Abstract
In this study, we first considered the influence of micro-nozzle wall roughness structure on molecular collision and reflection behavior and established a modified CLL model. The DSMC method was used to simulate and analyze the flow of the micro-nozzle in the cold gas micro-propulsion system, and the deviation of simulation results before and after the improvement of CLL model were compared. Then, the rarefied flow characteristics under a small needle valve opening (less than 1%) were focused on the research, and the particle position, molecular number density, and spatial distribution of internal energy in the micro-nozzle were calculated. The spatial distributions of the flow mechanism in the micro-nozzle under different needle valve openings were compared and analyzed. It was found that when the needle valve opening is lower than 1%, the slip flow and transition flow regions move significantly upstream of the nozzle, the free molecular flow distribution region expands significantly, and the relationship between thrust force and needle valve opening is obviously different from that of medium and large needle valve openings. The effect of nitrogen temperature on the rarefied flow and thrust force is also discussed in this research. The numerical results showed that as gas temperature increases, the molecular internal energy, momentum, and molecular number density near the nozzle exit are enhanced. The thrust at small needle valve openings was significantly affected by the temperature of the working mass. The results of this study will provide key data for the design and development of cold gas micro-thrusters.
1. Introduction
With the continuous development of the space industry, the micro-satellite has been paid more and more attention. The role of the propulsion system of the micro-satellite in a space mission is to maintain the satellite orbit and attitude control. At present, the micro-thrusters that have been applied in practice can be divided into chemical propulsion, cold propulsion, and electric propulsion [1,2]. Cold gas micro-propulsion generates thrust through the ejection of a high-pressure stored working medium, usually N2, through the Laval nozzle, which has small thrust, wide range regulation, and low noise. Due to its simple structure and most mature technology, it is most often used in practical space missions [3]. As one of the key components of cold gas micro-propulsion technology, this study on the flow characteristics of the nozzle can provide a reference for the performance improvement of cold gas micro-propulsion.
Cold gas micro-thrusters realize the needle valve displacement with nanometer accuracy and rapid response through the piezoelectric actuator, which meets the high-precision regulation requirement of the flow area at the throat of the micro-nozzle. N2, as the propellant, enters the micro-channel and expansion nozzle and ejects to create thrust force. Due to the extremely small size of the micro-nozzle, the internal flow and heat transfer problems are more complex than those of the traditionally sized nozzle, and the thrust generated is of a micro-level, which is difficult to accurately measure [4,5]. At present, numerical simulation methods are often used to study the micro-nozzle [6,7]. Due to the small size of the micro-nozzle and the relatively rarefied internal flow, the flow field can be divided into several regimes, which includes the coexistence of a continuous flow zone, slip flow zone, transition flow zone, and free molecular flow zone [8]. The rarefied gas flow in the whole basin follows the Boltzmann equation. Among the many methods for directly solving the Boltzmann equation or its model equation, direct simulation Monte Carlo (DSMC) [9] has been proven to be an accurate and efficient calculation method. In 2012, He Xiaoying et al. [10] used the DSMC method to simulate the interaction between a rocket plume and lunar dust when a lunar module landed on the moon, and the spray process of dust particles generally agreed with the physical consequence. In 2020, Kyun Ho Lee [11] used the DSMC method to conduct a numerical study on the detailed plume pattern of a liquid apogee engine (LAE) and its influence on geostationary orbit (GEO) satellites. The rarefaction of a gas is determined by the Knudsen number, which is the ratio of the average free travel of gas molecules to the geometric characteristic length (L) of the flow. According to the Knudsen number, the liquid flow can be divided into the following four types of mechanisms: continuous flow (Kn < 0.01), slip flow (0.01 < Kn ≤ 0.1), transition flow (0.1 < Kn < 10), and free molecular flow (Kn ≥ 10) [12]. In 2020, Nam T. P. Le et al. [13]. used a newly proposed slip and boundary condition for high-speed rarefied flow, and the results showed that with the increase of Kn, the wall slip velocity and temperature step would continuously intensify and have an impact on momentum and energy transfer in the micro-channel. Vasilis K. et al. [14] proposed a Bosanquet-type function that approximately and very satisfactorily describes the Knudsen number dependence of viscosity in the whole transition stage (i.e., from slip flow to the free molecular flow limit). Masoud Darbandi et al. [15] adopted a DSMC method suitable for unstructured grids to numerically simulate the rarefied flow region of micro/nano scale Laval nozzles from subsonic to supersonic speeds, and the results showed that if the Knudsen number exceeds the medium order, the high viscous force generated in the wall boundary layer will prevent the formation of any supersonic flow in the diverging part of the nozzle. In the micro-scale gas flow, a decrease in the scale will lead to an increase in the face ratio, and the wall force field has a more prominent dominant effect on the flow field; that is, the wall effect is more prominent. Varade et al. [16] conducted experiments and three-dimensional numerical calculations on the gas slip flow in the extended micro-channel, in which the viscous shear force is the main factor of the pressure drop in the extended micro-channel. In addition, increasing the number of Kn will increase the wall friction coefficient, which is due to the weakening of convection. M. Renksizbulut et al. [17] conducted a numerical study on rarefied gas flow and the heat transfer of slip flow in the entrance area of a rectangular micro-channel and found that increasing the micro-channel face ratio would not only increase the wall friction coefficient and Nusselt number (Nu), but also increase the sensitivity to Kn. Since the velocity gradient and pressure gradient near the wall of the inlet are relatively high, the friction change rate on the section along the flow direction of the pipeline is relatively large, so the influence of inlet effect on the flow should be considered. In 2009, Li C. et al. [18] analyzed the flow and friction characteristics in the inlet area through experiments, studied the flow characteristics distribution of nitrogen in the inlet part of 0.1 m~1.524 m micropipe, and focused on the influence of inlet effect. Zhang T. et al. [19] numerically analyzed the influence of the inlet section of the micro-channel on the internal flow. They also believed that the inlet effect was a key factor for the fluid flow and heat transfer characteristics. Sobhan et al. [20] and Palm [21] summarized the existing literature on flow and heat transfer in the flow channel and found that there was a deviation between experimental results and theoretical values and believed that the influence of inlet and outlet parts was ignored in some cases. In addition to the influence of the rarefaction effect, wall effect, and inlet effect, the flow inside the micro-nozzle is also affected by wall roughness [22,23], fluid–solid heat transfer [24,25], and other factors.
The nozzle structure chosen in this article, on the package, contains the pressure cavity, groove and the expansion period, the groove for the structure with a large length-to-diameter ratio (length-to-diameter ratio > 10), and the accumulator cavity to the expansion period of export of the nitrogen pressure value reduced from 10−1 MPa to vacuum; the flow mechanism covers four flow regions from continuous flow to free molecular flow, and belongs to the multi-scale rarefied flow problem. Although K.M. Muhanned Rafi et al. [26] also discussed the continuous flow area and rarefication flow area in the micro-nozzle, they did not analyze the slip flow and transition flow, and the micro-nozzle structure was a simple convergent-to-divergent nozzle, lacking a large aspect ratio, as shown in the figure. However, the multi-scale flow in the micro-nozzle structure with large aspect ratio selected in our study is distributed in the flow channel, which will increase the rarefied effect and wall effect in the micro-channel. Because the influence of environmental electromagnetic and vibration interference on the reasoning and testing system is difficult to be eliminated [4], there is a large error in the thrust test results when the needle valve opening is small. However, there are few simulation studies on the rarefied flow characteristics and the mechanism of the rarefied flow in the micro-nozzle under small openings.
The purpose of this work is to study the rarefied flow characteristics of the micro-nozzle with a small opening of needle valve by DSMC method coupled with a modified gas-surface interaction model, which considers the effect of wall roughness. The spatial distribution of simulated particles, molecular number density distribution, intramolecular energy distribution, local Kn and thrust force in the nozzle with the different needle valve openings and gas temperatures are recorded and analyzed.
2. Mathematical Models
The motion of molecules in a fluid can be described by the Boltzmann equation [27]. When the continuous flow assumption no longer applies, problems such as flow shear and heat transfer will not be solved by continuous flow methods. So, MD and DSMC methods are proposed to solve Boltzmann equation and use it to describe the dilute flow problem. However, the MD method is computationally time consuming because it directly solves for the motion of each molecule and its collisions. For solving other rarefied flow problems with larger scales, the MD method is clearly too computationally intensive. The Direct Simulation Monte Carlo (DSMC) method was proposed by Bird, and in 1992 the DSMC method was shown to be consistent with the Boltzmann equation [27]. The method uses the introduction of a certain number of sample points to simulate clusters of molecules or atoms to simplify the solution of Boltzmann’s equation. Unlike the direct solution of the MD method, the DMSC method samples statistical methods and introduces scattering rate and post-collision velocity distribution models to describe the collision events between molecules or between molecules and wall boundaries. Currently, the DSMC method is widely used in solving problems including spacecraft in orbit and micro-scale rarefied flow. Eshan et al. [28,29] investigated the convective heat transfer of the argon gas flow through a micro/nano channel with uniform heat flux wall boundary condition using the direct simulation Monte Carlo (DSMC), and they also simulated the rarefied supersonic and subsonic gas flow around a NACA 0012 airfoil using both continuum and particle approaches.
2.1. Molecular Collision Model
In the DSMC method, the solution of the molecular collision process is based on a statistical approach to a sample of molecules within a cell [30]. There are several methods to ensure that the number of molecular collisions solved by statistical methods is close to the analytical theoretical solution, including the majorant frequency scheme [31] and the NTC (no-time-counter) format. The probability of collision of sample particle i with particle j in each cell is
where N is the transient sample particles (or DSMC particles) in the cell. However, calculating the collision process for each molecular pair in each cell is still very computer time consuming, so Bird proposes the Acceptance-Rejection (AR) format to select the colliding molecular pairs within a cell. The NTC method selects the number of molecular pairs that collide within a cell at a certain time step as
where is the cell volume, is the maximum value of the product of the collision cross section and the relative velocity of all possible colliding particles in a cell, N and are the number of sample particles in the cell, and the actual number of atoms or molecules contained in the sample particles, respectively.
The other branch of the collision algorithms called Bernoulli trials (BT) are proposed based on the Kac stochastic equation. Stefanov develops a simplified version of the Bernoulli trial algorithm (SBT) [32], which can reduce the computational cost of the BT algorithm. Roohi et al. [33] developed a generalized form of the SBT algorithm (GBT). Its superiority is that the computational effort is decreased as the number of molecule particles in a cell is comparable with that set in the NTC model without any sensible reduction in the simulation accuracy. Unlike the SBT method, the symmetrized and simplified Bernoulli trials (SSBT) scheme picks the second particle of a selected pair from the whole particles with equal probability. It prevents repetitive collisions by introducing a procedure to avoid duplicate colliding pairs [34]. Recently, Stefan Stefanov et al. [35] proposed a novel hybrid transient adaptive subcell (TAS) algorithm, which combines the NTC, GBT, and SBT depending on the instantaneous number of particles in the considered cell.
2.2. Cercignanie–Lampise–Lord (CLL) Gas–Surface Interaction Model
In micro-scale rarefied flow problems, the collisions between molecules and walls will have an impact on the molecular motion behavior. Especially when the length and diameter of the micro-channel are relatively large, the effect of molecule–wall collisions will be more significant. Sazhin et al. [36] presented the results of experimental investigation of free-molecular gas flow in channels with an atomically pure and adsorbed surface. Sharipov et al. [37] introduced the complete ranges of the main parameters, which determine rarefied gas flows through a capillary. The capillary length varies from zero, when the capillary degenerates into a thin orifice, to infinity when the end effects can be neglected. The Knudsen number, characterizing the gas rarefaction, varies from zero when the gas is considered as a continuous medium to infinity when the intermolecular collisions can be discounted. Molecule–surface interaction models or known as the gas–surface interaction (GSI) models, are mainly divided into the following three categories: (1) specular reflection models; (2) diffuse reflection models; and (3) mixed models of specular and diffuse reflection.
The Maxwell model [38] (a hybrid specular and diffuse reflection model) describes the proportion of incident molecules that reach thermal equilibrium (contact with the wall for a long enough time) by introducing a scale factor f. This fraction of molecules moves in ideal diffuse reflection, while the other 1 − f molecules are assumed to collide with and reflect from an ideal smooth/elastic surface. The momentum and energy losses occurring in non-ideal diffuse reflections can be described by introducing accommodation coefficients that account for incident normal momentum, tangential momentum and kinetic energy (, and , respectively).
The Maxwell model is unable to consider the effects of wall morphology, wall atomic/gas molecular potential energy interactions, etc., on non-ideal molecular scattering. Momentum and energy adjustment factors need to be introduced to make empirical adjustments. The determination of the above-mentioned adjustment coefficients relies on the results of molecular beam experiments or simulation studies, leading to a large limitation of the application. Thus, based on the Maxwell model, Lord et al. introduced phenomenology into the DSMC method, which led to the development of a new wall reflection model, namely the Cercignani–Lampis–Lord (CLL) wall reflection model [39]. The CLL model assumes that the normal and tangential velocities during molecular reflection are independent of each other and introduces a dispersion kernel function to describe the normal and tangential velocity probabilities of the reflected molecules. The dispersive kernel function determines the relationship between incident and impinging reflected molecules. The number circulation of the impacted wall-reflecting molecules can be expressed as
where and are the velocity distribution functions of the incident and reflected molecules, respectively. and are the velocities of the incident and reflected molecules, respectively. is the dispersion kernel function.
The dispersion kernel function for the tangential velocity and normal components is expressed as
where and are the tangential and normal velocities, respectively. The subscripts and represent incident and reflected molecules, respectively. and are the tangential momentum adjustment coefficient and the normal energy accommodation coefficient, respectively.
The dispersion kernel functions for the tangential velocity and normal components satisfy the normalization condition.
At the same time, the dispersion kernel function is also subject to the reciprocity relation.
The molecular reflection velocity distribution form calculated according to the CLL model is shown in Figure 1. The reflected molecules from the impact wall form an asymmetric one-sided blade form, which is closer to the experimental results of gas molecules impacting the wall under vacuum conditions.
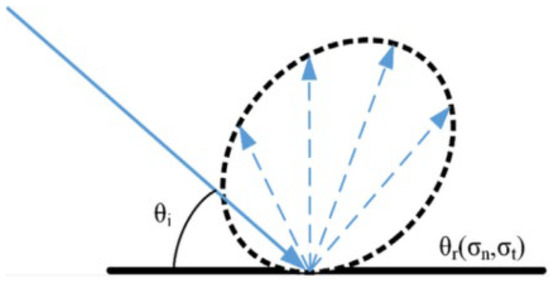
Figure 1.
Reflection velocity distribution of wall impact molecules described by CLL model.
Although the CLL model can effectively describe the form of unilateral blade-type velocity distribution exhibited after hitting the wall, the model does not consider (1) the interaction potential of wall atoms or molecules with gas molecules, or (2) the wall morphology and roughness. To obtain computational results close to the experimental ones, the CLL model needs to adjust the tangential momentum accommodation factor and the normal energy accommodation factor . To obtain close to the experimental calculation results, the CLL model needs to adjust the tangential momentum adjustment coefficient and the normal energy adjustment coefficient. It is shown that the values of the above adjustment coefficients are related to the state of the wall and the state of action between the gas molecules and the wall.
2.3. Modified CLL Gas–Surface Interaction Model
According to the results of scanning electron microscope (SEM) photography of the inner wall surface of the micro-nozzle in this study (Figure 2), the wall surface of the micro-nozzle is affected by the processing, there are close to equally spaced radial corrugated rough surface with an average spacing of 0.65 μm. The surface roughness measurement Ra is 0.4 μm. From the inner wall surface corrugation, the form is closer to the sine wave form, and this paper assumes that the inner wall surface corrugation is sine wave, the rough corrugation height H can be expressed as follows
where Ra is the average roughness of the wall surface, λ is the average wavelength of the wall ripple.
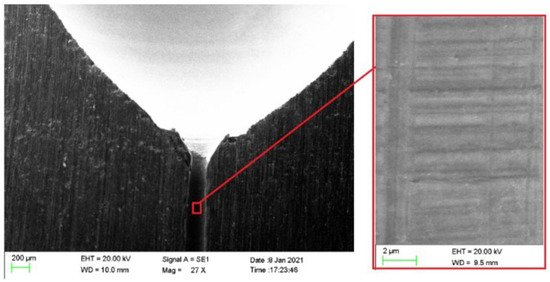
Figure 2.
Scanning electron micrograph of inner surface of micro-nozzle.
To consider the effect of the action potential between fluid molecules and wall atoms during collisions, the present study incorporates the wall molecule capture probability function proposed by A. Hurkmans et al. [40] into the CLL model.
where is the ratio of atomic masses of fluid molecules to solid walls. is the potential well depth. is the kinetic energy of the incident molecule, is the Boltzmann constant, is the angle of molecular incidence, is the wall surface temperature.
The normal velocities of the molecules before and after hitting the wall ( and ) are related as follows
where . This value characterizes the velocity of gas molecules whose scattering obeys the Maxwell distribution when the incident molecules interact with the wall for a long enough time to reach thermal equilibrium with the wall.
The tangential momentum accommodation factor and the normal energy accommodation factor in the CLL model can be calculated by the following equation [41]
Tangential energy accommodation coefficient can be
where is the normal momentum value, if there is heat transfer between the molecules and the wall.
The CLL model can be closed as long as the reflected of the molecule after hitting the wall is known to find the values of and . When the wall is a non-planar sine wave shape, the incident molecules will undergo additional deflection after hitting the sine wave wall, thus changing the motion characteristics of the reflected molecules. The Washboard model [40] considered the effect of sinusoidal wall surface on the molecular wall impact behavior. The model contains formulas for solving the velocity of gas molecules incident to a sine wave wall reflection. Substitute this equation into the tangential momentum accommodation coefficient and the normal energy accommodation coefficient. The equation for solving the velocity of gas molecules incident to a sine wave wall reflection is as follows
where
where is the molecular reflection angle, W is the potential well energy, is the maximum tilt angle on the sine wave plane.
In our modified CLL model, since the probability distribution is taken into account, the above model can determine the probability distribution of the molecular reflection angle, reflection velocity and reflected energy for a particular molecular incidence angle and sinusoidal shape structure ( and ), and then determine the molecular reflection angle and velocity corresponding to the maximum probability value. The normal and tangential reflected velocity values are obtained by spatial decomposition (Equations (28) and (29)) and then substituted into Equations (13) to (15) to obtain the normal and tangential momentum adjustment coefficients and energy accommodation coefficients.
where is the constant introduced by our model, which is set to 1.0 in this study. This value represents the deviation of the calculated maximum probability reflection angle of the molecule after hitting the wall from the actual maximum probability reflection angle. The mechanism of molecular reflection of gas molecules at the wall atomic potential well action, wall adhesion, and sinusoidal surface action is considered as shown in Figure 3. The incident molecules are refracted after entering the wall atomic potential well (wall atomic attraction), and then there is a certain probability of adhesion upon contact with the wall, and additional deflection of some of the reflected molecules after hitting the sinusoidal wall (due to the wall slope).
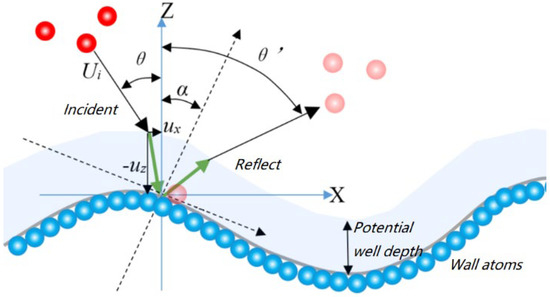
Figure 3.
Molecular wall interaction mechanism described by improved CLL model.
This study uses the DSMC solver in OpenFOAM-7.0. OpenFOAM uses the dsmcCloud class, which belongs to the Lagrangian class, to store the data of various variables (including the velocity, position, rotational energy, translational energy, etc.) during the DSMC calculation. The DSMC solver also supports MPI parallel computation. By storing a double-linked list (parcel class) with pointers to variable class instantiations, the sample particle data can be easily accessed. The above storage mechanism can effectively reduce the storage volume and data query efficiency of computing 105 and above sample particles. The DSMC calculation flow is shown in Figure 4.
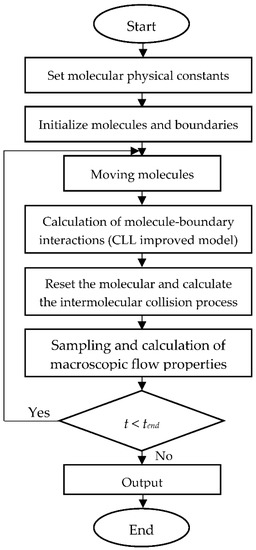
Figure 4.
DSMC simulation flow chart.
3. Experiment Setup
In this study, to ensure the accuracy of the simulation model, the simulation data results were verified by experiments. For thrust measurement of micro-thruster, there are usually two methods: direct measurement and indirect measurement [42]. The indirect force measurement system based on torsion pendulum platform was adopted. As shown in Figure 5, the force measuring system was based on a torsion pendulum platform. A high-precision capacitive displacement meter was used to measure the arm displacement. At the same time, a vacuum chamber with diameter of 1 m and length of 1.2 m was built to create a real working environment for the thruster. The mechanical pumps and molecular pumps were used for vacuuming, so that the pressure in the vacuum chamber is less than 1 Pa. The mechanical pump was installed on the air-floating platform outside the warehouse to minimize the influence of mechanical vibration on the force measurement. The force measuring system was also equipped with an on-line damping and calibration subsystem suitable for vacuum, which can improve the measurement accuracy and achieve a larger force measuring range.
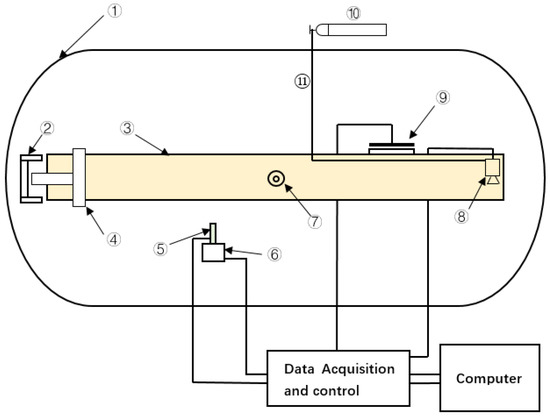
Figure 5.
Schematic diagram of measuring system. ① Vacuum Chamber; ② Damper; ③ Pendulum; ④ Counter-weight; ⑤ Displacement Device; ⑥ Precision Seat; ⑦ Axis; ⑧ Micro-thruster; ⑨ Calibration System; ⑩ Gas Bottle; ⑪ Pipe.
As shown in Figure 6, the force measuring system was built. The precision leveled torsion pendulum platform was installed in the vacuum chamber, the micro-thruster was installed at the right end of the swing arm, and the counterweight, displacement meter, and damper were installed on the left side of the swing arm. The micro-thruster was covered by thermal control, as shown in Figure 7. The air supply source was installed outside the vacuum chamber, which was led into the vacuum chamber through hoses and connected to the thruster. All electronic control and data acquisition were controlled by measurement and control software to minimize human interference and improve the automation of the test system.
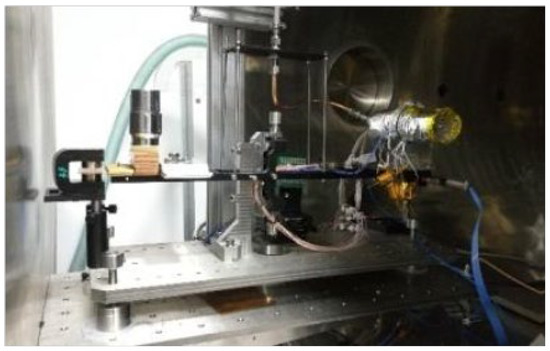
Figure 6.
Establishment of thrust measurement system.
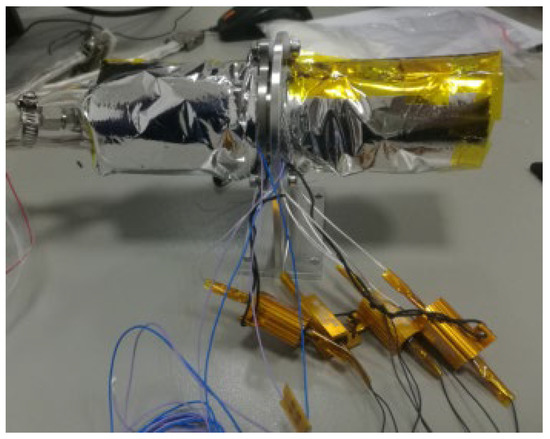
Figure 7.
Thruster with thermal control coating.
In addition, to improve the accuracy of thrust measurement, the following restrictions and measures were adopted to further reduce the thrust test error. The cold air used in the thruster was nitrogen with a purity of 99.99%; The hose was installed through the central axis of the thrust frame, thereby eliminating the influence on the measurement. In order to avoid the uncertainty of the thrust test caused by temperature fluctuations, the thruster was heated to 42 °C by the closed loop thermal control device to increase the heat radiation of the module. The thrust frame was corrected and calibrated before, during, and after the test, which effectively improved the accuracy of the thrust measurement.
The torsion pendulum is a second-order damping vibration system. Its governing equations can be described as:
where the moment of inertia of the pendulum arm is I, the damping coefficient is c, the damping is provided by the electromagnetic damping system, the elastic coefficient of the axis is K, the pendulum angle is , and the length of the thrust arm is L.
The principle of steady thrust measurement is as follows: when the thruster is working, the thrust force is produced to push the swing arm torsion. Because the swing arm is fixed with the shaft hinge, the elastic shaft provides the torque for balancing the thrust, so that the swing arm can rest in a certain position after many vibrations. The velocity and acceleration terms in Equation (10) are zero and Equation (10) is simplified to:
The displacement of the swing arm before and after moving can be measured by using the high-precision displacement sensor fixed on the base. The steady-state thrust can be directly calculated by the calibrated elastic coefficient. A displacement meter with the measurement range of 2 nm–100 μm and with an accuracy within 1 nm is used to measure the displacement of the pendulum arm. The thrust force is determined by this displacement value with an uncertainty of ±0.1 μN. The gas pressure in the inlet chamber of the propulsion system is stabilized at 0.15 MPa. The gas flow rate is regulated by controlling the opening ratio of the solenoid needle valve. The needle valve displacement range is from 0 to 3.4 μm.
4. Model Validation
In this section of the study, the flow characteristics in the micro-nozzle were firstly calculated using the CLL model and the modified CLL model, respectively, and then the calculation results were analyzed by comparing the experimental results of the vacuum thrust test conducted.
The computational domain of the micro-nozzle is shown in Figure 8. Since the nozzle is an axisymmetric structure, a wedge-shaped computational domain (circumferential angle of 0.5°) is used in this study. The computational domain model can be divided into four sections, such as inlet section, throat section, microfluidic section, and expansion section. The main structural parameters of the micro-nozzle include: (1) valve needle cone angle of 30°; (2) micro-channel inner diameter of 0.6 mm, length of 2.7 mm; (3) expansion section length of 3.8 mm, outlet section diameter of 6 mm.
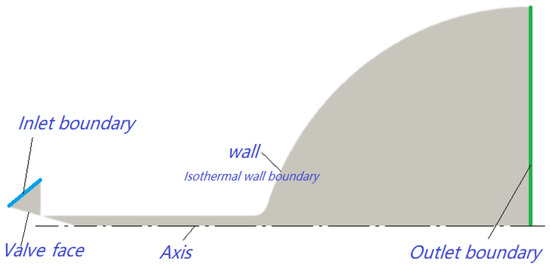
Figure 8.
Computational domain.
Since the DSMC calculation is applied to the whole area, the continuous flow area in the valve chamber upstream of the throat needs to be minimized to reduce the computational effort (the area within 0.4 mm upstream of the throat is selected for this calculation). The inlet boundary surface is nearly parallel to the normal tangent of the throat to ensure that the continuous flow area in the valve chamber and the structured grid surface near the throat obtain a small degree of deformation. The left face of the computational domain is the entrance boundary. The DSMC model is used to correspond to the actual inlet pressure value by setting the inlet and outlet molecular number density. The calculation sets the molecular number density of incoming nitrogen at the inlet to 1.9011 × 1025 1/m3 (corresponding to 0.15 MPa pressure). The mass of nitrogen molecule is 46.5 × 10⁻²⁷ kg/m3 and the equivalent diameter is 3.64 × 10⁻¹⁰ m. Since the actual outlet pressure is a vacuum, the molecular number density at the outlet surface is zero. The wall is set as an isothermal boundary, the molecule–wall interaction (GSI) model is used to describe the molecule–wall interaction, and the binary collision model is the variable diameter hard sphere model (VHS).
Because DSMC method is used, a particle of molecular samples (a collection of a certain number of molecular samples with the same properties) is introduced to characterize the actual molecules. Based on the calculated elapsed time and average exit velocity values comparing the equivalent molecular number conditions of different molecular sample packages, the final determined equivalent molecular number of the nitrogen molecular sample package is 5.5 × 10⁸. The calculation time step is set to a fixed time step of 1 × 10⁻⁹ s.
The grid partitioning is done using OpenFOAM’s BlockMesh method. The computational domain meshing is shown in Figure 9. The axial grid is divided into four regions: upstream of the throat, downstream of the throat expansion section, micro-channel, and nozzle expansion section. The number of grids in the axial direction for each region is listed sequentially in Table 1. The effect of the number of grid divisions on the calculation results is analyzed in Table 1. The inlet molecular number density was kept at 1.9011 × 1025 1/m3 during the grid test, and the time steps were all 1 × 10⁻⁹ s with a needle valve opening of 10%. According to the comparison results of the average exit velocity, Case4 has a higher calculation accuracy and has a relatively small total number of grids, and the relative deviation effect of continuing to increase the grid on the calculation results is less than 2%. Therefore, Case4 is selected as the mesh for further modeling.
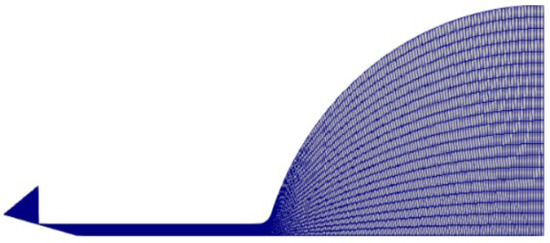
Figure 9.
Computational grids.

Table 1.
Effects of grids on the mean molecular velocity at the nozzle exit.
The effect of the equivalent molecular number of the nitrogen molecular sample package is shown in Figure 10. According to the comparison results of the average mass flow rate at the outlet, the equivalent molecular number of the nitrogen molecule sample package is 5.5 × 10⁸, which has a high calculation accuracy. The relative deviation of the calculation results caused by continuing to reduce the equivalent molecular number is less than 2%. At the same time, it has a relatively large number of equivalent molecules, which can reduce the number of nitrogen molecular sample packages, thus reducing the calculation time consumption.
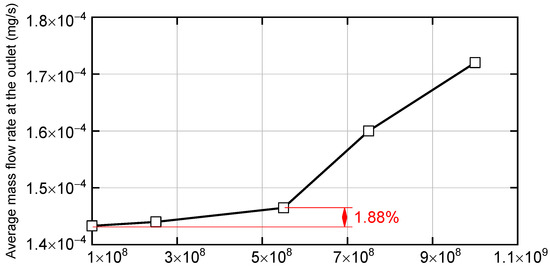
Figure 10.
Effect of equivalent molecular number of nitrogen molecular sample package.
In order to verify the accuracy of the simulation calculations, the calculated results are compared with the experimental values for experimental verification. The experimental and simulation comparison results of thrust force under different thruster needle valve opening conditions are shown in Table 2 and Figure 11. The calculation results show that the deviation of the thrust results calculated using the original CLL model from the experimental measurements for the corresponding operating conditions is significantly larger than that of the modified CLL model (especially in the case of needle valve opening below 10%). The modified CLL model can maintain a low calculated deviation in the low needle valve opening range (maximum calculated deviation of 18.97%, a 73.7% reduction in deviation compared to the CLL model). When the needle valve opening is small, the flow rarefied effect in the nozzle is enhanced and the effect of molecular collision with the microfluidic wall on the flow resistance increases, leading to an enhanced effect of the molecular–wall interaction model on the calculation results. The effect of wall roughness is not considered, and the model accommodation coefficient is constant, which makes it difficult for the original CLL model to achieve high accuracy in a wide range of needle valve openings. The modified CLL model, on the other hand, obtained a lower thrust (closer to the experimental results) by considering the effect of wall roughness and enhancing the diffuse reflection of molecules with the rough wall under rarefied flow conditions.

Table 2.
Comparisons between experimental and computational thrust forces.
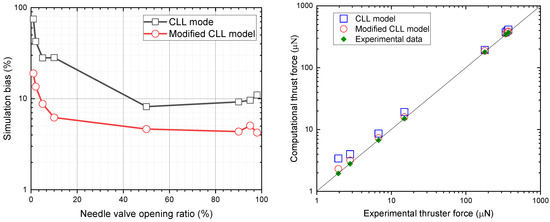
Figure 11.
Comparisons between experimental and computational results by CLL model and its modified model.
5. Results and Discussion
5.1. Flow Characteristics at a Gas Temperature of 300 K and a Needle Valve Opening of Less Than 1%
In this section, the DSMC model coupled with the modified CLL model is used to simulate the flow and thrust characteristics in the nozzle needle valve at small openings of 0.25%, 0.5%, and 0.75%, respectively, to explore the rarefied flow mechanism at small openings by means of simulation. The flow state in the micro-nozzle reaches quasi-stable state at 0.1 ms. Figure 12 shows the results of the spatial distribution of molecular sample particles, molecular number density, and internal energy of molecules inside the micro-nozzle at three openings. The DSMC method uses the introduction of a certain number of sample particles to simulate clusters of molecules or atoms to simplify the solution of the Boltzmann equation. The equivalent number of molecules per molecular sample particle is set to 5.5 × 10⁸. The results in (a) show that the molecules are mainly concentrated in the upstream cavity and micro-channel of the throat due to the throttling effect of the throat. Because of the small opening ratio, the molecular number density in the downstream area, of about 1/3 length of the microchannel, is low. Due to the vacuum condition at the outlet, the molecules will disperse rapidly after entering the nozzle expansion section from the micro-channel, and the macroscopic performance is fluid expansion. The results in (b) show that the molecular number density near the downstream of the throat is lower than 1023. Since the molecular sample package is used to approximate the actual mass molecules, the molecular number density field in Figure 12b is a discrete point discontinuous distribution. The molecular number density is directly related to the local pressure, and also determines the strength of the intermolecular collision and the interaction between molecules and the wall of the microchannel. As the opening is further reduced from 0.75% to 0.25%, the molecular density in the nozzle flow channel decreases significantly, as does the molecular number density near the throat outlet (Figure 12a,b). Internal-molecular energy distribution can be seen in the molecular distribution of the nozzle expansion section with a small opening of the needle valve. When the valve opening is 0.25%, the molecules are present only in the central region of the extended section and do not move to the more distant wall region. Additionally, with slightly larger openings (0.5% and 0.75%), the nitrogen molecules can still move to reach the near-wall region of the nozzle (Figure 12c).
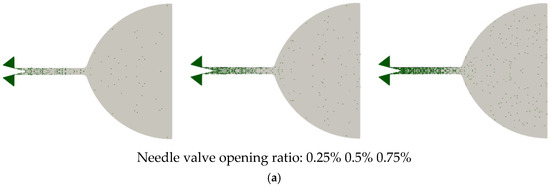
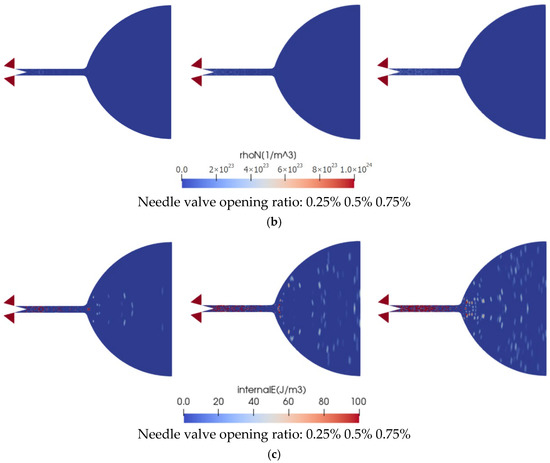
Figure 12.
Molecular particle position, molecular number density, and internal energy distributions in the axial plane with different valve openings at t = 0.1 ms. (a) Molecular Particles. (b) Molecular number density. (c) Internal energy of molecule.
To further quantify the internal flow characteristics of the nozzle at small openings, the molecular number density and molecular internal energy along the nozzle axis at small openings of the three needle valves are given in Figure 13. The horizontal coordinate in the figure is the dimensionless length Lx/D. D is the internal radius of the micro-channel. Lx is the horizontal distance from the valve needle tip. RhoN means the molecular number density. As the needle valve opening decreases, the molecular number density at the tip of the needle valve decreases from 7.0 × 10²² 1/m3 to 1.9 × 10²² 1/m3, a decrease in molecular number density of 72.8% (0.67% decrease in needle valve opening). In addition, the internal energy of the molecules coming out of the same position in the nozzle decreases with the needle valve opening. In addition, both the molecular number density and the molecular internal energy decrease rapidly along the axis in the downstream direction.
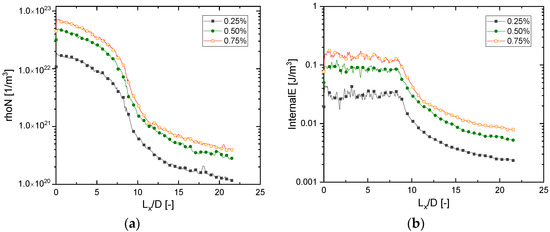
Figure 13.
Molecular number density and internal energy profiles along the nozzle axis with different valve openings at t = 0.1 ms. (a) Molecular number density (b) Molecular internal energy.
The results on the microfluidic axis to the local Kn are given in Figure 14. The local Knudsen number is defined as Kn = λ/L. We use the micro-channel diameter as the representative physical length scale for calculating the Kn number. When the needle valve opening is less than 1%, the partition interface between slip flow and transition flow region (Kn = 0.1) then continues to move upstream from the microfluidic 5D position (1% opening) as the needle valve opening is reduced. At 0.25% needle valve opening, the slip flow and transition flow zone interface move up to the needle valve tip region, while at 0.5% opening, the slip flow and transition flow zone interface is approximately 1D downstream of the needle valve tip. Under micro-opening conditions, the transition flow in the micro-nozzle flow path begins within approximately 4D of the needle valve tip downstream.
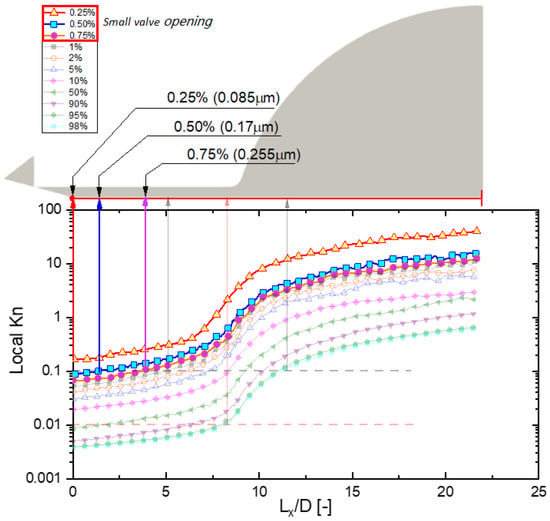
Figure 14.
Local Kn distributions along the axis with different valve openings at t = 0.1 ms.
Figure 15 shows the results of the thrust force of the micro-injector tube for different needle valve openings obtained based on DSMC calculations and fitted with an exponential function. The blue scatter is the thrust value at small openings, and the gray scatter is the thrust result at needle valve openings greater than or equal to 1%. Under low needle valve opening conditions, there is a significant non-linear relationship between the thrust force and the needle valve opening. The fitted equation for thrust vs. valve opening is shown in Figure 15. For small needle valve openings, the relationship between thrust and opening is exponential, y = −0.63 + 0.63exp (1.79x). The R2 value of the fitting function is 0.99, which indicates that the fitting function in the figure can describe the relationship between the thrust force and the needle valve opening very well. The thrust forces for needle valve openings of 0.25%, 0.5%, and 0.75% were 0.36 μN, 0.92 μN, and 1.8 μN, respectively. After a needle valve opening of more than 1%, the relationship between thrust and needle valve opening is different from the small opening case. The fitted function relationship between opening and thrust for different opening degrees is polynomial function, y = 2.12 + 0.3x + 0.12x2 − 0.0014x3 + 5 × 10−6x4.
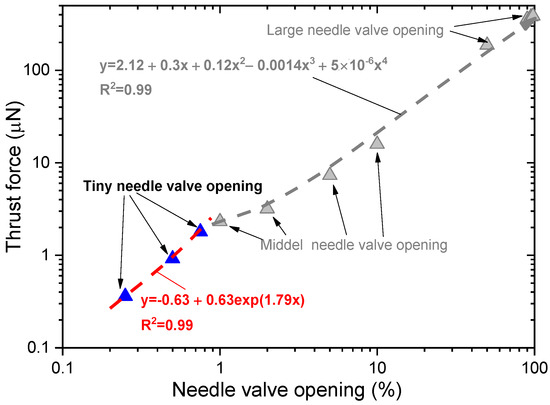
Figure 15.
Computational thrust force with different valve opening ratios at t = 0.1 ms. Blue triangle symbols are the computational thrust forces under the needle valve opening ratio less than 1%, the red dashed line is the corresponding fitting function. Grey triangle symbols are the computational thrust forces under the needle valve opening ratio larger than 1%, and the grey dashed line is the corresponding fitting function.
5.2. Effect of Gas Temperature on Flow Characteristics
In this section, the flow characteristics in the micronozzle were analyzed with the nitrogen temperature, i.e., 285.82 K, 293.15 K and 300.48 K. The inlet nitrogen pressure is maintained at 0.15 MPa, and the needle valve opening is set to 1%. Figure 16 reveals the spatial distribution of nitrogen molecular particles at 0.1 ms. Due to the small needle valve opening, the number of nitrogen molecules passing through throttle and microchannel is significantly limited. Most of the nitrogen molecules are concentrated in the middle and upper regions of the micro-nozzle. Due to the small difference in gas temperature, the difference in molecular distribution under the three cases is not significant.

Figure 16.
Molecular particle position with different gas temperature at t = 0.1 ms. The inlet nitrogen pressure is maintained at 0.15 MPa. Each green point denotes a molecular group. (a) 285.82 K. (b) 293.15 K. (c) 300.48 K.
As the gas temperature increases, the molecular internal energy in the exit region of the micro-channel increases slightly. More high internal energy nitrogen molecules appear in the region near the exit of the micro-channel and the near-wall area of the nozzle expansion section at a gas temperature of 300.48 K than the case of a gas temperature of 285.82 K (Figure 17). The nitrogen molecules in all three conditions were fully expanded in the nozzle expansion section.
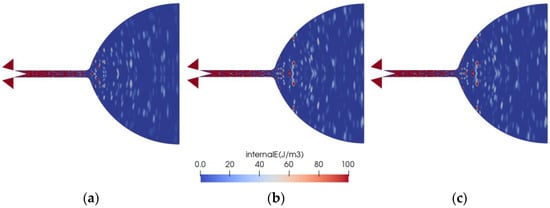
Figure 17.
Molecular internal energy distributions in nozzle at different gas temperatures at t = 0.1 ms. (a) 285.82 K. (b) 293.15 K. (c) 300.48 K.
Similar to the molecular energy distribution, the nitrogen molecular momentum increases with increasing the gas temperature (Figure 18). Higher molecular momentum can promote higher thrust. Due to the small opening of the current needle valve, the number of high momentum molecules is small and mainly concentrated in the upstream region of the expansion section of the micro-nozzle.
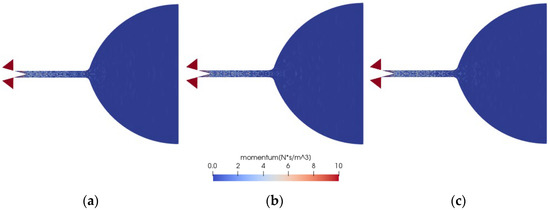
Figure 18.
Molecular momentum distributions in nozzle at different gas temperatures at t = 0.1 ms. (a) 285.82 K. (b) 293.15 K. (c) 300.48 K.
Figure 19 shows the calculated results of the axial distributions of molecular internal energy, momentum, and molecular number density under different gas temperatures. Increasing the gas temperature can enhance the molecular internal energy, momentum, and molecular number density near the nozzle exit, where the Lx/D is larger than 16, and has no significant effect in other regions. The small difference in current gas temperatures (±2.5%) may not have caused a significant difference in flow.

Figure 19.
The calculated results of the axial distributions of molecular internal energy (Left side), momentum (Middle) and molecular number density (Right side) under different gas temperatures.
The effect of the gas mass temperature on the thrust value is provided in Figure 20. The thrust results are calculated based on the statistically obtained macroscopic gas velocity and density. For the baseline case, i.e., the nitrogen temperature is 293.15 K, the calculated thrust force is 6.6 μN. The thrust at small needle valve openings is significantly affected by the temperature of the working mass. The same ±2.5% temperature variation causes thrust fluctuations of 7.9% and 8.5% for small openings.
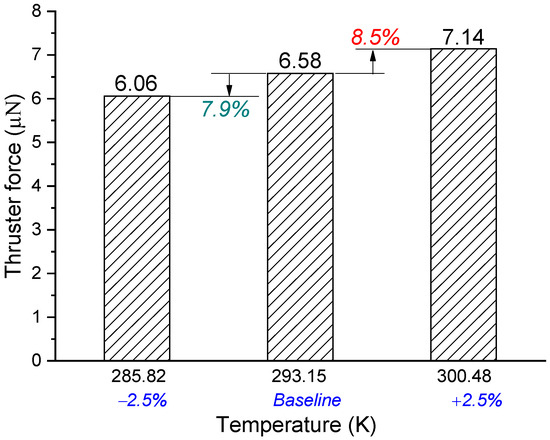
Figure 20.
Computational thrust forces under the condition of ±2.5% variation of gas temperature.
6. Conclusions
In this paper, the DSMC method coupled with a modified CLL model, which consider the effect of the wall roughness on the molecular collision and reflect behavior, was used to calculate the multi-scale flow in a micro-nozzle. The flow regime and molecular characteristics in the micro-nozzle was discussed. The main conclusions obtained are as follows.
To consider the effect of the action potential between fluid molecules and wall atoms during collisions, the present study incorporated the wall molecule capture probability function. In our modified CLL model, since the probability distribution was considered, the above model determined the probability distribution of molecular reflection angle, reflection velocity, and reflected energy for a particular molecular incidence angle and sinusoidal shape structure. Then, the normal and tangential momentum adjustment coefficients and energy accommodation coefficients could be calculated.
When the needle valve opening was small, the flow rarefied effect in the nozzle was enhanced and the effect of molecular collision with the microfluidic wall on the flow resistance increased, leading to an enhanced effect of the molecular–wall interaction model on the calculation results. The modified CLL model can obtain a lower thrust (closer to the experimental results) by considering the effect of wall roughness and enhancing the diffuse reflection of molecules with the rough wall under rarefied flow conditions.
The results showed that as the opening was further reduced from 0.75% to 0.25%, the molecular density in the nozzle flow channel decreases significantly, as did the molecular number density near the throat outlet. When the needle valve opening was less than 1%, the partition interface between slip flow and transition flow region (Kn = 0.1) then continued to move upstream from the microfluidic 5D position (1% opening) as the needle valve opening was reduced.
For small needle valve openings, the relationship between thrust and opening was exponential, y = −0.63 + 0.63exp (1.79x). After a needle valve opening of more than 1%, the fitted function relationship between opening and thrust for different opening degrees was polynomial function
According to the simulation results of rarefied flow at different gas temperatures, it was found that as the gas temperature increases, the molecular internal energy, momentum, and molecular number density near the nozzle exit could be enhanced. The thrust at small needle valve openings was significantly affected by the temperature of the working mass. The same ±2.5% temperature variation caused thrust fluctuations of 7.9% and 8.5% for small openings.
Author Contributions
Conceptualization, D.L., X.L. and X.W.; methodology, D.L. and X.L.; software, X.L., X.W. and Y.G.; validation, X.F.; formal analysis, X.W.; resources, Y.G.; writing—original draft preparation, X.L. and X.F.; writing—review and editing, X.L. and D.L.; supervision, D.L. All authors have read and agreed to the published version of the manuscript.
Funding
The research is supported by the National Key R&D Program of China (2020YFC2201100), 13th Five-Year Plan Civil Aerospace Advanced Research Technology Project of China, and the National Natural Science Foundation of China (Grant No. U21B2074).
Institutional Review Board Statement
Not applicable.
Informed Consent Statement
Not applicable.
Data Availability Statement
Some data, models, or code that support the findings of this study are available from the corresponding author upon reasonable request.
Conflicts of Interest
The authors declare no conflict of interest.
References
- Liu, H.; Niu, X.; Zeng, M.; Wang, S.; Cui, K.; Yu, D. Review of micro propulsion technology for space gravitational waves detection. Acta Astronaut. 2022, 193, 496–510. [Google Scholar] [CrossRef]
- Hitt, D.L.; Zakrzwski, C.M.; Thomas, M.A. MEMS-based satellite micropropulsion via catalyzed hydrogen peroxide decomposition. Smart Mater. Struct. 2001, 10, 1163. [Google Scholar] [CrossRef]
- Luo, J.; Bai, Y.-Z.; Cai, L.; Cao, B.; Chen, W.-M.; Chen, Y.; Cheng, D.-C.; Ding, Y.-W.; Duan, H.-Z.; Gou, X.; et al. The first round result from the TianQin-1 satellite. Class. Quantum Gravity 2020, 37, 185013. [Google Scholar] [CrossRef]
- Bayt, R.L. Analysis, Fabrication and Testing of a MEMS-Based Micropropulsion System; Massachusetts Institute of Technology: Cambridge, MA, USA, 1999. [Google Scholar]
- Merkowitz, S.M.; Maghami, P.G.; Sharma, A.; Willis, W.D.; Zakrzwski, C.M. A μNewton thrust-stand for LISA. Class. Quantum Gravity 2002, 19, 1745. [Google Scholar] [CrossRef]
- Louisos, W.F.; Hitt, D.L. Viscous effects on performance of three-dimensional supersonic micronozzles. J. Spacecr. Rocket. 2012, 49, 51–58. [Google Scholar] [CrossRef]
- Louisos, W.F.; Hitt, D.L. Numerical studies of supersonic flow in bell-shaped micronozzles. J. Spacecr. Rocket. 2014, 51, 491–500. [Google Scholar] [CrossRef]
- Bird, G.A. Molecular gas dynamics. NASA STI/Recon Tech. Rep. A 1976, 76, 40225. [Google Scholar]
- Bird, G.A. Approach to translational equilibrium in a rigid sphere gas. PhyFluids 1963, 6, 1518–1519. [Google Scholar] [CrossRef]
- He, X.; He, B.; Cai, G. Simulation of rocket plume and lunar dust using DSMC method. Acta Astronaut. 2012, 70, 100–111. [Google Scholar] [CrossRef]
- Lee, K.H. Plume simulation of liquid apogee engine for GEO satellite using parallel DSMC method. Comput. Fluids 2020, 208, 104612. [Google Scholar] [CrossRef]
- Rosa, P.; Karayiannis, T.G.; Collins, M.W. Single-phase heat transfer in microchannels: The importance of scaling effects. Appl. Therm. Eng. 2009, 29, 3447–3468. [Google Scholar] [CrossRef]
- Le, N.T.P.; Roohi, E.; Tran, T.N. Comprehensive assessment of newly-developed slip-jump boundary conditions in high-speed rarefied gas flow simulations. Aerosp. Sci. Technol. 2019, 91, 656–668. [Google Scholar] [CrossRef]
- Michalis, V.; Kalarakis, A.; Skouras, E.; Burganos, V.N. Rarefaction effects on gas viscosity in the Knudsen transition regime. Microfluid. Nanofluidics 2010, 9, 847–853. [Google Scholar] [CrossRef]
- Darbandi, M.; Roohi, E. Study of subsonic–supersonic gas flow through micro/nanoscale nozzles using unstructured DSMC solver. Microfluid. Nanofluidics 2011, 10, 321–335. [Google Scholar] [CrossRef]
- Varade, V.; Duryodhan, V.; Agrawal, A.; Pradeep, A.; Ebrahimi, A.; Roohi, E. Low Mach number slip flow through diverging microchannel. Comput. Fluids 2015, 111, 46–61. [Google Scholar] [CrossRef]
- Renksizbulut, M.; Niazmand, H.; Tercan, G. Slip-flow and heat transfer in rectangular microchannels with constant wall temperature. Int. J. Therm. Sci. 2006, 45, 870–881. [Google Scholar] [CrossRef]
- Li, C.; Jia, L.; Zhang, T. The entrance effect on gases flow characteristics in micro-tube. J. Therm. Sci. 2009, 18, 353–357. [Google Scholar] [CrossRef]
- Zhang, T.; Jia, L.; Li, X. Numerical research on entrance effect on internal flow characteristics in micro-scale. Prog. Comput. Fluid Dyn. Int. J. 2009, 9, 67–76. [Google Scholar] [CrossRef]
- Sobhan, C.B.; Garimella, S.V. A comparative analysis of studies on heat transfer and fluid flow in microchannels. Microscale Thermophys. Eng. 2001, 5, 293–311. [Google Scholar] [CrossRef]
- Palm, B. Heat transfer in microchannels. Microscale Thermophys. Eng. 2001, 5, 155–175. [Google Scholar] [CrossRef]
- Lu, H.; Xu, M.; Gong, L.; Duan, X.; Chai, J.C. Effects of surface roughness in microchannel with passive heat transfer enhancement structures. Int. J. Heat Mass Transf. 2020, 148, 119070. [Google Scholar] [CrossRef]
- Shams, M.; Khadem, M.H.; Hossainpour, S. Direct simulation of roughness effects on rarefied and compressible flow at slip flow regime. Int. Commun. Heat Mass Transf. 2009, 36, 88–95. [Google Scholar] [CrossRef]
- Alexeenko, A.; Fedosov, D.; Gimelshein, S.; Levin, D.; Collins, R. Transient heat transfer and gas flow in a MEMS-based thruster. J. Microelectromechanical Syst. 2006, 15, 181–194. [Google Scholar] [CrossRef]
- Hameed, A.H.; Kafafy, R.; Asrar, W.; Idres, M. Two-dimensional flow properties of micronozzle under varied isothermal wall conditions. Int. J. Eng. Syst. Model. Simul. 2013, 5, 174–180. [Google Scholar] [CrossRef]
- Rafi, K.M.M.; Deepu, M.; Rajesh, G. Effect of heat transfer and geometry on micro-thruster performance. Int. J. Therm. Sci. 2019, 146, 106063. [Google Scholar] [CrossRef]
- Bird, G.A. Molecular Gas Dynamics and the Direct Simulation of Gas Flows; Clarendon Press: Oxford, UK, 1994. [Google Scholar]
- Balaj, M.; Roohi, E.; Akhlaghi, H.; Myong, R.S. Investigation of convective heat transfer through constant wall heat flux micro/nano channels using DSMC. Int. J. Heat Mass Transf. 2014, 71, 633–638. [Google Scholar] [CrossRef]
- Shoja-Sani, A.; Roohi, E.; Kahrom, M.; Stefanov, S. Investigation of aerodynamic characteristics of rarefied flow around NACA 0012 airfoil using DSMC and NS solvers. Eur. J. Mech. B/Fluids 2014, 48, 59–74. [Google Scholar] [CrossRef]
- Bird, G.A. Molecular Gas Dynamics; Clarendon Press: Oxford, UK, 1976. [Google Scholar]
- Ivanov, M.S.; Rogasinsky, S.V. Analysis of numerical techniques of the direct simulation Monte Carlo method in the rarefied gas dynamics. Sov. J. Numer. Anal. Math. Model. 1988, 3, 453–466. [Google Scholar] [CrossRef]
- Goshayeshi, B.; Roohi, E.; Stefanov, S. DSMC simulation of hypersonic flows using an improved SBT-TAS technique. J. Comput. Phys. 2015, 303, 28–44. [Google Scholar] [CrossRef]
- Roohi, E.; Stefanov, S.; Shoja-Sani, A.; Ejraei, H. A generalized form of the Bernoulli Trial collision scheme in DSMC: Derivation and evaluation. J. Comput. Phys. 2018, 354, 476–492. [Google Scholar] [CrossRef]
- Taheri, E.; Roohi, E.; Stefanov, S. A symmetrized and simplified Bernoulli trial collision scheme in direct simulation Monte Carlo. Phys. Fluids 2022, 34, 012010. [Google Scholar] [CrossRef]
- Stefanov, S.; Roohi, E.; Shoja-Sani, A. A novel transient-adaptive subcell algorithm with a hybrid application of different collision techniques in direct simulation Monte Carlo (DSMC). Phys. Fluids 2022, 34, 092003. [Google Scholar] [CrossRef]
- Sazhin, O.V.; Borisov, S.F. Influence of the state of a surface on the formation of a rarefied gas flow in a channel. J. Eng. Phys. Thermophys. 2001, 74, 1232–1238. [Google Scholar] [CrossRef]
- Sharipov, F.; Seleznev, V. Data on internal rarefied gas flows. J. Phys. Chem. Data 1998, 27, 657–706. [Google Scholar] [CrossRef]
- Maxwell, J.C. On stresses on rarefied gases arising from inequalities of temperature. Philos. Trans. R. Soc. Lond. 1965, 170, 231–256. [Google Scholar] [CrossRef]
- Cercignani, C.; Lampis, M. Kinetic models for gas-surface interactions. Transp. Theory Stat. Phys. 1971, 1, 101–114. [Google Scholar] [CrossRef]
- Hurkmans, A.; Overbosch, E.G.; Olander, D.R.; Los, J. The trapping of potassium atoms by a polycrystalline tungsten surface as a function of energy and angle of incidence. Surf. Sci. 1976, 54, 154. [Google Scholar] [CrossRef]
- John, C.T. Washboard model of gas–surface scattering. J. Chem. Phys. 1990, 92, 680. [Google Scholar] [CrossRef]
- He, L.; Ma, W.; Guo, P.; Sheng, T. Developments of attitude determination and control system of microsats: A survey. Proceedings of the Institution of Mechanical Engineers, Part I. J. Syst. Control. Eng. 2021, 235, 1733–1750. [Google Scholar] [CrossRef]
Disclaimer/Publisher’s Note: The statements, opinions and data contained in all publications are solely those of the individual author(s) and contributor(s) and not of MDPI and/or the editor(s). MDPI and/or the editor(s) disclaim responsibility for any injury to people or property resulting from any ideas, methods, instructions or products referred to in the content. |
© 2023 by the authors. Licensee MDPI, Basel, Switzerland. This article is an open access article distributed under the terms and conditions of the Creative Commons Attribution (CC BY) license (https://creativecommons.org/licenses/by/4.0/).