Article

Numerical Investigation of the Effect of Supersonic Air Temperature on the Mixing Characteristics of Liquid Fuel

1
Weapon Systems Engineering, University of Science and Technology, Daejeon 34133, Republic of Korea
2
Aerospace Technology Research Institute, Agency for Defense Development, Daejeon 34186, Republic of Korea
*
Author to whom correspondence should be addressed.
Energies 2023, 16(1), 496; https://doi.org/10.3390/en16010496
Submission received: 3 December 2022 / Revised: 25 December 2022 / Accepted: 28 December 2022 / Published: 2 January 2023
(This article belongs to the Section I2: Energy and Combustion Science)

Abstract

:
The effect of supersonic air temperature on the mixing characteristics of liquid hydrocarbon fuel injected into three different supersonic airflows elevated in three steps from 373 K to 673 K was investigated numerically. Compressible Reynolds-averaged Navier–Stokes (RANS) equations were solved together with species conservation equation using ANSYS Fluent for two-phase flow simulations including fuel droplet breakup and evaporation. The turbulence model needed to close the RANS equations used the Shear Stress Transport (SST) k-ω model. The Eulerian–Lagrangian model was employed to track fuel droplets in mainstream air, and the Kelvin–Helmholtz and Rayleigh–Taylor (KH-RT) models were used to simulate the droplet breakup process. Numerical solutions were validated using experimental data. The higher the air temperature, the stronger the streamwise vortices downstream of the pylon. When the air temperature was 373 K, the liquid fuel hardly evaporated, but as the air temperature increased, and the mass fraction of the vaporized fuel and the mixing efficiency increased linearly downstream of the pylon. At air temperatures of 523 K and 673 K, the mixing efficiencies were 10% and 51% at the combustor outlet, respectively. The total pressure loss decreased slightly due to droplet evaporation as the temperature increased from 373 K to 673 K.

1. Introduction

In a supersonic combustion ramjet (scramjet) flying at hypersonic speeds of Mach 5 or greater, the airflow is maintained at supersonic speed in the combustor. Deceleration from hypersonic to subsonic speeds results in more total pressure loss and excessive static temperature increase. Therefore, it is more advantageous to maintain supersonic flow within the scramjet to avoid undesirable flow losses due to compression and deceleration to subsonic speeds [1,2,3]. Because the residence time of the airflow in a scramjet combustor is only a few milliseconds, rapid fuel mixing and uniform fuel distribution in supersonic airflow are important to improve the combustion efficiency of the scramjet [4,5,6]. Much research activities on the scramjet have been focused on scramjet engines using hydrogen fuel, which facilitate verification of hypersonic flight feasibility due to hydrogen properties such as high heat of combustion, excellent ignition characteristics and high cooling capacity [7,8,9,10]. However, liquid hydrocarbon fuels are easier to store and handle than hydrogen fuels and have high energy densities per unit volume, but since additional time is required for atomization and evaporation before ignition, fast and uniform fuel/air mixing within the supersonic combustor using liquid fuels is quite difficult [11,12,13]. Hydrogen-fueled scramjets are considered space access vehicles, while liquid hydrocarbon fuels are used in volume-limited hypersonic cruise missiles [14,15].
Mixing in a supersonic shear layer is highly dependent on the compressibility effect as well as the density and velocity ratios in the shear layer [16,17]. Among the various methods for mixing enhancement in supersonic flows, streamwise (axial) vortices generated by physical devices such as ramps [18,19], pylons [20,21] and struts [22,23] are very effective. Because streamwise vortices are axially oriented vortex structures in the mainstream air, they are less susceptible to compressibility effects and are more effective in compressible regions than incompressible ones [24,25].
Because the pylon and strut are structures that protrude from the wall, fuel is injected into the core stream away from the combustor wall, fully utilizing the mainstream air. The pylon and strut have the advantage of improving both the penetration and spreading of fuel. The trailing-edge configurations of the pylon and strut can induce streamwise vortices that enhance mixing and combustion [26]. However, these intrusive fuel injection devices, such as the pylon and strut, cause unwanted total pressure losses due to streamwise vortices and shock waves. Devices that introduce streamwise vortices to improve fuel and air mixing in supersonic flow are called hypermixers [27]. Doster et al. [28,29] performed experimental and computational studies on the effect of three different trailing-edge pylons on the mixing characteristics of hydrogen fuel and supersonic air. They found that the ramp pylon and the alternating-wedge pylon introduced streamwise vortices into the flow, greatly increasing fuel/air mixing compared with the basic pylon without ramps or wedges at the trailing edge.
Recently, due to powerful computers and robust numerical algorithms, computational fluid dynamics (CFD) plays an important role in comprehensive understanding of complex physical phenomena that cannot be experimentally confirmed in supersonic flows. Manna et al. [30] numerically analyzed the flowfield of a strut-based liquid-kerosene-fueled scramjet combustor using CFX-TASCflow. A Lagrangian dispersed-phase analysis was performed on fuel-droplet evaporation and mixing in supersonic streams. Parametric studies were conducted to investigate the effect of combustor-inlet Mach number and total pressure on the flow development process. Simulations were also performed to investigate the effect of two types of fuel injection struts (namely, five-faced diamond struts and swept-back struts) on scramjet combustor performance. Kumaran et al. [31] investigated the mixing and combustion characteristics of liquid kerosene in a strut-based supersonic combustor using ANSYS Fluent. For the nonreacting flow with fuel injection, the fuel droplet trajectory, kerosene vapor mass fraction, degree of mixing, and mixing efficiency along the combustor length were presented. The contours of kerosene vapor mass fraction showed that the concentration of kerosene vapor was high in the low-velocity wake region behind the struts and then spread out toward the combustor sidewalls. Dharavath et al. [32] performed both nonreacting and reacting flow simulations for a kerosene-fueled scramjet combustor using ANSYS CFX-11. The three-dimensional RANS equations were solved with the k-ε turbulence model. A single-step chemical reaction with the Lagrangian particle tracking method was used for the combustion of kerosene fuel. The top wall pressures were found to agree fairly well with the experimental data for both nonreacting and reacting flows.
Liquid fuel injection in supersonic airflow involves a complex fuel/air mixing process due to the breakup and evaporation of the liquid compared with gaseous fuels such as hydrogen. Additionally, it is difficult to numerically simulate the two-phase flow of liquid and air, including the breakup and evaporation of droplets. Therefore, studies on the mixing of liquid fuels in supersonic airflow have been limited compared to gaseous fuels. Previous studies on the mixing characteristics of liquid fuels in supersonic airflows have been conducted at room temperature or high ignition temperatures. Studies of the effect of supersonic air temperature on fuel/air mixing characteristics such as streamwise vortices, mixing efficiency, and total pressure loss have not been performed. Therefore, in this study, numerical simulations were performed in supersonic airflows of Mach 1.8 with preheated air temperatures of 373, 523, and 673 K. Two-phase flow simulations including injection, breakup, and evaporation of liquid fuel were performed using ANSYS Fluent. The Eulerian–Lagrangian model was used to track the fuel droplets in mainstream air and the dynamic drag model was employed to determine the drag coefficient of the droplet. The numerical solutions were validated through comparison with the experimental data.

2. Mathematical Formulation and Numerical Simulation

2.1. Model Geometry and Physical Parameter

Figure 1 shows a schematic diagram of the computational domain including the alternating-wedge pylon. There is a two-dimensional convergent-divergent (CD) nozzle in front of the combustor to accelerate the air elevated to 374–673 K to Mach 1.8. A large exhaust duct is also located behind the combustor to ensure that the flow downstream of the pylon is not affected by the combustor outlet. The configurations of the combustor, nozzle and alternating-wedge pylon are the same as those investigated experimentally by Hwang et al. [33]. The pylon includes four expansion wedges in the aft area of the pylon to enhance turbulent mixing and widen the vortex zone. The wedge of the pylon has an expansion angle of 36° and itself has a forward compression half angle of 7° to the mainstream air. The expansion wedge forms a lower pressure region and flow spills into the region, creating streamwise vortices downstream of the pylon [34].
There are two fuel injection orifices with a diameter (d) of 0.32 mm per side of the pylon. Liquid hydrocarbon fuel was injected vertically onto the pylon surface in the mainstream air. The hydrocarbon fuel is exo-THDCPD (C10H16) with a purity of 99.0% by weight. The boiling point of the fuel is 460 K at atmospheric pressure and the fuel density is 940 kg/m3 at 288 K [35,36].
The fuel-to-air momentum flux ratio is the main controlling parameter to describe the physics of fuel jets in crossflow air [37]. The momentum flux ratio ( q ), defined as the ratio of the dynamic pressure of the injected fuel to the crossflow air, is expressed as follows [29]:
q = ρ f   u f 2 ρ a   u a 2 = γ f P f M f 2 γ a P a M a 2
where ρ f and ρ a represent the fuel and air densities, respectively, u f and u a are the corresponding velocities, γ f and γ a are the corresponding specific heat ratios, P f and P a are the corresponding pressures, and M f and M a are the corresponding Mach numbers.
In the simulation, the fuel-to-air momentum flux ratio was maintained constant at 15 to compare the mixing characteristics of the liquid fuel according to the air temperature change. The fuel temperature was constant at 288 K, but the air temperatures were adjusted from 373 K to a maximum of 673 K above the fuel boiling point (460 K).

2.2. Numerical Simulation

Since the computational domain contains the pylon with complex three-dimensional configuration, it was built as a hybrid mesh including hexagonal and tetrahedral meshes using ICEM-CFD. The interior of the computational domain was mostly hexagonal mesh, with some tetrahedral mesh placed near the pylon or walls. A prism mesh was used to properly simulate the effect of boundary layers near the walls and pylon. The mesh layer increased in size by 1.2 times as it moved away from the walls and pylon, resulting in a total of 20 layers. It was confirmed that the wall y+ was maintained in the range of 1.0–1.5. In the simulation, the 3D compressible turbulent Reynolds-averaged Navier–Stokes (RANS) equations were solved together with the species conservation equation using ANSYS Fluent V19.2. The turbulence model needed to close the RANS equations used Menter’s Shear Stress Transport (SST) k-ω model [38]. The SST k-ω model takes advantage of both the standard k-ε model in the detached region and Wilcox’s k-ω model in the near-wall region. This model performs relatively well in adverse pressure gradients and separated flows compared with the k-ω or k-ε models. At the same time, when predicting the mixing layers and jet flows, the SST k-ω model provides relatively better results than other one- and two-equation RANS turbulence models [39]. The Eulerian–Lagrangian model [40] was employed to track fuel droplets in the mainstream air, and a two-phase analysis was performed taking into account the coupling between air flow and fuel droplets. For the drag coefficient required in the equation of motion of the droplets, the dynamic drag model [41] was used. The KH-RT model [42,43], which combines the effects of Kelvin–Helmholtz (KH) waves driven by aerodynamic forces and Rayleigh Taylor (RT) instabilities due to the acceleration of shed droplets ejected into the air flow, was chosen to simulate the droplet breakup process.
The advection terms of governing equations were discretized by the second-order upwind (SOU) scheme [44] to more accurately capture the flow characteristics. The Green-Gauss Node-Based Gradient method [45] was employed for the gradient of the scale at the cell center, and the convective fluxes across cell boundary were discretized by advection upstream splitting method (AUSM) [46] to better capture the oblique or bow shocks.
For the boundary conditions of the computational domain, the total pressure and total temperature of the air at the inlet of the domain were specified. All the flow variables at the outlet boundary, including pressure, were determined from the inside of the domain by extrapolation because the flow was supersonic [31,47]. For liquid fuel injection, mass flow rate, temperature and pressure were specified. No-slip and adiabatic conditions were applied to all solid surfaces (walls), and the droplets were allowed to reflect off the walls.

2.3. Mathematical Modeling

2.3.1. Eulerian Governing Equations

Mass conservation equation for the mainstream air [40]:
ρ t + x i ( ρ u i ) = S m
where ρ and u i are the density and mean velocity components of the air, respectively.
The source term S m is the mass added to the air from the droplets due to evaporation of the droplets.
Momentum conservation equation for the mainstream air [40]:
t ( ρ u i ) + x j ( ρ u i u j ) = p x i + ( σ i j ) x j + ( τ i j ) x j + S f
where p is the static pressure, S f is the momentum source term due to the effect of droplet motion, and σ i j is the stress tensor due to the molecular viscosity ( μ ) defined by:
σ i j = [ μ ( u i x j + u j x i ) ] 2 3 μ u k x k δ i j
and τ i j is the Reynolds stress tensor defined by:
τ i j = ρ   u i u j ¯
where u is the fluctuating velocity of the mainstream air. The Reynolds stress term is appropriately modeled using the Boussinesq hypothesis [48] to relate the Reynolds stress to the mean velocity gradients:
ρ   u i u j ¯ = μ t ( u i x j + u j x i ) 2 3 ( ρ k + μ t u k x k ) δ i j
where k is the turbulent kinematic energy and μ t is the turbulent eddy viscosity computed by the SST k-ω turbulent model.
Energy conservation equation for the mainstream air [40]:
t ( ρ E ) + x j [ ( u j ( ρ E + p ) ] = x j ( k e f f T x j j h j J ¯ j + ( τ = e f f · u i ) ) + S h
where E is the total energy, k e f f is the effective conductivity ( k + k t , where k t is the turbulent thermal conductivity), and J ¯ j is the diffusion flux of species j. The first three terms on the right-hand side of Equation (7) represent energy transfer due to conduction, species diffusion, and viscous dissipation, respectively. S h is the energy source term resulting from the heat transfer accompanied by the droplet dispersion.
In addition to the Navier–Stokes equations, the species transport conservation equation for the mass fraction ( Y j ) of the fuel jet is solved to investigate the mixing between the fuel and the mainstream air [40].
t ( ρ Y k ) + x i ( ρ u i Y k ) = J ¯ k x i + S i
where S i is the rate of generation by addition from the dispersed phase. J ¯ k is the diffusion flux of species k due to concentration and temperature gradients.

2.3.2. Lagrangian Model for Fuel Droplet Tracking

In the Eulerian–Lagrangian model, the mainstream air is considered as a continuum in which the Navier–Stokes equations are solved, whereas the discrete phase is solved by tracking the droplets. There is an exchange of momentum, mass and energy between the continuum and discrete phases. Droplet–droplet interactions are included in the simulation. However, this method requires the discrete phase to have a low volume fraction, while the mass loading can be high [40].
Prediction of the droplet trajectory is possible by integrating the force balance for the droplet written in the Lagrangian reference frame. This force balance equates the droplet inertia to the forces acting on the droplet and can be written as
d u p d t = u u p τ p + g   ( ρ p ρ ) ρ p + F
where u is the mainstream air velocity, u p is the droplet velocity, ρ is the air density, ρ p is the droplet density, ( u u p ) / τ p is the drag force per unit droplet mass and τ p is the droplet relaxation time [49] calculated by
τ p = ρ p   d p 2 18 μ 24 C d   R e p
where d p is the droplet diameter and C d is the droplet drag coefficient. R e p is the relative Reynolds number between the mainstream air and the droplets.
Many droplet drag models assume that the droplet remains spherical throughout its domain. With this assumption, the drag of a spherical object is determined as [41]:
C d , s p h e r e = { 0.424                                                           R e p > 1000 24 R e ( 1 + 1 6   R e 2 / 3 )               R e p 1000
However, as an initially spherical droplet moves through the mainstream air, its shape is distorted significantly when the Weber number is large. In the extreme case, the droplet shape approaches a disk shape. However, the drag on a disk is much greater than that on a sphere. Because the droplet drag coefficient is strongly dependent on the droplet shape, the drag model that assumes the droplet shape is spherical is not satisfactory. The dynamic drag model accounts for the effect of a droplet distortion, which linearly varies the drag between that of a sphere and the value of 1.54 corresponding to a disk. The drag coefficient is given by
C d = C d , s p h e r e ( 1 + 2.632 y )
where y is the droplet distortion determined by the solution of
d 2 y d t 2 = C F   ρ g   u 2 C b   ρ l   r 2 C k   σ ρ l     r 3 y C d   μ l ρ l     r 2   d y d t
where ρ l and ρ g are the densities of the droplet and air, u is the relative velocity between the droplet and air, r is the undistorted droplet radius, σ is the droplet surface tension, and μ l is the droplet viscosity. The constants C k = 8, C d = 5, C F = 1/3, C b = 1/2 [50].
The trajectory equations and all auxiliary equations describing heat or mass transfer to/from the droplet are solved by stepwise integration over discrete time steps. Integration of time in Equation (9) yields the velocity of the droplet at each point along the trajectory, and the trajectory itself is predicted by
d x d t = u p
Equations (9) and (14) are a set of coupled ordinary differential equations, and Equation (9) can be converted into the following general form [40]
d u p d t = 1 τ p ( u u p ) + a
Here, the term a includes accelerations due to all other forces except drag force. This set can be solved for the constants u , a and τ p by analytical integration or the Runge–Kutta method [51,52].

2.3.3. Droplet Breakup Model

When the injected fuel interacts with the supersonic airstream, surface waves are generated on the fuel column, resulting in droplet shear. The surface wave evolves and the liquid column disintegrates, generating a large number of fuel ligaments. Under the influence of airstream, the fuel ligaments break down more and produce large droplets, which subsequently break into smaller droplets called child droplets [53].
The wave breakup model of Reitz [54] assumes that the breakup time and consequent droplet size are related to the fastest-growing Kelvin–Helmholtz (KH) instability. The KH model assumes that the radius r of the newly formed droplets is proportional to the wavelength of the fastest-growing unstable surface wave on the parent droplet of radius a .
r = B 0   Λ K H
where Λ K H is the wavelength corresponding to the KH wave with the maximum growth rate ( Ω K H ). B 0 is the constant for the drop size and is generally taken as 0.61. The rate of change of droplet radius is given by
d a d t = ( a r ) τ K H ,             r a
where τ K H is the breakup time defined by
τ K H = 3.726   B 1   a Λ K H   Ω K H
where B 1 is the breakup time constant and a value of 1.73 was recommended by Liu et al. [41], but the value of B 1 can be between 1 and 60 depending on the injector characterization [54,55].
The maximum growth rate ( Ω K H ) and the corresponding wavelength ( Λ K H ) are obtained from Equations (19) and (20), respectively.
Ω K H ρ l a 3 σ = 0.34 + 0.38   W e 2 1.5 ( 1 + Z ) ( 1 + 1.4 T 0.6 )
Λ K H a = 9.02   ( 1 + 0.45   Z 0.5   ) ( 1 + 0.4   T 0.7 ) ( 1 + 0.87   W e 2 1.67 ) 0.6  
where Z = W e 1   / R e 1 is the Ohnesorge number and T = O h W e 2 is the Taylor number. Also, W e 1 = ρ l   U r 2   a / σ and W e 2 = ρ g U r 2   a / σ are the liquid and gas Weber numbers, respectively, and R e 1 = U r   a / ν l is the Reynolds number. U r is the relative velocity between the fuel droplet and the mainstream air.
The KH-RT model [42], which combines the effects of the Kelvin–Helmholtz instability and the Rayleigh–Taylor instability, assumes that a liquid core exists in the region near the fuel injection orifice. Child droplets are shed from this liquid core and are subjected to sudden acceleration when they are ejected into the airstream and Rayleigh–Taylor (RT) instability becomes the dominant effect. The length of the liquid core is obtained from the Levich theory [56]
L = C L   d 0   ρ l ρ g
where C L is the Levich constant usually equal to 5.7 [54] and d 0 is the orifice diameter.
Like the KH model, the RT model is based on the wave instability of the droplet surface given the frequency of the fastest growing wave as
Ω R T = 2 3 3 σ [ g t ( ρ l ρ g ) ] 3 / 2 ρ l + ρ g
where g t is the droplet acceleration in the direction of droplet movement. The corresponding wave number is
K R T = g t ( ρ l ρ g ) 3 σ
The wavelength corresponding to the fastest wave growth rate is 2 π C R T / K R T . If the wavelength is smaller than the local droplet diameter, the RT waves are assumed to grow on the droplet surface. Once waves begin to grow on the droplet surface, the wave growth time is tracked. This time is then compared to the breakup time ( τ R T ) defined by
τ R T = C τ Ω R T
where C τ is the RT breakup time constant, usually equal to unity [57,58]. If the RT waves have been growing for a time greater than the breakup time ( τ R T ), the drop is assumed to breakup. The radius of the smaller child droplets is calculated as follows:
r c = π   C R T K R T
where C R T is an adjustable constant from 0.1 to 1.0 [42,57,58,59], with a default value of 0.1 [40].

2.3.4. Mesh Independent Study and Solution Validation

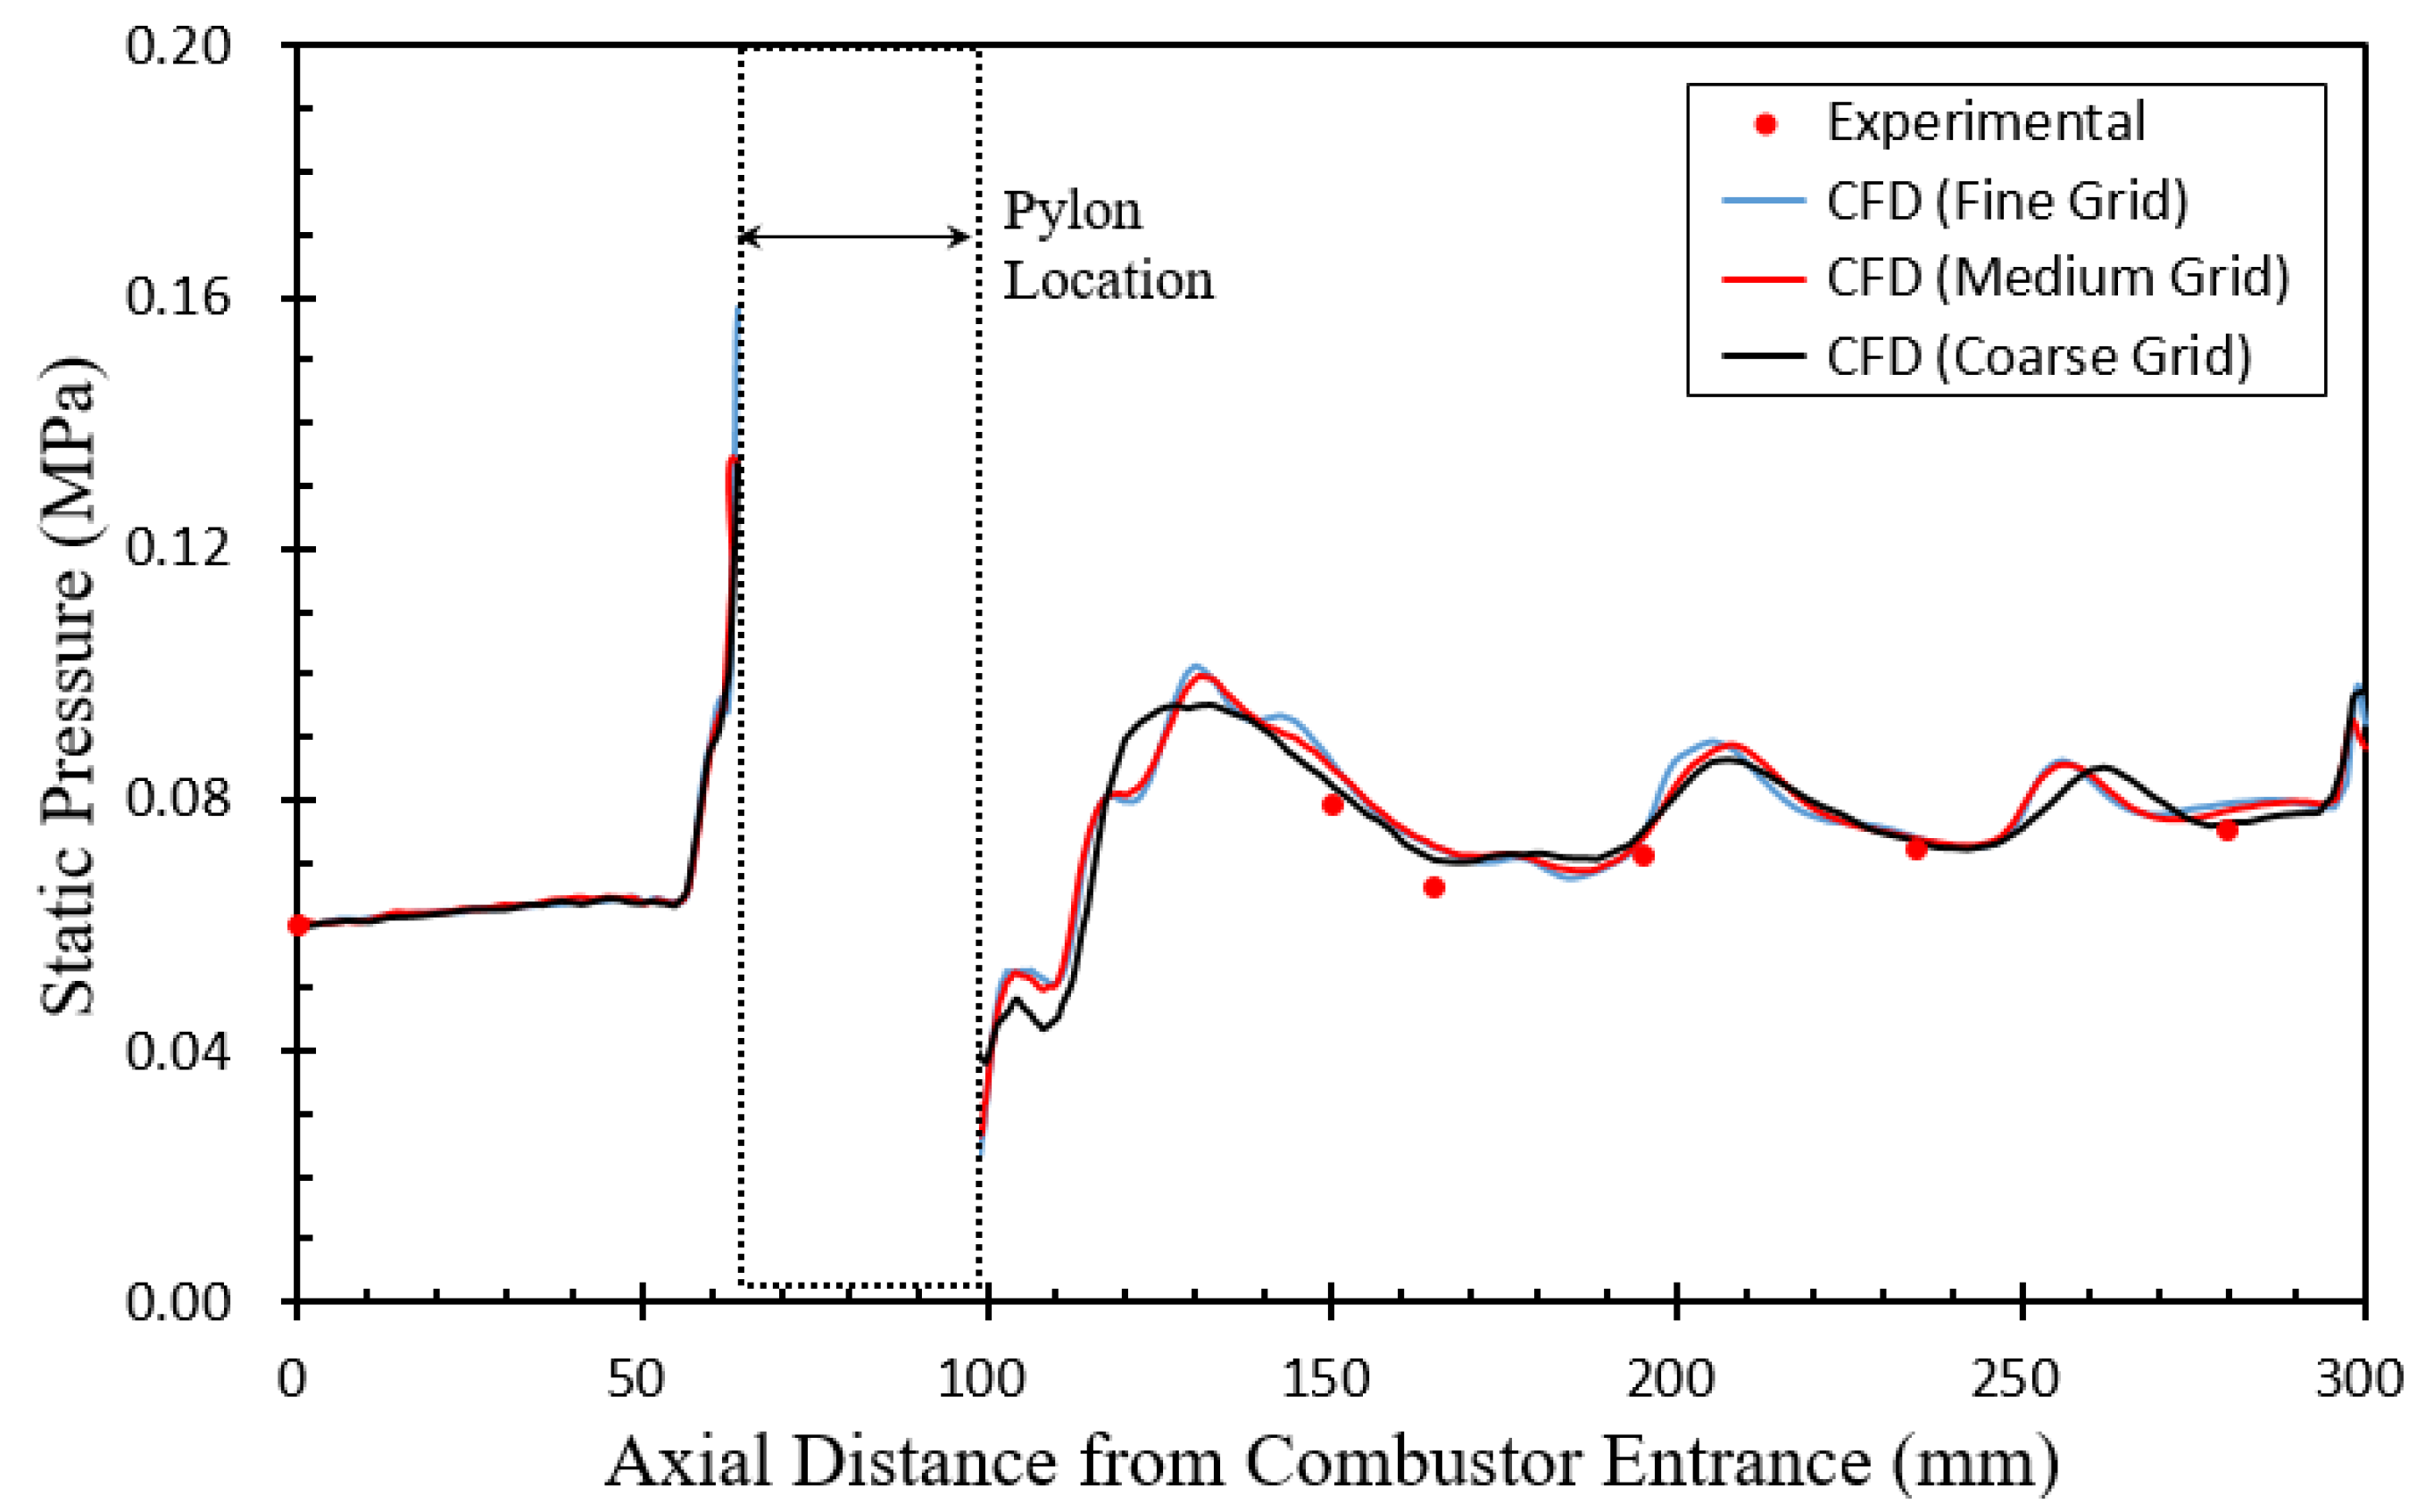
In order to perform grid independence in the simulation, three different grids were applied: a coarse grid (1.70 million elements), a medium grid (4.30 million elements), and a fine grid (8.68 million elements). As shown in Figure 2, the static pressure distributions for the medium and fine grids were almost the same, but the coarse grid showed a slight difference. Therefore, the simulations in this study were performed using the medium grid (4.30 million elements).
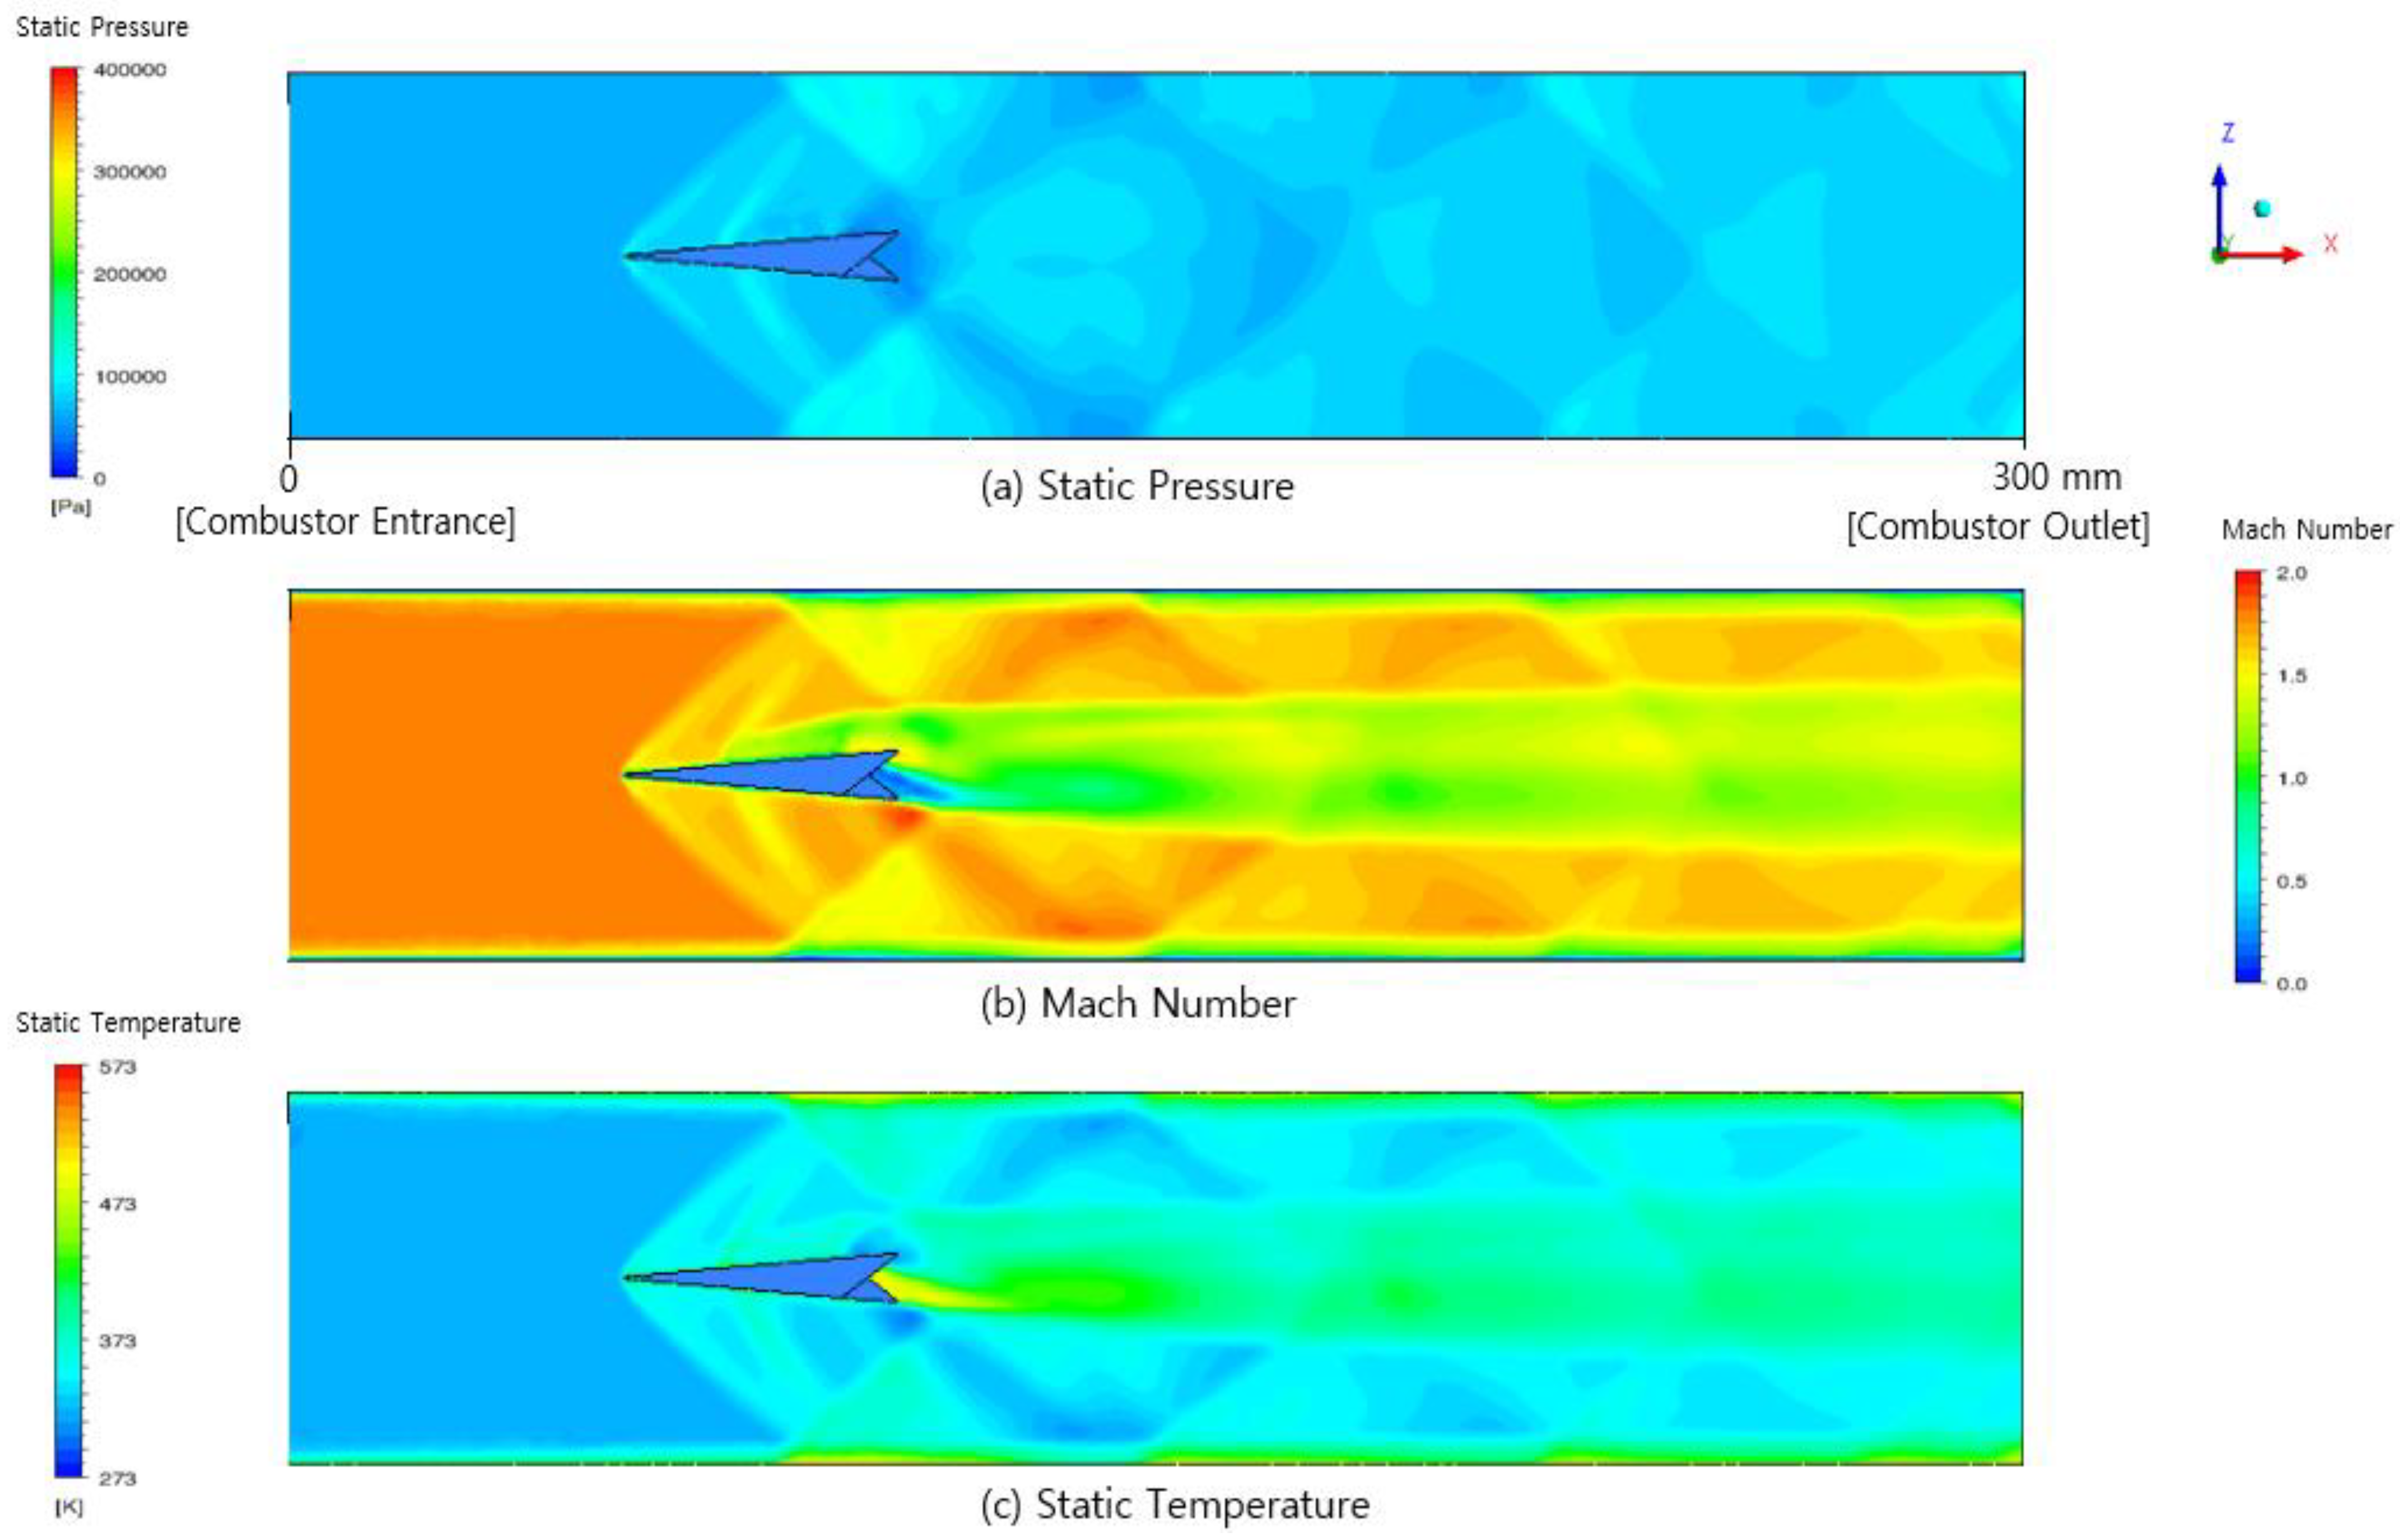
In Figure 2, the calculated static pressure distributions along the center of the combustor top wall for an air temperature of 523 K were compared with the experimental data of Hwang et al. [33]. Although the pressure variation around the pylon was severe due to the shocks shown in Figure 3, there are no measurement data due to insufficient space to install the pressure tap. However, the six static pressures obtained from the measurable locations were in relatively good agreement with the calculated static pressures.
Figure 3 shows the static pressure, Mach number, and static temperature contours in the X-Z plane at mid-height in the Y direction of the combustor for an air temperature of 523 K. It can be seen that an oblique shock was generated ahead of the pylon, which hit the wall and generated reflected shocks. These shocks generated by the pylon were almost symmetrical on both sides of the pylon, although slightly different due to the position of the fuel injection and expansion ramps on the pylons in the Y direction of the combustor. In addition, a bow shock was generated ahead of fuel injection, and expansion waves were generated by the expansion ramps at the rear of the pylon, which increased the temperature immediately behind the ramps as shown in Figure 3c.

3. Simulation Results and Discussion

3.1. Streamwise Vortex

In this study, the streamwise vortex ( ω x ) was defined as the axial component of the curl of the velocity vector. Note that vortices are directional and have positive and negative values. The absolute value of the streamwise vortex is used to integrate over a magnitude parameter, which is always positive. The mass-weighted average integral of the absolute value ( Ω x ) of the axial vortices is a measure of streamwise vortices. The relative magnitude of streamwise vortices normalized to the maximum vortex value ( Ω x m a x ) from the data globally at any axial location was calculated [29].
| ω x | = | ( × V ) x |
Ω x =   | ω x |   ρ u d A   ρ u d A
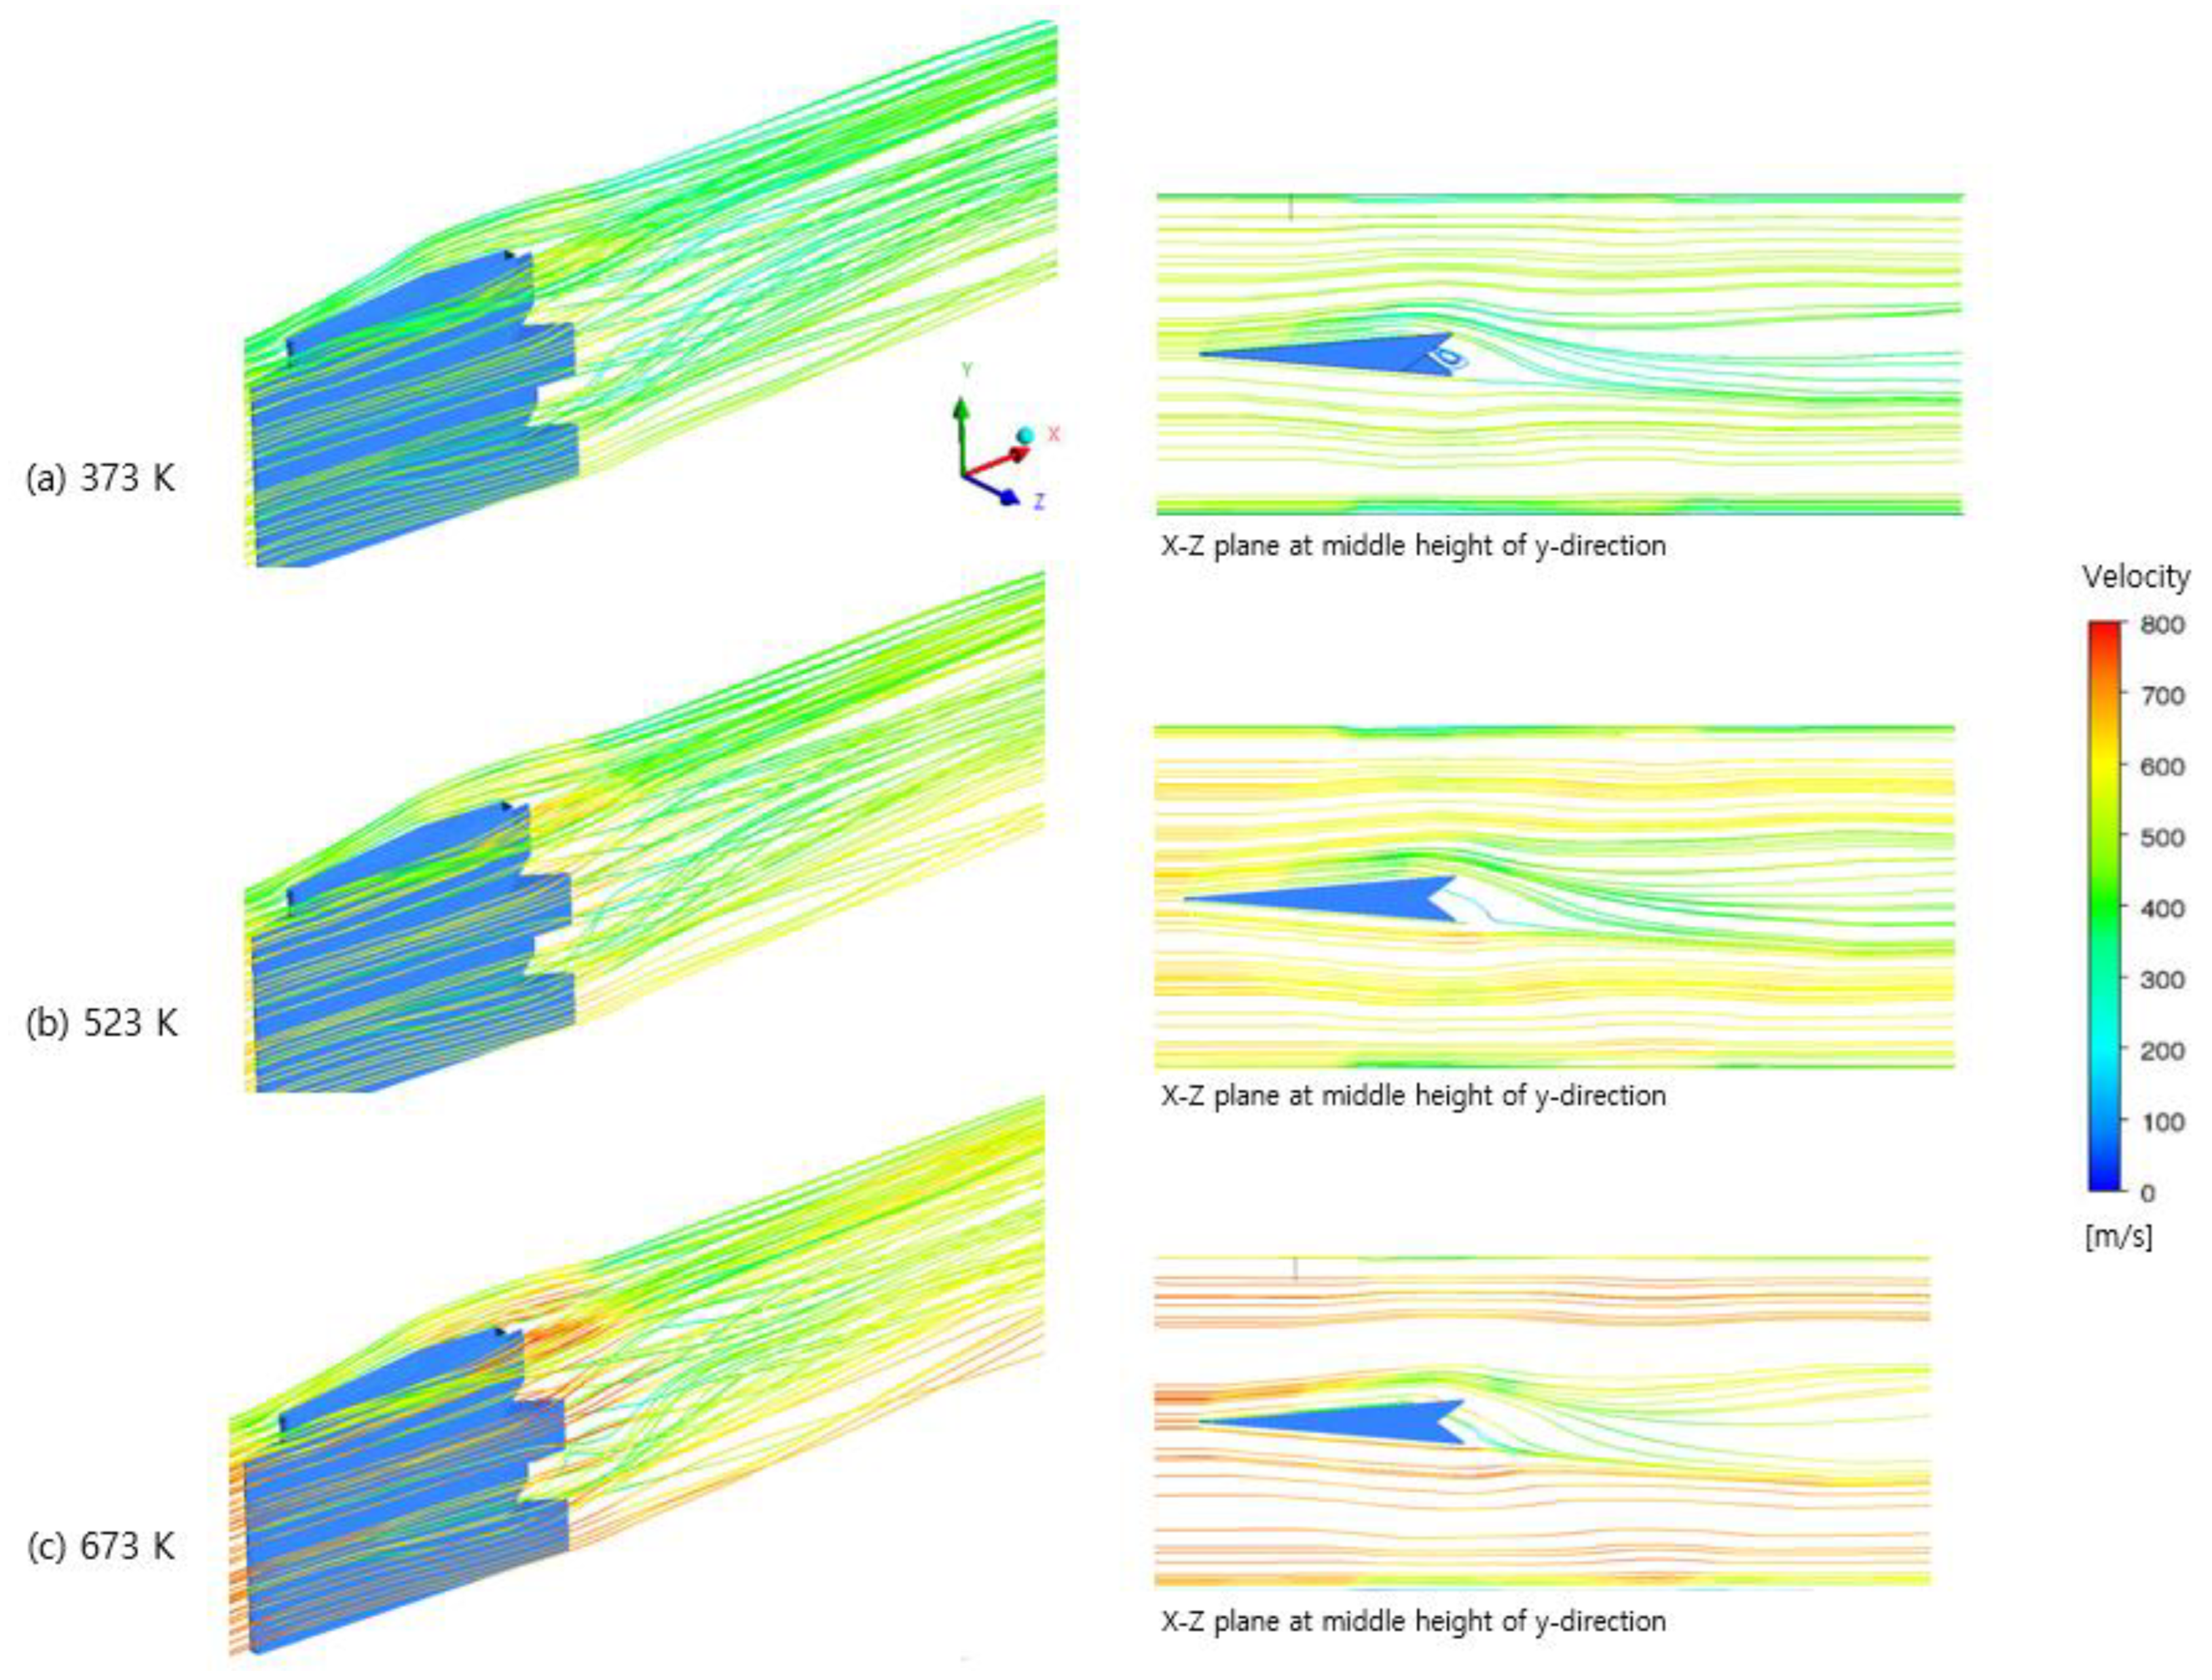
Figure 4 shows the streamlines and velocity contours near the pylon for three different air temperatures of 373, 523, and 673 K. As shown in the figure, the higher the air temperature, the higher the velocity near the pylon. In the case of Figure 4a, where the temperature is the lowest, small vortices were generated between the wedges at the rear of the pylon due to the low velocity. It can be seen that the streamlines downstream near the pylon became slightly more entangled as the temperature increased.
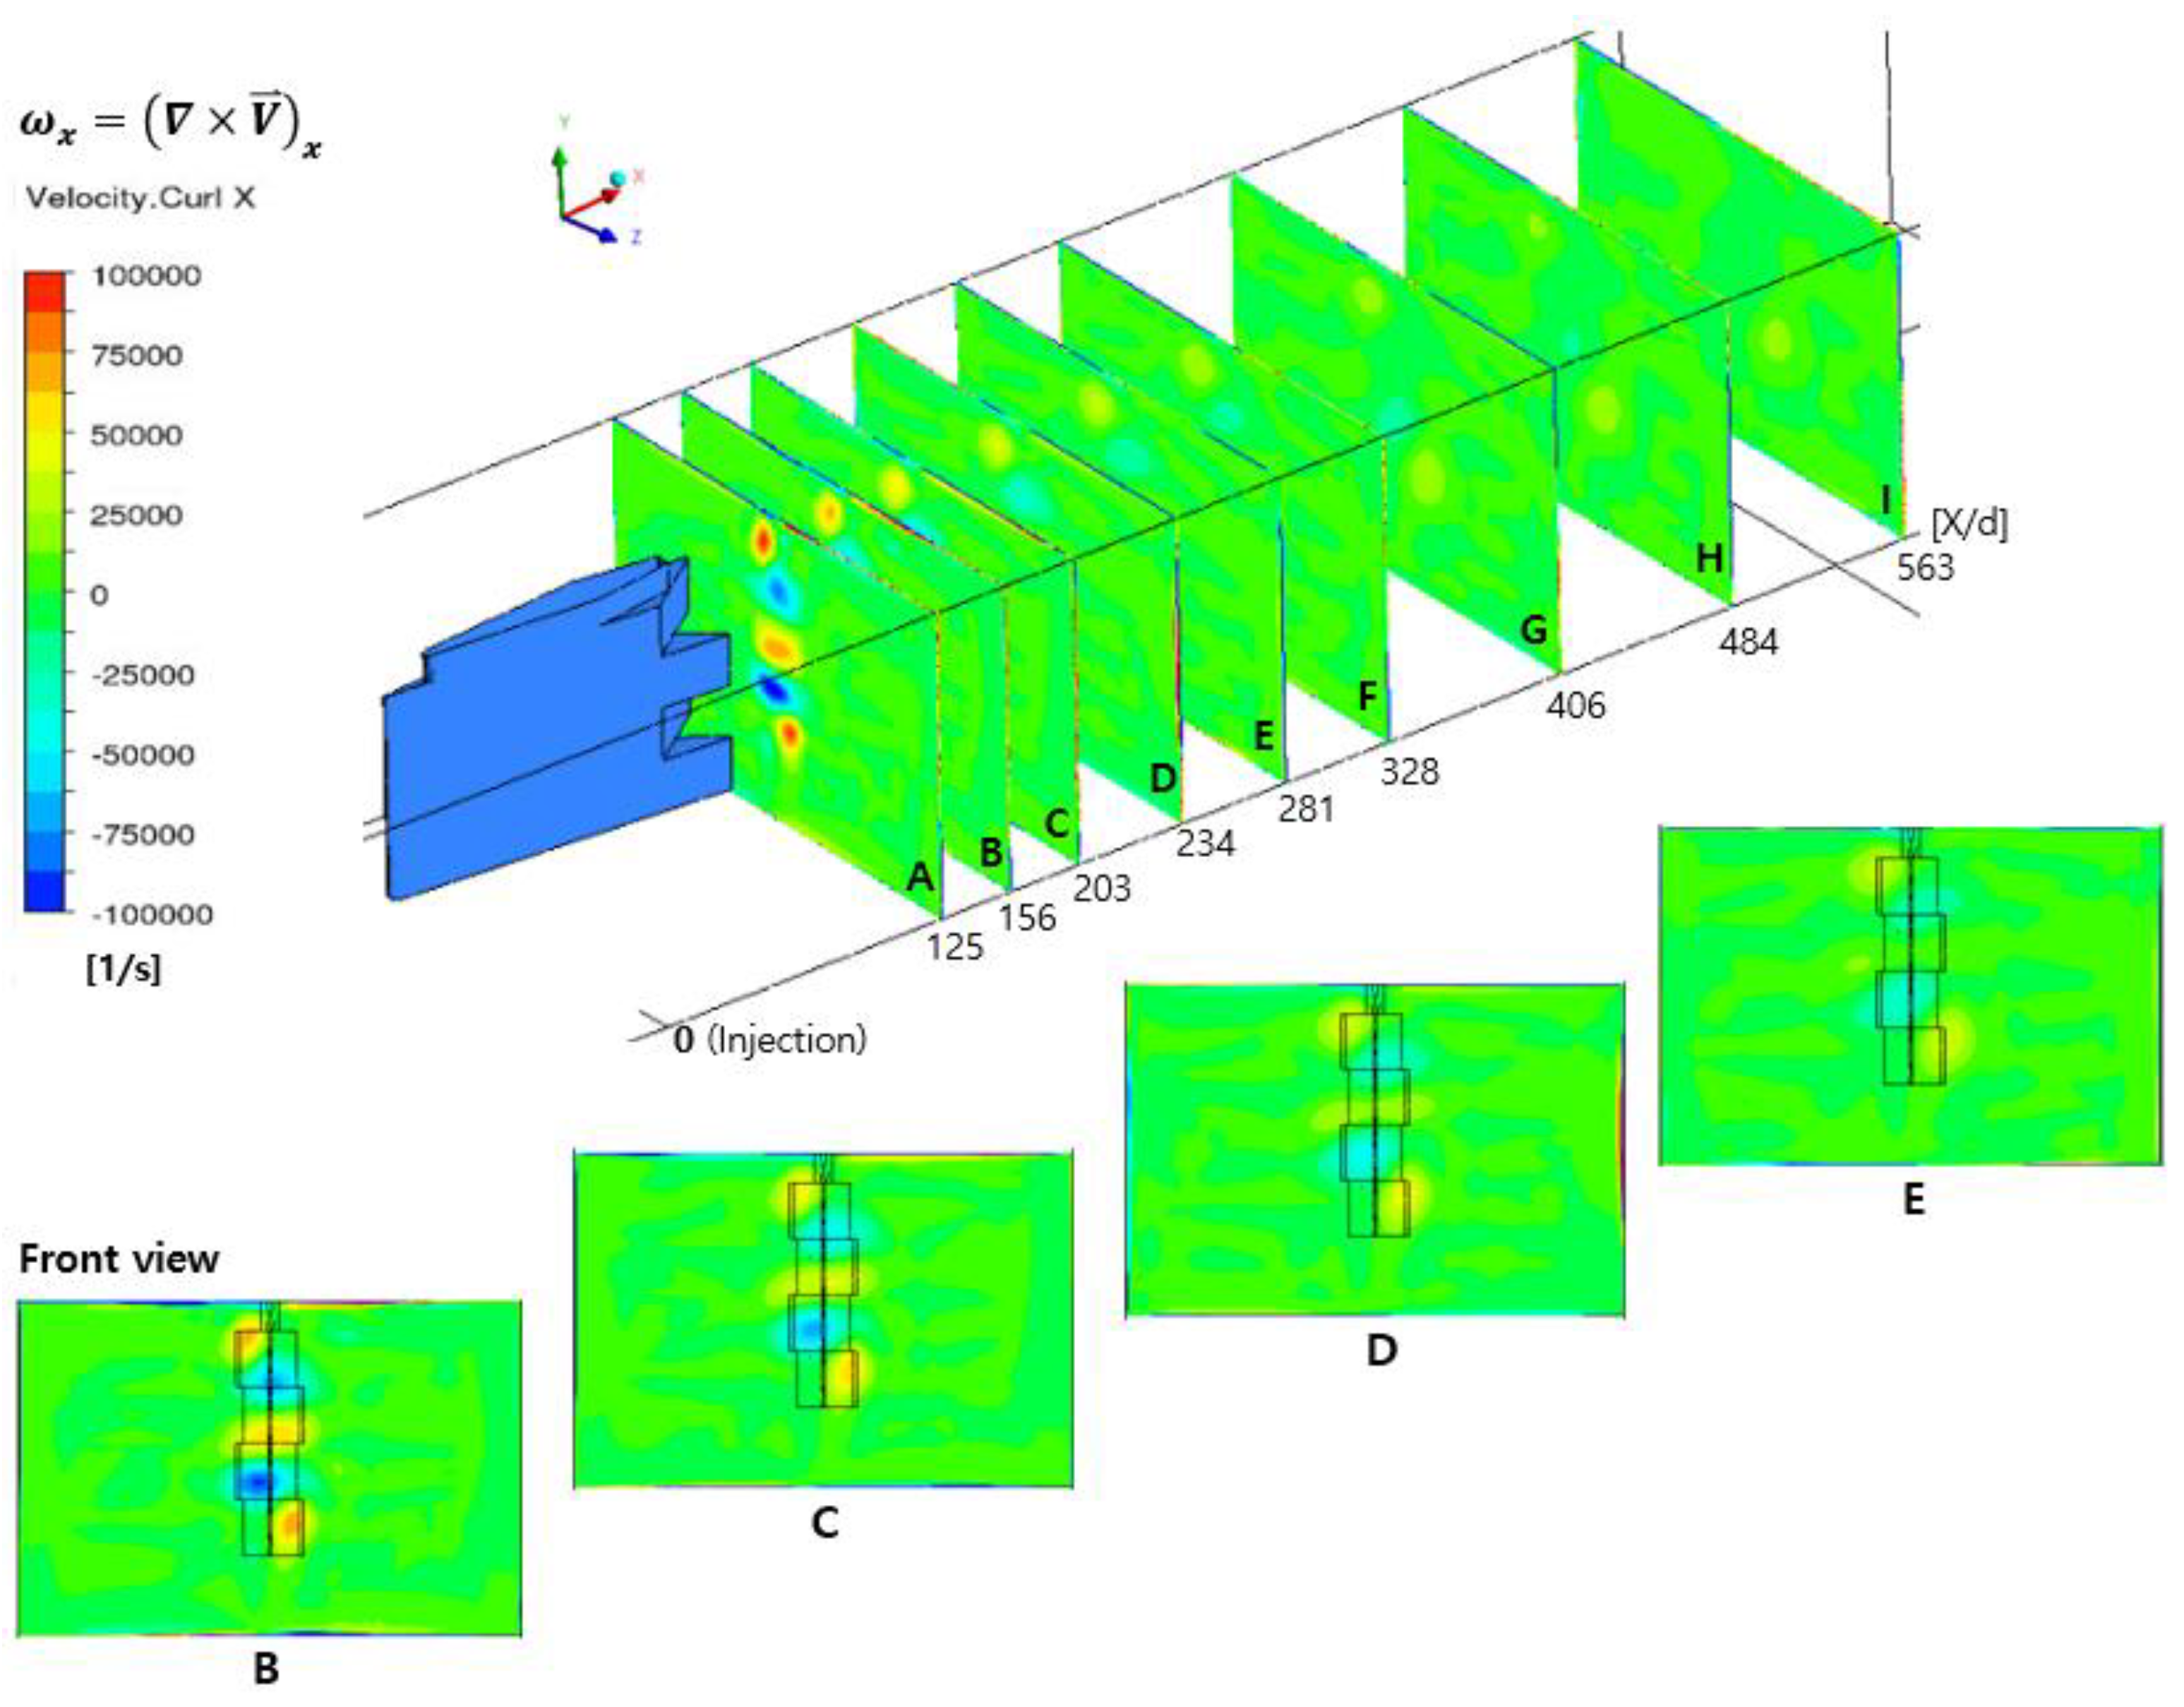
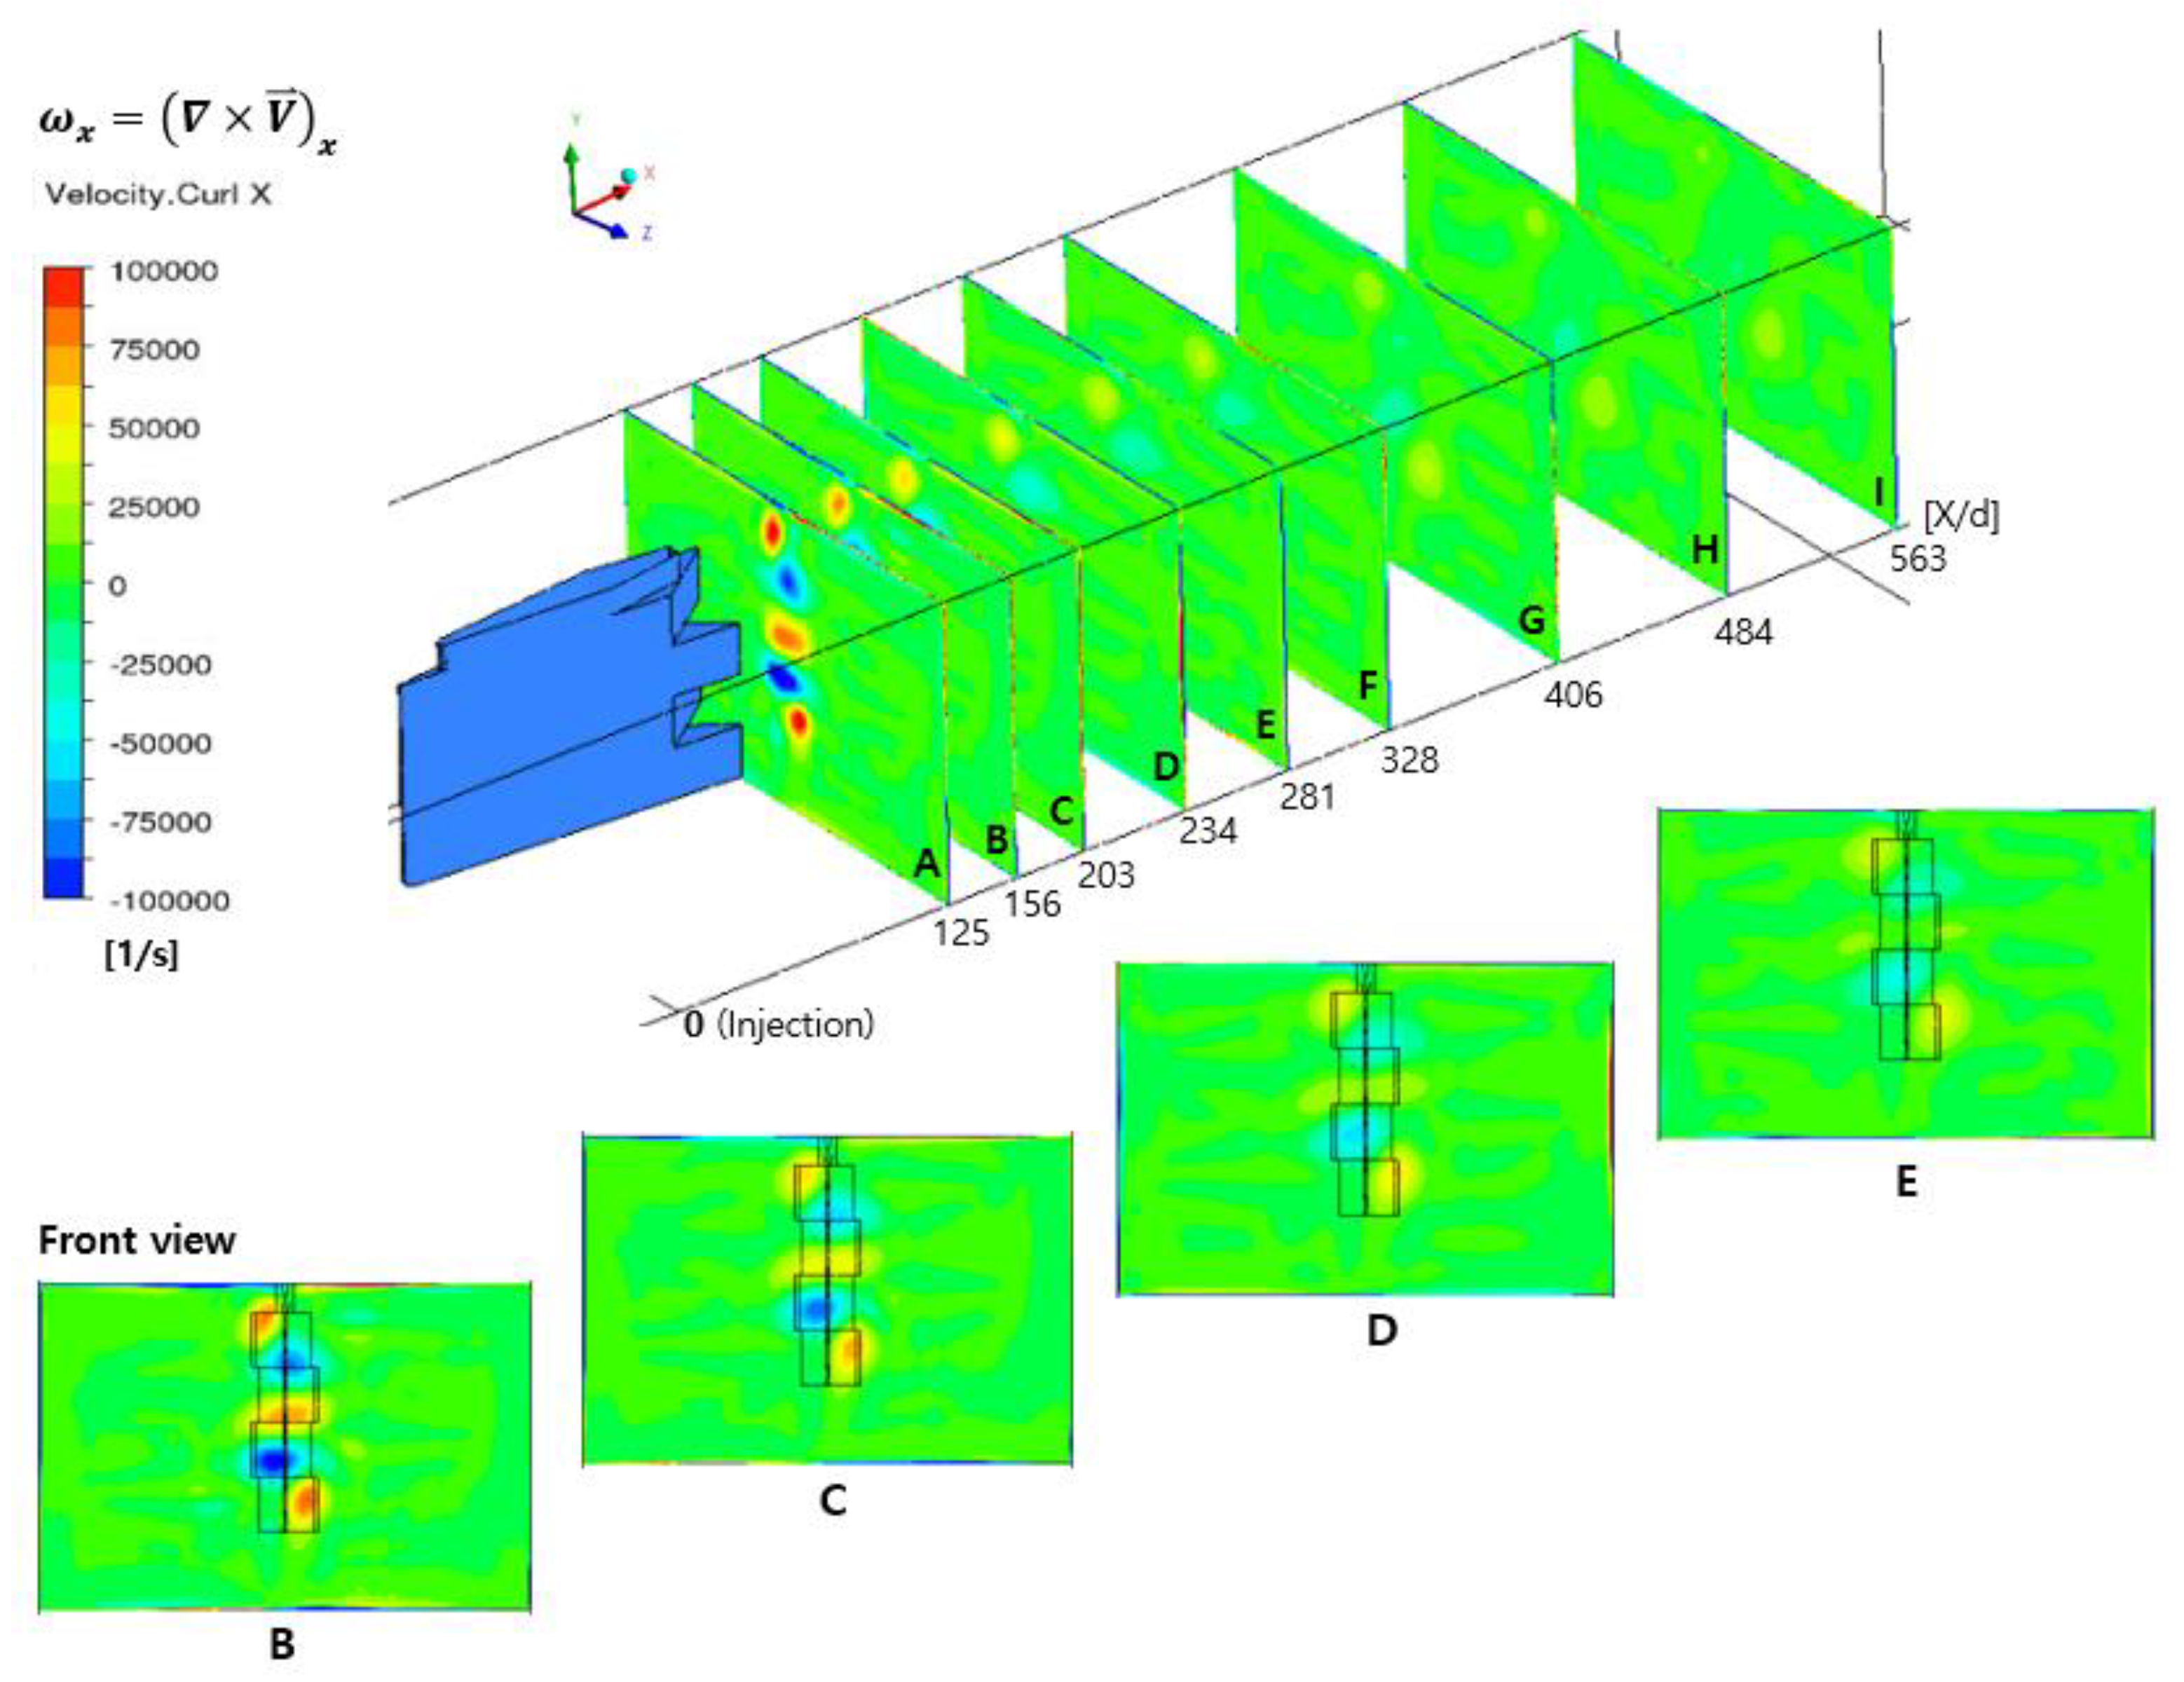
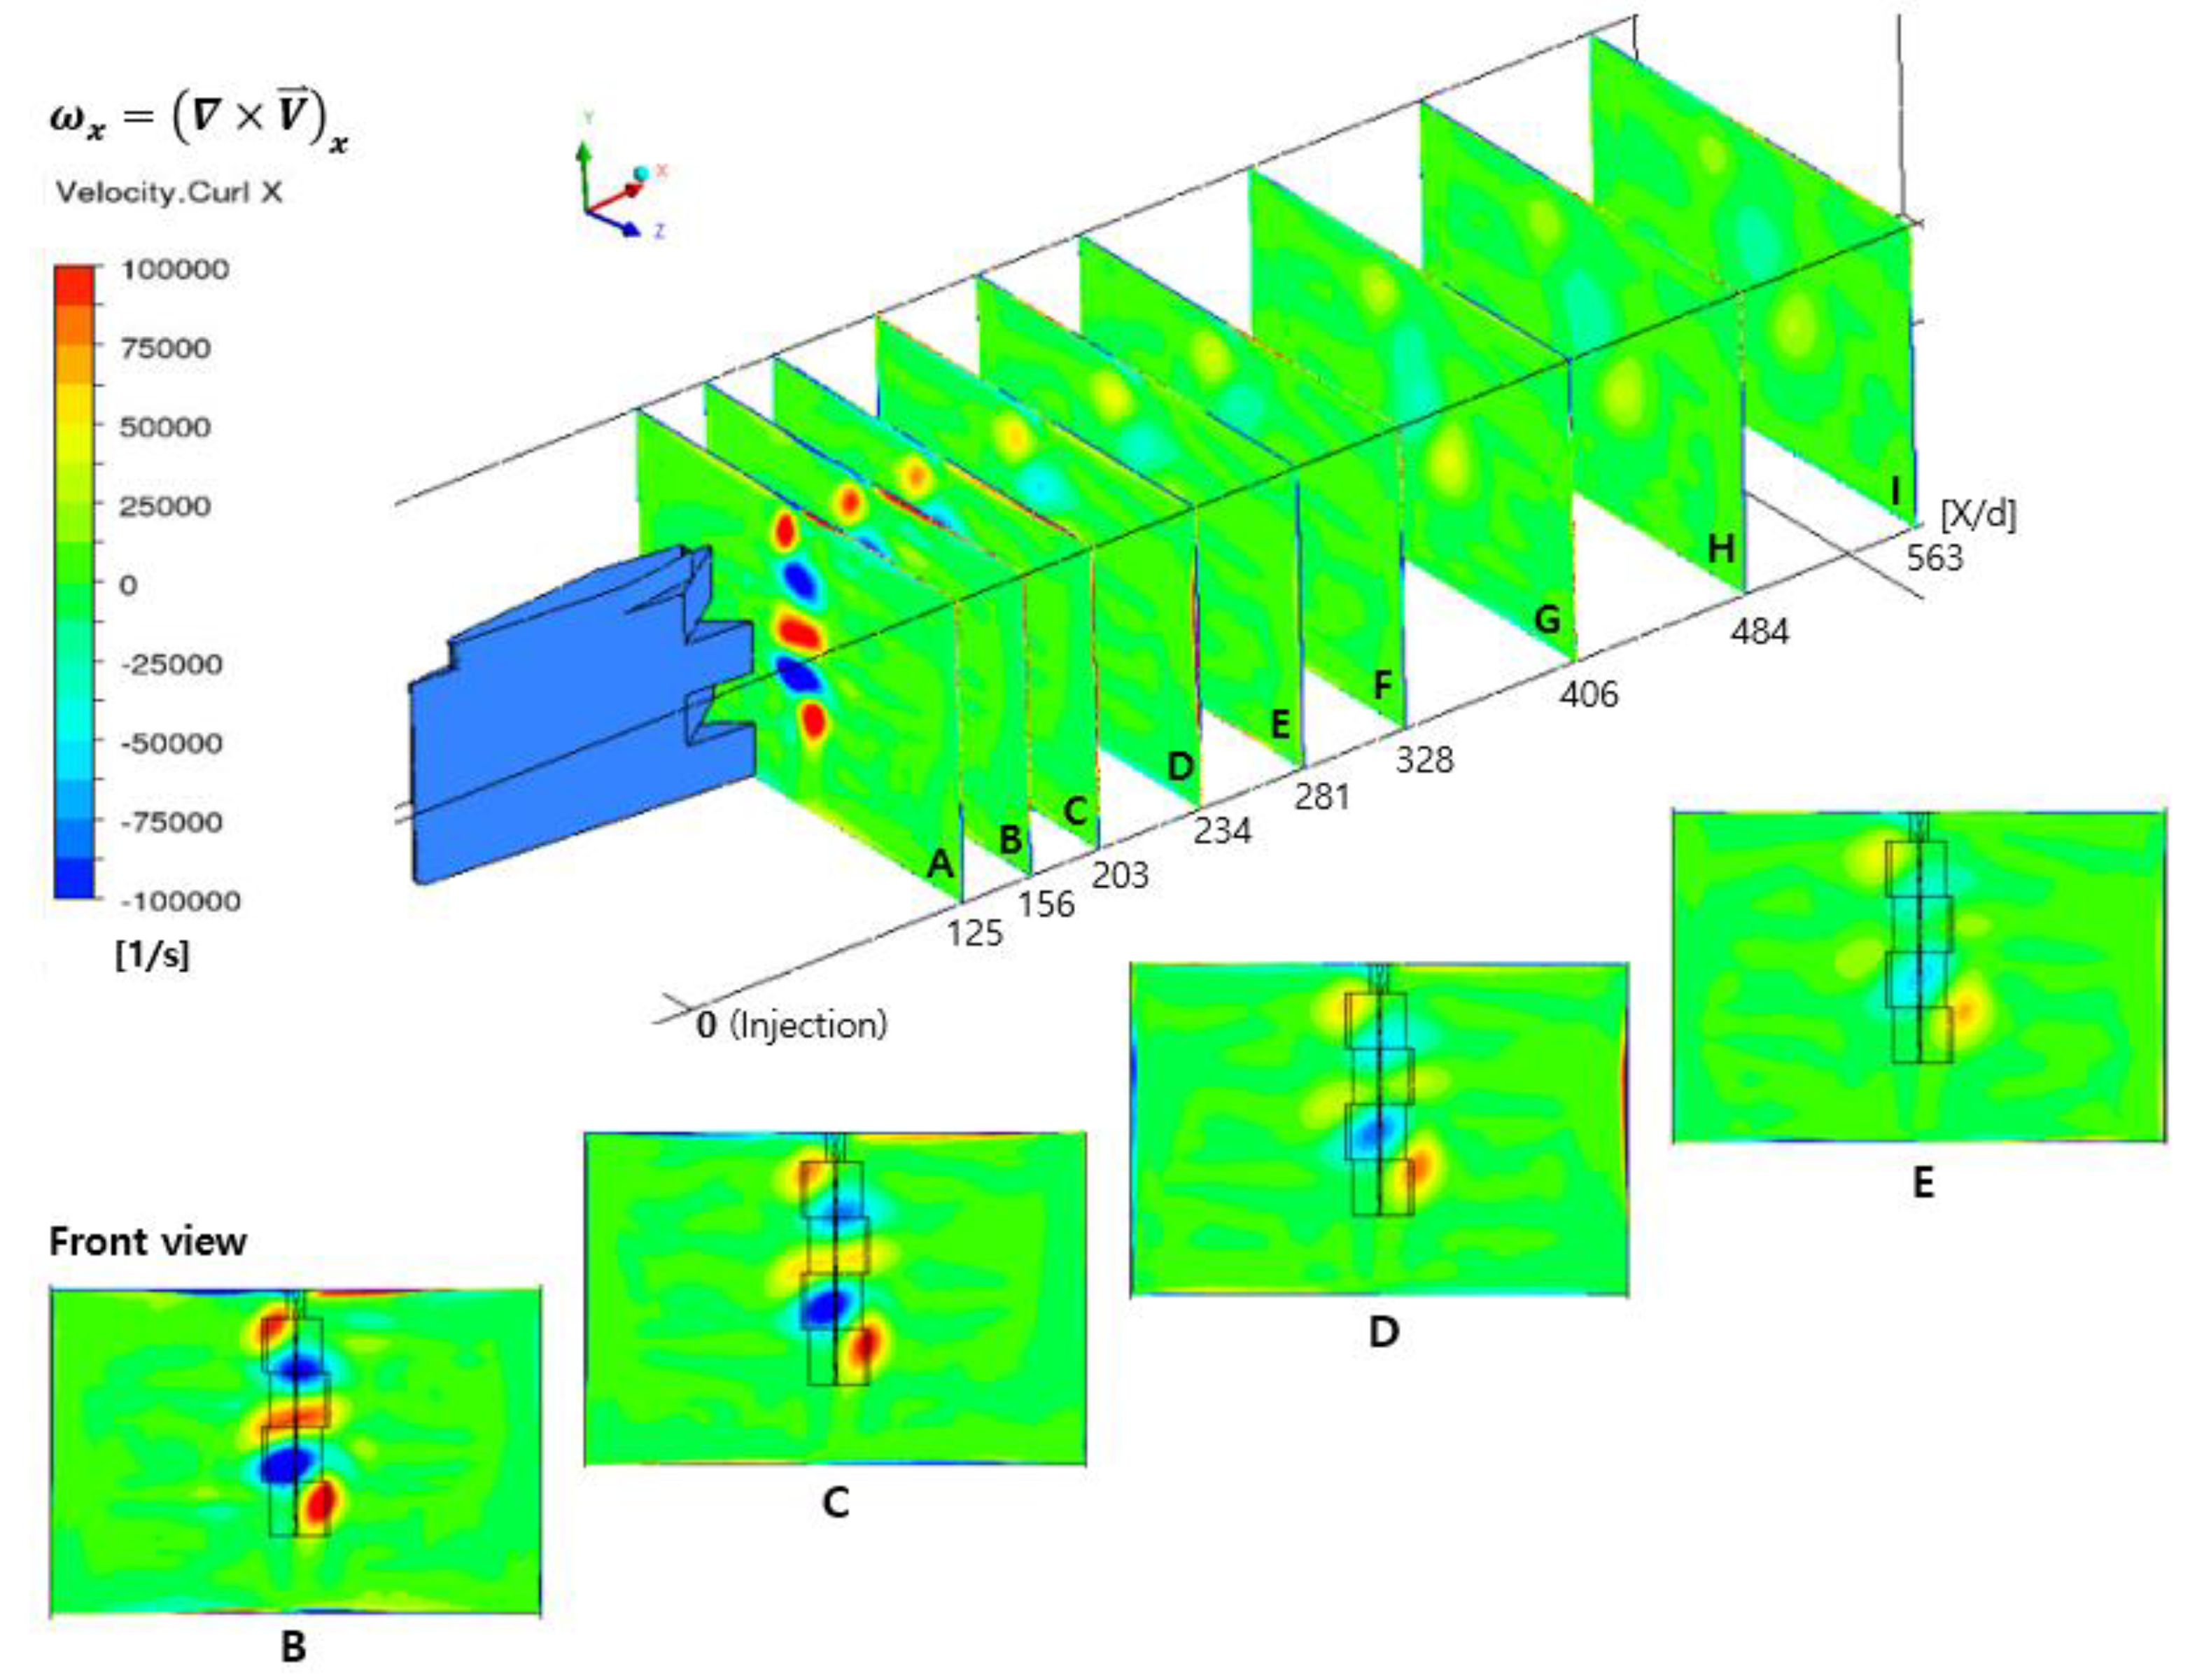
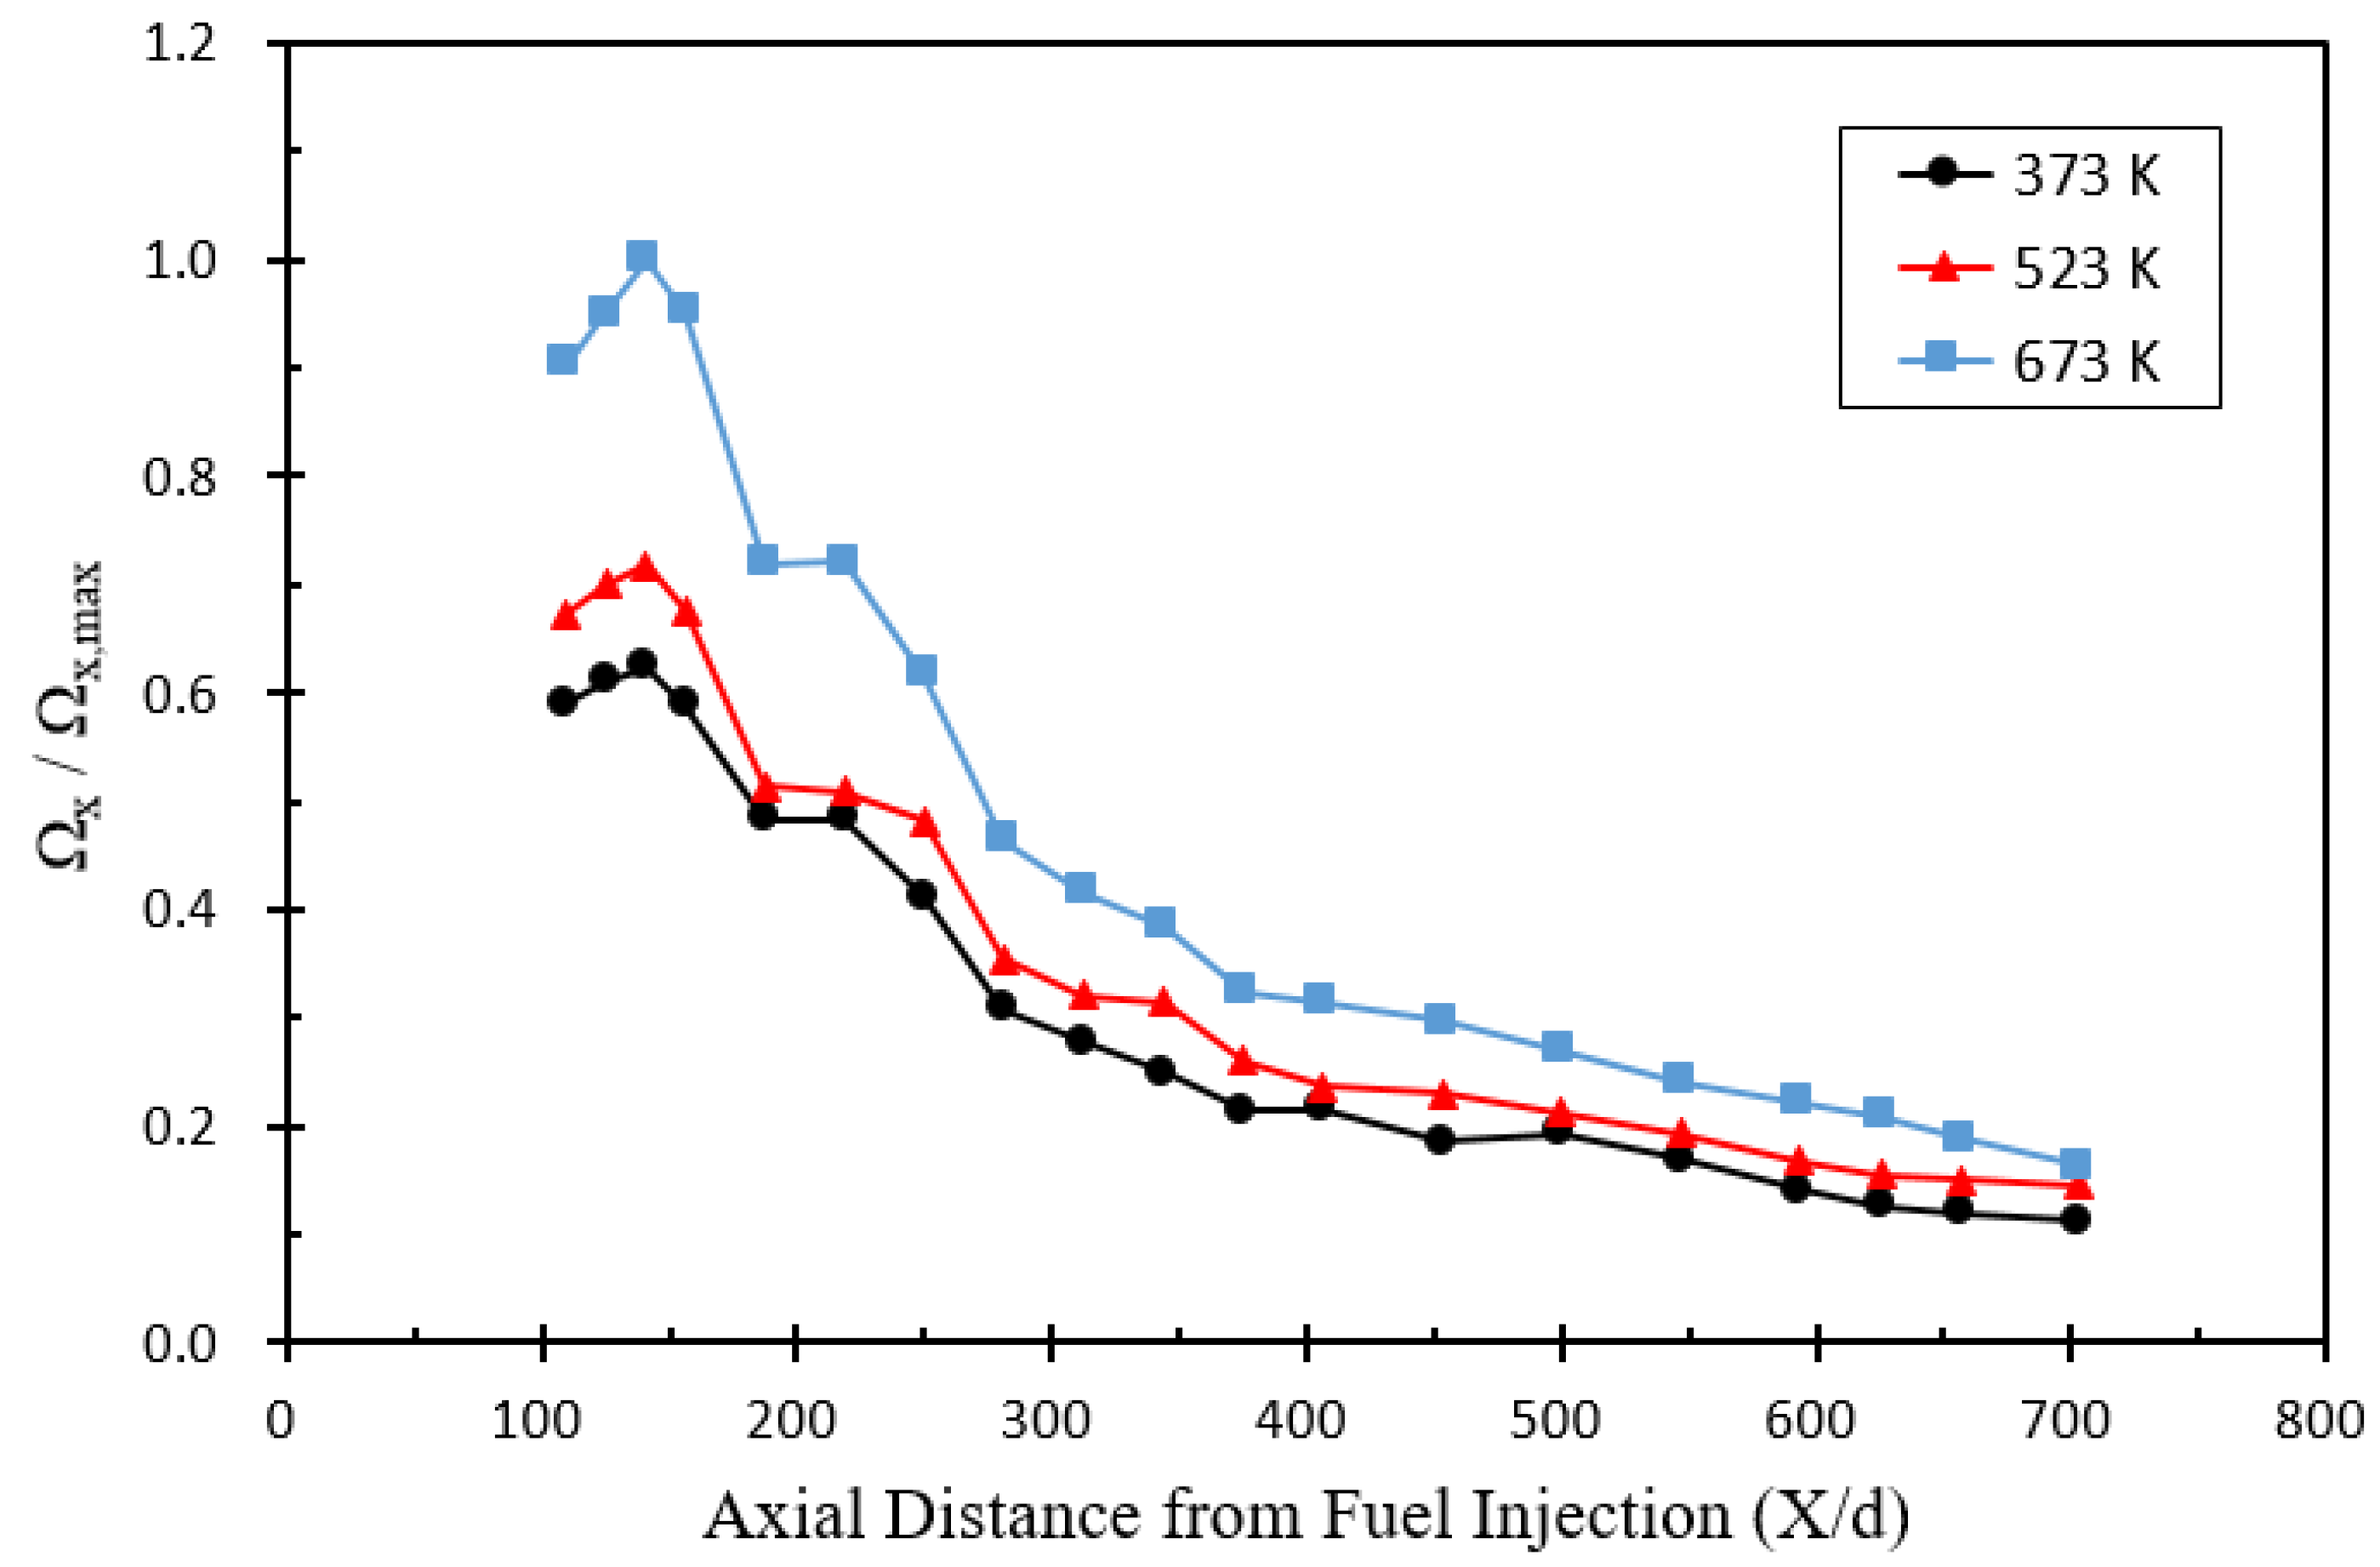
Figure 5, Figure 6 and Figure 7 show the streamwise vortex contours at various axial locations downstream of the pylon for three different air temperatures of 373, 523, and 673 K, respectively. In the figures, the X/d=constant planes downstream of the pylon were labeled alphabetically with letters A through I. That is, the letter B represents the cross section with X/d = 156, and the letter E represents the cross section with X/d = 281. Figure 8 shows a comparison of streamwise vortex magnitudes at 19 locations (X/d = 109.4–703.1) downstream of the pylon for three different air temperatures. Here X is the axial distance downstream of the fuel injection orifice in the pylon and d is the orifice diameter. It can be seen that the higher the air temperature, the stronger the magnitude of the streamwise vortices downstream of the pylon. At X/d = 109.4–140.6 adjacent to the pylon, the streamwise vortices were stronger downstream of the pylon. However, after X/d = 140.6, the streamwise vortices gradually weakened toward the downstream of the pylon due to the decrease in the influence of the alternating-wedge of the pylon. Although the simulation conditions in this study and in Doster et al. [29] were slightly different in pylon configuration, injectant (fuel) and injection location, and supersonic air conditions, the trend of increasing and decreasing streamwise vortices downstream of the pylon was similar.

3.2. Mixing Efficiency

Mixing efficiency is used to quantitatively analyze the fuel dispersion in the mainstream air. Because combustion is highly dependent on the mixing process, mixing efficiency is one of the most important parameters to characterize the flow field in a scramjet combustor. Here, the mixing efficiency ( η m ) at any axial location is defined as follows [31]:
η m = m ˙ fuel ,   mixed m ˙ fuel , in = x α R   ρ u d A x m ˙ fuel , in
Here, the denominator is the total amount of fuel injected upstream of this location. The quantity α R in the numerator is given by
α R = {   α                                                   α α s t α s t 1 α 1 α s t                   α > α s t    
where α is the local fuel mass fraction and α s t is the stoichiometric fuel mass fraction (0.071 for C10H16) corresponding to the oxygen mass fraction at that location. ρ and u are the local density and axial velocity, respectively. Thus, mixing efficiency ( η m ) is a measure of the percentage of the fuel that is likely to burn under stoichiometric conditions. 0 < η m < 1 , where   η m = 1 indicates perfect mixing and η m = 0 represents complete separation of fuel and air.
Figure 9 shows the comparison of the vaporized fuel mass fraction contours at various axial locations downstream of the pylon for three different air temperatures of 373, 523, and 673 K. At an air temperature of 373 K, there was almost no vaporized fuel downstream of the pylon, but the vaporized fuel mass fraction increased as the air temperature increased. At air temperatures of 523 K and 673 K above the boiling point of the fuel (460 K), the vaporized mass fraction of the fuel injected from the two orifices per side of the pylon increased further downstream of the pylon and spread laterally.
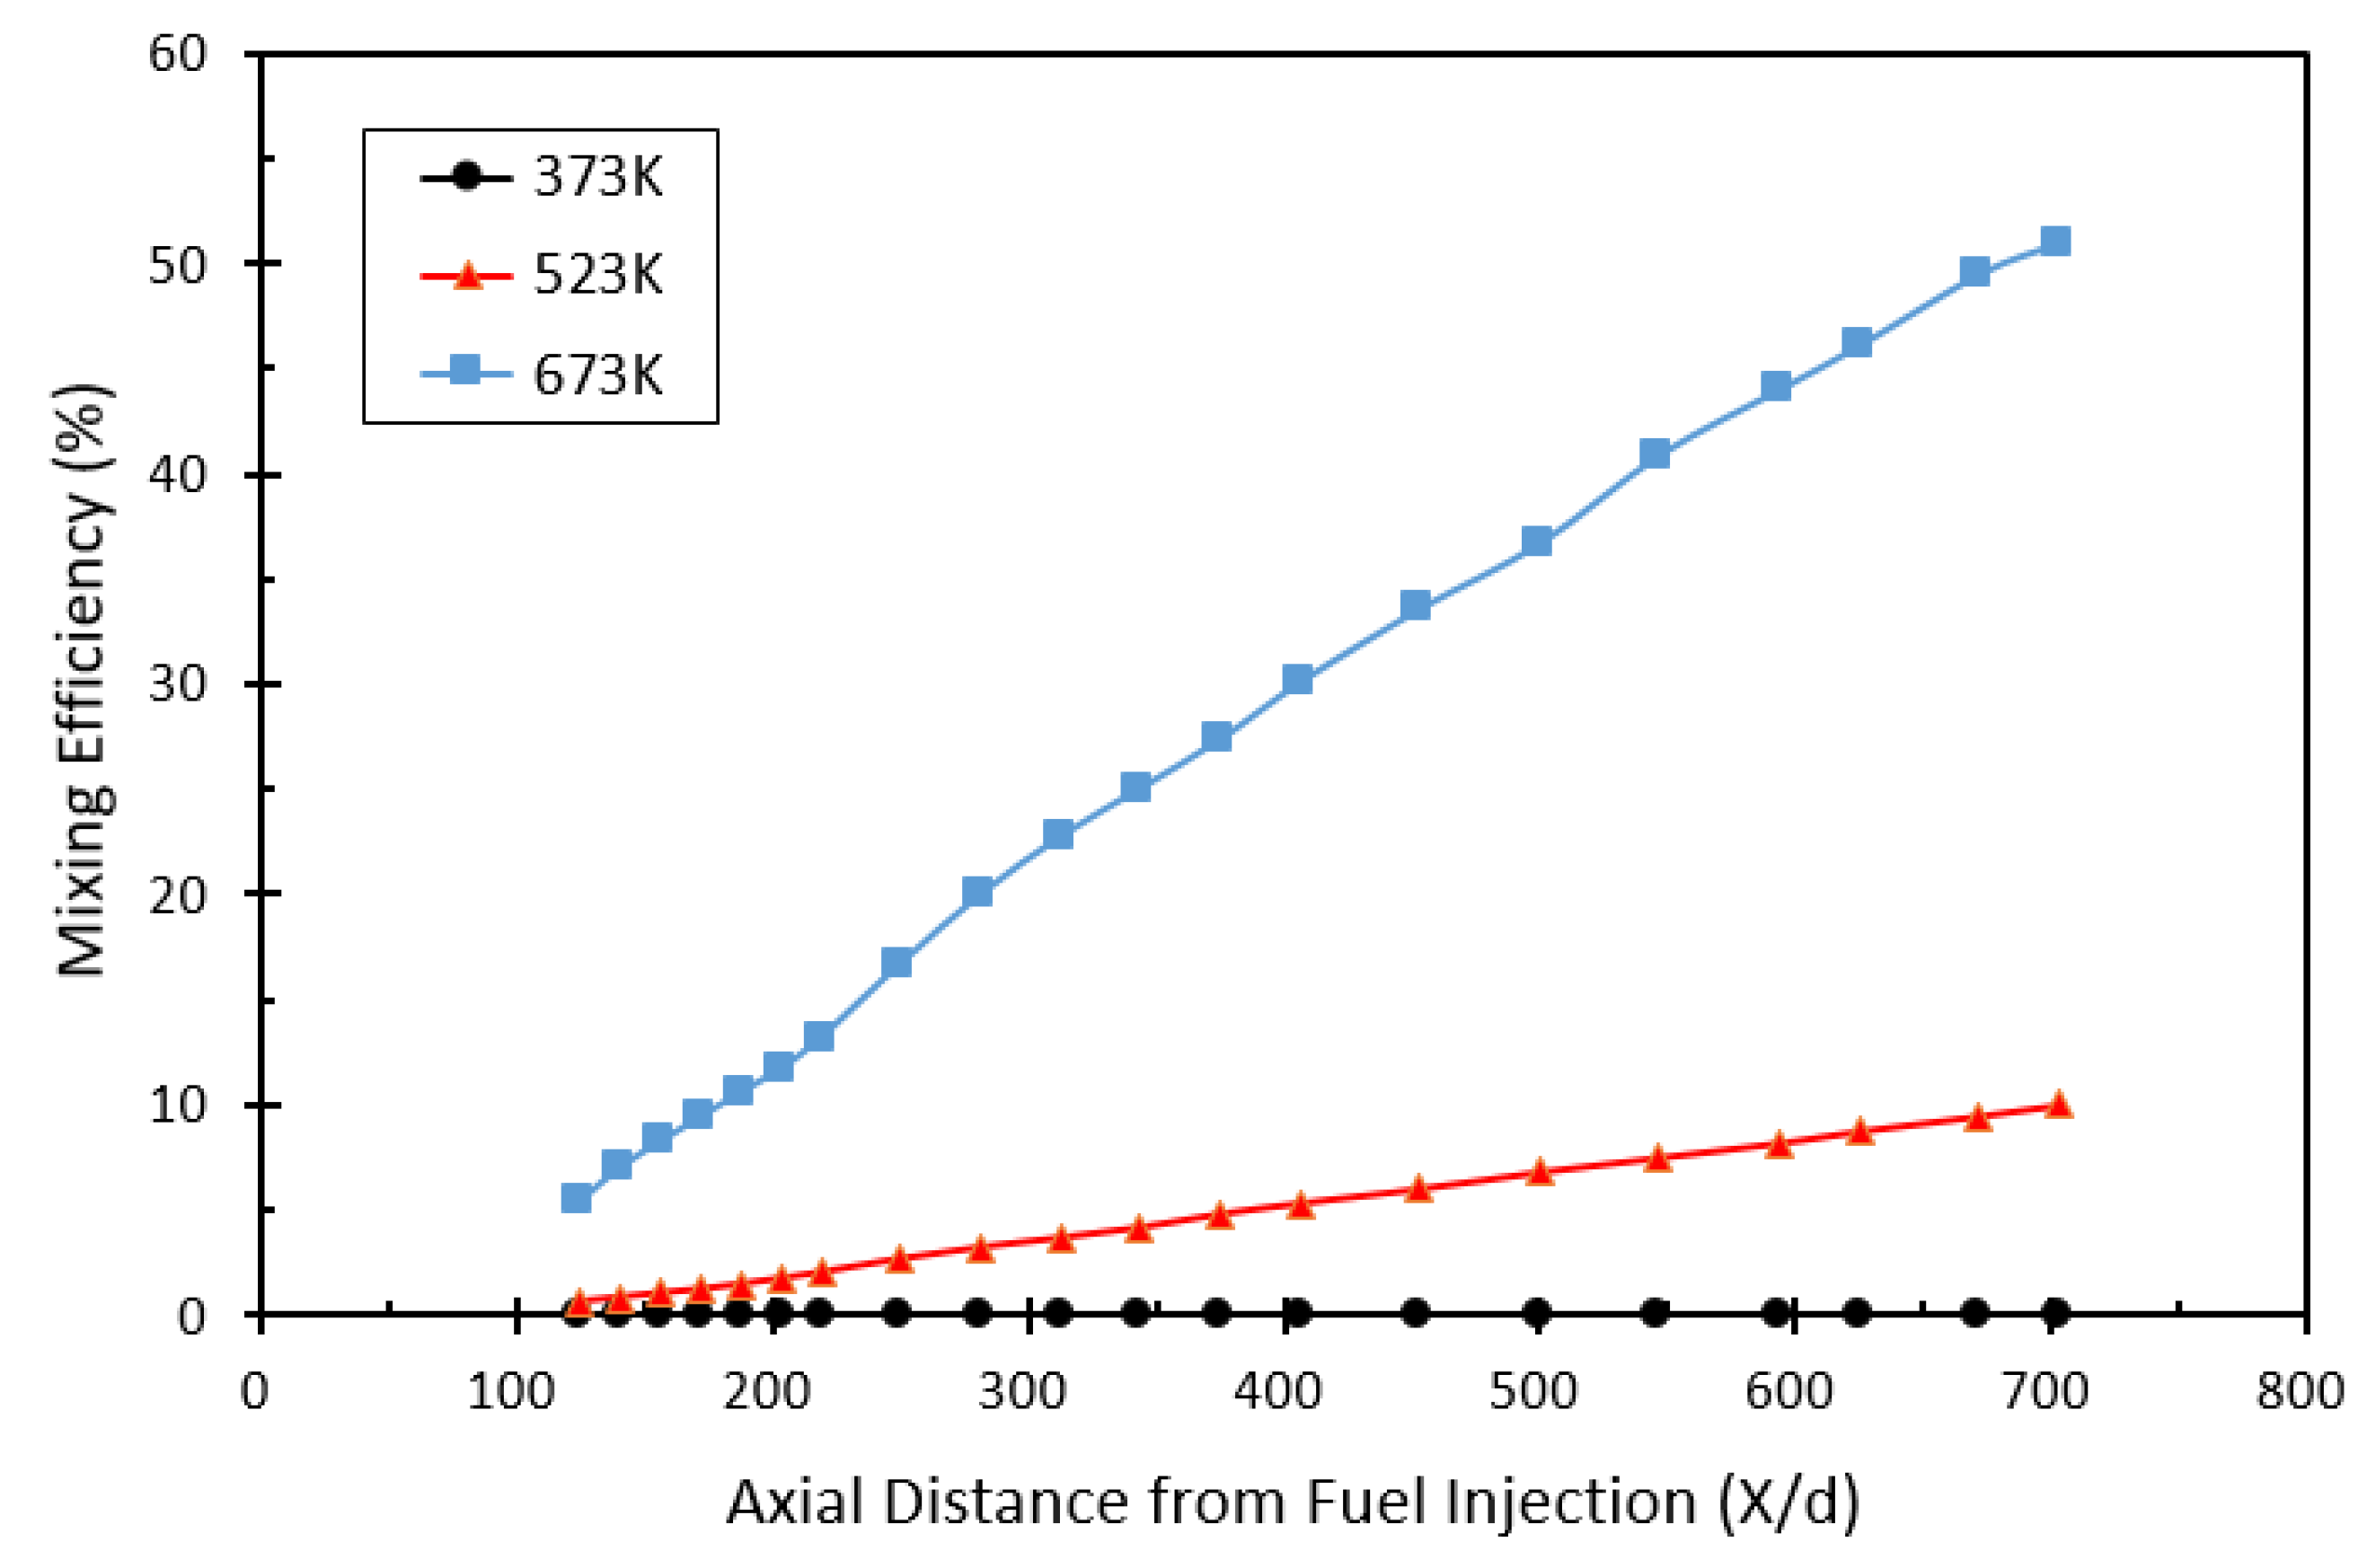
Figure 10 shows the comparison of the mixing efficiencies downstream of the pylon for three different air temperatures. When the temperature was 373 K, the mixing efficiency was zero because there was no vaporized fuel as shown in Figure 9a. However, as the air temperature increased, the mixing efficiency increased linearly downstream of the pylon. At an air temperature of 523 K, the mixing efficiency was 10% at the combustor outlet (X/d = 703), and at a higher air temperature of 673 K, the mixing efficiency reached 51% at the combustor outlet. Therefore, it can be confirmed that the air temperature has a significant effect on the mixing efficiency.

3.3. Total Pressure Loss

The presence of the pylon for fuel injection inside the combustor causes flow disturbance, resulting in total pressure loss. Therefore, estimating the total pressure loss is important for fuel/air mixture studies. The total pressure loss ( Λ ) is calculated as the difference between the mass-weighted averages of the total pressures at the inlet and outlet of the combustor [29].
Λ = 1 P ¯ T o u t P ¯ T i n
P ¯ T o u t =   P T o u t   ρ u d A   ρ u d A
where P ¯ T o u t is the mass-weighted average of the total pressures at the outlet of the combustor.
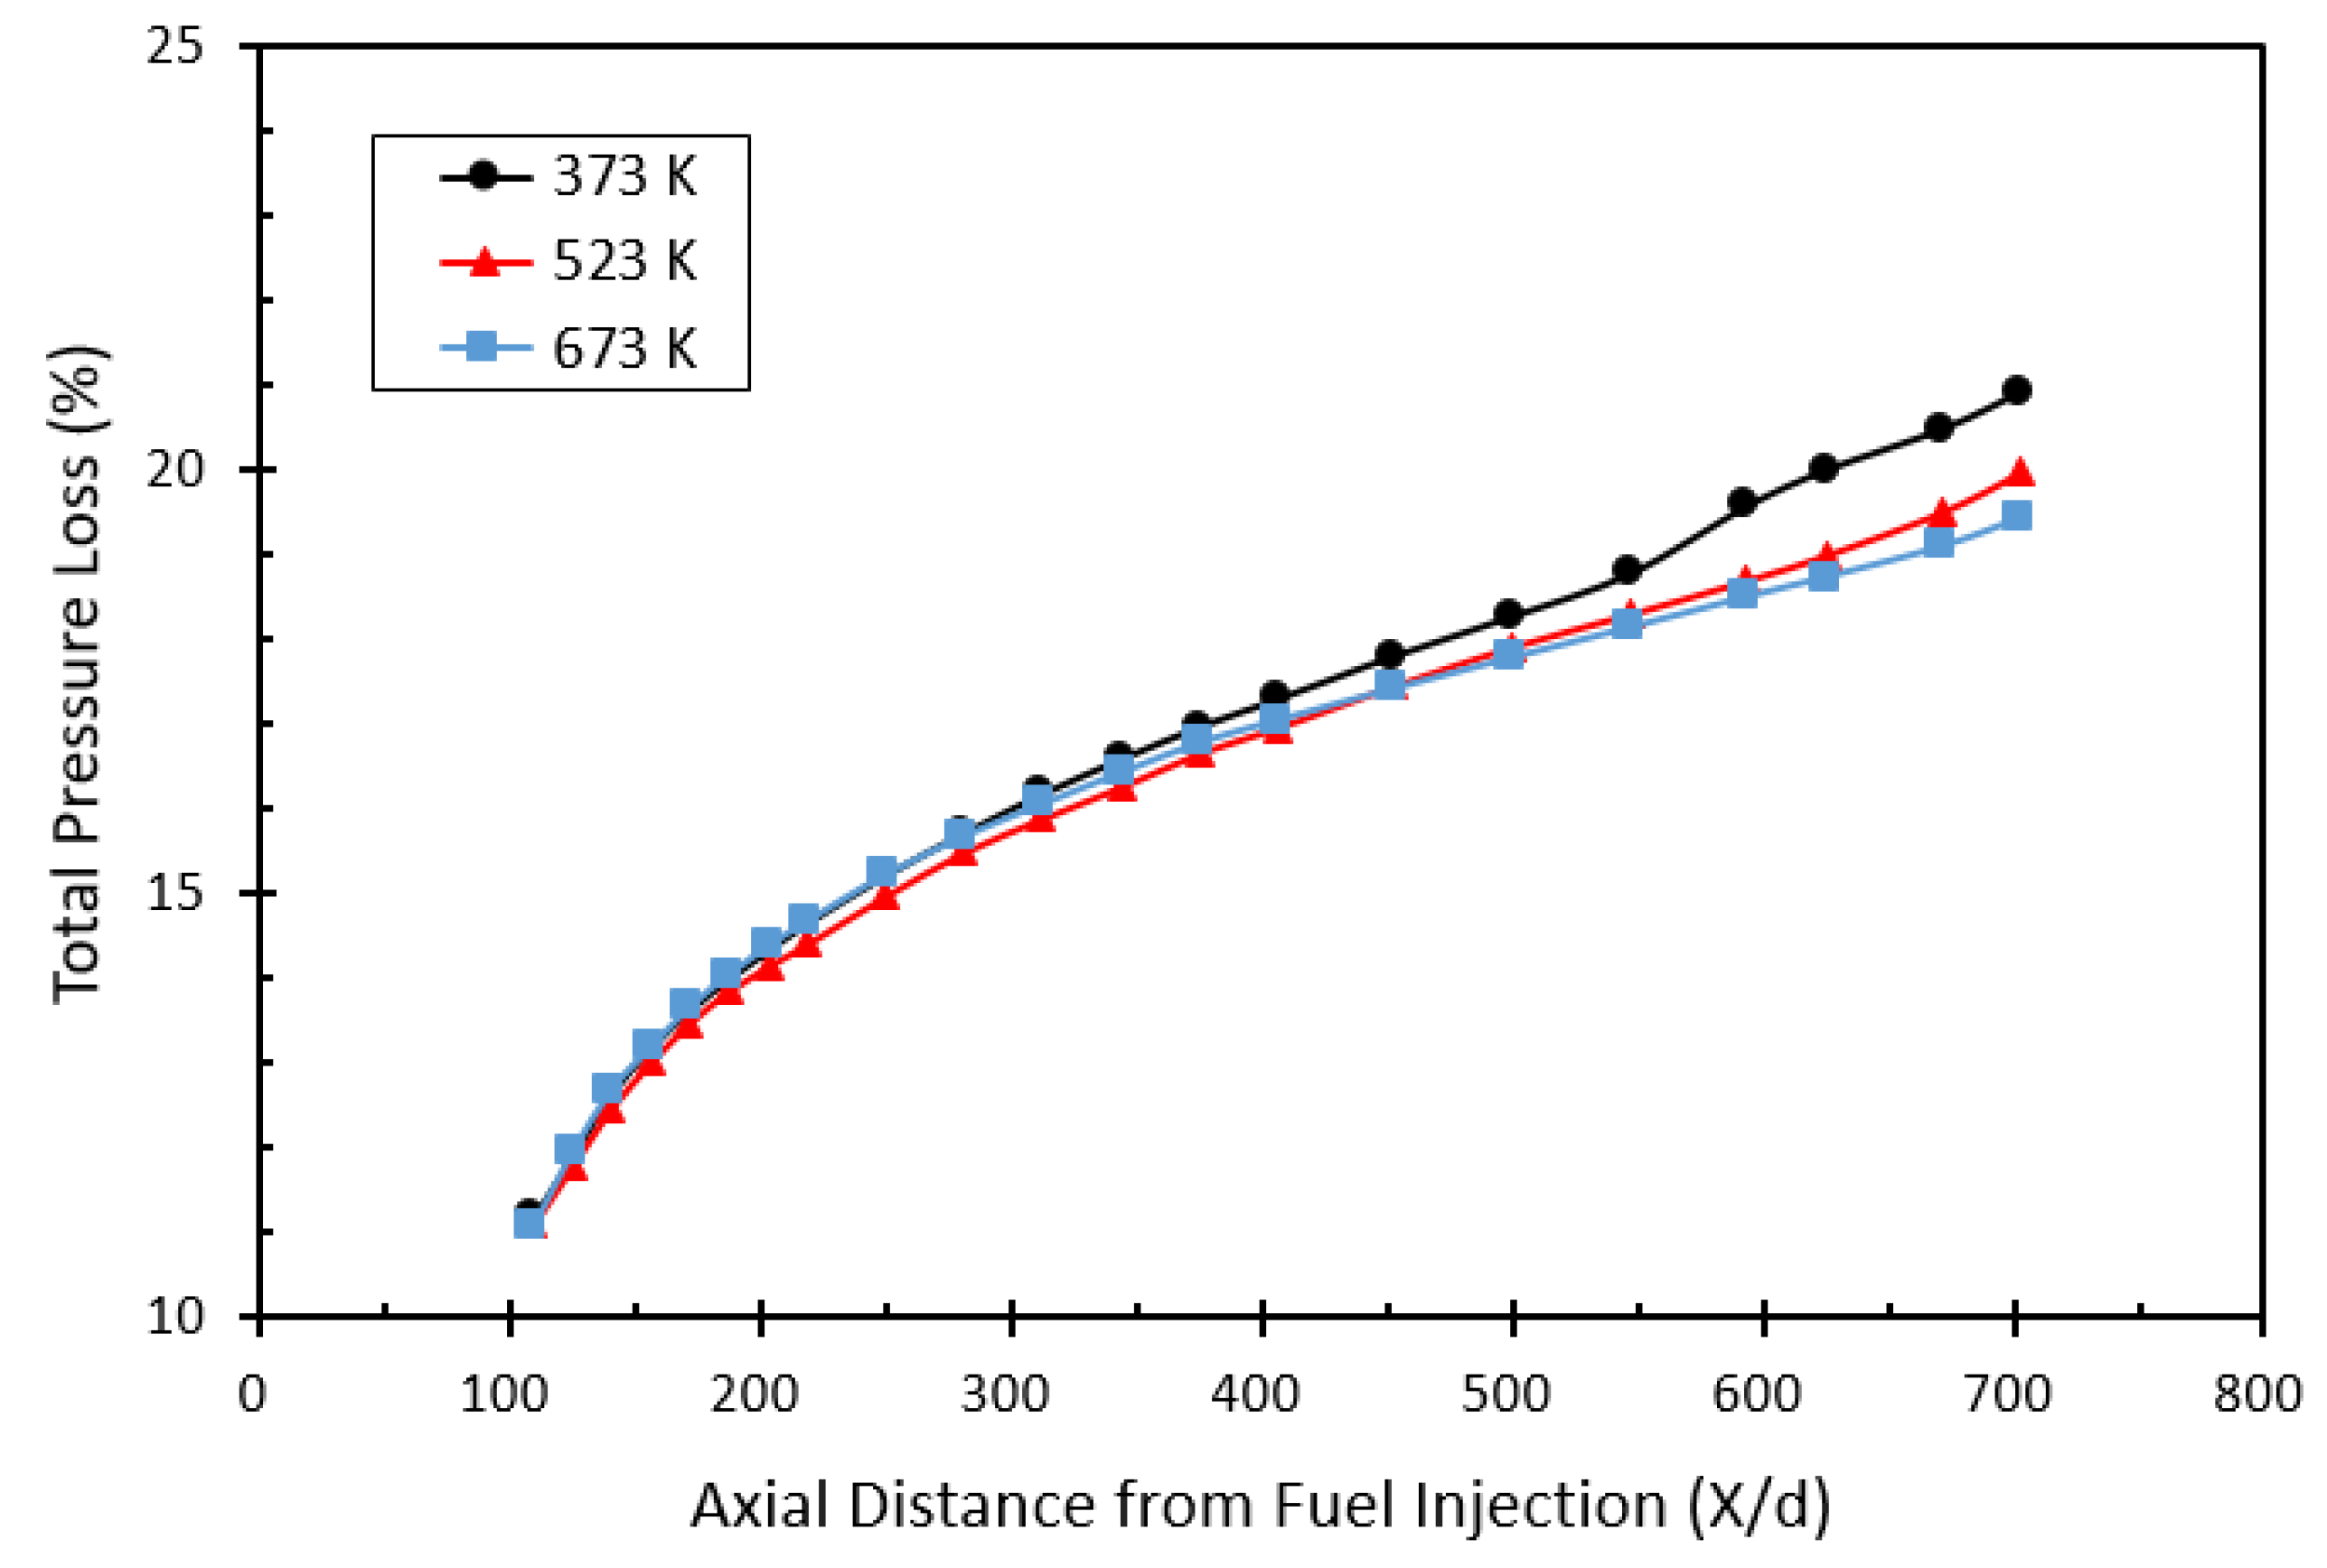
Figure 11 shows the comparison of the total pressure losses downstream of the pylon for three different air temperatures. The total pressure loss decreased with increasing air temperature. It also decreased further downstream of the pylon, and the total pressure loss at the combustor outlet (X/d = 703) was 20.90%, 19.95%, and 19.42% at air temperatures of 373 K, 523 K, and 673 K, respectively. It seems that the lower the air temperature, the larger and more fuel droplets exist in the flow field, resulting in a relatively high resistance to flow and thus a greater total pressure loss.

4. Conclusions

A two-phase flow simulation including the breakup and evaporation of fuel droplets was performed to investigate the effect of air temperature on the mixing characteristics of liquid hydrocarbon fuel in supersonic airflows. The supersonic air of Mach 1.8 preheated to three different temperatures of 373, 523, and 673 K was supplied to the combustor inlet. The fuel was injected into the supersonic airstream by means of an alternating-wedge pylon and the fuel-to-air momentum flux ratio was kept constant at 15. For the turbulence model required to solve the RANS equations, the SST k-ω model was used. The Eulerian–Lagrangian model was used to track the droplets in the air flow, and the KH-RT model to simulate the droplet breakup process. The numerical solution was validated through comparison with the experimental data. The main conclusions are summarized as follows:
(1)
The higher the air temperature, the stronger the magnitude of the streamwise vortices downstream of the pylon. The streamwise vortices adjacent to the pylon became stronger as it moved away from the pylon, but after X/d = 140.6, the influence of the alternating-wedge of the pylon decreased and the streamwise vortices gradually weakened toward the downstream of the pylon.
(2)
When the air temperature was 373 K, the liquid fuel hardly evaporated, but as the air temperature was higher than the fuel boiling point (460 K), the mixing efficiency increased linearly downstream of the pylon. At air temperatures of 523 K and 673 K, the mixing efficiencies were 10% and 51% at the combustor outlet (X/d = 703), respectively.
(3)
The total pressure loss decreased slightly as the temperature increased from 373 K to 673 K, and the decrease was larger toward the downstream of the pylon. The total pressure loss at the combustor outlet was 20.9% at air temperature of 373 K and 19.4% at 673 K. This appears to be caused by the presence of smaller and fewer fuel droplets as the temperature increases.

Author Contributions

Conceptualization, B.-J.H. and S.M.; methodology, B.-J.H.; software, B.-J.H.; validation, B.-J.H.; formal analysis, B.-J.H.; investigation, B.-J.H.; data curation, B.-J.H.; writing—original draft preparation, B.-J.H. writing—review and editing, S.M. All authors have read and agreed to the published version of the manuscript.

Funding

This research received no external funding.

Data Availability Statement

The data presented in this study are available on request from the corresponding author.

Conflicts of Interest

The authors declare no conflict of interest.

References

  1. Curran, E.T. Scramjet engines: The first forty years. J. Propuls. Power 2001, 17, 1138–1148. [Google Scholar] [CrossRef]
  2. Li, Z.; Gu, H. Investigation for effects of jet scale on flame stabilization in scramjet combustor. Energies 2022, 15, 3790. [Google Scholar] [CrossRef]
  3. Fry, R.S. A century of ramjet propulsion technology evolution. J. Propuls. Power 2004, 20, 27–58. [Google Scholar] [CrossRef]
  4. Jeong, S.-M.; Choi, J.-Y. Combined diagnostic analysis of dynamic combustion characteristics in a scramjet engine. Energies 2020, 13, 4029. [Google Scholar] [CrossRef]
  5. Relangi, N.; Ingenito, A.; Jeyakumar, S. The implication of injection locations in an axisymmetric cavity-based scramjet combustor. Energies 2021, 14, 2626. [Google Scholar] [CrossRef]
  6. Li, F.; Sun, M.; Cai, Z.; Chen, Y.; Sun, Y.; Li, F.; Zhu, J. Effects of additional cavity floor injection on the ignition and combustion processes in a Mach 2 supersonic flow. Energies 2020, 13, 4801. [Google Scholar] [CrossRef]
  7. Choubey, G.; Devarajan, Y.; Huang, W.; Mehar, K.; Tiwari, M.; Pandey, K.M. Recent advances in cavity-based scramjet engine- a brief review. Int. J. Hydrog. Energy 2019, 44, 13895–13909. [Google Scholar] [CrossRef]
  8. Kim, C.-H.; Jeung, I.-S. Forced combustion characteristics related to different injection locations in unheated supersonic flow. Energies 2019, 12, 1746. [Google Scholar] [CrossRef] [Green Version]
  9. Jeong, E.; O’Byrne, S.; Jeung, I.-S.; Houwing, A.F.P. The effect of fuel injection location on supersonic hydrogen combustion in a cavity-based model scramjet combustor. Energies 2020, 13, 193. [Google Scholar] [CrossRef] [Green Version]
  10. Athithan, A.A.; Jeyakumar, S.; Sczygiol, N.; Urbanski, M.; Hariharasudan, A. The combustion characteristics of double ramps in a strut-based scramjet combustor. Energies 2021, 14, 831. [Google Scholar] [CrossRef]
  11. Lewis, M.J. Significance of fuel selection for hypersonic vehicle range. J. Propuls. Power 2001, 17, 1214–1221. [Google Scholar] [CrossRef]
  12. Denman, Z.J.; Wheatley, V.; Smart, M.K.; Veeraragavan, A. Fuel injection and mixing in a Mach 8 hydrocarbon-fuelled scramjet. In Proceedings of the 20th Australasian Fluid Mechanics Conference (AFMC 2016), Perth, Australia, 5–8 December 2016. [Google Scholar]
  13. Zhang, J.; Chang, J.; Shi, W.; Hou, W.; Bao, W. Combustion stabilizations in a liquid kerosene fueled supersonic combustor equipped with an integrated pilot strut. Aerosp. Sci. Technol. 2018, 77, 83–91. [Google Scholar] [CrossRef]
  14. Powell, O.A.; Edwards, J.T.; Norris, R.B.; Numbers, K.E.; Pearce, J.A. Development of hydrocarbon-fueled scramjet engines: The hypersonic technology (HyTech) program. J. Propuls. Power 2001, 17, 1170–1176. [Google Scholar] [CrossRef]
  15. Hunt, J.L.; Rausch, V.L. Airbreathing hypersonic systems focus at NASA Langley research center. In Proceedings of the 8th AIAA International Space Planes and Hypersonic Systems and Technologies Conference, Norfolk, VA, USA, 27–30 April 1998. AIAA Paper 98-1641. [Google Scholar]
  16. Papamoschou, D.; Roshko, A. The compressible turbulent shear layer: An experimental study. J. Fluid Mech. 1988, 197, 453–477. [Google Scholar] [CrossRef] [Green Version]
  17. Ren, Z.; Wang, B.; Xiang, G.; Zhao, D.; Zheng, L. Supersonic spray combustion subject to scramjets: Progress and challenges. Prog. Aerosp. Sci. 2019, 105, 40–59. [Google Scholar] [CrossRef]
  18. Hartfield, R.J.; Hollo, S.D.; McDaniel, J.C. Experimental investigation of a supersonic swept ramp injector using laser-induced iodine fluorescence. J. Propuls. Power 1994, 10, 129–135. [Google Scholar] [CrossRef]
  19. Rogers, R.C.; Capriotti, D.P.; Guy, R.W. Experimental supersonic combustion research at NASA Langley. In Proceedings of the 20th AIAA Advanced Measurement and Ground Testing Technology Conference, Albuquerque, NM, USA, 15–18 June 1998. AIAA Paper 98-2506. [Google Scholar]
  20. Gruenig, C.; Avrashkov, V.; Mayinger, F. Fuel injection into a supersonic airflow by means of pylons. J. Propuls. Power 2000, 16, 29–34. [Google Scholar] [CrossRef]
  21. Bogdanoff, D.W. Advanced injection and mixing techniques for scramjet combustors. J. Propuls. Power 1994, 10, 183–190. [Google Scholar] [CrossRef]
  22. Sunami, T.; Magre, P.; Bresson, A.; Grisch, F.; Orain, M.; Kodera, M. Experimental study of strut injectors in a supersonic combustor using OH-PLIF. In Proceedings of the AIAA/CIRA 13th International Space Planes and Hypersonics Systems and Technologies Conference, Capua, Italy, 16–20 May 2005. AIAA Paper 2005-3304. [Google Scholar]
  23. Vergine, F.; Ground, C.; Maddalena, L. Strut injectors for scramjets: Total pressure losses in two streamwise vortex interactions. J. Propuls. Power 2017, 33, 1140–1150. [Google Scholar] [CrossRef]
  24. Hwang, B.-J.; Min, S. Research progress on mixing enhancement using streamwise vortices in supersonic flows. Acta Astronaut. 2022, 200, 11–32. [Google Scholar] [CrossRef]
  25. Seiner, J.M.; Dash, S.M.; Kenzakowski, D.C. Historical survey of enhanced mixing in scramjet engines. J. Propuls. Power 2001, 17, 1273–1286. [Google Scholar] [CrossRef]
  26. Huang, W.; Du, Z.-B.; Yan, L.; Xia, Z.-X. Supersonic mixing in airbreathing propulsion systems for hypersonic flights. Prog. Aerosp. Sci. 2019, 109, 100545. [Google Scholar] [CrossRef]
  27. Curran, E.T.; Heiser, W.H.; Pratt, D.T. Fluid phenomena in scramjet combustion systems. Annu. Rev. Fluid Mech. 1996, 28, 323–360. [Google Scholar] [CrossRef]
  28. Doster, J.C.; King, P.I.; Gruber, M.R.; Maple, R.C. Pylon fuel injector design for a scramjet combustor. In Proceedings of the 43rd AIAA/ASME/SAE/ASEE Joint Propulsion Conference and Exhibit, Cincinnati, OH, USA, 8–11 July 2007. AIAA Paper 2007-5404. [Google Scholar]
  29. Doster, J.C.; King, P.I.; Gruber, M.R.; Carter, C.D.; Ryan, M.D.; Hsu, K.-Y. In-stream hypermixer fueling pylons in supersonic flow. J. Propuls. Power 2009, 25, 885–901. [Google Scholar] [CrossRef]
  30. Manna, P.; Behera, R.; Chakraborty, D. Liquid-fueled strut-based scramjet combustor design: A computational fluid dynamics approach. J. Propuls. Power 2008, 24, 274–281. [Google Scholar] [CrossRef]
  31. Kumaran, K.; Behera, P.R.; Babu, V. Numerical investigation of the supersonic combustion of kerosene in a strut-based combustor. J. Propuls. Power 2010, 26, 1084–1091. [Google Scholar] [CrossRef]
  32. Dharavath, M.; Manna, P.; Sinha, P.K.; Chakraborty, D. Numerical Analysis of a Kerosene-Fueled Scramjet Combustor. ASME J. Therm. Sci. Eng. Appl. 2016, 8, 011003. [Google Scholar] [CrossRef]
  33. Hwang, B.-J.; Choi, H.; Min, S. An experimental study on penetration and mixing characteristics of liquid fuel in preheated supersonic airflows. Acta Astronaut. 2023, 202, 511–521. [Google Scholar] [CrossRef]
  34. Hiejima, T. Theoretical analysis of streamwise vortex circulation induced by a strut injector. Phys. Rev. Fluids 2016, 1, 054501. [Google Scholar] [CrossRef]
  35. Bruno, T.J.; Huber, M.L.; Laesecke, A.; Lemmon, E.W.; Perkins, R.A. Thermochemical and Thermophysical Properties of JP-10 (NISTIR 6640); National Institute of Standards and Technology: Gaithersburg, MD, USA, 2006; pp. 14–25. [Google Scholar]
  36. Hwang, B.-J.; Kang, S.; Lee, H.J.; Min, S. Measurement of laminar burning velocity of high performance alternative aviation fuels. Fuel 2020, 261, 116466. [Google Scholar] [CrossRef]
  37. No, S.-Y. A review on empirical correlations for jet/spray trajectory of liquid jet in uniform cross flow. Int. J. Spr. Combust. Dyn. 2015, 7, 283–314. [Google Scholar] [CrossRef] [Green Version]
  38. Menter, F.R. Two-equation eddy-viscosity turbulence models for engineering applications. AIAA J. 1994, 32, 1598–1605. [Google Scholar] [CrossRef] [Green Version]
  39. Li, L.-Q.; Huang, W.; Fang, M.; Shi, Y.-L.; Li, Z.-H.; Peng, A.-P. Investigation on three mixing enhancement strategies in transverse gaseous injection flow fields: A numerical study. Int. J. Heat Mass Transf. 2019, 132, 484–497. [Google Scholar] [CrossRef]
  40. ANSYS. ANSYS Fluent Theory Guide; ANSYS Inc.: Canonsburg, PA, USA, 2013; pp. 2–600. [Google Scholar]
  41. Liu, A.B.; Mather, D.; Reitz, R.D. Modeling the effects of drop drag and breakup on fuel sprays. In Proceedings of the 1993 SAE International Congress and Exposition, Detroit, MI, USA, 1–5 March 1993. SAE Technical Paper 930072. [Google Scholar]
  42. Beale, J.C.; Reitz, R.D. Modeling spray atomization with the Kelvin-Helmholtz/Rayleigh-Taylor hybrid model. At. Sprays 1999, 9, 623–650. [Google Scholar] [CrossRef]
  43. Li, X.; Soteriou, M.C. Detailed numerical simulation of liquid jet atomization in crossflow of increasing density. Int. J. Multiph. Flow 2018, 104, 214–232. [Google Scholar] [CrossRef]
  44. Barth, T.J.; Jespersen, D.C. The design and application of upwind schemes on unstructured meshes. In Proceedings of the 27th Aerospace Sciences Meeting, Reno, NV, USA, 9–12 January 1989. AIAA Paper 89-0366. [Google Scholar]
  45. Rausch, R.D.; Batina, J.T.; Yang, H.T.Y. Spatial adaptation of unstructured meshes for unsteady aerodynamic flow computations. AIAA J. 1992, 30, 1243–1251. [Google Scholar] [CrossRef]
  46. Liou, M.-S.; Steffen, C.J. A new flux splitting scheme. J. Comput. Phys. 1993, 107, 23–39. [Google Scholar] [CrossRef] [Green Version]
  47. ANSYS. ANSYS Fluent Users Guide; ANSYS Inc.: Canonsburg, PA, USA, 2013; pp. 289–292. [Google Scholar]
  48. Hinze, J.O. Turbulence, 2nd ed.; McGraw-Hill Book Co.: New York, NY, USA, 1975; pp. 1–82. [Google Scholar]
  49. Chen, X.-Q.; Pereira, J.C.F. Computational modeling of a dilute turbulent liquid-solid flow using a Eulerian-Lagrangian approach. Int. J. Numer. Methods Heat Fluid Flow 2000, 10, 409–432. [Google Scholar] [CrossRef]
  50. O’Rourke, P.J.; Amsden, A.A. The TAB method for numerical calculation of spray droplet breakup. In Proceedings of the 1987 SAE International Fuels and Lubricants Meeting and Exposition, Toronto, ON, Canada, 2–5 November 1987. SAE Technical Paper 872089. [Google Scholar]
  51. Cash, J.R.; Karp, A.H. A variable order Runge-Kutta method for initial value problems with rapidly varying right-hand sides. ACM Trans. Math. Softw. 1990, 16, 201–222. [Google Scholar] [CrossRef]
  52. Rasheed, M.; Mohammed, O.Y.; Shihab, S.; Al-Adili, A. A comparative analysis of PV cell mathematical model. J. Phys. Conf. Ser. 2021, 1795, 012042. [Google Scholar] [CrossRef]
  53. Almanzalawy, M.S.; Rabie, L.H.; Mansour, M.H. Modeling of an efficient airblast atomizer for liquid jet into a supersonic crossflow. Acta Astronaut. 2020, 177, 142–157. [Google Scholar] [CrossRef]
  54. Reitz, R.D. Modeling atomization processes in high-pressure vaporizing sprays. At. Spray Technol. 1987, 3, 309–337. [Google Scholar]
  55. Bhandarkar, A.; Manna, P.; Chakraborty, D. Assessment of droplet breakup models in high-speed cross-flow. At. Sprays 2017, 27, 61–79. [Google Scholar] [CrossRef]
  56. Levich, V.G. Physicochemical Hydrodynamics; Prentice-Hall: Hoboken, NJ, USA, 1962. [Google Scholar]
  57. Xin, J.; Ricart, L.; Reitz, R.D. Computer modeling of diesel spray atomization and combustion. Combust. Sci. Technol. 1998, 137, 171–194. [Google Scholar] [CrossRef]
  58. Li, P.; Wang, Z.; Sun, M.; Wang, H. Numerical simulation of the gas-liquid interaction of a liquid jet in supersonic crossflow. Acta Astronaut. 2017, 134, 333–344. [Google Scholar] [CrossRef]
  59. Fan, X.; Wang, J. A marker-based Eulerian-Lagrangian method for multiphase flow with supersonic combustion applications. Int. J. Mod. Phys. Conf. Ser. 2016, 42, 1660159. [Google Scholar] [CrossRef]
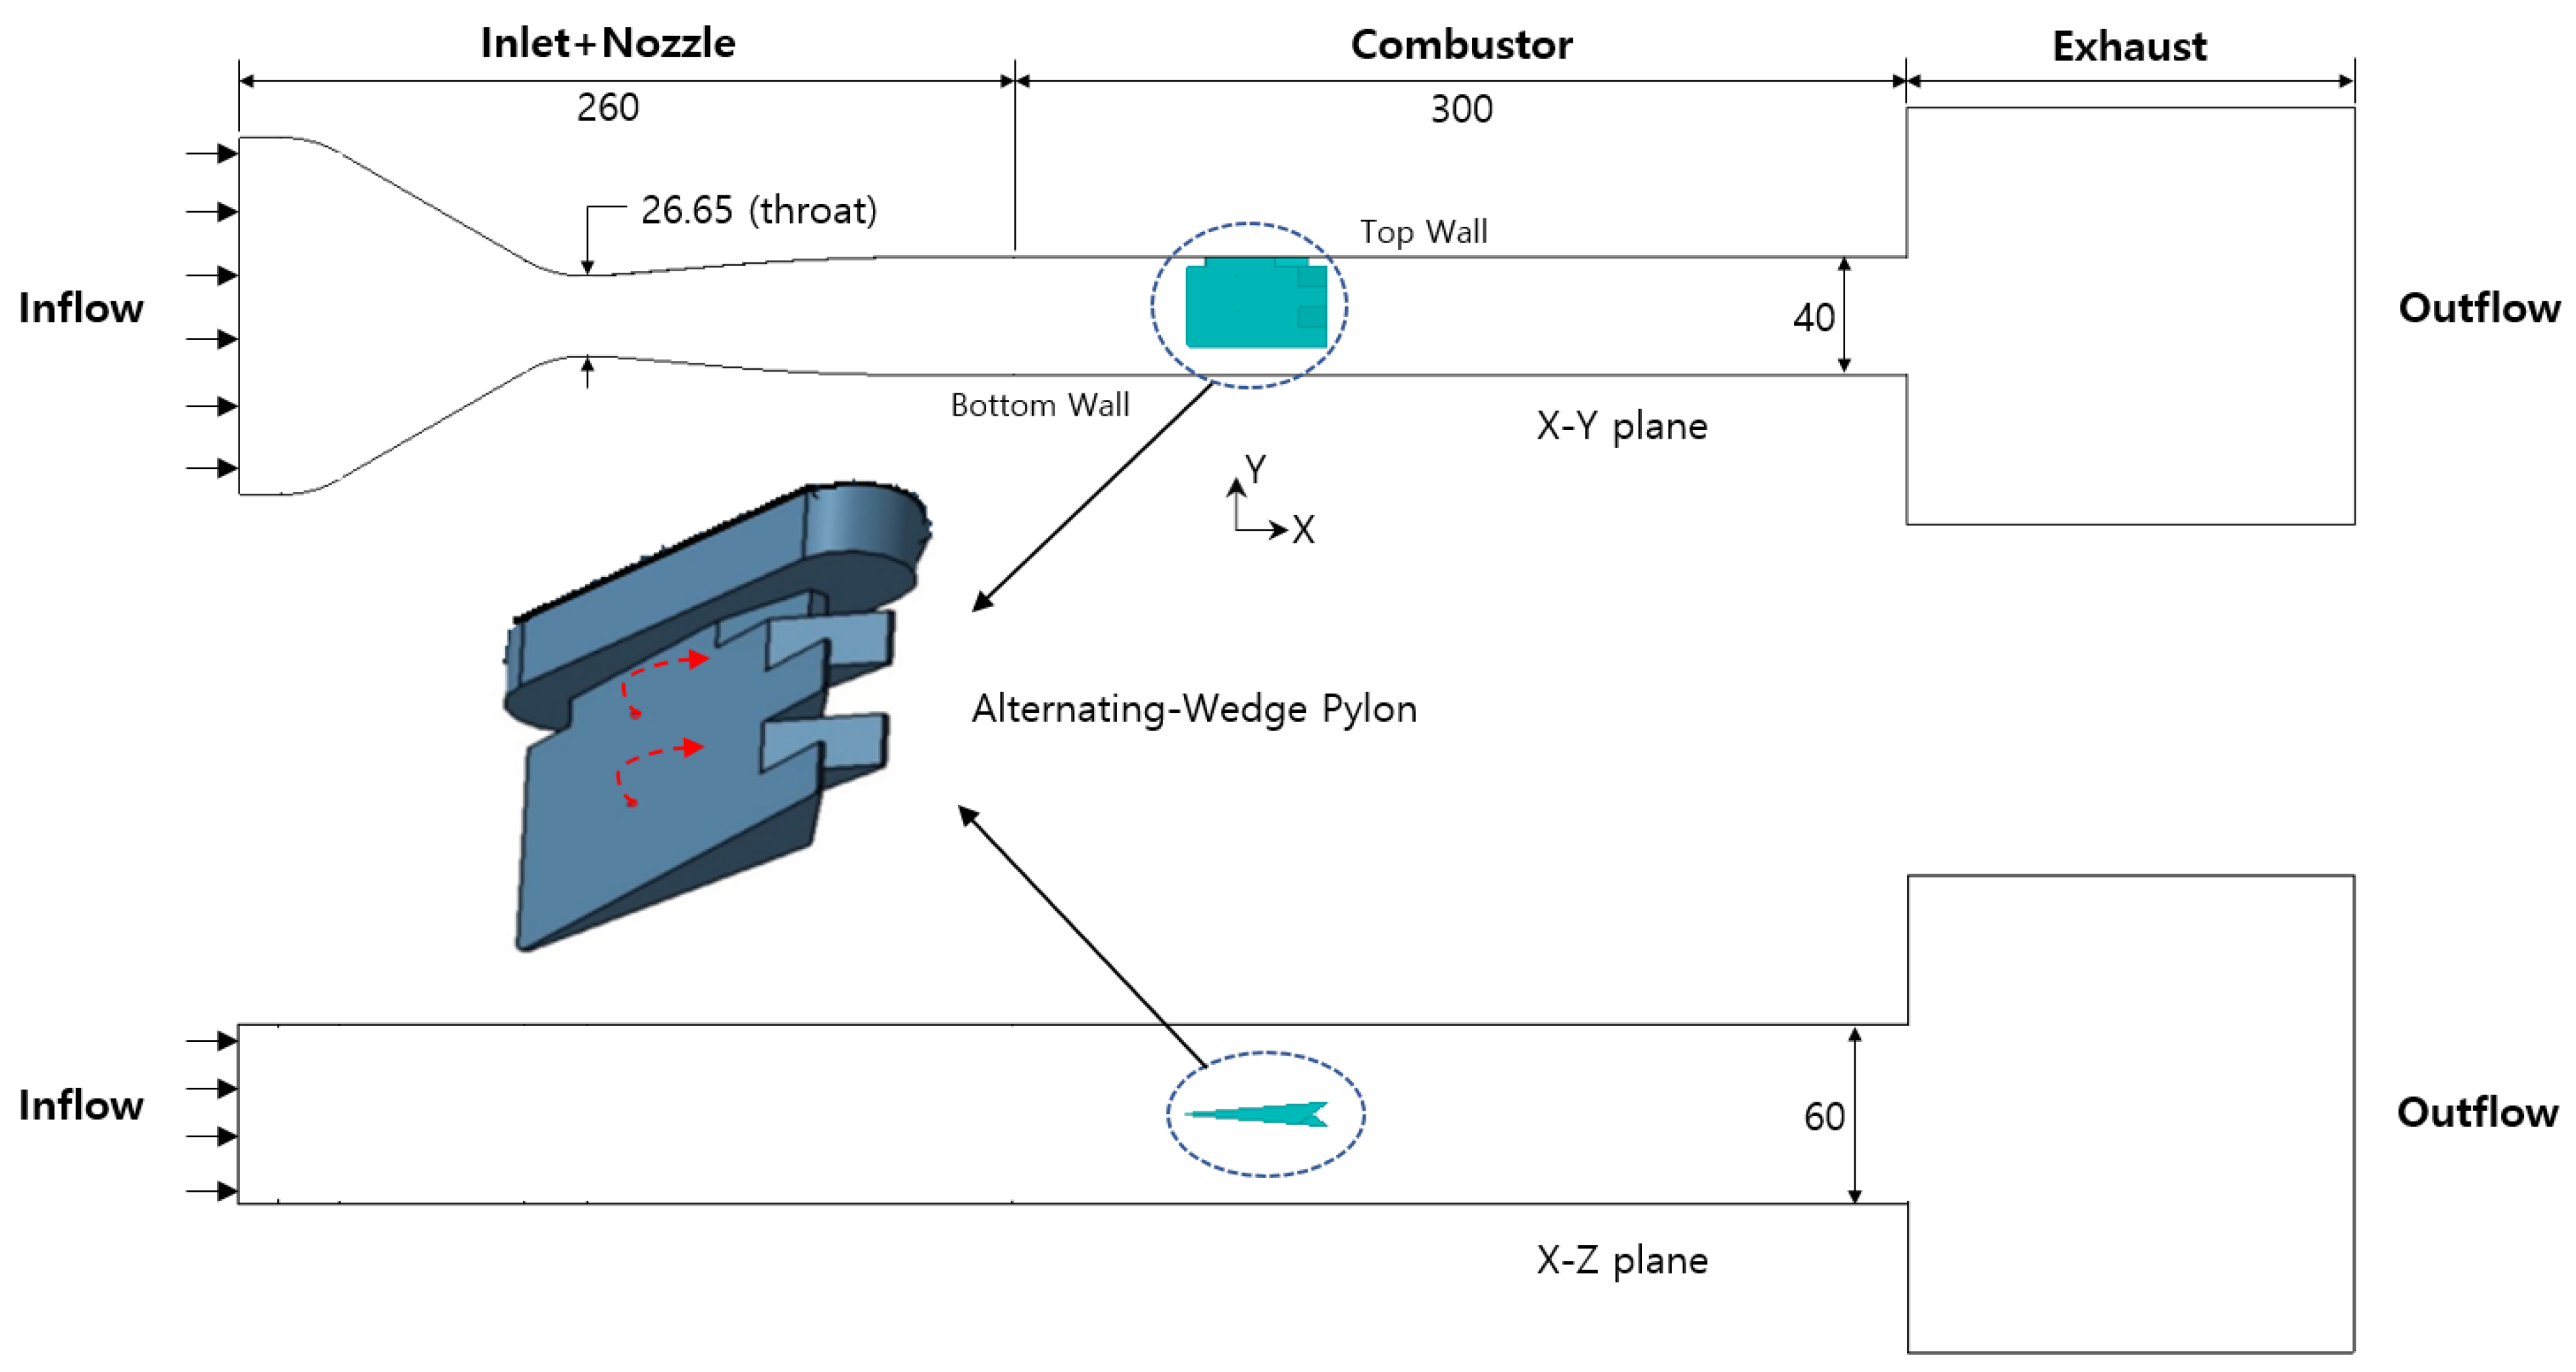
Figure 1. Schematic diagram of the computational domain including the alternating-wedge pylon (all units in mm).
Energies 16 00496 g001
Figure 2. Comparison of static pressures along the center of combustor top wall for three different grids with experimental data [33].
Energies 16 00496 g002
Figure 3. Static pressure, Mach number, and static temperature contours in the combustor X–Z plane.
Energies 16 00496 g003
Figure 4. Streamlines and velocity contours near the pylon for three different air temperatures: 373 K, 523 K, and 673 K.
Energies 16 00496 g004
Figure 5. Streamwise vortex contours at various locations downstream of the pylon for an air temperature of 373 K.
Energies 16 00496 g005
Figure 6. Streamwise vortex contours at various locations downstream of the pylon for an air temperature of 523 K.
Energies 16 00496 g006
Figure 7. Streamwise vortex contours at various locations downstream of the pylon for an air temperature of 673 K.
Energies 16 00496 g007
Figure 8. Comparison of streamwise vortex magnitudes downstream of the pylon for three different air temperatures.
Energies 16 00496 g008
Figure 9. Vaporized fuel mass fraction contours at various locations downstream of the pylon for three different air temperatures.
Energies 16 00496 g009
Figure 10. Comparison of mixing efficiencies downstream of the pylon for three different air temperatures.
Energies 16 00496 g010
Figure 11. Comparison of total pressure losses downstream of the pylon for three different air temperatures.
Energies 16 00496 g011
Disclaimer/Publisher’s Note: The statements, opinions and data contained in all publications are solely those of the individual author(s) and contributor(s) and not of MDPI and/or the editor(s). MDPI and/or the editor(s) disclaim responsibility for any injury to people or property resulting from any ideas, methods, instructions or products referred to in the content.