Abstract
Given the importance of renewable energy sources in distribution systems, this article addresses the problem of locating and determining the capacity of these sources, namely, wind turbines and solar panels. To solve this optimization problem, a new algorithm based on the behavior of salp is used. The objective functions include reducing losses, improving voltage profiles, and reducing the costs of renewable energy sources. In this method, the allocation of renewable resources is considered for different load models in distribution systems and different load levels using smart meters. Due to the fact that these objective functions are multi-objective, the fuzzy decision-making method is used to select the optimal solution from the set of Pareto solutions. The considered objective functions lead to loss reduction, voltage profile improvement, and RES cost reduction (A allocating RES resources optimally without resource limitations; B: allocating RES resources optimally with resource limitations). In addition, daily wind, solar radiation, and temperature data are taken into account. The proposed method is applied to the IEEE standard 33-bus system. The simulation results show the better performance of the multi-objective salp swarm algorithm (MSSA) at improving voltage profiles and reducing losses in distribution systems. Lastly, the optimal results of the MSSA algorithm are compared with the PSO and GA algorithms.
1. Introduction
Given the increasing electricity consumption, the economic and technical limitations in the construction of large power plants, issues related to environmental pollution, financial and energy crises, and the challenges involved in creating a competitive environment in power production and sales, production has only slightly increased in the power networks, as well as in a scattered manner [1]. Renewable energy sources (RES) such as solar and fuel cells, wind turbines, geothermal power plants, and biomass have low power production levels (less than 10 MW) and are installed at the lowest level of the network, i.e., near the end-users and in the electrical energy distribution system [2,3,4,5]. Usually, the fuel consumed by RES is either completely clean or entails very little pollution, much less than that of large power plants. One of the advantages of using RES, in addition to clean production, is that there will be no line losses, as power is produced at the point of consumption, and there is no power transmission over long distances [6]. Therefore, the presence of these sources in power distribution networks has greatly reduced losses and costs, entailing low investment, postponing high costs (building large power plants and transmission lines), and increasing system reliability [7,8]. In addition, due to the radial nature of distribution networks and the single-line output, many loads face blackouts; thus, the presence of RES in these grids also increases reliability and improves voltage profiles and stability by reducing losses [9,10,11,12]. However, the production of RES power is associated with uncertainty and depends on environmental conditions. It is clear that changing the production of these resources will compromise the network’s optimal operation [13,14,15]. Moreover, the incorrect selection of RES with regard to location and capacity may increase losses and increase voltage at some buses. Since the location and the production of these resources cannot be changed, research should seek to develop tools to bring the operating point of the network as close as possible to optimal conditions while obtaining the maximum power from the RES [16,17]. Modeling, applications, and evaluations of optimal sizing and placement of distributed generations, optimal sizing and placement of energy storage system in power grids, optimal sizing and location of charging stations, new methodology for optimal location and sizing of battery energy storage system in distribution networks for loss reduction, and multi-objective optimal allocation and performance evaluation for energy storage have been studied [18,19,20,21,22,23].
The optimal network restructure via improved whale optimization approach [24], optimal locations and sizing of capacitors in radial distribution systems using mine blast algorithm [25], and ant lion optimization algorithm for renewable distributed generations [26] were also studied.
Various methods have been presented in the literature for determining the optimal location and size of RES [27,28,29], as well as those of distributed generators (DGs). Most of these methods are based on metaheuristic algorithms such as PSO [30], HBMO [31], GA [32], and ICA [33].
It is known that most of the authorities have located and sized RES without considering wind and solar availability and their limitations. Furthermore, the type of load model and the percentage of load power consumption are not accurate. Load distribution networks involve commercial, industrial, and residential customers, and the amount of these subscribers varies throughout the day and the year, following a specific pattern for each type of consumer. Therefore, considering loads with constant values can yield inaccurate results regarding the problem of siting DGs and determining the capacity of RES. In some articles, the load is considered to be multilevel, which leads to conflicting and misleading results, taking into account that peak consumption for all types of consumers does not happen at the same time. In this regard, the use of smart meters and accurately measuring the consumption for different loads will result in more accurate results. Accordingly, this article examines the accurate allocation of RES while considering the load consumed by subscribers, separately and accurately on an hourly basis. The power generation characteristics of RES are also examined with regard to limitations such as those inherent to wind power. This, with the aim of reducing system losses and energy costs, as well as improving the voltage profile in a distribution network, data for 24 h regarding wind profiles, solar radiation, temperature, and load composition (industrial, commercial, and domestic users) are considered. RES allocation can be defined as an optimization problem. To solve it, the salp swarm method has been used. As for the effectiveness of the salp chain model and the multi-objective salp swarm algorithm (MSSA), as well as its advantages in solving optimization problems, the following remarks can be made:
- Undefeated solutions are stored in a reservoir; hence, they are never lost, even if the entire population is destroyed in one iteration.
- Neighboring solutions in congested areas are discarded each time the reservoir is maintained, which improves the coverage of nondominated solutions for all targets.
- A food source is selected from the nondominant solutions with the least number of neighboring solutions, which always leads the search toward the quieter regions of the Pareto optimal front and improves the coverage of the solutions obtained.
- The MSSA has the same operators as the SSA because it uses the same population distinction (leader and follower salps) and the position update process.
- The MSSA has only two control parameters (c1 and archive size).
- The MSSA is simple and easy to implement.
In theory, the above makes the MSSA potentially able to solve multi-objective optimization problems with unknown search spaces, as well as logically able to find exact Pareto optimal solutions with high accuracy. The adaptive mechanism of the MSSA allows it to avoid local solutions and finally achieve a correct estimate of the best solution obtained during the optimization process. In the proposed method, three objective functions are used: reducing losses, improving voltage profiles, and reducing the costs of RES. Due to the fact that these objective functions are multi-objective, the fuzzy decision-making method is employed to select the optimal solution from the set of Pareto solutions. The proposed method is applied to the IEEE 33-bus standard test system. The simulation results of two scenarios are examined, showing the efficiency and better performance of the MSSA algorithm in solving the multi-objective optimization problem and optimally allocating RES in distribution systems by considering the load model and resource limitations, such as RES installation costs and system power losses, while achieving improved voltage stability. The continuation of the paper is as follows: the formulation of the problem (wind turbine model, solar panel model, load model, and objective function constraints) is explained in Section 2. A brief introduction of the salp community optimization algorithm is given in Section 3. The studied system, the results, and the conclusions of the paper are given in Section 4, Section 5 and Section 6, respectively.
2. Formulation of the Problem
This problem is formulated in order to plan for the location and capacity of RES in distribution systems. To this effect, the objective functions must have the lowest possible value, and the constraints of the problem and the network must be observed. This section outlines the method for modeling wind turbines and solar panels regarding the objective functions and constraints considered in this study.
2.1. Wind Turbine Modeling
The power produced by wind turbines changes over time according to the wind speed (Figure 1).
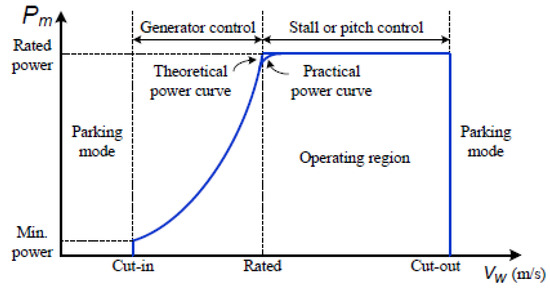
Figure 1.
Wind turbine performance in different areas.
The approximate relation of wind turbine output power is as follows [34,35]:
where is the low cutoff speed, is the high cutoff speed, is the rated wind speed, and is the output power.
2.2. Solar Panel (PV) Modeling
The output of a solar power plant can be calculated from its nominal output power under standard test conditions (STC), as well as according to light intensity and ambient temperature.
where , output of the solar power plant, STC means that the solar radiation is 1000 W/m2, solar radiation temperature is 25 °C, and AM atmospheric light quality is 1.5, the operating point radiation, k is the power temperature coefficient, PSTG is the output power under STC, and is the operating point temperature [36,37].
2.3. Load Modeling
Due to the fact that there are different kinds of loads in a distribution system, it is necessary to specify the type of load to be considered in load consumption modeling. In other words, at each substation, the type of load distribution is different (it may be industrial, domestic, or commercial), and the amount of power consumed is a function of the voltage range of that substation. Therefore, it is not accurate to consider the consumption power of the nodes. Taking this issue into consideration allows proper load distribution and an accurate calculation of system losses. To this effect, active and reactive load and power consumption models can be defined mathematically and according to Equations (3) and (4).
where denotes that the power consumption at the bus has a nominal voltage [38].
2.4. Objective Functions
The objective functions considered in this optimization problem are described below.
2.4.1. Reducing Losses
To calculate the total active losses in a distribution network with nodes, Equation (5) is used.
2.4.2. Improving the Voltage Profile
Due to the fact that the voltage in the radial system decreases at the starting point of the feeder due to voltage drops, in order to maintain the voltage of the distribution buses within the operating range, the improvement of the voltage profile is considered as an objective function, which is expressed in Equation (6) [39].
2.4.3. Cost Reduction
When it comes to RES, it is not possible to install the maximum capacity, as the costs involved are higher than those associated with power losses. Therefore, the costs of RES, which should be minimal, are considered as an objective function and divided into two parts:
- The initial installation cost
- The maintenance and operating costs
The costs related to the maintenance and operations of each RES unit are different and depend on the type of source. Therefore, these articles consider these costs separately, which are calculated via Equation (8) [40].
where represents the maintenance and operating costs of solar (PV) and wind (WT) units for 1 year. Therefore, the overall cost of RES, which is considered as the objective function, is expressed by Equation (9).
2.5. Constraints
Solving the RES optimization and planning problem has its limitations, which are presented below.
2.5.1. RES Capacity
The capacity of scattered production resources, as well as the level of RES penetration, should be limited to a certain value.
where , the penetration level of RES in the distribution network. Moreover, the selected capacity for each of the RES must be within standard values.
2.5.2. Setting the Permissible Voltage Range
The voltage of each of the buses should not be higher or lower than the allowed range. The maximum voltage value is up to 1.05 pu, and the minimum voltage is up to 0.9 pu.
2.5.3. Line Capacity Constraint
In order to limit the power transmission capacity of the lines, as well as the current passing through them, the line capacity should not exceed the specified limit.
2.5.4. Fuzzy Decision Making
The ultimate goal of a multi-objective optimization algorithm is to identify the solution in the Pareto optimal set. However, to prove the optimality of the solution, it is impossible to identify the entire Pareto optimal set, due to its large dimensions. Therefore, a practical approach to the multi-objective optimization problem is to examine the set of solutions in which the Pareto optimal set is possible. In this research, a fuzzy-based approach is applied to this effect.
3. Salp Swarm Algorithm
The SSA was presented in [41,42,43]. Salps belong to the family of Salpidae, which have a clear, tubular body. Their body texture is very similar to that of jelly fish, and they move much like them, with water being pumped through their bodies to provide forward thrust. The shape of a salp can be seen in Figure 2. The SSA is inspired by the social chain-like behavior of salps (Figure 3), as it entails better movement and involves fast, coordinated changes for chasing food.

Figure 2.
Single salp.

Figure 3.
Group of salps (salp chain).
3.1. Proposed Mathematical Model for the Salp Chain
To mathematically model a salp chain, the population is first divided into two groups: the leader and the followers. The leader is the salp at the front of the chain, and others are the followers. The leader steers the group, and the followers follow each other. Thus, they directly or indirectly follow the leader.
As in other collective methods, the position of the salps is defined in an n-dimensional search space, where n is the number of variables of a specific problem. Therefore, the position of all salps is stored in a two-dimensional matrix called . It is also assumed that there is a food source called in the search space, which acts as the target.
To update the position of the leader, the following equation is used:
where represents the first salp position (leader) in the dimension, is the food source location in the dimension, j represents the dimension upper limit, j represents the dimension lower limit, and and are random numbers.
Equation (13) shows that the leader only updates its position relative to the food source. The coefficient is the most important parameter in the SSA algorithm because it balances exploration and exploitation, defined as follows:
where the current iteration, and is is the total number of iterations. Parameters and are random numbers generated uniformly in the interval [0, 1]. They indicate whether the next position in the dimension should be toward positive infinity or negative infinity, and they also specify the step size.
To update the followers’ position, the following equation is used (Newton’s law of motion):
where , represents the position of the follower in the dimension, for a given time , an initial velocity , .
Since the time corresponds to the same iteration, the difference between iterations is equal to 1. Thus, by considering = 0, this equation can be rewritten as follows:
where indicates the position of the follower SALP in the dimension.
With Equations (14) and (16), the salp chains can be simulated. The pseudo code of the SSA is shown in Figure 4.
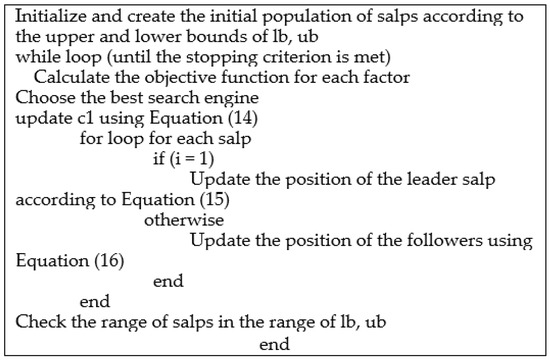
Figure 4.
Pseudo code of SSA.
3.2. Multi-Objective SALP Swarm Algorithm
The answer to a multi-objective problem is a set of answers called the Pareto optimal set. The SSA can move salps to the food source and update them as the iterations progress. However, this algorithm is not able to solve multi-objective problems due to the following reasons:
- The SSA stores only one answer as the best; hence, it cannot store multiple answers for a multi-objective problem.
- The SSA updates the food source with the best answer obtained so far in each iteration, but there is no single best answer for multi-objective problems.
The first problem can be solved by equipping the food source reservoir with the SSA. This reservoir stores the best nondominant answers obtained so far during the optimization process and is very similar to multi-objective particle swarm optimization (MOPSO) archives. This reservoir can store a limited number of non-overwhelming responses. During optimization, each salp is compared with all residents of the tank using Pareto dominant operators. If a salp is dominant over an answer in the pool, they are swapped. If a salp dominates a set of answers in the pool, they are all replaced with the salp. If at least one resident of the tank dominates a salp in the new population, it is immediately released. If a salp is not dominant compared to all the inhabitants of the reservoir, it is added to the archive. This ensures that the repository always stores undefeated answers. However, there is a special case in which the reservoir is completely filled and a salp is not dominant in comparison with the reservoir inhabitants. Of course, the easiest way is to randomly remove one of the answers from the archive and replace it with an undefeated salp. A more reasonable approach is to remove one of the similar undefeated answers in the pool. Because a comparative multi-objective algorithm must be able to find uniformly distributed Pareto optimal solutions, the best candidate to be removed from the archive is a candidate located in a densely populated area. This method improves the distribution of the residents during iterations. To find non-dominated responses with a densely populated neighborhood, the number of neighborhood responses with a certain maximum distance is counted and assumed. This distance is defined as , where max and min are two vectors for storing the maximum and minimum values of each target. Repository has one answer per best case section. After assigning a rank to each tank resident as a function of the number of neighborhood responses, a roulette wheel is used to select one of them. The higher the number of neighbor responses for an answer (i.e., the larger the rank number), the more likely it is to be removed from the pool.
4. System under Study
This article deals with the optimal placement and sizing of renewable resources (i.e., solar and wind power). In this context, the IEEE 33-bus standard system was used; the single-line diagram of this system is shown in Figure 5. Because the purpose of this article is to study and limit wind and solar resources, wind and solar radiation profiles, along with the temperature, are shown in Figure 6 and Figure 7. In addition, the load profile percentage according to the type of load is shown in Figure 8 and Figure 9. Moreover, the coefficients related to the load modeling methods are given in Table 1. In this article, this load profile percentage is taken from intelligent sampling systems in the network, unlike other studies, where these percentages are fixed. This entails an accurate study and a correct selection of RES resources in the distribution system. Moreover, Table 2 and Table 3 present information related to the installation costs of wind turbines and solar panels according to the network’s capacity. Information about the SSA optimization method is given in Table 4.
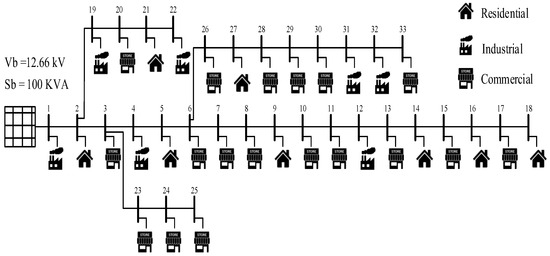
Figure 5.
Single-line diagram of the studied 33-bus system.
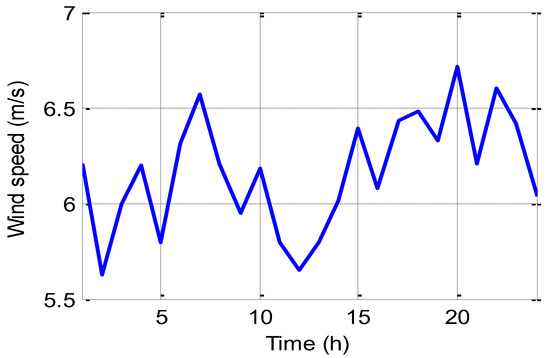
Figure 6.
The 24 h wind profile of the studied system.
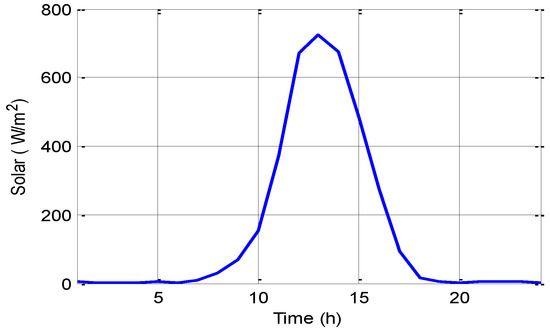
Figure 7.
The 24 h solar radiation profile of the case system.
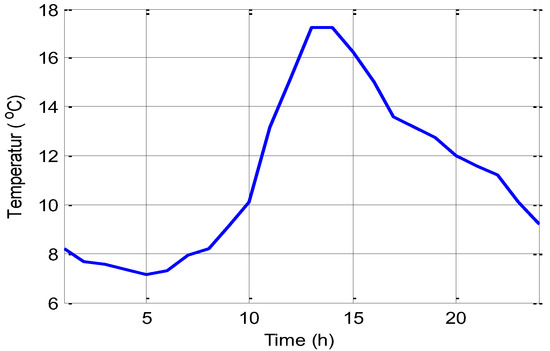
Figure 8.
The 24 h temperature profile of the studied system.
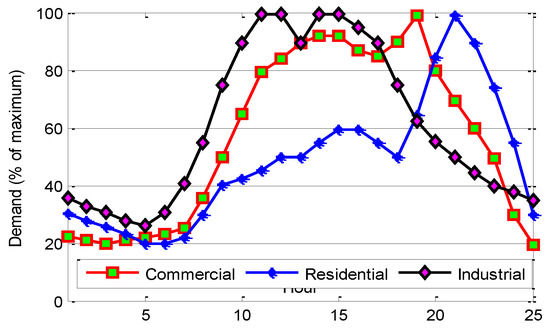
Figure 9.
The 24 h load percentage profile of the studied system.

Table 1.
Type of load and power values for modeling.

Table 2.
Wind turbine parameters.

Table 3.
Solar array parameters.

Table 4.
Information on the SSA.
5. Simulation Results
The simulation was conducted in MATLAB 2017. The general trend of the subject is shown in Figure 10. In this article, two scenarios were defined for simulating and optimizing the system under study, as follows:
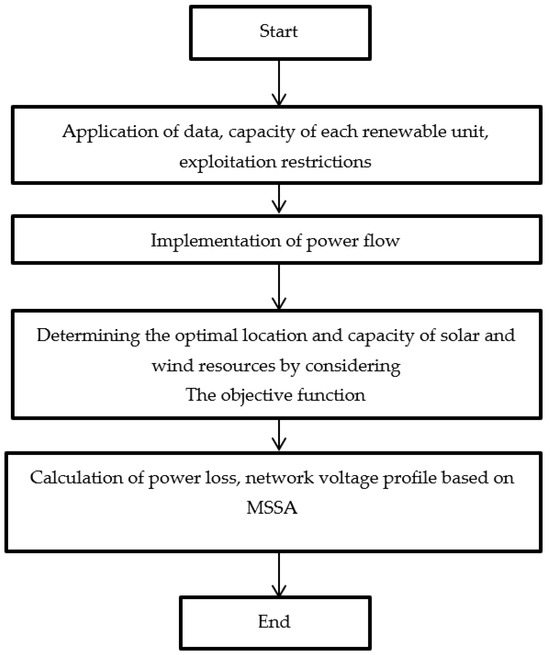
Figure 10.
Overall solution procedure.
- Optimal allocation of RES resources without resource limitations
- Optimal allocation of RES resources with limited resources
Optimization was carried out according to the objective functions, and the results are given in Table 5 and Table 6. The optimal results were introduced using the genetic algorithm (GA)/particle swarm optimization (PSO) for locating and finding the optimal size of distributed generation in distribution systems, indicating the superiority of the proposed method.

Table 5.
Optimal results of the algorithms for the first scenario.

Table 6.
Optimal results of the algorithms for the first scenario.
In many cases, the objective functions defined in the multi-objective optimization problem conflict with each other. In such a case, it is said that there will be “Pareto optimal solutions” for a multi-objective optimization problem (theoretically, there may be infinite Pareto optimal solutions for a multi-objective optimization problem). There is a concept called nondominated solution in multi-objective optimization problem-solving systems. If improving the values produced by one or more objective functions of this problem (by placing the candidate solution in the objective functions and producing output values) causes a decrease in the quality of the values produced by other objective functions of the same problem, a candidate solution for the multi-objective optimization problem is called “nondominated”. Such answers are called “Pareto optimal”. Without additional information, all Pareto optimal solutions are equally good and are considered equal to each other. The results show that, when the number of sample points increased, the results did not change significantly. The set of Pareto solutions, the solution obtained via fuzzy decision making, the voltage profile, and the active and reactive power losses for 24 h before and after optimization are shown in Figure 11, Figure 12, Figure 13, Figure 14, Figure 15, Figure 16, Figure 17, Figure 18, Figure 19 and Figure 20.
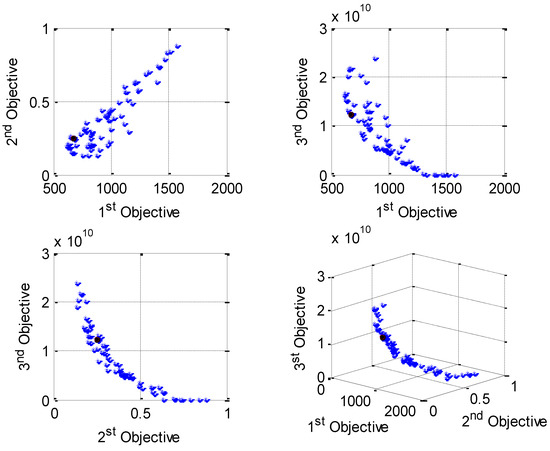
Figure 11.
Pareto solution set, MSSA algorithm (first scenario).
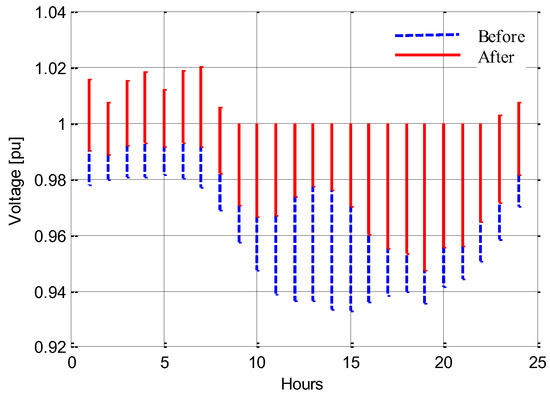
Figure 12.
Voltage profile for 24 h (first scenario).
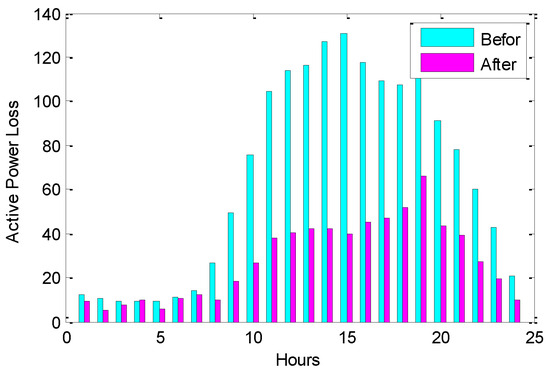
Figure 13.
Active power losses for 24 h (first scenario).
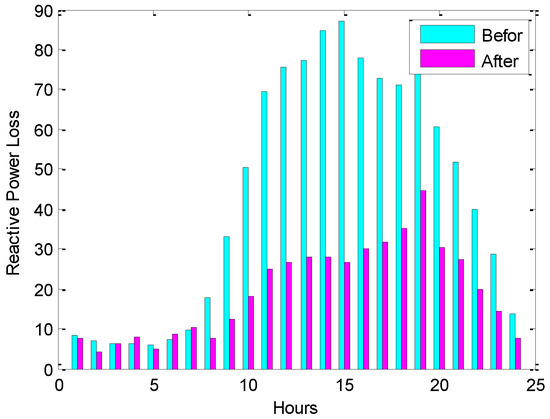
Figure 14.
Reactive power losses for 24 h (first scenario).
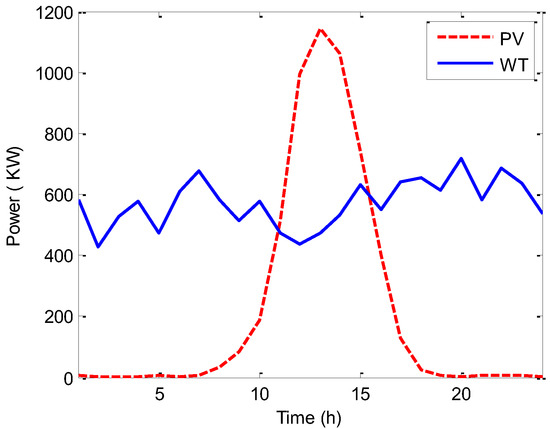
Figure 15.
Power produced by RES for 24 h (first scenario).
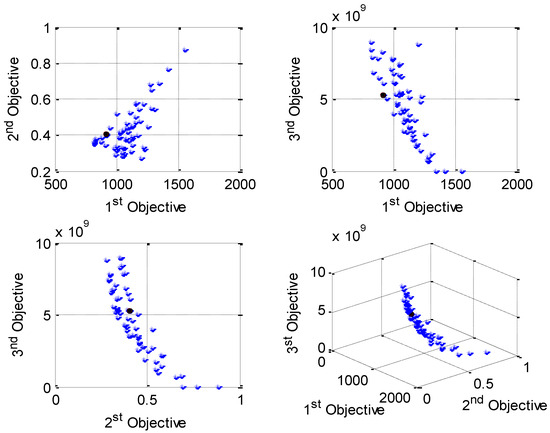
Figure 16.
Pareto solution set, MSSA algorithm (second scenario).
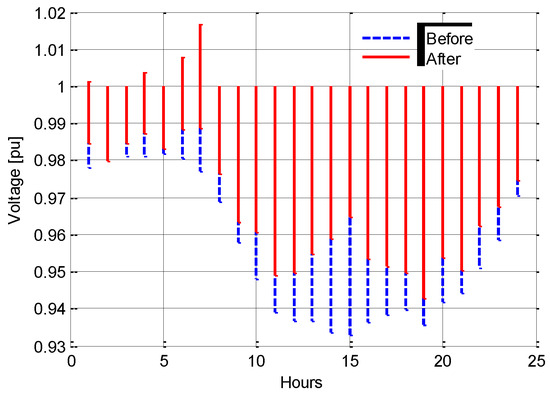
Figure 17.
Voltage profile for 24 h (second scenario).
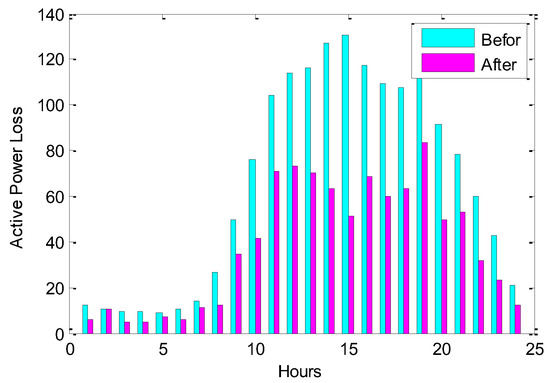
Figure 18.
Active power losses for 24 h (second scenario).
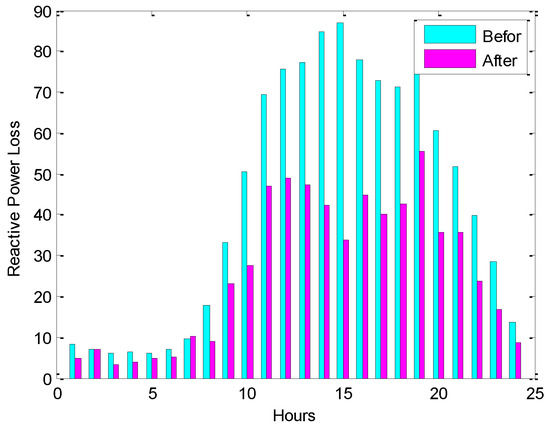
Figure 19.
Reactive power losses for 24 h (second scenario).
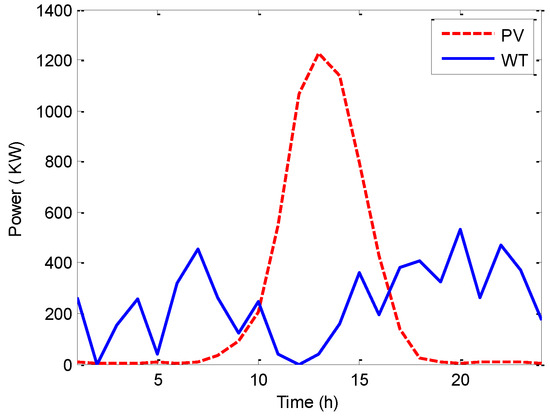
Figure 20.
Power produced by RES for 24 h (second scenario).
According to the results, it can be said that, despite the inclusion of RES, the losses in the distribution system decreased and the voltage profile increased. Table 7 shows the comparison of objective functions between scenarios.

Table 7.
Comparison of objective functions between scenarios.
6. Conclusions
Distribution systems are of great importance, as they are the lowest link in the distribution of electrical energy. Therefore, improving the operating conditions, reducing losses, and improving voltage profiles are particularly relevant. In this article, a method was proposed to determine the location, capacity, and number of renewable energy sources (RES) in the distribution systems. In this method, the load profile and sources of wind and solar energy are considered for a 24 h interval. The RES allocation problem is considered to be a multi-objective optimization problem whose objective functions are loss reduction, voltage profile improvement, and RES cost reduction. To solve this problem, a new multi-objective salp swarm algorithm is considered. The proposed method was applied on the 33-bus standard test system, and the results showed the efficiency of the algorithm in determining the location and size of RES in distribution systems with several load models (industrial, commercial, and household), with reduced losses and improved voltage profiles. In order to address the limitations of RES, the amount of wind and solar resources was considered to be 70% of the nominal percentage. In this case, despite the limited resources, a reduction in losses was observed. However, the costs of the RES increased as their production increased. In light of the importance of distribution systems, it can be said that, even in the worst scenarios, an optimal design would improve the operating conditions of a distribution network.
In the future, we will look at the following topics:
- Considering the uncertainty of load and power of renewable energy sources in solving the problem of microgrid energy management,
- Checking the proposed method in large systems,
- Considering the energy storage system,
- The cost of resources in accordance with the number and type of resources.
Author Contributions
Conceptualization, F.Z.; methodology, I.F.D., S.M. and L.F.G.-N.; software, I.F.D.; validation, O.D.M.; formal analysis, I.F.D. and S.M.; investigation, I.F.D., F.A. and L.F.G.-N.; resources, F.A.; data curation, F.Z.; writing—original draft, L.F.G.-N.; writing—review and editing, O.D.M.; visualization, O.D.M.; supervision, I.F.D.; project administration, I.F.D. and L.F.G.-N.; funding acquisition, L.F.G.-N. All authors have read and agreed to the published version of the manuscript.
Funding
This research received no external funding.
Data Availability Statement
The data used in this study are reported in the paper’s figures and tables.
Conflicts of Interest
The authors declare no conflict of interest.
References
- Zhang, G.; Jiang, C.; Wang, X. Comprehensive review on structure and operation of virtual power plant in electrical system. IET Gener. Transm. Distrib. 2019, 13, 145–156. [Google Scholar] [CrossRef]
- Pupo-Roncallo, O.; Campillo, J.; Ingham, D.; Hughes, K.; Pourkashanian, M. Large scale integration of renewable energy sources (RES) in the future Colombian energy system. Energy 2019, 186, 115805. [Google Scholar] [CrossRef]
- Zhang, X.; Lovati, M.; Vigna, I.; Widén, J.; Han, M.; Gal, C.; Feng, T. A review of urban energy systems at building cluster level incorporating renewable-energy-source (RES) envelope solutions. Appl. Energy 2018, 230, 1034–1056. [Google Scholar] [CrossRef]
- Ganjei, N.; Zishan, F.; Alayi, R.; Samadi, H.; Jahangiri, M.; Kumar, R.; Mohammadian, A. Designing and Sensitivity Analysis of an Off-Grid Hybrid Wind-Solar Power Plant with Diesel Generator and Battery Backup for the Rural Area in Iran. J. Eng. 2022, 2022, 4966761. [Google Scholar] [CrossRef]
- Tzen, E.; Morris, R. Renewable energy sources for desalination. Sol. Energy 2003, 75, 375–379. [Google Scholar] [CrossRef]
- Gbadamosi, S.L.; Nwulu, N.I. Optimal planning of renewable energy systems for power loss reduction in transmission expansion planning. J. Eng. Des. Technol. 2020, 18, 1209–1222. [Google Scholar] [CrossRef]
- Tightiz, L.; Yang, H. Resilience Microgrid as Power System Integrity Protection Scheme Element with Reinforcement Learning Based Management. IEEE Access 2021, 9, 83963–83975. [Google Scholar] [CrossRef]
- Niu, M.; Xu, N.Z.; Kong, X.; Ngin, H.T.; Ge, Y.Y.; Liu, J.S.; Liu, Y.T. Reliability importance of renewable energy sources to overall generating systems. IEEE Access 2021, 9, 20450–20459. [Google Scholar] [CrossRef]
- Hadjidemetriou, L.; Asprou, M.; Demetriou, P.; Kyriakides, E. Enhancing power system voltage stability through a centralized control of renewable energy sources. In Proceedings of the 2015 IEEE Eindhoven PowerTech, Eindhoven, The Netherlands, 29 June–2 July 2015; IEEE: New York, NY, USA, 2015; pp. 1–6. [Google Scholar]
- Akbari, E.; Shafaghatian, N.; Zishan, F.; Montoya, O.D.; Giral-Ramírez, D.A. Optimized Two-Level Control of Islanded Microgrids to Reduce Fluctuations. IEEE Access 2022, 10, 95824–95838. [Google Scholar] [CrossRef]
- Hosseinzadeh, N.; Aziz, A.; Mahmud, A.; Gargoom, A.; Rabbani, M. Voltage stability of power systems with renewable-energy inverter-based generators: A review. Electronics 2021, 10, 115. [Google Scholar] [CrossRef]
- Sadeghi, B.; Shafaghatian, N.; Alayi, R.; El Haj Assad, M.; Zishan, F.; Hosseinzadeh, H. Optimization of synchronized frequency and voltage control for a distributed generation system using the Black Widow Optimization algorithm. Clean Energy 2022, 6, 869–882. [Google Scholar] [CrossRef]
- Ullah, Z.; Mokryani, G.; Campean, F.; Hu, Y.F. Comprehensive review of VPPs planning, operation and scheduling considering the uncertainties related to renewable energy sources. IET Energy Syst. Integr. 2019, 1, 147–157. [Google Scholar] [CrossRef]
- Montoya, O.D.; Zishan, F.; Giral-Ramírez, D.A. Recursive Convex Model for Optimal Power Flow Solution in Monopolar DC Networks. Mathematics 2022, 10, 3649. [Google Scholar] [CrossRef]
- Zishan, F.; Akbari, E.; Montoya, O.D.; Giral-Ramírez, D.A.; Nivia-Vargas, A.M. Electricity retail market and accountability-based strategic bidding model with short-term energy storage considering the uncertainty of consumer demand response. Results Eng. 2022, 16, 100679. [Google Scholar] [CrossRef]
- Kumar, K.; Babu, N.R.; Prabhu, K.R. Design and analysis of RBFN-based single MPPT controller for hybrid solar and wind energy system. IEEE Access 2017, 5, 15308–15317. [Google Scholar] [CrossRef]
- Dadjé, A.; Djongyang, N.; Kana, J.D.; Tchinda, R. Maximum power point tracking methods for photovoltaic systems operating under partially shaded or rapidly variable insolation conditions: A review paper. Int. J. Sustain. Eng. 2016, 9, 224–239. [Google Scholar] [CrossRef]
- Yang, B.; Yu, L.; Chen, Y.; Ye, H.; Shao, R.; Shu, H.; Yu, T.; Zhang, X.; Sun, L. Modelling, applications, and evaluations of optimal sizing and placement of distributed generations: A critical state-of-the-art survey. Int. J. Energy Res. 2021, 45, 3615–3642. [Google Scholar] [CrossRef]
- Yang, B.; Wang, J.; Chen, Y.; Li, D.; Zeng, C.; Chen, Y.; Guo, Z.; Shu, H.; Zhang, X.; Yu, T.; et al. Optimal sizing and placement of energy storage system in power grids: A state-of-the-art one-stop handbook. J. Energy Storage 2020, 32, 101814. [Google Scholar] [CrossRef]
- Yang, B.; Li, J.; Shu, H.; Cai, Z.; Tang, B.; Huang, X.; Zhu, M. Recent advances of optimal sizing and location of charging stations: A critical overview. Int. J. Energy Res. 2022, 46, 17899–17925. [Google Scholar] [CrossRef]
- Yuan, Z.; Wang, W.; Wang, H.; Yildizbasi, A. A new methodology for optimal location and sizing of battery energy storage system in distribution networks for loss reduction. J. Energy Storage 2020, 29, 101368. [Google Scholar] [CrossRef]
- Kong, X.; Wang, H.; Li, N.; Mu, H. Multi-objective optimal allocation and performance evaluation for energy storage in energy systems. Energy 2022, 253, 124061. [Google Scholar] [CrossRef]
- Tightiz, L.; Yang, H.; Bevrani, H. An Interoperable Communication Framework for Grid Frequency Regulation Support from Microgrids. Sensors 2021, 21, 4555. [Google Scholar] [CrossRef] [PubMed]
- Abd Elazim, S.M.; Ali, E.S. Optimal network restructure via improved whale optimization approach. Int. J. Commun. Syst. 2021, 34, e4617. [Google Scholar]
- Abd Elazim, S.M.; Ali, E.S. Optimal locations and sizing of capacitors in radial distribution systems using mine blast algorithm. Electr. Eng. 2018, 100, 1–9. [Google Scholar] [CrossRef]
- Ali, E.S.; Abd Elazim, S.M.; Abdelaziz, A.Y. Ant lion optimization algorithm for renewable distributed generations. Energy 2016, 116, 445–458. [Google Scholar] [CrossRef]
- Tahir, M.F.; Haoyong, C.; Khan, A.; Javed, M.S.; Laraik, N.A.; Mehmood, K. Optimizing size of variable renewable energy sources by incorporating energy storage and demand response. IEEE Access 2019, 7, 103115–103126. [Google Scholar] [CrossRef]
- Bartolucci, L.; Cordiner, S.; Mulone, V.; Rocco, V.; Rossi, J.L. Hybrid renewable energy systems for renewable integration in microgrids: Influence of sizing on performance. Energy 2018, 152, 744–758. [Google Scholar] [CrossRef]
- Moradi, M.H.; Abedini, M.; Tousi, S.R.; Hosseinian, S.M. Optimal siting and sizing of renewable energy sources and charging stations simultaneously based on differential evolution algorithm. Int. J. Electr. Power Energy Syst. 2015, 73, 1015–1024. [Google Scholar] [CrossRef]
- Mozafar, M.R.; Moradi, M.H.; Amini, M.H. A simultaneous approach for optimal allocation of renewable energy sources and electric vehicle charging stations in smart grids based on improved GA-PSO algorithm. Sustain. Cities Soc. 2017, 32, 627–637. [Google Scholar] [CrossRef]
- Niknam, T.; Fard, A.K.; Seifi, A. Distribution feeder reconfiguration considering fuel cell/wind/photovoltaic power plants. Renew. Energy 2012, 37, 213–225. [Google Scholar] [CrossRef]
- Ahmad, A.; Khan, A.; Javaid, N.; Hussain, H.M.; Abdul, W.; Almogren, A.; Alamri, A.; Azim Niaz, I. An optimized home energy management system with integrated renewable energy and storage resources. Energies 2017, 10, 549. [Google Scholar] [CrossRef]
- Kasaei, M.J.; Gandomkar, M.; Nikoukar, J. Optimal management of renewable energy sources by virtual power plant. Renew. Energy 2017, 114, 1180–1188. [Google Scholar] [CrossRef]
- Petru, T.; Thiringer, T. Modeling of wind turbines for power system studies. IEEE Trans. Power Syst. 2002, 17, 1132–1139. [Google Scholar] [CrossRef]
- Chen, Z.; Spooner, E. Grid power quality with variable speed wind turbines. IEEE Trans. Energy Convers. 2001, 16, 148–154. [Google Scholar] [CrossRef]
- Baouche, F.Z.; Abderezzak, B.; Ladmi, A.; Arbaoui, K.; Suciu, G.; Mihaltan, T.C.; Raboaca, M.S.; Hudișteanu, S.V.; Țurcanu, F.E. Design and Simulation of a Solar Tracking System for PV. Appl. Sci. 2022, 12, 9682. [Google Scholar] [CrossRef]
- Elkholy, A. Harmonics assessment and mathematical modeling of power quality parameters for low voltage grid connected photovoltaic systems. Sol. Energy 2019, 183, 315–326. [Google Scholar] [CrossRef]
- Singh, D.; Singh, D.; Verma, K. Multiobjective optimization for DG planning with load models. IEEE Trans. Power Syst. 2009, 24, 427–436. [Google Scholar] [CrossRef]
- Rahiminejad, A.; Vahidi, B.; Hejazi, M.A.; Shahrooyan, S. Optimal scheduling of dispatchable distributed generation in smart environment with the aim of energy loss minimization. Energy 2016, 116, 190–201. [Google Scholar] [CrossRef]
- Han, X.; Zhang, H.; Yu, X.; Wang, L. Economic evaluation of grid-connected micro-grid system with photovoltaic and energy storage under different investment and financing models. Appl. Energy 2016, 184, 103–118. [Google Scholar] [CrossRef]
- Mirjalili, S.; Gandomi, A.H.; Mirjalili, S.Z.; Saremi, S.; Faris, H.; Mirjalili, S.M. Salp Swarm Algorithm: A bio-inspired optimizer for engineering design problems. Adv. Eng. Softw. 2017, 114, 163–191. [Google Scholar] [CrossRef]
- Faris, H.; Mirjalili, S.; Aljarah, I.; Mafarja, M.; Heidari, A.A. Salp swarm algorithm: Theory, literature review, and application in extreme learning machines. Nat. Inspired Optim. 2020, 2020, 185–199. [Google Scholar]
- Tightiz, L.; Mansouri, S.; Zishan, F.; Yoo, J.; Shafaghatian, N. Maximum Power Point Tracking for Photovoltaic Systems Operating under Partially Shaded Conditions Using SALP Swarm Algorithm. Energies 2022, 15, 8210. [Google Scholar] [CrossRef]
Disclaimer/Publisher’s Note: The statements, opinions and data contained in all publications are solely those of the individual author(s) and contributor(s) and not of MDPI and/or the editor(s). MDPI and/or the editor(s) disclaim responsibility for any injury to people or property resulting from any ideas, methods, instructions or products referred to in the content. |
© 2023 by the authors. Licensee MDPI, Basel, Switzerland. This article is an open access article distributed under the terms and conditions of the Creative Commons Attribution (CC BY) license (https://creativecommons.org/licenses/by/4.0/).