Article

Enzymatic Conversion of Hydrolysis Lignin—A Potential Biorefinery Approach

1
Chair of Biosystems Engineering, Institute of Forestry and Engineering, Estonian University of Life Sciences, Friedrich Reinhold Kreutzwaldi 1a, 51014 Tartu, Estonia
2
The Core Laboratory for Wood Chemistry and Bioprocessing, University of Tartu, Ravila 14a, 50411 Tartu, Estonia
3
Laboratory of Lignin Biochemistry, Department of Chemistry and Biotechnology, Tallinn University of Technology, 12618 Tallinn, Estonia
4
Institute of Technology, University of Tartu, Nooruse 1, 50411 Tartu, Estonia
5
Institute of Chemistry, University of Tartu, Ravila 14a, 50411 Tartu, Estonia
*
Authors to whom correspondence should be addressed.
Energies 2023, 16(1), 370; https://doi.org/10.3390/en16010370
Submission received: 29 November 2022 / Revised: 24 December 2022 / Accepted: 26 December 2022 / Published: 28 December 2022
(This article belongs to the Special Issue Biopower Technologies)

Abstract

:
Lignin is an abundant and renewable source capable of replacing different raw materials in the chemical industry. It can be obtained from lignocellulosic biomass (LCB) via different pretreatment methods. In the present study, hydrolysis lignin (HL) from the SunburstTM pretreatment technology was utilized to investigate its enzymatic conversion. At first, soluble HL fractions were obtained via alkali solubilization followed by acid precipitation, referred to as acid precipitated lignin (APL). Furthermore, the APL was tested with three different bacterial laccases to identify the optimal conditions for its conversion into small molecular weight fractions. Among the tested laccases, Streptomyces coelicolor A3(2) (ScLac) displayed the highest rate of APL conversion with a high lignin dosage and under extremely alkaline conditions, i.e., 50 g/L in 0.25 M NaOH solution, resulting in higher molecular weight fractions. The increase in the molecular weight and quantitative linkages before and after the enzymatic oxidation of the APL were characterized by size exclusion chromatography (SEC), Fourier-transform infrared spectroscopy (FT-IR), and two-dimensional heteronuclear single quantum correlation nuclear magnetic resonance (2D HSQC NMR) methods.

1. Introduction

Lignin has become a major focus in recent decades as a renewable source capable of replacing different raw materials in the chemical industry [1]. It can be obtained from paper waste such as cardboard [2] and different lignocellulosic biomasses (LCBs), e.g., agricultural waste, grasses, and wood [3]. Naturally, lignin bioprocessing involves lignin decomposition to lignin-based aromatics via extracellular microbial enzymes and is further converted to value-added bioproducts through microbial metabolism [4]. Industrially, the bleaching of wood fibers using a bleaching agent is the primary process to remove lignin and produce paper with a suitable brightness [5]. While there are numerous pretreatment methods for lignin extraction, one such pretreatment is the thermomechanical–chemical pretreatment of LCB, which results in depolymerized hemicellulose, cellulose, and hydrolysis lignin (HL) [6]. HL has a complex heterogenous and native structure that could be useful in material applications, such as composites [7]. However, higher molecular weight lignin applications are elusive since most chemical industries use fewer complex precursors [8]. Therefore, the valorization of lignin requires its conversion into lower molecular weight phenolics and aromatics that serve as the building blocks for the chemical synthesis of high-value products [9,10]. Thus, lignin could replace crude oil-based chemicals and be a game changer in the transition towards a bio-based economy [11].
Biological or enzymatic treatment of lignin has multiple advantages over physical and thermochemical methods, since it requires low energy, a mild reaction, and environmentally benign conditions [12]. Among the lignin-converting enzymes, laccases (EC 1.10.3.2) are very versatile biocatalysts currently used in the food, textile, and pulp and paper sectors, which catalyze the oxidation of phenolic substrates with the reduction of molecular oxygen into water and are capable of operating in industrial conditions [13]. However, biorefinery conditions, such as an extreme pH, high concentrations of inhibitors, and temperature, are harsh for enzymes; thus, the majority of fungal and plant laccases fail to perform [14], but these shortcomings could be addressed by bacterial laccases, since they possess several advantages, such as a broad pH, temperature, and ease of production [15,16]. Hence, the conversion of lignin by different bacterial laccases is promising and could lead to lignin valorization at an industrial scale.
Most reports on bacterial laccases are based on the utilization of a laccase-mediator system (LMS), where mediators such as 2,2′-azino-bis(3-ethylbenzothiazoline-6-sulfonic acid) diammonium salt (ABTS) and 1-hydroxybenzotriazole (HBT), assist in lignin conversion [9,17,18]. LMS mediates the cleavage of nonphenolic bonds present in lignin, this could amplify lignin depolymerization. Unfortunately, it is only appropriate at the laboratory scale; from an industrial viewpoint, it is expensive [19]. Therefore, a straightforward approach is required to integrate the enzymatic conversion of lignin in current biorefineries, where lignin could be converted at higher concentrations into small molecular weight fractions. Since alkaline conditions show the highest solubilization of lignin, it is reasonable to use this as a starting point for enzymatic valorization [20,21]. But alkaline conditions present challenges, such as enzyme inhibition and polycondensation of lignin [22]. As a result, further investigation is required to understand the enzymatic conversion with high lignin concentrations in alkaline conditions. In the present study, fractionated HL was treated with different bacterial laccases, and their activity on lignin was measured in Britton and Robinson (B&R) buffer and alkaline conditions. We also show that laccases are useable in industrially viable alkaline conditions.

2. Materials and Methods

2.1. Materials

The HL was produced by the thermomechanical–chemical pretreatment method (SunburstTM Technology) of birch woodchips and was provided by Fibenol OÜ, Estonia. Amycolatopsis sp. 75iv2 (AmLac), S. coelicolor A3(2) (ScLac), and S. viridosporus T7A (SvLac) enzymes were expressed, purified, and reconstituted with copper, as described previously by Tiit Lukk’s group [23,24]. Ninety-seven percent sodium hydroxide (NaOH), from Lachner, was used, as well as Whatman Grade GF/B Glass microfiber filter paper, 460 × 570 mm. In addition, 99.8% acetic acid (CH3COOH) from Lachema and phosphoric acid (H3PO4) Tris-HCl 99% were bought from Sigma Aldrich, as well as 99.8% boric acid (H3BO3) from Keemia Kaubandus AS.

2.2. Preparation of Acid Precipitated Lignin (APL) and Britton & Robinson (B&R) Buffer

The APL was prepared by solubilizing HL in NaOH solution. Briefly, 10 g of HL was solubilized in 100 mL of 0.25 M NaOH solution for 2 h at room temperature under continuous magnetic stirring at 150 rpm (revolutions per minute). After solubilization, HL was filtered using Whatman filter paper, and subsequently filtered HL fractions were precipitated at pH 2 using 3 M H2SO4. Later, the precipitate was washed with water and dried under vacuum 150 MPa (Mega Pascal) at 40 °C overnight and further utilized in the experiments. The 30 mM (B&R) buffer was prepared using MilliQ water, as described previously by Ebihara et al. [25].

2.3. Enzymatic Treatment of APL

The APL was prepared as described earlier, and 0.1 g was weighed and solubilized for 1 h in 1 mL 30 mM B&R buffer. Later, a similar volume of NaOH solution was added to perform the alkaline experiments, and 3 M H2SO4 was used to adjust the pH before adding the enzymes. Previously, the samples were vortexed, and after the complete solubilization of APL in B&R buffer and NaOH solution, the laccases were added to the mixture at room temperature for 21 h, as described by Veera et al. [26]. The enzyme reactions were prepared in 100 µL volume, and 90 µL soluble lignin was treated with 10 µL of enzyme dosage, while the control reaction was run without the enzyme, and 10 µL MQ H2O was added instead. Furthermore, the enzymatic oxidation was measured at three different pH (6, 8, and 10) in B&R buffer and four different pH (9, 10, 11, and 12) in alkaline solutions. The complete procedure for obtaining APL, enzymatic oxidation, and its characterization are presented in Figure 1. The laccase’s activities, optimum pH, and krel and Kapp values were similar, as described by Majumdar et al. [23].

2.4. Lignin Concentration Determination by UV-Vis Spectroscopy

The solubilization concentration of the APL in B&R buffer and the different alkaline conditions were determined using a Thermo Evolution 160 UV-Vis Spectrophotometer. The UV absorption of the solubilized APL before the enzymatic treatment was based on the absorbance at 280 nm, and the solubilized lignin concentration was calculated using the following equation.
Y   = 0.0618 x   0.0007
Here, y = concentration at g/L, and x = absorbance at 280 nm.
It is to be noted that the absorption calculations were based on the calibration curve conducted using known concentrations of completely soluble APL.

2.5. Size Exclusion Chromatography (SEC)

The enzyme-treated and nontreated (control) lignin samples were centrifuged for 10 min at 10,000 rpm, and 90 µL supernatant was taken to mix with 90 µL of 0.1 M NaOH to make a final volume of 180 µL for analysis. The relative molecular weight distributions were measured by SEC. The analysis was performed using the Shimadzu Prominence system with a UV detector at 280 nm with size exclusion columns MCX 1000 Å 5 µm, 8 × 300 mm, and MCX, 8 × 300 mm, 100,000 Å, 5 µm with pre-column MCX 5 µm, 8 × 50 mm (Polymer Standards Service). An isocratic flow with 0.1 M NaOH solution at a flow rate of 0.6 mL/mink was used, and the samples were run for 50 min, with an injection volume of 10 µL. The lignin’s relative molecular weight was determined using a polystyrene sulfonate sodium salt standard-based calibration curve in the range of 246 to 100,000 Da. The obtained chromatograms from the samples were analyzed with LabSolutions GPC software.

2.6. Fourier-Transform Infrared Spectroscopy (FT-IR)

The functionalities of the enzyme-treated and nontreated (control) APL were measured using FT-IR spectroscopy (Spectrum BXII, Perkin Elmer Inc., Waltham, MA, USA). The spectra were recorded with an average accumulation of 16 scans in the 4000–600 cm−1 interval range with a resolution of 4 cm−1. The samples were prepared by mixing enzyme-treated and nontreated (control) APL with KBr in a weight ratio of 1:100 and pressed into disks under 10 tons of pressure for 1 min.

2.7. Two-Dimensional NMR Spectroscopy

Two-dimensional heteronuclear single quantum coherence (HSQC) spectra were recorded by the dissolution of 120 mg of dry lignin sample in 0.5 mL DMSO-d6. The material was solubilized overnight and analyzed using Bruker Avance-III 700 MHz. The spectra were obtained using the Bruker Topspin pulse program hsqcedetgpsisp2.3, with 16 scans, 0.08 s acquisition time, and 3 s relaxation delay.

3. Results and Discussion

3.1. The Molecular Weight Distribution of Acid Precipitated Lignin (APL)

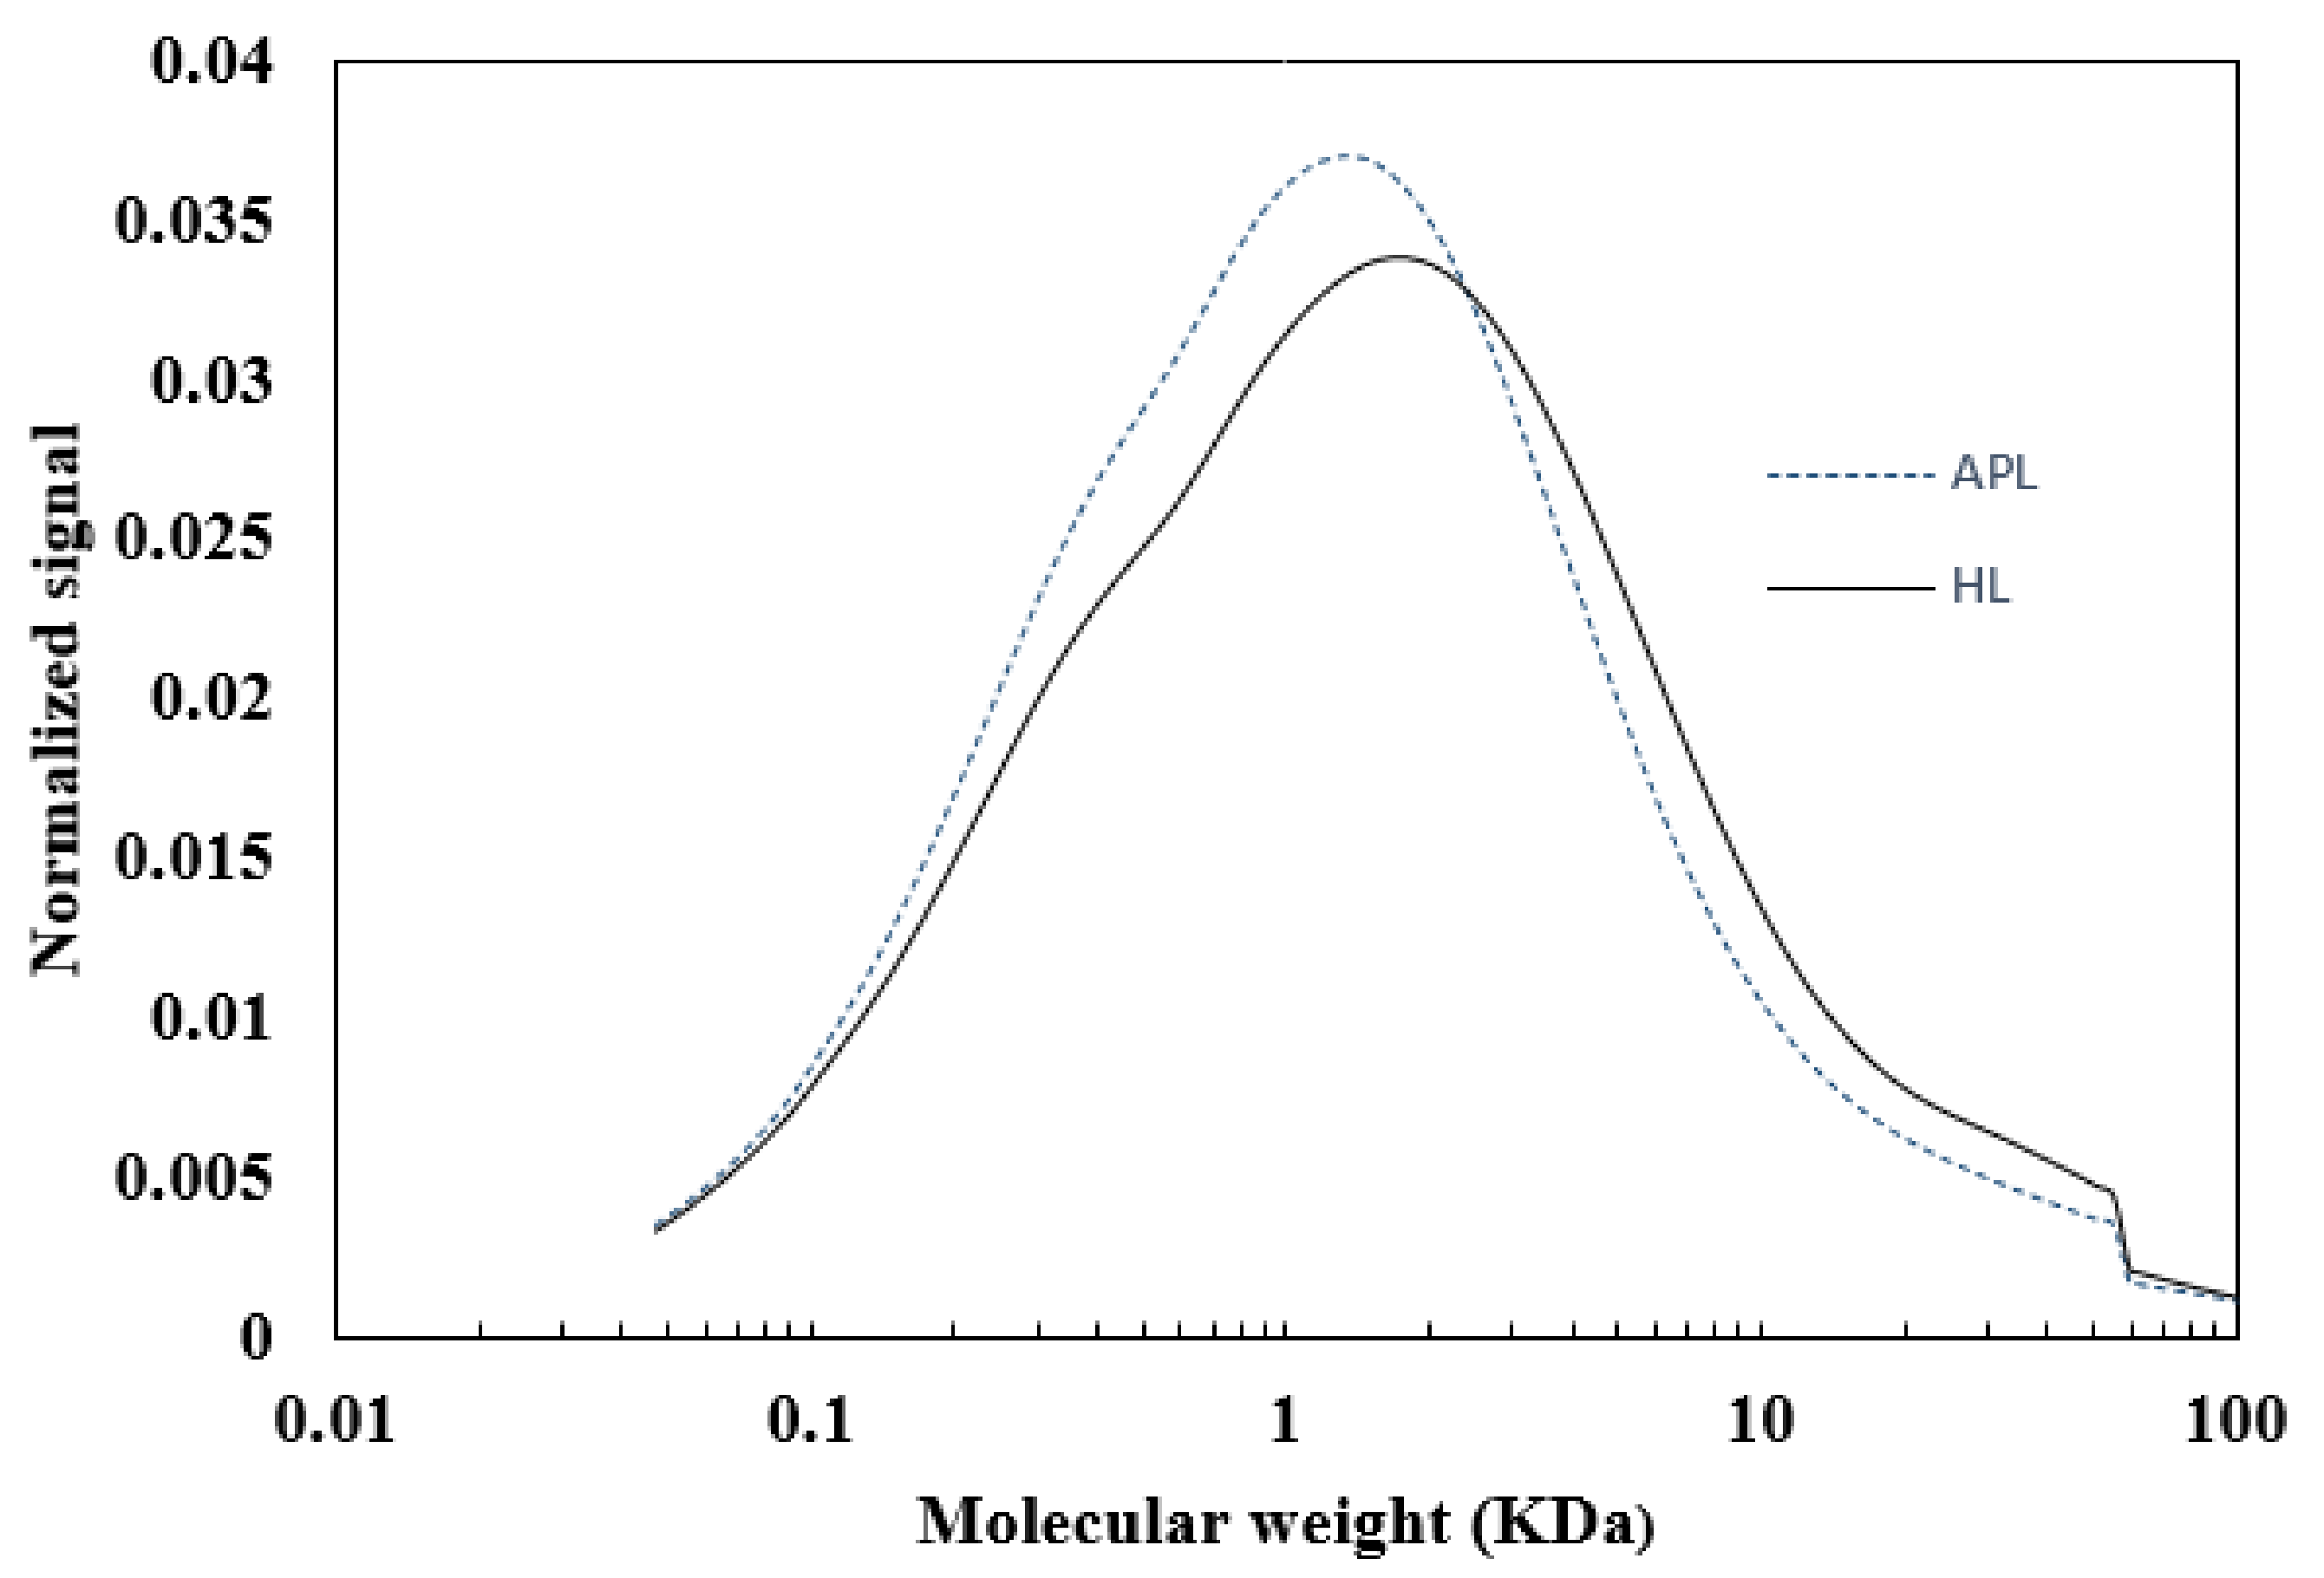
Size exclusion chromatography (SEC) was used to quantify the changes in the molecular weights, as reported previously by the group [27]. The distinction between the HL and APL molecular weight distribution curves via SEC are shown in Figure 2, and its number average molecular weight (Mn) and weight average molecular weight (Mw) values are shown in Table 1. The decrease in the molecular weight demonstrated the fractionation of the HL in the form of lower molecular weight APL while removing the insoluble higher molecular weight lignin. In Section 3, the changes in the average molecular weight before and after the enzymatic treatments were divided with the control average molecular weight values (APL without laccase) to show the degree of enzymatic conversion. This would allow us to better understand the enzymatic activity towards lignin depolymerization or repolymerization.

3.2. Enzymatic Oxidation of APL

To determine the major contributor to laccases activity, the enzymatic oxidation of the APL was carried out. The laccases used on the APL were first tested in B&R buffer at different pH (6, 8, and 10), with limited lignin solubilization, as shown in Table 2.
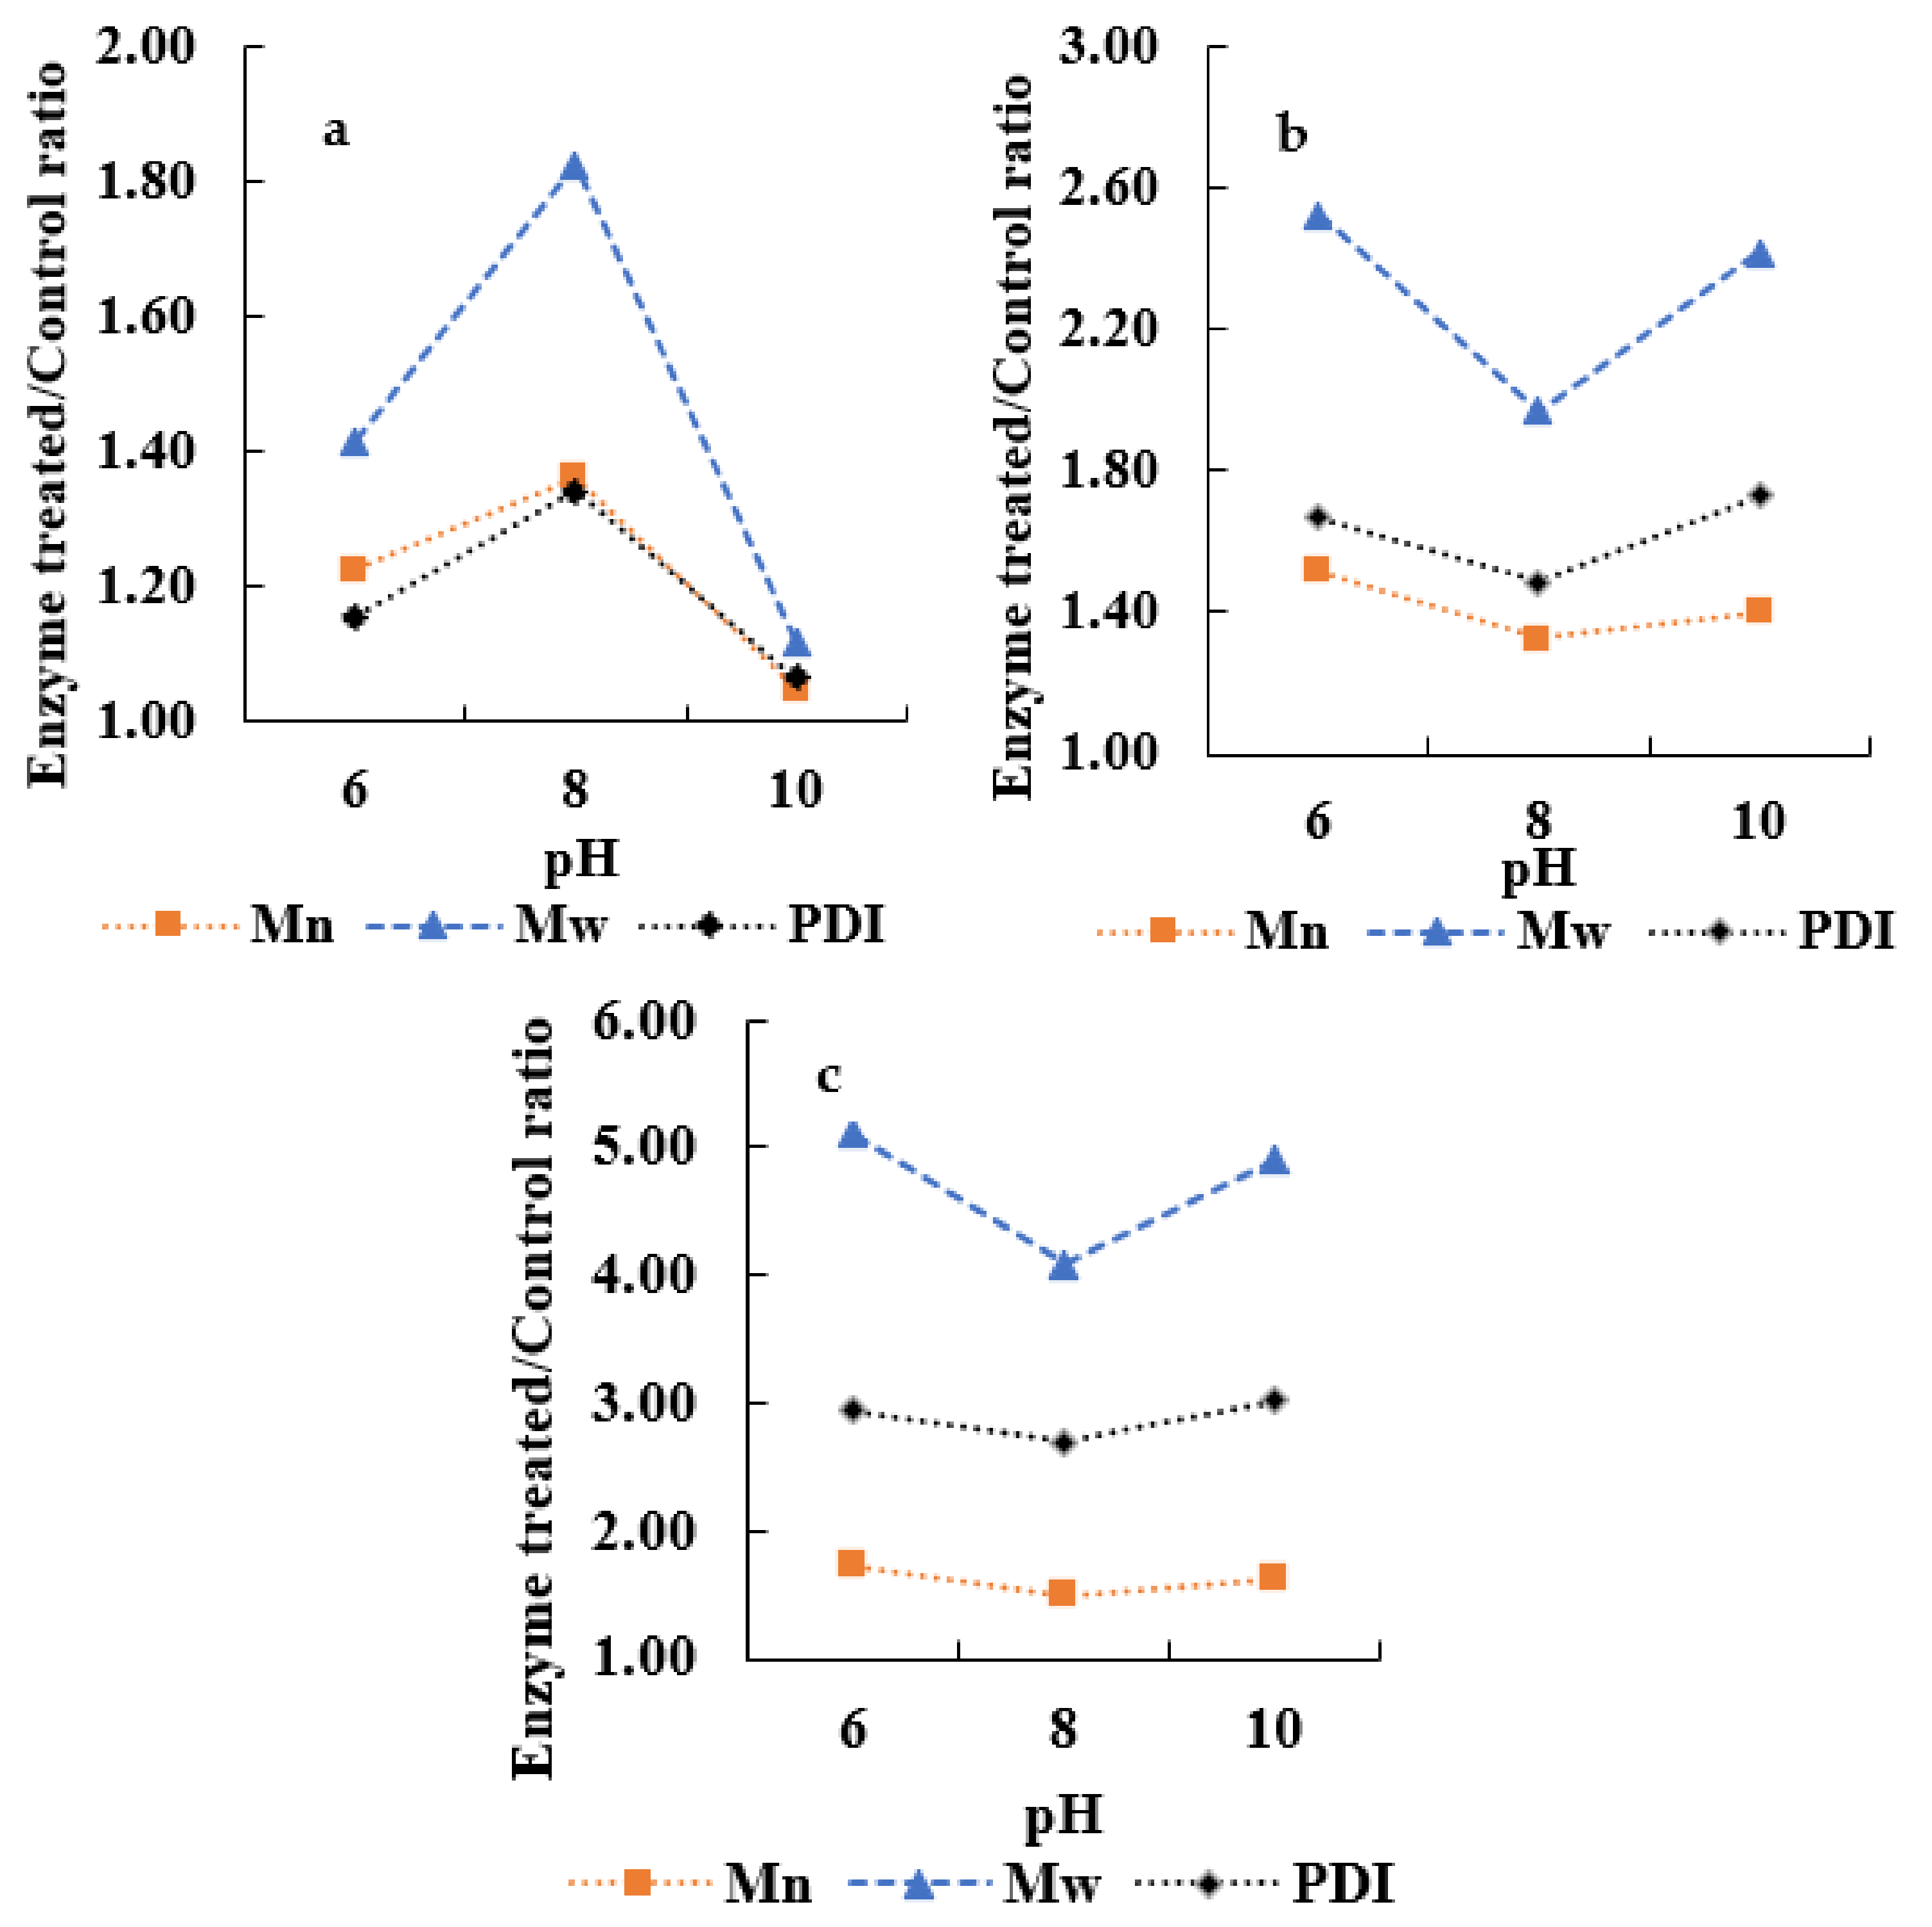
All three laccases, AmLac, SvLac, and ScLac, showed lignin conversion at different pH (6, 8, and 10), as shown in Figure 3a–c. In addition, SvLac and ScLac were found to be active at a higher pH (10) in B&R buffer, as shown in Figure 3b,c compared to AmLac, as shown in Figure 3a, where there were small changes observed at pH 10, and further activity decreased with an increased pH. This shows the feasibility of laccases (SvLac and ScLac) to retain their activity at an alkaline pH. Although all the reactions resulted in higher molecular weight fractions, the bacterial laccases were able to tolerate increasing dosages of lignin, i.e., from 1 to 5 g/L, as reported previously [28,29]. Thus, the radical formation by the enzymatic treatment could result in the polycondensation of the APL after depolymerization, as discussed by Zhu et al. [18]. One interesting fact noticed throughout the experiments in buffer conditions was the enzymatic functionality at a higher pH, which led to experiments with hasher alkaline conditions, i.e., only in the NaOH solutions with an adjusted pH. It is also interesting to note how a high lignin concentration affected the enzyme activity. Therefore, the laccases’ activity in alkaline conditions with an adjusted pH was established to understand the optimal limit for lignin conversion. Here, ScLac showed the highest activity in comparison to SvLac and AmLac. Hence, ScLac was chosen to elucidate the enzymatic conversion in different alkaline solutions, i.e., in 0.4% (0.1 M) and 1% (0.25 M) NaOH solution concentrations.
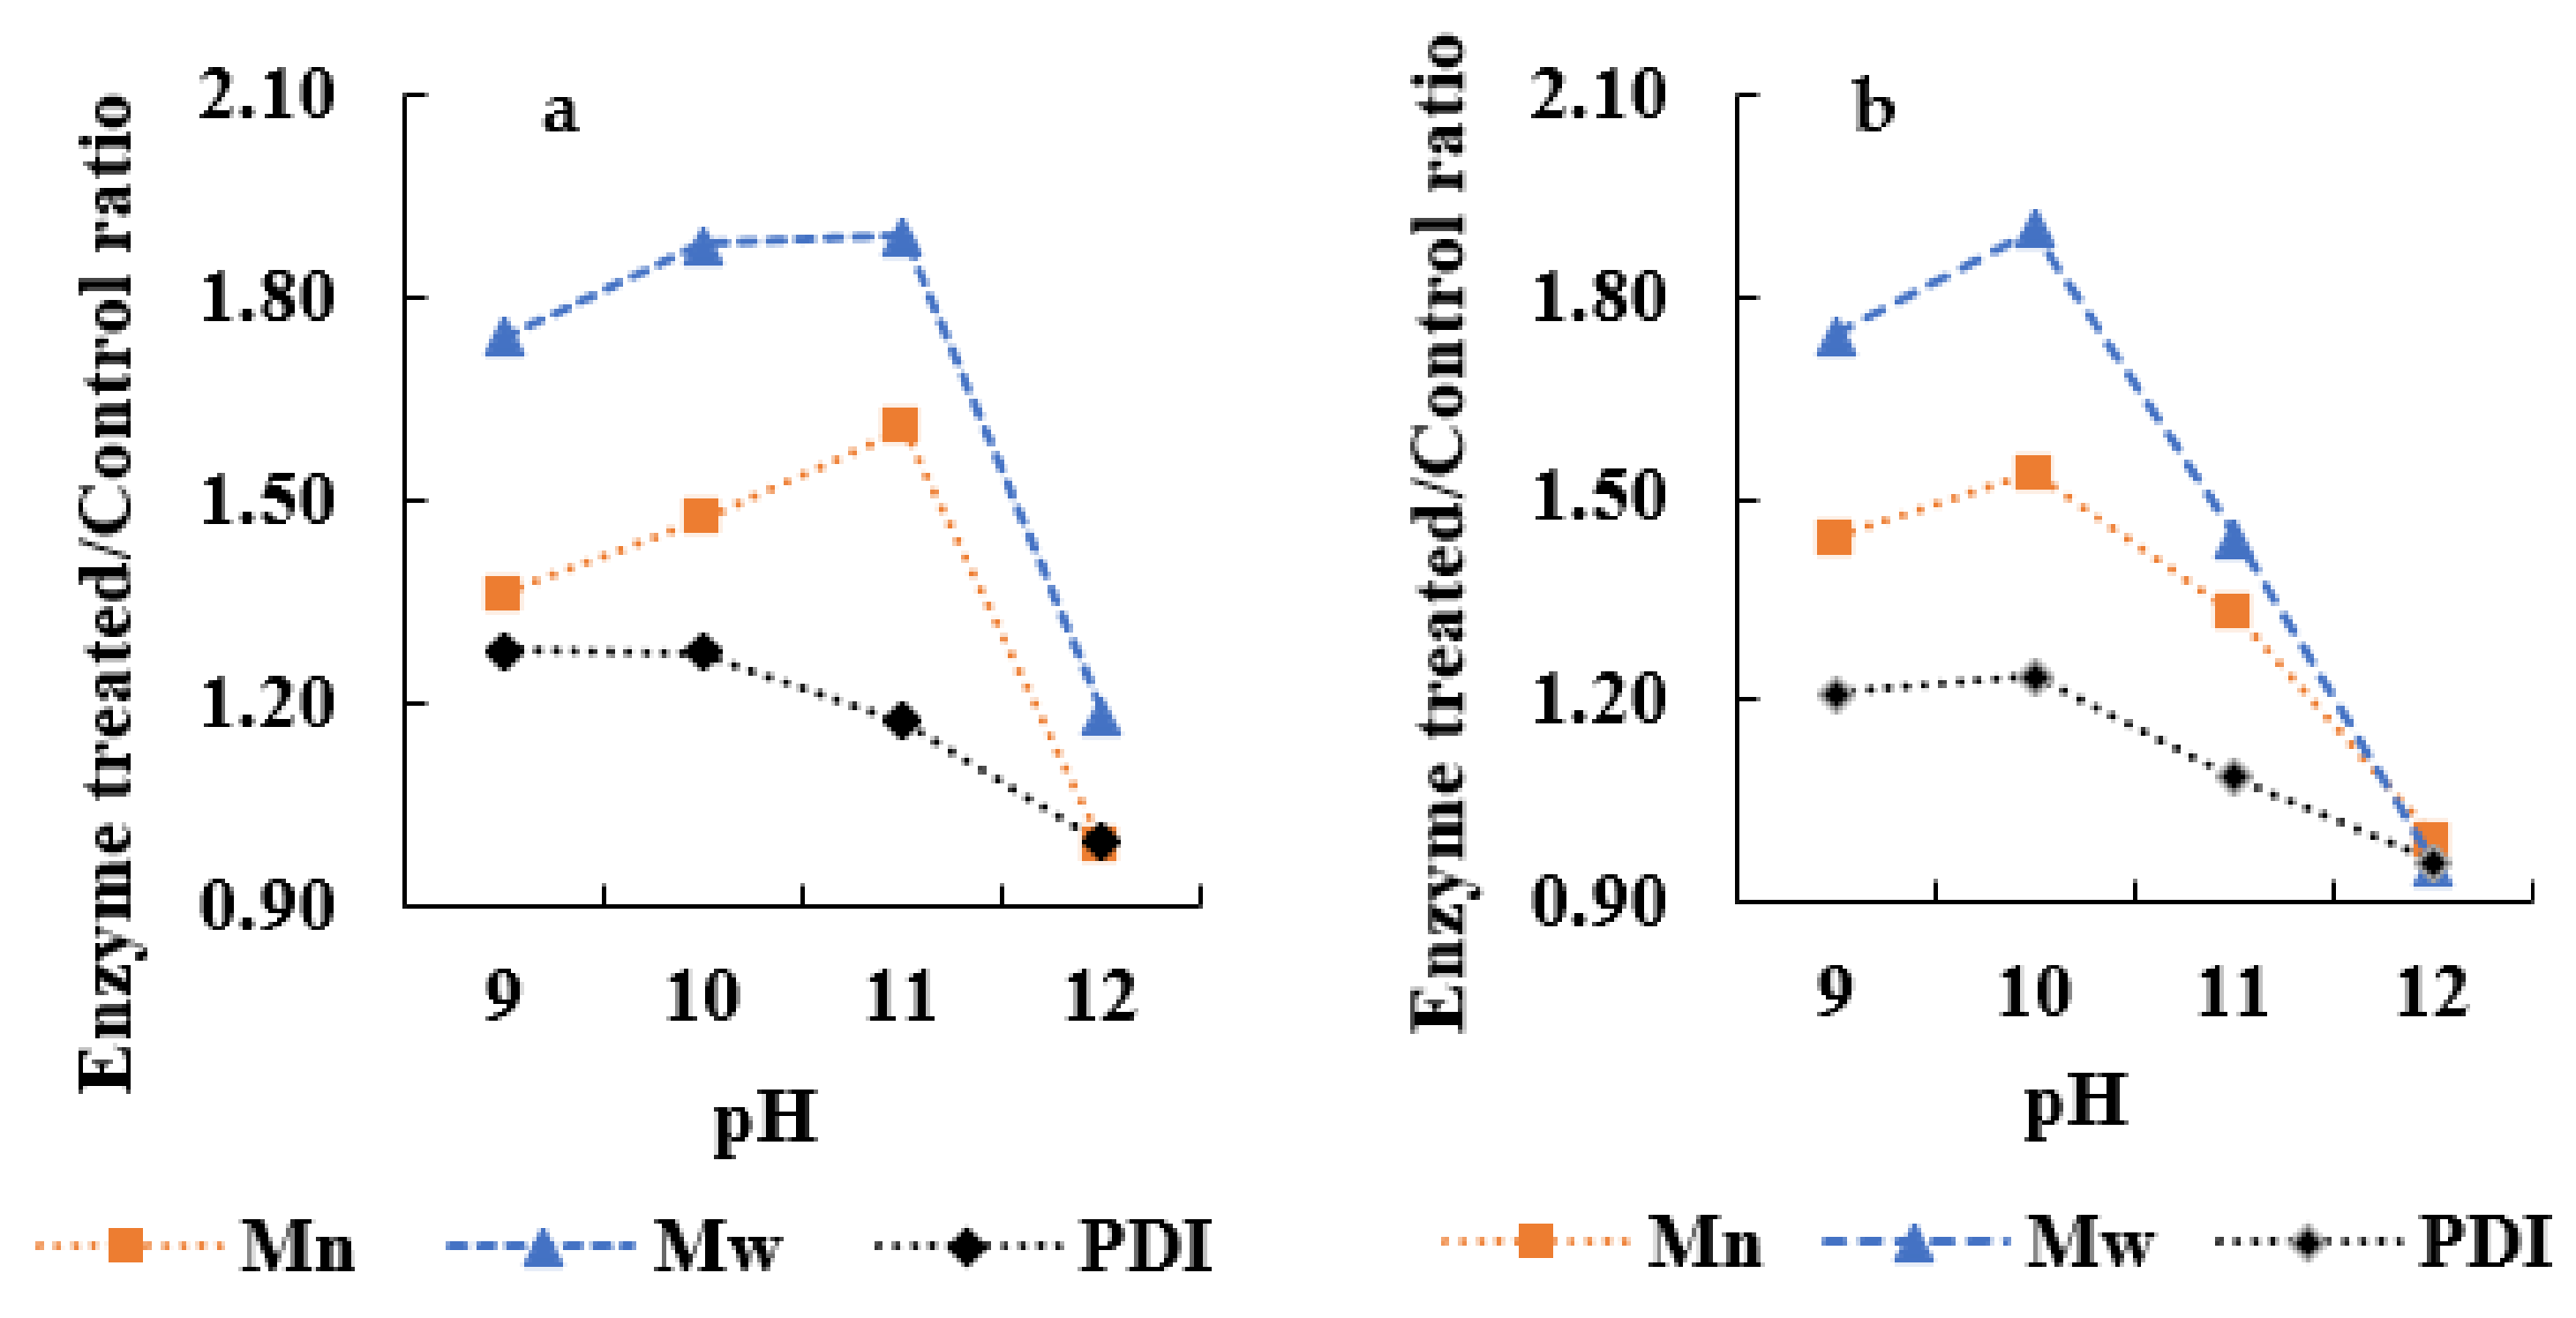
Nevertheless, before moving towards a higher alkalinity and different lignin dosages, it is compelling to note that ScLac retained its activity in the NaOH solutions with an adjusted pH (9, 10, 11, and 12) with a limited lignin dosage (i.e., 5 g/L), as shown in Figure 4a,b. Although, it was noted that with the increase in the NaOH concentration or pH, the activity decreased, i.e., from pH 10 to 12. This was most likely due to the laccases’ intolerance to a higher alkalinity, as discussed by Chan et al. [30]. Despite this, the average molecular weight (Mn and Mw) and PDI values obtained by SEC, as shown in Table 3, demonstrated an increase in the molecular weight after treatment at a higher pH. Thus, further experiments were required to elucidate the enzymatic inhibition with high lignin dosages.

3.3. Determination of Enzymatic Inhibition

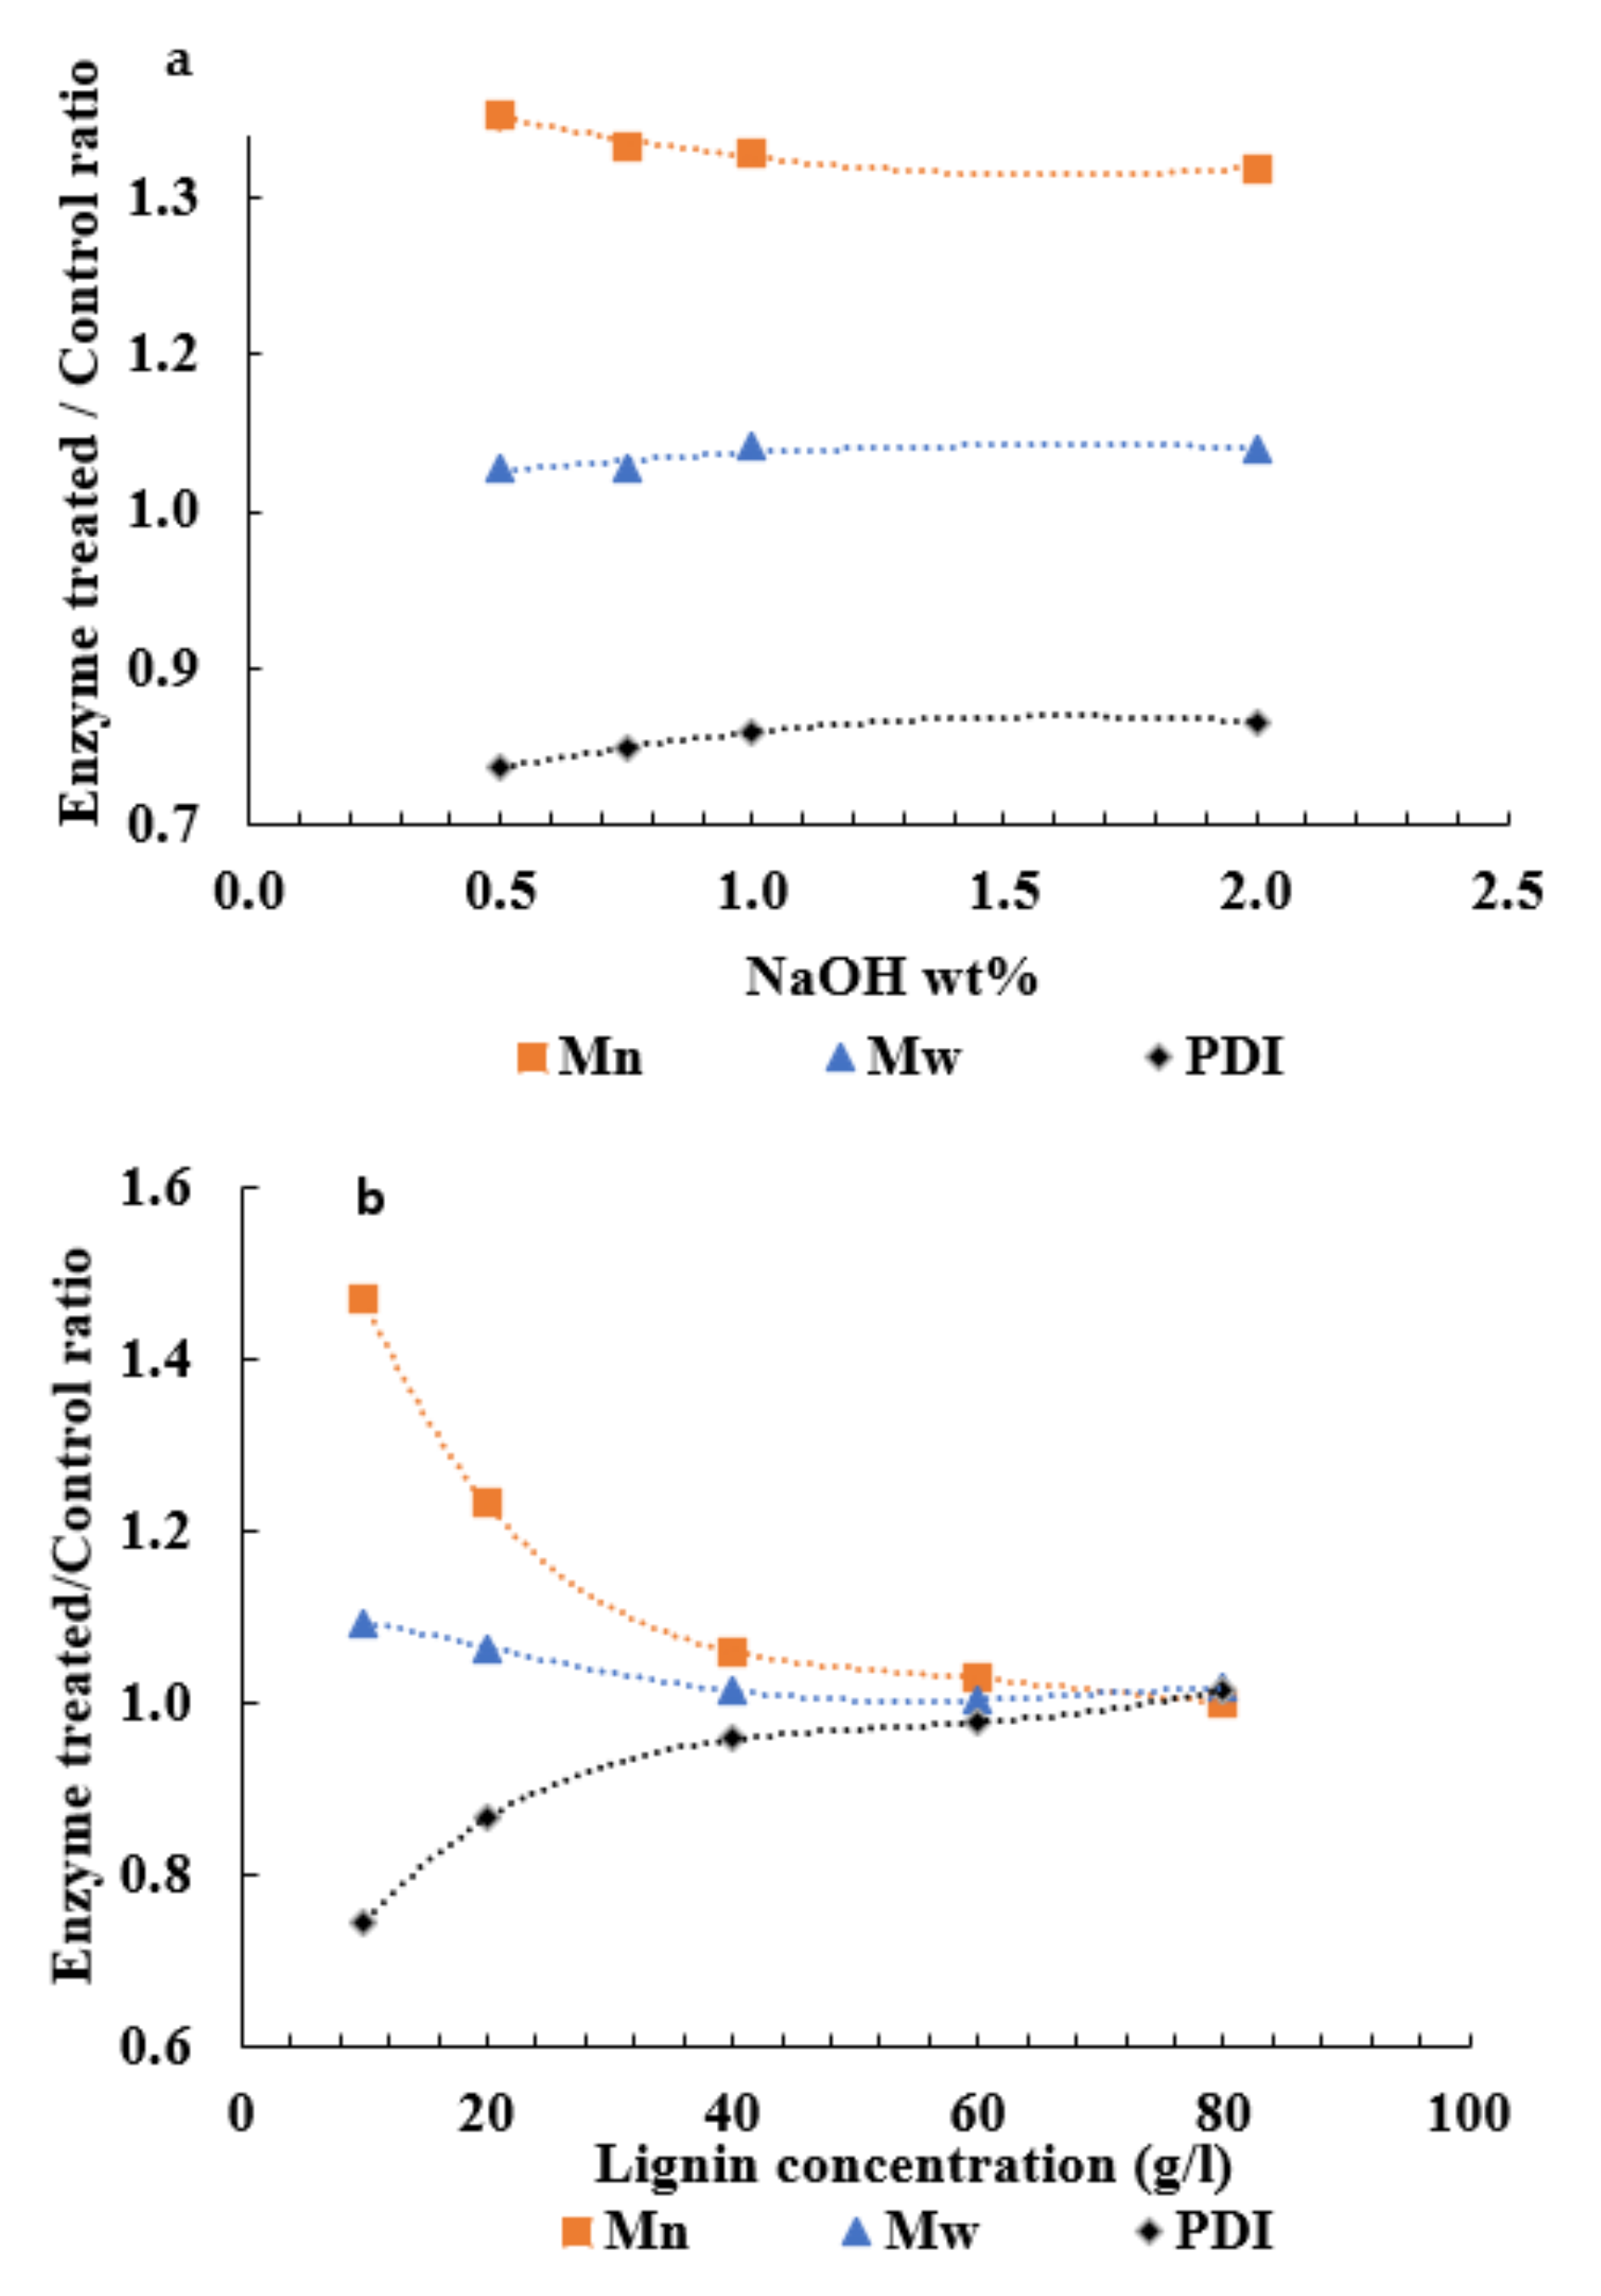
The inhibition of the enzymes was either due to the NaOH or lignin dosage. Therefore, it was important to understand the role of both, as it became apparent that NaOH, as well as lignin, are the main contributors to the enzyme inactivation in alkaline conditions. The amount of NaOH directly correlated to the dissolution of the APL; this means that the pH adjustment could also lead to the precipitation of lignin from the solution. However, it was shown that the precipitation of the lignin onsets at approximately pH 9 [31], since the NaOH concentration governs the APL’s solubility. From earlier results, it was seen that these enzymes were uninhibited at low (5 g/L) lignin concentrations and were soluble even with the lowest NaOH concentration used, i.e., 0.4% NaOH. Thus, the variable range was 0.4–2% NaOH concentration with 10 g/L APL. It was seen that at pH 10 with 2% NaOH concentration, the enzymes retained their ability to interact with the APL (Figure 5a), since these concentrations allow for very high lignin inputs (up to 200 g/L), and the next APL concentration’s effect on the enzymes was investigated.
To understand better the laccases’ effects on the APL in alkaline solutions with high lignin dosages, the complete dissolution of the APL was obtained, and the pH was adjusted with sulfuric acid. This was mainly because the APL itself affects the pH of the NaOH solution, where a higher lignin input reduces the pH. Otherwise, the lignin remains insoluble if put into a pH 10 NaOH solution. The results of the higher lignin dosages were obtained using ScLac; however, the other two (AmLac and SvLac) showed the same type of tendency in 0.1 M alkaline solutions, as shown in Figures S1 and S2. ScLac showed the optimal conversion at pH 10, and the enzymatic treatment effect decreased drastically with an increase in pH. The condition of 1% NaOH was chosen to accommodate a wide variety of lignin inputs in the range of 10–80 g/L, as seen in Figure 5b. It was observed that the ScLac showed the conversion of APL from 10 to 50 g/L and then reached a plateau at 60 g/L, where the activity was negligible. Hence, the effects measured can be correlated to a higher NaOH content, since 70 g/L can theoretically be achieved also with a 0.75% NaOH concentration. The various and well-known inhibitory mechanisms of the lignin in biomass have already been proposed and are well known [32,33,34]. It is reasonable to assume that the APL became the major limiting factor with the alkaline treatments.
Thus, 50 g/L at pH 10 (1% or 0.25 M NaOH) was considered to be the optimal condition for the ScLac treatment, which led towards lignin polymerization. The polymerization of lignin could be used in some applications; one such example was presented by Chunlin et al., which was a new perspective for valorizing polymerized lignin in biobased fiber products through the green processing of the solvent fractionation and enzymatic treatment, and further characterization was achieved [35].
In addition, it is to be noted that during the testing of the NaOH concentrations (Figure 5a), the effectiveness was reduced at the highest alkali load. However, in general, the effect seems to be quite mild, which is surprising. The main issue with higher alkali concentrations is that adding more H2SO4 is required for the pH adjustment, thus increasing the overall ionic strength in the solution, in the form of Na2SO4. These types of high salt concentrations can lead to enzyme inhibition through the loss of the quaternary structure of the enzyme, which is critical, as the trinuclear copper site is composed of neighboring polypeptides [36]. Instead, NaOH should be used in as low concentrations as possible, directly correlated to the target lignin input.
The oxidative degradation of lignin was known to occur in bleaching and has been applied to pulp to improve its brightness for decades [5,37]. These processes, although generating benzoquinones as products of lignin degradation, are generally focused on the degradation of lignin rather than the valorization and, thus, lack selectivity [38]. More recently, metal-catalyzed oxidation reactions of lignin model compounds have been reported; however, these studies are related to β-O-4′ lignin models [30]. Typically, the industry targets the most effective conditions, which in this case is the highest possible concentration of lignin.

3.4. FT-IR Specstra of ScLac-Treated and Nontreated (Control) APL

The FT-IR analysis of the ScLac-treated APL under the optimal conditions (i.e., 50 g/L in 0.25 M NaOH solution) was compared with the nontreated (control) APL to determine the changes in the functional properties. The FT-IR analysis results of the ScLac-treated and nontreated (control) APL are shown in Figure 6.
The characteristic band at 3403 cm−1 corresponded to the O-H stretching in the hydroxyl group of the phenolic and aliphatic groups of lignin [39]. The peak at 2937 cm−1 indicates the C–H stretching in the methyl and methylene groups. The detection of a new peak at 1656 cm−1 represents the carbonyl (C=O) group. Further, the stretches of C-O and C-C of the aromatic moieties of the lignin were observed at 1594 cm−1 [40]. The appearance of bands at 1328 and 1222 cm−1 was assigned to the presence of syringyl and guaiacyl units, and the peak at 837 cm−1 represents the plane C-H vibration of the guaiacyl units [22].
Compared with the untreated APL, the ScLac-treated APL displayed major changes in the signal from the 1600 to 1800 cm−1 region due to the enzymatic treatment. However, the overall spectra of the ScLac-treated APL were surprisingly similar to the spectra measured from the untreated. The sensitivity of the method was not high enough to be able to detect changes in the structure of different lignins; therefore, the semiquantitative spectra of the treated and untreated APL were measured.

3.5. Semiquantitative HSQC Spectra of Enzymatically Treated APL

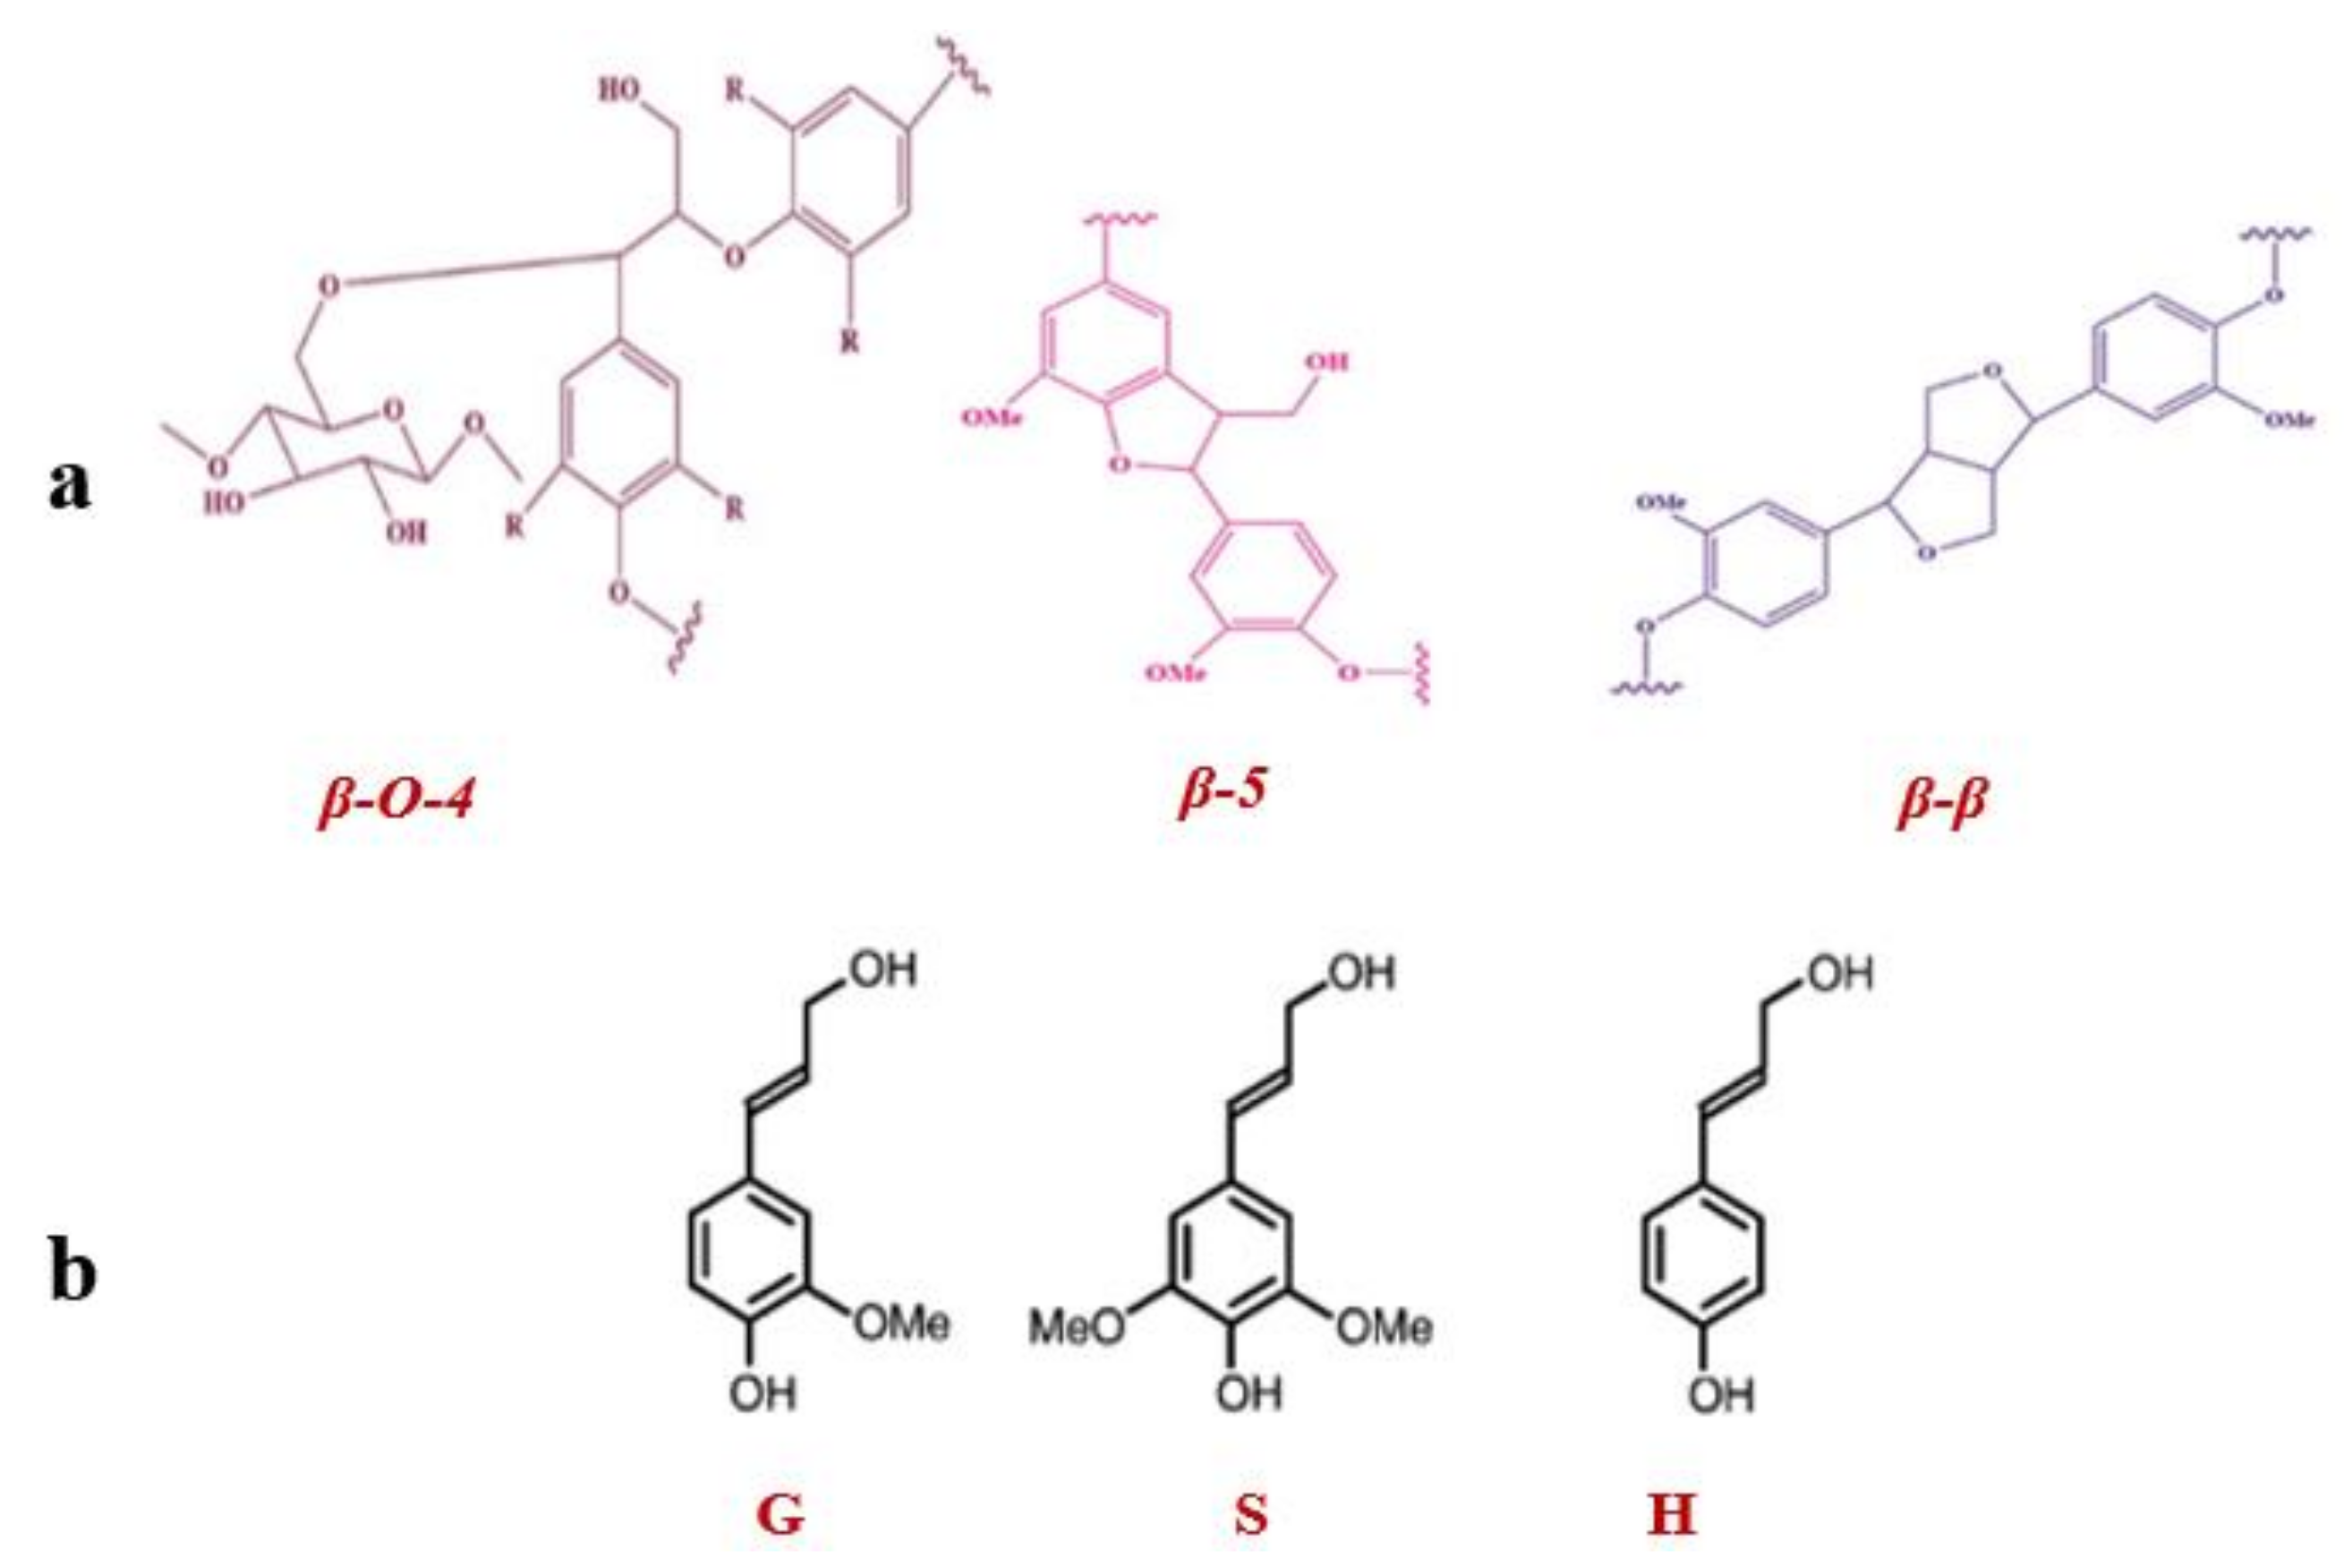
The enzymatic treatment of lignin by laccases at 50 g/L in pH 10 (1 % or 0.25 M NaOH) solution was considered the optimal condition and showed a change in the molecular weight but did not answer questions concerning the structural changes within lignin. Thus, the semiquantitative HSQC spectra of the ScLac-treated APL were compared with the untreated APL. The characteristic signals for the quantitation of the aliphatic and aromatic regions were chosen, as mentioned in Figures S3 and S4, by the integration of the Cα-Hα for the linkage types and C2,6-H2,6 for the aromatic subunit composition [41,42,43]. The 1H NMR (proton nuclear magnetic resonance) and the resulting data associated with the different types of interunit linkages and substructures present in the ScLac-treated and untreated APL can be seen in Figures S5–S7 and Table 4. In addition, a comparison of the APL correlation peaks with previously reported data is shown in Figure 7 and Table 5.
The notable changes are in the monomeric ratios of the S-G subunits and more prevalent is the change in the linkages, where we saw a major increase in the relative abundance of the β-O-4 linkage, by almost 20%. This seemed to arise mostly from a decrease in the β-β linkages; however, as it is a ratio-based method, there is a plethora of possibilities for other changes. These changes here could be correlated with the increase seen with the molecular weight distribution analysis, where these types of laccases induce the formation of highly reactive phenoxy radicals [44]. Thus, reactions could happen between the radicalized O- and other lignin OH groups, leading to the formation of new β-O-4 linkages. Finally, the catechol units were linked together with ether bonds, and both resorcinol and hydroquinone units were linked together with C-C bonds [45]. This, in addition, would lead to the formation of higher molecular weight lignin molecules, as described by Zhu et al. [18]. Not only can the phenoxy groups be affected, but on guaiacyl-type model compounds, different types of polymerization reactions were shown [10]. This, in turn, could explain the change seen in the monomeric distribution ratio. Laccases have been shown to play a part in lignin formation and polymerization; thus, it could be the major reaction seen here [35,46,47]. However, it must be noted that with heterogenous mixtures such as lignin, it is difficult to fully ascertain the mechanism behind the changes seen. This is also one of the main reasons why much of the work being conducted with laccases is carried out with model compounds.

4. Conclusions

The biological conversion of lignin is a promising method for lignin valorization. However, multiple challenges must be solved before the application of enzymes in an industrial setting. Here, we showed the enzymatic treatment of lignin by three bacterial laccases in industrially viable solutions with relatively high lignin concentrations. In addition, we showed that a more universal NaOH solution with high lignin solubilization can be used for enzymatic treatment, specifically with laccases. These conditions could be scaled up and be used for the development or discovery of novel depolymerization enzymes for lignins. However, as demonstrated in the past, lignin treatment with enzymes leads to oxidative polymerization of two major monomers, coniferyl alcohol, and sinapyl alcohol [22]. We propose that the research on enzymes should be biased towards robust systems with viability in the biorefinery concept, and the approach used here could be considered for future research.

Supplementary Materials

The following supporting information can be downloaded at: https://www.mdpi.com/article/10.3390/en16010370/s1, Figure S1. Change in APL molecular weights after AmLac treatment in 0.1 M NaOH solutions at different pH (9, 10, 11, and 12); Figure S2. Change in APL molecular weights after SvLac treatment in 0.1 M NaOH solutions at different pH (9, 10, 11, and 12). Figure S3: Aliphatic region HSQC spectra of APL (a) and ScLac-treated APL (b); Figure S4. Aromatic region HSQC spectra of APL (a) and ScLac-treated APL (b); Figure S5. H NMR spectra of untreated (control) APL; Figure S6: H NMR spectra of ScLac-treated APL.

Author Contributions

Conceptualization, K.K.P. and S.K.; methodology, S.K. and K.K.P.; data curation, K.K.P. and S.K.; writing—original draft preparation, S.K. and K.K.P.; writing—review and editing, T.K. and K.K.P.; visualization, K.K.P.; supervision, T.K., S.S. and T.L.; project administration, T.K. and M.L.; funding acquisition, M.L. All authors have read and agreed to the published version of the manuscript.

Funding

This research was supported by ERDF and the Estonian Research Council via project RESTA22 “Technologies for the Chemical and Enzymatic Valorization of Lignin: Products from Lignin and Its Phenolic Fragments—Starting Compounds for the Synthesis of Materials, Resins, Adhesives, Plastics, Building Materials”.

Data Availability Statement

The data that support the findings of this study are available from the corresponding author, Sharib Khan. All data generated or analyzed during this study are included in this article and its Supplementary Materials.

Conflicts of Interest

The authors declare no conflict of interest. The funders had no role in the design of the study; in the collection, analyses, or interpretation of data; in the writing of the manuscript; or in the decision to publish the results.

References

  1. Yu, O.; Kim, K.H. Lignin to materials: A focused review on recent novel lignin applications. Appl. Sci. 2020, 10, 4626. [Google Scholar] [CrossRef]
  2. Tofani, G.; Cornet, I.; Tavernier, S. Separation and recovery of lignin and hydrocarbon derivatives from cardboard. Biomass Convers. Biorefinery 2022, 12, 3409–3424. [Google Scholar] [CrossRef]
  3. Baruah, J.; Nath, B.K.; Sharma, R.; Kumar, S.; Deka, R.C.; Baruah, D.C.; Kalita, E. Recent trends in the pretreatment of lignocellulosic biomass for value-added products. Front. Energy Res. 2018, 6, 141. [Google Scholar] [CrossRef]
  4. Weng, C.; Peng, X.; Han, Y. Depolymerization and conversion of lignin to value-added bioproducts by microbial and enzymatic catalysis. Biotechnol. Biofuels 2021, 14, 84. [Google Scholar] [CrossRef]
  5. Tofani, G.; Cornet, I.; Tavernier, S. Estimation of hydrogen peroxide effectivity during bleaching using the Kappa number. Chem. Pap. 2021, 75, 5749–5758. [Google Scholar] [CrossRef]
  6. Mahmood, N.; Yuan, Z.; Schmidt, J.; Xu, C.C. Hydrolytic depolymerization of hydrolysis lignin: Effects of catalysts and solvents. Bioresour. Technol. 2015, 190, 416–419. [Google Scholar] [CrossRef] [PubMed]
  7. Svensson, I.; Roncal, T.; De Winter, K.; Van Canneyt, A.; Tamminen, T.; Mikkelson, A.; Barrio, A. Valorisation of Hydrolysis Lignin Rest from Bioethanol Pilot Plant: Process Development and Upscaling. Ind. Crops Prod. 2020, 156, 112869. [Google Scholar] [CrossRef]
  8. Sun, Z.; Fridrich, B.; De Santi, A.; Elangovan, S.; Barta, K. Bright Side of Lignin Depolymerization: Toward New Platform Chemicals. Chem. Rev. 2018, 118, 614–678. [Google Scholar] [CrossRef] [Green Version]
  9. Christopher, L.P.; Yao, B.; Ji, Y. Lignin biodegradation with laccase-mediator systems. Front. Energy Res. 2014, 2, 12. [Google Scholar] [CrossRef]
  10. Agustin, M.B.; de Carvalho, D.M.; Lahtinen, M.H.; Hilden, K.; Lundell, T.; Mikkonen, K.S. Laccase as a Tool in Building Advanced Lignin-Based Materials. ChemSusChem 2021, 14, 4615–4635. [Google Scholar] [CrossRef]
  11. Patel, A.; Shah, A.R. Integrated lignocellulosic biorefinery: Gateway for production of second generation ethanol and value added products. J. Bioresour. Bioprod. 2021, 6, 108–128. [Google Scholar] [CrossRef]
  12. Chio, C.; Sain, M.; Qin, W. Lignin utilization: A review of lignin depolymerization from various aspects. Renew. Sustain. Energy Rev. 2019, 107, 232–249. [Google Scholar] [CrossRef]
  13. Moreno, A.D.; Ibarra, D.; Eugenio, M.E.; Tomás-Pejó, E. Laccases as versatile enzymes: From industrial uses to novel applications. J. Chem. Technol. Biotechnol. 2020, 95, 481–494. [Google Scholar] [CrossRef]
  14. Berlin, A.; Balakshin, M. Industrial Lignins: Analysis, Properties, and Applications. In Bioenergy Research: Advances and Applications; Elsevier: Amsterdam, The Netherlands, 2014. [Google Scholar] [CrossRef]
  15. Osma, J.F.; Toca-Herrera, J.L.; Rodríguez-Couto, S. Cost analysis in laccase production. J. Environ. Manag. 2011, 92, 2907–2912. [Google Scholar] [CrossRef]
  16. Lee, S.; Kang, M.; Bae, J.H.; Sohn, J.H.; Sung, B.H. Bacterial Valorization of Lignin: Strains, Enzymes, Conversion Pathways, Biosensors, and Perspectives. Front. Bioeng. Biotechnol. 2019, 7, 209. [Google Scholar] [CrossRef] [Green Version]
  17. Bourbonnais, R.; Paice, M.G. Oxidation of non-phenolic substrates. FEBS Lett. 1990, 267, 99–102. [Google Scholar] [CrossRef] [Green Version]
  18. Zhu, D.; Liang, N.; Zhang, R.; Ahmad, F.; Zhang, W.; Yang, B.; Wu, J.; Geng, A.; Gabriel, M.; Sun, J. Insight into Depolymerization Mechanism of Bacterial Laccase for Lignin. ACS Sustain. Chem. Eng. 2020, 8, 12920–12933. [Google Scholar] [CrossRef]
  19. Balakshin, M.Y.; Capanema, E.A.; Sulaeva, I.; Schlee, P.; Huang, Z.; Feng, M.; Borghei, M.; Rojas, O.J.; Potthast, A.; Rosenau, T. New Opportunities in the Valorization of Technical Lignins. ChemSusChem 2021, 14, 1016–1036. [Google Scholar] [CrossRef]
  20. Aro, T.; Fatehi, P. Production and Application of Lignosulfonates and Sulfonated Lignin. ChemSusChem 2017, 10, 1861–1877. [Google Scholar] [CrossRef]
  21. Xue, Y.; Li, Y.; Liu, Z.; Hou, Y. Structural changes of lignin in soda delignification process and associations with pollution load. BioResources 2019, 14, 7869–7885. [Google Scholar] [CrossRef]
  22. Mattinen, M.L.; Suortti, T.; Gosselink, R.; Argyropoulos, D.S.; Evtuguin, D.; Suurnäkki, A.; De Jong, E.; Tamminen, T. Polymerization of different lignins by laccase. BioResources 2008, 3, 549–565. [Google Scholar] [CrossRef]
  23. Majumdar, S.; Lukk, T.; Solbiati, J.O.; Bauer, S.; Nair, S.K.; Cronan, J.E.; Gerlt, J.A. Roles of small laccases from streptomyces in lignin degradation. Biochemistry 2014, 53, 4047–4058. [Google Scholar] [CrossRef] [PubMed]
  24. Zovo, K.; Pupart, H.; Van Wieren, A.; Gillilan, R.E.; Huang, Q.; Majumdar, S.; Lukk, T. Substitution of the Methionine Axial Ligand of the T1 Copper for the Fungal-like Phenylalanine Ligand (M298F) Causes Local Structural Perturbations that Lead to Thermal Instability and Reduced Catalytic Efficiency of the Small Laccase from Streptomyces coelicolor A3 (2). ACS Omega 2022, 7, 6184–6194. [Google Scholar] [CrossRef]
  25. Ebihara, A.; Kawamoto, S.; Shibata, N.; Yamaguchi, T.; Suzuki, F.; Nakagawa, T. Development of a modified Britton-Robinson buffer with improved linearity in the alkaline pH region. Bioj. Sci. Technol. 2016, 3, 2016. Available online: http://www.bjst.bio-journal.com/2016/m15006/ (accessed on 20 February 2016).
  26. Hämäläinen, V.; Grönroos, T.; Suonpää, A.; Heikkilä, M.W.; Romein, B.; Ihalainen, P.; Malandra, S.; Birikh, K.R. Enzymatic processes to unlock the lignin value. Front. Bioeng. Biotechnol. 2018, 6, 20. [Google Scholar] [CrossRef] [PubMed] [Green Version]
  27. Khan, S.; Rauber, D.; Shanmugam, S.; Kay, C.W.M.; Konist, A.; Kikas, T. Efficient Lignin Fractionation from Scots Pine (Pinus sylvestris) Using Ammonium-Based Protic Ionic Liquid: Process Optimization and Characterization of Recovered Lignin. Polymers 2022, 14, 4637. [Google Scholar] [CrossRef] [PubMed]
  28. Dillies, J.; Vivien, C.; Chevalier, M.; Rulence, A.; Châtaigné, G.; Flahaut, C.; Senez, V.; Froidevaux, R. Enzymatic depolymerization of industrial lignins by laccase-mediator systems in 1,4-dioxane/water. Biotechnol. Appl. Biochem. 2020, 67, 774–782. [Google Scholar] [CrossRef] [PubMed]
  29. Zhang, S.; Xiao, J.; Wang, G.; Chen, G. Enzymatic hydrolysis of lignin by ligninolytic enzymes and analysis of the hydrolyzed lignin products. Bioresour. Technol. 2020, 304, 122975. [Google Scholar] [CrossRef]
  30. Chan, J.C.; Paice, M.; Zhang, X. Enzymatic Oxidation of Lignin: Challenges and Barriers Toward Practical Applications. ChemCatChem 2020, 12, 401–425. [Google Scholar] [CrossRef]
  31. Sewring, T.; Theliander, H. Acid precipitation of kraft lignin from aqueous solutions: The influence of anionic specificity and concentration level of the salt. Holzforschung 2019, 73, 937–945. [Google Scholar] [CrossRef]
  32. Li, M.; Pu, Y.; Ragauskas, A.J. Current understanding of the correlation of lignin structure with biomass recalcitrance. Front. Chem. 2016, 4, 45. [Google Scholar] [CrossRef] [PubMed] [Green Version]
  33. Dos Santos, A.C.; Ximenes, E.; Kim, Y.; Ladisch, M.R. Lignin–Enzyme Interactions in the Hydrolysis of Lignocellulosic Biomass. Trends Biotechnol. 2019, 37, 518–531. [Google Scholar] [CrossRef] [PubMed]
  34. Li, X.; Zheng, Y. Lignin-enzyme interaction: Mechanism, mitigation approach, modeling, and research prospects. Biotechnol. Adv. 2017, 35, 466–489. [Google Scholar] [CrossRef] [PubMed]
  35. Wang, L.; Tan, L.; Hu, L.; Wang, X.; Koppolu, R.; Tirri, T.; van Bochove, B.; Ihalainen, P.; Sobhanadhas, L.S.S.; Xu, C.; et al. On Laccase-Catalyzed Polymerization of Biorefinery Lignin Fractions and Alignment of Lignin Nanoparticles on the Nanocellulose SurfaceviaOne-Pot Water-Phase Synthesis. ACS Sustain. Chem. Eng. 2021, 9, 8770–8782. [Google Scholar] [CrossRef]
  36. Curran, L.M.L.K.; Pham, L.T.M.; Sale, K.L.; Simmons, B.A. Review of advances in the development of laccases for the valorization of lignin to enable the production of lignocellulosic biofuels and bioproducts. Biotechnol. Adv. 2021, 54, 107809. [Google Scholar] [CrossRef]
  37. Lange, H.; Decina, S.; Crestini, C. Oxidative upgrade of lignin—Recent routes reviewed. Eur. Polym. J. 2013, 49, 1151–1173. [Google Scholar] [CrossRef] [Green Version]
  38. Subbotina, E.; Rukkijakan, T.; Marquez-Medina, M.D.; Yu, X.; Johnsson, M.; Samec, J.S.M. Oxidative cleavage of C–C bonds in lignin. Nat. Chem. 2021, 13, 1118–1125. [Google Scholar] [CrossRef]
  39. Zhang, Z.; Yang, R.; Gao, W.; Yao, X. Investigation of [Emim][OAc] as a mild pretreatment solvent for enhancing the sulfonation efficiency of alkali lignin. RSC Adv. 2017, 7, 31009–31017. [Google Scholar] [CrossRef] [Green Version]
  40. Ibrahim, M.N.M.; Iqbal, A.; Shen, C.C.; Bhawani, S.A.; Adam, F. Synthesis of lignin based composites of TiO2 for potential application as radical scavengers in sunscreen formulation. BMC Chem. 2019, 13, 17. [Google Scholar] [CrossRef] [Green Version]
  41. Sette, M.; Wechselberger, R.; Crestini, C. Elucidation of lignin structure by quantitative 2D NMR. Chem. Eur. J. 2011, 17, 9529–9535. [Google Scholar] [CrossRef]
  42. Zikeli, F.; Vinciguerra, V.; D’Annibale, A.; Capitani, D.; Romagnoli, M.; Mugnozza, G.S. Preparation of lignin nanoparticles from wood waste for wood surface treatment. Nanomaterials 2019, 9, 281. [Google Scholar] [CrossRef] [PubMed] [Green Version]
  43. Ahmed, M.A.; Lee, J.H.; Raja, A.A.; Choi, J.W. Effects of gamma-valerolactone assisted fractionation of ball-milled pine wood on lignin extraction and its characterization aswell as its corresponding cellulose digestion. Appl. Sci. 2020, 10, 1599. [Google Scholar] [CrossRef] [Green Version]
  44. Arefmanesh, M.; Vuong, T.V.; Nikafshar, S.; Wallmo, H.; Nejad, M.; Master, E.R. Enzymatic synthesis of kraft lignin-acrylate copolymers using an alkaline tolerant laccase. Appl. Microbiol. Biotechnol. 2022, 106, 2969–2979. [Google Scholar] [CrossRef] [PubMed]
  45. Sun, X.; Bai, R.; Zhang, Y.; Wang, Q.; Fan, X.; Yuan, J.; Cui, L.; Wang, P. Laccase-catalyzed oxidative polymerization of phenolic compounds. Appl. Biochem. Biotechnol. 2013, 171, 1673–1680. [Google Scholar] [CrossRef]
  46. Hilgers, R.; Vincken, J.P.; Gruppen, H.; Kabel, M.A. Laccase/Mediator Systems: Their Reactivity toward Phenolic Lignin Structures. ACS Sustain. Chem. Eng. 2018, 6, 2037–2046. [Google Scholar] [CrossRef] [Green Version]
  47. Domínguez, G.; Blánquez, A.; Borrero-López, A.M.; Valencia, C.; Eugenio, M.E.; Arias, M.E.; Rodríguez, J.; Hernández, M. Eco-Friendly Oleogels from Functionalized Kraft Lignin with Laccase SilA from Streptomyces ipomoeae: An Opportunity to Replace Commercial Lubricants. ACS Sustain. Chem. Eng. 2021, 9, 4611–4616. [Google Scholar] [CrossRef]
Figure 1. Preparation of APL, enzymatic oxidation reactions, and the characterization steps.
Energies 16 00370 g001
Figure 2. The molecular weight distribution of the APL and HL was analyzed using SEC.
Energies 16 00370 g002
Figure 3. (a) AmLac, (b) SvLac, and (c) ScLac activities on APL at different pH (6, 8, an d10) in B&R buffer. Here, the weight average molecular weight (Mw), number average molecular weight (Mn), and polydispersity Index (PDI) values before and after the enzymatic treatments were divided with the control average molecular weight values (APL without laccase) to show the degree of enzymatic conversion.
Energies 16 00370 g003
Figure 4. Average molecular weights (Mn and Mw) and PDI ratio of the APL with and without ScLac in (a) 0.4% NaOH and (b) 1% NaOH solutions at increasing pH (9, 10, 11, and 12).
Energies 16 00370 g004
Figure 5. (a) ScLac inhibition at 2% (wt%) NaOH solution with 10 g/L lignin; (b) ScLac activity lost over 55 g/L lignin at 1% NaOH solution (pH 10).
Energies 16 00370 g005
Figure 6. FT-IR spectra of ScLac-treated (blue) and nontreated (black) APL.
Energies 16 00370 g006
Figure 7. (a) Major changes were quantified on interunit linkages, i.e., β-O-4, β-β, and β-5, (b) while small changes were seen on the main substructures G (coniferyl alcohol), S (sinapyl alcohol), and H (p-coumaryl alcohol) in the APL after the ScLac treatment.
Energies 16 00370 g007
Table 1. Average molecular weights and polydispersity index (PDI) of the HL and APL in KDa.
LigninMnMwPDI
HL0.668.897.2
APL0.536.867.6
Table 2. APL solubilization at different pH (6, 8, and 10) in B&R buffer and NaOH solution conditions (g/L).
pHB&R Buffer0.1 M NaOH Solution0.25 M NaOH Solution
612 ± 320 ± 325 ± 1
813 ± 422 ± 235 ± 2
1015 ± 428 ± 1.245 ± 5
Table 3. Mn, Mw, and PDI values (in KDa) of untreated (black) and ScLac-treated (red) APL at different pH (9, 10, 11, and 12) in 0.25 M and 0.1 M NaOH solutions.
EnzymeSolutionpHMnMwPDI
0.25 M NaOH Solution90.566.5711.74
0.8011.4614.19
100.566.8312.16
0.8612.9715.01
110.576.6711.67
0.769.6312.65
120.658.7013.27
0.658.2912.75
ScLac0.1 M NaOH Solution
90.536.3711.92
0.7211.1015.26
100.566.6311.78
0.8312.4715.02
110.526.3712.23
0.8412.0714.37
120.536.2311.83
0.526.1811.75
Table 4. Results of the HSQC analysis, the main subunits of lignin, as well as the linkages are shown as a % ratio of their integration signals.
Monomeric Ratio %S/G RatioInter-Unit Linkages %
GSHβ-O-4β-5β-β
ScLac treated22753371326
Control sample20773452543
Table 5. Signal assignments of the 13C–1H correlation peaks in the 2D HSQC NMR spectra of the isolated lignin fractions, according to Sette et al. and Zikeli et al. [41,42].
δCH (ppm)Assignment (Label)
104.1/6.64C2,6-H2,6 in syringyl units (S2,6)
107.0/7.05C2,6-H2,6 in sinapaldehyde units (SA2,6)
107.0/7.25C2,6-H2,6 in α-oxidized (Cα=O) syringyl units (S’2,6)
111.3/7.01C2-H2 in guaiacyl units (G2)
112.5/6.67C3,5-H3,5 in p-hydroxyphenyl units (H3,5)
112.6/7.49C2-H2 in oxidized guaiacyl units (G’2)
115.9/6.96 + 6.63C5-H5 and C6-H6 in guaiacyl units (G5, G6)
119.1/6.84C6-H6 in guaiacyl units (G6)
119.5/6.84C6-H6 in coniferaldehyde (CA6)
128.9/7.14C2,6-H2,6 in p-hydroxyphenyl units (H2,6)
Disclaimer/Publisher’s Note: The statements, opinions and data contained in all publications are solely those of the individual author(s) and contributor(s) and not of MDPI and/or the editor(s). MDPI and/or the editor(s) disclaim responsibility for any injury to people or property resulting from any ideas, methods, instructions or products referred to in the content.