Article

Investigation of the Selectivity of the Water Shutoff Technology

Department of Development and Operation of Oil and Gas Fields, Saint Petersburg Mining University, 199106 Saint Petersburg, Russia
*
Author to whom correspondence should be addressed.
Energies 2023, 16(1), 366; https://doi.org/10.3390/en16010366
Submission received: 12 November 2022 / Revised: 18 December 2022 / Accepted: 26 December 2022 / Published: 28 December 2022
(This article belongs to the Special Issue Modern Trends in Oil and Gas Industry)

Abstract

:
High water-cut oil production is one of the major issues in the petroleum industry. The present study investigates different profile control solutions, with an emphasis on selective methods and materials that mostly decrease the permeability of water-saturated reservoir areas. To achieve the selective water flow blockage in fractured porous media, the sodium silicate-based gel-forming composition was developed. The test procedure was created to assess selective and strength characteristics of the presented composition. According to the results of this procedure, adding polyatomic alcohols to the mentioned composition enhances its hydrophilic behavior in water-saturated rocks (work of adhesion increases from 117 to 129 mJ/m2) and reduces the hydrophobic behavior in oil-saturated rocks (work of adhesion drops from 110.3 to 77.4 mJ/m2). The selectivity of the composition performance is validated by its higher wettability of water-saturated reservoir rocks compared with oil-saturated; thus, the composition creates a more stable water shutoff barrier when entering the water zone in a formation. As a result of core flooding experiments in natural, fractured, porous core samples, the efficiency of the water blocking capacity of the composition was proved. In addition, these tests showed the selectivity of the composition because the permeability decrease in water-saturated core samples was higher than in oil-saturated ones. The experimental value of the selectivity coefficient was 152.14.

1. Introduction

A significant part of oilfields in Russia is proceeding to the last production stage, which includes the declining oil recovery and the water-cut growth. Consequently, maintaining the profitability of oil production gets more complicated under these conditions [1]. In this case, repair and insulation works are chosen as a solution because they allow both to decrease the expenses of lifting and processing the production water and to control fluid flows in the formation and the near-wellbore zone during the operation of oil and gas fields [2,3].
There are numerous technologies and chemical agents designed to manage the excessive water production in wells [4,5,6,7,8,9]. All these methods may be divided into selective and non-selective, depending on the mechanism of the water shutoff operation and the blocking agent used.
Non-selective water shutoff operations are based on simultaneous or consequent injections of several agents into a reservoir, so they form the water- and oil-insoluble precipitate as a result of chemical interactions or physicochemical processes. As an example, water shutoff operations using resins or cements influence the new-wellbore zone and reduce the relative permeability not only to water, but to oil as well. Consequently, the productivity of wells is undermined [7].
Selective water shutoff operations imply the agents that mostly enhance the filtration resistance in water-saturated reservoir zones [10,11,12]. The selective performance of chemical agents is derived from the differences in the filtration properties of formations and in the physicochemical characteristics of reservoir fluids (oil and water). Major groups of selective properties are presented in work [6]. According to this research, these groups can be described as in Figure 1.
The fact that the selective technologies do not require the additional downhole perforating is their main advantage. Therefore, selective methods and materials should be preferred when designing water shutoff operations [7].
However, despite the great variety of existing selective water shutoff technologies, a significant proportion of them could not gain popularity in the industry due to different drawbacks [13]. As an example, the water shutoff method based on the injection of supersaturated solid hydrocarbons solutions [14] was not widely used because these agents were quite difficult to obtain. The polyacrylonitrile (HIPAN) application [14,15] is limited by the salinity of the formation water and the injection water. Furthermore, stabilized water-in-oil emulsions [16,17], which aim at hydrophobization of water-saturated zones, failed to create the stable high-pressure gradient conditions of a water-blocking barrier [18]. Polyacrylamide-based gels with different crosslinkers are reported to be the most common water shutoff solutions [10,19], although some of their molecular chains may undergo destruction during the pumping processes that negatively affect the gel strength [20].
Injection of systems based on sodium silicate (liquid glass) is one of the most advanced and sophisticated types of water shutoff operations [21]. Not only are liquid glass-based systems tolerant of high pressure and temperature, but they are also non-toxic [10,20,22]. Considering the mentioned benefits, the sodium silicate-based composition was designed for the selective limitation of water influx in fractured porous formations. The inorganic chromium (III) salt acts as a crosslinking agent because it initiates the gelation throughout the volume of the initial system [23]. The mechanism of gelation in the designed system may be described as the following: chrome (III) cations react with silicate anions, causing their polymerization, and, as a result, the three-dimensional atomic structure is formed [24].
It is important to mention that the assessment methods for shutoff compositions are mostly based on the results of core flooding tests [25] and do not consider the interfacial processes, although these processes were studied during research on other enhanced oil recovery technologies [26].
This paper presents the substantiation of the selective abilities of the designed shutoff composition. To provide sufficient evidence, the series of experiments were conducted on the advanced equipment available at the Enhanced Oil Recovery Laboratory of the Mining University. As a result, the following features of the composition were experimentally evaluated:
  • adhesive capability,
  • impact on the permeability of oil- and water-saturated samples,
  • selectivity coefficient.

2. Materials and Methods

2.1. Materials

The designed shutoff composition consists of powdered sodium silicate (TS 2145-338-05133190-2008), chrome alum (GOST 4162-79), glycerol (GOST 6259-75) and water. These components have various applications in the oil and gas industry and may be easily found [27,28]. The chrome alum is reported to be an efficient crosslinking agent of polyacrylamide-based solutions [29,30]. According to patent research, the aforementioned components were not used together as a water shutoff solution. The distinguishing feature of the designed composition is its ability to undergo gelation throughout the volume; thus, the entire volume of the initial solution transforms into the plugging material.

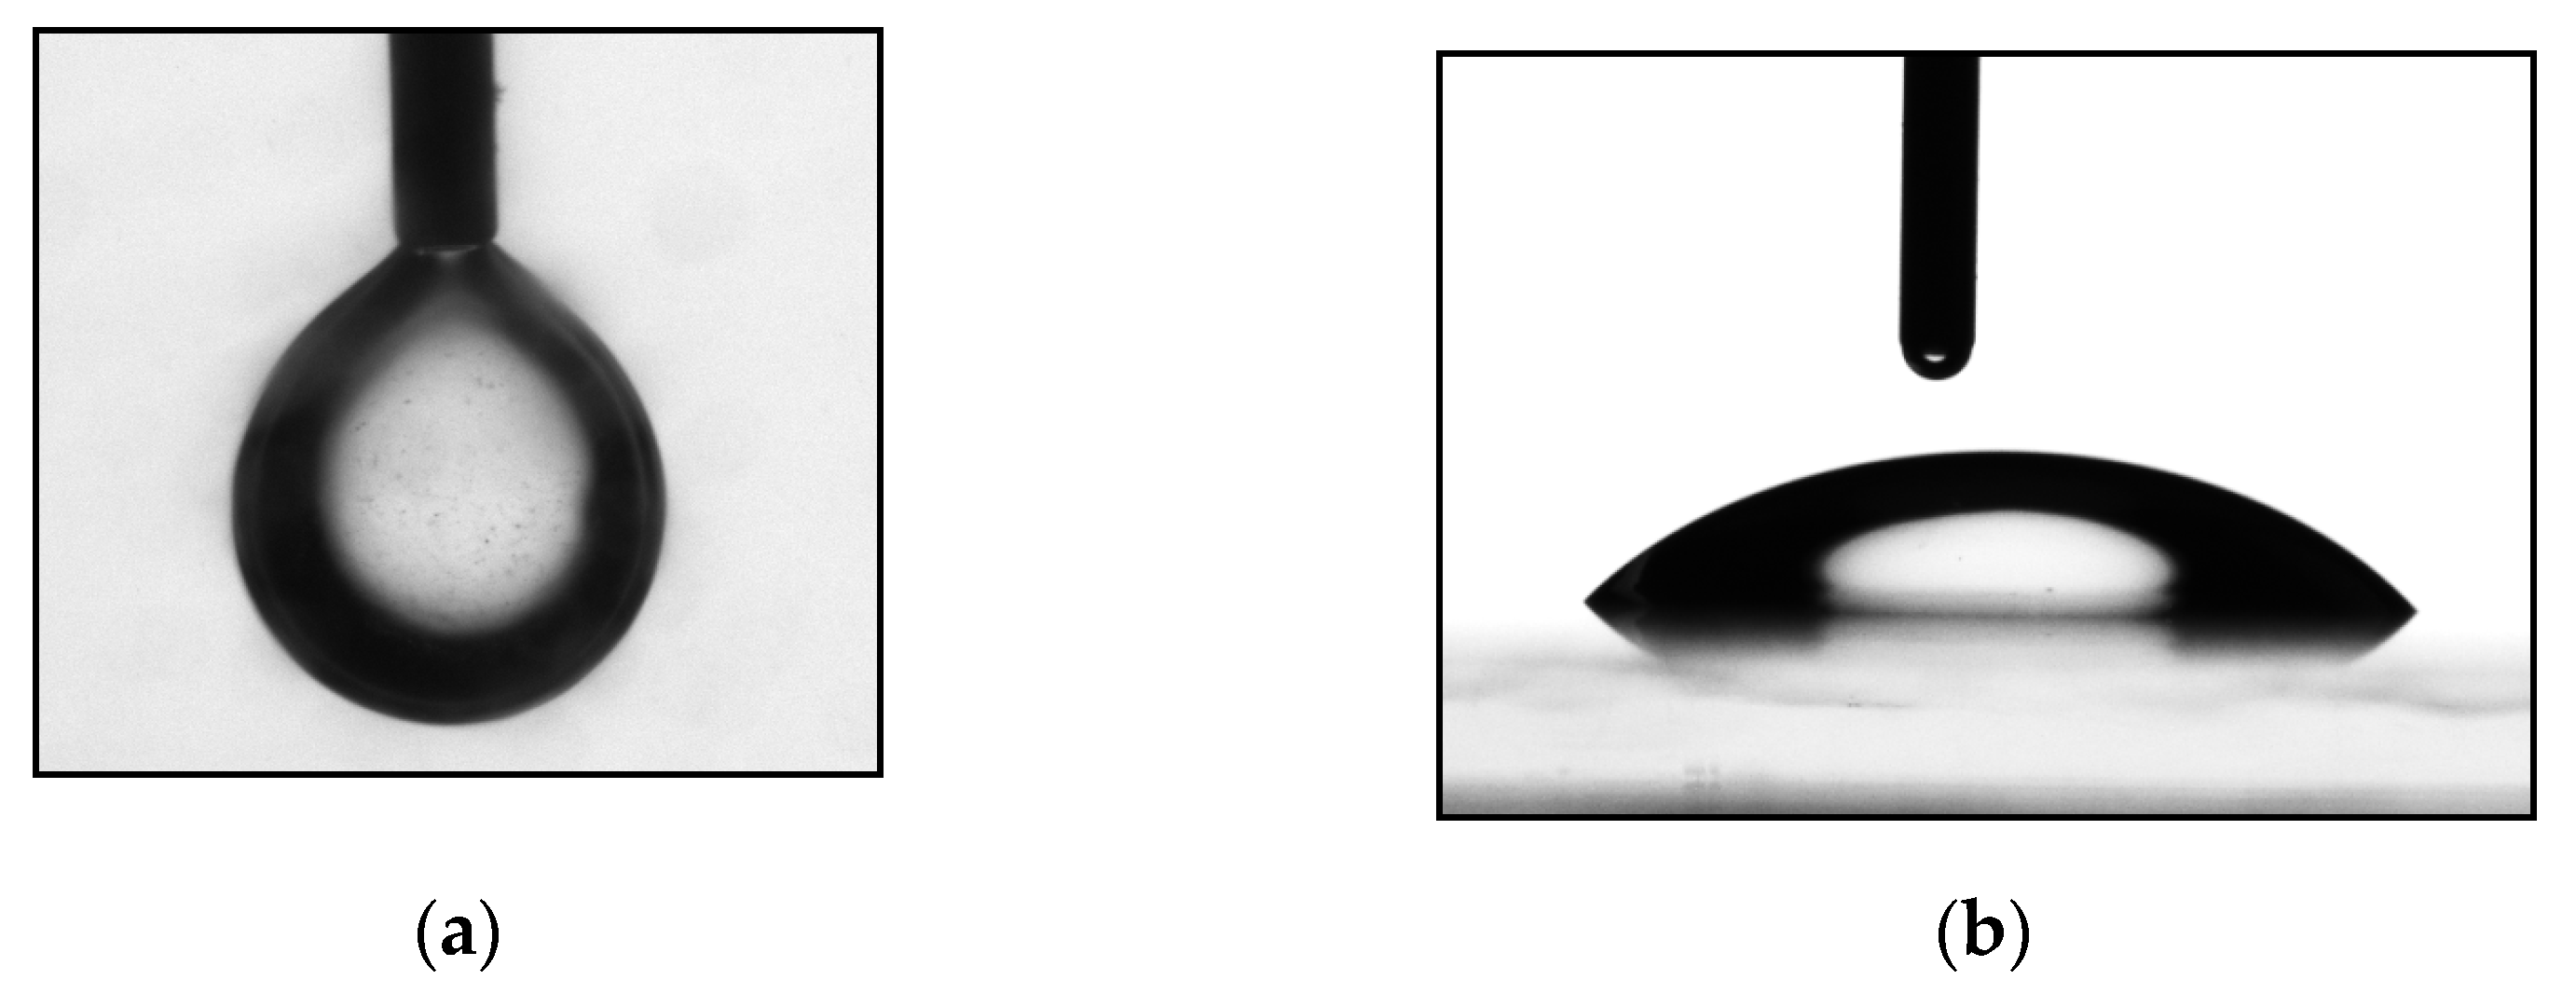
2.2. Evaluation of Adhesive Capability

Adhesion determines the wettability of surfaces, and it is defined as the work that is required to separate contacting phases (liquid and solid). The greater the work of adhesion, the better the wettability of a surface [31]. To calculate the work of adhesion, the Young–Dupré equation was applied (1) [32]:
W a = σ ( 1 + c o s θ ) ,
where Wa indicates the work of adhesion, J/m2; σ indicates the surface tension of the liquid-air interface, N/m; θ indicates the contact angle, deg.
The surface tension at the liquid-air interface of the designed composition was determined using the EASYDROP system, which provides measurements of the contact angle and surface/interfacial tensions (Figure 2). This system is intended for the evaluation of a droplet shape and the investigation of molecular surface properties of liquids and solids, and it is operated with DSA-209 computer software. The EASYDROP system also includes the camera that provides the droplet image and allows it to perform dynamic measurements of the surface tension and the contact angle. An illustration of the acting forces and the contact angle on the droplet of the composition is shown in Figure 3.
The surface tension may be evaluated by the shape and size of a drop hanging from a syringe needle, on the condition the drop is in the hydro-mechanical equilibrium [13].
The surface energy of solids is estimated by the contact angle calculations, which involve combinations of different equations for the interface tension with the Young–Dupré equation. Thus, cos(θ) is expressed independent of surface tensions between the solid and gas phases (σS), between the gas and liquid phases (σL), and between the liquid and solid phases (σSL) (Figure 3).
All evaluation approaches are based on the laying drop method, which means that the drop is located on the solid surface. The software uses the image of the drop on the surface to determine the contact angle by analyzing grey tone transitions to receive the actual shape of the drop and the contact line (baseline). In other words, the software calculates the square root of the second derivative of the luminance level to acquire points where the most noticeable luminance fluctuations occur. Next, the acquired shape of the drop is described by the suitable mathematical model, which is later used for the calculation of the contact angle. Overall, the methods of contact angle evaluation differ in the mathematical models used, which depend on the shape of the drop.
Either the entire shape of the drop or its part near the contact area is usually evaluated. All methods define the contact angle as the angle between a tangent to the drop surface and the solid surface at the point of their contact.
The contact angle of the designed composition was measured at the interface with oil- and water-saturated core samples.
The adhesive capability of the shutoff composition was estimated at oil- and water-saturated samples of Artinskian deposits. The composition including 7% sodium silicate and 3.5% chrome alum was infused with glycerol in different concentrations to vary the wettability of rock samples.

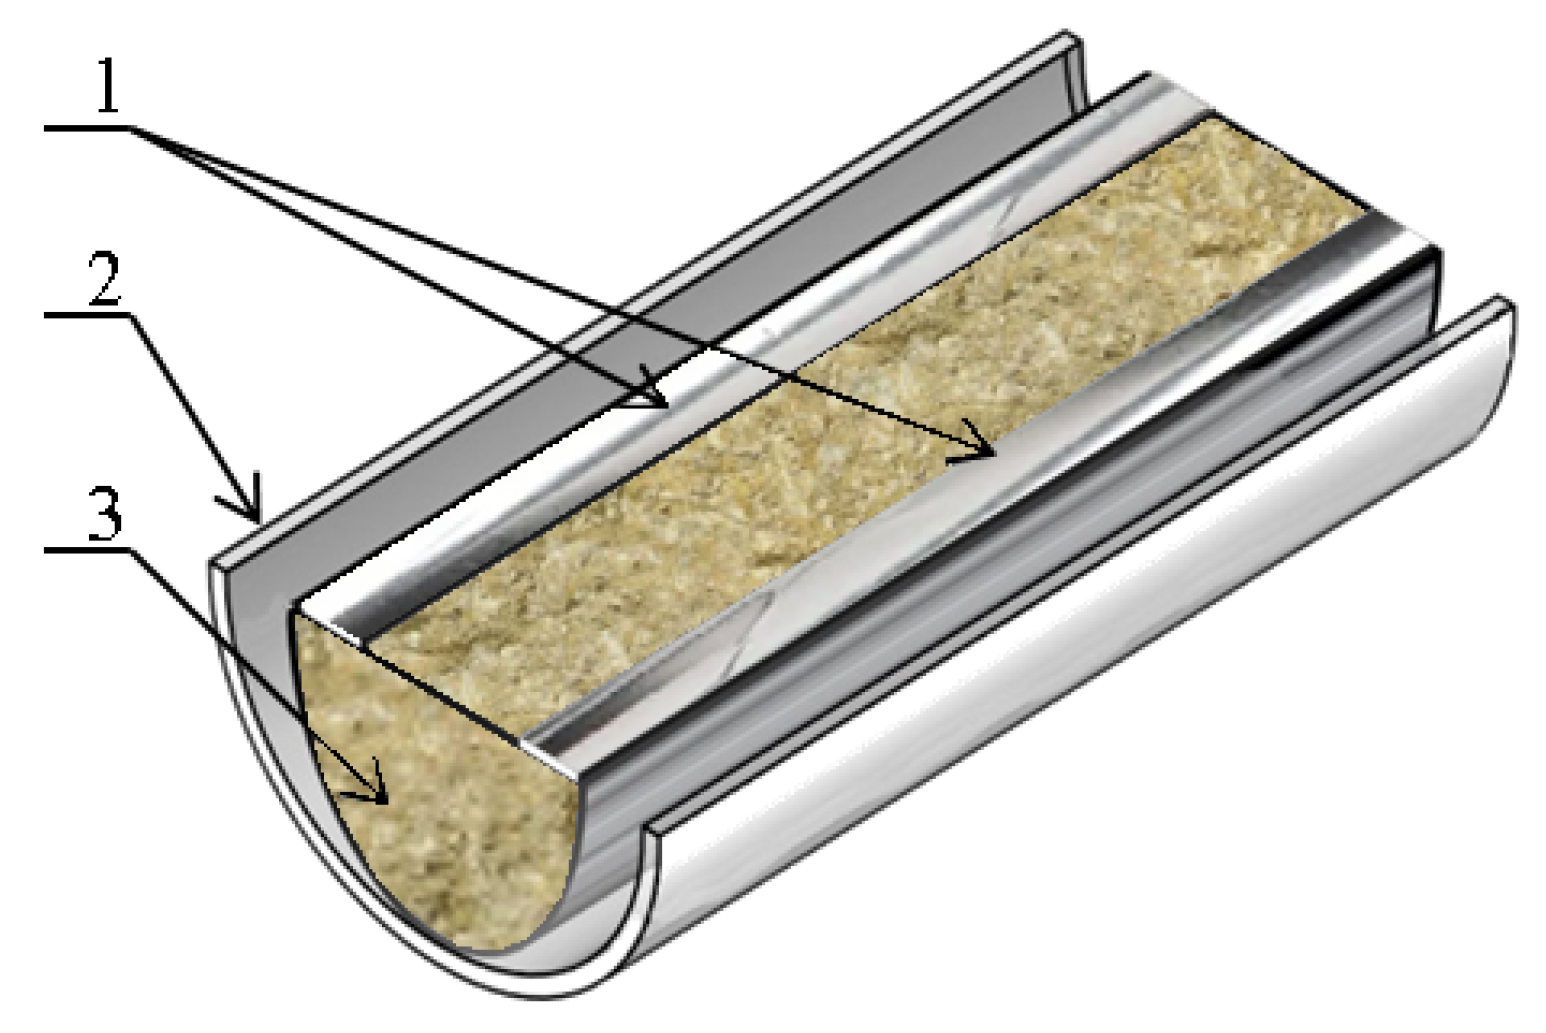
2.3. Preparation of Fractured Porous Core Samples

The series of core flooding tests were performed to estimate the possible impact of the designed composition on the filtration properties of water- and oil-saturated formations. Core samples and reservoir fluids preparation, as well as experiments management, were held in accordance with OST 39-195-86 “Oil. Laboratory method for determining water flood displacement efficiency” and OST 39-235-89 “Oil. Laboratory method for determining relative permeability in terms of simultaneous stationary filtration” [33].
Core flooding experiments were conducted on fractured porous core samples. To prepare the samples, a fracture in the carbonate core was artificially made, according to the following methodology (Figure 4):
  • the core is cut into equal halves;
  • two strips of three-layer aluminum foil 5 mm in width are put on the cut surface;
  • the core halves are connected, placed into a heat shrink sleeve and then tightened with a hot air gun.

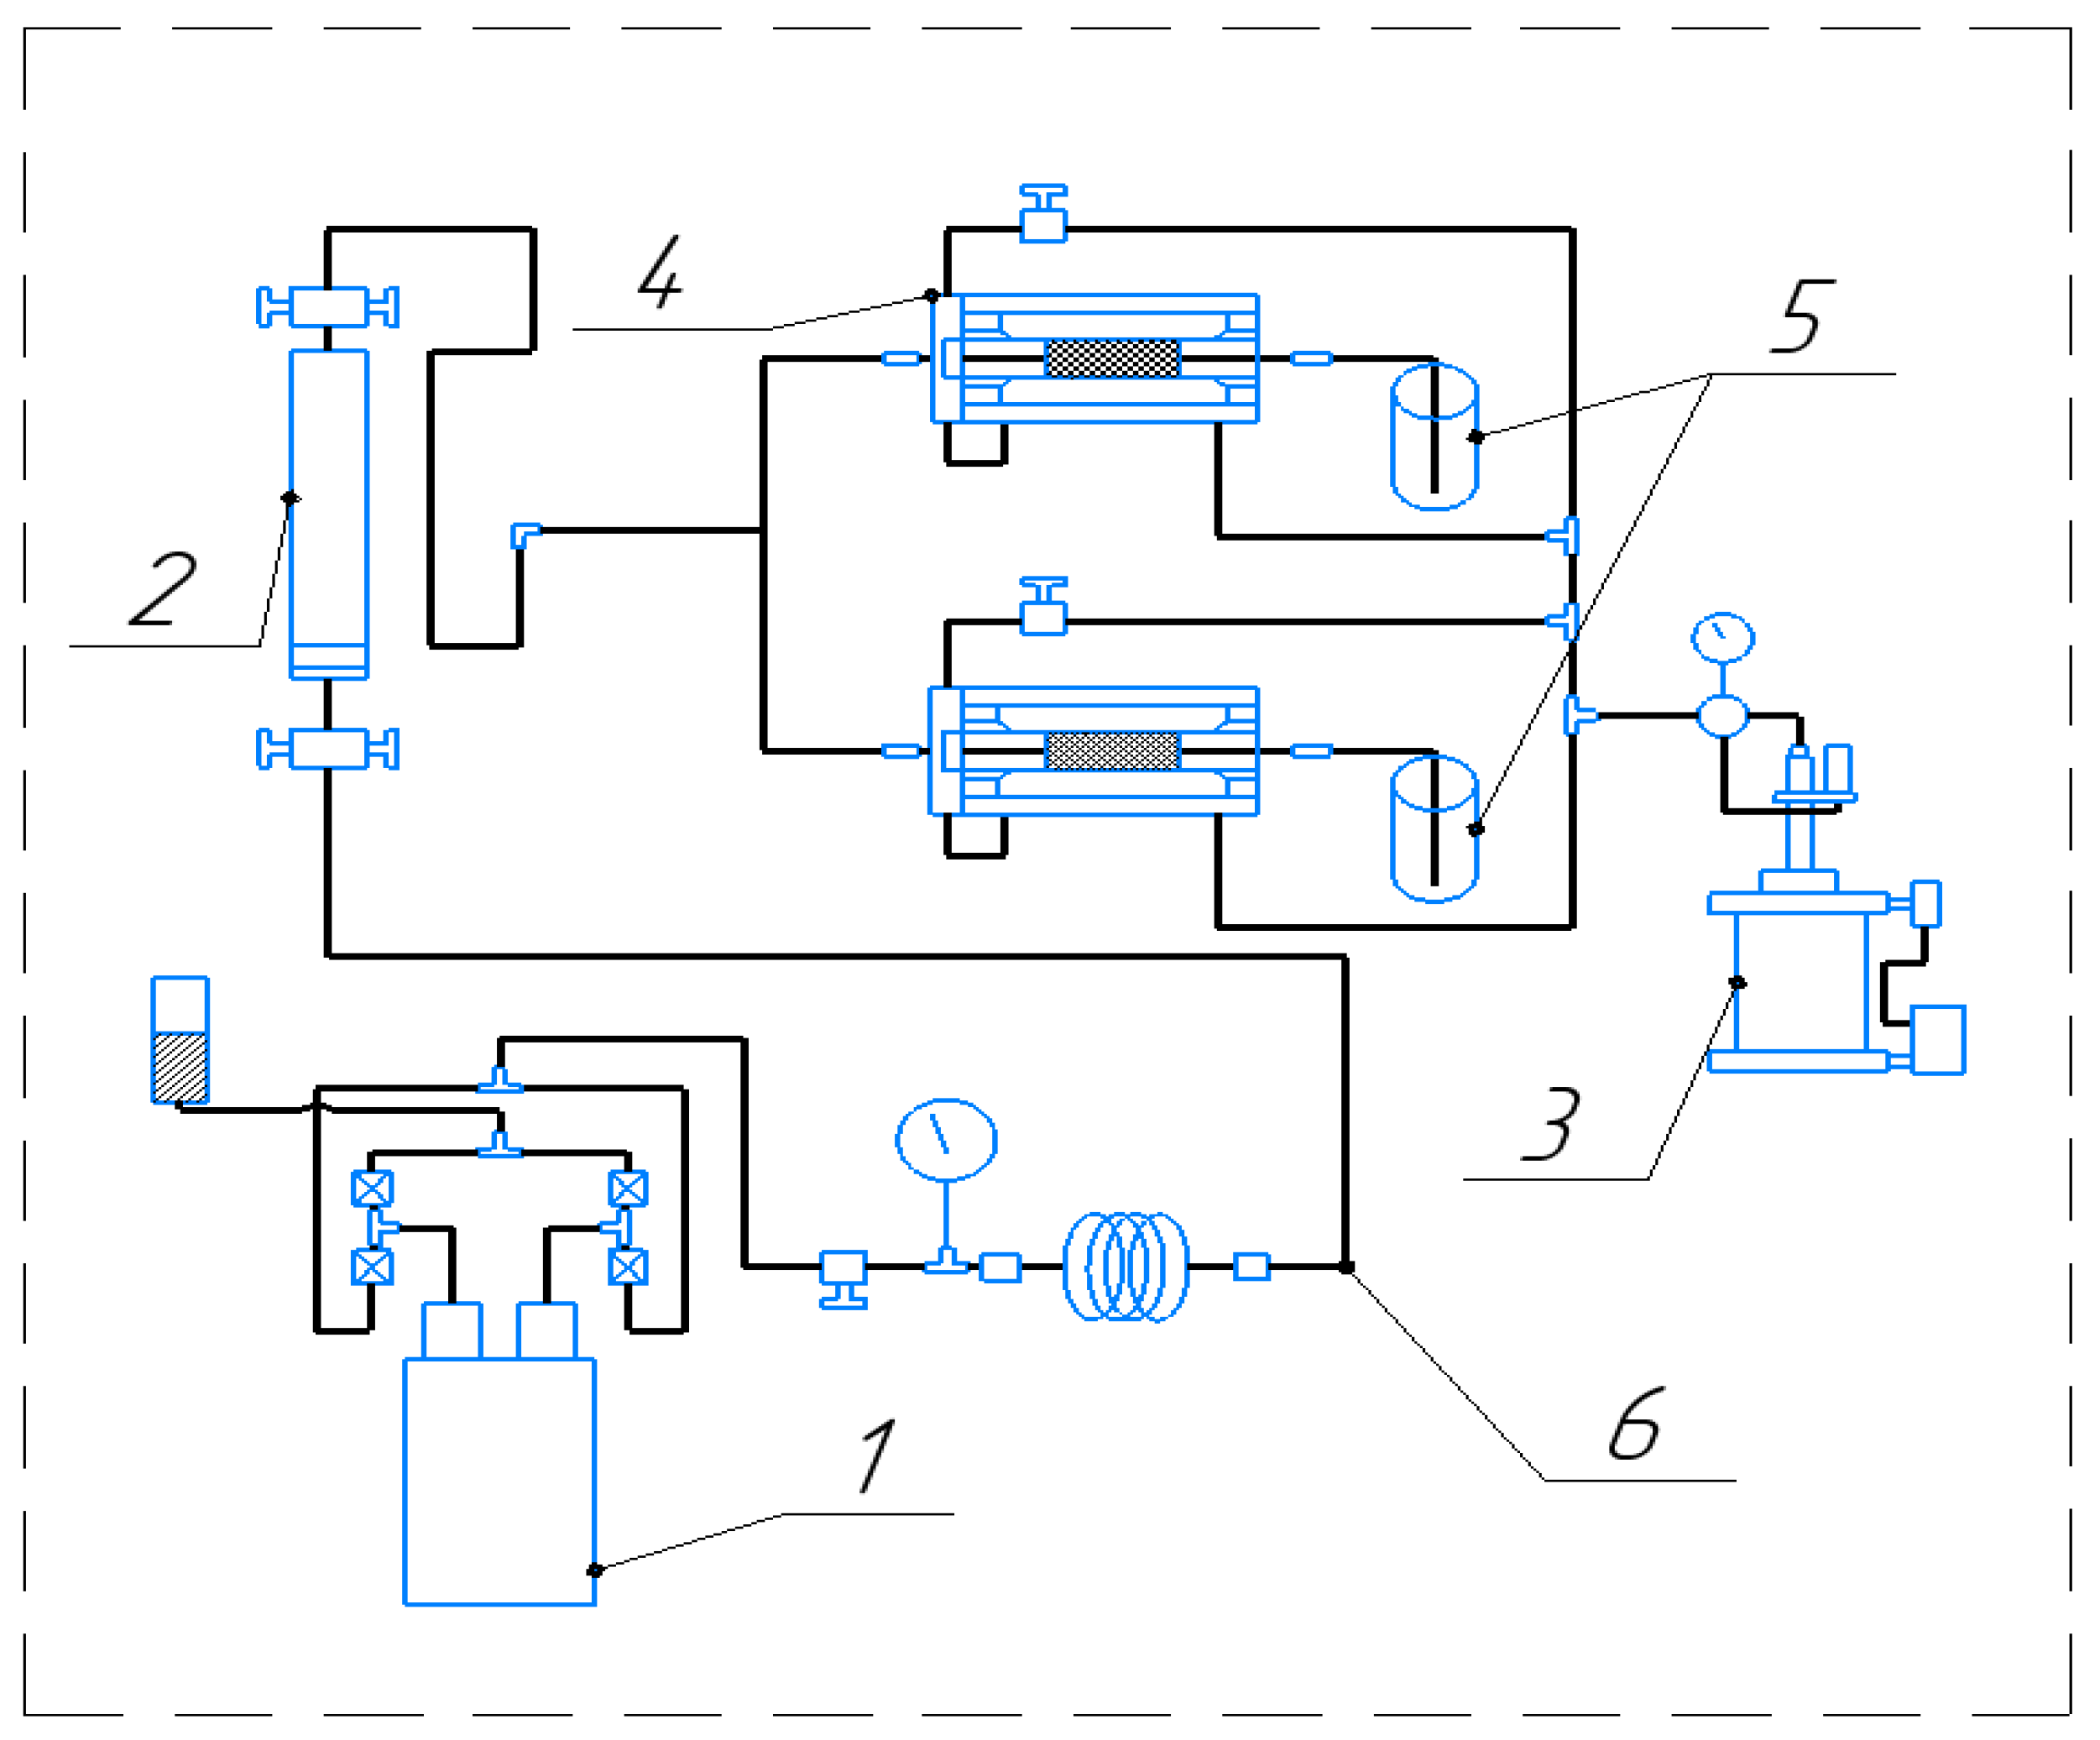
2.4. Shutoff Efficiency Evaluation in Single Core Sample Experiment

Core flooding tests were conducted using the FDES-645 unit (CoretestSystems, Morgan Hill, CA, USA). Its range of functions allows carrying out different types of experiments that involve a core sample flooding at high temperature and pressure [34,35].
During the experiment, fluids were injected at a constant flow rate, and fluctuations in differential pressure were recorded, whereas the differential pressure behavior was used to calculate changes in water or oil mobility after the injection of the shutoff composition [25,26,36,37]. The direction of flow in core samples was managed to match the real flow behavior of the reservoir and injected fluids in production wells. The forward filtration corresponded with the inflow from a formation to a well, and, consequently, it modeled the well operation process. Therefore, the reverse filtration included the injection of 5 pore volumes of the designed composition, and it acted as the model for the shutoff operation in the water-saturated near-wellbore zone [26,38,39,40].
Core sample permeability in all experiments was calculated according to Darcy’s law:
k = μ L Q S Δ P
where k indicates the permeability of the core sample, m2; μ indicates the dynamic viscosity, Pa∙s; L indicates the length of the core sample, m; Q indicates the preset volumetric flow rate, m3/s; S indicates the cross-sectional area of the core, m2; ΔP indicates the pressure drop at the respective flow rate, Pa.
The core flooding experiment procedure was the following:
  • The prepared core sample was vacuumed and saturated with preset brine water acting as reservoir water. After the sample was fully saturated, the pore volume was calculated by weighing the sample and measuring its mass change.
  • The saturated core sample was placed into the sample holder of the FDES-645 unit, which later created pressure close to the reservoir one.
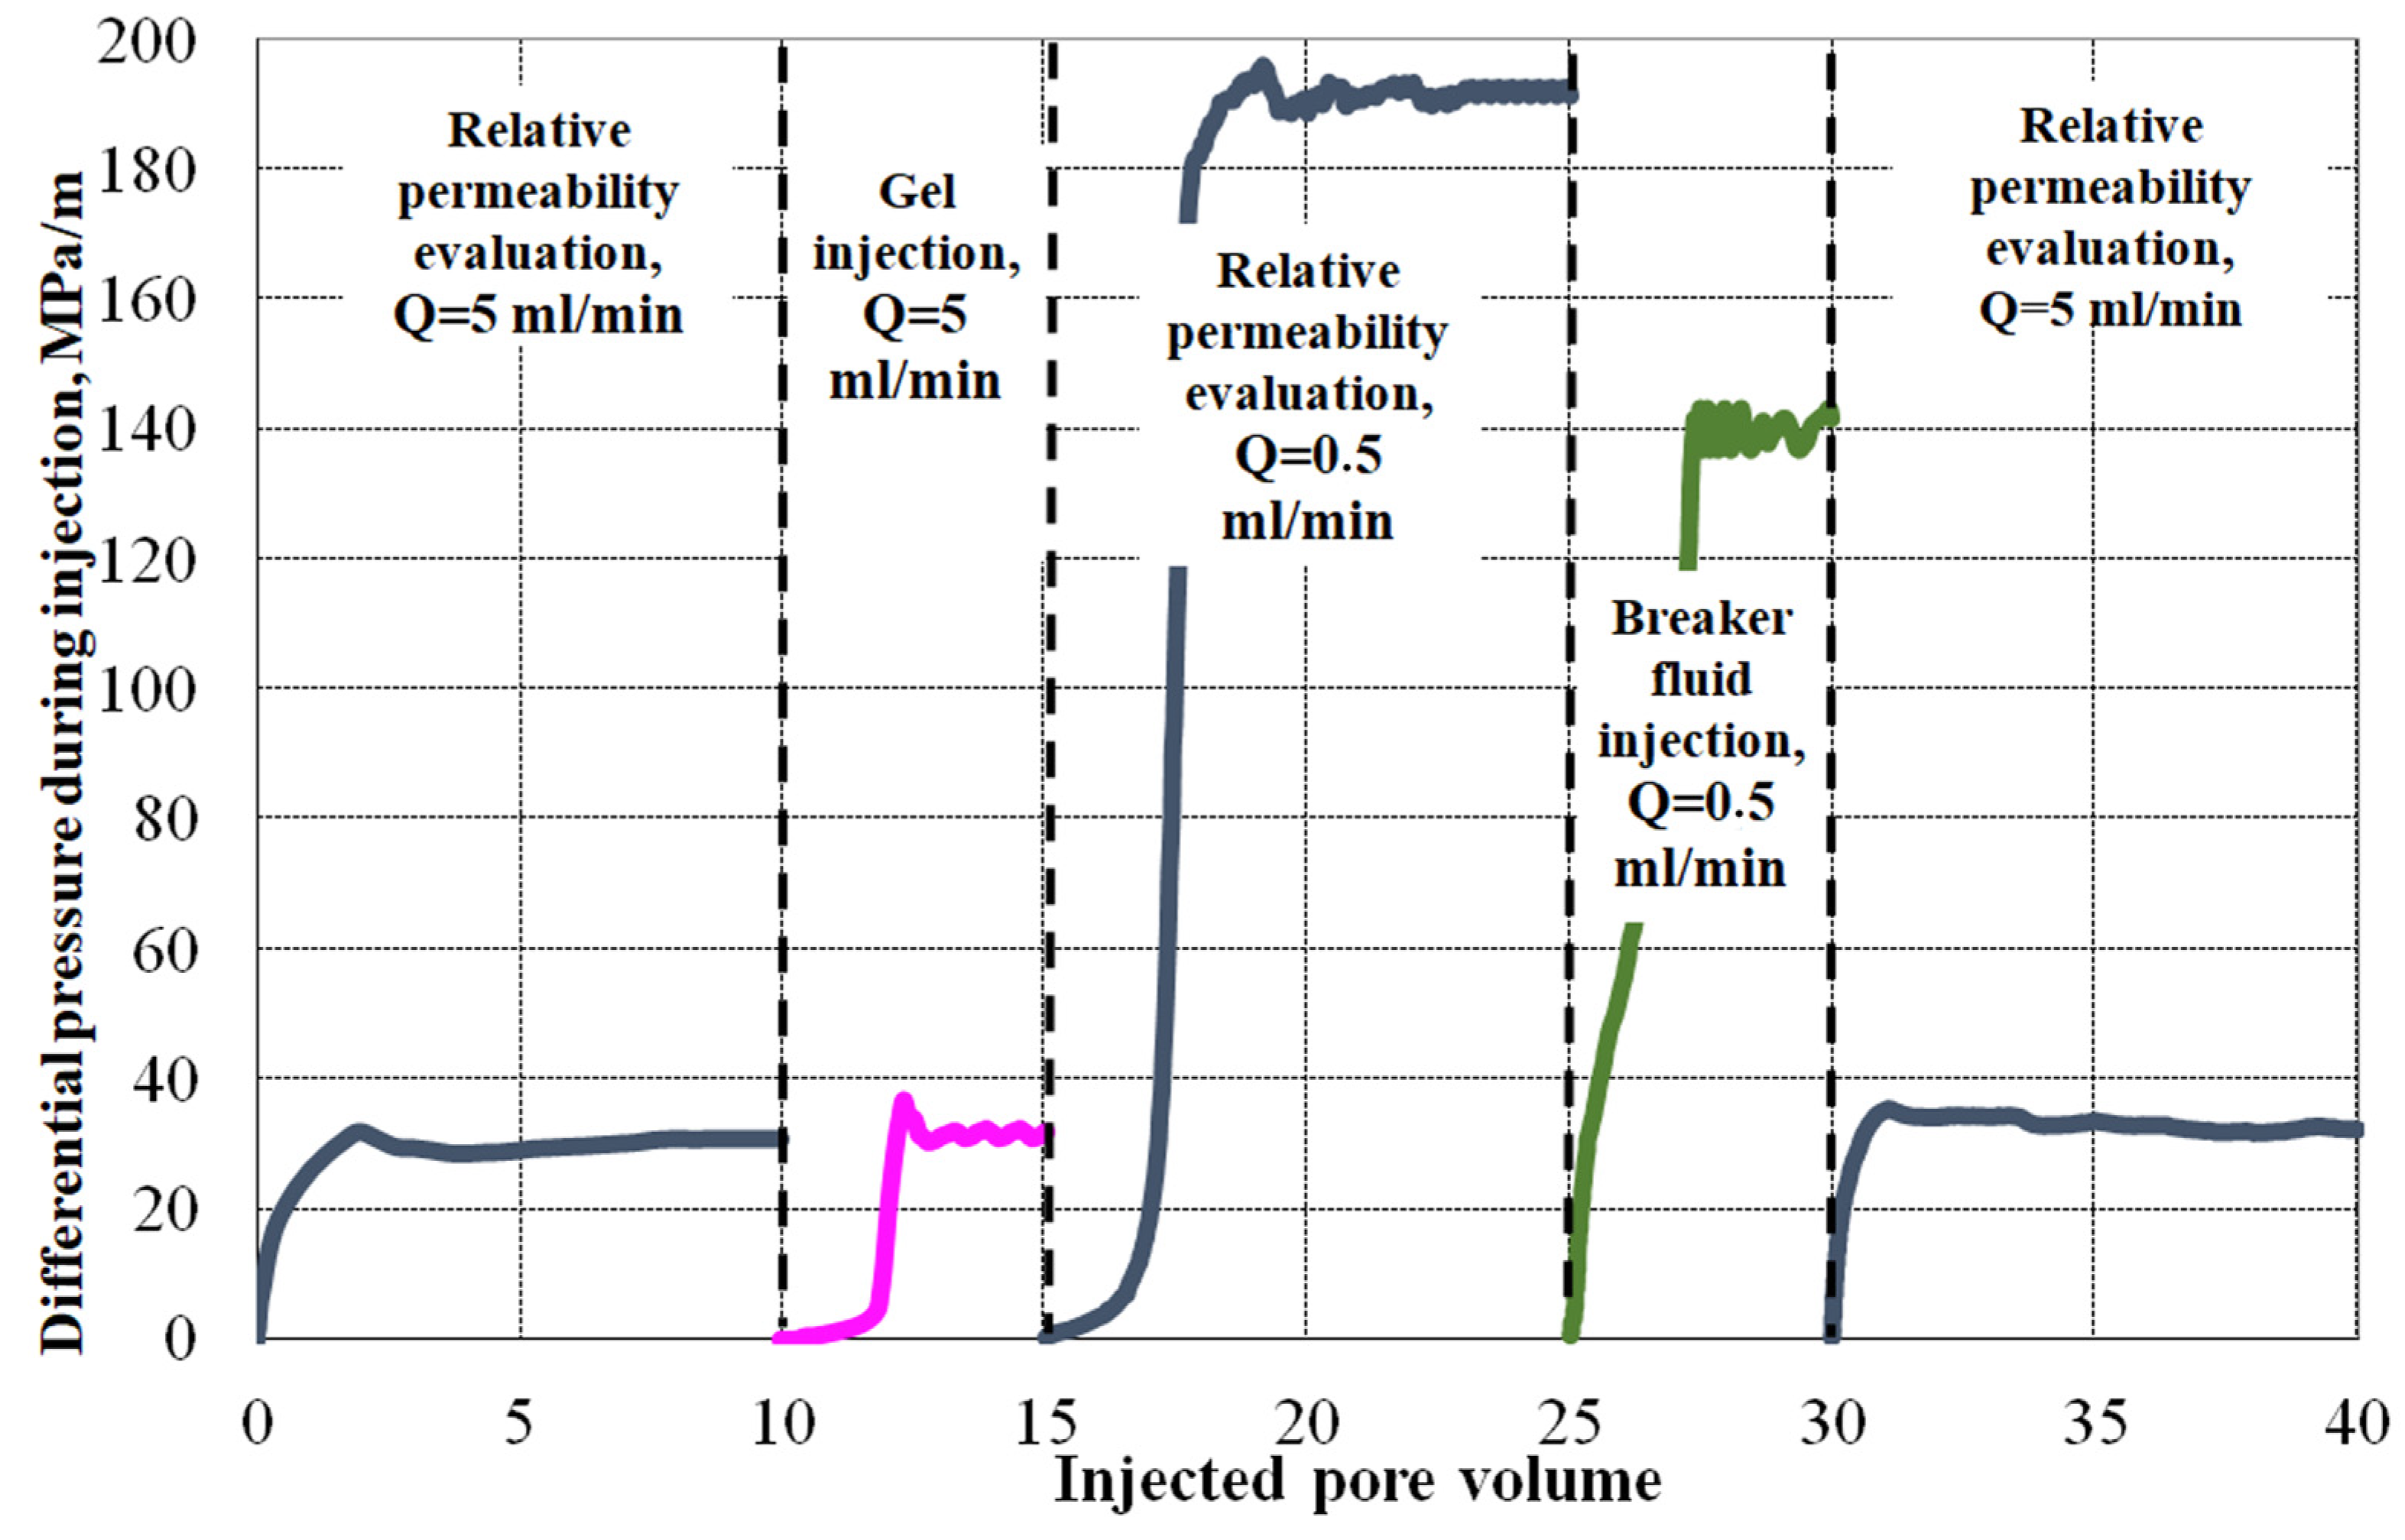
  • The preset water (or oil, in the case of oil-saturated formation modeling) was injected into the core sample. Simultaneously, its relative permeability to brine water at a constant flow rate was measured until the differential pressure stabilization. The applied pressure was the same as the reservoir pressure, the temperature was normal, and the flow direction was considered “forward”.
  • After switching the flow direction to “reverse”, 5 pore volumes (or the maximum volume possible at high pressure) of the shutoff composition were injected into the core sample. The volume of injected fluid was measured by scales at the rear side of the core.
  • When the injection of the gel was finished, the core sample was heated up to the average reservoir temperature (37 °C), and the system was left quiescent for 24 h (on average) in constant PT conditions.
  • Next, the brine water was injected in the “forward” direction, and the relative permeability of the core sample to water was gauged again at a constant flow rate until the differential pressure stabilization.
  • After that, the flow direction was changed to “reverse” and 5 pore volumes of the breaker fluid (20% sodium hydroxide solution) were injected.
  • At the end, the flow direction was switched back to “forward”, and the final relative permeability to water was measured at a constant flow rate until the differential pressure stabilization.
Experimental data were processed as follows:
  • Differential pressure values and mobility of brine water (or oil) were evaluated before and after the injection of the shutoff composition, and they were used to calculate the relative permeability to brine water (or oil) before and after the injection;
  • The differential pressure values during the first and the last (5th) pore volume injections of the shutoff composition were recorded;
  • The initial differential pressure of gel displacement was recorded at the final stage of the flooding experiment;
  • The differential pressure values after the first and the last (5th) pore volume injections of the breaker fluid were recorded;
  • The differential pressure of the water (or oil) injection was recorded at the final stage of the flooding experiment;
  • The residual resistance factor of the core sample was calculated by the following equation:
R r e s 1 = g r a d P 2 g r a d P 1 ,
where R1res indicates the residual resistance factor after the shutoff composition injection; gradP1 indicates the differential pressure of the water (oil) injection before the “shutoff operation”, Pa/m; gradP2 indicates the differential pressure during water (oil) injection after the “shutoff operation”, Pa/m;
  • The maximum resistance factor of the core sample after the injection of the designed composition was evaluated by the following equation:
R max 1 = g r a d P 3 g r a d P 1 ,
where R1max indicates the maximum resistance factor after the injection of the shutoff composition; gradP3 indicates the initial (maximum) differential pressure of gel displacement during the water (oil) injection, Pa/m;
  • The residual resistance factor of the core after the breaker fluid injection was calculated by the following equation:
R r e s 2 = g r a d P 4 g r a d P 1 ,
where R2res indicates the residual resistance factor after the breaker fluid injection; gradP4 indicates the differential pressure of the water (oil) injection after the exposure to the breaker fluid, Pa/m.

2.5. Selectivity Evaluation in Dual Core Sample Experiment

To evaluate the selectivity of the designed composition, a special core flooding experiment was performed. It included two parallel core holders connected with the FDES-645 unit; the schematic of the setup is shown in Figure 5. One of the core samples acted as an oil-saturated formation, another was a model for a water-saturated fractured formation, and both were placed into sample holders. During the flooding experiment, the flow rate was maintained constant at changing differential pressure.
The flooding experiment was mostly similar to one described in chapter 2.4. However, the following steps were added:
  • 5 pore volumes of the shutoff composition were simultaneously injected into both core samples at a constant flow rate, and the volume of fluids displaced from oil- and water-saturated cores was measured.
  • After that, the flow direction was changed to “reverse”, and 5 pore volumes of the breaker fluid (20% sodium hydroxide solution) were simultaneously injected into both core samples.
The experimental data were processed as it was described in chapter 2.4 for both oil- and water-saturated samples. In addition, the selectivity coefficient was calculated:
K S = R 2 R 1 ,
where KS indicates the selectivity coefficient; R1 indicates the residual resistance factor of the oil-saturated core; R2 indicates the residual resistance factor of the water-saturated core.

3. Results

Table 1 and Table 2, as well as Figure 6, show the results of calculating the composition’s work of adhesion at oil- and water-saturated rock samples, regarding varying glycerol concentration. The work of adhesion was determined by Equation (1).
According to Table 2 and Figure 6, rising glycerol concentration results in increasing work of adhesion in the water-saturated rock sample and lowering it in the oil-saturated rock sample. A 3% glycerol concentration was found to be the best possible because the work of adhesion did not significantly change after the addition of a greater amount of glycerol.
The higher adhesive capability of the shutoff composition to water-saturated rock sample in comparison with the oil-saturated one is the indirect indicator of the gel’s selectivity, i.e., better contact allows it to create a stronger shutoff barrier in the water-saturated zone [37]. To validate these assumptions and to estimate the shutoff composition’s impact on a formation, two flooding experiments were performed.
Experiments were conducted on oil- and water-saturated, natural, fractured, porous core samples. Figure 7 and Figure 8 and Table 3 and Table 4 present the results of the tests. The residual resistance factor was calculated according to Equations (3)–(5).
According to experimental results, it may be noticed that the gel composition easily invades fractures of both oil- and water-saturated rocks. Differential pressure after injecting and stabilizing the shutoff composition reached 59 MPa/m for the oil and 192 MPa/m for the water, which leads to a high residual resistance factor in oil- and water-saturated samples. To restore the permeability, 20% sodium hydroxide solution was injected into samples, followed by another measurement of permeability. After the breaker fluid injections, the permeability of the water-saturated sample increased from 1.19·10−3 to 7.40·10−3 μm2. Similarly, the permeability of the oil-saturated sample improved from 3.50·10−3 to 267.59·10−3 μm2. These results confirm the possibility of the partial disintegration of the shutoff barrier in situ. It is noticeable that the filtration properties of the oil-saturated sample were almost completely restored after being exposed to the breaker fluid, while the residual resistance factor of the water-saturated sample was higher on the grounds of the gel’s better adhesive capability to water-saturated (hydrophilic) rocks.
To support this suggestion, an additional experiment on estimating the selective effect of the designed composition was performed. The experiment involved a special set-up containing two parallel core holders and the filtration equipment. Core samples used in this experiment had pre-made fractures with the same apertures. They were placed into holders, the next one of them was saturated with oil, and another one with water.
The experiment included the following stages: evaluating initial relative permeabilities to oil and water; simultaneously injecting 5 pore volumes of the gel composition into core samples; leaving core samples quiescent for 12 h; again, measuring relative permeabilities to oil and water; simultaneously injecting 5 pore volumes of breaker fluid (sodium hydroxide solution) to restore the permeability of the oil zone; evaluating final relative permeabilities to oil and water.
After the flooding experiment, relative permeabilities to oil and water for each sample were determined, and changes in the permeability coefficient, residual resistance factor and selectivity coefficient were estimated.
Figure 9 and Table 5 show the results of the experiment. The residual resistance factor was determined by Equations (3)–(5), and the selectivity coefficient was calculated by Equation 6.
Overall, the sodium hydroxide injection resulted in an 85% improvement in the permeability of the oil-saturated sample, as it reached 101.6·10−3 μm2 with an initial value of 120.98·10−3 μm2. The permeability of the water-saturated sample grew slightly, in comparison with its value after the gel injection, and came to 1.3·10−3 μm2 starting from 234.96·10−3 μm2.
According to the selectivity coefficient calculations, the hydrodynamic resistance after injecting the composition increased in the water-saturated sample 55.55 times more than in the oil-saturated one. Injection of sodium hydroxide solution allowed raising this proportion up to 152.14.
The processed experimental data substantiated the ability of gel composition to effectively lower the permeability of water-saturated fractured porous core samples to a greater extent than oil-saturated ones. In addition, it was proved possible to minimize the damage caused to the filtration properties of the oil-saturated sample by injecting a hydroxide solution. At the same time, the hydroxide solution injection did not appear to improve the permeability of the water-saturated zone.
Finding the sufficient amount of composition to be injected is vital for ensuring the success of fluid diversion operations [12,25]. If a smaller amount is injected, the operation’s effectiveness may deteriorate.
The differential pressure values that the gelated composition may endure without displacement were evaluated by the results of flooding tests. Considering that these values may be lower in situ, the initial differential pressure of gel displacement is suggested to be taken as 5 MPa/m.
The amount of composition should be sufficient to ensure the formation of a shutoff barrier that is stable under the differential pressure fluctuations during well operation and completion. The parameters of the gel injection are suggested to be determined by Equations (7)–(9). Figure 10 shows the schematic of the near-wellbore zone with gel composition injected.
R b min Δ P g r a d ( P d i s p ) + R w ,
where Rb indicates the radius of the forming barrier, m; grad(Pdisp) indicates the differential pressure of gel displacement, Pa/m; ΔP indicates the maximum expected pressure drawdown, Pa; Rw indicates the wellbore radius, m.
The minimum volume of shutoff composition required to limit water flow in fractured formations is calculated by the following equation:
V M I N 1.1 π ( ( R b M I N ) 2 R w 2 ) h Γ δ ,
where VMIN indicates the minimum volume of shutoff composition required to form a strong barrier, m3; 1.1 indicates the assurance factor, which considers gel losses; π = 3.1415…, which indicates the mathematical constant; Rb indicates the radius of the forming barrier, m; Rw indicates the wellbore radius, m; h indicates the length of the zone that is required to be blocked, m; Г indicates the fracture intensity (determined by dividing the number of fractures by the length of normal line to surfaces creating fractures), 1/m; δ indicates the fracture aperture (medium perpendicular width of fracture), m.
It is essential to consider the gelation kinetics of the composition in relation to the reservoir temperature when performing shutoff operations [26]. The gelation time considerably limits, and even decreases the volume of possibly injected shutoff composition. To consider this feature, the following condition needs to be satisfied:
t g e l t i n j V M A X Q i n j ,
where tgel indicates the gelation time at the reservoir temperature, min; tinj indicates the expected time of composition injection, min; VMAX indicates the maximum volume of composition considering the gelation kinetics, m3; Qinj indicates the maximum flow rate that is possible during the injection considering the reservoir injectivity and the pumping capacity, m3/min.
According to condition 9, the composition volume that may be injected into the reservoir, considering gelation kinetics, is the following:
V M A X Q i n j t g e l .
Figure 11 shows the diagram of optimal injection volume determination.
Overall, the composition’s optimal injection volume (Vopt) is evaluated according to the required strength of the shutoff barrier and the gelation time. It is also essential to satisfy the condition VMAX≥Vopt≥VMIN to ensure effective blockage and minimize risks of accidents during the injection process.
As an example, the optimal injection volume of the shutoff composition for the following conditions was calculated:
  • wellbore radius—0.2 m;
  • pressure drawdown during the well operation—10 MPa;
  • differential pressure of gel displacement—5 MPa/m;
  • length of the water zone that is required to be blocked—15 m;
  • average fracture intensity in the shutting zone—37 m−1;
  • average fracture aperture in the shutting zone изoляции—179 μm.
In accordance with Equation (7), the minimum radius of the blocking barrier is 2.2 m. Thus, as calculated by Equation (8), the minimum volume of the shutoff composition required to create a strong hydrodynamical barrier is 1.65 m3. Considering the maximum capacity of the UIPK-RIR unit (6 m3/h) and the gelation time of the composition ensuring the best selective characteristics at 37 °C (100 min), the maximum possible injected volume of the composition by Equation (9) is 10 m3. Therefore, to provide a stable limitation of water inflow, the composition volume should satisfy the condition 10 ≥ Vopt 1.65 m3.
It is important to mention that the application of designed composition is slightly limited by its interaction with the reservoir water as a result of crosslinking. To avoid any influence of water on the composition’s properties, future research on the possible application of buffer fluids or liquid emulsive “packer” technology is planned.

4. Conclusions

  • In this study, the new gel-forming composition based on sodium silicate was developed to limit the water inflow in fractured porous reservoirs. Inorganic chromium (III) salt was used as a crosslinking agent due to its ability to initiate gelation throughout the volume of the composition.
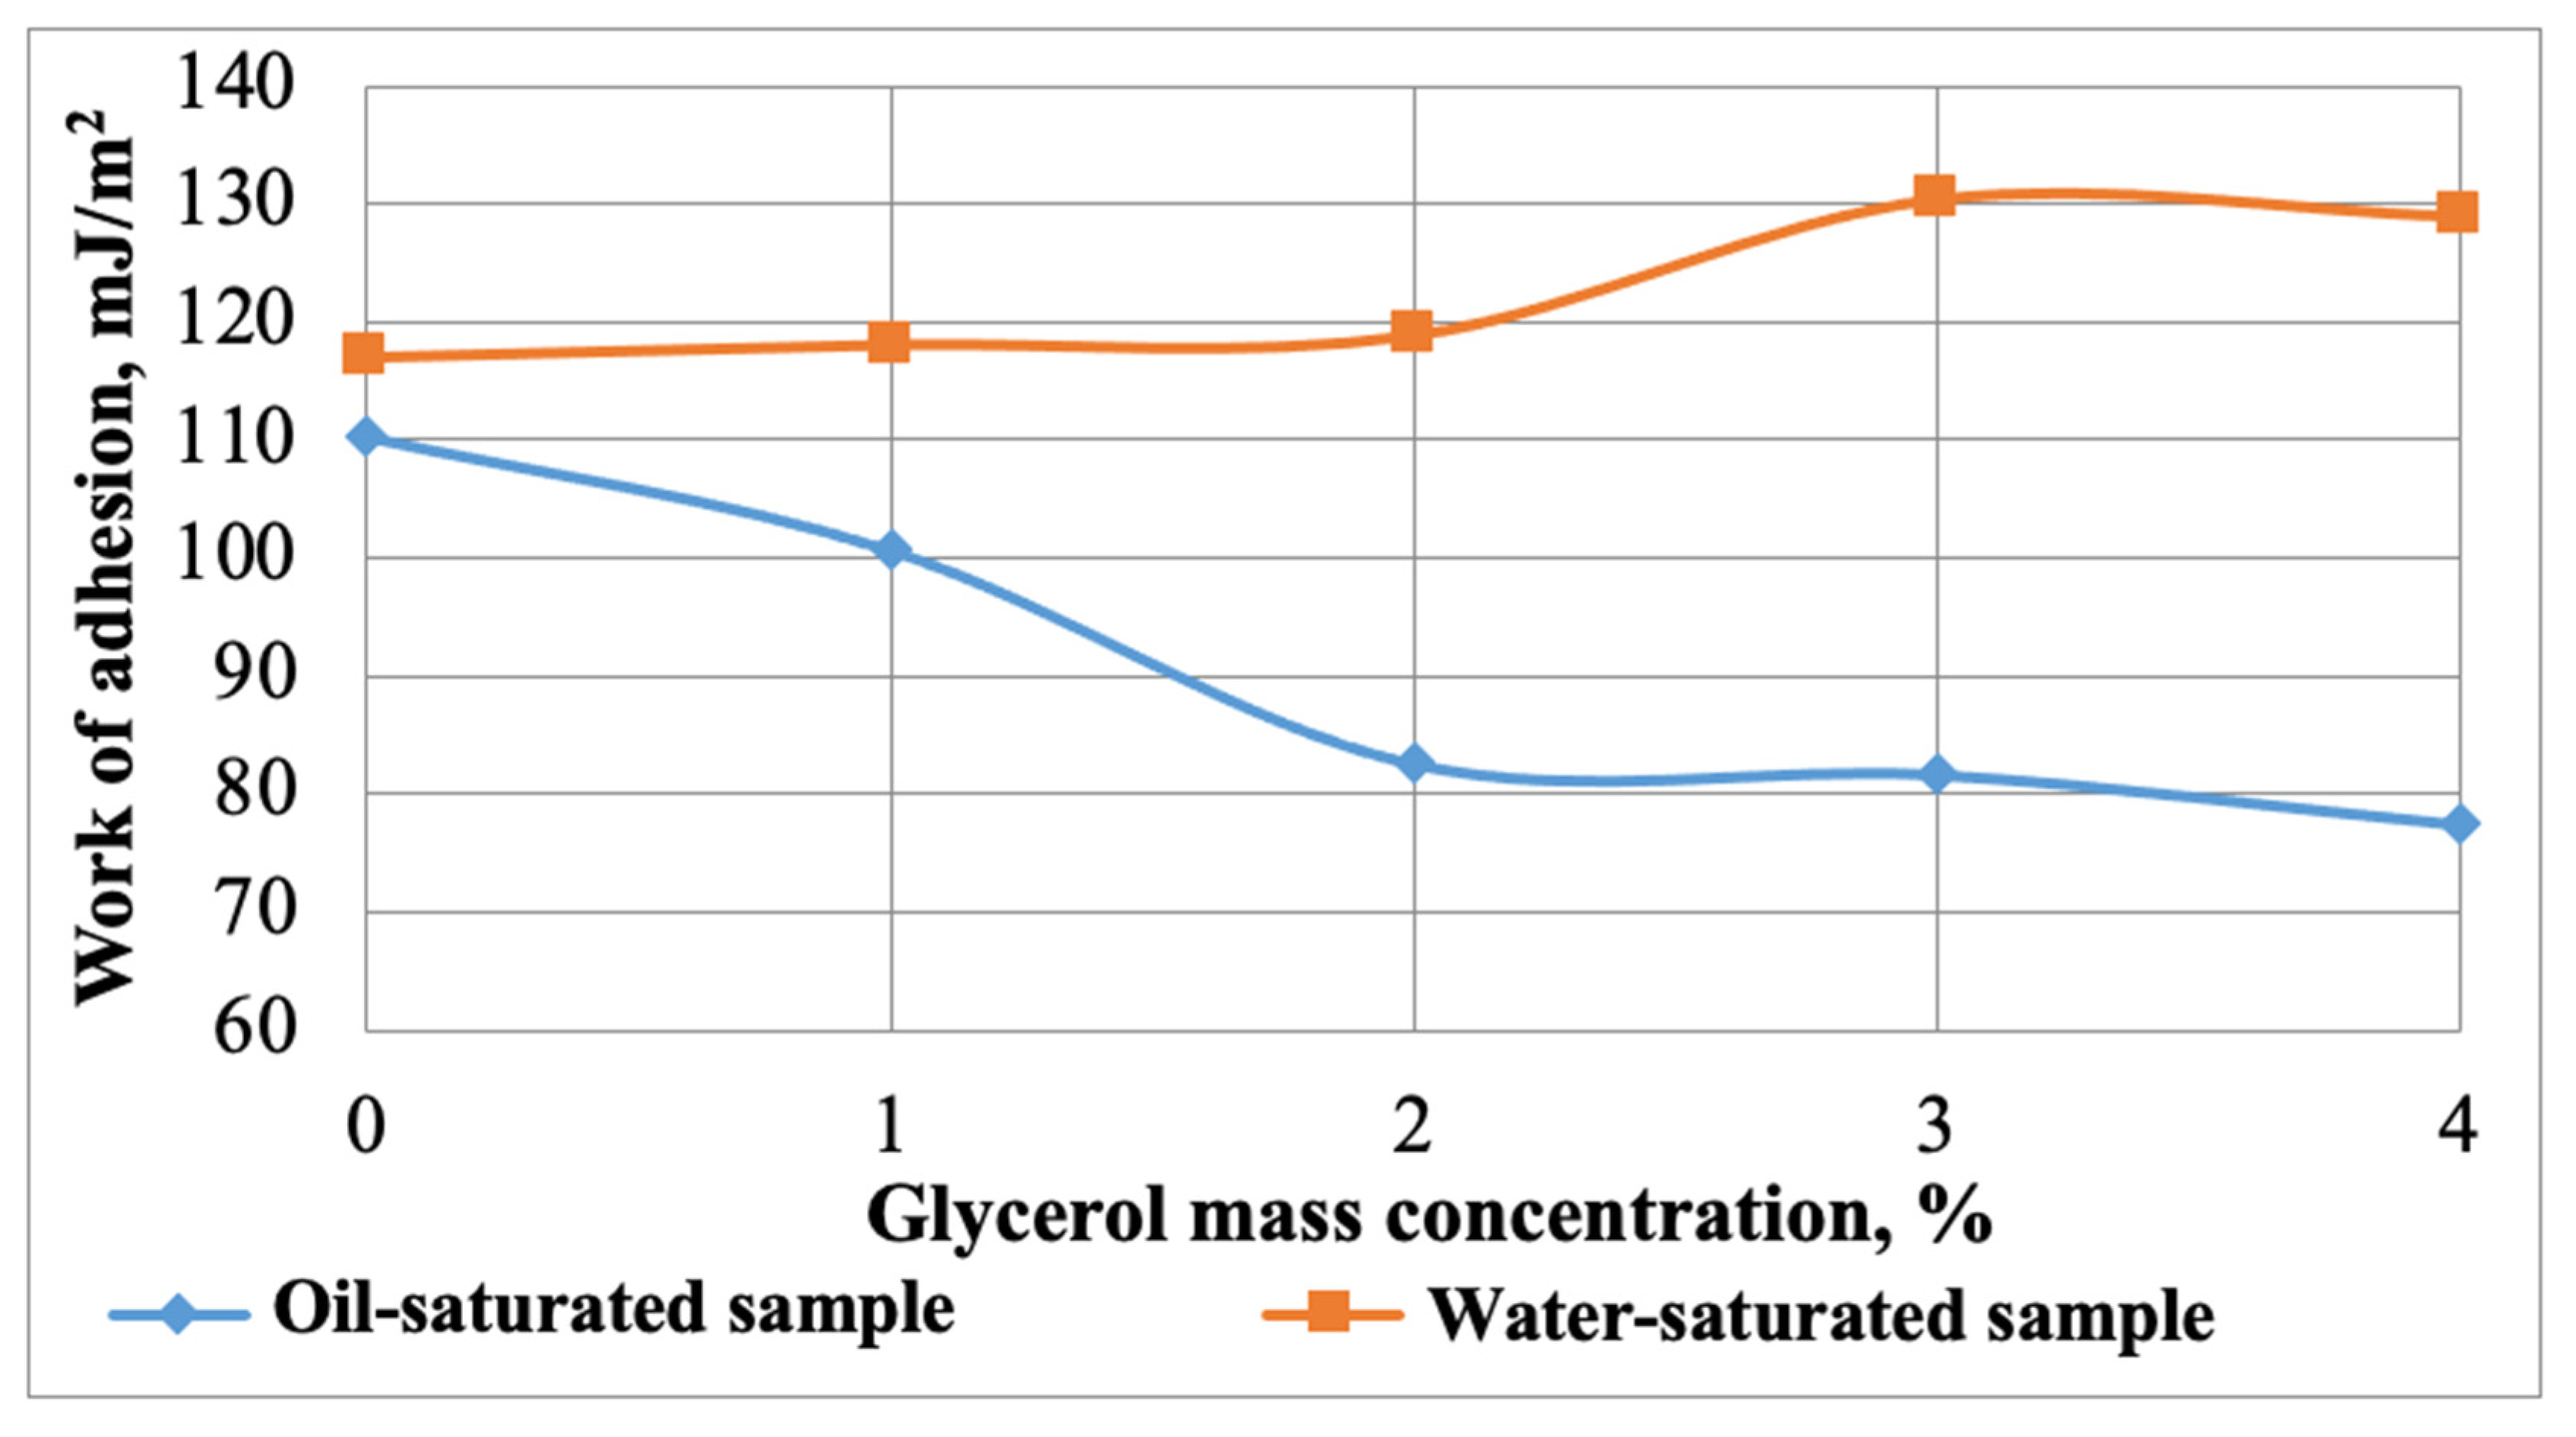
  • It was revealed that polyatomic alcohol can influence the selectivity of the designed composition by enhancing its hydrophilic behavior in water-saturated rocks (work of adhesion increases from 117 to 129 mJ/m2) and reducing the hydrophobic behavior in oil-saturated rocks (work of adhesion drops from 110.3 to 77.4 mJ/m2).
  • Moreover, the selectivity of the composition’s performance was experimentally validated by the fact that the permeability of the water-saturated fractured porous core samples decreased to a greater extent than the permeability of the oil-saturated ones. The experimental value of the selectivity coefficient is 152.14.
  • The calculation methodology for evaluating the injection volume of the developed gel-forming composition was suggested. It was based on the necessity of creating the shutoff barrier that not only would tolerate pressure fluctuations occurring during well operation processes, but also would consider limitations for the injection time.
  • Furthermore, it was confirmed that the injection of sodium hydroxide water solution may effectively dissolve the shutoff barrier in situ. The filtration properties of oil-saturated zones were almost completely restored after being exposed to the breaker fluid (the residual resistance factor is 1.19), and water-saturated zones had a higher residual resistance factor due to the composition’s better wettability of water-saturated rocks (the residual resistance factor is 180.14), which is several times higher than similar indicators in studies carried out on related specifics [23,38,41,42,43]. This indicates the higher efficiency of the considered technology.

Author Contributions

Conceptualization, V.D. and T.N.V.; methodology, V.D.; software, N.O.; validation, V.D. formal analysis, V.D. and T.N.V.; investigation, V.D., T.N.V., N.O. and G.S.; resources, V.D. and N.O.; data curation, T.N.V.; writing—original draft preparation, V.D. and T.N.V.; writing—review and editing, V.D., T.N.V. and G.S.; visualization, N.O.; supervision, V.D.; project administration, V.D. All authors have read and agreed to the published version of the manuscript.

Funding

This research received no external funding.

Institutional Review Board Statement

Not applicable.

Informed Consent Statement

Not applicable.

Data Availability Statement

Not applicable.

Conflicts of Interest

The authors declare no conflict of interest.

References

  1. Raupov, I.; Burkhanov, R.; Lutfullin, A.; Maksyutin, A.; Lebedev, A.; Safiullina, E. Experience in the Application of Hydrocarbon Optical Studies in Oil Field Development. Energies 2022, 15, 3626. [Google Scholar] [CrossRef]
  2. Mardashov, D.V.; Bondarenko, А.V.; Raupov, I.R. Technique for calculating technological parameters of non-Newtonian liquids injection into oil well during workover. J. Min. Inst. Volume 000. 2022, 1–14. [Google Scholar] [CrossRef]
  3. Tananykhin, D.; Grigorev, M.; Korolev, M.; Solovyev, T.; Mikhailov, N.; Nesterov, M. Experimental Evaluation of the Multiphase Flow Effect on Sand Production Process: Prepack Sand Retention Testing Results. Energies 2022, 15, 4657. [Google Scholar] [CrossRef]
  4. Raupov, I.R.; Milic, J. Improvement of operational efficiency of high water-cut oil wells. In IOP Conference Series: Earth and Environmental Science; IOP Publishing: Bristol, UK, 2022; Volume 1021, p. 012077. [Google Scholar]
  5. Deng, B.; Wei, L. Water Control of Horizontal Wells Using Foam-Gel: Lessons Learnt in a Heavy Oil Reservoir with Strong Waterdrive. In Proceedings of the Paper presented at the SPE/IATMI Asia Pacific Oil & Gas Conference and Exhibition, Jakarta, Indonesia, 17–19 October 2017. [Google Scholar]
  6. Wiggett, A.J. Water—Chemical Treatment and Management. In Proceedings of the Paper Presented at the SPE Oilfield Water Management Conference and Exhibition, Kuwait City, Kuwait, 21–22 April 2014. [Google Scholar]
  7. Rebecca, F.; Morgan, J.C.; Stevens, D.G.; Thrasher, D.R. Water Shut-Off in Oil Production Wells—Lessons from 12 Treatments. In Proceedings of the Paper presented at the 7th Abu Dhabi international Petroleum Exhibition and Conference, Abu Dhabi, United Arab Emirates, 13–16 October 1996. [Google Scholar]
  8. Zhang, G.; Liu, Z.; Li, Y.; Jia, X.; Sun, Z.; Lv, Z. Pilot Test and Effect Evaluation for the Water Shutoff Technology with Concentric Tube in Horizontal Well of Bohai Oilfield. In Proceedings of the International Petroleum Technology Conference, Beijing, China, 26–28 March 2019. [Google Scholar]
  9. Burdin, K.; Kichigin, A.; Mazitov, R.; Lobov, M.; Bravkov, P.; Stepanov, V.; Eliseev, D.; Zemchihin, A.; Byakov, A. Gas shutoff treatment in mega rich horizontal well with coiled tubing inflatable packer for North Caspian. In Proceedings of the Society of Petroleum Engineers—SPE Russian Petroleum Technology Conference, Moscow, Russia, 26–28 October 2015; SPE: Moscow, Russia, 2015. [Google Scholar]
  10. Prischepa Oleg, M.; Nefedov, Y.V.; Kochneva, O.Y. Raw material base of hard-to-extract oil reserves of Russia. Period. Tche Quim. 2020, 17, 915–924. [Google Scholar] [CrossRef]
  11. Cherepovitsyn, A.; Metkin, D.; Gladilin, A. An Algorithm of Management Decision-Making Regarding the Feasibility of Investing in Geological Studies of Forecasted Hydrocarbon Resources. Resources 2018, 7, 47. [Google Scholar] [CrossRef] [Green Version]
  12. Mavliev, A.R.; Rogachev, M.K.; Mardashov, D.V. Substantiation of pumped volumes of flow angularity compositions in injection wells. J. Min. Inst. 2011, 189, 182. [Google Scholar]
  13. Shagiakhmetov, A.; Yushchenko, S. Substantiation of In Situ Water Shut-Off Technology in Carbonate Oil Reservoirs. Energies 2022, 15, 5059. [Google Scholar] [CrossRef]
  14. Rogachev, M.K.; Mukhametshin, V.V.; Kuleshova, L. Improving the efficiency of using resource base of liquid hydrocarbons in Jurassic deposits of Western Siberia. J. Min. Inst. 2019, 240, 711. [Google Scholar] [CrossRef] [Green Version]
  15. Prischepa, O.M.; Nefedov, Y.V.; Ibatullin, A.H. Assessment of the hydrocarbon potential of the domanik deposits of the tpp on the basis of quantitative models of generation and assessment of the saturation of the pore space. In EAGE/SPE Workshop on Shale Science 2021: New Challenges; European Association of Geoscientists and Engineers; EAGE: Moscow, Russia, 2021; Volume 2021, pp. 1–5. [Google Scholar]
  16. Galkin, V.I.; Ponomareva, I.N.; Martyushev, D.A. Prediction of reservoir pressure and study of its behavior in the development of oil fields based on the construction of multilevel multidimensional probabilistic-statistical models. Georesursy 2021, 23, 73–82. [Google Scholar] [CrossRef]
  17. Lekomtsev, A.V.; Iliushin, P.Y.; Korobov, G.Y. Modeling and proving of design solutions for the reconstruction of treatment facility of oil and water. Tche Quim. Group 2020, 17, 269–281. [Google Scholar] [CrossRef]
  18. Ketova, Y.A.; Bai, B.; Khizhnyak, G.P.; Gladkikh, Y.A.; Galkin, S.V. Testing of preformed particles polymer gel technology on core filtration models to limit water inflows. J. Min. Inst. 2020, 241, 91. [Google Scholar] [CrossRef]
  19. Liu, T.; Leusheva, E.; Morenov, V.; Li, L.; Jiang, G.; Fang, C.; Zhang, L.; Zheng, S.; Yu, Y. Influence of Polymer Reagents in the Drilling Fluids on the Efficiency of Deviated and Horizontal Wells Drilling. Energies 2020, 13, 4704. [Google Scholar] [CrossRef]
  20. Matthews, M.D. Treatise of Petroleum Geology. In Handbook of Petroleum Geology: Exploring for Oil and Gas Traps; Chapter 7: Migration of Petroleum; American Association Of Petroleum Geologists: Tulsa, OK, USA, 1999. [Google Scholar]
  21. Burkhanov, R.N.; Lutfullin, A.A.; Maksyutin, A.V.; Raupov, I.R.; Valiullin, I.V.; Farrakhov, I.M.; Shvydenko, M.V. Retrospective analysis algorithm for identifying and localizing residual reserves of the developed multilayer oil field. Georesursy 2022, 24, 125–138. [Google Scholar] [CrossRef]
  22. Buckley, S.; Leverett, M. Mechanism of Fluid Displacement in Sands. Trans. AIME 1942, 146, 107–116. [Google Scholar] [CrossRef]
  23. Demir, M.; Topguder NN, S.; Yilmaz, M.; Ince, Y.; Karabakal, U.; Gould, J.H. Water Shutoff Gels Improved Oil Recovery in Naturally Fractured Raman Heavy Oilfield. In SPE Russian Oil and Gas Technical Conference and Exhibition, Moscow, Russia, 20–22 October 2008; OnePetro: Moscow, Russia, 2008; Volume 2, pp. 912–922. [Google Scholar]
  24. Shagiakhmetov, A.M.; Tananykhin, D.S. The development of a water proofing polymeric composition based on carboxymethylcellulose for carbonate reservoirs. Int. J. Appl. Eng. Res. 2017, 12, 273–276. [Google Scholar]
  25. Shagiakhmetov, A.M.; Petrakov, D.G. Investigation of Selective Properties of the Gel-Forming Composition in the Limitation of Water Inflow in Carbonate Reservoirs Conditions. Int. Res. J. 2016, 5, 47. [Google Scholar]
  26. Fan, G.; Li, M.; Chen, X.; Palyanitsina, A.; Timoshin, A. Polymer-Nanosilica-assisted to evaluate oil recovery performances in sandstone reservoirs. Energy Rep. 2021, 7, 2588–2593. [Google Scholar] [CrossRef]
  27. Wei, Z.; Zhu, S.; Dai, X.; Wang, X.; Yapanto, L.M.; Raupov, I.R. Multi-criteria decision making approaches to select appropriate enhanced oil recovery techniques in petroleum industries. Energy Rep. 2021, 7, 2751–2758. [Google Scholar] [CrossRef]
  28. Mardashov, D.V. Development of blocking compositions with a bridging agent for oil well killing in conditions of abnormally low formation pressure and carbonate reservoir rocks. J. Min. Inst. 2021, 251, 617–626. [Google Scholar] [CrossRef]
  29. Rybakov, A.A.; Guskova, I.A.; Gabdrakhmanov, A.T. Monitoring EOR and Well Stimulation Techniques by Oil Optical Properties Measurement. In Society of Petroleum Engineers—SPE Russian Oil and Gas Exploration and Production Technical Conference and Exhibition 2014, RO and G 2014—Sustaining and Optimising Production: Challenging the Limits with Technology; OnePetro: Moscow, Russia, 2014; Volume 2, pp. 984–991. [Google Scholar]
  30. Islamov, S.R.; Bondarenko, A.V.; Gabibov, A.F.; Mardashov, D.V. Polymer compositions for well killing operation in fractured reservoirs. In Advances in Raw Material Industries for Sustainable Development Goals; CRC Press/Balkema: Boca Raton, FL, USA, 2021; pp. 343–351. [Google Scholar]
  31. Kume, N. An Engineering Approach To Predicting Post-Treatment Well Performance Using Selective Chemical Water Shut-Off Techniques: An RPM Example. In Society of Petroleum Engineers (SPE); OnePetro: Moscow, Russia, 2003; pp. 4071–4081. [Google Scholar]
  32. Mullins, O.C.; Joshi, N.B.; Groenzin, H.; Daigle, T.; Crowell, C.; Joseph, M.T.; Jamaluddin, A. Linearity of Near-Infrared Spectra of Alkanes; SAGE PublicationsSage UK: London, UK, 2016; Volume 54, pp. 624–629. [Google Scholar] [CrossRef]
  33. Beloglazov, I.I.; Morenov, V.A.; Leusheva, E.L.; Gudmestad, O.T. Modeling of Heavy-Oil Flow with Regard to Their Rheological Properties. Energies 2021, 14, 359. [Google Scholar] [CrossRef]
  34. Islamov, S.R.; Bondarenko, A.V.; Mardashov, D.V. Substantiation of a well killing technology for fractured carbonate reservoirs. In Proceedings of the Youth Technical Sessions Proceedings—Proceedings of the 6th Youth Forum of the World Petroleum Council-Future Leaders Forum, Saint Petersburg, Russia, 23–28 June 2019; pp. 256–264. [Google Scholar]
  35. Podoprigora, D.; Raupov, I. Research of the influence of polymeric drilling mud on the filtration-capacitive properties of polymictic sandstones. Acta Tech. CSAV Ceskoslovensk Akad. Ved 2018, 63, 537–546. [Google Scholar]
  36. Rogachev, M.K.; Kondrashev, A.O. Substantiation of intrastratal water shutoff technology in low permeability reservoirs. J. Min. Inst. 2016, 217, 55. [Google Scholar]
  37. Lakatos, I.; Szentes, G.; Toro, M.; Karaffa, Z.; Vago, A. Mitigation of Formation Damage Caused by Chemical Overdosing in Water Shut-Off Treatments. In Proceedings of the SPE International Symposium on Formation Damage Control, Lafayette, OR, USA, 19–22 February 2020; OnePetro: Moscow, Russia, 2020. [Google Scholar]
  38. Dupuis, G.; Bouillot, J.; Zaitoun, A.; Caremi, G.; Burrafato, G. Combined Water/Sand Control Polymer Treatments in Offshore Gas Wells. In Proceedings of the SPE EOR Conference at Oil and Gas West Asia, Muscat, Oman, 21–23 March 2016. [Google Scholar]
  39. Parton, C.; Singh, D.; Khamatnurova, T.; Lewis, C.; Vo, L.K. Long Interval Foamed Diversion Treatment: A Mid-Scale Multizone Diversion Treatment Study. In SPE European Formation Damage Conference and Exhibition, Budapest, Hungary, 3–5 June 2015; OnePetro: Moscow, Russia, 2015; pp. 718–731. [Google Scholar]
  40. El-Karsani, K.S.; Al-Muntasheri, G.A.; Sultan, A.S.; Hussein, I.A. Gelation of a Water-Shutoff Gel at High Pressure and High Temperature: Rheological Investigation. Soc. Pet. Eng. 2015, 20, 1103–1112. [Google Scholar] [CrossRef]
  41. Dai, L.C.; You, Q.; Yuhong, X.; Long, H.; Ya, C.; Fulin, Z. Case Study on Polymer Gel to Control Water Coning for Horizontal Well in Offshore Oilfield. In Proceedings of the Paper Presented at the Offshore Technology Conference, Houston, TX, USA, 1–3 May 2011. [Google Scholar]
  42. Jain, P.; Sharma, V.; Raju, A.V.; Patra, S.K. Polymer Gel Squeeze for Gas Shutoff, Water Shutoff and Injection Profile Improvement in Bombay High Pilot Wells. In Proceedings of the Paper presented at the SPE Asia Pacific Oil and Gas Conference and Exhibition, Brisbane, Australia, 17–19 October 2000. [Google Scholar]
  43. Caili, D.; Qing, Y.; Yefei, W.; Fulin, Z.; Shuler, P. Research on Reutilization Technology of Residual Polymer in Formation After Polymer Flooding. In Proceedings of the SPE Improved Oil Recovery Symposium, Tulsa, OK, USA, 24–28 April 2010. [Google Scholar]
Figure 1. Major groups of selective water shutoff principles.
Energies 16 00366 g001
Figure 2. Evaluation of the surface tension (a) and the contact angle (b).
Energies 16 00366 g002
Figure 3. Surface tension forces and the contact angle applied to the composition droplet on a solid surface. σS—surface tensions between the solid and gas phases, σL—between the gas and liquid phases, σSL—between the liquid and solid phases, θ—the contact angle.
Energies 16 00366 g003
Figure 4. Core sample preparation. 1, aluminum foil strips; 2, the plastic heat shrink sleeve; 3, natural core sample.
Energies 16 00366 g004
Figure 5. Schematic of the setup modeling a heterogeneous reservoir. 1, injection pump; 2, liquid container; 3, tightening system; 4, core holders; 5, measuring container; 6, alloy steel tubes.
Energies 16 00366 g005
Figure 6. Correlation between the work of adhesion and the glycerol concentration in the shutoff composition at oil- and water-saturated rock samples.
Energies 16 00366 g006
Figure 7. Correlation between the differential pressure and the injected pore volume at oil-saturated fractured porous core sample.
Energies 16 00366 g007
Figure 8. Correlation between the differential pressure and the injected pore volume at water-saturated fractured porous core sample.
Energies 16 00366 g008
Figure 9. Relation between differential pressure and injected pore volumes of oil and water during the selectivity estimation experiment.
Energies 16 00366 g009
Figure 10. Water shutoff barrier located in the near-wellbore zone. Rb—radius of forming barrier, m; Rw—the wellbore radius, m.
Energies 16 00366 g010
Figure 11. Determination of composition’s optimal injection volume.
Energies 16 00366 g011
Table 1. Correlation between contact angle values of the shutoff composition and glycerol concentrations.
Glycerol Mass Concentration, %Surface Tension, mN/mContact Angle, Deg
Oil-Saturated SampleWater-Saturated Sample
073.459.953.5
172.467.050.8
271.781.348.9
371.381.733.9
470.184.032.8
Table 2. Correlation between the work of adhesion and the glycerol concentration in “Silicate” shutoff composition.
Glycerol Mass Concentration, %Surface Tension, mN/mWork of Adhesion, mJ/m2
Oil-Saturated SampleWater-Saturated Sample
073.4110.3117.1
172.4100.7118.1
271.782.6118.9
371.381.7130.5
470.177.4129.0
Table 3. Results of the flooding experiment on oil-saturated fractured porous core sample.
CharacteristicUnitBefore the Gel InjectionAfter the Gel InjectionAfter the Breaker Fluid Injection
Differential pressure during the injectionMPa/m6.6159.067.43
Relative permeability to oil10−3 μm2303.293.50267.59
Coefficient of permeability reduction%-−8550−13
Residual resistance factor -86.531.13
Maximum differential pressure during the injectionMPa/m19.57
Table 4. Results of the flooding experiment on water-saturated fractured porous core sample.
CharacteristicUnitBefore the Gel InjectionAfter the Gel InjectionAfter the Breaker Fluid Injection
Differential pressure during the injectionMPa/m30.10192.3132.59
Relative permeability to water10−3 μm280.071.197.40
Coefficient of permeability reduction%-−6600−980
Residual resistance factor -67.0410.82
Maximum differential pressure during the injectionMPa/m36.84
Table 5. Results of flooding experiments on selectivity evaluation.
CharacteristicUnitBefore the Gel InjectionAfter the Gel InjectionAfter the Breaker Fluid Injection
Differential pressure of oil injectionMPa/m51.3719.6629.89
Differential pressure of water injection3.87164.82101.60
Residual resistance factor of oil-saturated sample 5.261.19
Residual resistance factor of water-saturated sample293.75180.77
Selectivity coefficient 55.55152.14
Disclaimer/Publisher’s Note: The statements, opinions and data contained in all publications are solely those of the individual author(s) and contributor(s) and not of MDPI and/or the editor(s). MDPI and/or the editor(s) disclaim responsibility for any injury to people or property resulting from any ideas, methods, instructions or products referred to in the content.

