Article

Experiments on Water-Gas Flow Characteristics under Reservoir Condition in a Sandstone Gas Reservoir

1
State Key Laboratory of Oil-Gas Reservoir Geology and Exploitation, Southwest Petroleum University, Chengdu 610500, China
2
PetroChina Qinhai Oilfield Company, Dunhuang 736202, China
3
Hainan Branch of CNOOC China Ltd., Haikou 570105, China
*
Authors to whom correspondence should be addressed.
Energies 2023, 16(1), 36; https://doi.org/10.3390/en16010036
Submission received: 20 November 2022 / Revised: 16 December 2022 / Accepted: 19 December 2022 / Published: 21 December 2022

Abstract

:
For gas reservoirs that contain water, investigating characteristics of water–gas seepage is crucial to the formulation of gas field development plans and predicting the production capacity and water breakthrough of gas wells. For the purposes of such an investigation, the process of water invasion into a water-containing gas reservoir was studied based on four sandstone samples whose physical properties differed quite vastly (permeability: 0.112–192.251 mD; porosity: 8.33–20.60%). Gas–water relative permeability experiments were conducted on the gas-driven water in the reservoir conditions (temperature: 135 °C; pressure: 75 MPa). Starting with the sandstone samples’ microstructural characteristics, particular attention was paid to the impacts of throat radius and clay content on the water–gas seepage characteristics. It was found that the basic physical properties, microscopic characteristics, and mineral composition of the sandstone samples all affected the water–gas seepage characteristics. The larger the pore-throat radius, the stronger the ability of sandstone samples to allow fluid through under the same water saturation and the greater the relative permeability of gas and water phases. Furthermore, the wider the throat radius and the lower the clay content, the greater the gas–water relative permeability. Isotonic water saturation and irreducible water saturation were found to be negatively to throat radius and positively with clay content. Furthermore, When sandstone samples have similar clay content, the average throat radius is four times larger, its irreducible water saturation is decreased by 1.63%, its residual gas saturation is decreased by 1.00%, and the gas permeability under irreducible water saturation increases by more than 400 times. Water intrusion showed a more significant impact on the gas–water flow characteristics of the low-permeability sandstone samples, and it severely restricted the flow capacity of the gas phase.

1. Introduction

Relative water–gas permeability, one of the most important parameters to the process of gas reservoir development, is also an important consideration in the production performance prediction and numerical simulation for gas reservoirs. The study of relative water–gas permeability is particularly important to the prediction of the production capacity and water breakthrough of gas wells, especially those that contain water [1,2,3]. For this reason, foreign and domestic scholars have been contributing to a wealth of both theoretical and experimental research on the subject for decades.
In terms of experimental research, Johnson et al. [4] proposed a method to calculate the relative permeability based on experimental data, which was widely used later and was called the JBN method. The relative permeability measurement methods of rock can be divided into the steady-state method and the non-steady-state state method [5]. The steady-state method calculates the phase permeability by testing and recording the outlet velocity and displacement pressure difference of the rock sample, while the non-steady-state method calculates the phase permeability by applying a certain pressure pulse at the inlet of the test rock sample [6,7], and non-steady-state method is usually run under either constant core plug pressure difference or constant fluid injection rate conditions [8]. Based on this method, many scholars [9,10,11] have carried out a lot of experiments to study gas-water permeability. Babadagli et al. [12] thought that surface roughness and lithology would affect the relative permeability of rock samples. Guo et al. [13] believed that temperature would have an impact on permeability, and through experiments, it was found that the effect of temperature on permeability had stages, and permeability decreased with the increase in temperature. However, Yacoub et al. [14] came to a different conclusion. Guo et al. [15] found that displacement mode would have an impact on relative permeability. Alberto et al. [16] analyzed the effect of wettability on relative permeability, and they proposed that the relative permeability of water increased significantly when the surface became more hydrophobic. Relative permeability can be affected by pore structure and clay mineral composition, and some scholars [17,18] found that the higher the clay mineral content was, the lower the flow capability of the rock. Agostini1 et al. [19] studied the effect of effective stress on absolute permeability. Relative permeability also can be affected by effective stress [20,21], and Adenutsi et al. [22] found that the saturation of bound water increases with the increase in stress. Moghadasi et al. [23] and Zhang et al. [24] have studied not only two-phase but also three-phase relative permeability. The capillary end effect affects the calculation of relative permeability. The steady-state saturation curve converges to saturation when the capillary pressure is zero, which results in an uneven saturation distribution, with the greatest deviation at the exit [25,26]. Viscous coupling and flow direction have a great influence on the permeability test results. When the viscous coupling is considered, the countercurrent relative permeability is always lower than the co-flow relative permeability [27].
Based on physical experiments, many scholars [28,29,30] have studied the theoretical calculation methods of relative permeability. Li et al. [31] studied the empirical model, semi-empirical model, and theoretical model of relative permeability. A new technique for accurate measurement of two-phase relative permeability under non-Darcy flow conditions was proposed by Lai et al. [32]. Zhou [33] and Daigle [34] proposed a new model to estimate the permeability of unsaturated water from the hydraulic diffusion coefficient. Wu et al. [35] proposed a relative permeability model taking into account the distribution of pore size, curvature, and air and water space. Sun et al. [36] established a numerical relative permeability calculation model based on digital rock analysis. Mo et al. [37] established a theoretical calculation model that considered immobile water saturation to describe gas-water relative permeability. On the basis of the Brookse-Corey model, the influence of bending degree was considered, and the model was improved. Prediction models of permeability and relative permeability of porous media considering pore characteristics and pore-scale physical characteristics were proposed from the perspective of fractals [38,39,40,41,42].
Based on the above investigation and analysis, it is established that foreign and domestic scholars have conducted numerous studies, from both the experimental and theoretical perspectives, on relative gas–water permeability in gas reservoirs. Almost all the experiments, however, were carried out under conventional conditions, mainly in the form of gas-driven water experiments. For that reason, the theoretical models based on these experiments do not consider the influence of pressure and temperature. According to the research results of Yang et al. [43], both temperature and pressure affect permeability, which decreases with the increase of effective stress and temperature. Fang et al. [44] conducted relative gas–water permeability experiments under both conventional and high-temperature/high-pressure conditions, resulting in significantly different curves for the different experimental conditions. As has been demonstrated, temperature and pressure affect not only absolute permeability but also relative permeability. Therefore, relative gas–water permeability experiments need to be conducted at temperatures and pressures that correspond to the relevant reservoir conditions. Furthermore, for water-driven gas reservoirs, water-driven gas should be the main displacement method so that the results obtained accurately characterize the gas–water flow characteristics. The sandstone sample displayed stress-sensitive effects under reservoir conditions, which affected its flow capacity. The stress-sensitive effect of the sandstone sample was related to its pore structure and mineral composition [45]. Therefore, the results from the analysis of gas–water seepage characteristics under reservoir conditions must be combined with the microstructural characteristics of the sandstone sample.
There is a gas reservoir located in the South China Sea; the temperature of its reservoir condition is 135 °C, and its pressure is 75 MPa. This gas reservoir has a wide development range, and the physical properties of the reservoir where the gas wells lie vary greatly. Affected by the edge water and sensitivity to stress, the fluid flow characteristics are complex, seriously affecting the prediction and evaluation of the gas wells’ productivity. Therefore, it is necessary to perform in-depth research into the flow characteristics of the fluid in the reservoir conditions.
In this paper, in order to reflect the heterogeneity of the reservoir, four sandstone samples with vastly different physical properties (permeability: 0.112–192.251 mD; porosity: 8.33–20.60%) were selected for this experiment, and the unsteady state method was used in the relative permeability experiment. Combined with the results of x-ray diffraction and mercury intrusion experiments, the differences between the seepage characteristics of each sandstone sample were analyzed in hopes of providing some guidance on the development of this type of gas reservoir.

2. Experimental Samples and Fluid Properties

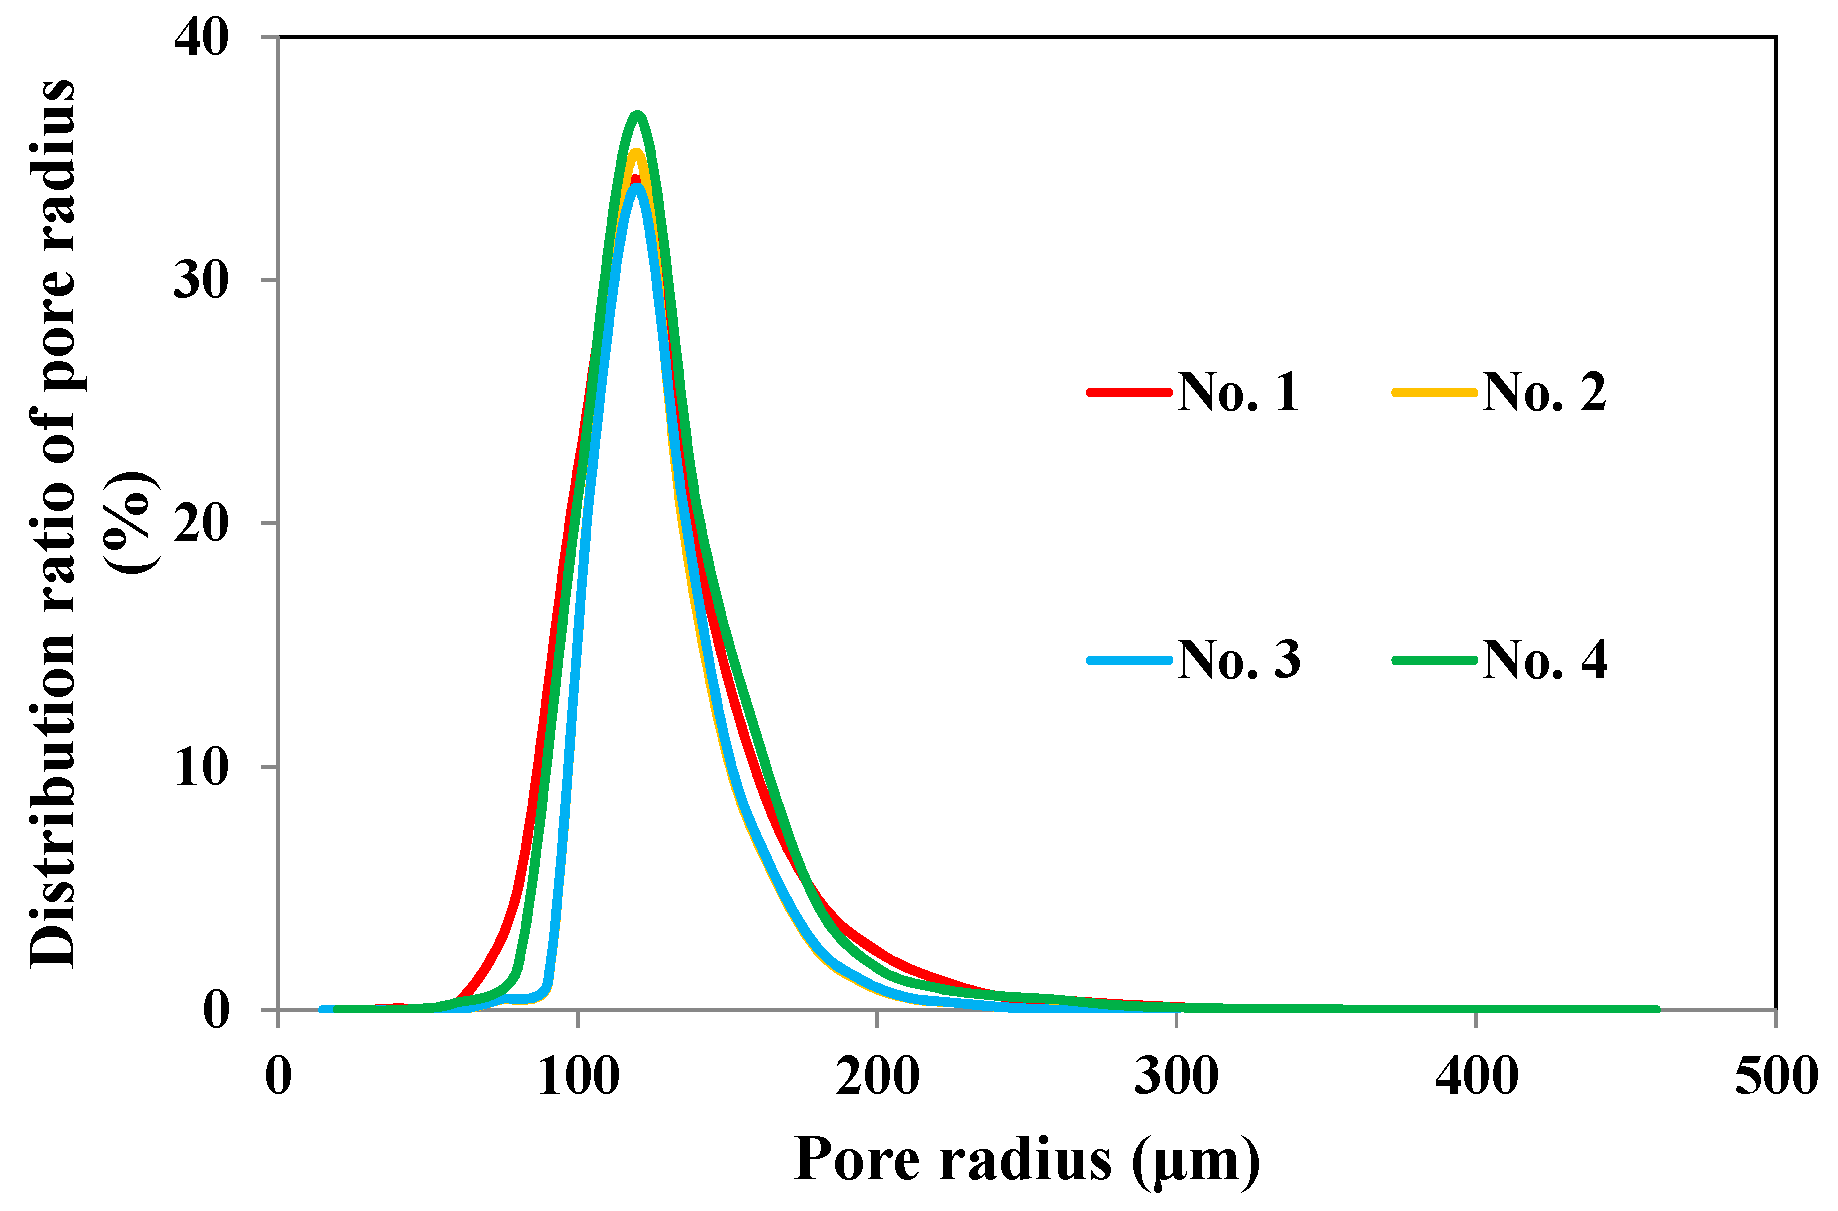
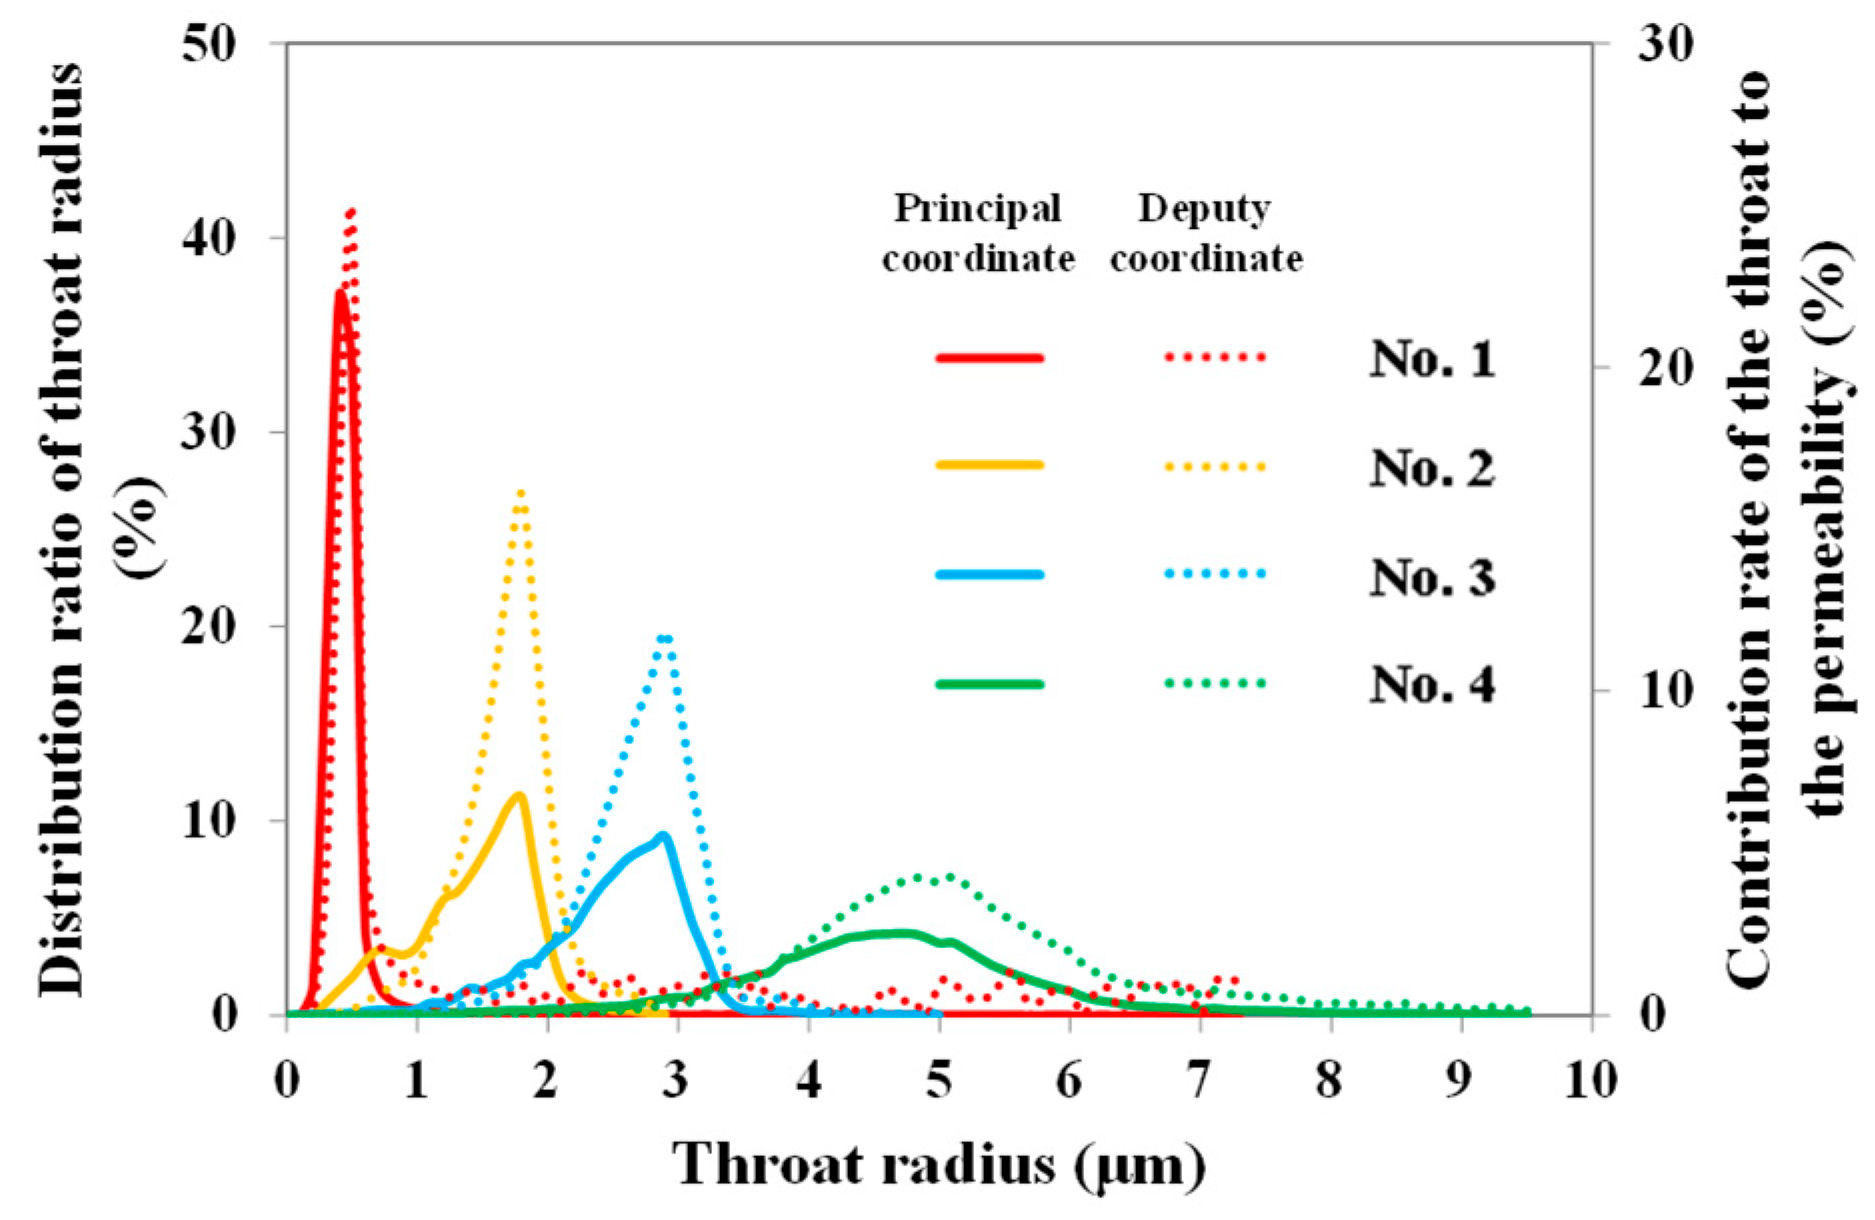
2.1. Properties of Experimental Samples

The sandstone samples used in this experiment were taken from a high-temperature and high-pressure sandstone gas reservoir in the South China Sea. The samples are water wet, and the wetting angle ranges from 15 to 30 degrees. The basic physical properties of the rock samples measured under conventional conditions (confining pressure 3 MPa, backpressure 0.101 MPa, temperature 25 °C) and reservoir conditions (confining pressure 95 MPa, backpressure 75 MPa, temperature 135 °C) are shown in Table 1.
The mineral composition of each rock sample was obtained by X-ray diffraction experiment, as shown in Table 2.
The pore and throat distribution of each rock sample was studied through a constant velocity mercury injection experiment. The interfacial tension and contact angle remain unchanged during the constant velocity mercury injection experiment. Mercury enters the core at each throat and holds pressure, which increases the pressure throughout the capillary system. As mercury enters the pores, the pressure is released, and the pressure throughout the system decreases. The pore throat information can be obtained by recording the mercury inlet pressure-mercury inlet volume curve during this process. The radius of the main throat is determined by the pressure of the breakthrough point, and the size of the pore is determined by the volume of mercury intake. Thus, the size and number of throats are clearly reflected in the mercury inlet pressure curve. The contribution distribution of throat to permeability was obtained, as shown in Figure 1 and Figure 2.
According to Li et al. (2020), the stress sensitivity of porosity is mainly correlated with the clay mineral content, and that of permeability is mainly related to the clay mineral content in addition to the throat radius. It is clear from the data in the above chart that the porosity radius distributions of the four sandstone samples were roughly the same. The average pore radii were 123.64, 122.77, 123.23, and 124.59 μm, respectively (Figure 1). No. 2 had the highest clay content (Table 2), so its porosity stress sensitivity was also the greatest. Nos. 3 and 4 had lower clay mineral content and wider throat radii, so their permeability stress sensitivities were reduced. Although No. 1 had the lowest clay content, its throat radius was the smallest. No. 2 had the highest clay content, so the permeability reduction in the two was relatively great due to the combined effects. Through the above analysis, combined with the permeability of the rock sample under conventional and reservoir conditions, it can be seen that, under the conditions of reservoir temperature and pressure, the average throat radii of Nos. 1–4 still demonstrated a trend of sequential increase.

2.2. Properties of Experimental Fluid

In this experiment, water and nitrogen were used as liquid and gas, respectively, to cut down the pollution of experimental fluid to rock samples, and the corresponding viscosity of water and nitrogen at 135 °C and 75 MPa is 0.2214 mPa.s and 0.0355 mPa.s, respectively.

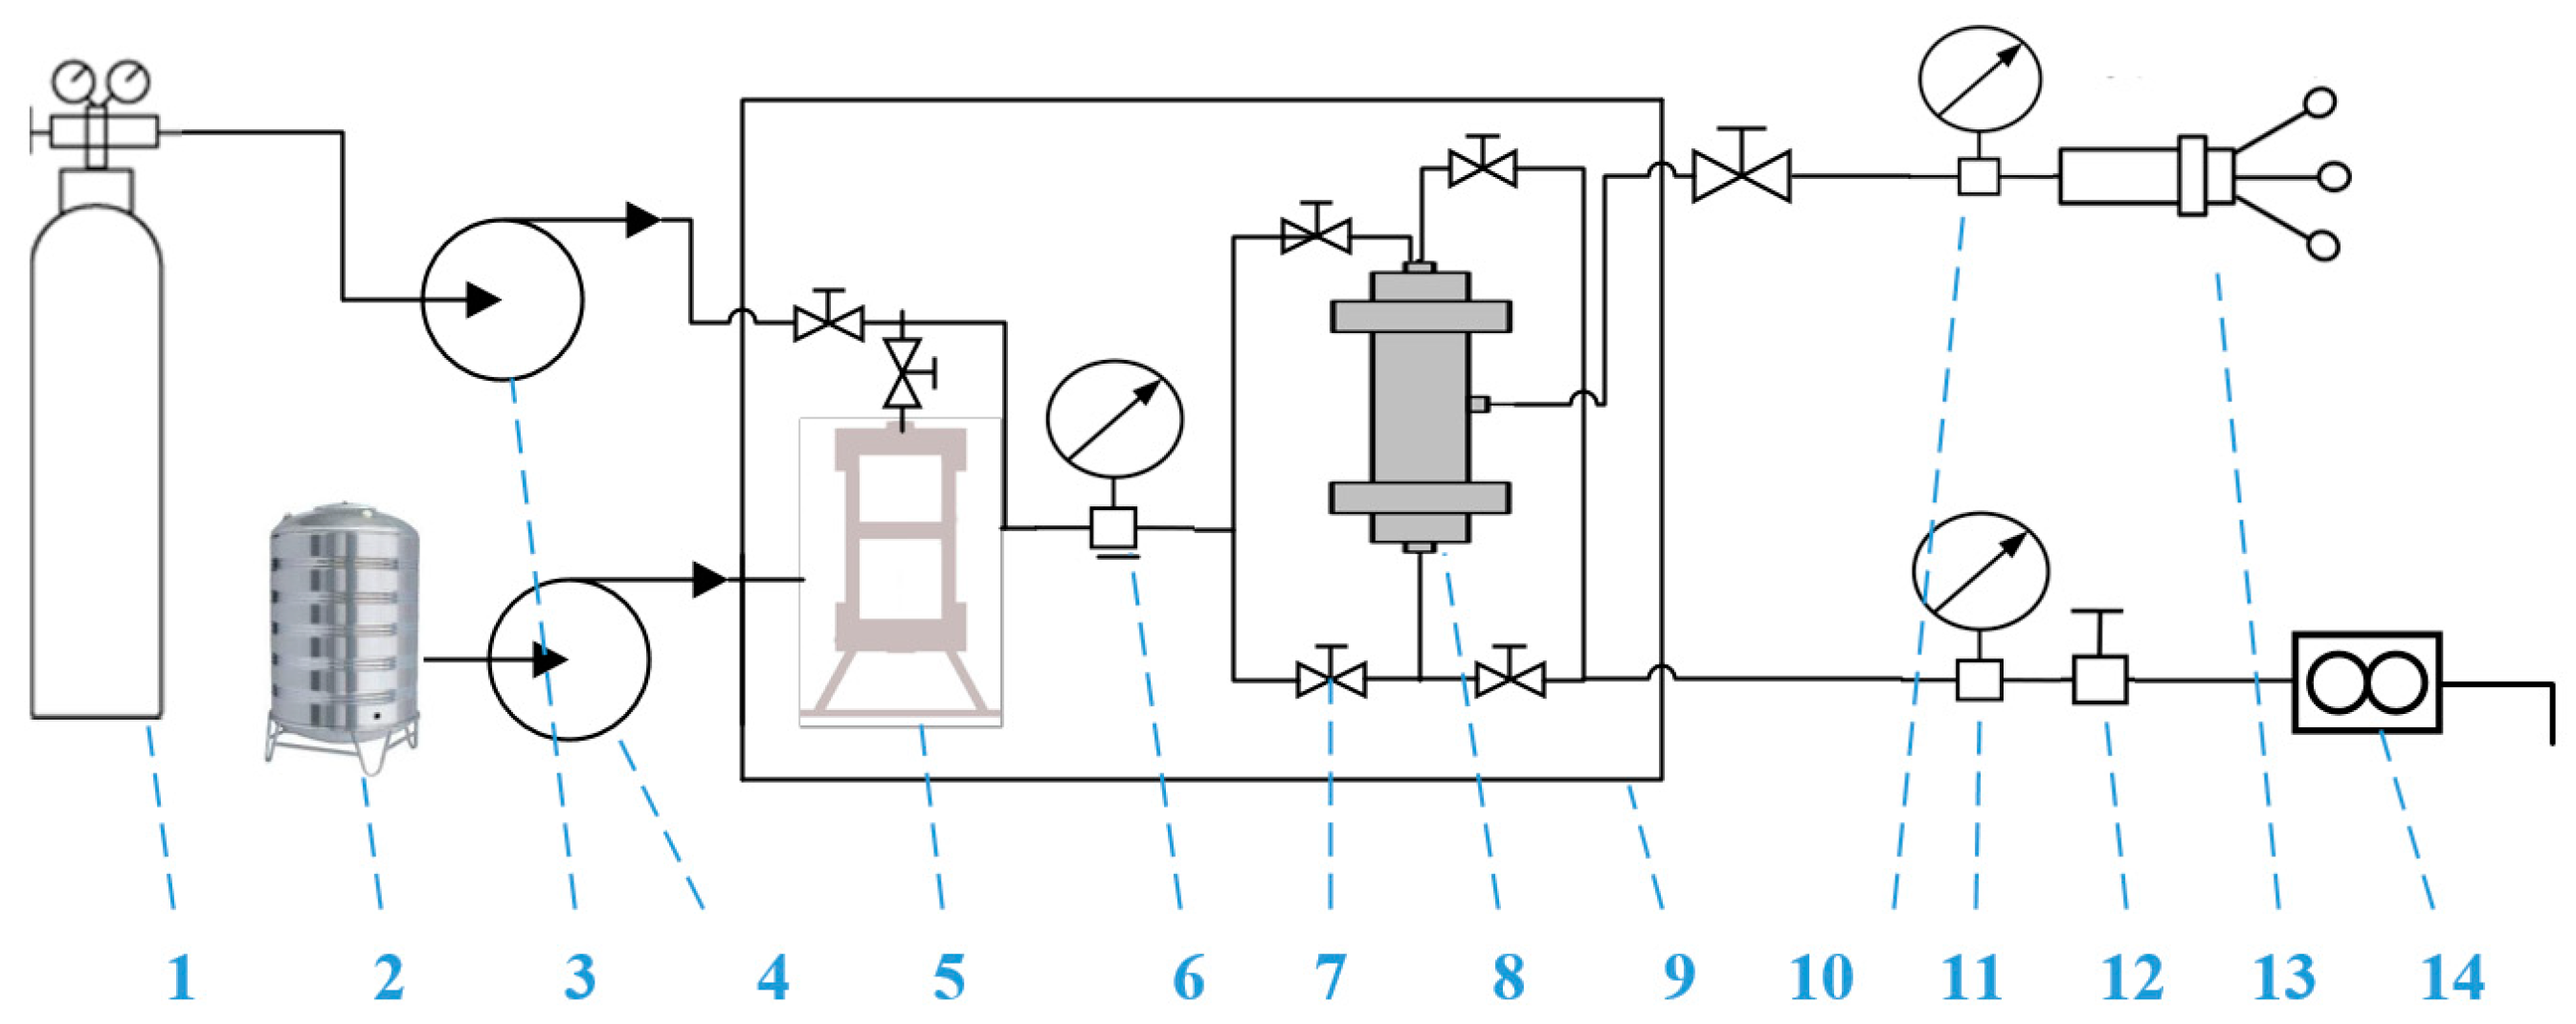
3. Experimental Conditions and Procedures

This experiment adopts the self-developed multi-functional core displacement device (Figure 3), which can automatically measure the temperature, pressure, gas volume, water volume, and other parameters during the experiment. The experimental procedure and data processing method were carried out according to China National Standard GB/T28912–2012 “Test method for two-phase relative permeability in rock” [46]. This relative permeability experiment uses the unsteady state method, (1) Dry the rock sample and measure its dry weight; (2) The sample was vacuumed and pressurized to saturate the water and measure its wet weight; (3) Place the sample in the gripper and adjust the temperature and pressure to reservoir conditions; (4) Gas flooding experiments were carried out under constant pressure drop until no liquid was produced and (5) The method in Appendix B was used to calculate the relative permeability. The experimental results are presented in Appendix A.

4. Experimental Results and Analysis

In this paper, relative permeability is used to characterize the flow capacity. Flow capacity refers to the ability of sandstone samples to allow the passage of gas or water phase under different water saturation. This part is discussed from three aspects: water phase flow capacity, gas phase flow capacity, and integrated flow capacity.

4.1. Water Phase Flow Capacity

Curves of water phase relative and effective permeability and water saturation of each rock sample are drawn, as shown in Figure 4. Moreover, the characteristic values of the water phase permeability curve and the physical parameters of the rock sample are statistically presented in Table 3 for subsequent analysis.
Figure 4 shows that in the early and middle stages of the rock samples’ water production processes, the main pores and throats were occupied by gas, and water moved along the particles’ surfaces after entering the core due to sandstone’s strong hydrophilicity. Since the flow channel used was small, raising its flow resistance, the relative permeability of the water phase rose only gradually. As water saturation increased, the larger pores and throats originally occupied by gas in the core were gradually filled with water; therefore, the water phase relative permeability curve began to rise rapidly. A comparison of the four curves indicates that, from Nos. 1–4, both the relative and effective permeability curves increased in a growing manner. The specific reasons for this are detailed below.

4.1.1. Irreducible Water Saturation

By comparison, Nos. 1 and 3 had roughly the same average pore radii and clay mineral content. The average throat radius of No. 3 is 4.8 times that of No. 1, and its irreducible water saturation decreased by 1.63%. The analysis concluded that at the beginning of the experiment, the pores and throats were filled with water. It was also found that, in the gas-driven water process, the gas passed through the smaller-sized throats and entered the larger pores [35]. Finally, it was established that the larger the throat radius, the smaller the pore-to-throat-radius ratio, and the lower the fluid flow resistance, the greater the sweep efficiency of gas-driven water. Ultimately, the irreducible water saturation was sharply reduced. The average throat radius of No. 2 is 2.79 times that of No. 1. Based on the previous analysis, since the clay mineral content of the two was similar, No. 2 should have had lower irreducible water saturation than No. 1, but this was not the case. Instead, analysis suggests that the main reason for this phenomenon was that the higher clay mineral content weakened the sandstone samples’ resistance to deformation under pressure and increased the degree of compression and deformation undergone by the pores and throats under the reservoir conditions [45]. Additionally, some of the components in clay minerals are prone to swelling when exposed to water, increasing their ability to attach to water, thus, blocking flow channels during migration. This reduces the sweep efficiency of air-driven water, thereby lowering the saturation of irreducible water. No. 4 had lower clay content and the largest average throat radius, so it had the least saturation of irreducible water. From this, it can be concluded that the larger the throat radius and the lower the clay content, the lower the irreducible water saturation. Lower irreducible water saturation, in turn, means that water can only start flowing if it occupies a smaller proportion of the number of channels.

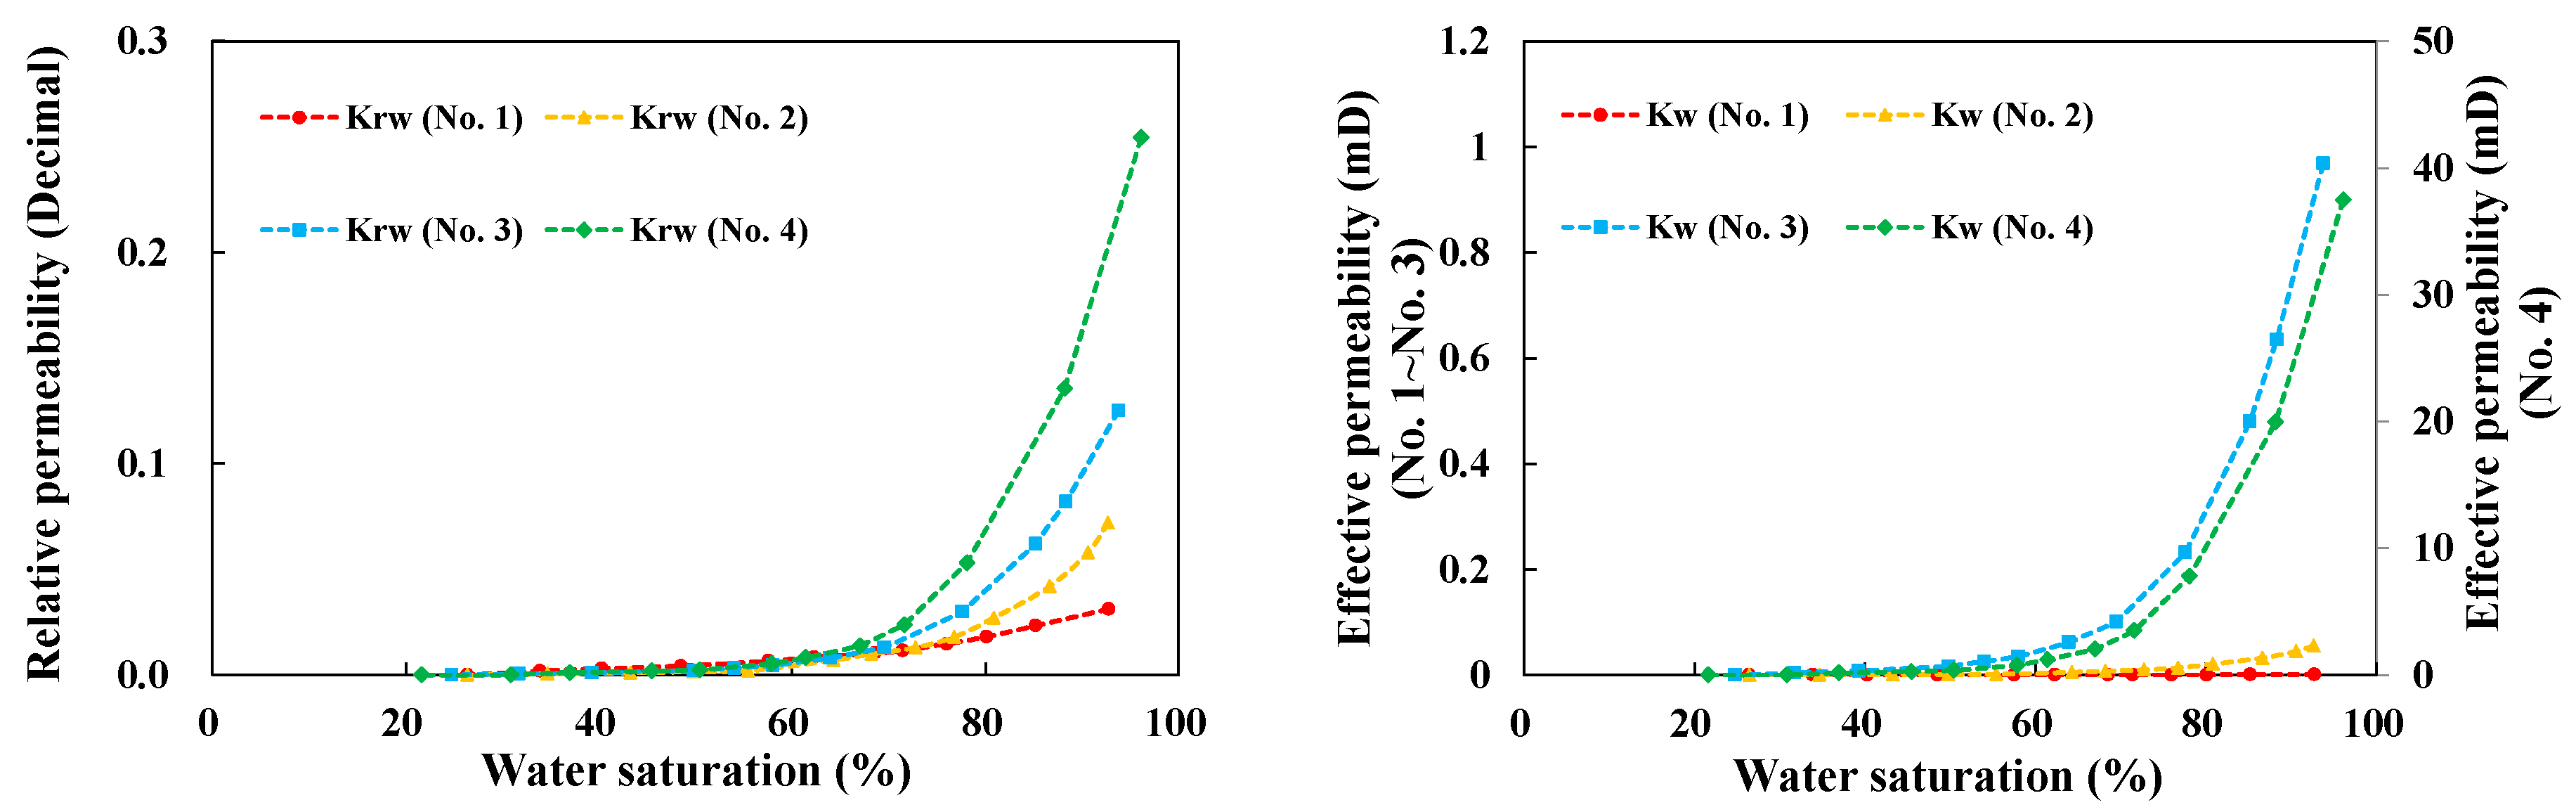
4.1.2. Water Relative Permeability under Residual Gas Saturation

The ends of the relative permeability curves of Nos. 1–4 increased sequentially. Analysis suggests that the larger the throat radius and the lower the clay content, the greater the relative permeability of the water phase under residual gas saturation. Through analysis, we find that the main reasons are as follows: (1) the sandstone samples are hydrophilic; water is the wetting phase, and nitrogen is the non-wetting phase; therefore, the interfacial tension between water and sandstone is greater; (2) the viscosity of water is much higher than that of nitrogen (by 6.24 times), so water’s resistance to flow is also much greater; (3) water molecules have a larger volume than nitrogen molecules, so they require a greater channel size. Therefore, when nitrogen is flowing, there are more channels available for use. The larger the throat radius of the sandstone sample, the smaller the flow capacity gap between nitrogen and water due to the difference in the size and quantity of the flow channels, and the greater the water phase relative permeability under the corresponding residual gas. Additionally, clay is prone to swelling when it encounters water, thereby reducing the sample’s flow capacity. Therefore, clay has a greater impact on flow capacity in the water phase than in the gas phase. The higher the clay content, the weaker the fluidity of the liquid phase compared to the gas phase. However, the influence of clay on flow capacity is not as great as that of the throat radius and the relative permeability of the water phases of Nos. 1–4 thus increased sequentially under residual gas saturation.

4.1.3. Water Effective Permeability under Residual Gas Saturation

The sequential increase in the effective permeability of the water phases of Nos. 1–4 under residual gas may have been due to the following: (1) Permeability is a manifestation of the comprehensive seepage capacity of the reservoir. The higher the permeability under reservoir conditions, the greater the fluid flow capacity; (2) the lower the residual gas saturation, the fewer pore channels occupied by the gas phase, and the greater the flow capacity of the water phase. It is known that the higher the permeability of a sandstone sample under reservoir conditions and the lower its residual gas saturation, the higher the effective permeability of the water phase under residual gas saturation.

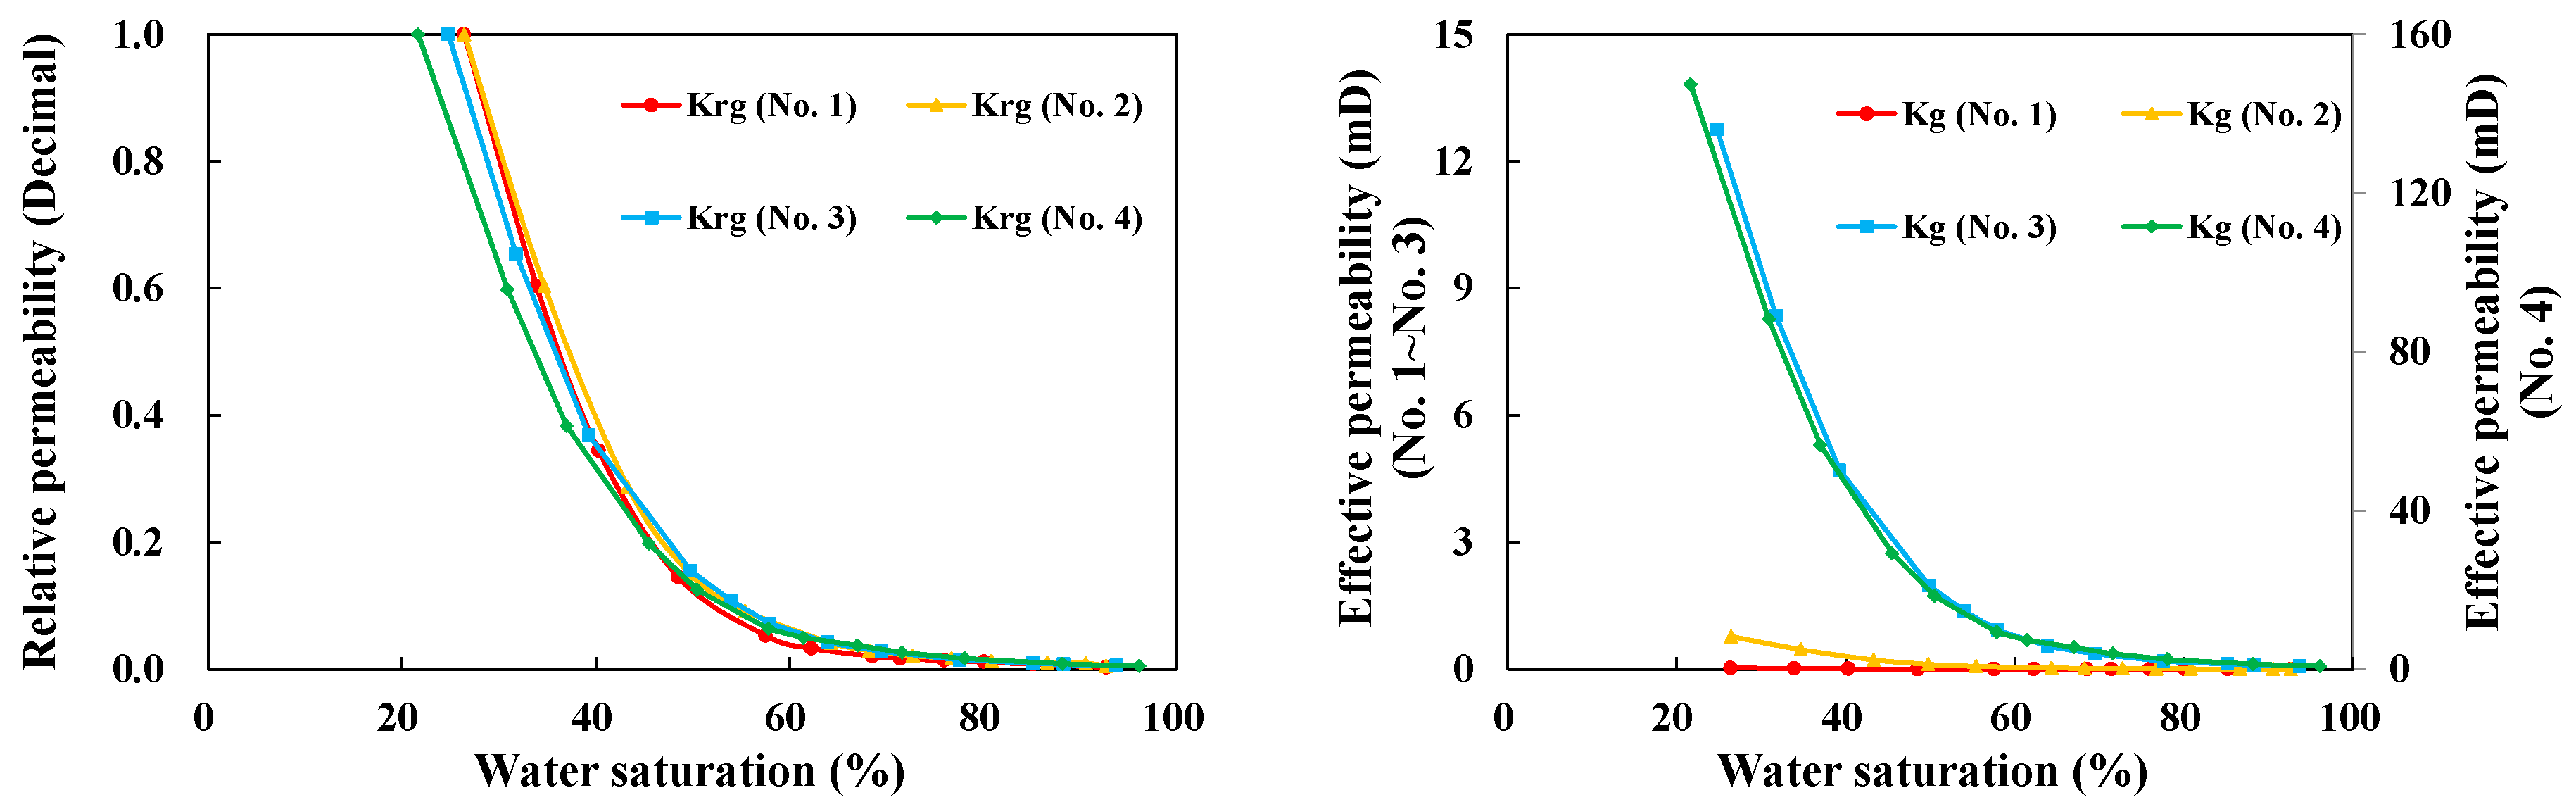
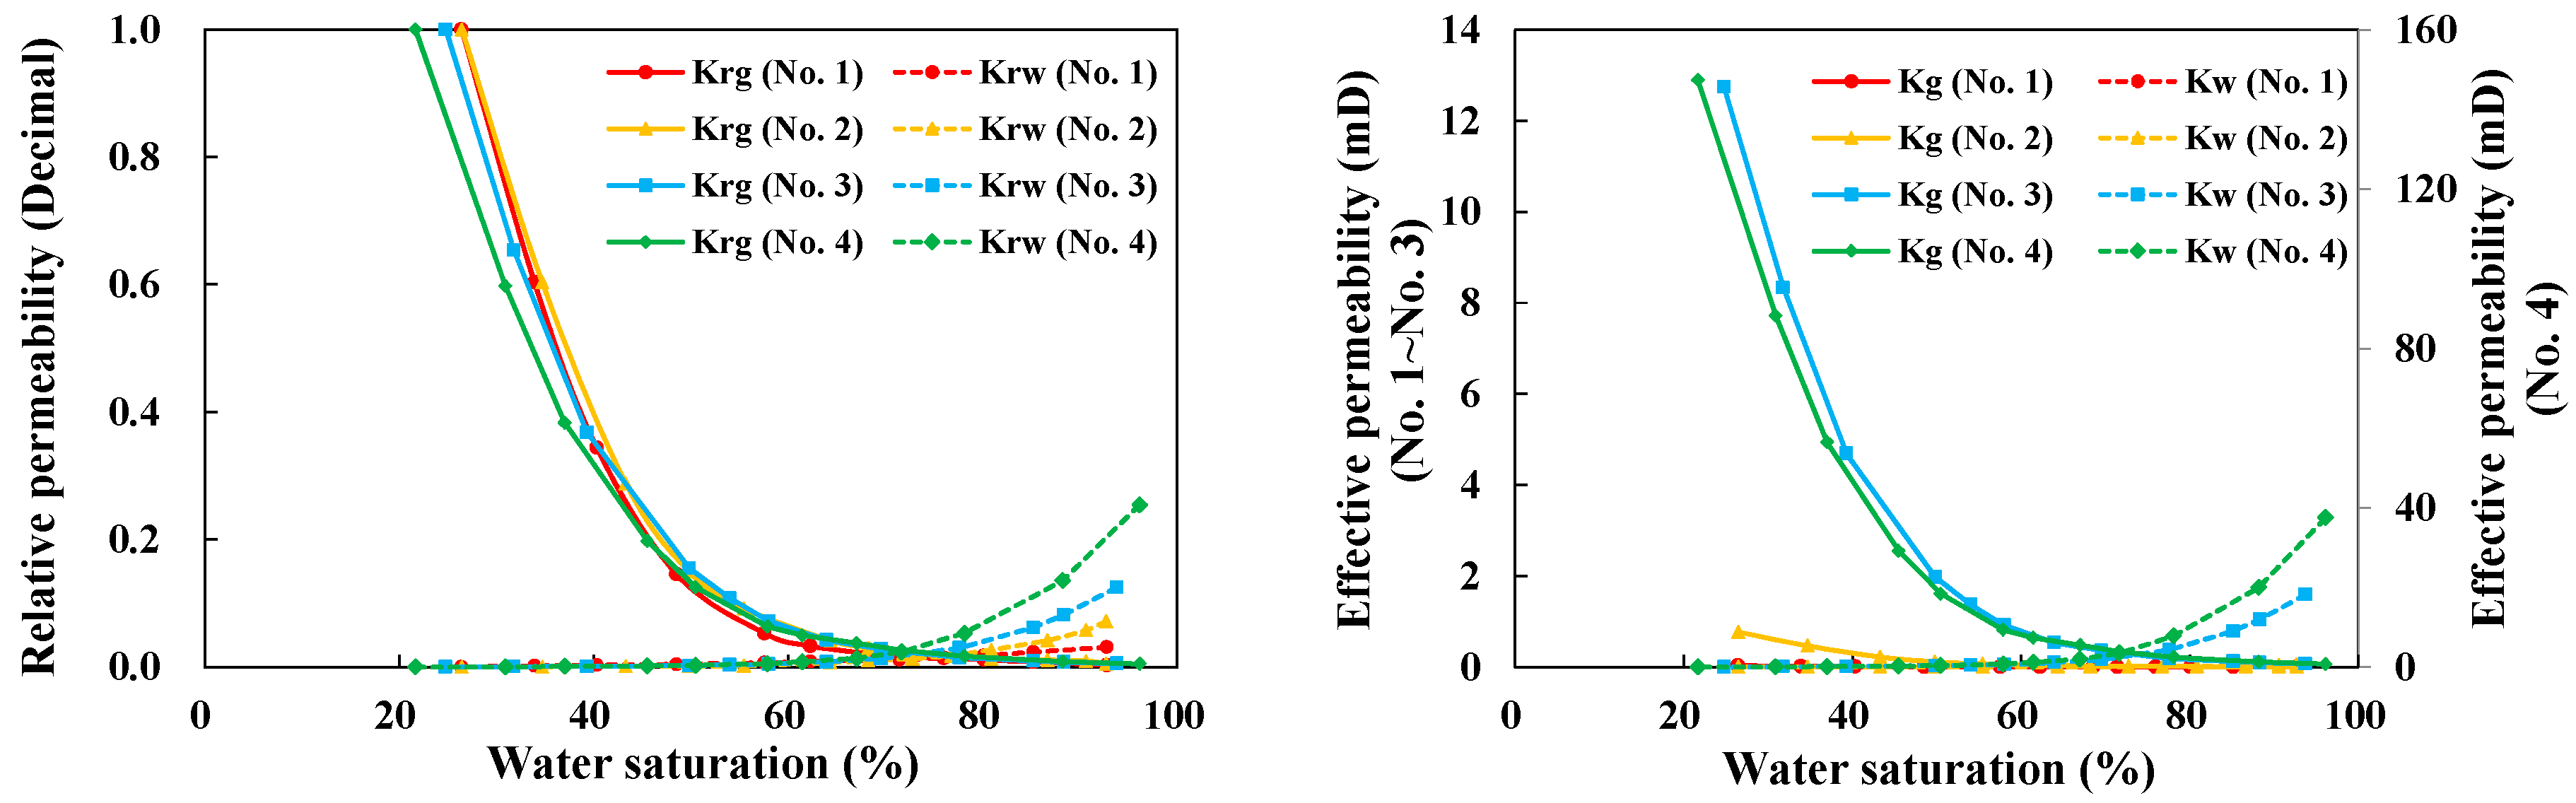
4.2. Gas Phase Flow Capacity

Curves of gas phase relative and effective permeability and water saturation of each rock sample are drawn, as shown in Figure 5. Moreover, the characteristic values of the gas phase permeability curve and the physical parameters of the rock sample are statistically presented in Table 4 for subsequent analysis.
Figure 5 shows that at the beginning of the water saturation stage’s initial increase, the easy-flowing gas in the larger pores and throats was quickly displaced out, and the gas permeability dropped swiftly. With a further increase in water saturation, the non-flowing gas in the core was gradually driven out. The gas phase’s relative permeability decreased slowly at this stage until it finally reached zero. The gas phase relative permeability graph implies a gradual increase in average throat radius, and the curve gradually shifts to the left, which is mainly due to the leftward shift of irreducible water saturation. However, this was not analyzed here. Additionally, during the initial stage of water breakthrough, the reduction in relative permeability of Nos. 4–1’s gas phases decreased sequentially. The main reason for this is that when water enters the core and attempts to adhere to the particles’ surfaces under the action of interfacial tension during the water-driven gas process (in which water is the wetting phase and gas is the non-wetting phase), it struggles to occupy the narrower pores and throats and gradually expands to the larger ones. Once a throat with a small radius is occupied by the water phase, the gas phase loses the capacity to flow. Therefore, the number of flow channels available for the gas phase in the entire core is rapidly reduced, resulting in a rapid drop in its flow capacity. Therefore, water has a more serious impact on the flow capacity of gas in low-permeability reservoirs. Once water breakthrough occurs in the low-permeability reservoir stratum, the production capacity of a gas well will rapidly decrease, possibly to the point of cessation. The effect of clay on the two-phase gas–water flow has been elaborated in detail, being characterized mainly as higher clay content relating to a weaker flow capacity, resulting in a reduction in the throat radius of the sandstone sample. Compared to No. 1, No. 2’s clay content increased by 4.70%, but its throat radius increased by 179.69%. Here the influence of clay content on the curve was less than that of the throat radius, so No. 1’s curve displayed a greater reduction than that of No. 2.

4.2.1. Residual Gas Saturation

The average throat radius of No. 3 is 4.8 times that of No. 1, and its residual gas saturation decreased by 1.00%. In the water-driven gas process, the larger the throat radius, the smaller the ratio of the pore to the throat radius, resulting in higher water-driven gas sweep efficiency and less residual gas. The average throat radius of No. 2 is 2.79 times that of No. 1. Based on the previous analysis, if the two had the same clay content, No. 2 should have had lower residual gas saturation than No. 1. On the contrary, No. 2’s clay content was 4.70% higher than that of No. 1, making the residual gas saturation of the two roughly equal. The main reason for this was that the higher the clay content of the sandstone sample, the greater the degree of compression and deformation of its pores and throats under effective stress. Additionally, some of the components in clay minerals swell when exposed to water. This swelling easily blocks the flow channels during the water-driven gas process, preventing more gas from being displaced, thus, increasing residual gas saturation. Therefore, the larger the throat radius and the lower the clay content, the smaller the residual gas saturation.

4.2.2. Gas Effective Permeability under Irreducible Water Saturation

The factors that influence the effective permeability of gas phases under irreducible water saturation are similar to those of water phases under residual gas saturation (i.e., it is related to the permeability and irreducible water saturation of the rock sample under reservoir conditions). The higher the permeability under reservoir conditions, the higher the effective permeability of gas phases under irreducible water saturation. Furthermore, the lower the irreducible water saturation, the fewer pore channels that may be occupied by the water phase, and the greater the flow capacity of the gas. Permeability reflects the comprehensive seepage capacity of the reservoir stratum; the higher its value, the better because it not only facilitates the passage of test fluid in single-phase fluid experiments but also demonstrates greater gas-phase fluid seepage capacity in a two-phase gas–water environment.

4.3. Integrated Flow Capacity

Curves of water-gas relative and effective permeability and water saturation of each rock sample are drawn, as shown in Figure 6. Moreover, the characteristic values of the permeability curve and the physical parameters of the rock sample are statistically presented in Table 5 for subsequent analysis.
Figure 6 demonstrates that although the physical properties of each sample varied dramatically, each of their relative and effective permeabilities showed basically the same trend in variation during water saturation. In the initial stage of water breakthrough, relative and effective permeability decreased rapidly, indicating that two-phase flow capacity is weaker than that of single-phase. The curve is an example of the ‘high on left and low on right’ phenomenon, indicating that the gas phase had a stronger flow capacity. Permeability is a manifestation of the comprehensive seepage capacity of a reservoir; under the same water saturation, a sample’s higher permeability means that its effective permeability will also be greater.

4.3.1. Two-Phase Co-Flow Area

The range of the two-phase co-seepage zone was mainly affected by irreducible water saturation and residual gas saturation (i.e., the impact of throat radius and clay content). The average throat radius of No. 3 is 4.8 times that of No. 1, which caused its irreducible water saturation and residual gas saturation to decrease by 1.63% and 1.00%, respectively. Therefore, the two-phase co-seepage zone increased by 2.63%. The average throat radius of No. 2 is 2.79 times that of No. 1, but its clay content also increased by 4.70%. As a result, its irreducible water saturation and residual gas saturation increased by 0.04% and 0.08%, respectively, decreasing the two-phase seepage zone by 0.12%. This entails that the larger the throat radius of the sandstone sample and the lower the clay content, the wider the two-phase co-permeation zone, which is more conducive to gas-liquid flow.

4.3.2. Water Saturation at the Iso-Permeability Point

A comparison of the water’s saturation of isotonic points in Nos. 1–4 showed that the four points decreased sequentially. The analysis revealed the reason for this to be that water molecules are much larger than those of nitrogen. The larger the throat radius, the more channels water can use, reducing resistance to flow. Therefore, water needs to occupy fewer channels to achieve the same flow capacity as nitrogen. No. 4 had the weakest stress sensitivity and the largest throat radius under normal conditions, so it also had the largest throat radius under reservoir conditions; thus, the isotonic point of No. 4 had the lowest water saturation. However, the isotonic point of No. 1 had the highest water saturation. Although No. 2 had a larger throat radius, its clay content was higher compared to No. 1, resulting in greater stress sensitivity. That, in addition to the interaction between clay and water, resulted in a reduction in the water phases’ flow capacities. Therefore, there were few differences between the water saturation of Nos. 1 and 2’s isotonic points.

5. Conclusions

By analyzing the differences in the four sandstone samples (whose physical properties under reservoir conditions differed greatly), water-driven gas-relative permeability curves yielded the following conclusions:
(1)
When sandstone samples have similar clay content, the average throat radius is four times larger, its irreducible water saturation decreased by 1.63%, and the larger the throat radius and the lower the clay content, the greater the relative permeability of the water phase under residual gas saturation.
(2)
When sandstone samples have similar clay content, the average throat radius is four times larger, its residual gas saturation decreased by 1.00%, and the larger the throat radius and the lower the clay content, the higher the effective permeability of gas phases under irreducible water saturation.
(3)
When sandstone samples have similar clay content, the average throat radius is four times larger, and the two-phase co-seepage zone increased by 2.63%. When the sandstone sample’s clay content increased by 4.70%, the two-phase seepage zone decreased by 0.12%. This entails that the larger the throat radius of the sandstone sample and the lower the clay content, the wider the two-phase co-permeation zone, which is more conducive to gas-liquid flow.

Author Contributions

Methodology, Y.L., H.Y., and X.L.; resources, M.K. and J.Z.; validation, Formal analysis, Investigation, Y.L.; writing—original draft, Y.L. and H.Y.; writing—review and editing, Y.L., H.Y., and J.Z. All authors have read and agreed to the published version of the manuscript.

Funding

This research was funded by the National Science and Technology Major Project of China, grant number 2016ZX05052–002–04 and 2016ZX05024–005–008, National Natural Science Foundation of China, grant number 51704246.

Data Availability Statement

Not applicable.

Conflicts of Interest

The authors declare no conflict of interest.

Nomenclature

K reservoir Permeability under reservoir conditions, %
r ¯ t h r o a t Mean throat radius, μm
C clay Clay content, %
S wc Irreducible water saturation, %
K rw ( S gr ) Water relative permeability at the residual gas saturation, dimensionless
K w ( S gr ) Water effective permeability at the residual gas saturation, mD
S gr Residual gas saturation, %
K g ( S wc ) Gas effective permeability at the irreducible water saturation, mD
S w ( K e ) Water saturation at the iso-permeability point, %
S g - w Two-phase co-flow area, %

Abbreviations

W ( t ) , G ( t ) Cumulative water production, cumulative gas production, cm3
W ( t ) , G ( t ) Cumulative water production after correction and cumulative gas production after correction, cm3
B w The compression factor of water, decimals
B g The compression factor of gas, decimals
R g w Gas water ratio, decimals
f W s g Water content, decimal
V W ( t ) Dimensionless cumulative water recovery, decimal
V ( t ) Dimensionless cumulative total output, decimal
V p Volume of pore, cm3
K r w Water phase relative permeability
I Relative to injection capacity or flow capacity, dimensionless, decimal
Q 0 , Q ( t ) Water production flow of rock sample outlet face at initial time and time t, cm3/s
Δ p 0 , Δ p ( t ) Displacement pressure difference at the initial time and at t, MPa
K r g Gas phase relative permeability
μ g , μ w Gas and water viscosity, mPa.s
S ge Gas saturation of rock sample outlet end face, decimal

Appendix A

Table A1. The experimental results of No.1 (The mass of saturated water is 5.31 g).
No.Cumulative Time (s)Pressure Drop (MPa)Cumulative Gas Production at Atmospheric Pressure (mL)Cumulative Water Production at Atmospheric Pressure (mL)
11320.310.080.00
21620.310.490.01
31920.311.000.02
42220.311.110.03
52520.311.220.04
62820.311.380.19
73120.311.740.49
83300.312.060.63
93480.312.410.71
103660.312.780.74
113840.312.920.76
124020.313.230.78
134200.313.530.80
144740.314.470.85
155280.315.530.90
165460.316.090.91
176000.317.260.95
186180.317.640.96
196840.319.111.00
207740.3111.701.05
218040.3112.721.06
228940.3129.791.11
2310140.3133.781.15
2412540.3142.401.23
2514940.3151.741.28
2617340.3178.851.33
2720340.3192.101.38
2823340.31105.931.43
2929340.31135.741.48
3035340.31169.621.55
3153340.31268.921.64
3271340.31380.671.75
3389340.31496.521.80
3410,7340.31650.421.86
3511,9340.31799.901.90
3615,5340.311208.211.95
3719,7340.311690.862.00
Table A2. The experimental results of No.2 (The mass of saturated water is 4.31 g).
No.Cumulative Time (s)Pressure Drop (MPa)Cumulative Gas Production at Atmospheric Pressure(mL)Cumulative Water Production at Atmospheric Pressure (mL)
1360.200.700.05
2480.201.770.11
3600.203.530.55
4720.205.590.66
5960.2011.540.78
61920.2051.690.95
74020.20188.761.40
86720.20417.551.50
97020.20446.571.55
1020820.201991.082.00
1121420.202051.612.05
1224420.202443.422.08
1327420.202827.212.15
1430420.203214.242.20
1533420.203602.742.25
1635820.203918.172.33
1736420.204098.942.35
1842420.204920.092.45
1948420.205713.162.55
2050220.205950.612.60
2150820.206028.612.63
Table A3. The experimental results of No.3 (The mass of saturated water is 1.78 g).
No.Cumulative Time (s)Pressure Drop (MPa)Cumulative Gas Production at Atmospheric Pressure (mL)Cumulative Water Production at Atmospheric Pressure (mL)
1122.100.170.00
2722.100.600.00
31322.100.900.15
41922.101.820.33
52522.102.880.35
63122.104.160.37
73722.105.080.39
87922.1010.130.44
99722.1016.410.46
1011522.1024.180.47
1113322.1033.460.49
1215122.1044.080.50
1324122.10114.450.52
1440322.10303.790.54
1547522.10407.970.57
1664922.10697.730.60
1776922.10922.590.63
1896952.101162.220.67
1910,8952.101415.750.70
2013,2952.101905.120.72
2118,0002.102481.820.74
Table A4. The experimental results of No.4 (The mass of saturated water is 4.64 g).
No.Cumulative Time (s)Pressure Drop (MPa)Cumulative Gas Production at Atmospheric Pressure (mL)Cumulative Water Production at Atmospheric Pressure (mL)
1120.020.100.00
2240.020.500.05
3360.021.500.37
4480.023.000.75
51320.025.471.14
62520.0250.001.31
74000.02100.001.50
87000.02200.001.75
910000.02300.001.90
1015000.02500.002.05
1121000.02700.002.20
1226000.02900.002.33
1331620.021400.002.41
1434620.021600.002.49
1537620.021900.002.58
1640620.022200.002.66
1743620.022600.002.75
1849620.023500.002.84
1952620.025000.002.98

Appendix B

The calculation method comes from the patent “Determination Method of Gas-water phase Permeability Curve at High Temperature and High Pressure in Formation.” This method ignores the influence of capillary pressure, fluid compressibility, and gravity. The calculation steps are as follows (Guo, P.; Fang, J.L.; Du, J.F.; Wang, Z.H.; Luo, Y.Q.; Zhao, C.L.; Dong, C.; Xiong, X.M.; Zheng, X.P.; He, J.L.; et al. For-mation-determination of Gas-Water Phase Permeability Curves at High Temperature and High Pressure 2015 ):
First, the values recorded under surface conditions are translated to ground conditions:
W ( t ) = W ( t ) B w
G ( t ) = G ( t ) W ( t ) R g w B g
Then, the relative permeability of the water phase and gas phase and the gas saturation of the outlet face of the rock samples are calculated at each time.
The relative permeability of the water phase:
f w s g = d V w ( t ) d V ( t )
K r w = f w S g d [ 1 / V ( t ) ] d { 1 / [ I V ( t ) ] }
The relative to injection capacity or flow capacity I in Equation (A4) is calculated as follows:
I = Q ( t ) Q 0 Δ p 0 Δ p ( t )
The water production flow of the rock sample outlet face at time t  Q ( t ) in Equation (A5) is calculated as follows:
Q ( t ) = W ( t ) W ( t 1 ) + G ( t ) G ( t 1 ) Δ t
The dimensionless cumulative water recovery V w ( t ) in Equation (A4) is calculated as follows:
V w ( t ) = W ( t ) V p
The dimensionless cumulative total output V ( t ) in Equation (A4) is calculated as follows:
V ( t ) = W ( t ) + G ( t ) V p
The relative permeability of the gas phase:
K r g = K r w μ g μ w 1 f w S g f w S g
The Gas saturation of the rock sample outlet face S ge is calculated as follows:
S ge = V w ( t ) V ( t ) f w S g

Appendix C

Table A5. The relative permeabilities of No.1 sandstone sample.
No.Saturation of Water (%)KrgKrw
192.760.00320.0313
285.200.00800.0233
380.120.01170.0181
475.980.01390.0148
571.430.01680.0116
668.540.02060.0104
762.260.03290.0085
857.740.05300.0067
948.510.14550.0043
1040.300.34400.0031
1133.890.60320.0019
1226.391.00000.0000
Table A6. The relative permeabilities of No.2 sandstone sample.
No.Saturation of Water (%)KrgKrw
192.680.00530.0720
290.600.00940.0580
386.650.01080.0420
480.860.01280.0270
576.780.01700.0180
672.780.02140.0130
768.230.02940.0100
864.310.04200.0070
955.430.09200.0020
1049.780.15000.0016
1143.290.28760.0011
1234.690.60330.0005
1326.431.00000.0000
Table A7. The relative permeabilities of No.3 sandstone sample.
No.Saturation of Water (%)KrgKrw
193.760.00550.1250
288.330.00780.0820
385.190.00980.0620
477.610.01480.0300
569.540.02840.0130
663.920.04220.0080
758.000.07200.0045
854.000.10800.0033
949.830.15500.0021
1039.280.36800.0010
1131.80.65400.0006
1224.761.00000.0000
Table A8. The relative permeabilities of No.4 sandstone sample.
No.Saturation of Water (%)KrgKrw
196.120.00510.2543
288.200.00870.1356
378.100.01700.0530
471.640.02660.0237
567.030.03750.0137
661.440.04970.0082
757.880.06340.0052
850.470.12500.0025
945.480.19800.0018
1037.000.38300.0011
1130.890.59800.0000
1221.651.00000.0000

References

  1. Wang, F.; Li, X.; Couples, G.; Shi, J.; Zhang, J.; Tepinhi, Y.; Wu, L. Stress arching effect on stress sensitivity of permeability and gas well production in Sulige gas field. J. Pet. Sci. Eng. 2015, 125, 234–246. [Google Scholar] [CrossRef]
  2. Li, Y.; Xiao, F.; Xu, W.; Wang, J. Performance evaluation on water-producing gas wells based on gas & water relative permeability curves: A case study of tight sandstone gas reservoirs in the Sulige gas field, Ordos Basin. Nat. Gas Ind. B 2016, 3, 52–58. [Google Scholar]
  3. Zhao, K.; Du, P. Performance of horizontal wells in composite tight gas reservoirs considering stress sensitivity. Adv. Geo-Energy Res. 2019, 3, 287–303. [Google Scholar] [CrossRef]
  4. Johnson, E.F.; Bossler, D.P.; Naumann, V.O. Calculation of relative permeability from displacement experiments. Trans. AIME 1959, 216, 370–372. [Google Scholar] [CrossRef]
  5. Brace, W.F.; Walsh, J.B.; Frangos, W.T. Permeability of granite under high pressure. J. Geophys. Res. 1968, 73, 2225–2236. [Google Scholar] [CrossRef]
  6. Hsieh, P.A.; Tracy, J.V.; Neuzit, C.E.; Bredehoeft, J.D.; Silliman, S.E. A transient laboratory method for determining the hydraulic properties of ‘tight’ rocks- I. Theory. Int. J. Rock Mech. Min. Sci. 1981, 18, 245–252. [Google Scholar] [CrossRef]
  7. Yang, Z.; Bryant, S.; Dong, M. A method to measure ultralow permeabilities of shale core in multiple directions using pressure-pulse decay technique. In Proceedings of the SPE Annual Technical Conference and Exhibition, Dallas, TX, USA, 24 September 2018. SPE191511-MS. [Google Scholar]
  8. Toth, J.; Bodi, T.; Szucs, P.; Civan, F. Convenient formulae for determination of relative permeability from unsteady-state fluid displacements in core plugs. J. Pet. Sci. Eng. 2002, 36, 33–44. [Google Scholar] [CrossRef]
  9. Fu, X.; Agostini, F.; Skoczylas, F.; Jeannin, L. Experimental study of the stress dependence of the absolute and relative permeabilities of some tight gas sandstones. Int. J. Rock Mech. Min. Sci. 2015, 77, 36–43. [Google Scholar] [CrossRef]
  10. Mamudu, A.; Taiwo, S.; Olafuyi, O. Comparative Approach to Relative Permeability Predictions. In Proceedings of the Nigeria Annual International Conference and Exhibition, Lagos, Nigeria, 31 July 2017. SPE189174-MS. [Google Scholar]
  11. Fatemi, S.M.; Sohrabi, M. Relative permeabilities hysteresis for oil/water, gas/water and gas/oil systems in mixed-wet rocks. J. Pet. Sci. Eng. 2018, 161, 559–591. [Google Scholar] [CrossRef]
  12. Babadagli, T.; Raza, S.; Ren, X.; Develi, K. Effect of surface roughness and lithology on the water-gas and water-oil relative permeability ratios of oil-wet single fractures. Int. J. Multiph. Flow 2015, 75, 68–81. [Google Scholar] [CrossRef]
  13. Guo, X.; Zou, G.; Wang, Y.; Wang, Y.; Cao, T. Investigation of the temperature effect on rock permeability sensitivity. J. Pet. Sci. Eng. 2017, 156, 616–622. [Google Scholar] [CrossRef]
  14. Yacoub, A.; Djerbi, A.; Fen-Chong, T. The effect of the drying temperature on water porosity and gas permeability of recycled sand mortar. Constr. Build. Mater. 2019, 214, 677–684. [Google Scholar] [CrossRef]
  15. Guo, P.; Zhang, H.; Du, J.; Wang, Z.; Zhang, W.; Ren, H. Study on gas-liquid relative permeability experiments of fractured-porous reservoirs. Petroleum 2017, 3, 348–354. [Google Scholar] [CrossRef]
  16. Alberto, B.; Dante, H.D.; Oscar, C.; Armando, G.; Baltasar, M.; Roberto, M. Experimental study of the effect of wettability on the relative permeability for air-water flow through porous media. Int. J. Multiph. Flow 2019, 120, 103091. [Google Scholar]
  17. Fan, J.; Zhou, H.; Liu, S.; Liu, K. Gas-water Two phases Flow Characterization and its Influencing Factors in Low Permeability Tight Sandstone. In Proceedings of the Unconventional Resources Technology Conference, Denver, CO, USA, 12–14 August 2013. SPE URTEC2013-278. [Google Scholar]
  18. Yin, X.; Shu, J.; Li, Y.; Wei, G.; Lu, J.; Wu, P.; Ma, L. Impact of pore structure and clay content on the water-gas relative permeability curve within tight sandstones: A case study from the LS block, eastern Ordos Basin, China. J. Nat. Gas. Sci. Eng. 2020, 81, 103418. [Google Scholar]
  19. Agostinil, F.; Egermann, P.; Jeannin, L.; Portier, E.; Skoczylas, F.; Wang, Y. Loading Effects on Gas Relative Permeability of a Low-Permeability Sandstone. Petrophysics 2019, 60, 326–334. [Google Scholar]
  20. Mo, S.Y.; He, S.L.; Lei, G.; Gai, S.H.; Liu, Z.K. Effect of the drawdown pressure on the relative permeability in tight gas: A theoretical and experimental study. J. Nat. Gas. Sc.i Eng. 2015, 24, 264–271. [Google Scholar] [CrossRef]
  21. Farahani, M.; Aghaei, H.; Asadolahpour, S.R. Sensitivity of unsteady-state gas-water relative permeability to experimental artefacts and interpretation techniques; case study from a gas reservoir in south Iran. J. Nat. Gas. Sci. Eng. 2019, 71, 102998. [Google Scholar] [CrossRef]
  22. Adenutsi, C.D.; Li, Z.; Xu, Z.; Sun, L. Influence of net confining stress on NMR T2 distribution and two-phase relative permeability. J. Pet. Sci. Eng. 2019, 178, 766–777. [Google Scholar] [CrossRef]
  23. Moghadasi, L.; Guadagnini, A.; Inzoli, F.; Bartosek, M.; Renna, D. Characterization of two- and three-phase relative permeability of water-wet porous media through X-Ray saturation measurements. J. Pet. Sci. Eng. 2016, 145, 453–463. [Google Scholar] [CrossRef]
  24. Zhang, G.; Yao, G.; Li, J.; Wu, H.; Liu, Z.; Li, D. A new experimental method for measuring the three-phase relative permeability of oil, gas, and water. J. Pet. Sci. Eng. 2018, 170, 611–619. [Google Scholar] [CrossRef]
  25. Andersen, P.Ø. Analytical modeling and correction of steady state relative permeability experiments with capillary end effects–An improved intercept method, scaling and general capillary numbers. Oil Gas Sci. Technol. Rev. D’ifp Energ. Nouv. 2021, 76, 61. [Google Scholar] [CrossRef]
  26. Andersen, P.Ø.; Salomonsen, L.; Sleveland, D.S. Characteristic forced and spontaneous imbibition behavior in strongly water-wet sandstones based on experiments and simulation. Energies 2022, 15, 3531. [Google Scholar] [CrossRef]
  27. Andersen, P.Ø.; Nesvik, E.K.; Standnes, D.C. Analytical solutions for forced and spontaneous imbibition accounting for viscous coupling. J. Pet. Sci. Eng. 2020, 186, 106717. [Google Scholar] [CrossRef]
  28. Zhang, T.; Li, X.; Sun, Z.; Feng, D.; Miao, Y.; Li, P.; Zhang, Z. An analytical model for relative permeability in water-wet nanoporous media. Chem. Eng. Sci. 2017, 174, 1–12. [Google Scholar] [CrossRef]
  29. Zhu, H.; Tang, X.; Liu, Q.; Liu, S.; Zhang, B.; Jiang, S.; McLennan, J.D. Permeability stress-sensitivity in 4D flow-geomechanical coupling of Shouyang CBM reservoir, Qinshui Basin, China. Fuel 2018, 232, 817–832. [Google Scholar] [CrossRef]
  30. Salimi, H.; Bruining, J.; Joekar-Niasar, V. Comparison of modified effective-medium approximation to pore-network theory for relative permeabilities. J. Pet. Sci. Eng. 2019, 184, 106594. [Google Scholar] [CrossRef]
  31. Li, Y.; Li, X.; Teng, S.; Xu, D. Improved models to predict gas-water relative permeability in fractures and porous media. J. Nat. Gas. Sci. Eng. 2014, 19, 190–201. [Google Scholar] [CrossRef]
  32. Lai, B.; Miskimins, J.L. A new technique for accurately measuring two-phase relative permeability under non-Darcy flow conditions. J. Pet. Sci. Eng. 2015, 127, 398–408. [Google Scholar] [CrossRef]
  33. Zhou, C. Predicting water permeability and relative gas permeability of unsaturated cement-based material from hydraulic diffusivity. Cem. Concr. Res. 2014, 58, 143–151. [Google Scholar] [CrossRef]
  34. Daigle, H. Relative permeability to water or gas in the presence of hydrates in porous media from critical path analysis. J. Pet. Sci. Eng. 2016, 146, 526–535. [Google Scholar] [CrossRef]
  35. Wu, F.; Fan, Q.; Huang, D.; Ma, L.; Liang, X.; Sima, L. Predicting gas-water relative permeability using Nuclear Magnetic Resonance and Mercury Injection Capillary Pressure measurements. J. Nat. Gas. Sci. Eng. 2016, 32, 35–47. [Google Scholar] [CrossRef]
  36. Sun, Q.; Zhang, N.; Alyafei, N.; Wang, Y.H.; Fadlelmula, M. Numerical Relative Permeability Upscaling Based on Digital Rock Analysis. In Proceedings of the Reservoir Characterisation and Simulation Conference and Exhibition, Abu Dhabi, UAE, 17 September 2019. SPE196687-MS. [Google Scholar]
  37. Mo, F.; Peng, X.; Devegowda, D.; Tang, Y.; Sun, H.S. Permeability jail for two-phase flow in tight sandstones: Formulation, application and sensitivity studies. J. Pet. Sci. Eng. 2020, 184, 106583. [Google Scholar] [CrossRef]
  38. Tan, X.H.; Li, J.; Li, X.P.; Zhang, B.J.; Li, X.C. Flow model of a multi-stage hydraulic fractured horizontal well based on tree-shaped fractal fracture networks. J. Pet. Sci. Eng. 2018, 169, 494–503. [Google Scholar] [CrossRef]
  39. Tan, X.H.; Li, X.P.; Liu, J.Y.; Zhang, G.D.; Zhang, L.H. Analysis of permeability for transient two-phase flow in fractal porous media. J. Appl. Phys. 2014, 115, 113502. [Google Scholar] [CrossRef]
  40. Tan, X.H.; Liu, C.Y.; Li, X.P.; Wang, H.Q.; Deng, H. A stress sensitivity model for the permeability of porous media based on bi-dispersed fractal theory. Int. J. Mod. Phys. C 2018, 29, 1850019. [Google Scholar] [CrossRef]
  41. Han, X.B.; Tan, X.H.; Li, X.P. A water invasion unit numerical simulation model for the distribution of water and water invasion channel in complex edge water reservoir. J. Pet. Sci. Eng. 2022, 215, 2–20. [Google Scholar] [CrossRef]
  42. Liu, L.; Dai, S.; Ning, F.; Cai, J.C.; Liu, C.L.; Wu, N.Y. Fractal characteristics of unsaturated sands−implications to relative permeability in hydrate-bearing sediments. J. Nat. Gas. Sci. Eng. 2019, 66, 11–17. [Google Scholar] [CrossRef]
  43. Yang, J.P.; Chen, W.Z.; Tian, H.M.; Yu, H.D. Study of permeability evolutions in low permeability medium under different stresses and temperatures. Rock. Soil. Mech. 2009, 30, 3587–3595. [Google Scholar]
  44. Fang, J.; Guo, P.; Xiao, X.; Du, J.; Dong, C.; Xiong, Y.; Long, F. Gas-water relative permeability measurement of high temperature and high pressure tight gas reservoirs. Pet. Explor. Dev. 2015, 42, 92–96. [Google Scholar] [CrossRef]
  45. Li, Y.L.; Li, X.P.; Wu, F.; Lu, H.L.; Lei, X.; Wang, W.J.; Lu, R.B.; Tan, X.H. Experimental study on stress sensitivity of high-temperature and high-pressure sandstone gas reservoirs in Yingqiong Basin. Energy Sci. Eng. 2020, 8, 1–10. [Google Scholar] [CrossRef]
  46. GB/T 28912–2012; Test Method For Two Phase Relative Permeability In Rock. Standardization Administration of China: Beijing, China, 2012.
Figure 1. Pore radius distribution of each core.
Energies 16 00036 g001
Figure 2. Throat radius distribution of each core.
Energies 16 00036 g002
Figure 3. Schematic diagram of the multi-functional core displacement device. 1—gas cylinder; 2—water tank; 3—gas pump; 4—water pump; 5—piston container; 6—inlet pressure gage; 7—confining pressure valve; 8—core holder; 9—drying oven; 10—confining pressure gage; 11—outlet pressure gage; 12—back pressure valve; 13—confining pressure pump; 14—gas flowmeter.
Energies 16 00036 g003
Figure 4. Water phase relative and effective permeability curve.
Energies 16 00036 g004
Figure 5. Gas phase relative and effective permeability curve.
Energies 16 00036 g005
Figure 6. Relative and effective permeability curves of 4 cores.
Energies 16 00036 g006
Table 1. Basic parameter of rocks.
No.Diameter,
cm
Length,
cm
Porosity, %Permeability, mD
Conventional
Conditions
Reservoir
Conditions
Conventional
Conditions
Reservoir
Conditions
12.464.708.338.080.1120.062
22.494.9118.5516.874.5902.688
32.504.6419.2718.6520.38017.524
42.504.9220.6019.89192.251176.652
Table 2. Mineral compositions of rock samples.
No.Non-Clay Minerals Composition, %Clay Content, %
QuartzFeldsparCalciteDolomiteSiderite
170.716.26.61.20.25.1
265.213.95.24.61.39.8
371.115.54.93.00.05.5
470.314.74.73.90.26.2
Table 3. Water phase characteristic value and rock sample property parameter.
No. K reservoir , mD r ¯ t h r o a t , μ m C clay , % S wc , % K rw ( S gr ) K w ( S gr ) , mD
10.0620.5225.126.390.0310.001
22.6881.4609.826.430.0720.056
317.5242.5095.524.760.1250.969
4176.6524.7155.321.650.25437.487
Table 4. Gas phase characteristic value and rock sample property parameter.
No. K reservoir ,   mD r ¯ t h r o a t ,   μ m C clay ,   % S gr ,   % K g ( S wc ) ,   mD
10.0620.5225.17.240.031
22.6881.4609.87.320.772
317.5242.5095.56.2412.750
4176.6524.7155.33.88147.403
Table 5. Two-phase characteristic values and rock sample property parameters.
No. K reservoir ,   mD r ¯ t h r o a t ,   μ m C clay ,   % S g - w ,   % S w ( K e ) ,   %
10.0620.5225.166.3776.81
22.6881.4609.866.2576.11
317.5242.5095.569.0073.71
4176.6524.7155.374.4771.91
Disclaimer/Publisher’s Note: The statements, opinions and data contained in all publications are solely those of the individual author(s) and contributor(s) and not of MDPI and/or the editor(s). MDPI and/or the editor(s) disclaim responsibility for any injury to people or property resulting from any ideas, methods, instructions or products referred to in the content.

