Abstract
In the early construction of cavern leaching in salt cavern gas storages, the inner leaching tubing is often blocked, frequently leading to the bending deformation phenomenon of the leaching strings, which can result in out-of-control cavity shapes. It is difficult to monitor the stress, vibration, and morphological changes of the inner tube during the construction of a cavity. There are few research results in this field at home and abroad, and they are limited only to preliminary explorations of the mechanism or summaries and speculation of the field operation. In this paper, an experimental device for testing the dynamic characteristics of salt cavern leaching strings is developed based on the similarity principle. The device is used to simulate two types of operation processes, i.e., the direct and reverse circulation leaching processes. The experimental data are processed using the modal analysis method to obtain the vibration characteristic parameters of the inner leaching tubing in the circulation process with identical flow rates inside the tubing and the annular region. The following main conclusions can be drawn: The circulation mode has no significant effect on the vibration frequency of cavern leaching strings. The deformation characteristics of cavern leaching strings during direct and reverse circulation are identical, featuring maximum deformation at the bottom and minimum deformation in the middle. The maximum deformation of cavern leaching strings during reverse circulation is about 1.5 times that during direct circulation. Through an experimental investigation and analysis, the effects of the water injection rate and the cavern leaching method on the vibration frequency and bending deformation of cavern leaching strings was determined, providing a reference for further solving the bending problem of cavern leaching strings in combination with engineering practice.
1. Introduction
The construction of energy reserve storages is an indispensable part of the strategic plan for fossil fuels, such as oil and gas, and renewable energy. As one of the five links in the industrial chain of natural gas, i.e., “production, transportation, storage, marketing, and use”, gas storage plays an important role in natural gas peak regulation and strategic energy reserves. Moreover, it is an important means to ensure a safe and stable gas supply network and national energy security. Salt cavern gas storages (SCGS) are one of the four types of underground gas storages that have been considered as an ideal place for the underground storage of oil, gas, and high-level nuclear waste. Their advantages are associated with the unique geological conditions of salt rock (e.g., a wide distribution, large scale, simple structure and hydrological conditions, and good waterproof performance of the cover layer), the excellent physical properties (e.g., a compact structure, low porosity, low permeability, and good damage self-healing ability), as well as their economy, security, and environmental protection characteristics [1,2,3]. In addition, SCGSs have the merits of a high injection-production rate, large storage volume, and good safety and reliability, and their operation is little affected by the climate; thus, they have gained a wide application [4,5].
SCGSs are used to dissolve the target mineral stratum and transport it away from the underground by injecting clean water into the target salt-bearing stratum and making use of the salt dissolution effect of water. Eventually, a cavity with a certain volume and shape is formed, which is then used to store natural gas resources [6]. At the moment, the method of convective water-soluble mining via a single-well oil cushion is generally adopted in the construction of salt rock storages. The basic principles of this method are as follows: Three types of casing tubing are inserted into the bottom of a cavity well, including central tubing, intermedium tubing, and intermediate casing tubing. In general, diesel oil is injected into the annular space between the intermediate casing and intermedium tubing. It is well known that oil is insoluble in water and minerals and its density is lower than that of water. Based on the above properties, the diesel oil floats on the surface of the water and forms a protective oil cushion layer on the top of the cavity in salt caverns, effectively preventing the dissolution of the salt rock on top of the cavity. Therefore, the existence of the oil cushion plays an important role in controlling the cavity shape [7]. Different water-injection methods can lead to different leaching rates, thus forming cavities with different geometrical shapes [8]. Based on the water injection methods, cavern leaching methods can be divided into direct and reverse circulation cavern leaching. In direct circulation cavern leaching, water is injected into the central tubing, and the brine dissolved to a saturated state flows out from the annular space between the central and intermedium tubing. Through this circulation mode, a pear-shaped cavity with a large diameter at the bottom and a small diameter at the top tends to form. In reverse circulation cavern leaching, water is injected from the annular space between the central and intermedium tubing, and the saturated brine flows out from the central tubing. Through this circulation mode, an inverted cone cavity is formed. Figure 1a,b show the flow paths of these two circulation modes [9].
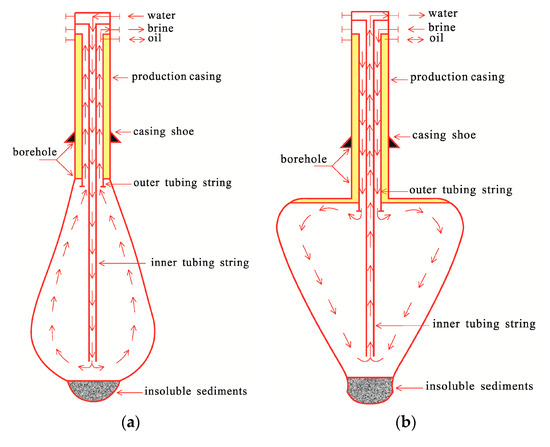
Figure 1.
Schematic of direct circulation and reverse circulation in single-well cavity construction. (a) Direct circulation process; (b) reverse circulation process.
Currently, the tubing–string combination commonly used in water-dissolving cavern leaching in China is a three-layer tubing–string system (Table 1). Its outermost layer is the production casing tubing, the adjacent layer is the outer leaching tubing, and the innermost layer is the inner leaching tubing [10]. Cavern leaching strings, i.e., inner and outer tubing, are freely suspended from the surface wellhead to the underground dissolved cavity. Considering the needs for well repair and cavity testing, there is generally no support between the inner leaching tubing and the inner wall of the outer leaching tubing, or between the outer leaching tubing and the inner wall of the production casing tubing. To keep the work efficiency of cavern leaching at high levels, the cavern leaching strings may work continuously underground (a kilometer or so from the earth’s surface) for months in the cavity body filled with brine. However, it is difficult to monitor the working status and stress distribution of leaching strings. Only when there is a need to control the cavity shape by adjusting the distance between the outlets of the inner and outer leaching tubing are the leaching strings allowed to be pulled out for detection and replacement.

Table 1.
Matching table of three-layer tubing–string for commonly used cavern leaching process.
However, in the cavern leaching process of SCGSs, it is often found on site that, even when the cavern leaching technology satisfies the design requirements and the leaching strings are well coordinated, severe bending and damage frequently occur in cavern leaching strings. As the most important tool in the construction of SCGSs, carving leaching strings are the only channel connecting the underground salt cavern and the surface wellhead equipment for freshwater injection and brine rate control. Therefore, its reliability and stability directly affect the progress and cost of cavern leaching projects. Hence, it is very important to investigate the deformation of cavern leaching strings and the related influencing factors. Figure 2 shows the deformation diagram of cavern leaching strings during the on-site constructions of the Jintan and Jianghan SCGSs [11,12,13]. When inspecting the tubing systems on the construction sites, the inner leaching tubing were often obstructed, and the most bent parts were the three leaching strings at the bottom. The bending deformation of the inner leaching tubing leads to cavities with irregular shapes, and the repair of the damaged tubing strings results in the extension of the operation cycle, which can be reflected in the following four aspects:
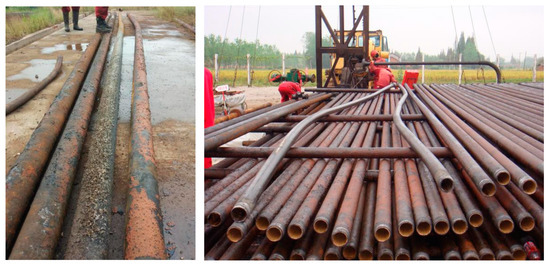
Figure 2.
Bending deformation diagram of leaching strings of SCGSs.
(1) Forcibly pulling out the bent inner leaching tubing may break the wall of the outer leaching tubing, and diesel oil can enter the outer leaching tubing from the damaged location in the subsequent cavern leaching process. In severe cases, the oil cushion cannot be formed on the top of the cavity.
(2) When pulling out the bent inner leaching tubing and the damaged outer leaching tubing, tubing stuck accidents can easily occur.
(3) The bending of the inner leaching tubing can cause the off-centralization of the leaching strings and a shallower string outlet depth, leading to the partial solution of the salt rock layer and out-of-control cavity shapes.
(4) The pulling-out operation of the bent strings prolongs the storage construction time and increases the construction costs.
Since it is difficult to monitor the stress state, vibration state, and shape changes of the inner leaching tubing during cavity construction, there are only few available research results in this field, which are limited only to preliminary studies on the mechanism or summaries and speculation of the field operation. Based on the structural characteristics of the double-layer tubing, Kyriakos et al. [14] discussed the possibility of elastic instability of the leaching strings of the cantilever tubing under the condition of simultaneous flow in the internal and external axial directions and conducted experimental and theoretical analyses. They concluded that the stability of the inner leaching tubing is determined by the internal flow, while the external flow plays an insignificant role. More specifically, when the flow rate is lower than the critical flow rate, the vibration amplitude of the string is very small; with the increase in the flow rate, the vibration amplitude of the string increases slowly and the vibration frequency becomes unstable. Shi et al. [15,16] reported that the damage of cavern leaching strings in salt cavern storages is caused by the collapse of the insoluble interlayer in salt rock, and proposed prediction and control methods for the collapse of the interlayer. Li et al. [17,18,19] published a preliminary discussion on the dynamic characteristics of leaching strings during the single-well water-soluble cavern leaching process of salt cavern storages. They believed that the self-induced vibration and dynamic instability of the leaching strings in a confined space are the main reasons for their serious bending or damage. Furthermore, they analyzed the vibration characteristics of the inner and outer leaching strings without spatial constraints and deduced calculation equations for the critical flow rate of leaching strings. They concluded that the dynamic instability of leaching strings occurs frequently under the unconstrained condition due to the liquid–solid coupling vibration, while the instable failure of the inner leaching tubing generally occurs before that of the outer leaching tubing. Wei et al. [20] conducted a statistical analysis on the cavitation problem of the leaching strings in the SCGSs of the Jianghan Oilfield and concluded that when the injection amount is higher than the critical fluid carrying flow rate, instability and deformation of the leaching strings may occur. Liu et al. [21] developed a nonlinear flow-induced vibration model of the leaching tubing of SCGSs using the energy method, element method, and Hamiltonian variational principle. They revealed that the safety of leaching tubing could be effectively improved by selecting leaching strings with a larger size when other conditions were satisfied. Cen et al. [22] performed field observations, a mechanical analysis, and a production data analysis, and determined that the main reasons for the bending of the oil casing tubing include liquid–solid coupling instability, interlayer rock impact and smash damage, and string wear and corrosion.
The current experimental and theoretical research is mainly focused on the direct circulation of the cavern leaching process and concerns only preliminary mechanistic studies, with no similarity experiment studies having been conducted. Moreover, no systematic studies have been performed on the vibration characteristics of cavern leaching strings under cavern leaching conditions. In addition, reverse circulation is also an important means for cavity expansion in the mid-term and later stages of cavity leaching. The stress state and vibration conditions of leaching strings are similar to those in the suction process, which are still controversial in the academic community [23,24,25].
In this study, an experimental device for testing the dynamic properties of the leaching strings of salt cavern storages is developed based on the similarity principles. The device is used to simulate the two operation processes of direct and reverse circulation in the cavern leaching process. The obtained data are processed using the modal analysis method to obtain the vibration characteristic parameters of the inner leaching tubing in the circulation process, where the tubing interior and annular region have the same flow rate. Therefore, by analyzing the influence of water injection displacement on the self-excited vibration of the pipes in the cavern, the vibration failure mechanism of the pipes in the cavern can be further revealed, which provides a basis for the selection of pipe string parameters and displacement in the actual salt cavern construction process. Therefore, it has important theoretical and engineering significance.
2. Experiment Introduction
The leaching strings of SCGSs are composed of three layers of coaxially nested tubing, including the outer leaching tubing, inner leaching tubing, and production casing tubing. The upper end of the leaching strings is connected with and fixed on the wellhead grounding system, the lower end is freely suspended in the salt rock cave, and the middle part is located in the confined space of the production casing tubing. In the leaching production process of salt caverns, the leaching strings and the water flow can form a typical cantilever flow tubing. Due to the complexity of the three-layer leaching string system and in order to simplify the analysis of the experimental model, in this experiment, the outer leaching tubing was considered a rigid wall. The effects of the fluid flow inside the inner leaching tubing and in the annular region between the inner and outer leaching tubing on the leaching strings were emphatically investigated. Moreover, the effects of different water injection displacement and circulation modes on string vibration and deformation were analyzed. In the actual downhole confined space, the liquid–solid coupling vibration may lead to the instability failure of the casing string, so this paper mainly considers two parameters, those being frequency and amplitude.
Based on the connection state and working environment of cavern leaching strings in the actual production of salt caverns, a large-scale physical experimental configuration for testing the dynamic characteristics of cavern leaching strings in salt caverns was built to simulate the direct and reverse circulation processes. A theoretical diagram and a physical map of the experimental device are depicted in Figure 3.
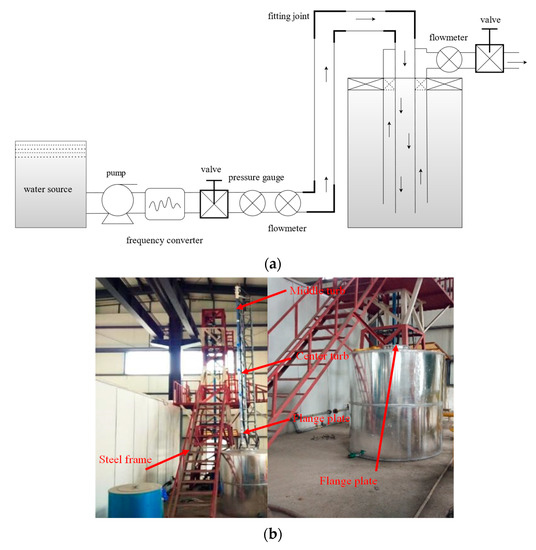
Figure 3.
Schematics of the experimental device. (a) Theoretical diagram; (b) physical map.
2.1. Experimental Principles
There are mainly two ways to study fluid mechanics problems; one is to use the mathematical analysis method to identify the laws of fluid motion, establish equations, and solve these equations; the other is to experimentally determine the relationships between the physical quantities of fluid motion. The experimental research includes direct and model-based experimental research. The results from direct experimental research can only be applied to specific experimental conditions or can only be extended to problems with exactly the same experimental conditions. Clearly, the direct experimental research method is associated with several limitations. In this study, based on the similarity theory of fluid experimentation, there are certain proportional relationships between the physical quantities of the control model and the prototype at corresponding points, which include geometrical, motional, and dynamic similarities of the fluid; thus, the results have practical and effective significance.
2.2. Experimental String Model
Since it is difficult to collect real data on-site and simulate the deformation of cavern leaching strings in a salt cavern thousands of meters deep, the similarity theory can be used to perform corresponding simulations and calculations. By selecting appropriate string materials, the deformation of leaching strings in a salt cavern under actual working conditions can be simulated, and then, the deformation characteristics can be analyzed based on the obtained results.
(1) Natural frequency of leaching strings
The natural frequency of salt cavern leaching strings is affected by their material and stiffness. The first five natural frequencies of actual leaching strings can be determined according to the Euler–Bernoulli beam theory. The differential equation for the motion of cantilever beams [26,27] is
where ρ is the material density of the salt cavern leaching strings (g/cm3); A is their cross-sectional area (m2); E is their elastic modulus (Pa); and I is the inertia moment of their cross-sectional area (N). Equations (2)–(5) are the boundary conditions of the cantilever beam.
By solving Equation (1), the first five natural frequencies of the salt cavern leaching strings under the cantilever state were obtained (Table 2).

Table 2.
Natural frequencies of actual leaching strings in salt caverns.
(2) Selection and checking calculation of leaching strings
Figure 4 depicts the physical maps of the inner leaching tubing and the direct and reverse circulation devices. Polyethylene (PE) was set as the material of the experimental strings. Table 3 lists the main physical parameters of the experimental string model.
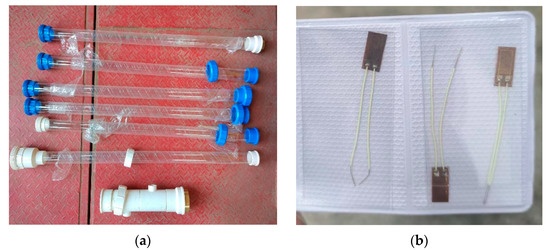
Figure 4.
Physical map of the experimental device. (a) Outer leaching tubing; (b) experimental device for reverse circulation.

Table 3.
Main physical parameters of the experimental string model.
In order to assess whether the PE pipe can produce the same deformation effect as the actual salt cavern leaching strings, a checking calculation was conducted based on the parameters in Table 3 and the longitudinal vibration model; the results are exhibited in Figure 5.
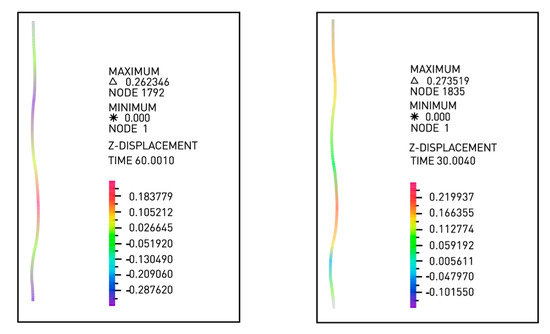
Figure 5.
Checking calculation results of the experimental strings.
2.3. Experimental Data Acquisition System
As depicted in Figure 6, eight groups of collection points were arranged around the leaching strings. Each group of collection points included three collection points on the same string cross-section that were uniformly distributed across the circumference at intervals of 120°. In total, there were 32 collection points. For each collection point, two strain gauges were arranged in the longitudinal and horizontal directions for temperature compensation and to eliminate experimental errors in the experimental process, such as temperature and initial deformation errors. The first and eighth groups of collection points were 0.15 m far away from their adjacent end faces of the experimental strings, while the spacing between two adjacent groups of collection points was 1.1 m. As illustrated in Figure 7, the vibration amplitude signal was collected and processed with a multi-channel dynamic strain collector to obtain the vibration amplitude, frequency spectrum, and phase information of the system.
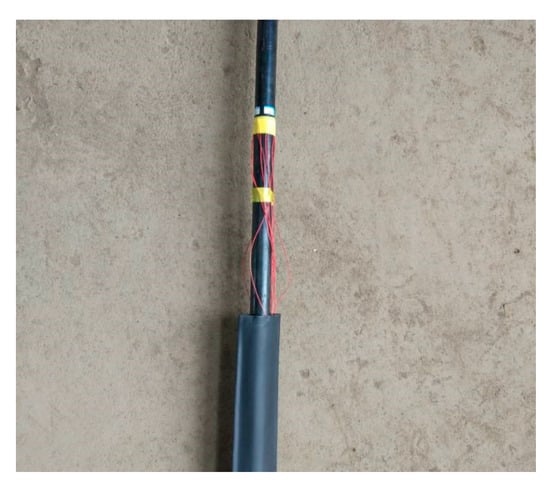
Figure 6.
Attachment and silicone-based waterproof treatment of strain gauges.
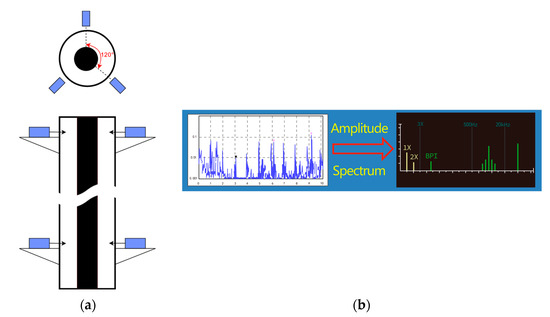
Figure 7.
Design of experimental data collection system. (a) Schematic of the strain gauge; (b) multi-channel dynamic strain collector.
The displacement, vibration parameters, and strain data of the leaching column during the experiment can be measured and calculated using the relevant equipment. A water pump and the connected water pipe were used to inject water into the tank, and the pump rate was controlled through the inlet and outlet valves and the frequency converter. The water flow rate was measured with a flowmeter. The switching between direct and reverse circulation was realized by changing the position of the connecting pipe heads. Strain data were collected using a strain gauge attached to the experimental strings, and were then transmitted to the multi-channel dynamic strain collector through the shielded wire; finally, the vibration and strain data of the strings were exported.
2.4. Experimental Working Conditions
In this experiment, the similar object selected according to the similarity principle was the actual size of the on-site inner leaching tubing, which had an outer diameter of 114.3 mm, 88.9 mm, and 73 mm. The length of the cavern leaching strings in the salt cavern could be adjusted during the production process. In this experiment, three groups of water injection displacement levels were designed to study the effect of the water injection displacement change during direct and reverse circulation on the vibration characteristics of the cavern leaching strings during production. The specific parameters are listed in Table 4.

Table 4.
Experimental working conditions for direct and reverse circulation with different water injection rates.
3. Experimental Data Processing
The strain data collected with the strain gauges and the strain data collection instrument should be post-processed to acquire the strain deformation and vibration characteristics of the experimental strings. First, data preprocessing was performed, including strain angle correction and filtering interference elimination to obtain the modal vibration shapes and axis curvatures of the strings. Thus, the strain-time and displacement-time histories could be obtained. On this basis, the deformation and vibration characteristics of the experimental strings were analyzed by studying their deformation characteristics and vibration modes and frequencies.
3.1. Modal Analysis Method of Experimental Data Processing
Modal analysis is a process of analyzing the natural frequency and mode shape of a structure. Modal analysis methods include the computational and experimental modal methods. The former determines the structural modes using the finite element method, while the latter does this by analyzing the input and output data collected experimentally. The modal analysis of salt cavern leaching strings can provide certain guidance for understanding the dynamic characteristics and fatigue failure of salt cavern leaching strings. In this study, the experimental modal method [28,29] was used to conduct the modal analysis of the salt cavern leaching strings.
Assuming that the experimental strings undergo small deformation, the displacement of their axis line in the flow direction within a certain time period can be expressed as follows:
where t is the time (s); z is the axial coordinate of the strings; l is their length (m); is their displacement in the axis line (m); is the modal vibration shape; and is the modal weight.
The string curvature in the axial flow direction is
The strings can be simplified as simply supported beams, and their vibration mode can be expressed as
By substituting the modal vibration shape of displacement into Equation (6), the curvature can be given as
Subsequently, the curvature and strain have the following relationship:
where is the surface strain in the string flow direction and R is the radius of the string (m).
By combining Equations (9) and (10), we can obtain
where is the modal vibration shape and is the modal weight.
Assuming that the coordinate along the string length direction is Zm, m = 1, 2, 3… M, then, the measured signals can be expressed as
where represents the measured signal, is the strain signal, and is the noise signal.
Assuming that the natural mode is a sinusoidal function and that the N-order modal analysis meets the requirements, then
First, the expansion form of the i-th order mode shape at M test points is as follows:
Then, the expansion of the N-order mode at M test points can yield an M × N matrix as follows:
The matrices of the measurement signals, noise signals, and modal weights are as follows:
Equation (20) can be rewritten as
The solution of Equation (21) is
where represents the determined displacement weight. Due to the effect of noise, there is a certain deviation between and the actual e(t).
In the equation, , and and the true solution is e(t). When the number of modes involved in the calculation is lower than the number of measurement points, Equation (20) does not hold and it needs to be solved by the least square method; thus, we can obtain
where H = . Using Equation (19), the displacement weight can be obtained, and then, the displacement of the water-secluding pipe in the axis-line flow direction w(t,z), can be determined by Equations (13) and (15).
3.2. Frequency Analysis Method
In the experiment, the strain–vibration curves of the experimental strings were collected by the strain data collection instrument, and the vibration frequency were obtained by the Fourier transform method.
When vibration occurs, the string experiences periodic vibration in both the lateral and flow directions, which can be expressed by a Fourier series as follows:
where is the vibration amplitude; n is the angular frequency; t is a certain time point; and is the initial phase angle.
After sampling at equal intervals, the continuous signal can be transformed into N discrete points. In this case, the series can be expressed as follows:
where , , , and are constants and N is the serial number of the corresponding continuous signal at a certain time point.
By solving Equation (25), the highest serial number of the fitting frequency n is N/2, which is called the Nyquist frequency.
4. Experimental Results and Discussion
4.1. Effect of Water Injection Rate on the Vibration Amplitude of Cavern Leaching Strings
In the experiment, the water injection rate of the inner leaching tubing was set as 54 L/min, 72 L/min, and 90 L/min. The distance between the inner and outer leaching tubing outlets was 0.6 m, and the water injection pressure was 0.5 MPa.
Figure 8 shows the vibration time-domain diagrams of the bottom of the inner leaching tubing with different water injection rates for direct and reverse circulation. It can be seen from Figure 8 that the vibration amplitude is 1.211 × 10⁻²¹ m when the displacement of the inner tube is 54 L/min under the positive cycle condition. When the displacement of the tube in the cavity is 72 L/min, the vibration amplitude is 2.3717 × 10⁻²¹ m; when the displacement of the tube in the cavity is 90 L/min, the vibration amplitude is 2.9323 × 10⁻²¹ m. In reverse circulation, the vibration amplitude is 3.6873 × 10⁻²¹ m when the displacement of the inner tube is 54 L/min. When the displacement of the tube in the cavity is 72 L/min, the vibration amplitude is 6.8613 × 10⁻²¹ m; when the displacement of the tube in the cavity is 90 L/min, the vibration amplitude is 9.3851 × 10⁻²¹ m. It can be observed that, regardless of direct or reverse circulation, the vibration amplitude at the bottom of the inner leaching tubing increased with the increase in the water injection rate. With the same water injection displacement, the string vibration amplitude of reverse circulation is greater than that of positive circulation.
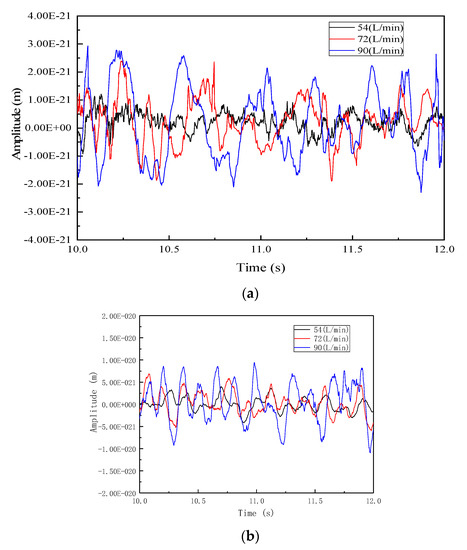
Figure 8.
Vibration time-domain diagrams of the bottom of the inner leaching tubing with different water injection rates. (a) Direct circulation; (b) reverse circulation.
4.2. Effect of Water Injection Rate on the Vibration Frequency of Cavern Leaching Strings
(1) Direct circulation process
Figure 9 shows the variation in the vibration frequency of the inner leaching tubing with different water injection rates for direct circulation. For the three water injection rates of 54 L/min, 72 L/min, and 90 L/min, the maximum vibration frequencies of the inner leaching tubing were 5.1 Hz, 5.8 Hz, and 6 Hz, respectively. With the increase in the water injection rate, the vibration frequency increased slightly, having an average value of 5.6 Hz.
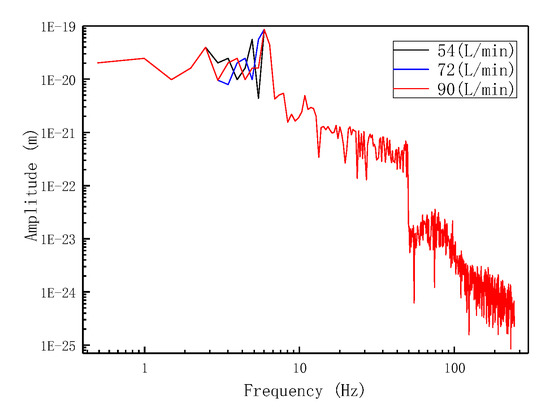
Figure 9.
Vibration frequency variation of the inner leaching tubing with different water injection rates for direct circulation.
(2) Reverse circulation process
Figure 10 shows the variation in the vibration frequency of the inner leaching tubing with different water injection rates for reverse circulation. For the three water injection rates of 54 L/min, 72 L/min, and 90 L/min, the maximum vibration frequencies of the inner leaching tubing were 5.1 Hz, 5.6 Hz, and 5.8 Hz, respectively. With the increase in the water injection rate, the vibration frequency of the inner leaching tubing increased slightly, having an average value of 5.5 Hz.
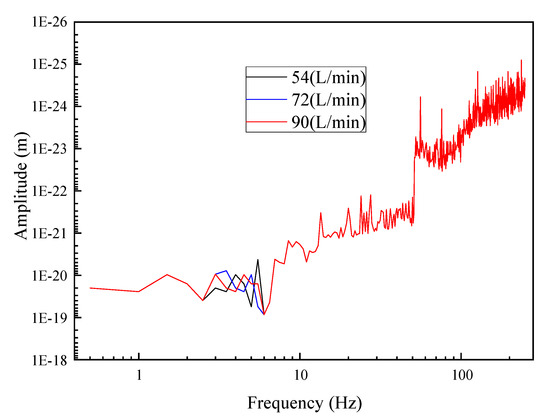
Figure 10.
Vibration frequency variation of the inner leaching tubing with different water injection rates for reverse circulation.
By comparing Figure 9 and Figure 10, it can be deduced that with the same water injection rate, the circulation mode has no apparent effect on the vibration frequency of the strings, and the vibration state of the inner leaching string during reverse circulation is basically the same as that during direct circulation.
4.3. Effect of Water Injection Rate on the Vibration Displacement Characteristics of Cavern Leaching Strings
In the experiment, the displacement of the inner leaching tubing varied slightly, and the waveform maintained a basically consistent shape with the change in the water injection rate. Hence, only the cloud diagram of the displacement characteristics with the water injection rate of 72 L/min was analyzed.
Figure 11a displays the cloud diagram of the displacement characteristics of the inner leaching string during direct circulation. It can be observed that with a water injection rate of 72 L/min, the three-dimensional displacement cloud diagram of the string fluctuated with time, and the vibration of the string was relatively regular. The string exhibited large displacements in the ranges of 0~3 m and 6.5~8 m, while in the other ranges, the string displacement was small. Figure 11b displays the cloud diagram of the displacement characteristics of the inner leaching string during reverse circulation. The string exhibited large displacements in the range of 2~7 m, while in the other ranges, the string displacement was small. By comparing the two working conditions of direct and reverse circulation, it can be deduced that the vibration of the string was more rigorous during reverse circulation.
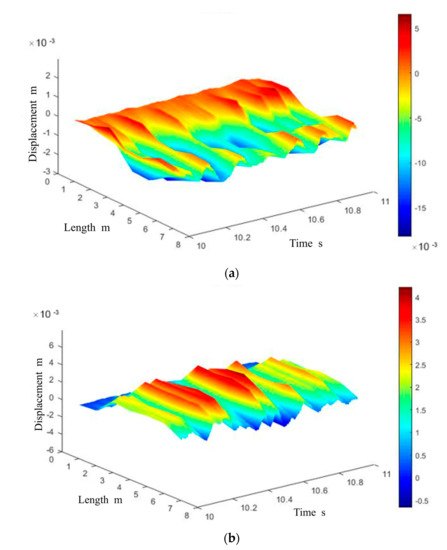
Figure 11.
Cloud diagrams of the displacement characteristics of the leaching strings with a water injection rate of 72 L/min. (a) Direct circulation. (b) Reverse circulation.
4.4. Effect of Water Injection Rate on the Vibration Deformation Characteristics of Cavern Leaching Strings
In this subsection, the effect of the length of the cavern leaching string on the string vibration amplitude with different water injection rates during direct and reverse circulation are investigated.
Figure 12a presents the vibration deformation diagram of the inner leaching tubing with different water injection rates during direct circulation. For the three different water injection rates, the deformation characteristics of the strings were basically the same, while the deformation amount increased with an increasing water injection rate. The deformation was the largest at the bottom of the string, followed by that at 1.4 m, and it was the smallest at 4 m. For the abovementioned three different water injection rates of 54 L/min, 72 L/min, and 90 L/min, the maximum deformation values of the string were 0.0056 m, 0.0066 m, and 0.0078 m, respectively.
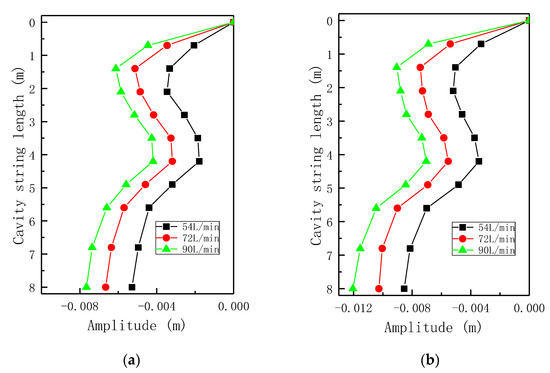
Figure 12.
Vibration deformation diagrams of the inner leaching tubing with different water injection rates. (a) Direct circulation; (b) reverse circulation.
Figure 12b presents the vibration deformation diagram of the inner leaching tubing with different water injection rates during reverse circulation. For the different water injection rates, the deformation characteristics of the strings during direct and reverse circulation were consistent, and the regions where the largest and smallest deformation occurred were also basically consistent. Overall, the vibration deformation during reverse circulation was larger than that during direct circulation, and the deformation values of the string were 0.0056, 0.0066, and 0.0078 m for the water injection rates of 54 L/min, 72 L/min, and 90 L/min, respectively. That is, the vibration of the string during reverse circulation was more rigorous than that during direct circulation. The largest deformation during reverse circulation was 1.5 times that during direct circulation.
Figure 13 exhibits the variation in the longitudinal deformation with time at a certain position of the inner leaching tubing with different water injection rates. It can be observed that the variation trends of the longitudinal deformation of the string with time were basically consistent across the three different water injection rates. Moreover, with the increase in the water injection rate, the longitudinal vibration deformation of the string increased, while the cavity tube longitudinal vibration deformation was not obvious.
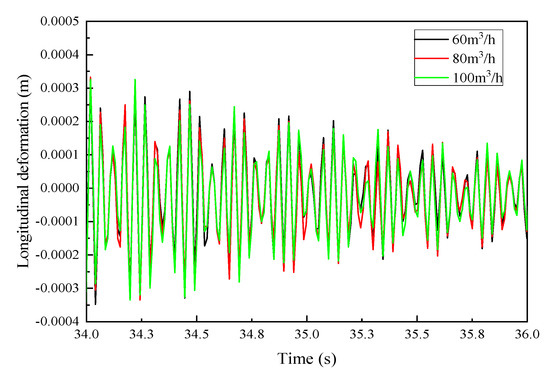
Figure 13.
Longitudinal deformation variation of the inner leaching tubing with different water injection rates.
5. Conclusions
In this paper, the self-excited vibration mechanism of the inner leaching tubing was investigated. An experimental device for testing the dynamic characteristics of salt cavern leaching strings was developed based on the similarity theory of fluid experimentation. In addition, the two working processes of direct and reverse circulation during cavern leaching were experimentally simulated. The experimental data were processed using the modal analysis method. This way, the vibration characteristic parameters of the inner leaching tubing during the circulation process when the tubing interior and the annular region had the same flow rate were obtained. Moreover, the self-excited vibration mechanism of the inner leaching tubing was explored from the perspective of mechanics. The main conclusions can be drawn as follows:
- With the same water injection rate, the vibration frequency of the string exhibited no significant differences during direct and reverse circulation, having an average value of about 5.5 Hz.
- During the same circulation mode, the vibration frequency of the string did not significantly increase with an increase in the water injection rate. The vibration amplitude becomes obviously larger, and the lateral vibration displacement and longitudinal vibration displacement of the string increases, so the water injection flow should not be too large in the actual cavity making process.
- With the same water injection rate, the deformation characteristics of the string were independent of the circulation mode. The largest deformation of the string during reverse circulation was about 1.5 times that during direct circulation. Therefore, it is necessary to pay attention to the selection of appropriate pipe string materials when using reverse circulation in the process of cavity making to ensure its deformation margin.
- When the other conditions were fixed, the deformation of the string increased with an increasing water injection rate. The deformation at the bottom of the string was the largest, while that at the middle of the string was the smallest.
- Matching the string injection rate with the dissolution efficiency of different salt caverns is the key to ensuring the efficiency of salt cavern construction and will be the focus of future research. Since the injection displacement of the pipe string is inextricably linked to the vibration of the pipe string, it is recommended to minimize the displacement before calculating the dissolution rate of the salt cavity and determining the parameters of the pipe string itself and the displacement to avoid the vibration failure of the pipe string. The reliability and stability of salt cavern strings directly affect the progress and cost of salt cavern construction, but the vibration failure mechanism of salt cavern strings cannot be fully revealed. In order to solve the failure mechanism of cavity strings, more professionals need to participate in the discussion.
Author Contributions
Conceptualization, S.D.; writing—original draft, S.D. and T.F.; conceptualization, methodology, J.W. and J.L.; validation, software, X.H.; investigation, resources, H.L. and D.L.; data curation, visualization, J.W. and S.Q.; writing—review and editing. All authors have read and agreed to the published version of the manuscript.
Funding
This research was funded by [CNPC scientific research and technology development project] grant number [number 2021DJ5402], and [number 2022KT2202].
Data Availability Statement
Data sharing not applicable. No new data were created or analyzed in this study. Data sharing is not applicable to this article.
Conflicts of Interest
The authors declare no conflict of interest.
References
- Malachowska, A.; Lukasik, N.; Mioduska, J.; Gebicki, J. Hydrogen Storage in Geological Formations—The Potential of Salt Caverns. Energies 2022, 15, 5038. [Google Scholar] [CrossRef]
- Yang, C.; Li, Y.; Qu, D.; Chen, F.; Ying, X. Advance in Reseaches of The Mechanical Behaviors of Bedded Salt Rokes. Adv. Mech. 2008, 38, 484–494. [Google Scholar]
- Zhang, L.; Chen, L.; Hu, R.; Cai, J. Subsurface multiphase reactive flow in geologic CO2 storage: Key impact factors and characterization approaches. Adv. Geo-Energy Res. 2022, 6, 179–180. [Google Scholar] [CrossRef]
- Wan, J.; Peng, T.; Shen, R.; Jurado, M.J. Numerical model and program development of TWH salt cavern construction for UGS. J. Pet. Sci. Eng. 2019, 179, 930–940. [Google Scholar] [CrossRef]
- Yang, H. Key Construction key technologies and challenges of salt-cavern gas storage in China. Oil Gas Storage Transp. 2017, 36, 747–753. [Google Scholar]
- Wang, Q. Water-Soluble Mining of Salt Deposits; Chemical Industry Press: Beijing, China, 2003. [Google Scholar]
- Luan, J. Study on Evaluation Method of Underground Salt Cavern Gas Storage; China University of Geosciences: Beijing, China, 2017. [Google Scholar]
- Wan, J.; Peng, T.; Yuan, G.; Ban, F.; Jurado, M.; Xai, Y. Influence of tubing/oil-blanket lifting on construction and geometries of two-well-horizontal salt caverns. Tunn. Undergr. Space Technol. 2021, 108, 103688. [Google Scholar] [CrossRef]
- Wan, J.; Peng, T.; Jurado, M.J.; Shen, R.; Yuan, G.; Ban, F. The influence of the water injection method on two-well-horizontal salt cavern construction. J. Pet. Sci. Eng. 2020, 184, 106560. [Google Scholar] [CrossRef]
- Tian, Z.; Xia, B. Research of Solution Mining Techniques on Salt Cavern Gas Storage. Geoscience 2008, 22, 97–102. [Google Scholar]
- Li, J.; Wan, J.; Liu, H.; Jurado, M.J.; He, Y.; Yuan, G.; Xia, Y. Stability Analysis of a Typical Salt Cavern Gas Storage in the Jintan Area of China. Energies 2022, 15, 4167. [Google Scholar] [CrossRef]
- Tang, L.; Zhang, G.; Dai, X. Some Thinks on Improving Downhole Operation Efficiency in Cavity-made Well Construction of Jintan Gas Storage. Technol. Superv. Pet. Ind. 2015, 5, 58–60. [Google Scholar]
- Dai, X.; Zhang, G.; Ma, J.; Tang, L. Causes Analysis and Solutions of JT2 Well Blocking in Jintan Salt-cavern Gas Storage. China Well Rock Salt 2017, 1, 13–15. [Google Scholar]
- Moditis, K.; Paidoussis, M.; Ratigan, J. Dynamics of a partially confined, discharging, cantilever pipe with reverse external flow. J. Fluids Struct. 2016, 63, 120–139. [Google Scholar] [CrossRef]
- Shi, X.; Li, Y.; Yang, C.; Qu, D. Test Study Of Influence Of Brine On Tensile Strength Of Muddy Intercalation. Chin. J. Rock Mech. Eng. 2009, 28, 2301–2308. [Google Scholar]
- Shi, X.; Li, Y.; Yang, C.; Qu, D.; Ma, H. Research on mechanical mechanism of interlayer collapse in solution mining for salt cavern gas storage. Rock Soil Mech. 2009, 30, 3615–3620+3626. [Google Scholar]
- Li, Y.; Yang, C.; Qu, D.; Yang, C.; Shi, X. Preliminary study of dynamic characteristics of tubing string for solution mining of oil/gas storage salt caverns. Rock Soil Mech. 2012, 3, 681–686. [Google Scholar]
- Li, Y.; Ge, X.; Wang, B.; Shi, X. Dynamic stability tests on tubing string for solution mining of a salt cavern UGS. Nat. Gas Ind. 2016, 36, 81–87. [Google Scholar]
- Li, Y.; Shi, X.; Liu, W.; Wang, B.; Ma, X.; Yang, C. Study on Movement Behavior and Application of Insoluble Substance in Salt Cavern Water—Soluble Cavity Construction Period. Chin. J. Rock Mech. Eng. 2016, 35, 23–31. [Google Scholar]
- Hu, W.; Fan, S.; Wang, C.; Yuan, G. Analysis of Serious Deformation of Cavitation Tubing in Salt Cavern Gas Storage in Jianghan Oilfield. IOP Conf. Ser. Earth Environ. Sci. 2021, 791, 012130. [Google Scholar]
- Liu, J.; Zeng, L.; Guo, X.; Dai, L.; Huang, X.; Cai, L. Nonlinear flow-induced vibration response characteristics of leaching tubing in salt cavern underground gas storage. J. Energy Storage 2021, 41, 102909. [Google Scholar] [CrossRef]
- Cen, X.; Zeng, H.; Wang, H.; Huang, X.; Zhang, R.; Wang, L.; Gao, S.; Liu, F.; Huang, Q.; Wu, J.; et al. Research on Tubing and Casing Anti-Bending Technology for Salt Cavern Gas Storage Cavity Construction. In Proceedings of the Abu Dhabi International Petroleum Exhibition & Conference, Online, 9–12 November 2020. [Google Scholar]
- Li, J.; Wan, J.; Wang, T.; Yuan, G.; Jurado, M.J.; He, Q. Leakage simulation and acoustic characteristics based on acoustic logging by ultrasonic detection. Adv. Geo-Energy Res. 2022, 6, 181–191. [Google Scholar] [CrossRef]
- Li, Y.; Shi, X.; Yang, C.; Qu, D. Several key problems about control of solution mining for oil/gas storage in deep salt mine. Chin. J. Rock Mech. Eng. 2012, 31, 1785–1796. [Google Scholar]
- Ni, Q.; Wang, L.; Huang, Y. Advances and Trends of a Dynamical Model:Pipes Aspirating Fluid. Chin. J. Appl. Mech. 2008, 25, 450–454. [Google Scholar]
- Paı, M.P. Some unresolved issues in fluid-structure interactions. J. Fluids Struct. 2005, 20, 871–890. [Google Scholar]
- Paı, M.P.; Luu, T.P.; Prabhakar, S. Dynamics of a long tubular cantilever conveying fluid downwards, which then flows upwards around the cantilever as a confined annular flow. J. Fluids Struct. 2008, 24, 111–128. [Google Scholar]
- Liangjie, M.; Qingyou, L.; Shouwei, Z. Experimental study of the vortex-induced vibration of drilling risers under the shear flow with the same shear parameter at the different Reynolds numbers. PloS ONE 2014, 9, e104806. [Google Scholar] [CrossRef]
- Liangjie, M.; Qingyou, L.; Shouwei, Z.; Jiang, W.; Zhengli, L.; Tao, P. Vortex-induced vibration mechanism of drilling riser under shear flow. Pet. Explor. Dev. 2015, 42, 112–118. [Google Scholar]
Disclaimer/Publisher’s Note: The statements, opinions and data contained in all publications are solely those of the individual author(s) and contributor(s) and not of MDPI and/or the editor(s). MDPI and/or the editor(s) disclaim responsibility for any injury to people or property resulting from any ideas, methods, instructions or products referred to in the content. |
© 2022 by the authors. Licensee MDPI, Basel, Switzerland. This article is an open access article distributed under the terms and conditions of the Creative Commons Attribution (CC BY) license (https://creativecommons.org/licenses/by/4.0/).