
Quantification Methodology of Ammonia Produced from Electrocatalytic and Photocatalytic Nitrogen/Nitrate Reduction


Abstract

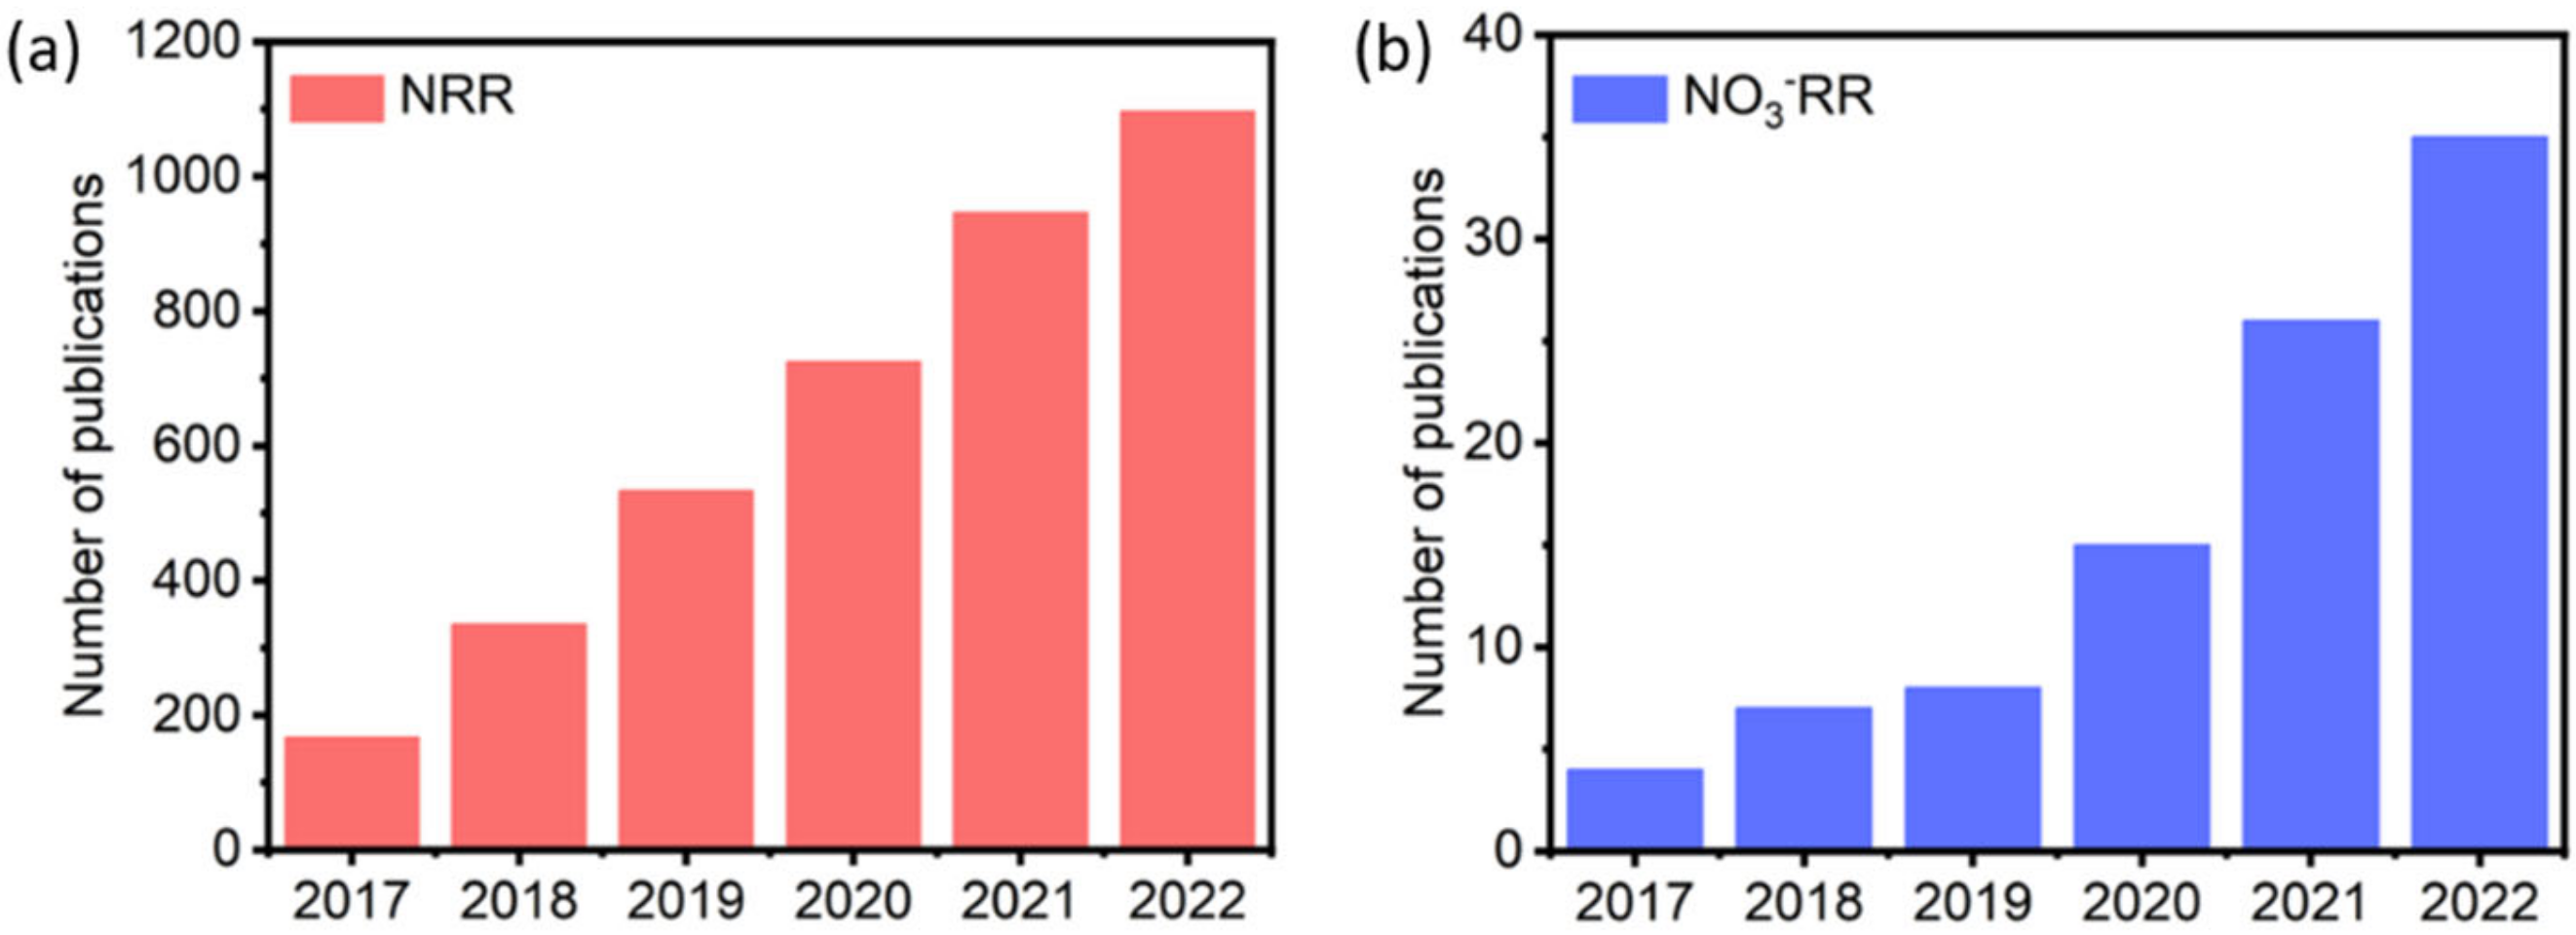
1. Introduction
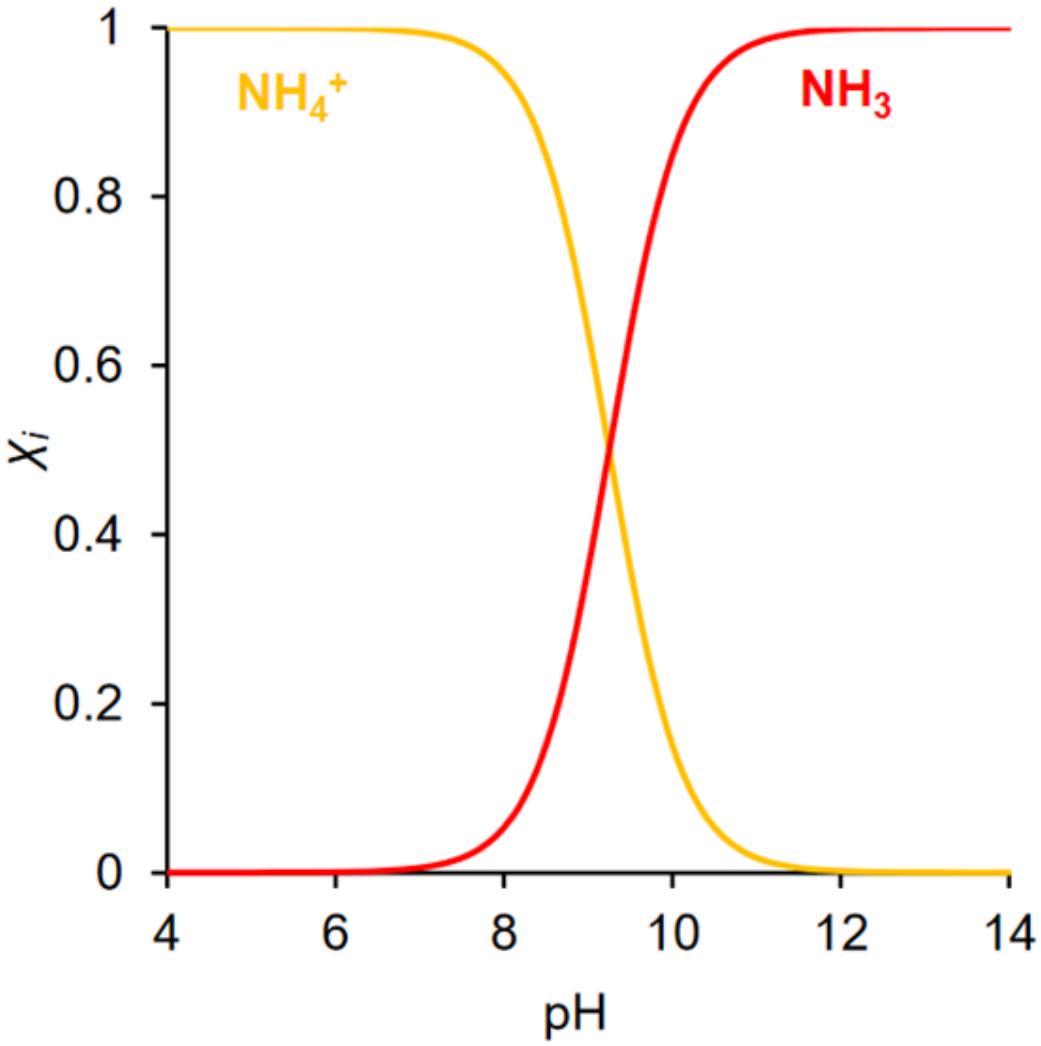
2. Ammonia in Solution
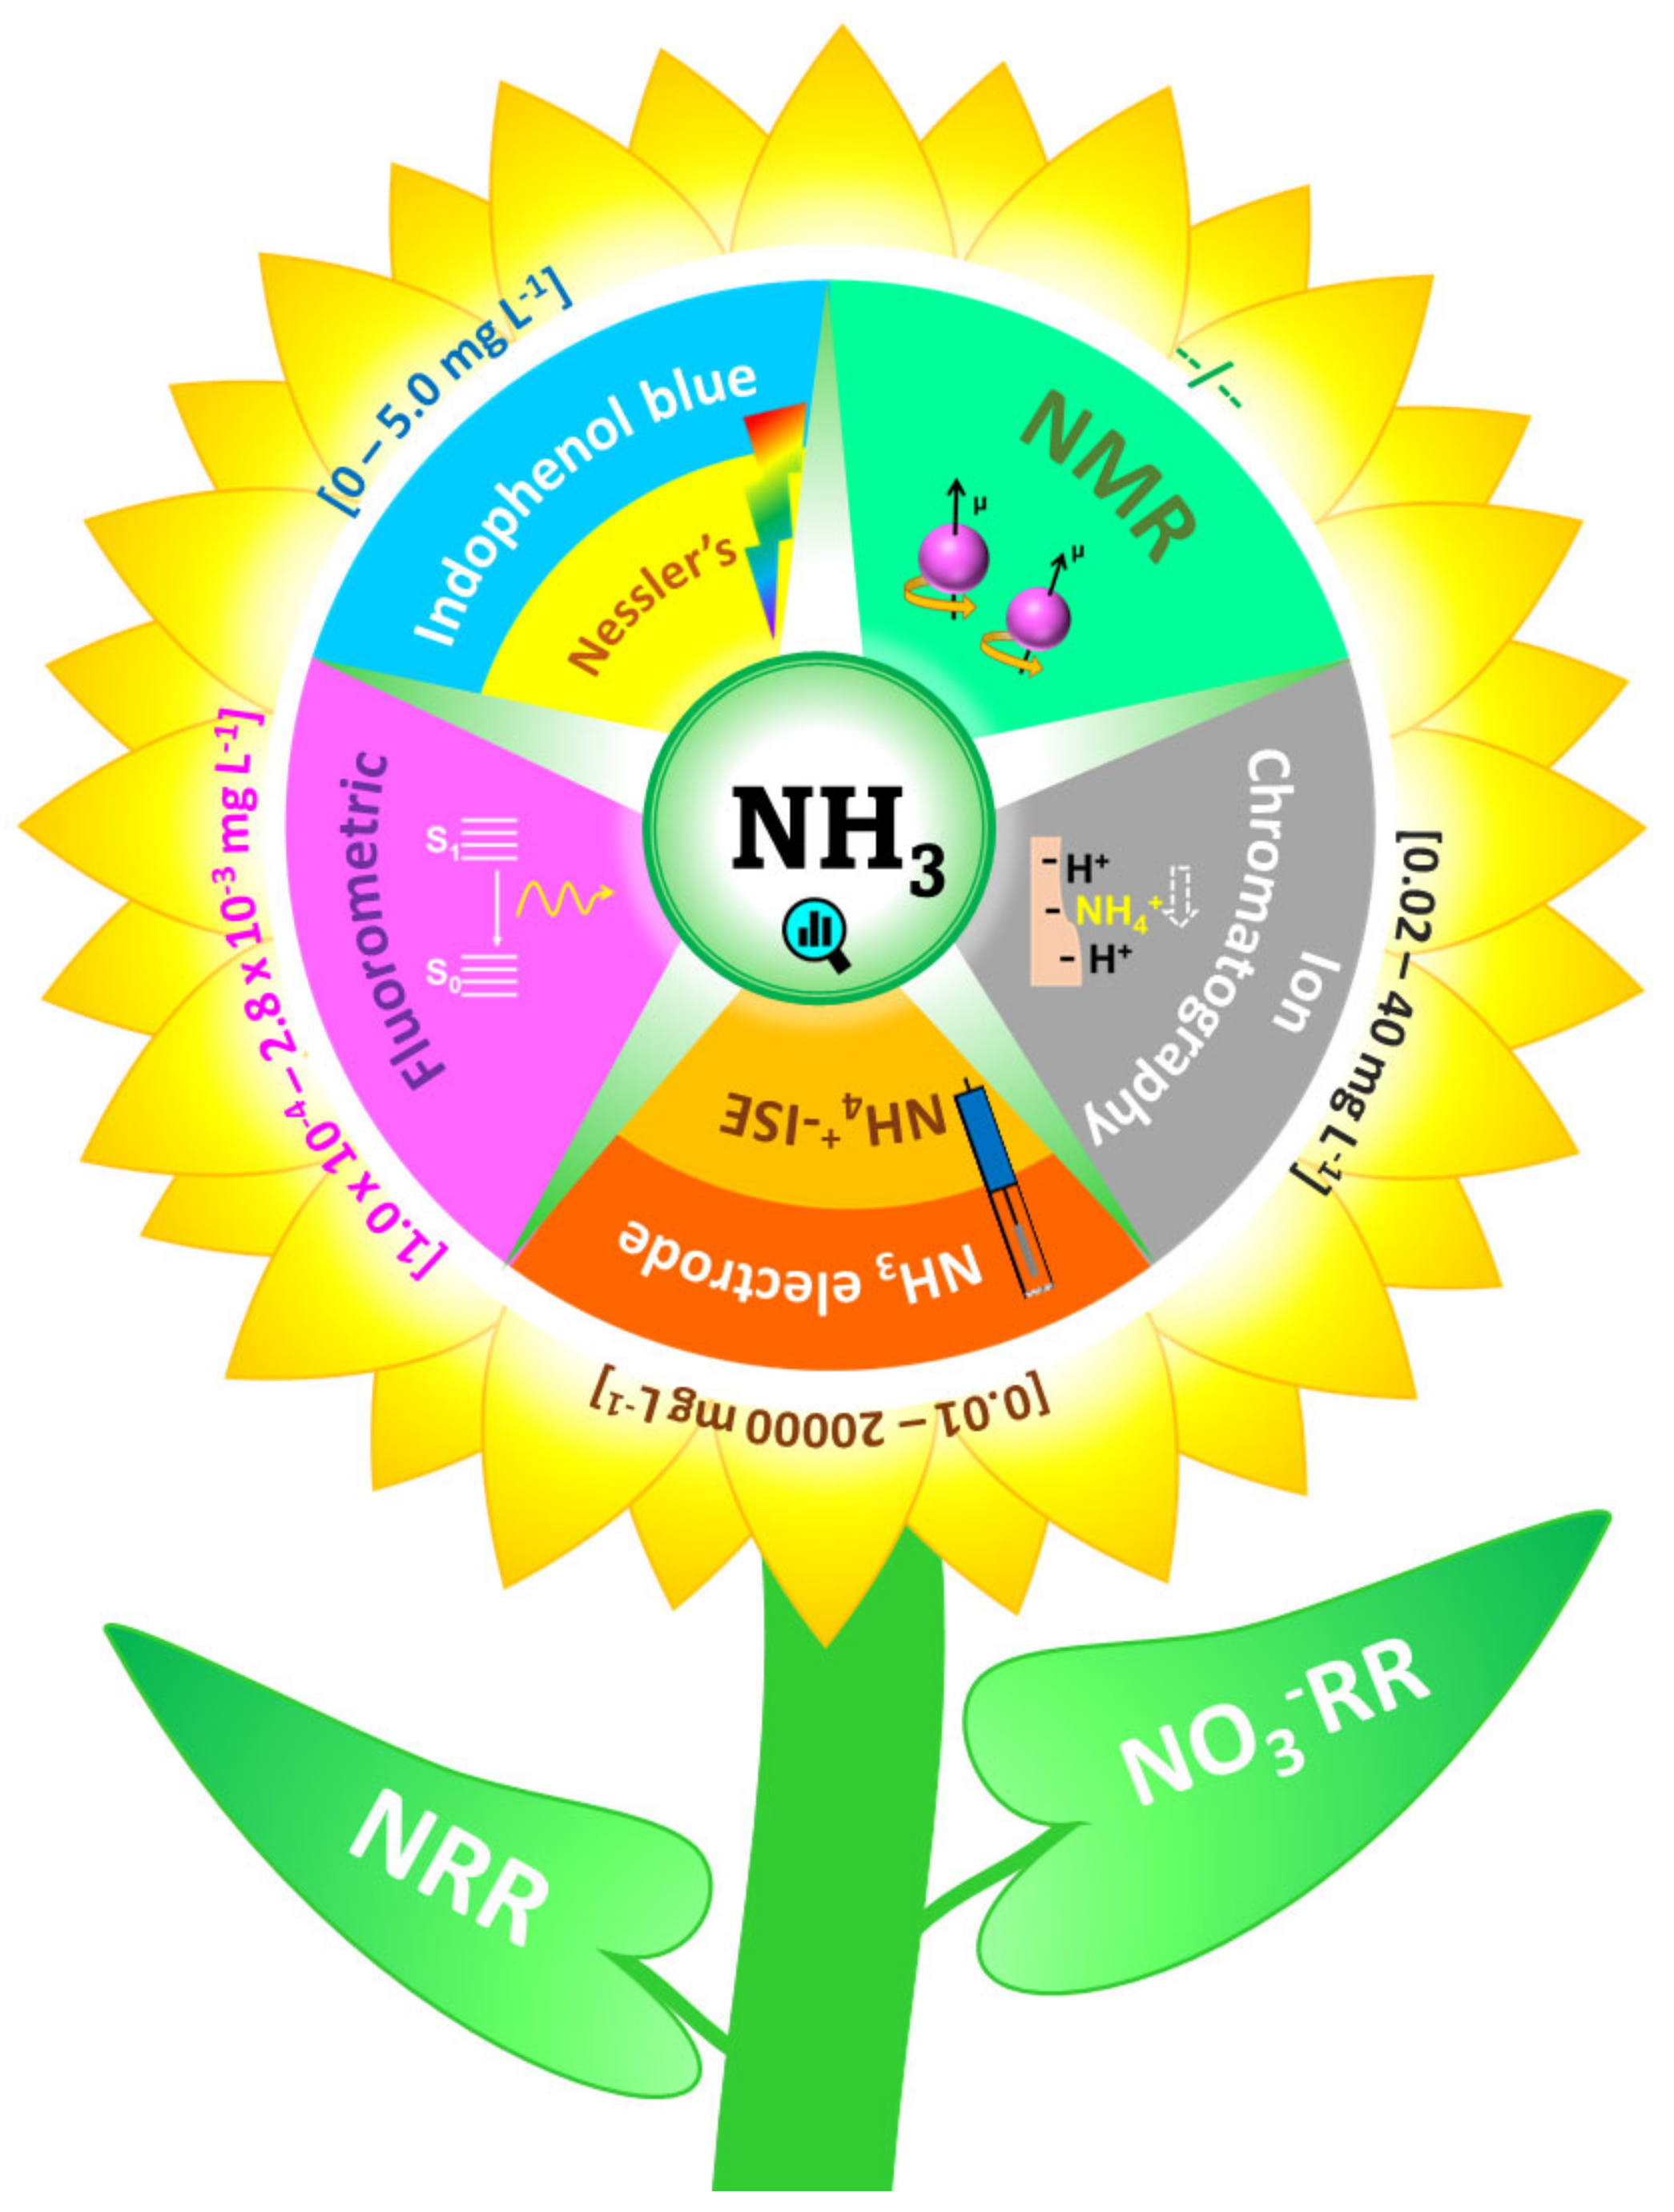
3. Ammonia Quantification Methods
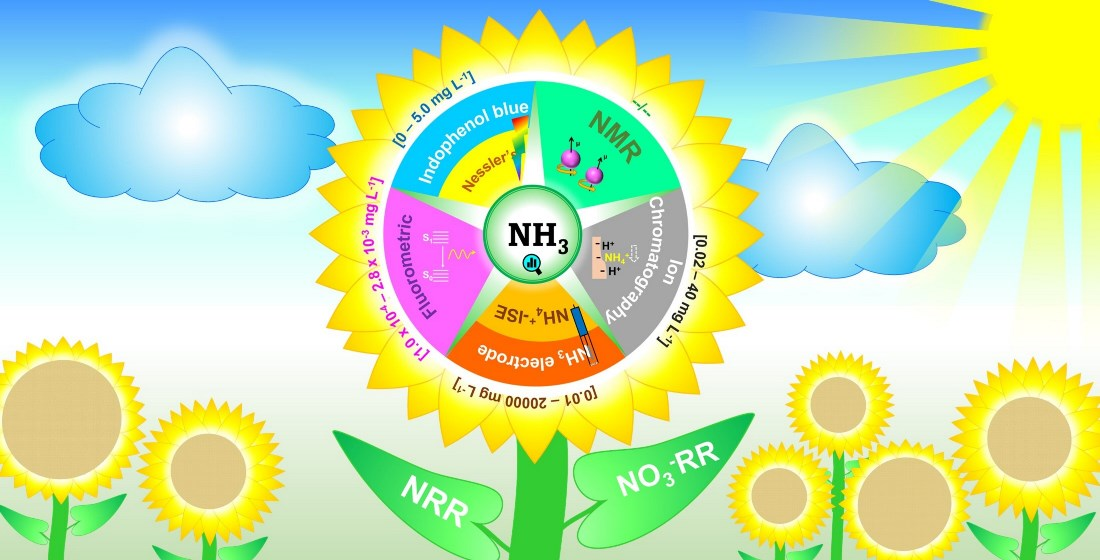
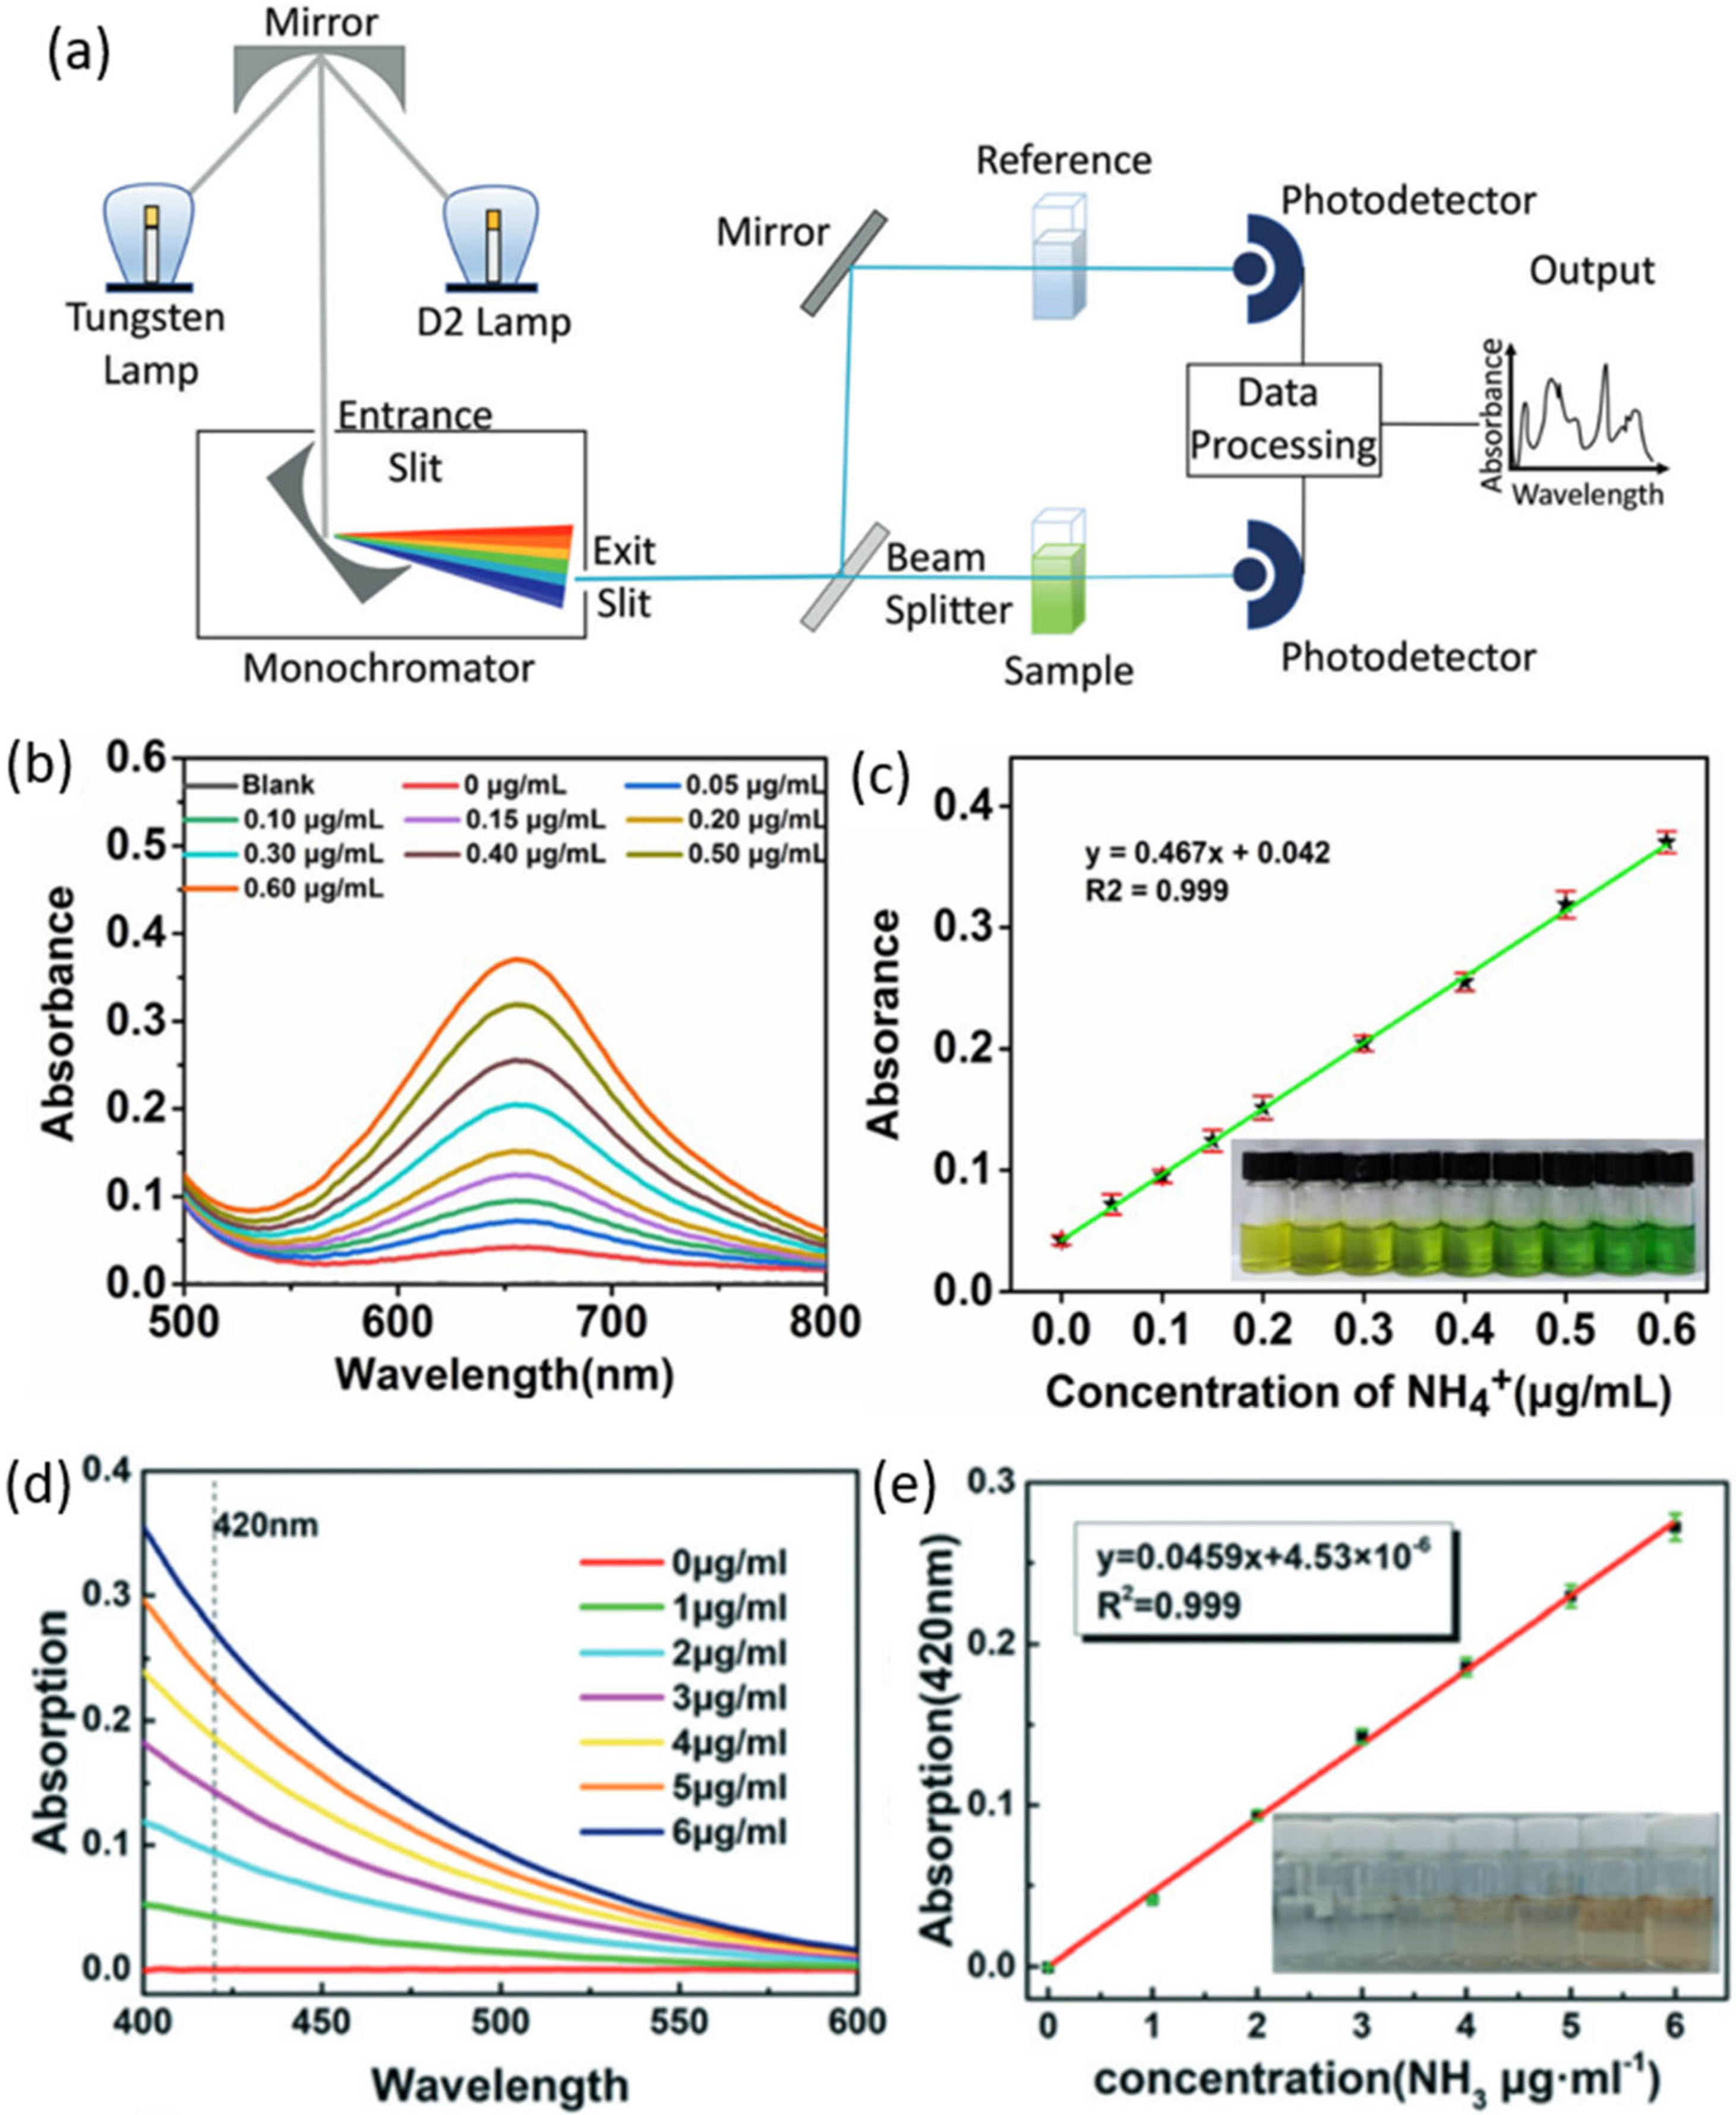
3.1. Spectrophotometric Method
3.1.1. Indophenol Blue Method


3.1.2. Nessler’s Method
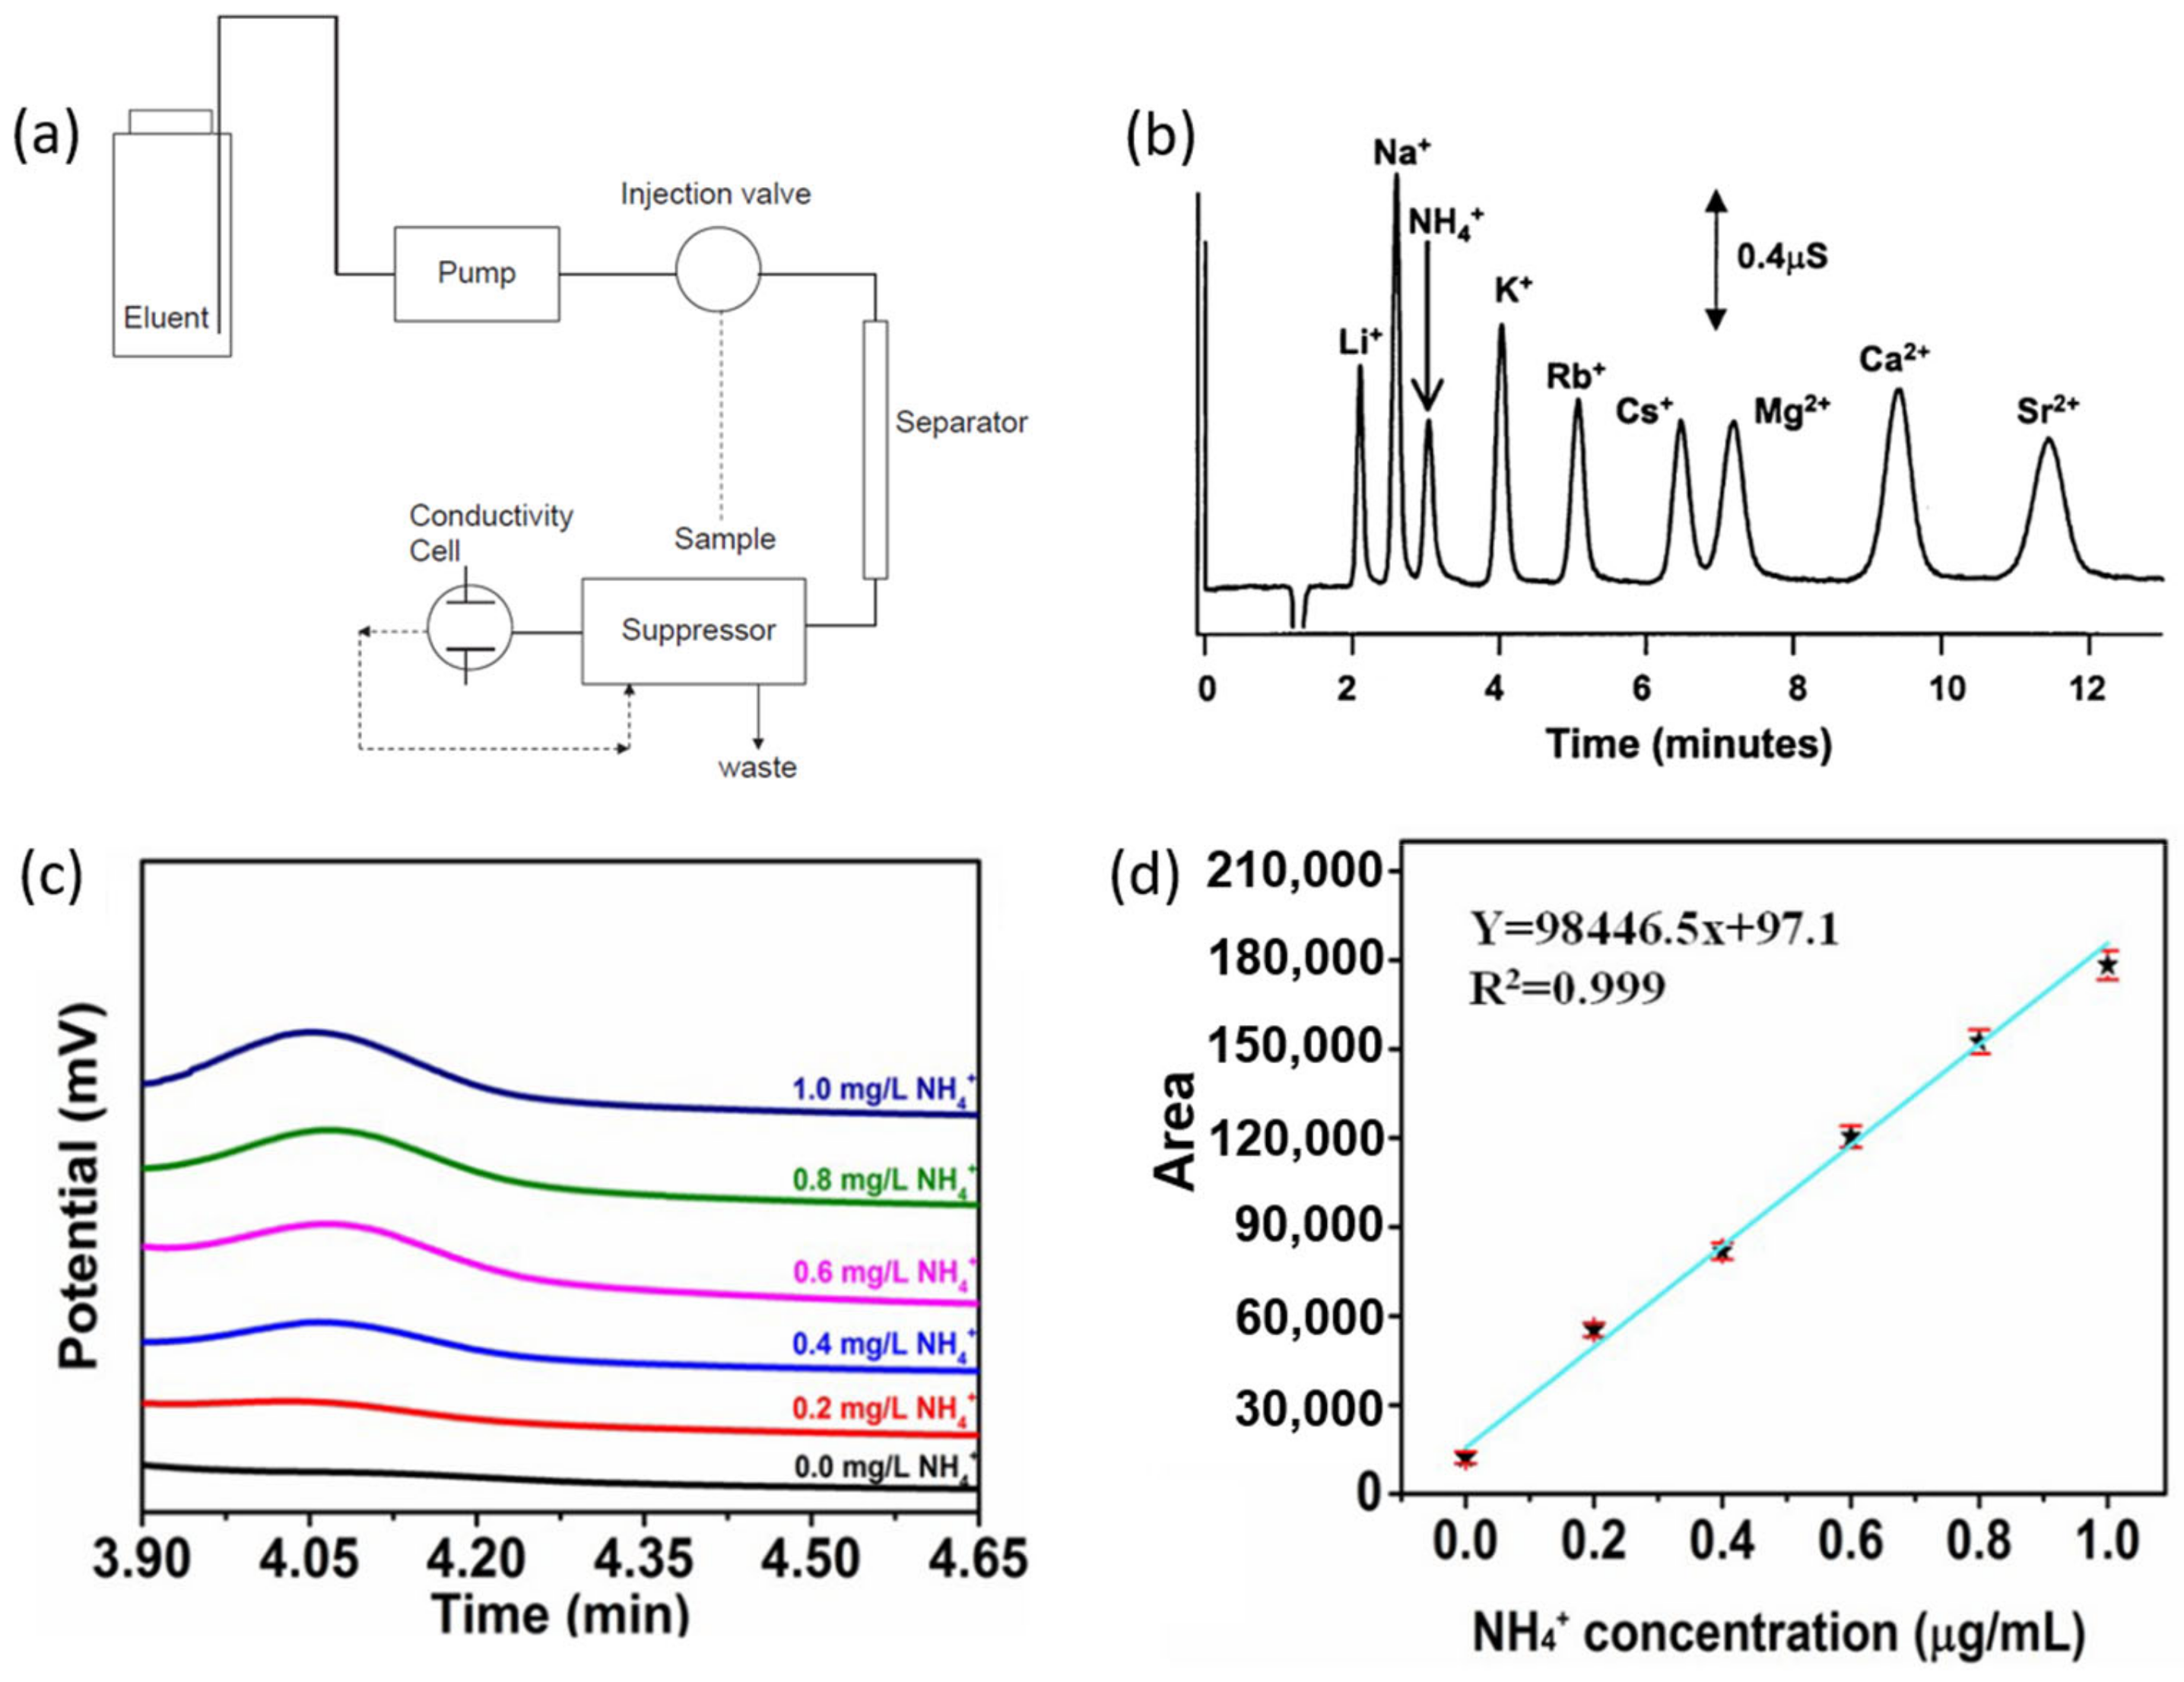
3.2. IC Method
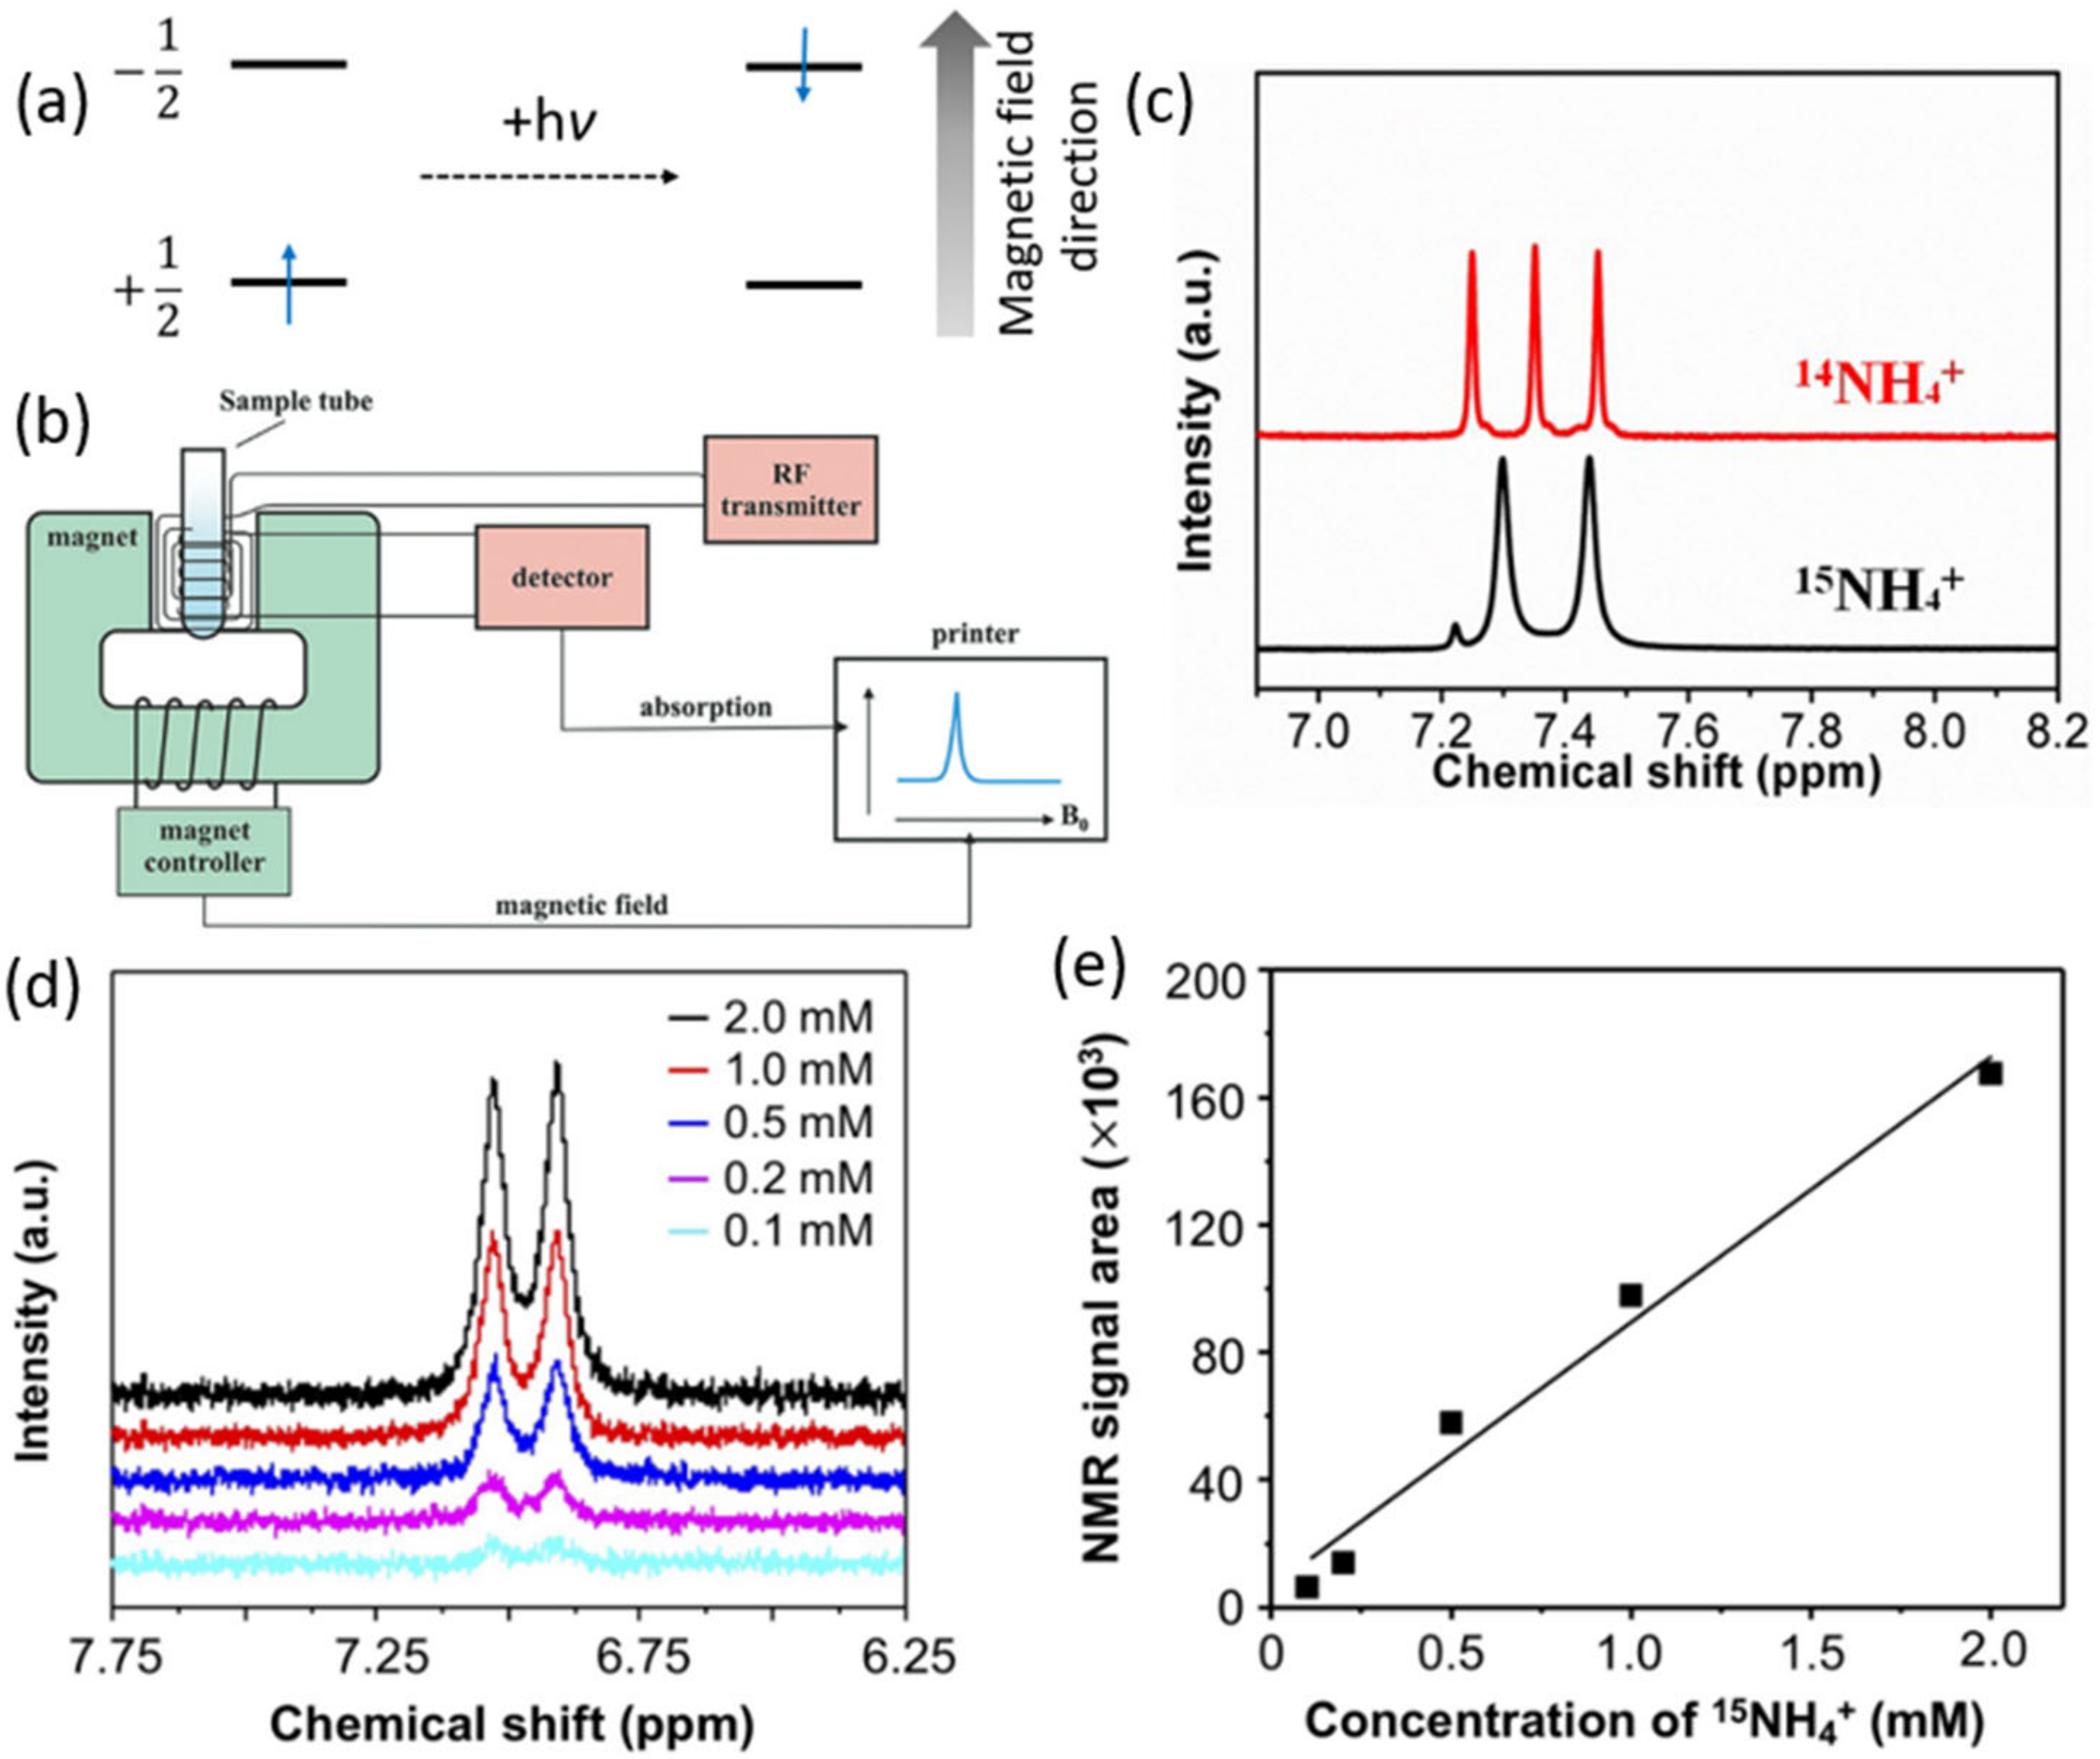
3.3. 1H NMR Method
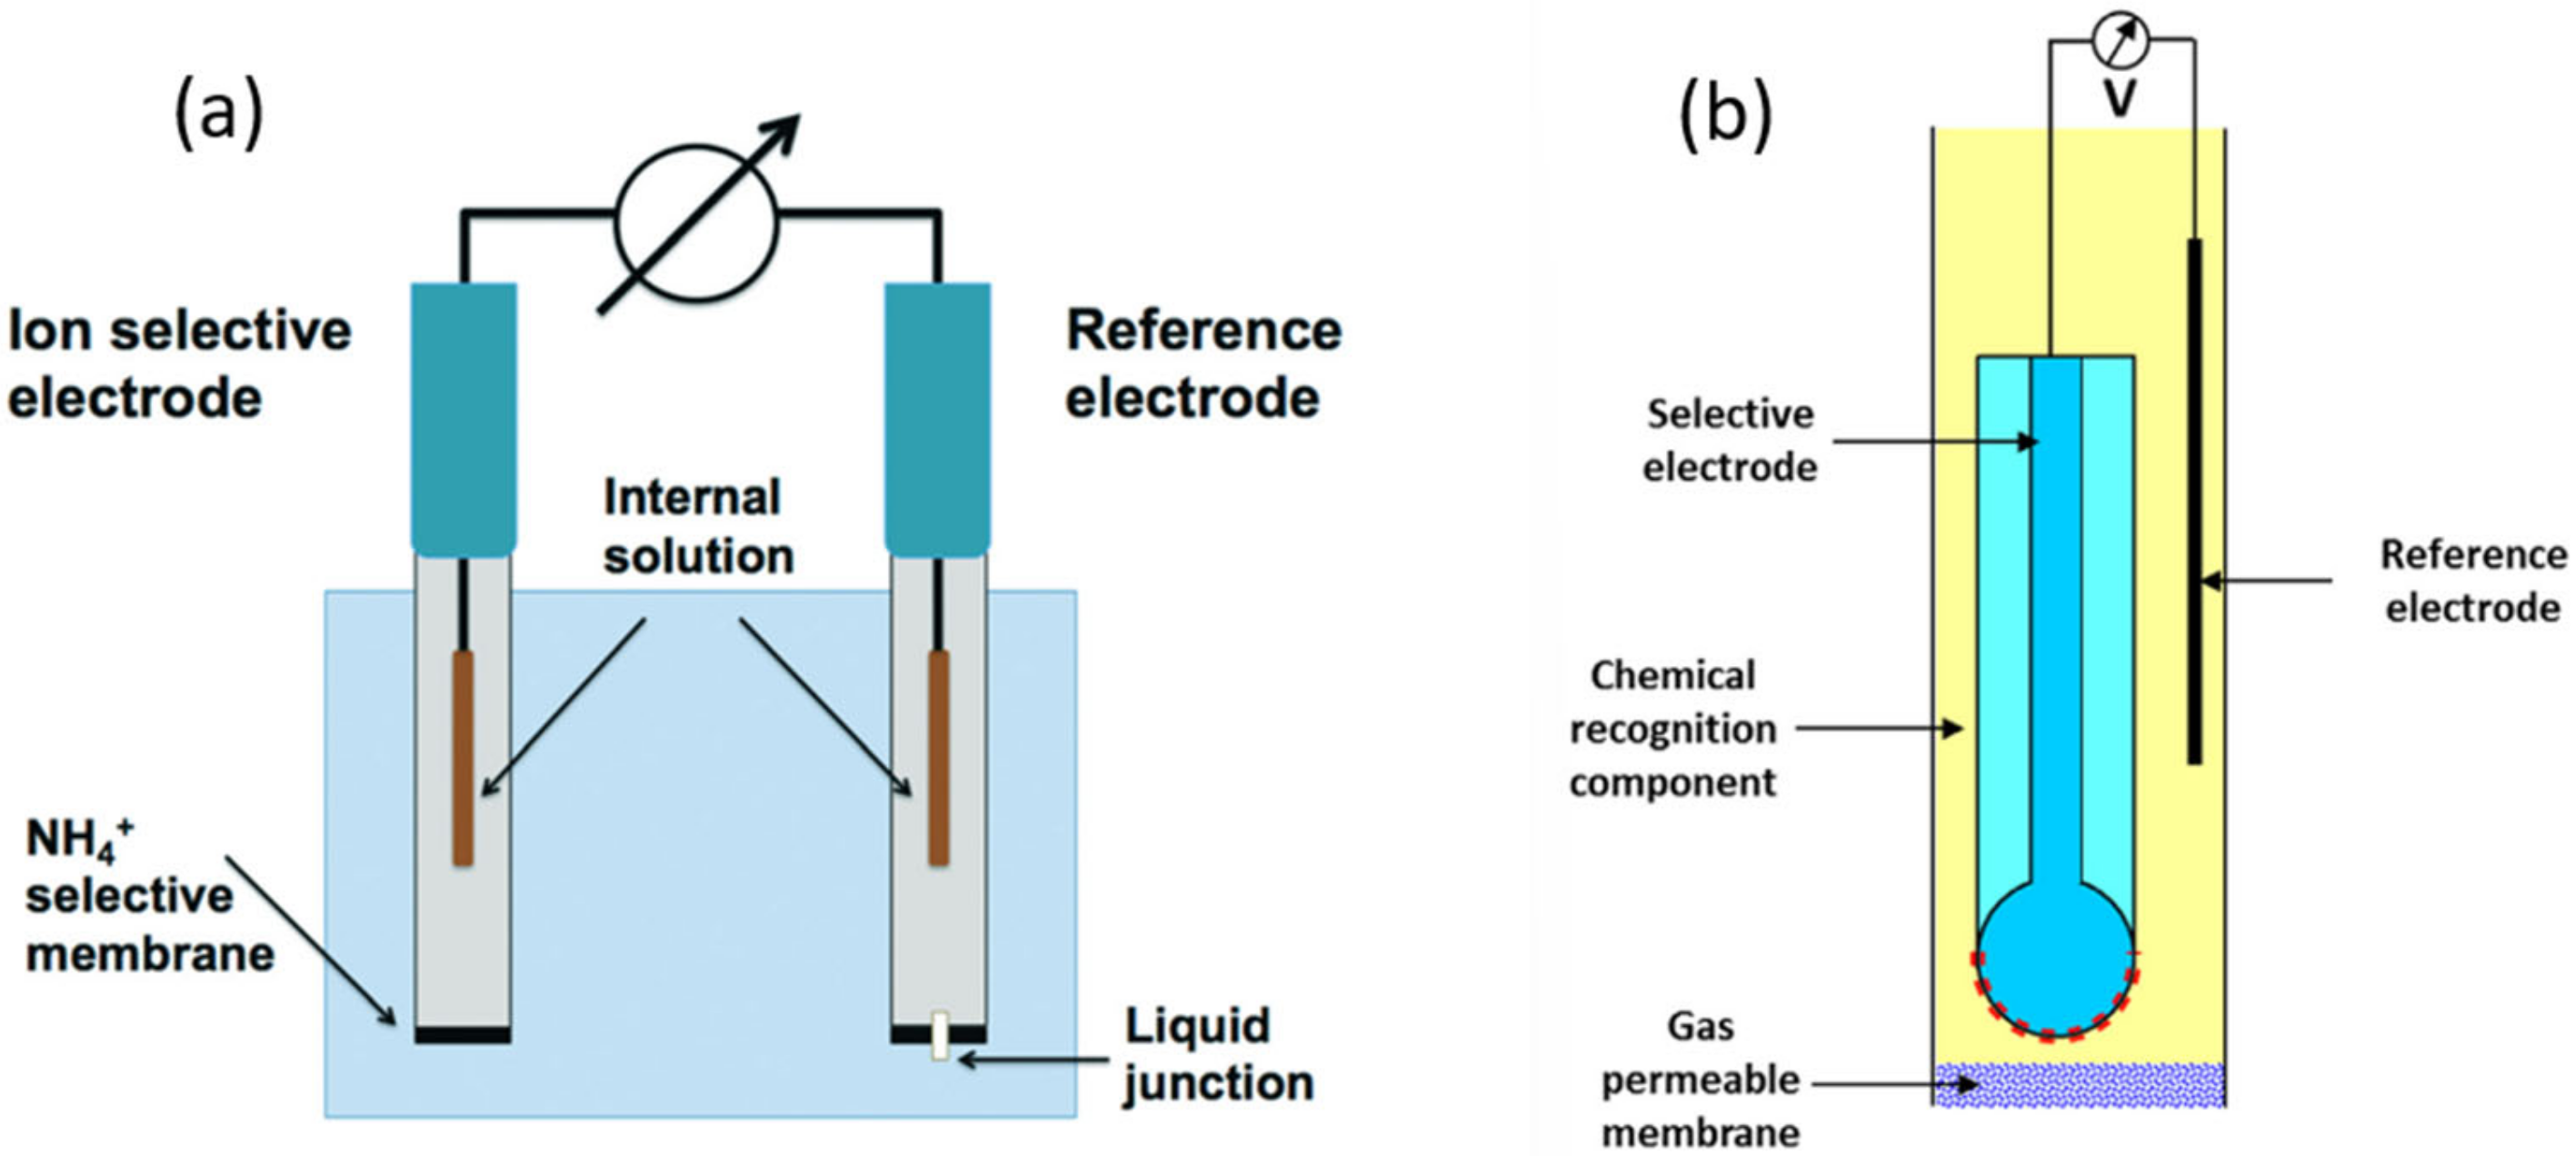
3.4. ISE Method
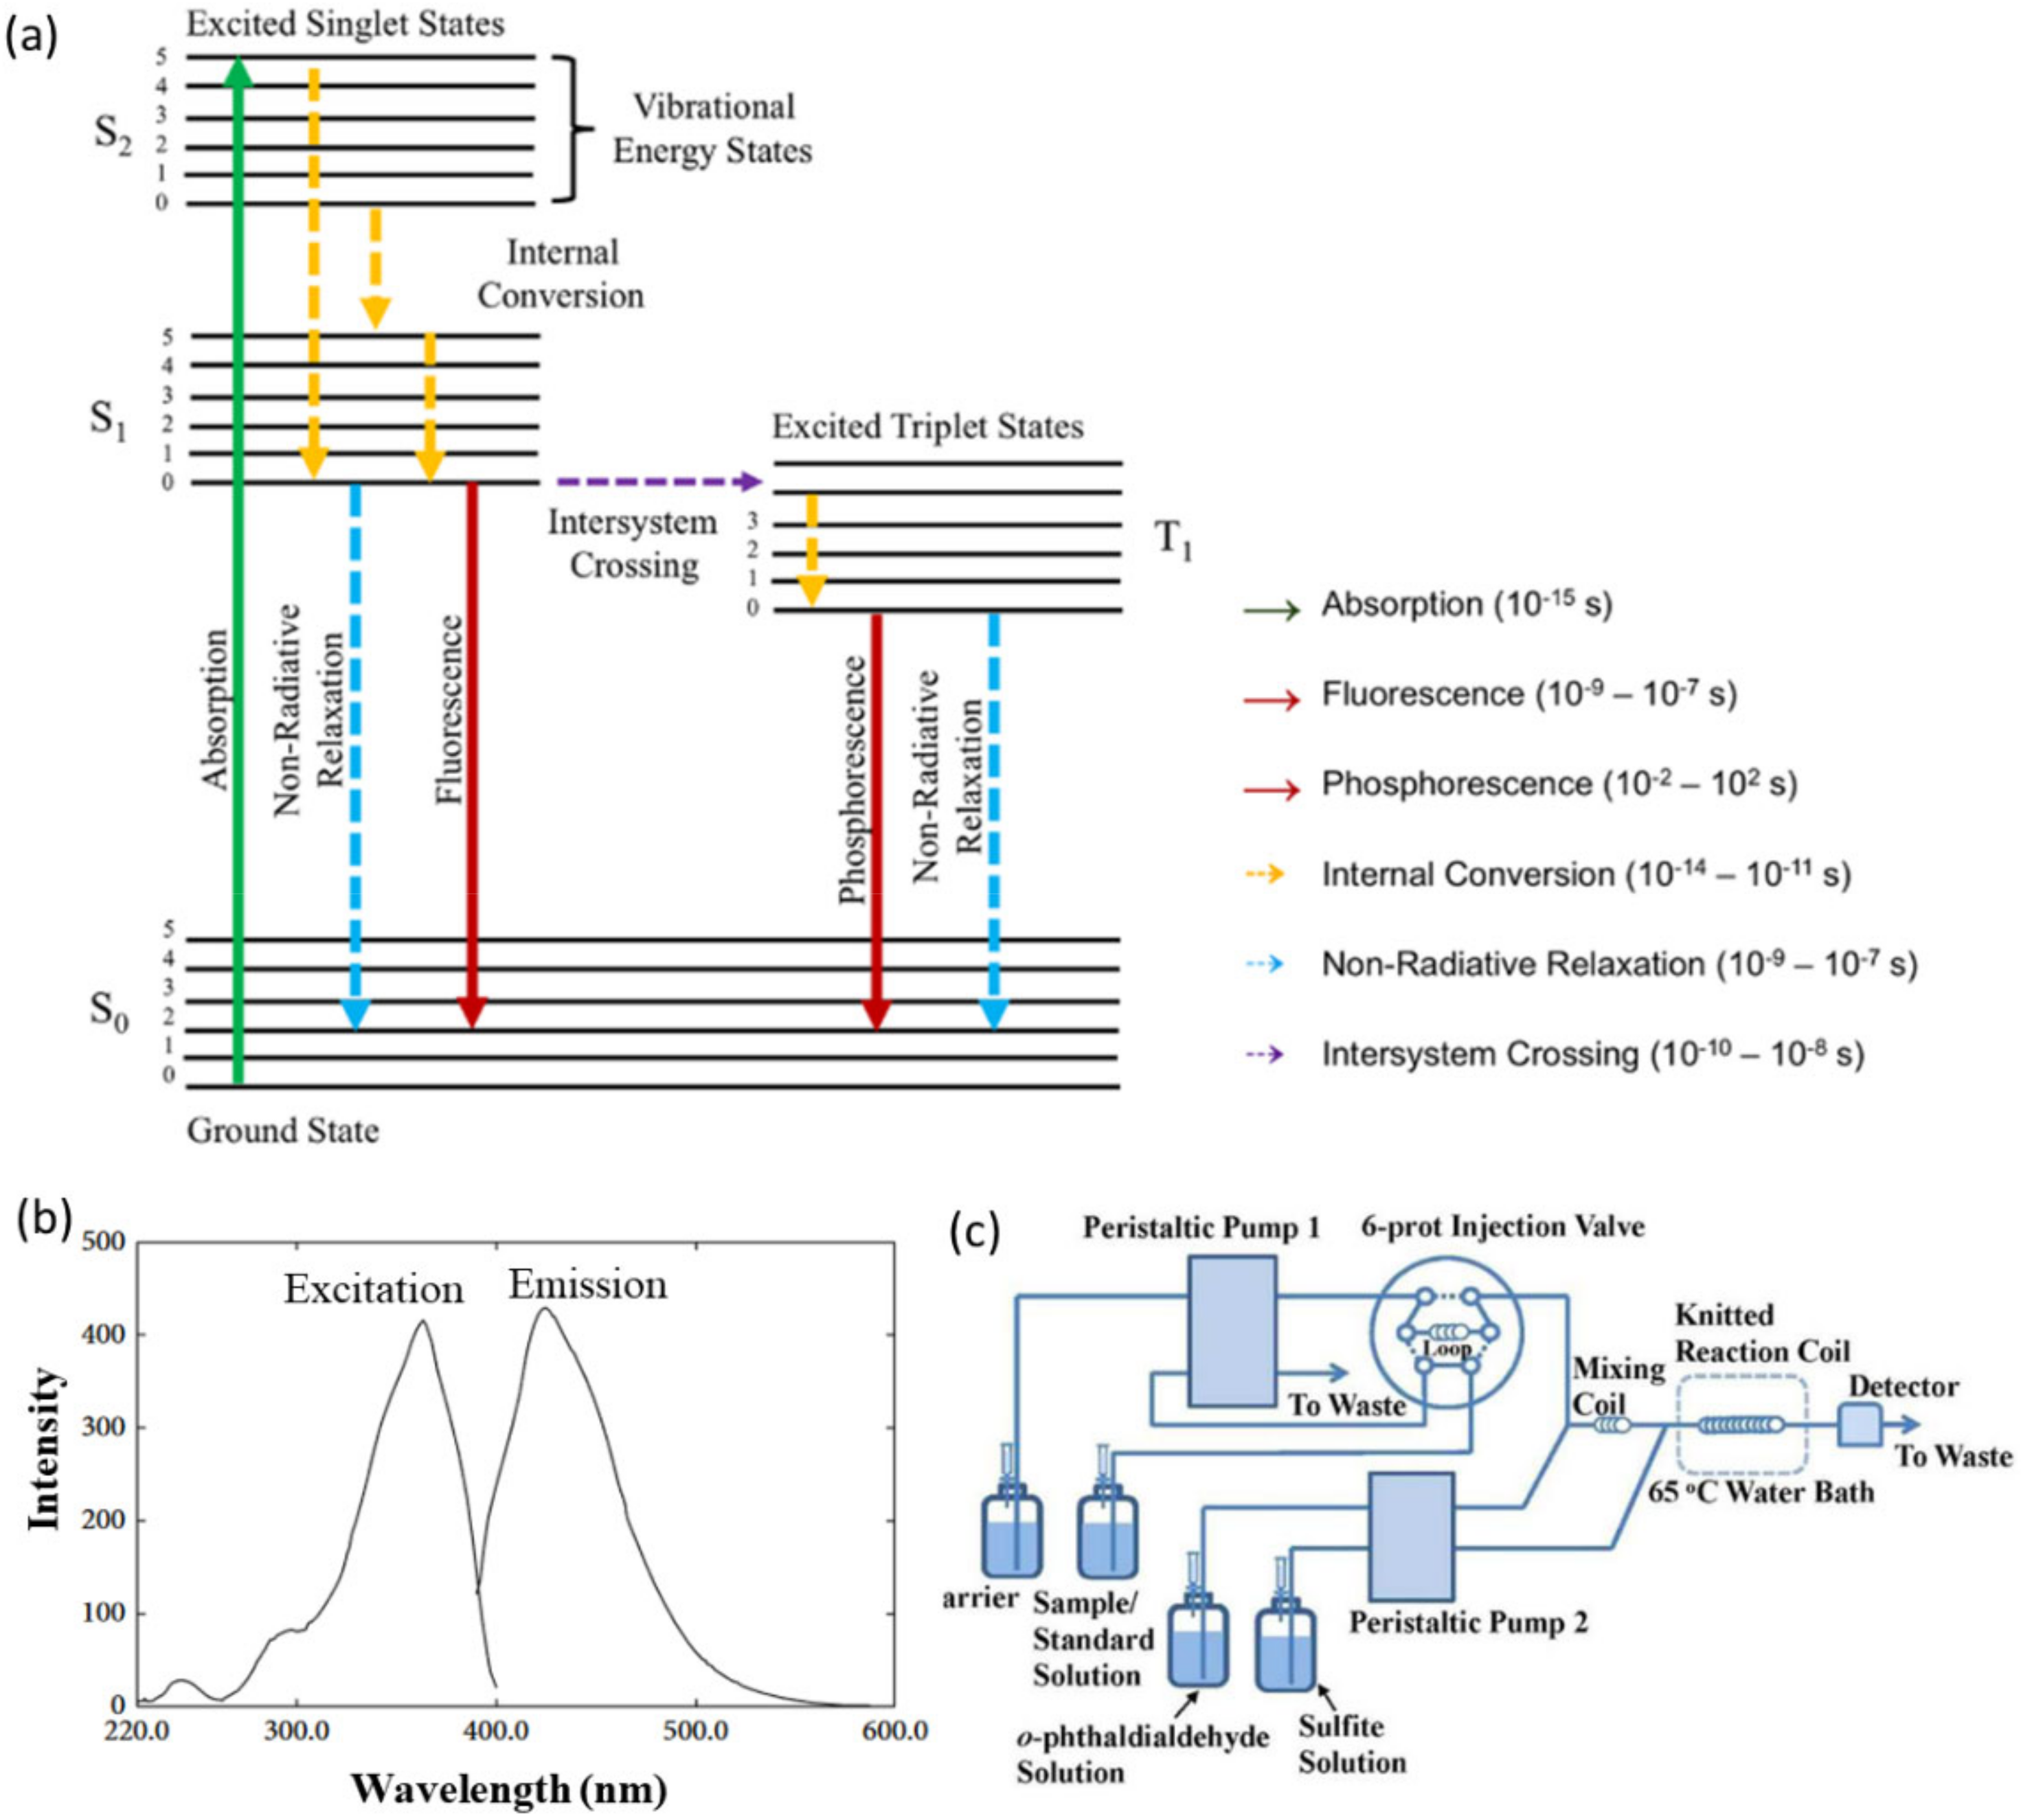
3.5. Fluorometric Method


3.6. Enzymatic, Conductivity, and Titrimetric Methods
3.7. Comparison of Ammonia Quantification Methods and Their Application in Nitrogen/Nitrate Reduction Reaction
4. Perspective for Selecting Method and Performing Ammonia Quantification
5. Conclusions
Author Contributions
Funding
Data Availability Statement
Conflicts of Interest
References
- Wang, L.; Xia, M.; Wang, H.; Huang, K.; Qian, C.; Maravelias, C.T.; Ozin, G.A. Greening Ammonia toward the Solar Ammonia Refinery. Joule 2018, 2, 1055–1074. [Google Scholar] [CrossRef]
- Comer, B.M.; Fuentes, P.; Dimkpa, C.O.; Liu, Y.-H.; Fernandez, C.A.; Arora, P.; Realff, M.; Singh, U.; Hatzell, M.C.; Medford, A.J. Prospects and Challenges for Solar Fertilizers. Joule 2019, 3, 1578–1605. [Google Scholar] [CrossRef]
- Hollevoet, L.; Jardali, F.; Gorbanev, Y.; Creel, J.; Bogaerts, A.; Martens, J.A. Towards Green Ammonia Synthesis through Plasma-Driven Nitrogen Oxidation and Catalytic Reduction. Angew. Chem. Int. Ed. 2020, 59, 23825–23829. [Google Scholar] [CrossRef] [PubMed]
- Kim, D.W.; Kang, D.W.; Kang, M.; Lee, J.-H.; Choe, J.H.; Chae, Y.S.; Choi, D.S.; Yun, H.; Hong, C.S. High Ammonia Uptake of a Metal–Organic Framework Adsorbent in a Wide Pressure Range. Angew. Chem. Int. Ed. 2020, 59, 22531–22536. [Google Scholar] [CrossRef] [PubMed]
- MacFarlane, D.R.; Cherepanov, P.V.; Choi, J.; Suryanto, B.H.R.; Hodgetts, R.Y.; Bakker, J.M.; Ferrero Vallana, F.M.; Simonov, A.N. A Roadmap to the Ammonia Economy. Joule 2020, 4, 1186–1205. [Google Scholar] [CrossRef]
- Bahadoran, A.; Liu, Q.; Ramakrishna, S.; Sadeghi, B.; De Castro, M.M.; Cavaliere, P.D. Hydrogen Production as a Clean Energy Carrier through Heterojunction Semiconductors for Environmental Remediation. Energies 2022, 15, 3222. [Google Scholar] [CrossRef]
- Appl, M. Ammonia, 2. Production Processes. In Ullmann’s Encyclopedia of Industrial Chemistry; Wiley-VCH: Weinheim, Germany, 2011; ISBN 978-3-527-30673-2. [Google Scholar]
- Martín, A.J.; Shinagawa, T.; Pérez-Ramírez, J. Electrocatalytic Reduction of Nitrogen: From Haber-Bosch to Ammonia Artificial Leaf. Chem 2019, 5, 263–283. [Google Scholar] [CrossRef]
- Mallouppas, G.; Ioannou, C.; Yfantis, E.A. A Review of the Latest Trends in the Use of Green Ammonia as an Energy Carrier in Maritime Industry. Energies 2022, 15, 1453. [Google Scholar] [CrossRef]
- Ham, C.J.M.v.d.; Koper, M.T.M.; Hetterscheid, D.G.H. Challenges in Reduction of Dinitrogen by Proton and Electron Transfer. Chem. Soc. Rev. 2014, 43, 5183–5191. [Google Scholar] [CrossRef]
- Elishav, O.; Mosevitzky Lis, B.; Miller, E.M.; Arent, D.J.; Valera-Medina, A.; Grinberg Dana, A.; Shter, G.E.; Grader, G.S. Progress and Prospective of Nitrogen-Based Alternative Fuels. Chem. Rev. 2020, 120, 5352–5436. [Google Scholar] [CrossRef]
- Smith, C.; Hill, A.K.; Torrente-Murciano, L. Current and Future Role of Haber–Bosch Ammonia in a Carbon-Free Energy Landscape. Energy Environ. Sci. 2020, 13, 331–344. [Google Scholar] [CrossRef]
- Xu, X.; Liu, E.; Zhu, N.; Liu, F.; Qian, F. Review of the Current Status of Ammonia-Blended Hydrogen Fuel Engine Development. Energies 2022, 15, 1023. [Google Scholar] [CrossRef]
- Cui, X.; Tang, C.; Zhang, Q. A Review of Electrocatalytic Reduction of Dinitrogen to Ammonia under Ambient Conditions. Adv. Energy Mater. 2018, 8, 1800369. [Google Scholar] [CrossRef]
- Tang, C.; Qiao, S.-Z. How to Explore Ambient Electrocatalytic Nitrogen Reduction Reliably and Insightfully. Chem. Soc. Rev. 2019, 48, 3166–3180. [Google Scholar] [CrossRef] [PubMed]
- Xue, X.; Chen, R.; Yan, C.; Zhao, P.; Hu, Y.; Zhang, W.; Yang, S.; Jin, Z. Review on Photocatalytic and Electrocatalytic Artificial Nitrogen Fixation for Ammonia Synthesis at Mild Conditions: Advances, Challenges and Perspectives. Nano Res. 2019, 12, 1229–1249. [Google Scholar] [CrossRef]
- Zhang, X.; Wang, Y.; Liu, C.; Yu, Y.; Lu, S.; Zhang, B. Recent Advances in Non-Noble Metal Electrocatalysts for Nitrate Reduction. Chem. Eng. J. 2021, 403, 126269. [Google Scholar] [CrossRef]
- Lu, X.; Song, H.; Cai, J.; Lu, S. Recent Development of Electrochemical Nitrate Reduction to Ammonia: A Mini Review. Electrochem. Commun. 2021, 129, 107094. [Google Scholar] [CrossRef]
- Guo, C.; Ran, J.; Vasileff, A.; Qiao, S.-Z. Rational Design of Electrocatalysts and Photo(Electro)Catalysts for Nitrogen Reduction to Ammonia (NH3) under Ambient Conditions. Energy Environ. Sci. 2018, 11, 45–56. [Google Scholar] [CrossRef]
- Bai, Y.; Bai, H.; Qu, K.; Wang, F.; Guan, P.; Xu, D.; Fan, W.; Shi, W. In-Situ Approach to Fabricate BiOI Photocathode with Oxygen Vacancies: Understanding the N2 Reduced Behavior in Photoelectrochemical System. Chem. Eng. J. 2019, 362, 349–356. [Google Scholar] [CrossRef]
- Cao, N.; Zheng, G. Aqueous Electrocatalytic N2 Reduction under Ambient Conditions. Nano Res. 2018, 11, 2992–3008. [Google Scholar] [CrossRef]
- Chen, X.; Li, N.; Kong, Z.; Ong, W.-J.; Zhao, X. Photocatalytic Fixation of Nitrogen to Ammonia: State-of-the-Art Advancements and Future Prospects. Mater. Horiz. 2018, 5, 9–27. [Google Scholar] [CrossRef]
- Wu, H.; Irani, R.; Zhang, K.; Jing, L.; Dai, H.; Chung, H.Y.; Abdi, F.F.; Ng, Y.H. Unveiling Carrier Dynamics in Periodic Porous BiVO4 Photocatalyst for Enhanced Solar Water Splitting. ACS Energy Lett. 2021, 6, 3400–3407. [Google Scholar] [CrossRef]
- Wu, H.; Tan, H.L.; Toe, C.Y.; Scott, J.; Wang, L.; Amal, R.; Ng, Y.H. Photocatalytic and Photoelectrochemical Systems: Similarities and Differences. Adv. Mater. 2020, 32, 1904717. [Google Scholar] [CrossRef] [PubMed]
- Utomo, W.P.; Leung, M.K.H.; Yin, Z.; Wu, H.; Ng, Y.H. Advancement of Bismuth-Based Materials for Electrocatalytic and Photo(Electro)Catalytic Ammonia Synthesis. Adv. Funct. Mater. 2022, 32, 2106713. [Google Scholar] [CrossRef]
- Zhang, Y.; Hu, J.; Zhang, C.; Liu, Y.; Xu, M.; Xue, Y.; Liu, L.; Leung, M.K.H. Bimetallic Mo–Co Nanoparticles Anchored on Nitrogen-Doped Carbon for Enhanced Electrochemical Nitrogen Fixation. J. Mater. Chem. A 2020, 8, 9091–9098. [Google Scholar] [CrossRef]
- Daiyan, R.; Chen, R.; Kumar, P.; Bedford, N.M.; Qu, J.; Cairney, J.M.; Lu, X.; Amal, R. Tunable Syngas Production through CO2 Electroreduction on Cobalt–Carbon Composite Electrocatalyst. ACS Appl. Mater. Interfaces 2020, 12, 9307–9315. [Google Scholar] [CrossRef]
- Utomo, W.P.; Wu, H.; Ng, Y.H. Modulating the Active Sites of Oxygen-Deficient TiO2 by Copper Loading for Enhanced Electrocatalytic Nitrogen Reduction to Ammonia. Small 2022, 18, 2200996. [Google Scholar] [CrossRef]
- Chen, P.; Shen, J.; Wang, T.; Dai, M.; Si, C.; Xie, J.; Li, M.; Cong, X.; Sun, X. Zeolitic Imidazolate Framework-67 Based Separator for Enhanced High Thermal Stability of Lithium Ion Battery. J. Power Sources 2018, 400, 325–332. [Google Scholar] [CrossRef]
- Wang, Y.; Zhou, W.; Jia, R.; Yu, Y.; Zhang, B. Unveiling the Activity Origin of a Copper-Based Electrocatalyst for Selective Nitrate Reduction to Ammonia. Angew. Chem. Int. Ed. 2020, 59, 5350–5354. [Google Scholar] [CrossRef]
- Qing, G.; Ghazfar, R.; Jackowski, S.T.; Habibzadeh, F.; Ashtiani, M.M.; Chen, C.-P.; Smith, M.R.; Hamann, T.W. Recent Advances and Challenges of Electrocatalytic N2 Reduction to Ammonia. Chem. Rev. 2020, 120, 5437–5516. [Google Scholar] [CrossRef]
- Choi, J.; Suryanto, B.H.R.; Wang, D.; Du, H.-L.; Hodgetts, R.Y.; Ferrero Vallana, F.M.; MacFarlane, D.R.; Simonov, A.N. Identification and Elimination of False Positives in Electrochemical Nitrogen Reduction Studies. Nat. Commun. 2020, 11, 5546. [Google Scholar] [CrossRef]
- Guo, Y.; Liu, C.; Ye, R.; Duan, Q. Advances on Water Quality Detection by UV-Vis Spectroscopy. Appl. Sci. 2020, 10, 6874. [Google Scholar] [CrossRef]
- Zhao, Y.; Wu, F.; Miao, Y.; Zhou, C.; Xu, N.; Shi, R.; Wu, L.-Z.; Tang, J.; Zhang, T. Revealing Ammonia Quantification Minefield in Photo/Electrocatalysis. Angew. Chem. Int. Ed. 2021, 60, 21728–21731. [Google Scholar] [CrossRef] [PubMed]
- Zhao, Y.; Shi, R.; Bian, X.; Zhou, C.; Zhao, Y.; Zhang, S.; Wu, F.; Waterhouse, G.I.N.; Wu, L.-Z.; Tung, C.-H.; et al. Ammonia Detection Methods in Photocatalytic and Electrocatalytic Experiments: How to Improve the Reliability of NH3 Production Rates? Adv. Sci. 2019, 6, 1802109. [Google Scholar] [CrossRef] [PubMed]
- Choe, S.; Kim, S.M.; Lee, Y.; Seok, J.; Jung, J.; Lee, J.S.; Jang, Y.J. Rational Design of Photocatalysts for Ammonia Production from Water and Nitrogen Gas. Nano Converg. 2021, 8, 22. [Google Scholar] [CrossRef]
- Salbitani, G.; Carfagna, S. Ammonium Utilization in Microalgae: A Sustainable Method for Wastewater Treatment. Sustainability 2021, 13, 956. [Google Scholar] [CrossRef]
- Langenfeld, N.J.; Kusuma, P.; Wallentine, T.; Criddle, C.S.; Seefeldt, L.C.; Bugbee, B. Optimizing Nitrogen Fixation and Recycling for Food Production in Regenerative Life Support Systems. Front. Astron. Space Sci. 2021, 8, 105. [Google Scholar] [CrossRef]
- Skolotneva, E.; Tsygurina, K.; Mareev, S.; Melnikova, E.; Pismenskaya, N.; Nikonenko, V. High Diffusion Permeability of Anion-Exchange Membranes for Ammonium Chloride: Experiment and Modeling. Int. J. Mol. Sci. 2022, 23, 5782. [Google Scholar] [CrossRef]
- Chen, X.; Guo, Y.; Du, X.; Zeng, Y.; Chu, J.; Gong, C.; Huang, J.; Fan, C.; Wang, X.; Xiong, J. Atomic Structure Modification for Electrochemical Nitrogen Reduction to Ammonia. Adv. Energy Mater. 2020, 10, 1903172. [Google Scholar] [CrossRef]
- Rocha, F.S.; Gomes, A.J.; Lunardi, C.N.; Kaliaguine, S.; Patience, G.S. Experimental Methods in Chemical Engineering: Ultraviolet Visible Spectroscopy—UV-Vis. Can. J. Chem. Eng. 2018, 96, 2512–2517. [Google Scholar] [CrossRef]
- Akash, M.S.H.; Rehman, K. Essentials of Pharmaceutical Analysis; Springer Nature Singapore: Singapore, 2020; ISBN 9789811515460. [Google Scholar]
- Pavia, D.L.; Lampman, G.M.; Kriz, G.S.; Vyvyan, J.R. Introduction to Spectroscopy, 5th ed.; Cengage Learning: Stamford, CT, USA, 2013. [Google Scholar]
- Zhou, L.; Boyd, C.E. Comparison of Nessler, Phenate, Salicylate and Ion Selective Electrode Procedures for Determination of Total Ammonia Nitrogen in Aquaculture. Aquaculture 2016, 450, 187–193. [Google Scholar] [CrossRef]
- Cong, M.; Chen, X.; Xia, K.; Ding, X.; Zhang, L.; Jin, Y.; Gao, Y.; Zhang, L. Selective Nitrogen Reduction to Ammonia on Iron Porphyrin-Based Single-Site Metal–Organic Frameworks. J. Mater. Chem. A 2021, 9, 4673–4678. [Google Scholar] [CrossRef]
- Zhang, Z.; Yao, K.; Cong, L.; Yu, Z.; Qu, L.; Huang, W. Facile Synthesis of a Ru-Dispersed N-Doped Carbon Framework Catalyst for Electrochemical Nitrogen Reduction. Catal. Sci. Technol. 2020, 10, 1336–1342. [Google Scholar] [CrossRef]
- Khalil, I.E.; Xue, C.; Liu, W.; Li, X.; Shen, Y.; Li, S.; Zhang, W.; Huo, F. The Role of Defects in Metal–Organic Frameworks for Nitrogen Reduction Reaction: When Defects Switch to Features. Adv. Funct. Mater. 2021, 31, 2010052. [Google Scholar] [CrossRef]
- Mikeš, O. Chapter 4.5. Ion Exchange Chromatography. In New Comprehensive Biochemistry; Deyl, Z., Ed.; Separation Methods; Elsevier: Amsterdam, The Netherlands, 1984; Volume 8, pp. 205–270. [Google Scholar]
- Lucy, C.A.; Hatsis, P. Chapter 4 Ion Chromatography. In Journal of Chromatography Library, 6th ed.; Heftmann, E., Ed.; chromatography; Elsevier: Amsterdam, The Netherlands, 2004; Volume 69, pp. 171–211. [Google Scholar]
- Srinivasan, K. Chapter Nine-Ion Chromatography Instrumentation for Water Analysis. In Chemistry and Water; Ahuja, S., Ed.; Elsevier: Amsterdam, The Netherlands, 2017; pp. 329–351. ISBN 978-0-12-809330-6. [Google Scholar]
- Chong, J.; Hatsis, P.; Lucy, C.A. High-Speed Ion Chromatographic Separation of Cations at Elevated Temperature. J. Chromatogr. A 2003, 997, 161–169. [Google Scholar] [CrossRef] [PubMed]
- Zia, K.; Siddiqui, T.; Ali, S.; Farooq, I.; Zafar, M.S.; Khurshid, Z. Nuclear Magnetic Resonance Spectroscopy for Medical and Dental Applications: A Comprehensive Review. Eur. J. Dent. 2019, 13, 124–128. [Google Scholar] [CrossRef]
- Jang, Y.J.; Lindberg, A.E.; Lumley, M.A.; Choi, K.-S. Photoelectrochemical Nitrogen Reduction to Ammonia on Cupric and Cuprous Oxide Photocathodes. ACS Energy Lett. 2020, 5, 1834–1839. [Google Scholar] [CrossRef]
- Rigamonti, M.G.; Gatti, F.G.; Patience, G.S. Experimental Methods in Chemical Engineering: Nuclear Magnetic Resonance. Can. J. Chem. Eng. 2019, 97, 628–635. [Google Scholar] [CrossRef]
- Lindner, E.; Pendley, B.D. A Tutorial on the Application of Ion-Selective Electrode Potentiometry: An Analytical Method with Unique Qualities, Unexplored Opportunities and Potential Pitfalls; Tutorial. Anal. Chim. Acta 2013, 762, 1–13. [Google Scholar] [CrossRef]
- Berg, J. An Ion-Selective Electrode for Detection of Ammonium in Wastewater Treatment Plants; KTH Royal Institute of Technology: Stockholm, Sweden, 2021; p. 48. [Google Scholar]
- Cecconi, F.; Reifsnyder, S.; Ito, Y.; Jimenez, M.; Sobhani, R.; Rosso, D. ISE-Ammonium Sensors in WRRFs: Field Assessment of Their Influencing Factors. Environ. Sci. Water Res. Technol. 2019, 5, 737–746. [Google Scholar] [CrossRef]
- Li, T.; Wu, Y.; Huang, J.; Zhang, S. Gas Sensors Based on Membrane Diffusion for Environmental Monitoring. Sens. Actuators B Chem. 2017, 243, 566–578. [Google Scholar] [CrossRef]
- Lakowicz, J.R. (Ed.) Introduction to Fluorescence. In Principles of Fluorescence Spectroscopy; Springer: Boston, MA, USA, 2006; pp. 1–26. ISBN 978-0-387-46312-4. [Google Scholar]
- Gomes, A.J.; Lunardi, C.N.; Rocha, F.S.; Patience, G.S. Experimental Methods in Chemical Engineering: Fluorescence Emission Spectroscopy. Can. J. Chem. Eng. 2019, 97, 2168–2175. [Google Scholar] [CrossRef]
- Sarı, T.; Dede, S.; Yusufoğlu, B.; Karakuş, E. Determination of L-Phenylalanine in Human Plasma Samples with New Fluorometric Method. Appl. Biochem. Biotechnol. 2022, 194, 1259–1270. [Google Scholar] [CrossRef] [PubMed]
- Roth, M. Fluorescence Reaction for Amino Acids. Anal. Chem. 1971, 43, 880–882. [Google Scholar] [CrossRef]
- Genfa, Z.; Dasgupta, P.K. Fluorometric Measurement of Aqueous Ammonium Ion in a Flow Injection System. Anal. Chem. 1989, 61, 408–412. [Google Scholar] [CrossRef]
- Felix, E.P.; Cardoso, A.A. A Method for Determination of Ammonia in Air Using Oxalic Acid-Impregnated Cellulose Filters and Fluorimetric Detection. J. Braz. Chem. Soc. 2012, 23, 142–147. [Google Scholar] [CrossRef]
- Hu, H.; Liang, Y.; Li, S.; Guo, Q.; Wu, C. A Modified o-Phthalaldehyde Fluorometric Analytical Method for Ultratrace Ammonium in Natural Waters Using EDTA-NaOH as Buffer. J. Anal. Methods Chem. 2014, 2014, e728068. [Google Scholar] [CrossRef]
- Zhu, Y.; Yuan, D.; Lin, H.; Zhou, T. Determination of Ammonium in Seawater by Purge-and-Trap and Flow Injection with Fluorescence Detection. Anal. Lett. 2016, 49, 665–675. [Google Scholar] [CrossRef]
- Kun, E.; Kearney, E.B. Ammonia. In Methods of Enzymatic Analysis, 2nd ed.; Bergmeyer, H.U., Ed.; Academic Press: Cambridge, MA, USA, 1974; pp. 1802–1806. ISBN 978-0-12-091304-6. [Google Scholar]
- Guilbault, G.G. Use of Enzymes in Analytical Chemistry. Anal. Chem. 1966, 38, 527–536. [Google Scholar] [CrossRef]
- Hao, Y.-C.; Guo, Y.; Chen, L.-W.; Shu, M.; Wang, X.-Y.; Bu, T.-A.; Gao, W.-Y.; Zhang, N.; Su, X.; Feng, X.; et al. Promoting Nitrogen Electroreduction to Ammonia with Bismuth Nanocrystals and Potassium Cations in Water. Nat. Catal. 2019, 2, 448–456. [Google Scholar] [CrossRef]
- Ishihara, A.; Kurahasi, K.; Uehara, H. Enzymatic Determination of Ammonia in Blood Plasma. Clin. Chim. Acta 1972, 41, 255–261. [Google Scholar] [CrossRef]
- Wang, P.; Chang, F.; Gao, W.; Guo, J.; Wu, G.; He, T.; Chen, P. Breaking Scaling Relations to Achieve Low-Temperature Ammonia Synthesis through LiH-Mediated Nitrogen Transfer and Hydrogenation. Nat. Chem. 2017, 9, 64–70. [Google Scholar] [CrossRef]
- Bridgewater, L.L.; Baird, R.B.; Eaton, A.D.; Rice, E.W. Standard Methods for the Examination of Water and Wastewater, 23rd ed.; American Public Health Association, American Water Works Association, Water Environment Federation, Eds.; American Public Health Association: Washington, DC, USA, 2017; ISBN 978-0-87553-287-5. [Google Scholar]
- Li, L.; Tang, C.; Xia, B.; Jin, H.; Zheng, Y.; Qiao, S.-Z. Two-Dimensional Mosaic Bismuth Nanosheets for Highly Selective Ambient Electrocatalytic Nitrogen Reduction. ACS Catal. 2019, 9, 2902–2908. [Google Scholar] [CrossRef]
- Xing, Z.; Kong, W.; Wu, T.; Xie, H.; Wang, T.; Luo, Y.; Shi, X.; Asiri, A.M.; Zhang, Y.; Sun, X. Hollow Bi2MoO6 Sphere Effectively Catalyzes the Ambient Electroreduction of N2 to NH3. ACS Sustain. Chem. Eng. 2019, 7, 12692–12696. [Google Scholar] [CrossRef]
- Liu, J.; Li, R.; Zu, X.; Zhang, X.; Wang, Y.; Wang, Y.; Fan, C. Photocatalytic Conversion of Nitrogen to Ammonia with Water on Triphase Interfaces of Hydrophilic-Hydrophobic Composite Bi4O5Br2/ZIF-8. Chem. Eng. J. 2019, 371, 796–803. [Google Scholar] [CrossRef]
- Daiyan, R.; Tran-Phu, T.; Kumar, P.; Iputera, K.; Tong, Z.; Leverett, J.; Ali Khan, M.H.; Esmailpour, A.A.; Jalili, A.; Lim, M.; et al. Nitrate Reduction to Ammonium: From CuO Defect Engineering to Waste NO x -to-NH 3 Economic Feasibility. Energy Environ. Sci. 2021, 14, 3588–3598. [Google Scholar] [CrossRef]
- Petsi, P.N.; Sarasidis, V.C.; Plakas, K.V.; Karabelas, A.J. Reduction of Nitrates in a Photocatalytic Membrane Reactor in the Presence of Organic Acids. J. Environ. Manag. 2021, 298, 113526. [Google Scholar] [CrossRef] [PubMed]
- Zhang, N.; Zheng, F.; Huang, B.; Ji, Y.; Shao, Q.; Li, Y.; Xiao, X.; Huang, X. Exploring Bi2Te3 Nanoplates as Versatile Catalysts for Electrochemical Reduction of Small Molecules. Adv. Mater. 2020, 32, 1906477. [Google Scholar] [CrossRef]
- Vesali-Kermani, E.; Habibi-Yangjeh, A.; Diarmand-Khalilabad, H.; Ghosh, S. Nitrogen Photofixation Ability of G-C3N4 Nanosheets/Bi2MoO6 Heterojunction Photocatalyst under Visible-Light Illumination. J. Colloid Interface Sci. 2020, 563, 81–91. [Google Scholar] [CrossRef] [PubMed]
- Xu, C.; Qiu, P.; Li, L.; Chen, H.; Jiang, F.; Wang, X. Bismuth Subcarbonate with Designer Defects for Broad-Spectrum Photocatalytic Nitrogen Fixation. ACS Appl. Mater. Interfaces 2018, 10, 25321–25328. [Google Scholar] [CrossRef]
- Fei, T.; Yu, L.; Liu, Z.; Song, Y.; Xu, F.; Mo, Z.; Liu, C.; Deng, J.; Ji, H.; Cheng, M.; et al. Graphene Quantum Dots Modified Flower like Bi2WO6 for Enhanced Photocatalytic Nitrogen Fixation. J. Colloid Interface Sci. 2019, 557, 498–505. [Google Scholar] [CrossRef] [PubMed]
- Liu, H.; Li, J.; Du, F.; Yang, L.; Huang, S.; Gao, J.; Li, C.; Guo, C. A Core–Shell Copper Oxides-Cobalt Oxides Heterostructure Nanowire Arrays for Nitrate Reduction to Ammonia with High Yield Rate. Green Energy Environ. 2022; in press. [Google Scholar] [CrossRef]
- Gao, X.; Shang, Y.; Liu, L.; Gao, K. Ag Plasmon Resonance Promoted 2D AgBr-δ-Bi2O3 Nanosheets with Enhanced Photocatalytic Ability. J. Alloys Compd. 2019, 803, 565–575. [Google Scholar] [CrossRef]
- Xu, F.; Wu, F.; Zhu, K.; Fang, Z.; Jia, D.; Wang, Y.; Jia, G.; Low, J.; Ye, W.; Sun, Z.; et al. Boron Doping and High Curvature in Bi Nanorolls for Promoting Photoelectrochemical Nitrogen Fixation. Appl. Catal. B 2021, 284, 119689. [Google Scholar] [CrossRef]
- Wang, Y.; Shi, M.; Bao, D.; Meng, F.; Zhang, Q.; Zhou, Y.; Liu, K.; Zhang, Y.; Wang, J.; Chen, Z.; et al. Generating Defect-Rich Bismuth for Enhancing the Rate of Nitrogen Electroreduction to Ammonia. Angew. Chem. Int. Ed. 2019, 58, 9464–9469. [Google Scholar] [CrossRef]


| Method | Detection Range (mg L−1 NH3-N) | Remarks | Representative Samples | Reaction System | NH3-N Yield (mg L−1) | Ref. |
|---|---|---|---|---|---|---|
| Spectrophotometer method: Indophenol blue method (salicylate method) | 0–0.6 | Advantages: High accuracy and repeatibility, simple procedure and instrumentation, stable color, low toxicity. Limitations: Time-consuming, sacrificial reagent interference. | Bi nanosheet | EC-NRR | 0.14 (−0.8 V) (a) | [73] |
| Cu/oxygen deficient-TiO2 | EC-NRR | 0.06 (−0.5 V) (a) | [28] | |||
| Bi2MoO6 | EC-NRR | 0.08 (−0.6 V) (a),(b) | [74] | |||
| Bi4O5Br2/ZIF-8 | PC-NRR | 0.46 | [75] | |||
| Cu/Cu2O | EC- NO3−RR | 171.4 (−0.85 V) (a),(c) | [30] | |||
| Defected CuO | EC- NO3−RR | 364.0 (−2.2 V) (a),(b),(c) | [76] | |||
| TiO2 (P25) | PC-NO3−RR | 2.3 | [77] | |||
| Spectrophotometer method: Nessler’s method | 0.025–5.0 | Advantages: High accuracy and repeatability, simple procedure and instrumentation, timesaving. Limitations: Metallic ion interference, pH effect, sacrificial reagent effect, toxicity. | Bi2Te3 | EC-NRR | 0.2 (−0.4 V) (a) | [78] |
| Bi nanocrystal | EC-NRR | 4.6 (−0.8 V) (a),(b) | [69] | |||
| C3N4/Bi2MoO6 | PC-NRR | 1.8 | [79] | |||
| Bi2O2CO3 | PC-NRR | 13.4 | [80] | |||
| GQDs/Bi2WO6 | PC-NRR | 0.3 | [81] | |||
| CuO@Co3O4 | EC- NO3−RR | 1675.6 (−0.24 V) (a),(b),(c) | [82] | |||
| Ion chromatography | 0.02–40 | Advantages: Detection of wide range of concentrations, high selectivity and precision, rapid detection. Limitation: Overlapped peak between NH4+ with Na+, K+, or Li+. | Ag/AgI-δ-Bi2O3 | PC-NRR | 3.3 | [83] |
| B-doped Bi (photoanode) | PEC-NRR | 0.03 (+0.48 V) (a),(b) | [84] | |||
| 1H NMR | / | Advantages: High sensitivity, straighforward discrimination of 14NH4 and 15NH3, appreciable repeatibility. Limitation: Complex and expensive instrumentation. | Defected Bi nanoplate | EC-NRR | 0.11 (−0.9 V) (a),(b) | [85] |
| ISE method: NH4+-ion selective electrode | 0.06–20,000 (d) | Advantage: Rapid detection Limitations: Na+ and K+ interference, less precise and accurate at low ammonia concentration. | / | / | / | / |
| ISE method: NH3 gas sensing electrode | 0.01–17,000 (e) | Advantage: Rapid detection Limitations: Escape of NH3 gas, less precise and accurate at low ammonia concentration. | / | / | / | / |
| Fluorometric method | 1.0 × 10⁻⁴–2.8 × 10⁻³ | Advantage: High sensitivity (up to nanomolar level) Limitations: Reaction completeness, complex instrumentation, less suitable for high ammonia concentration. | / | / | / | / |
Disclaimer/Publisher’s Note: The statements, opinions and data contained in all publications are solely those of the individual author(s) and contributor(s) and not of MDPI and/or the editor(s). MDPI and/or the editor(s) disclaim responsibility for any injury to people or property resulting from any ideas, methods, instructions or products referred to in the content. |
© 2022 by the authors. Licensee MDPI, Basel, Switzerland. This article is an open access article distributed under the terms and conditions of the Creative Commons Attribution (CC BY) license (https://creativecommons.org/licenses/by/4.0/).
Share and Cite
Utomo, W.P.; Wu, H.; Ng, Y.H. Quantification Methodology of Ammonia Produced from Electrocatalytic and Photocatalytic Nitrogen/Nitrate Reduction. Energies 2023, 16, 27. https://doi.org/10.3390/en16010027
Utomo WP, Wu H, Ng YH. Quantification Methodology of Ammonia Produced from Electrocatalytic and Photocatalytic Nitrogen/Nitrate Reduction. Energies. 2023; 16(1):27. https://doi.org/10.3390/en16010027
Chicago/Turabian StyleUtomo, Wahyu Prasetyo, Hao Wu, and Yun Hau Ng. 2023. "Quantification Methodology of Ammonia Produced from Electrocatalytic and Photocatalytic Nitrogen/Nitrate Reduction" Energies 16, no. 1: 27. https://doi.org/10.3390/en16010027
APA StyleUtomo, W. P., Wu, H., & Ng, Y. H. (2023). Quantification Methodology of Ammonia Produced from Electrocatalytic and Photocatalytic Nitrogen/Nitrate Reduction. Energies, 16(1), 27. https://doi.org/10.3390/en16010027