1. Introduction
Energy is one of the main driving forces of industrial development and economic growth in the world. Main energy resources are categorized into three fields: fossil energies, nuclear energy, and renewable energies. To ensure the security of energy supply, governments are faced with challenges such as increasing fossil fuel prices, rising energy demand, uncertainties in energy resources supply (especially natural gas and oil) because of geopolitical challenges [
1], and environmental effects like global warming [
2]. Increasing living standards and industrial development has led to extremely high demand of electricity. Problems associated with fossil fuels and nuclear energies, such as pollutant gases and nuclear waste, can be eliminated by using renewable energies [
3]. Additionally, the main sources of solar and wind energies are inexhaustible. Thus, it seems that they could be suitable for replacing thermal power plants and nuclear reactors. In other words, sustainable development goals and energy security are the main attraction of renewable energies on a global scale [
4,
5].
Based on the favorable geographic characteristics of Iran, Solaymani et al. [
6] have concluded that although renewable energies have not played a significant role in the energy supply of Iran, they can be used to fulfil the needs in the field of electricity production and fuel diversification to reduce dependency on fossil fuels. Because of that, Iranian government has recently paid attention to developing renewable energy power plants. In this regard, Iran’s Ministry of Energy introduced policies based on restricting fossil fuels and diversifying energy resources and have implemented a number of incentives like financial supports and subsidies to encourage the private sector to invest in wind, geothermal, biomass and solar power plants [
7]. Renewable energy and energy efficiency organization of Iran (SATBA) has set the participation and investment of non-governmental sectors in its major goals [
8,
9]. Finally, Zanjirchi et al. [
10] have identified the critical factors of failure and success of various developing plans of solar energy in Iran [
10].
In general, Iran is among the most suitable places in the world for the intensity and duration of solar radiation. According to estimates, in some regions in Iran, sunshine can reach 3200 h per year and there are more than 300 fully sunny days in most provinces. Additionally, the solar radiation is about 1800–2200 kWh/m
2 in a year, which is higher than the global average [
11]. For estimation of solar radiation and PV power plant production modeling in Iran, several studies have been carried out, like [
12,
13]. Different regions have been ranked in [
14] for implementation of solar power projects using hybrid Multi-Criteria Decision Making approach. A limited number of studies, Bakhshi-Jafarabadi et al. [
15], for example, have investigated the annual recorded energy generation data of commercial grid-connected photovoltaic system to boost the reliability of economic indices of feasibility studies, but they could not verify their forecasts with real power production data in PV systems. Ghodusinejad et al. [
16] evaluated the performance of a PV system in five cities with diverse climatic conditions in order to investigate the effect of weather and climatic conditions on the efficiency and performance of PV panels. They concluded the city of Yazd has the best performance in the amount of energy produced per year, with average capacity factor and performance ratio of 8184.59 (kWh), 23.57% and 0.887, respectively. Isfahan, Bandar Abbas, Tabriz, and Tehran have been ranked in the list from a technical viewpoint.
One of the most challenging topics in recent years is around capturing the maximum energy from the sun by using photovoltaic systems [
17,
18]. In addition to design parameters in types of panels, inverters and electrical equipment, several geographical factors like solar irradiances, the angle of sun incidence, cloudiness, ambient temperature and average wind speed affect the energy yield of such systems; the tilt and orientation of the panel are among the controllable parameters in studied cases [
19,
20]. One of the most critical principles in increasing solar panels’ efficiency is the sun’s radiation angle [
21]. The angle should always be perpendicular to the solar cells for maximum energy absorption. In case the radiation angle of the panels with the sun is not suitable in a power plant, the panels’ efficiency and, consequently, the overall efficiency of the power plant will decrease. Moreover, the sun constantly moves during the day, and due to the declination of the earth’s rotation angle from the sun, it is placed in different positions at different times of the day, month and year. To increase the efficiency of solar panels, the angle of the panels must be variable and always perpendicular to the solar panel, tracking the sun’s position in the sky [
22,
23]. As a result, a solar tracker that detects the sun’s motion is sometimes used to receive the most solar energy and absorb maximum energy. Trackers are devices installed in solar power plants, tracking the sun’s position in the sky to keep direct radiation conditions, leading to more energy extraction and improving electricity generation efficiency. Due to the east-west movement of the sun each day and changes in altitude relative to the horizon in different seasons, designing and building a solar tracker will be relatively complex and costly. Developers usually consider a fixed optimal angle for installing panels [
24,
25].
To maximize the energy generation in these types of power plants, Bushong [
26] investigated single axis and dual axis solar tracking systems which can track the position of the sun according to the season and time of the day to increase the performance of power generation. Although fixed structures can withstand harsher conditions and tracking mechanisms need more complex requirements and more site preparations, additional wiring and high quality materials tracking systems are being widely used. For example, Neville [
27] have showed that the dual axis tracking system has the maximum amount of output energy, with the single axis tracking system’s energy output falling by 5–10% and the fixed system’s output dropping by 50%. Recently Jacobson et al. [
28] estimated the optimal tilt angles of photovoltaic (PV) panel for all countries worldwide. They calculated the ratio of increasing the energy yield in horizontal panels related to optimally tilted, single-axis vertically/horizontally or two-axis tracked panels in the range of 1.19, 1.22, 1.35, and 1.39, respectively. They also concluded that tilting and tracking benefits generally increase with increasing latitude. They concluded that tracking can improve the energy yield in some cases but it cannot guarantee better performance in the power plant. For example, Sharaf Eldin et al. [
29] showed that sun tracking is not that feasible in hot environments. By using a validated mathematical model, they found that while tracking the sun, produced electrical energy can be increased by about 39% in the case of a cold city like Berlin, Germany, but it does not exceed 8% in the case of hot cities like Aswan, Egypt, due to overheating of the solar panels. Moreover, 5% to 10% of the generated energy is needed to run the tracking system.
Nadia Al-Rousan et al. [
30] have studied the principles and mechanisms of PV tracking systems to determine the best orientation of panels in power plants. The traditional and newly developed tracking systems have been compared in terms of efficiency, performance and tracking techniques. They concluded that the intelligent driver systems, which can predict the exact position of the sun, are the most promising tracking systems. Awasthi et al. [
31] have discussed types of solar tracking systems, particularly design and performance analysis of the various dual-axis tracking systems, in recent years. Generally, they have proved that these systems are more efficient and advantageous than single-axis and fixed alternatives.
In recent years, Rodríguez-Gallegos et al. [
32] introduced the types of solar trackers from a techno-economic point of view to assess the feasibility of using this equipment in large-scale solar power plants. They concluded that the solar trackers can be divided into two types, uniaxial and biaxial, in terms of the axis of motion. A single-axis tracker in a solar system can increase electrical efficiency by 25 to 35%, and a two-axis tracker by up to 45%. A dual-axis tracker can be very effective in areas where the sun’s position in the sky changes dramatically from summer to winter. However, in many parts of the world, the sun’s angle does not change enough to cause severe energy generation changes. Uniaxial trackers have a degree of freedom and a motor to adjust the angle of the panels from the east to west at sunrise or the height of the panels from north to south. However, the optimal tilt angle of the panels is adjusted by a supporting structure to a fixed value for the whole year, and in some cases, it is adjusted once at the beginning of each semester. The two-axis tracker has two degrees of freedom and two independent motors, both adjusting the side angle and height. This type of tracker further improves system performance when comparing to the first type. However, due to the complexity of the hardware and software mechanism of the two-way controller, it is significantly different from the uniaxial type in terms of cost. Also, due to the dual movement of the motors in the direction of the side angles and the height of the panels, they need more open space around them. Examples of fixed, uniaxial, tilted single-axis, and biaxial trackers are described in detail in [
32]. Recently researchers, like Gönül et al. [
33], have done a techno-economic assessment between the different type of automatic solar trackers and manually adjustable tilt mechanisms for behind-the-meter PV applications. First, they analysed the electricity production in annually adjustable tilt mechanisms with monthly and seasonal adjustment. Then, automatic single-axis east-west or south-north solar trackers and dual-axis are technically analyzed for three provinces in Turkey with different solar characteristics. Finally, levelized cost of electricity (LCoE), discounted payback period (DPBP) and internal rate of return were evaluated. They concluded in Turkey that the payback period of fixed-tilt system is about 12 years and monthly tilting can increase the production in the range of 3.6 to 5%, and two-axis tracker can increases production by 30.4–34.6% while the payback period would be in between 16.7–24 years.
In terms of automation technology, the electronic solar tracker continuously tracks the sun spatially at any time by moving through the engine speed control device and is divided into two types, automatic and full-automatic, according to the time control mechanism of engine operation [
34]. In the automatic type, the solar tracker needs manpower only once a day. The device turns on at a specific time around sunrise, and then continues to work and track the sun. At sunset, it automatically reverses, returns to its original position and then automatically shuts off. In the full-automatic type, there is no need for a person to turn the device on or off. At sunrise, the device automatically turns on to track the sun. At sunset, it automatically reverses to return to its original position, and in the same way, it turns on automatically the next day and continues to work. Regarding the movement type, there are two types, trackers with continuous and non-continuous motion. In the continuous type, the tracker continuously tracks the sun at any moment and is independent of the sun’s radiation (visibility of the sun). Theoretically and practically, it is entirely continuous and works based on the regular rotation of the earth or the apparent motion of the sun (the passage of time), which is continuous and constant. Due to the continuity, the system has proper functioning and is entirely error-free. As the sun hides under the clouds (cloudy and sunny days), the error-free system continues to operate with high accuracy and tracks the sun even under the clouds, meaning that the system works well on cloudy and sunny days. In the discontinuous or discrete type, the tracker detects the sun at regular intervals and is dependent on the sun’s radiation (inclination of the sun). It is theoretically and practically discontinuous. The main disadvantage of this system is that due to this disconnection, it has errors. Its error increases with the incomplete hiding of the sun under the clouds, and the system fails with the complete covering of the sun by clouds. This system only works on completely sunny days (without any clouds), and on partly cloudy days, it either has a lot of errors or does not work at all.
In Iran, where in any part of the country, on average, only about two months of the day is entirely sunny (without any clouds), the discontinuous system is unusable, so the continuous system must be used. The intermittent system can only be used in South and Southeast Asia, Africa, and South Africa. In terms of propulsion mechanisms, solar tracking systems are usually driven individually or in sets using a variety of electric motors such as stepper motor or servomotor. The rotation of this type of motor is typically transmitted to the panel support structure by a gearbox consisting of worm or Rack and Pinion gears. There are other types of actuators, such as piston type, in which the electric actuators move the structure holding the panel and change its angle by their longitudinal motion. In terms of solar tracking methods, various thermal sensors, optical sensors, or optical cells are used. Solar tracker power plants also have problems; for example, due to having mobile systems, they usually need more regular maintenance than fixed power plants. In some cases, more space may be needed to build a power plant or more strength for the soil. The drilling operations of wiring and classification trenches also increase. In general, the following problems should be considered regarding the operation of these power plants:
- ▪
Tracker motor breakdown and the need to be replaced or repaired for each string;
- ▪
Need for lubrication and periodic engine maintenance;
- ▪
Sensor failure;
- ▪
Poor sensitivity of sensors and error in detecting the correct direction;
- ▪
Instability in unusual weather conditions.
In terms of the operation economics, it is evident that two-axis tracking systems are suitable for capturing the maximum solar radiation by the panels. However, the high installation and maintenance cost limits the use of these systems for specific purposes only. Due to the constant sunlight on the north-south axis during the day and the daily change of these values, a combination of mechanized trackers was used to reduce the investment and operating costs. In some cases, an assortment of east-west mechanized trackers and north-south seasonal trackers were used, adjusted in six or four months. A comparison of the technical and economic performance of different types of tracking systems is shown in the
Table 1.
Some references predict hourly energy production will change [
25], if different trackers are used. If incentive coefficients are applied for production at certain hours, the economic conditions of the project can be severely affected.
In some cases in solar tracker power plants, due to a lack of accurate calculations, the power plant is fixed after a few years, and the power plant manager is forced to decide that the PV panels of power plant are no longer rotating. This is more common in uniaxial rotating power plants as, in some cases, the cost and time spent to increase the production of a rotating power plant are not justified compared to the fixed mode. For example, due to the geographical location and the purchase price of electricity, a 15% increase in electricity production has not been enough to increase the operating costs by 10%. In some projects, using a two-axis tracker due to the increase in efficiency of up to 40% has made the income from the sale of electricity proportionate to the project costs in the construction and operation stages. Sometimes, the investors of solar power plants use the solar tracker at the beginning of the project, but after the return of the investor’s capital or the full repayment of the loan, they refuse to repair and maintain the tracker as their goal is to settle the loan faster. Moreover, after a while (usually between 10 and 15 years), the trackers work less accurately and require repair and maintenance with exorbitant costs. Furthermore, using the tracker brings a lot of risk in weather with strong wind or snow and blizzards. Usually, in this relatively harsh climate, fixed solar structures are used, and the use of trackers is mostly limited to hot and dry climates.
According to global reports, the volume of the solar tracker market has grown by nearly 40% annually in the last five years despite the COVID-19 pandemic, and it is expected to reach more than 28 billion dollars in the next five years. USA, China, Spain, India, and Brazil have been the main destination markets for the sale of these products. It is estimated that nearly 33% of the solar systems above one megawatt in the United States are equipped with trackers; this number is 27% in regions such as Europe, Africa, and East Asia [
36,
37]. Based on the registered information in Iran, three companies have introduced themselves as manufacturers of solar trackers. As one of these companies claims, this company’s east-west single-axis solar tracker can increase the power plant’s electricity production by 25% per year and up to 40% on a sunny day and improve the return on investment. The tracking equipment of this company is designed for long-term operation under extreme weather conditions with the least need for repair and maintenance, and all its components and parts are made inside Iran. It is the first domestic solar tracker produced on an industrial scale and can increase electricity generation in photovoltaic systems during different months.
Among more than 90 large-scale PV power plants in Iran, there are only four tracking PV power plants in Qom, Isfahan and Yazd provinces. We are limited to consider these geographical positions to evaluate electricity production of different type of power plants in both modelled and real situations. Based on the results, we can expand the scope of the research and predict the power production of tracking PV systems in different regions. According to the available information, out of nearly 90 large-scale solar power plants installed in Iran until mid-2021, only four 10 MW power plants in Yazd, Qom and Isfahan provinces are equipped with single-axis east-west solar trackers whose angle of rotation can be adjusted from morning to afternoon up to 60 degrees relative to the vertical line. Two other 10 MW power plants with single-axis trackers have been put into operation in Yazd province since 2021 but were not included in this study’s performance comparison, due to the lack of information from a year of operation of the power plant. A power plant in Alborz province has also used a two-axis tracker in a part of the installed panels; however, since it is not possible to separate the production of this part from the generation of the entire power plant, it was not included in this study. Considering on the one hand, the geographical location and climate of the power plant installation site, and on the other hand, the scale of the power plant has a significant effect on the production of solar panels, in this article, the performance of power plants with the same capacity was analyzed as the local cases. For this purpose, first, two 10 megawatt power plants at a short distance from Tehran were compared. Next, the performance of four 10-MW-power plants in Yazd and the production of a 10 MW power plant in Isfahan were assessed.
2. Materials and Methods
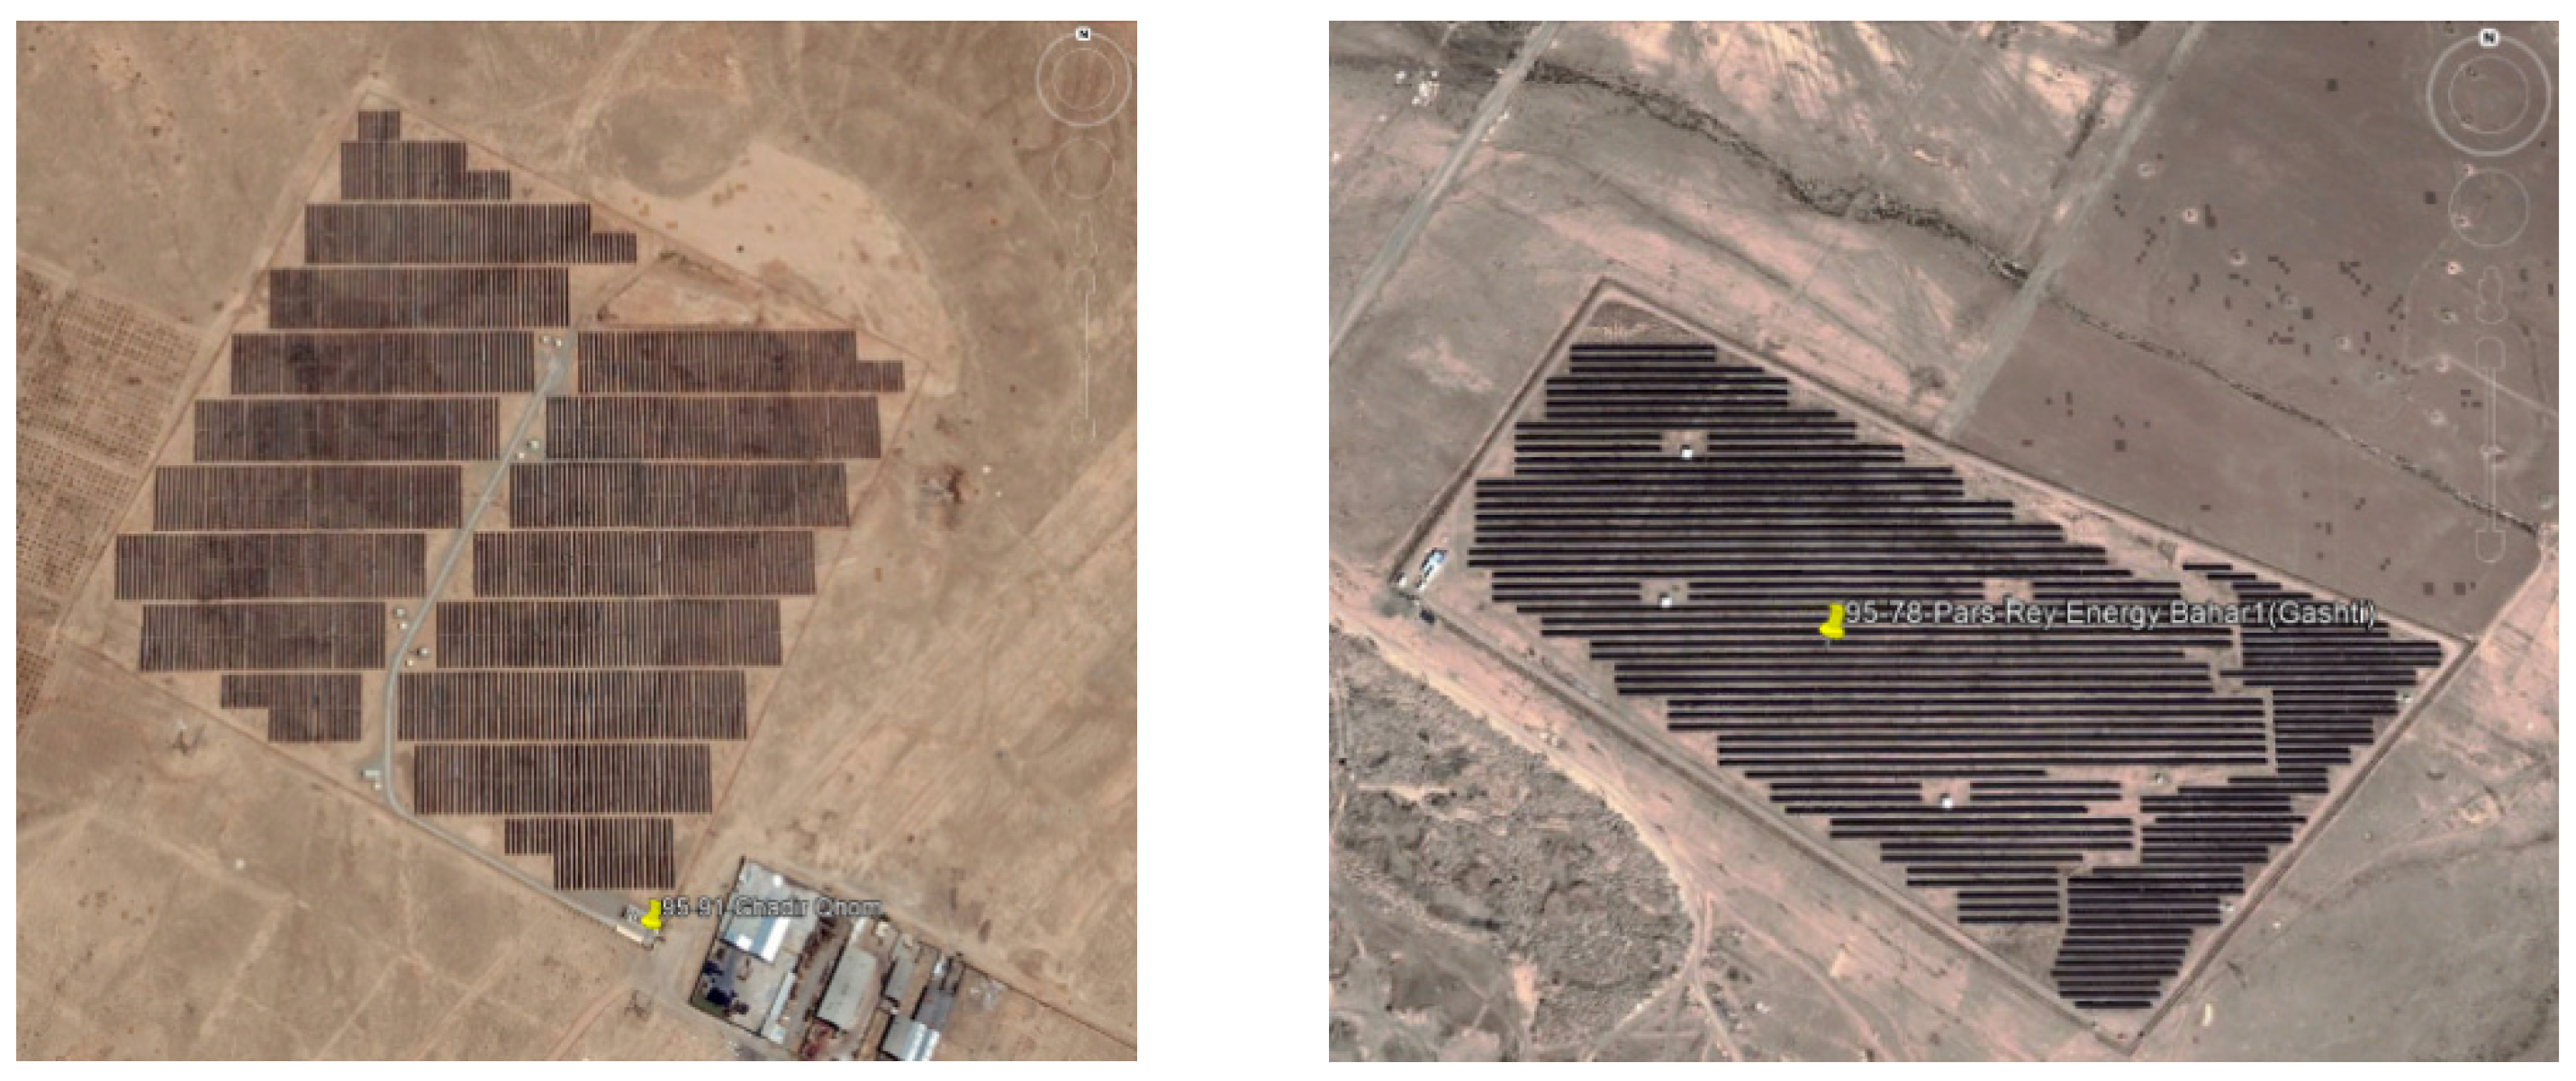
To investigate the effect of trackers on the hourly generation of power, a comparison was made between two 10 MW power plants in Qom (Q power plant) and Tehran (T power plant) provinces, which are in the vicinity of each other (
Table 2). The aerial images of the two power plants shown in
Figure 1 indicate that the installation axis of the panel support structure in the T power plant (installed with fixed foundations) is east-west, and in the Q power plant (installed nearby in Qom province) with a movable base is north-south.
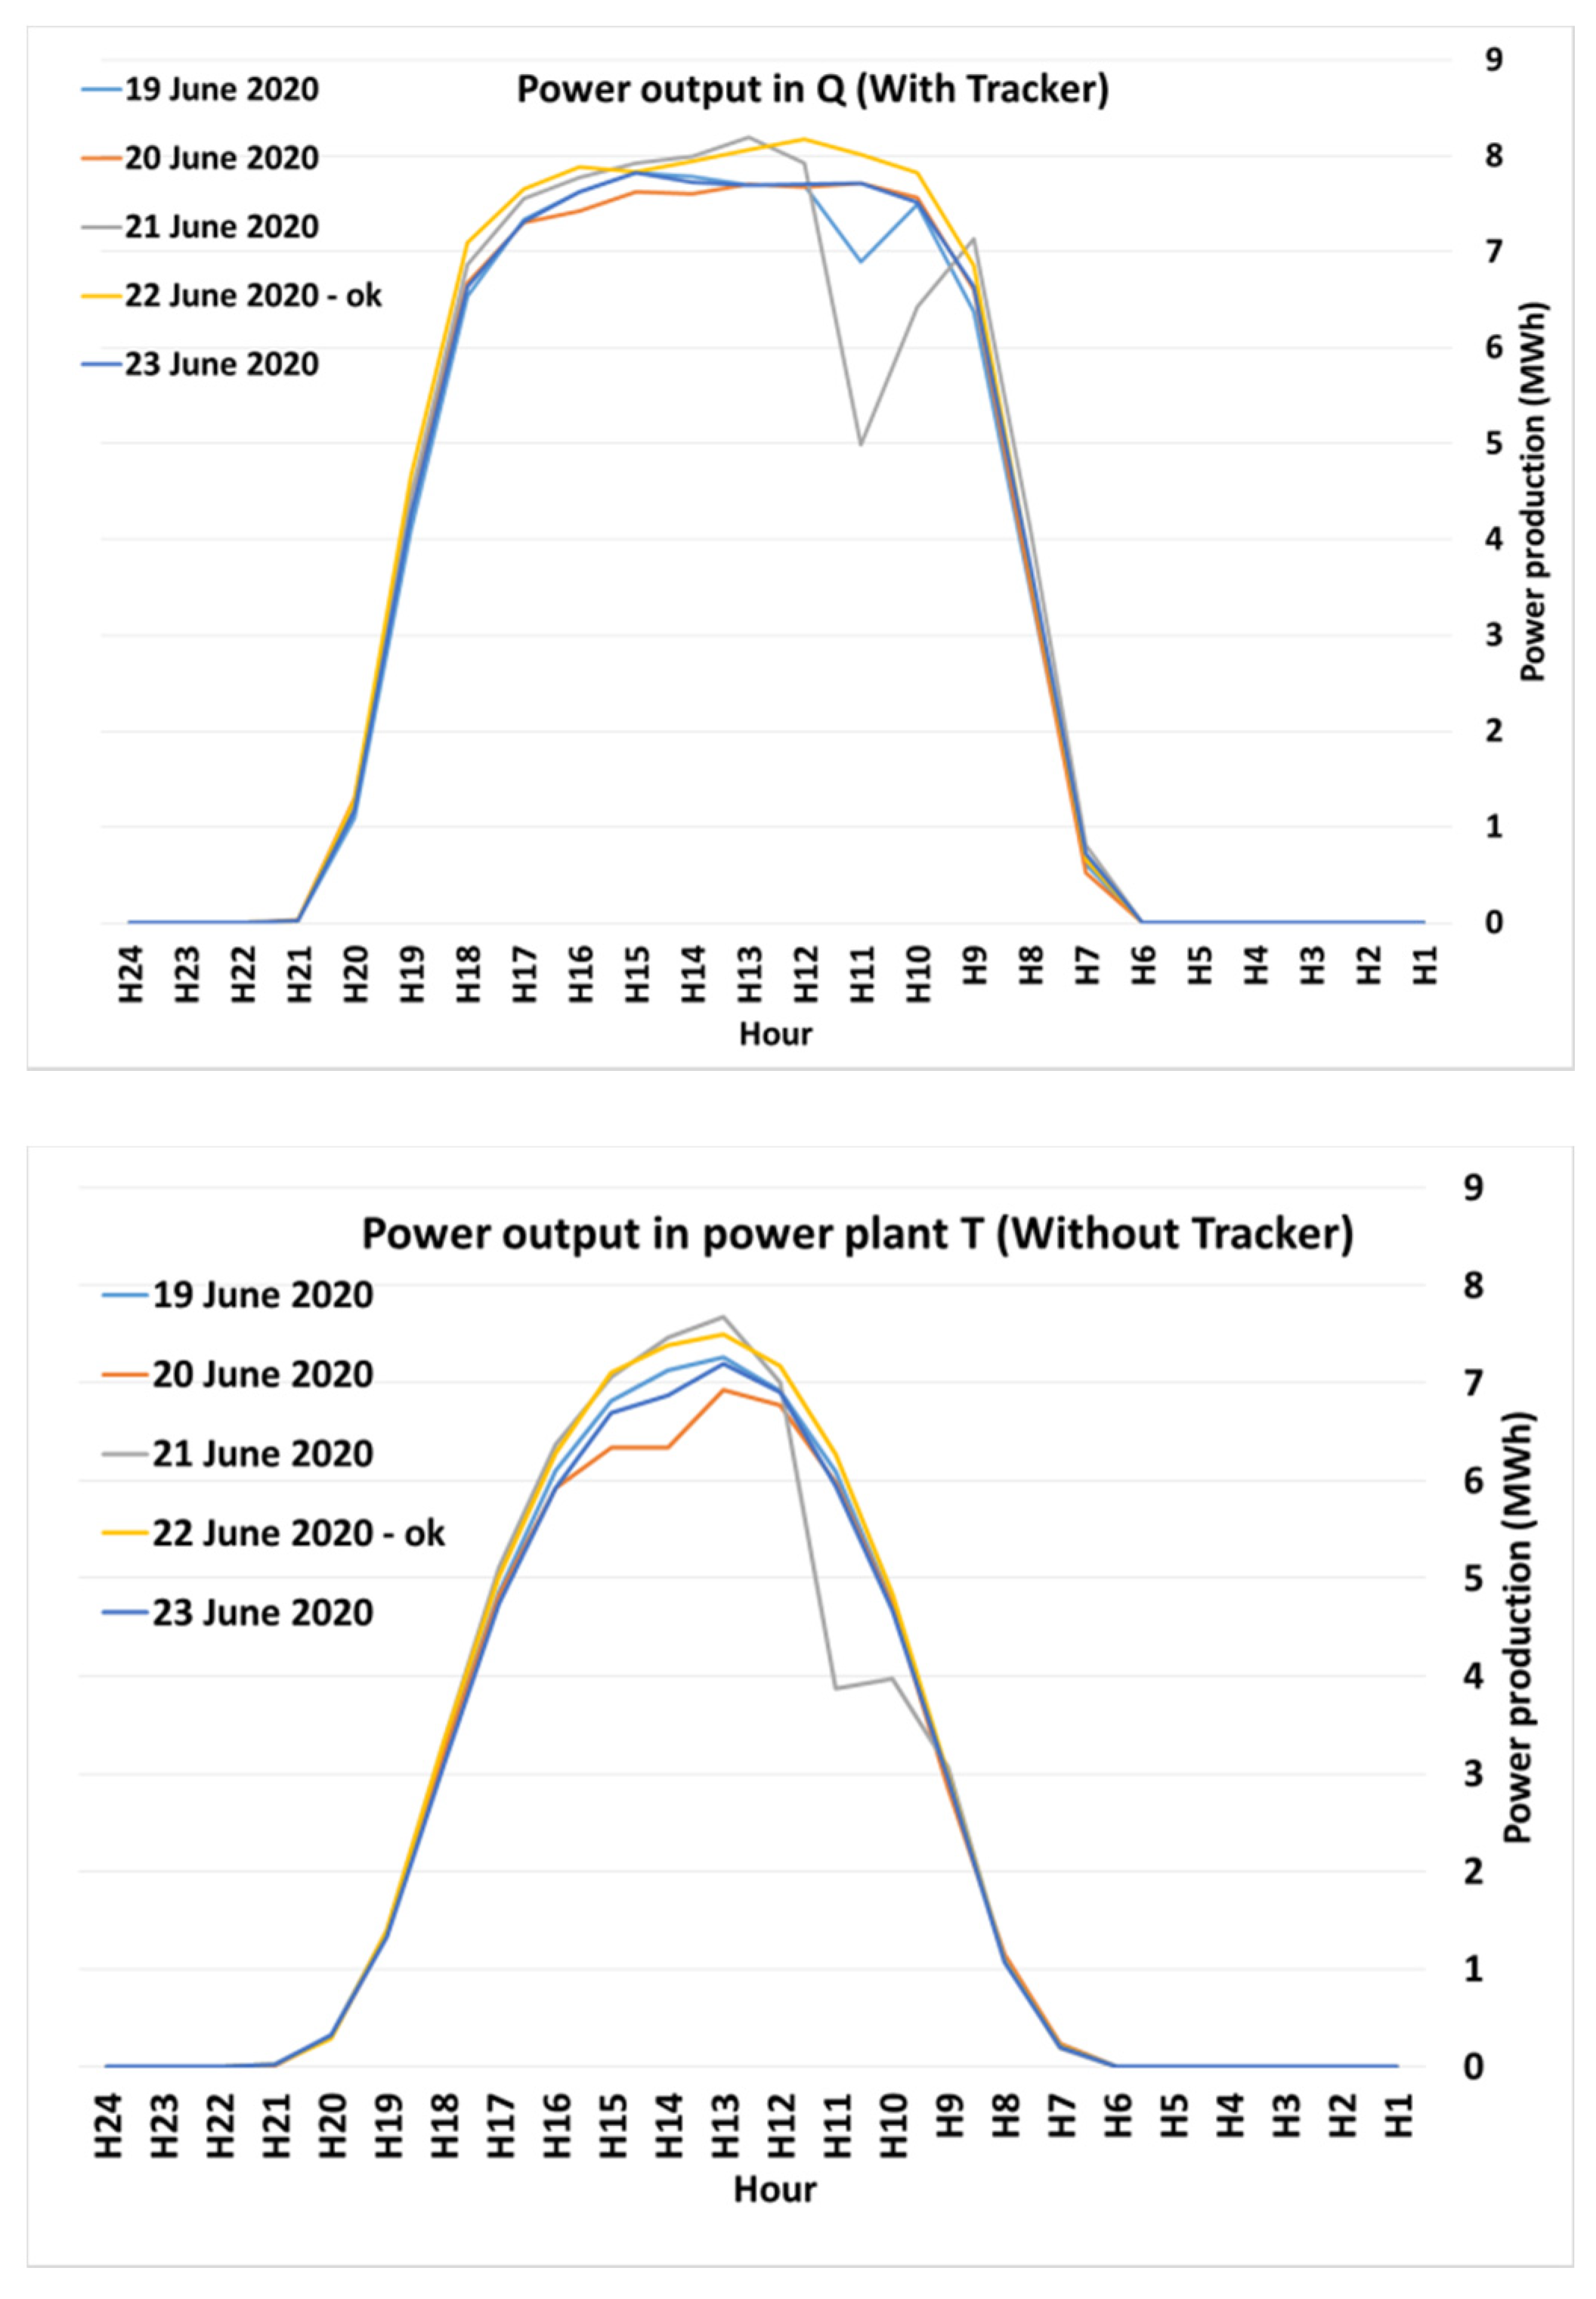
To correctly compare the plant’s hourly production power, five days when the sun was at the highest point of the horizon at the end of June 2020 were checked to find a suitable day for comparison. As observed in the graphs in
Figure 2, on 22 June 2020, the production of the two power plants was almost stable, and there was no interference from weather factors such as clouds or technical problems.
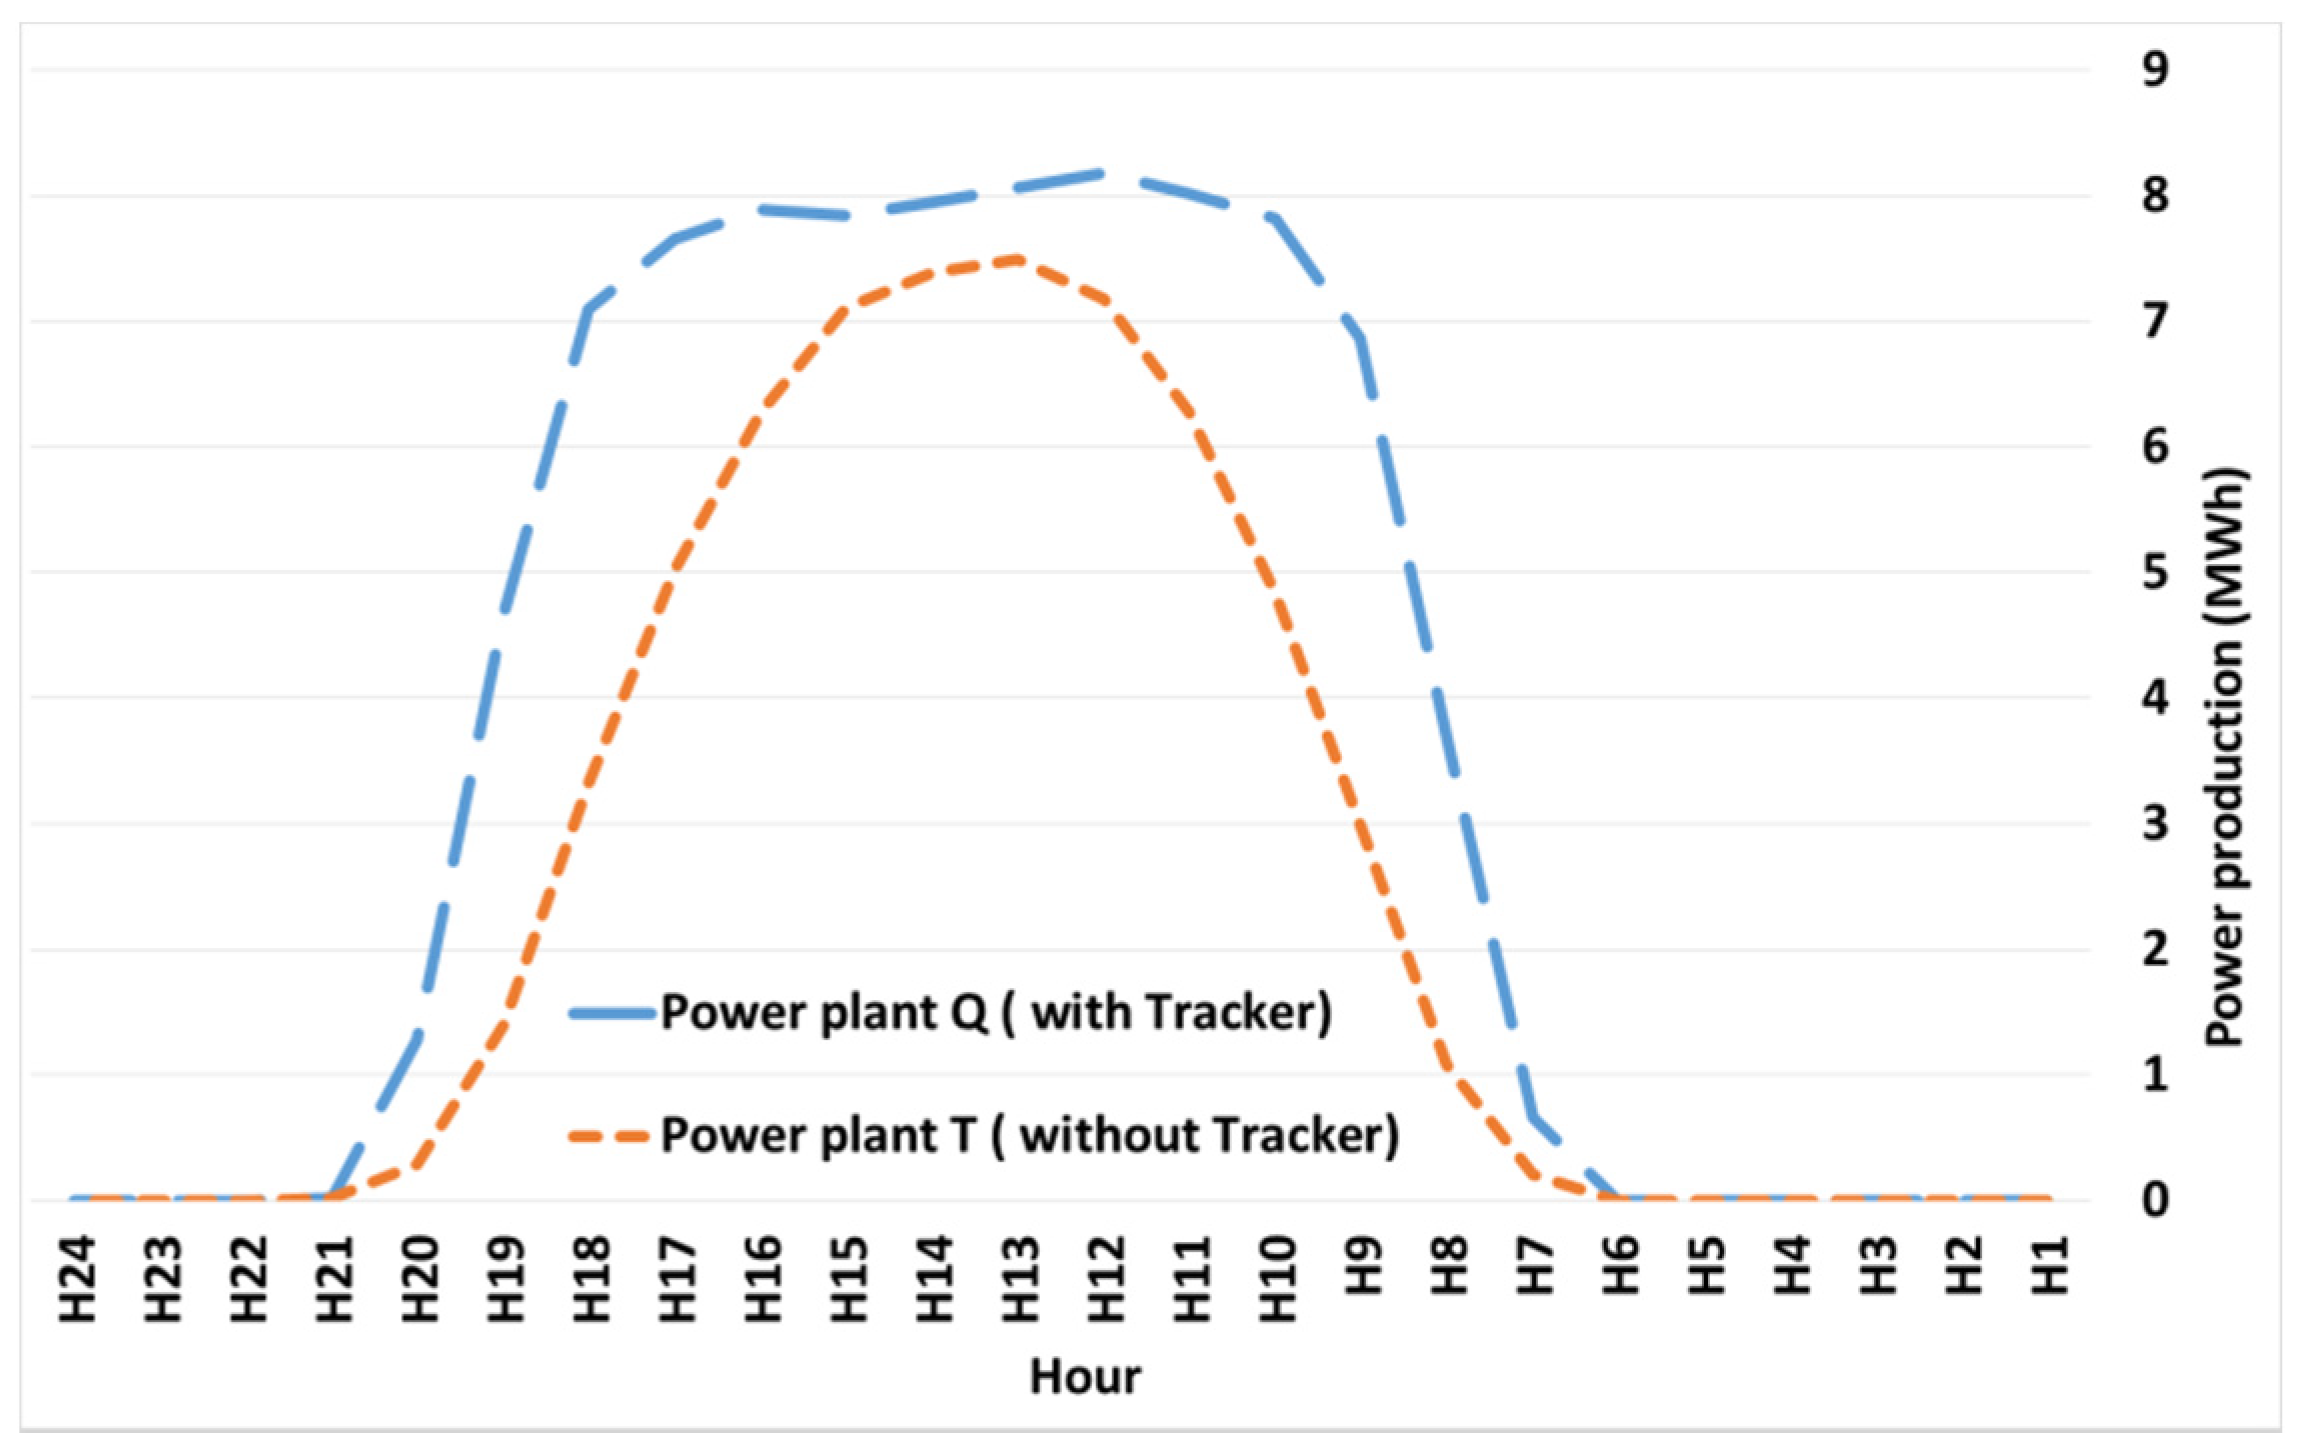
After choosing the right day for comparison, the production curves of these two power plants were compared. As
Figure 3 suggests, the production in the Q power plant with an east-west tracker started earlier with more intensity. At sunset, the production ended later and continued with greater intensity until the full evening. Comparing the total daily energy production (the area under the curve) of the two power plants on 22 June 2020 showed that the production of the power plant with the tracker was nearly 44% higher, although the power plant without the tracker is almost a year older. Considering that the geographical location, age and type of equipment used in the two power plants are different, the above comparison cannot be completely accurate. At noon, when the sun is at the highest angle, the T power plant, if installed with a suitable angle towards the south, should have higher production than the Q power plant. However, due to the structure of this power plant, it does not have an angle to the south. From a scientific point of view, with the same geographical location and equipment, the maximum point of production in power plants without trackers should be slightly higher than those with east-west trackers, which do not have a suitable angle to the south. Accordingly, in the diagram below, nearly 10% was added to the production of the power plant without a tracker to compensate for the issues such as the older life of the power plant, the equipment used in it, and the higher latitude.
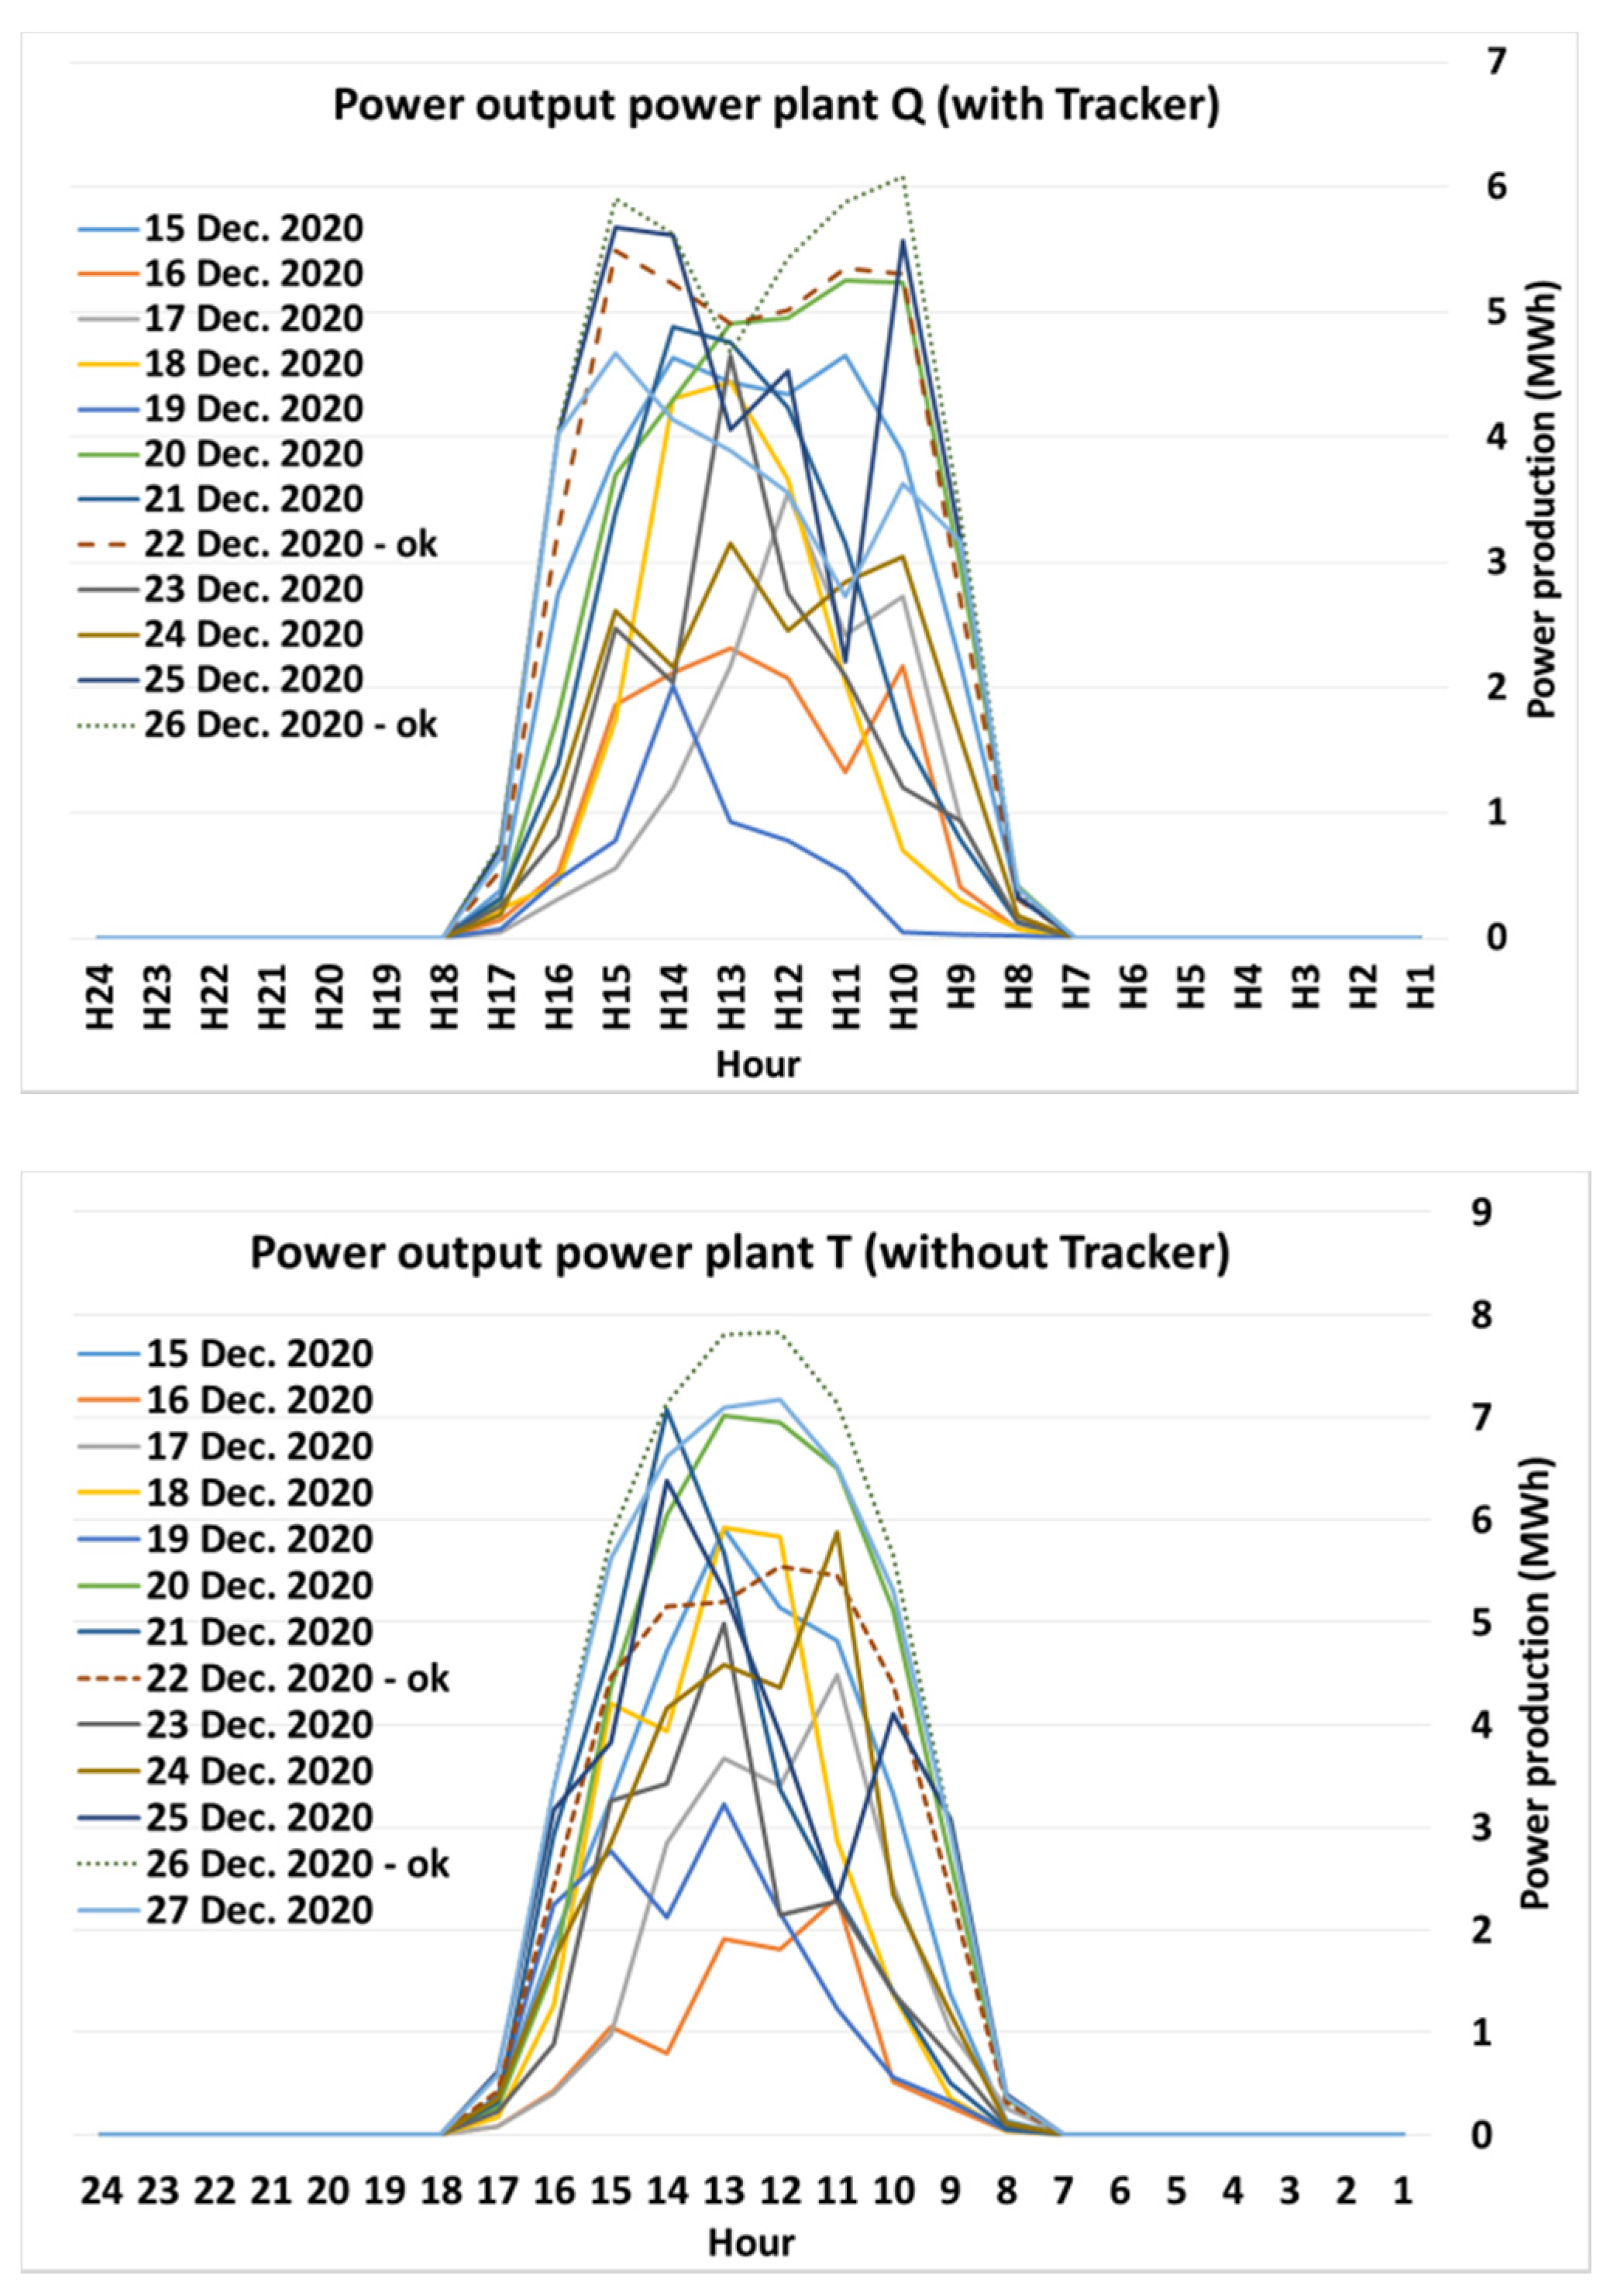
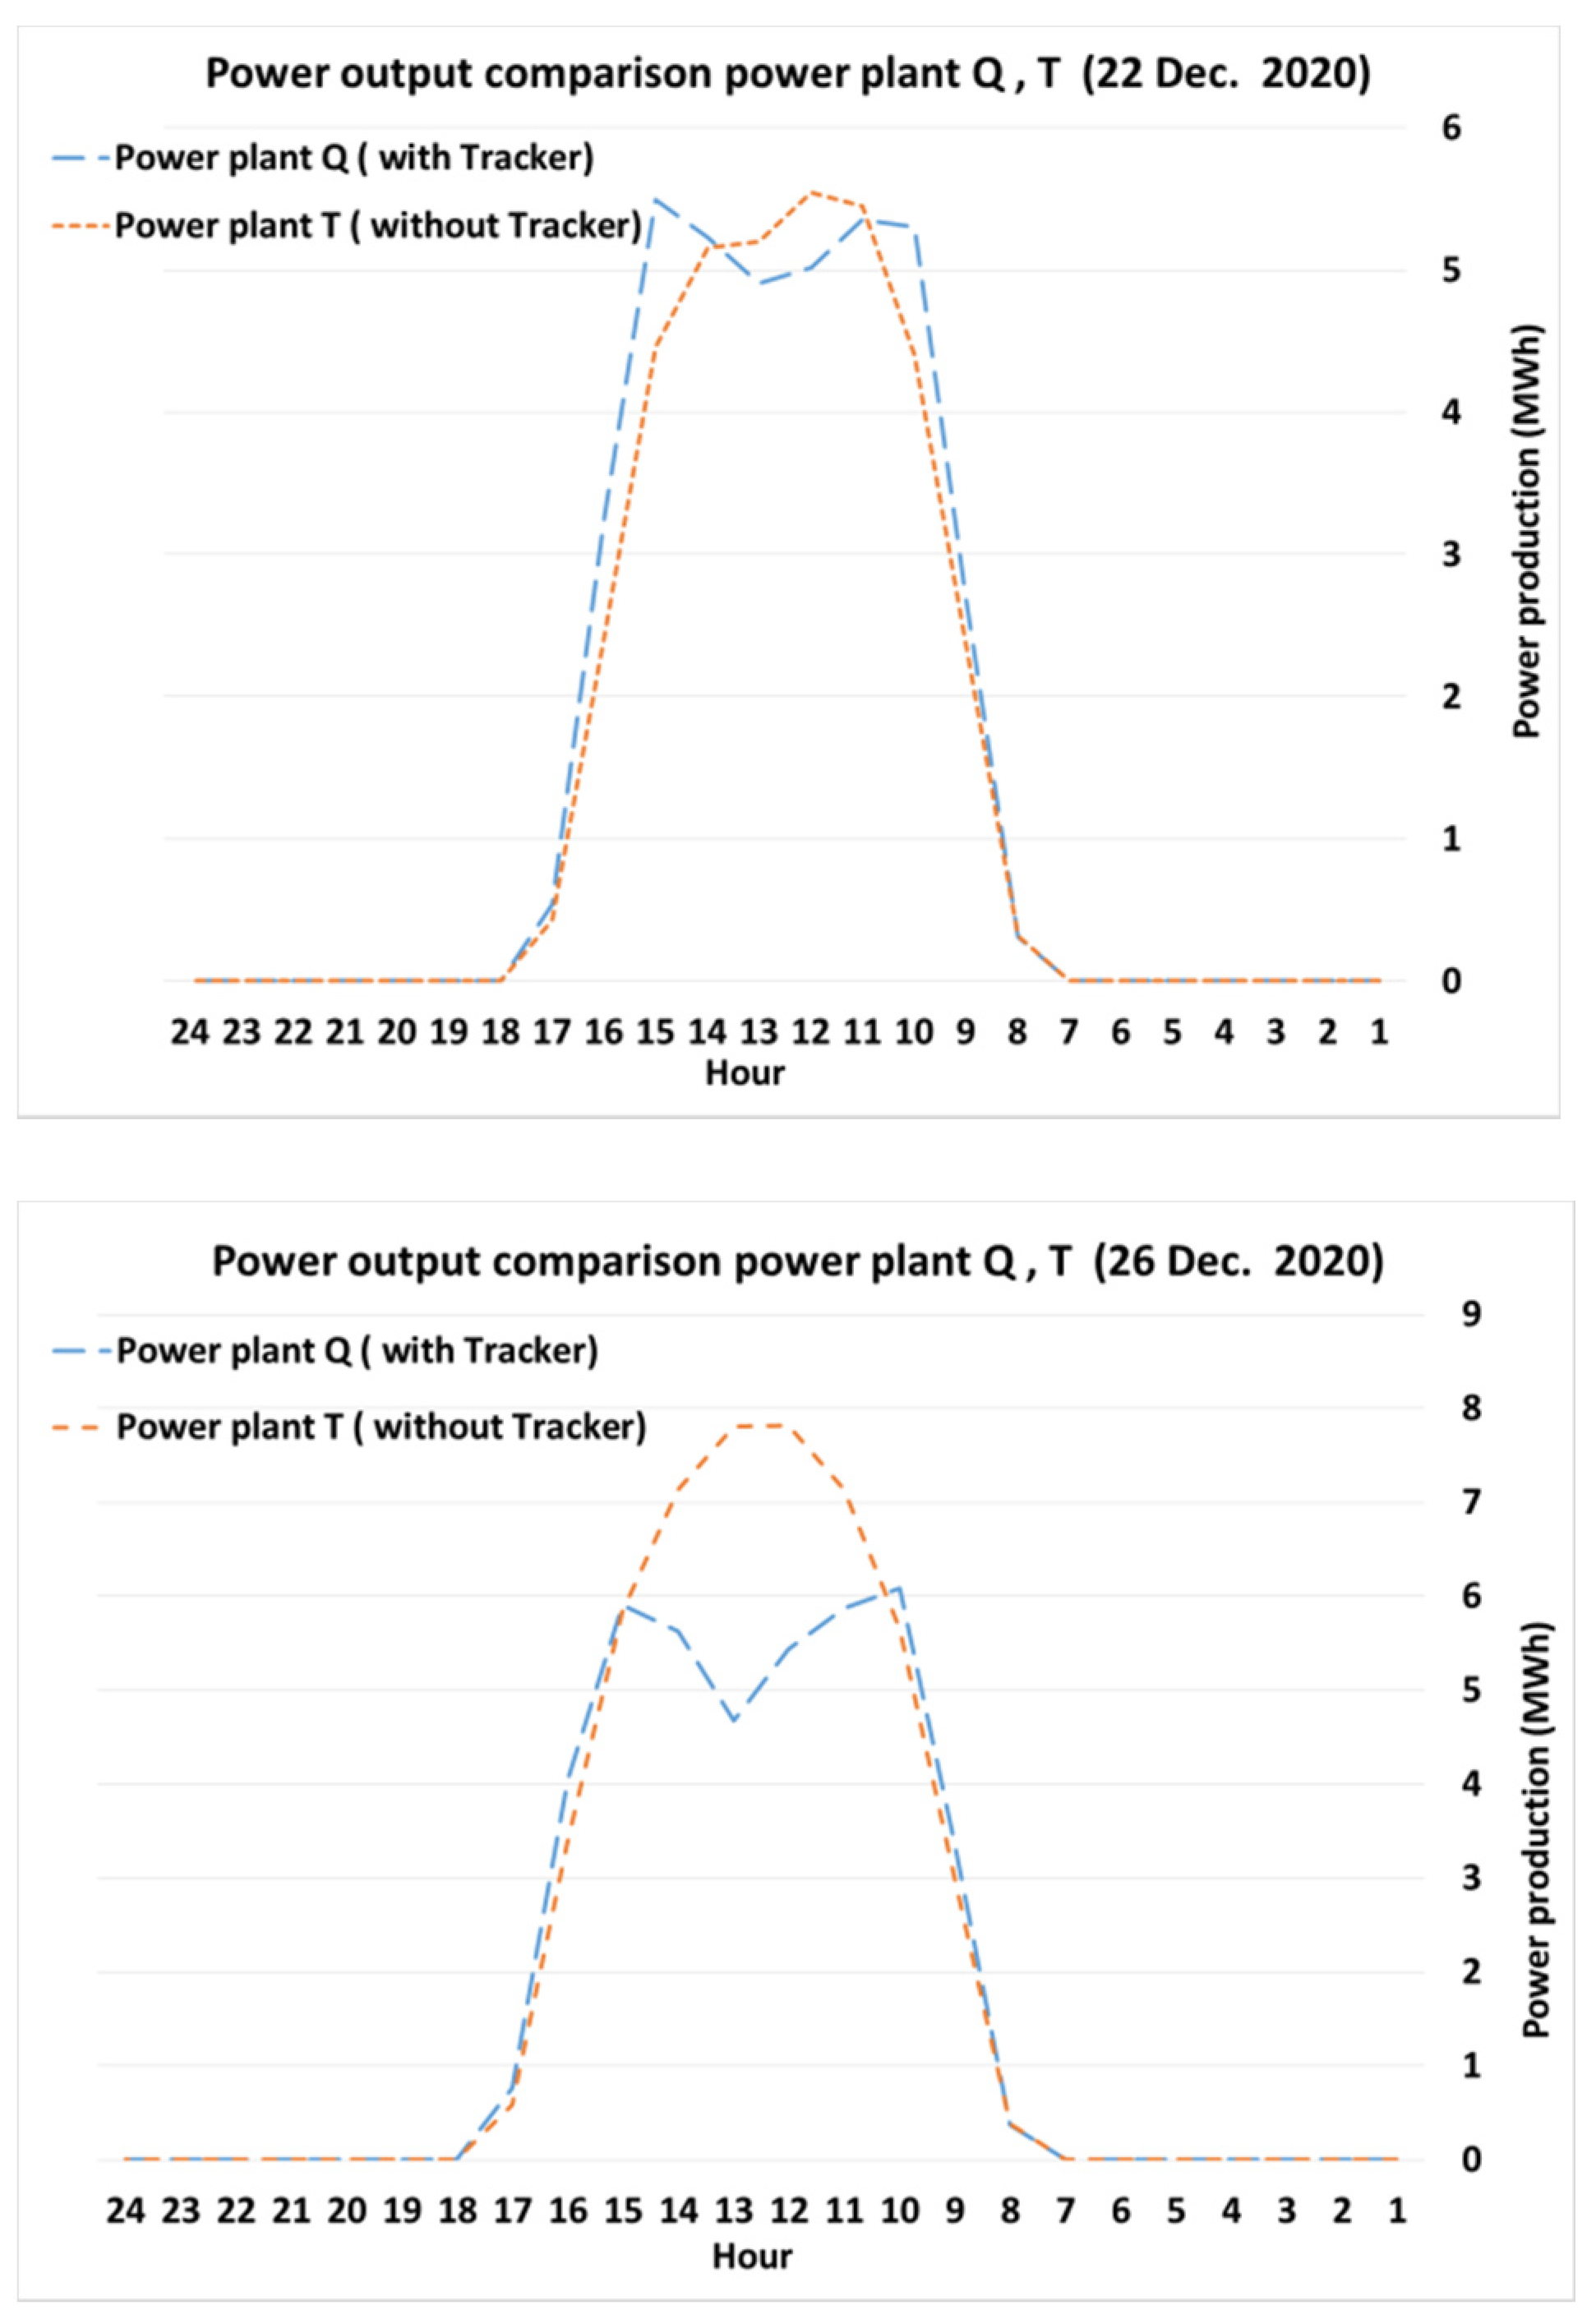
The above steps were repeated to find the suitable production day from 15 to 27 December 2020, and compare the performance of the two power plants when the sun has the lowest height on the horizon at noon.
According to the conditions observed in the
Figure 4, 22 December and 26 December were considered for comparison, as shown in
Figure 5.
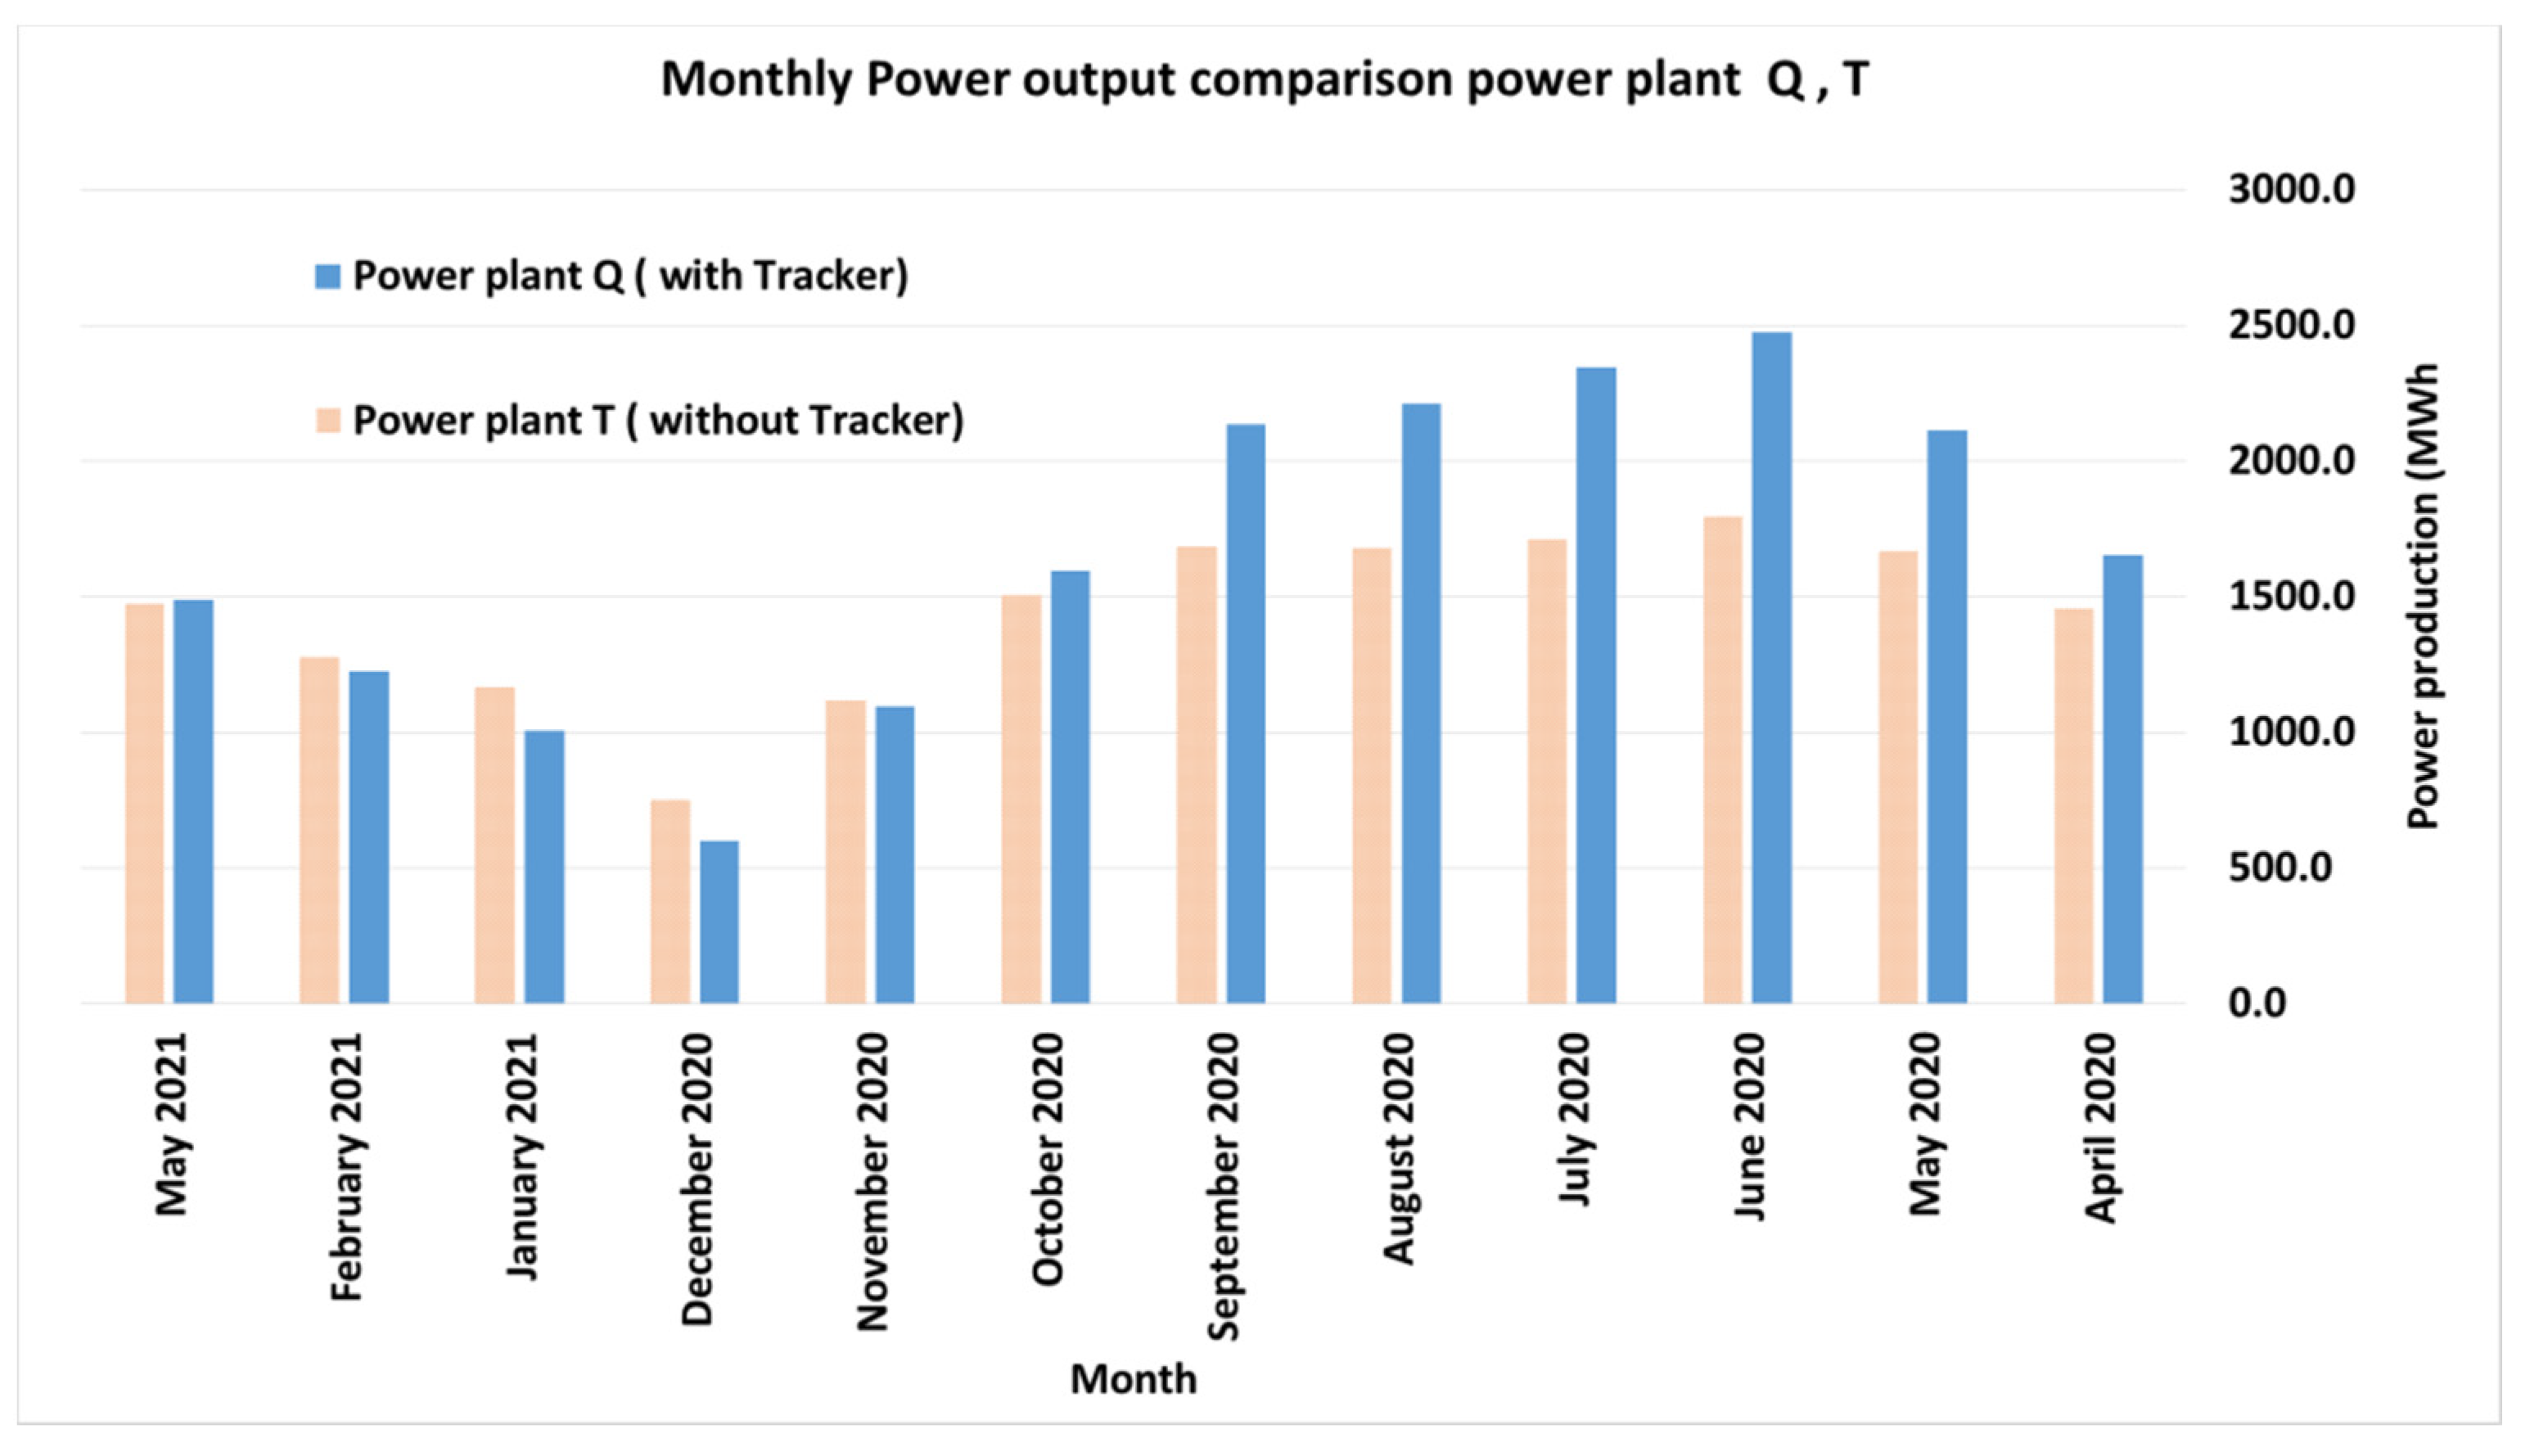
As evident from the graphs, the east-west solar trackers installed in the Q power plant do not have much positive effect in winter and even have a negative impact in some cases. For example, on 22 December 2020, the tracker caused a 6% increase in daily production, while on 26 December 2020, the power plant’s production decreased by 15%. For more accurate analysis, the total monthly production of these two power plants is shown in
Figure 6.
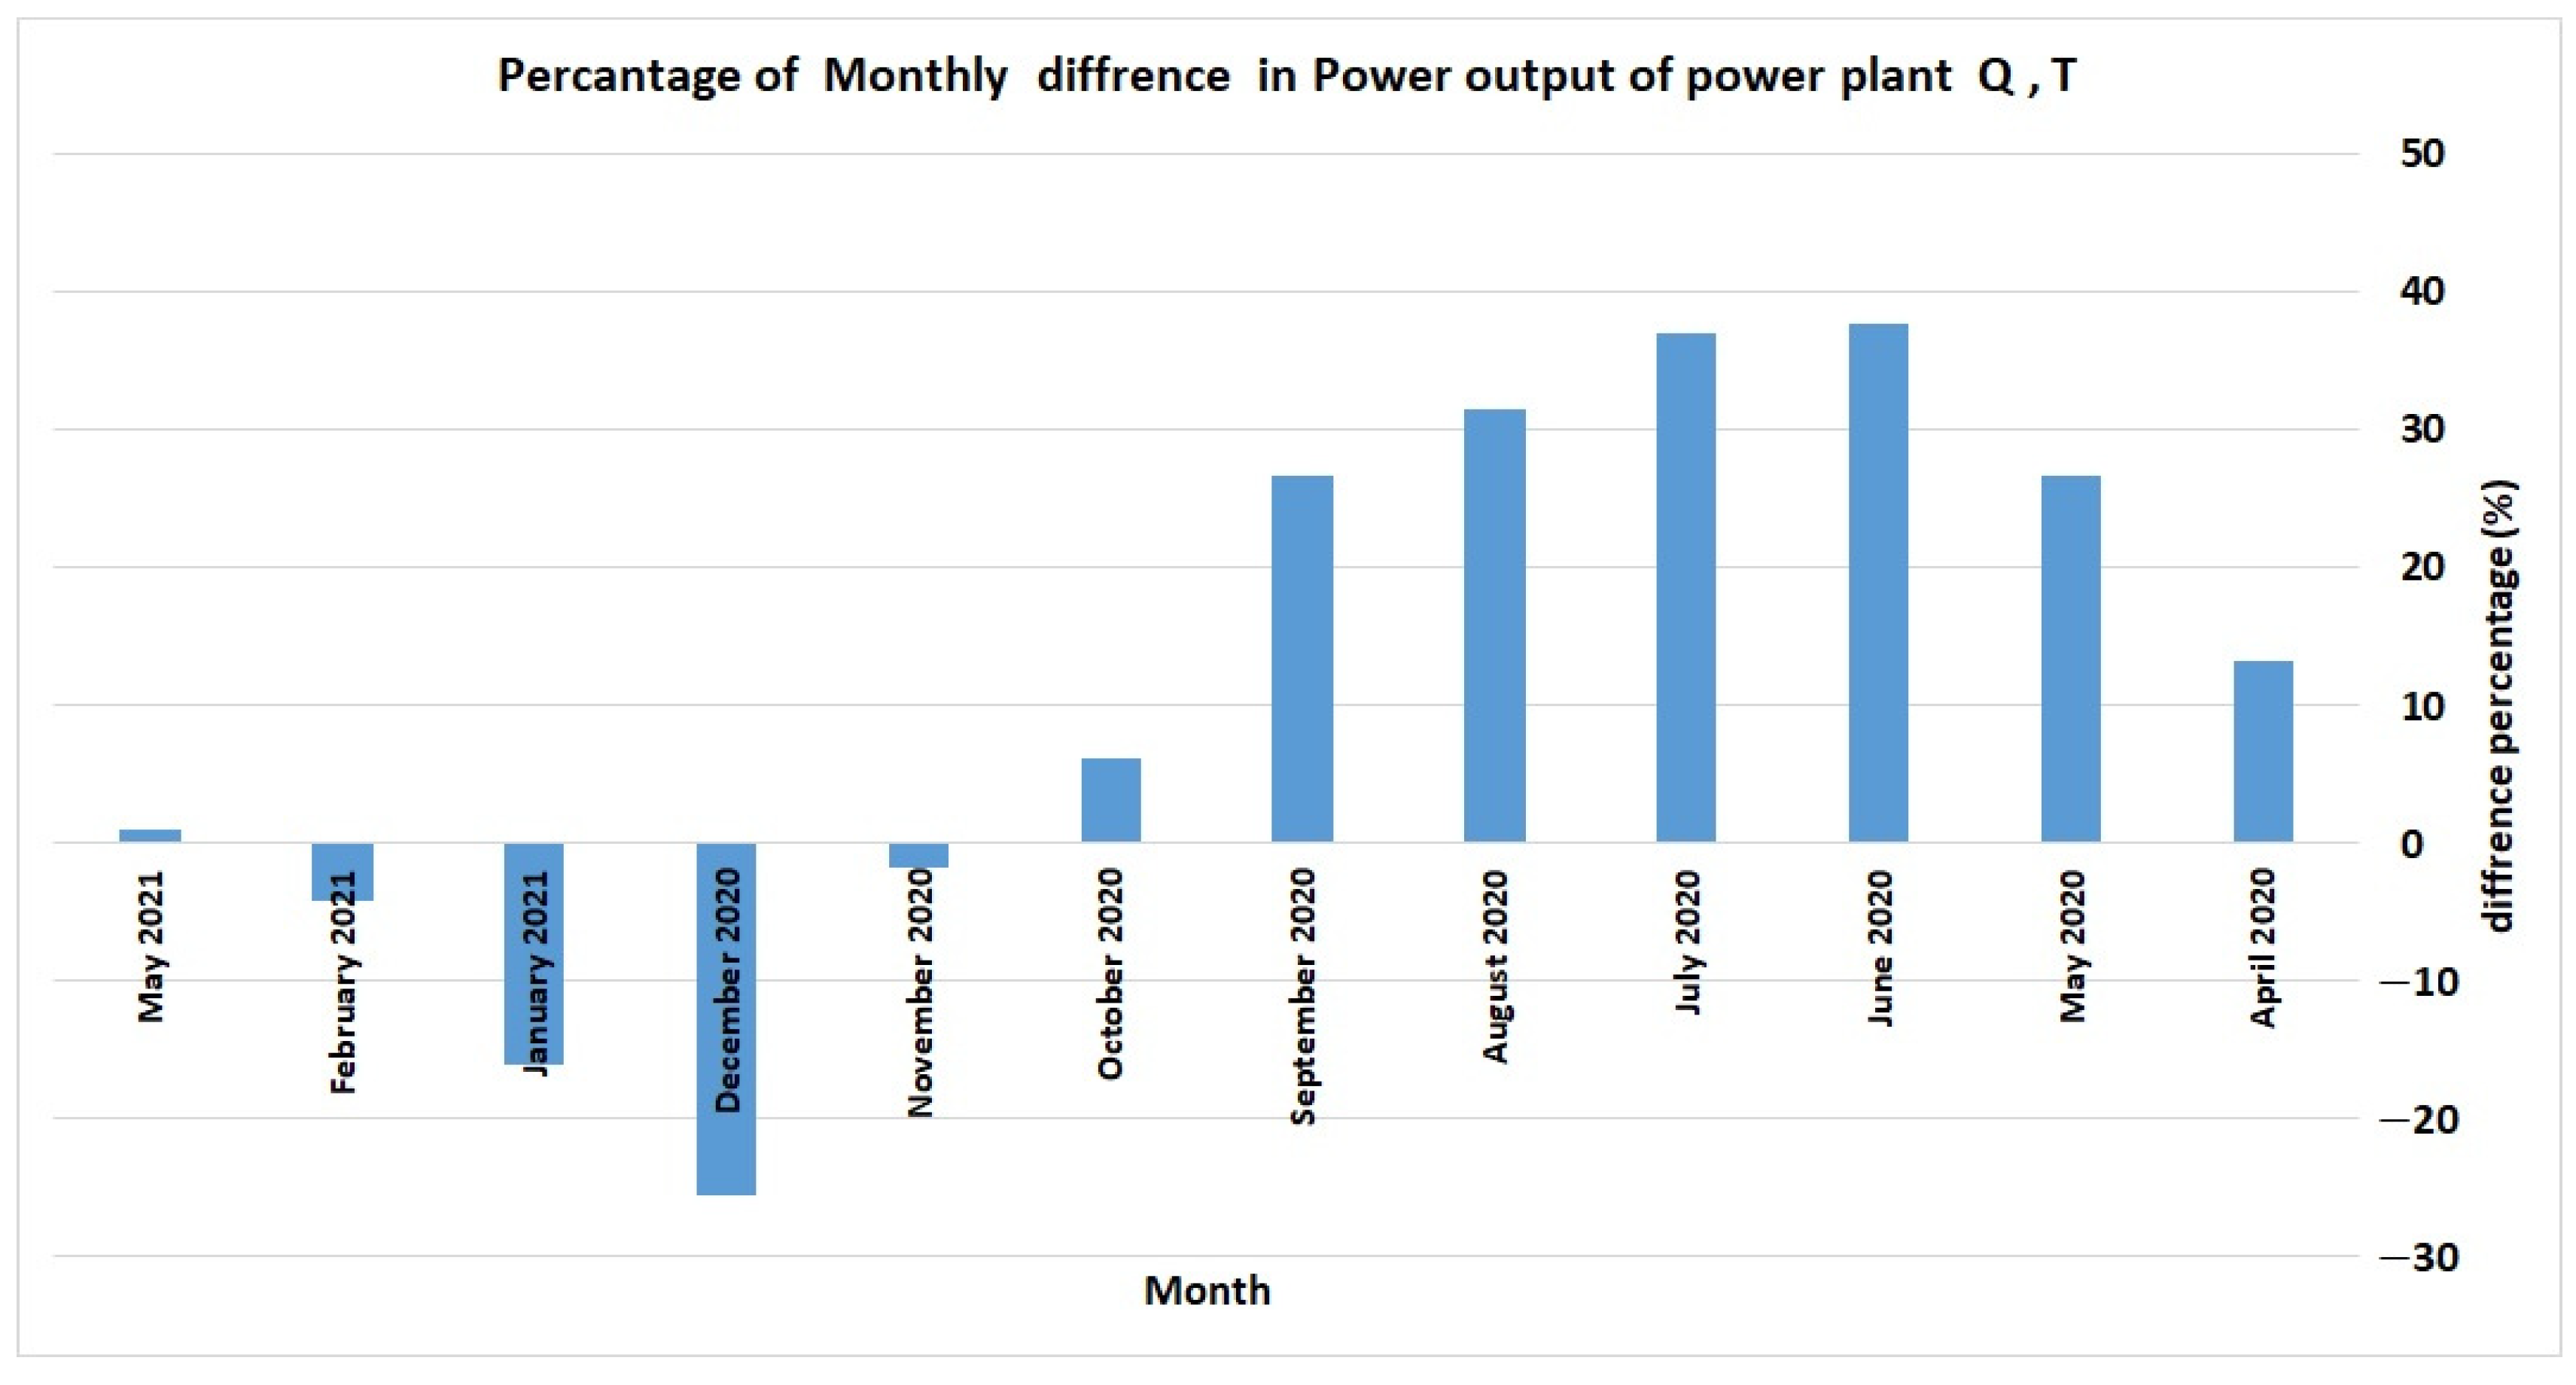
Based on the total monthly production data, the power plant with a tracker had higher production in 8 months of the year (March to October) than the power plants without a tracker; however, from November to February, the production started to decrease slightly. The monthly changes are depicted in
Figure 7 for a closer look. Comparing the annual production of two power plants confirmed an increase of 15% in the power plant with a tracker.
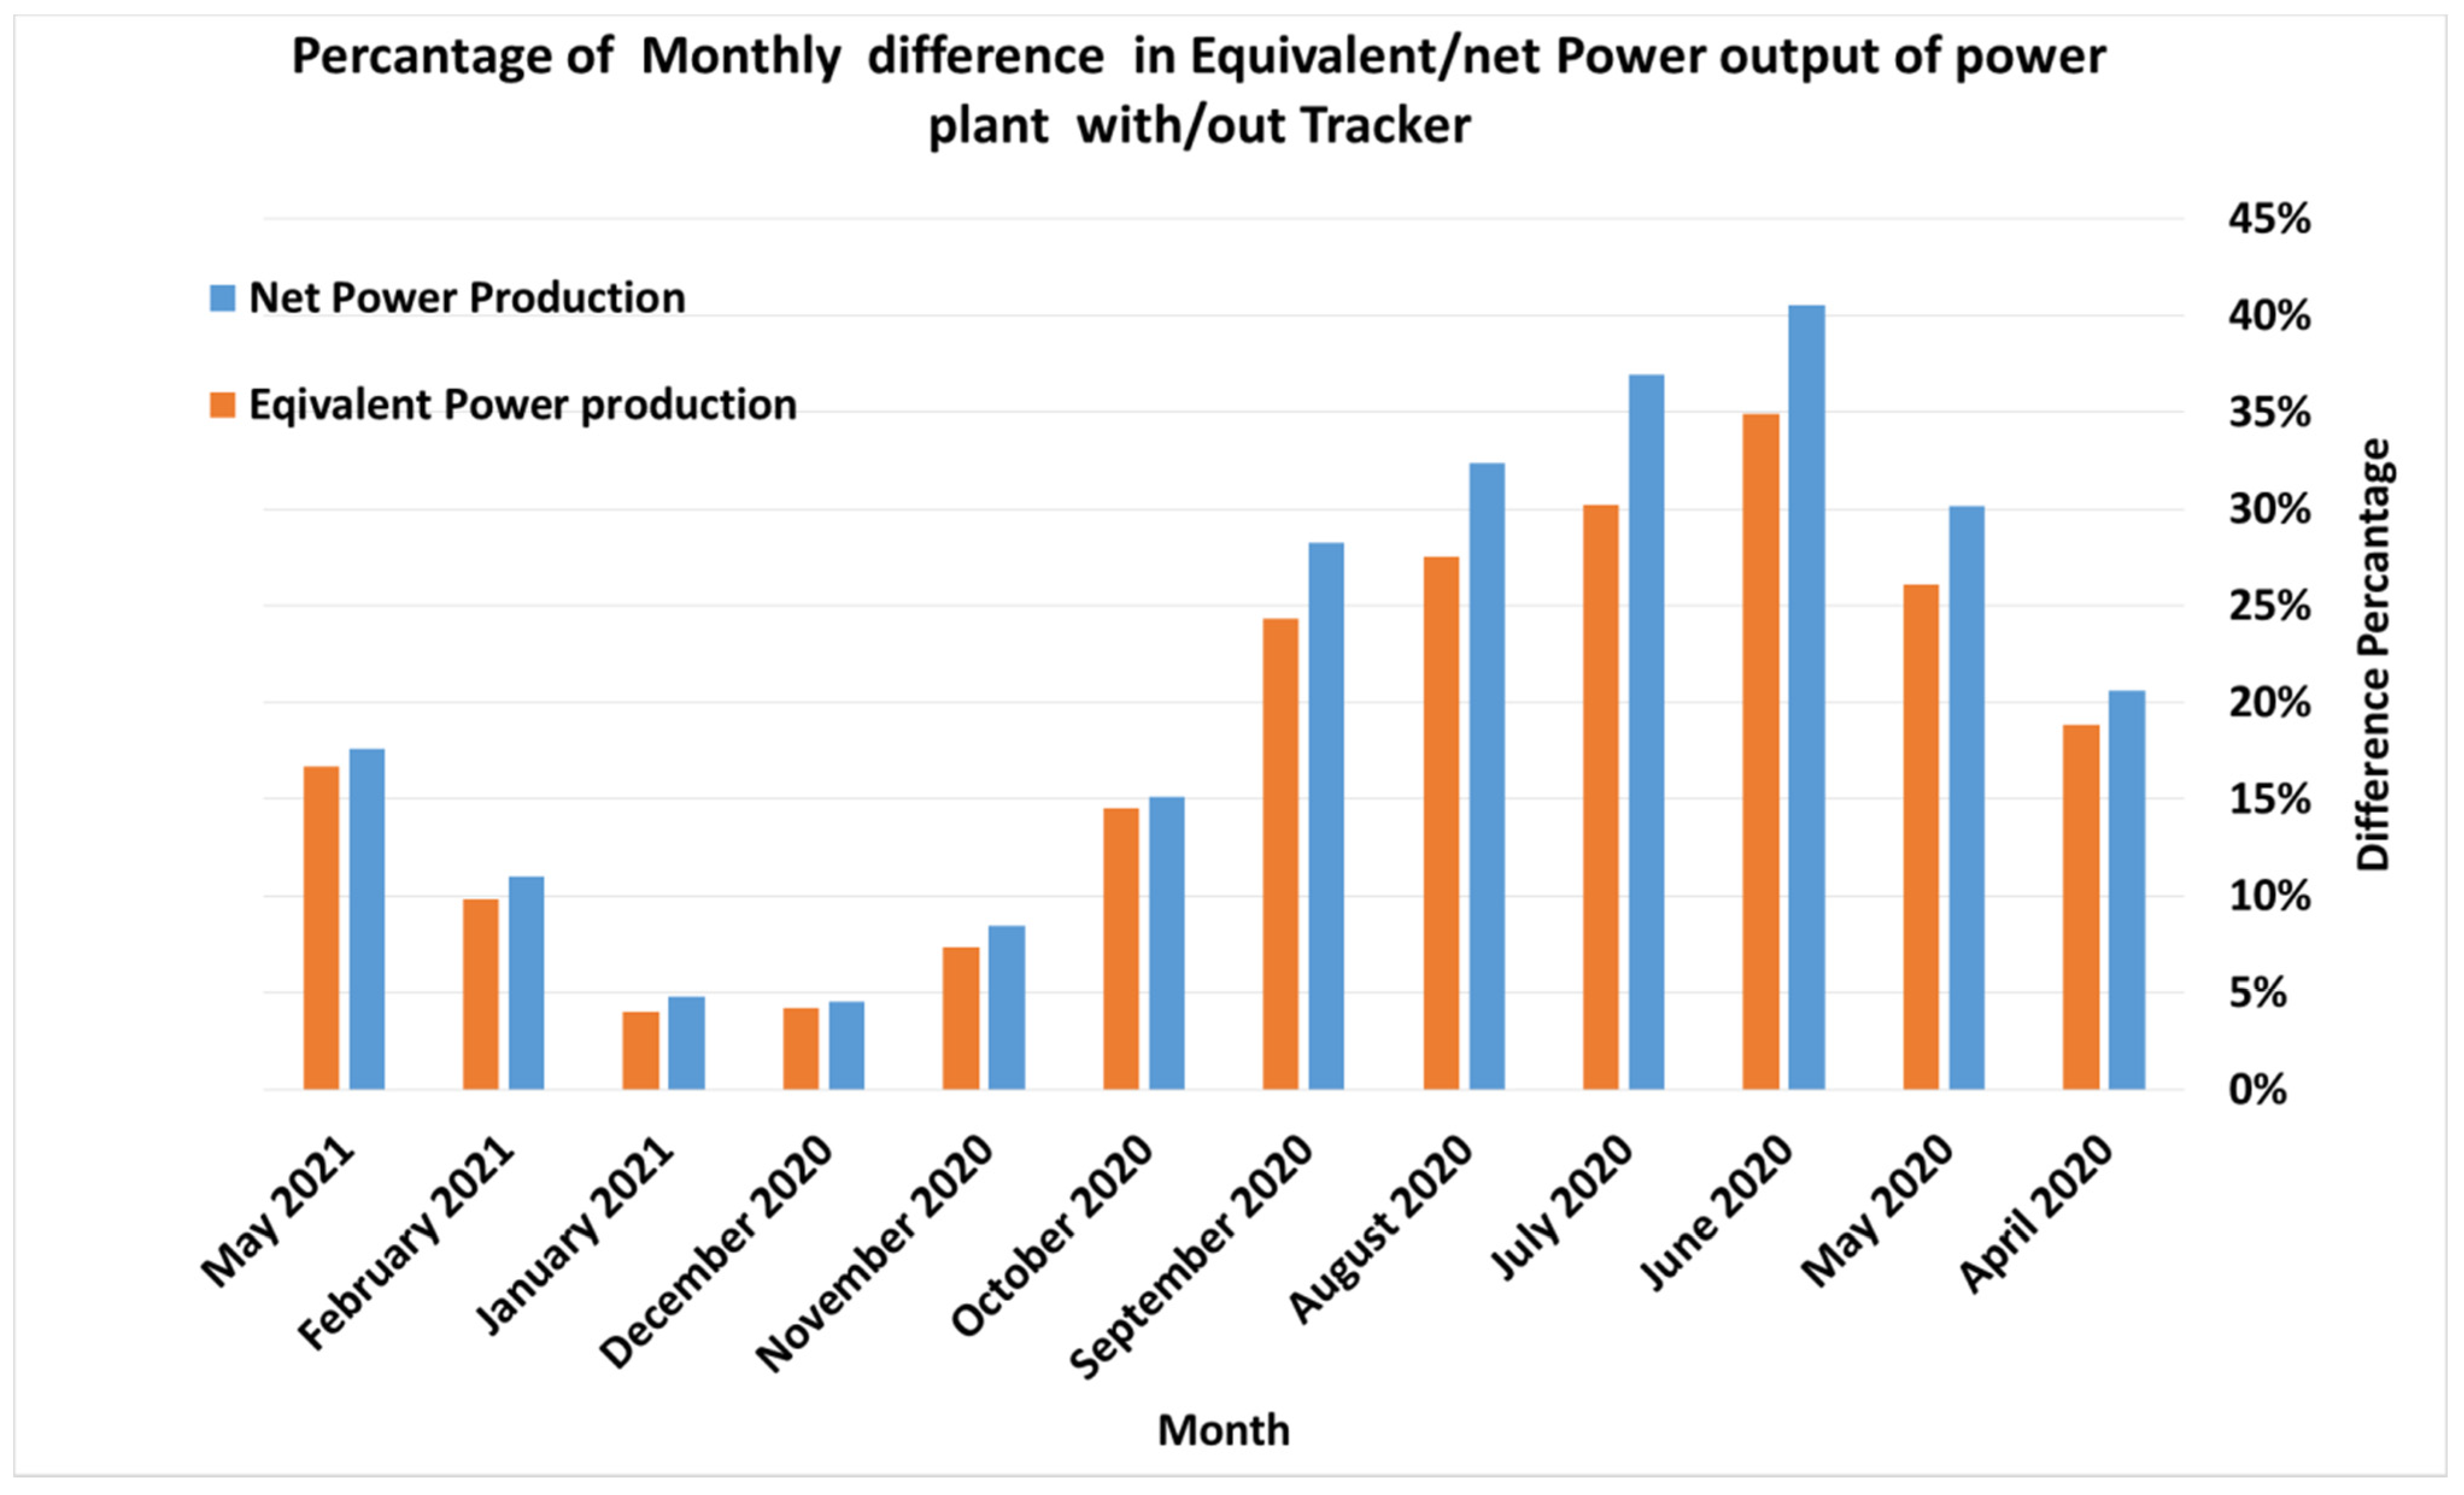
If the hourly production of the power plant is multiplied by the hourly coefficients (H) desired by the Iran Grid Management Company (IGMC) and the equivalent production is used for analysis, and the geographical and technical differences between the two power plants is taken into account, the annual equivalent production of the power plant with a tracker will be 21% higher. It reveals that using the equivalent production instead of the net output in power plants with trackers in this comparison will increase the income by 6% more. Power plants are usually compared using the utilization factor. The amount of energy produced was divided by the production capacity in 2020 (24 h a day and 365 days) to obtain the utilization factor of each power plant separately. Based on the available documents, to calculate the capacity credit factor of power plants, the amount of net production during the peak consumption hours (11 to 15 and 18 to 22 according to IGMC) and peak days (5 June to 6 September) is measured. Accordingly, the total production of the power plants under study in 8 determined hours and 94 reference days was divided by their full nominal capacity. As
Table 3 shows, if the geographical and technical differences are ignored, the capacity credit of the power plant with trackers will be 16.8% higher. The calculations were also done at peak hours. The results showed that the power plant with a tracker could produce electricity in the circuit with more than 73.6% of its nominal capacity during hours 11 to 15.
Considering that in the studied period, two power plants with east-west single-axis trackers (coded M and A) were put into operation in Yazd province, a comparison was made between the average performance of the 10 MW power plants with and without trackers (based on the specifications listed in the
Table 4).
Like the previous steps, the production curve of the five 10 MW power plants was plotted in June and December, when the sun is at its highest and lowest position (
Figure 8). Similar to the behavior of the power plants near Tehran, the production in the power plants with east-west trackers started earlier in June and ended later, so nearly 46% higher production energy was recorded (area under the curve). In December, the start and end times of production were almost the same, but the increase in production was much higher in the power plants with trackers. Although in the hours between 10 and 15 the power plants without trackers had higher production, the average daily production was almost equal in the power plants with and without trackers. By excluding power plant C from the calculations, which had unusual production in winter, the power plants with trackers still had nearly 10% higher production.
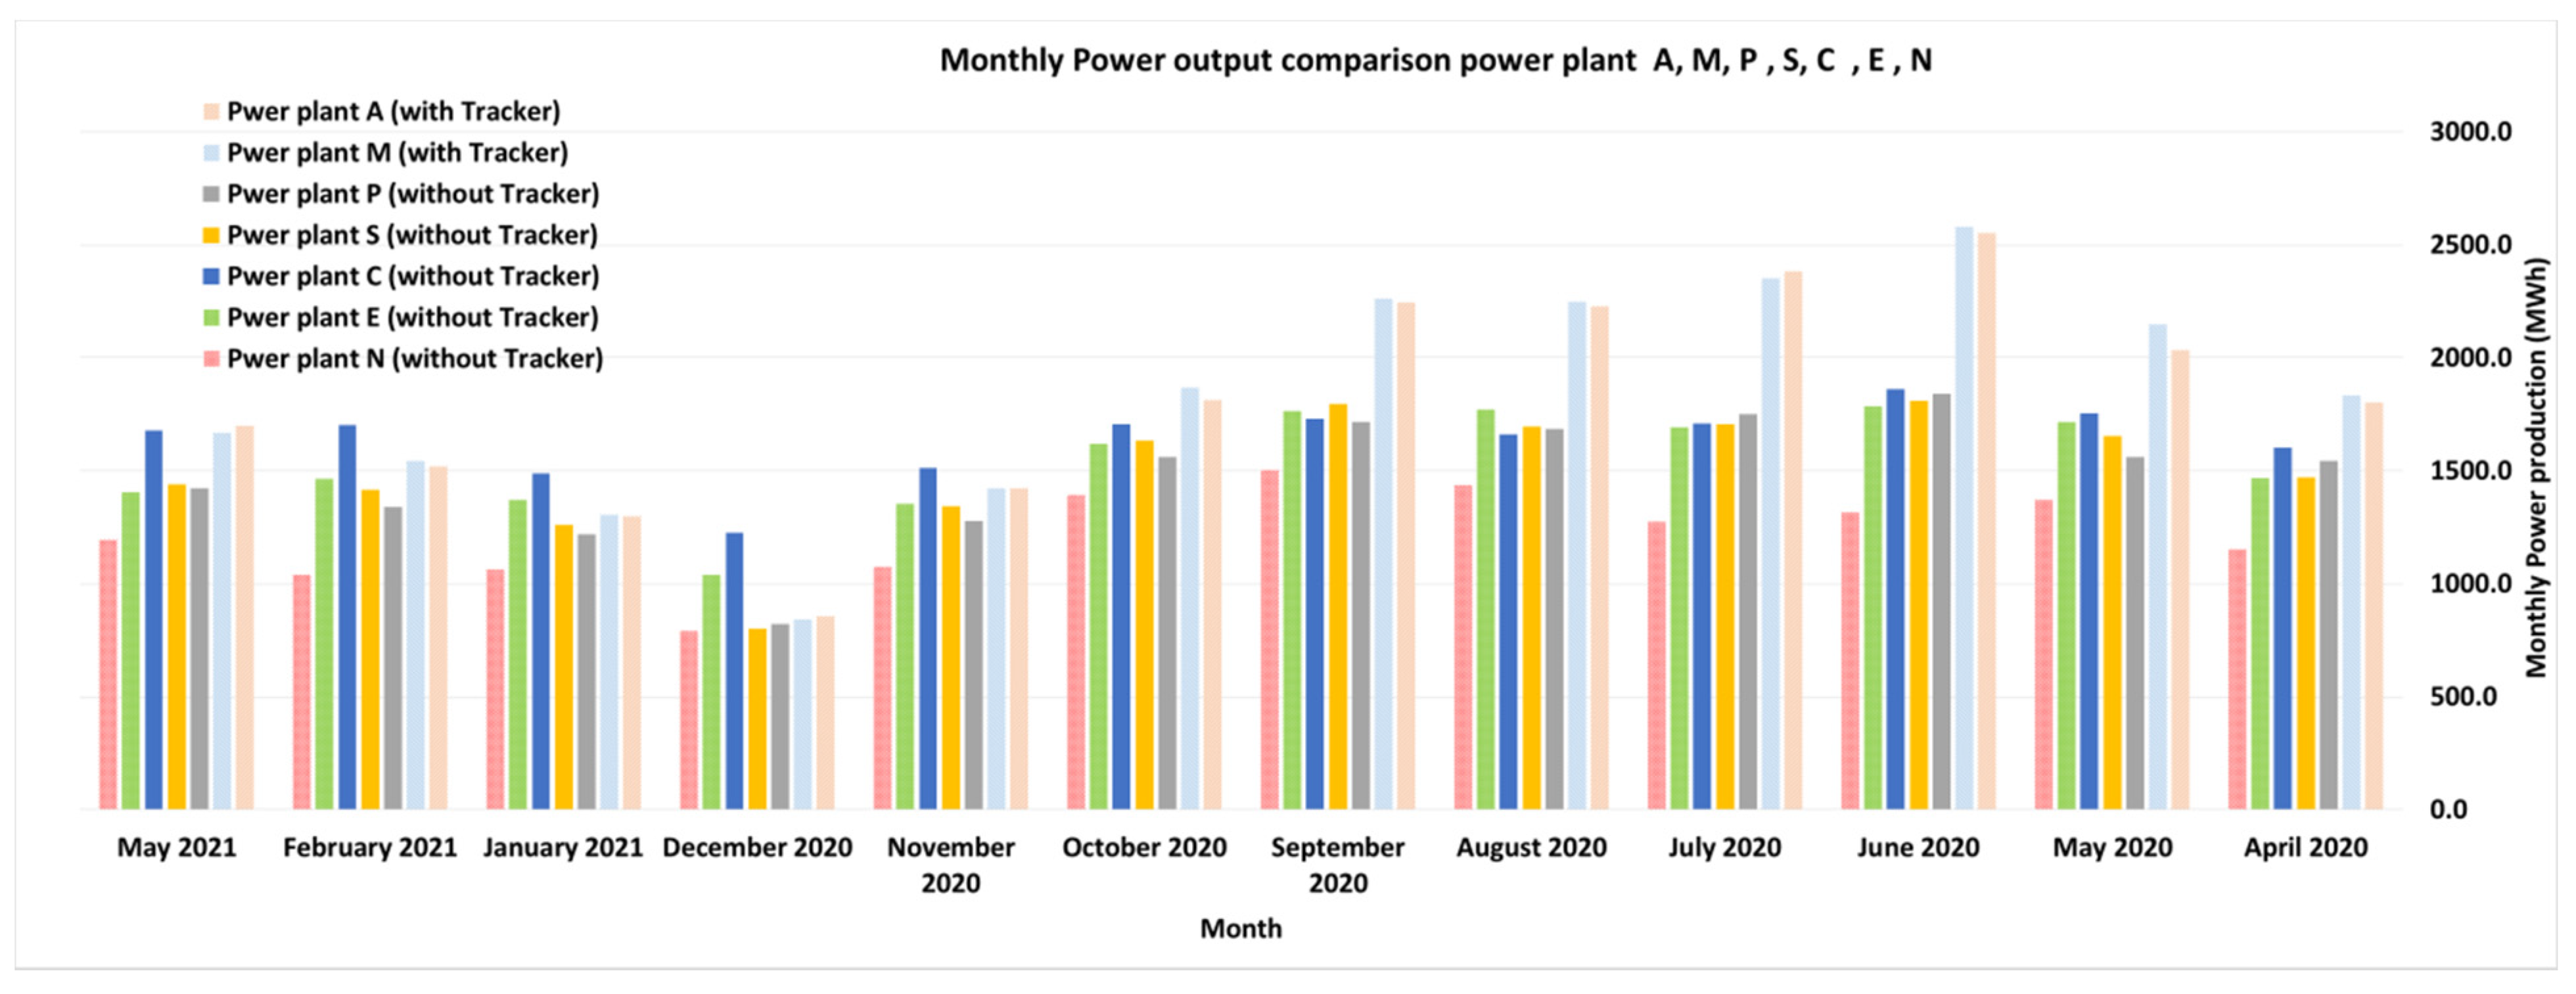
The results of examining the monthly production of the five power plants are illustrated in
Figure 9. As the Figure shows, the electricity production of the two power plants with solar trackers is higher than those without trackers from April to October. Since the production of power plant C in the cold seasons of the year was significantly different from other power plants, it was excluded from the analysis of the effect of trackers on the performance of power plants.
By excluding power plant C from the calculations and averaging the production of the two power plants with/without solar trackers, the average net production and annual equivalent production of the power plants with trackers were 23% higher (the average of the coefficients applied in 2020 was 0.9).
Figure 10 shows the percentage of changes in the monthly production of the power plants due to the use of the tracker.
Two power plants in Kerman province, located at the same latitude, altitude, and weather conditions as C power plants, were added to the investigations (
Table 5).
Figure 11 shows the similarity of the performance of one of the power plants in Kerman with power plant C in summer. In winter, however, the production of power plant C was still at the level of power plants with trackers and even much higher. For a more detailed investigation, the technical specifications and life of the equipment used in the power plant, as well as the weather conditions, especially temperature, must be carefully analyzed.
The following presents the utilization and effective capacity factors of the power plants under investigation (
Table 6). As the results show, if the geographical and technical differences are ignored, the power plant with a tracker will have a 22.8% higher utilization factor, 11.9% higher capacity credit factor and 6% more overlap with the noon peak.
The practical production of the oldest 10 MW power plant with a tracker in Isfahan province, the Jarqouye power plant, is investigated below (
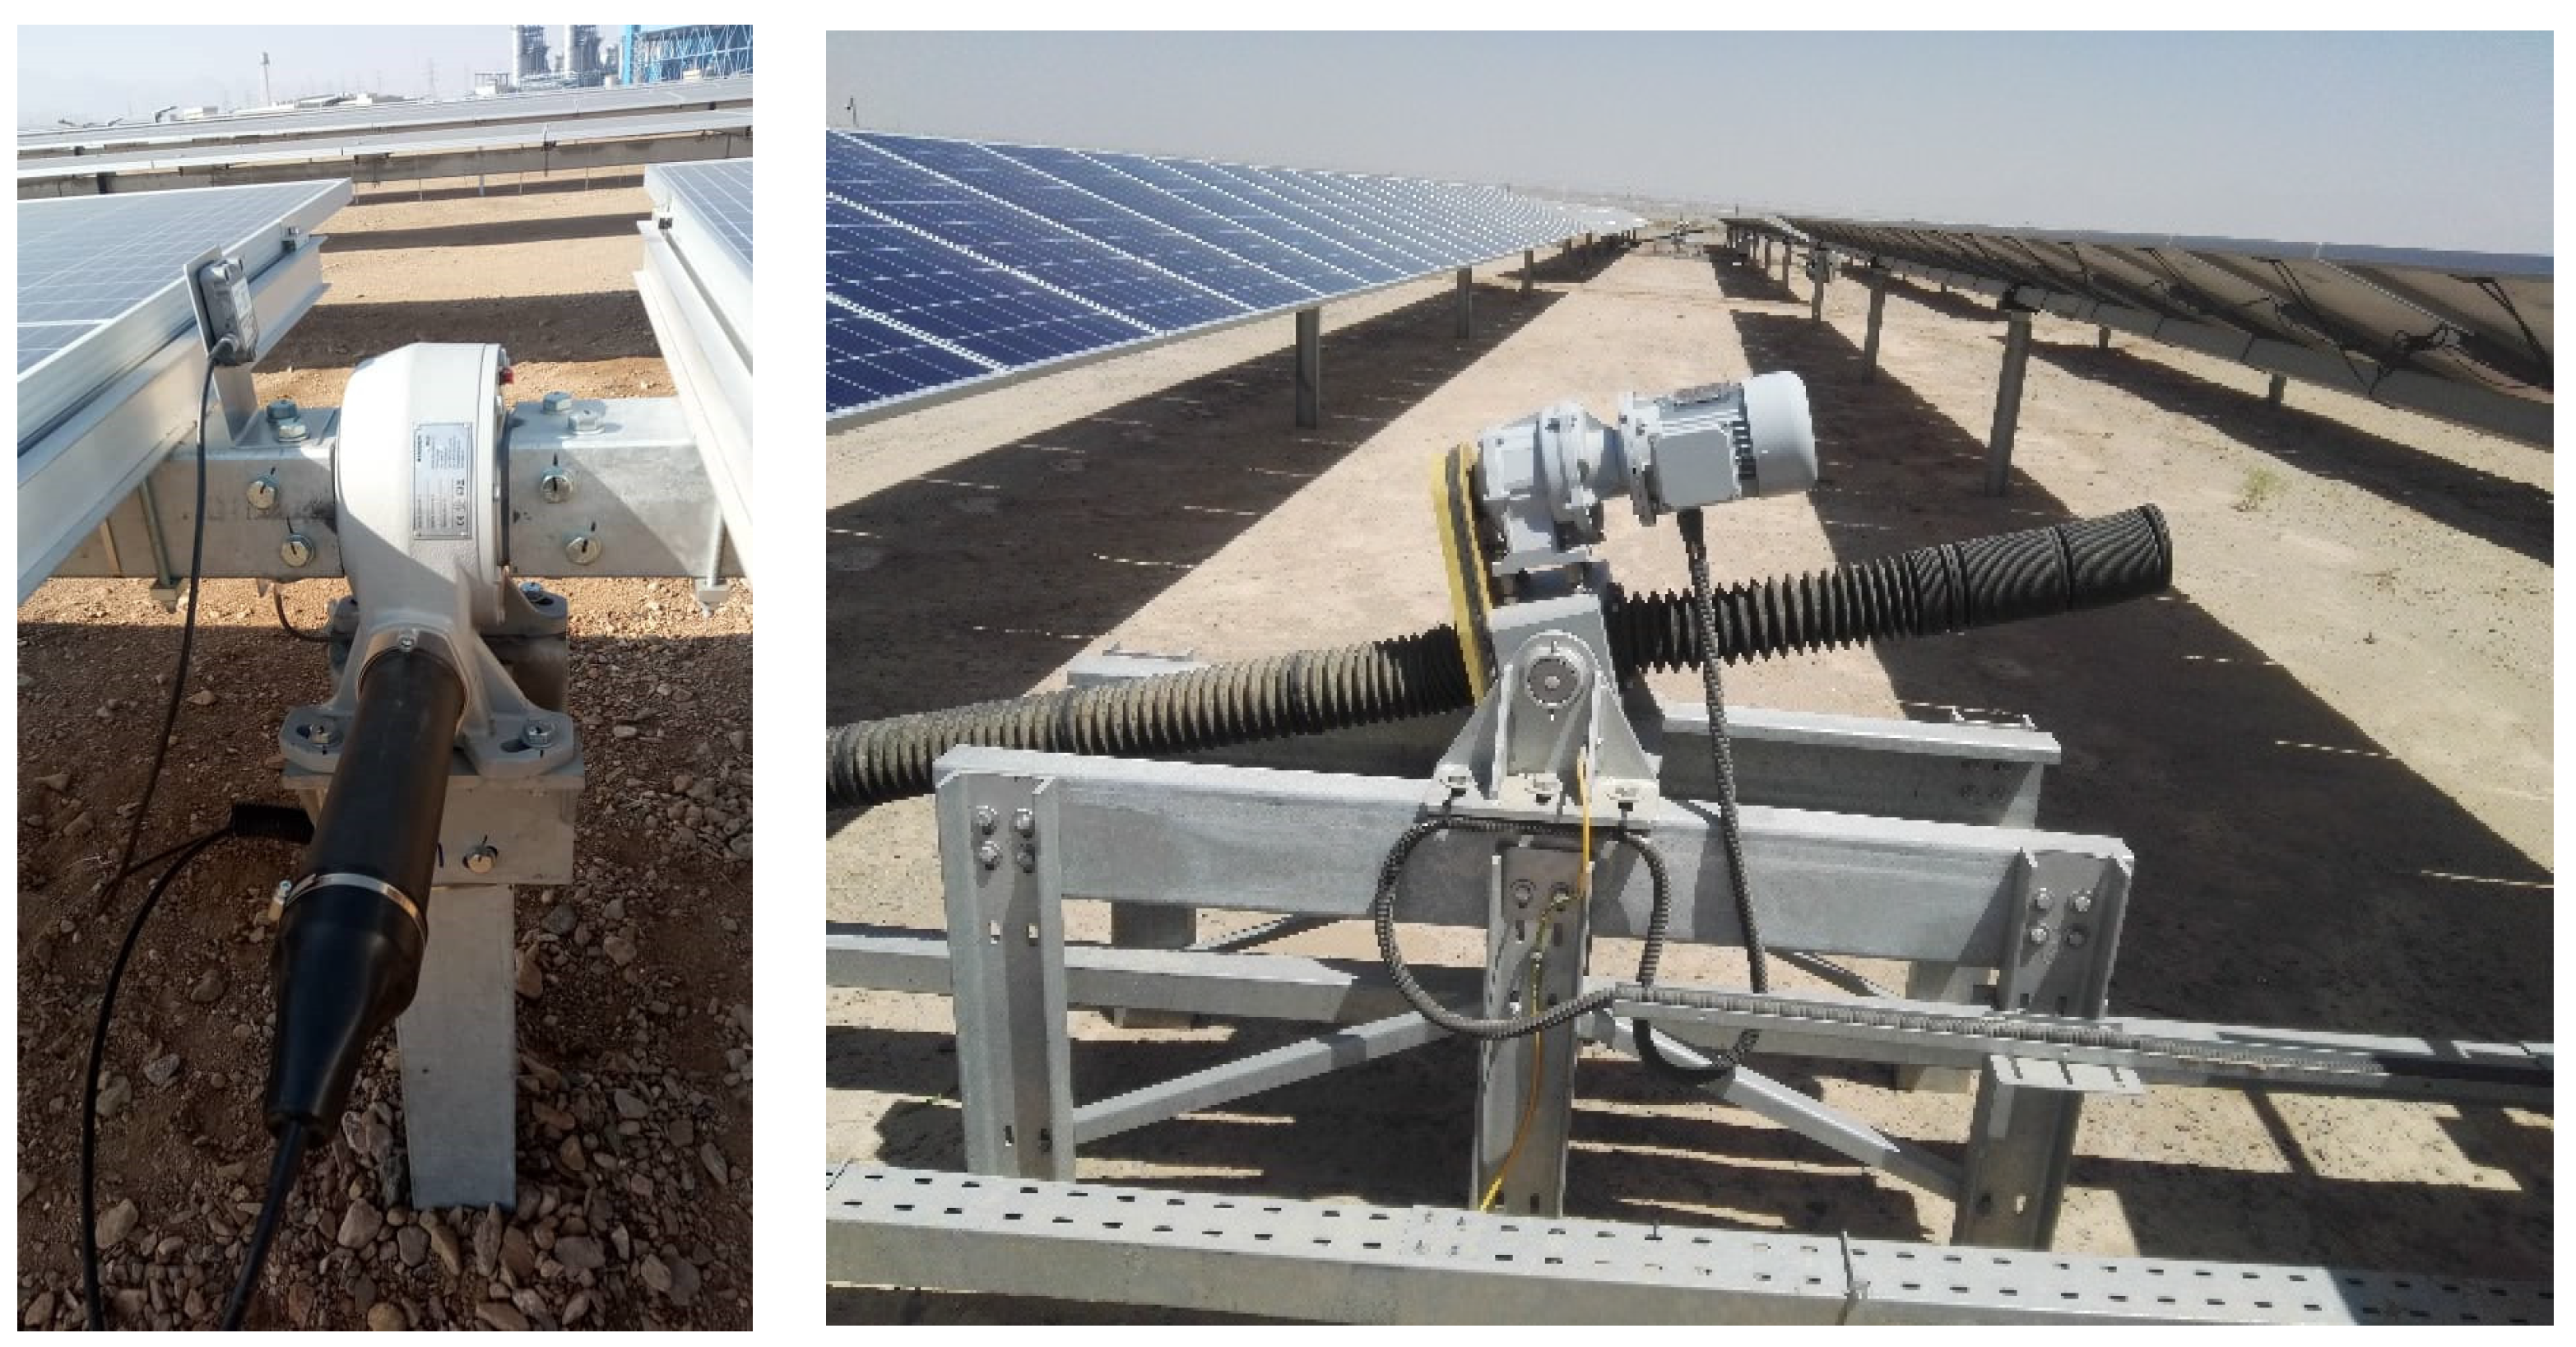
Table 7). Since there is no solar power plant with a similar capacity near this power plant, no comparison was made with fixed-base power plants. In total, in 2020, this power plant had a utilization factor of 22.6%, a capacity credit factor of 40.6% and an overlap factor with the noon peak of 73%, which is very similar to other power plants with trackers in the country. Pictures of the placement of the panels and the solar tracking system in the previously mentioned power plants are also shown in
Figure 12.
3. Software Assessment of Energy Production in Tracking Power Plants
After the general evaluation of the power generation performance in tracking power plants, a general assessment of the power generation efficiency in fixed-base, biaxial and seasonally rotating east-west and north-south tracking power plants can be obtained using the available software. For this purpose, the geographic location and technical specifications of one of the 10 MW power plants in Qom province were entered into the PVsyst software. To validate the model, the predicted monthly and annual production of the power plant was compared with the actual production values in that power plant in 2020. Then, the production changes were predicted in the case of using different trackers. After investigating the weather conditions of the installation site and determining the equipment used in the design of the panels’ orientation, the power plant’s production in six different scenarios was compared according to
Table 8.
In the first case, the panels are installed permanently at 35 degrees to the south. In the second case, the rotation axis of the hinge installed in the structure is east to west, and there is the ability to adjust the angle of the panels permanently to the south in two seasonal positions (20 degrees in summer and 50 degrees in winter). In the third case, the orientation of the axis is east-west, so the tilt angle can be changed from 0 to 90 degrees. The panels can track the sun from the southernmost point to the northernmost but cannot move east or west and can only detect the sun’s height in the sky. In the fourth mode, which has been used in the solar power plants installed in Iran, the panels can track the sun from the easternmost to the westernmost position, and the axis of rotation is in the north-south direction. The rotation limits are −60 to 60 degrees, and the tilt angle is 0 degrees. In the fifth mode, one of the most optimal modes for installing a single-axis power plant, the panels are installed on a north-south axis and can track the sun from its easternmost to its westernmost position. The rotation limit of 60 + 60 degrees to the west or east is also set for them, but at the same time, the tilt angle is set to the optimal value of 35 degrees. It will be possible if the rotation axis of the panel to the ground at this angle is set to the south, or for example, if the power plant is installed on a surface with a slope to the south. In the sixth state, which is also the last state, the panels can track the sun from the easternmost point to the westernmost point and from the northernmost point to the southernmost point in biaxial mode. After solving the problem in the above six cases, a complete report of daily and monthly net energy production was prepared for each scenario, which we will discuss further.
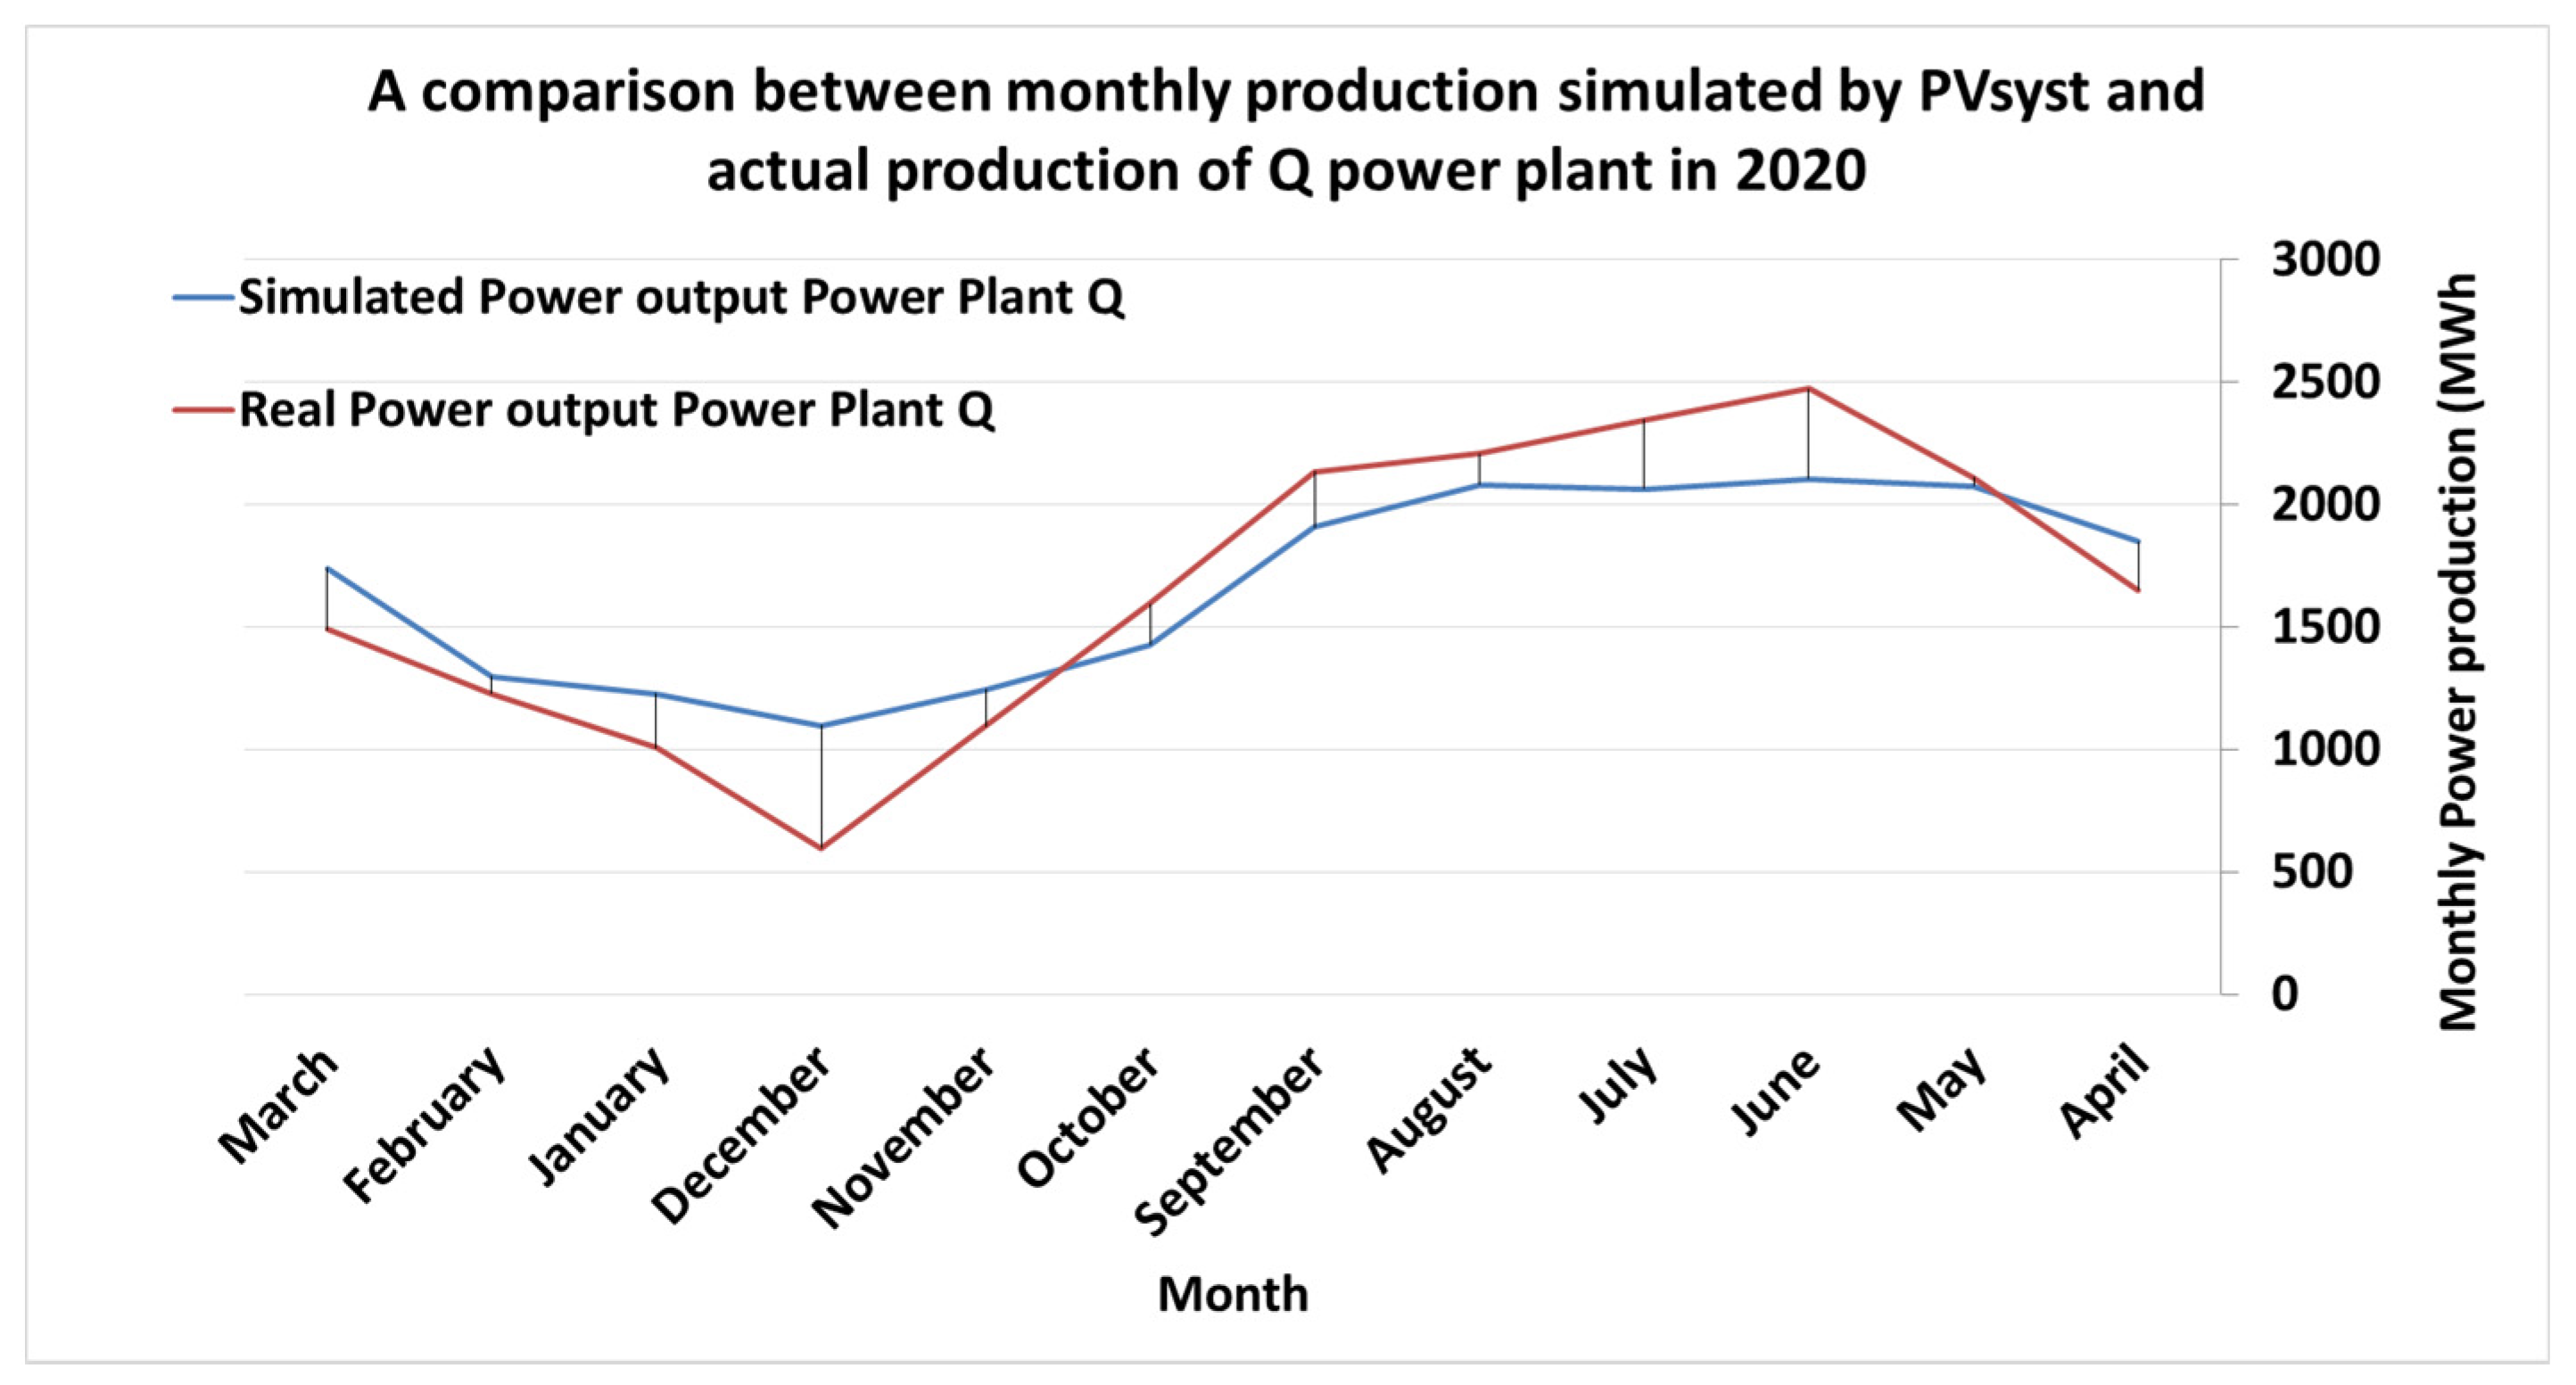
First, to verify the results, it is necessary to compare the actual production of the power plant in 2020 with the forecasts made by the PVsyst software. According to
Figure 13, this comparison was made monthly, showing that the total production of Q was nearly 1% lower than the forecasts. The production difference observed in the months of the year is mostly related to the difference in the operating conditions of the power plant.
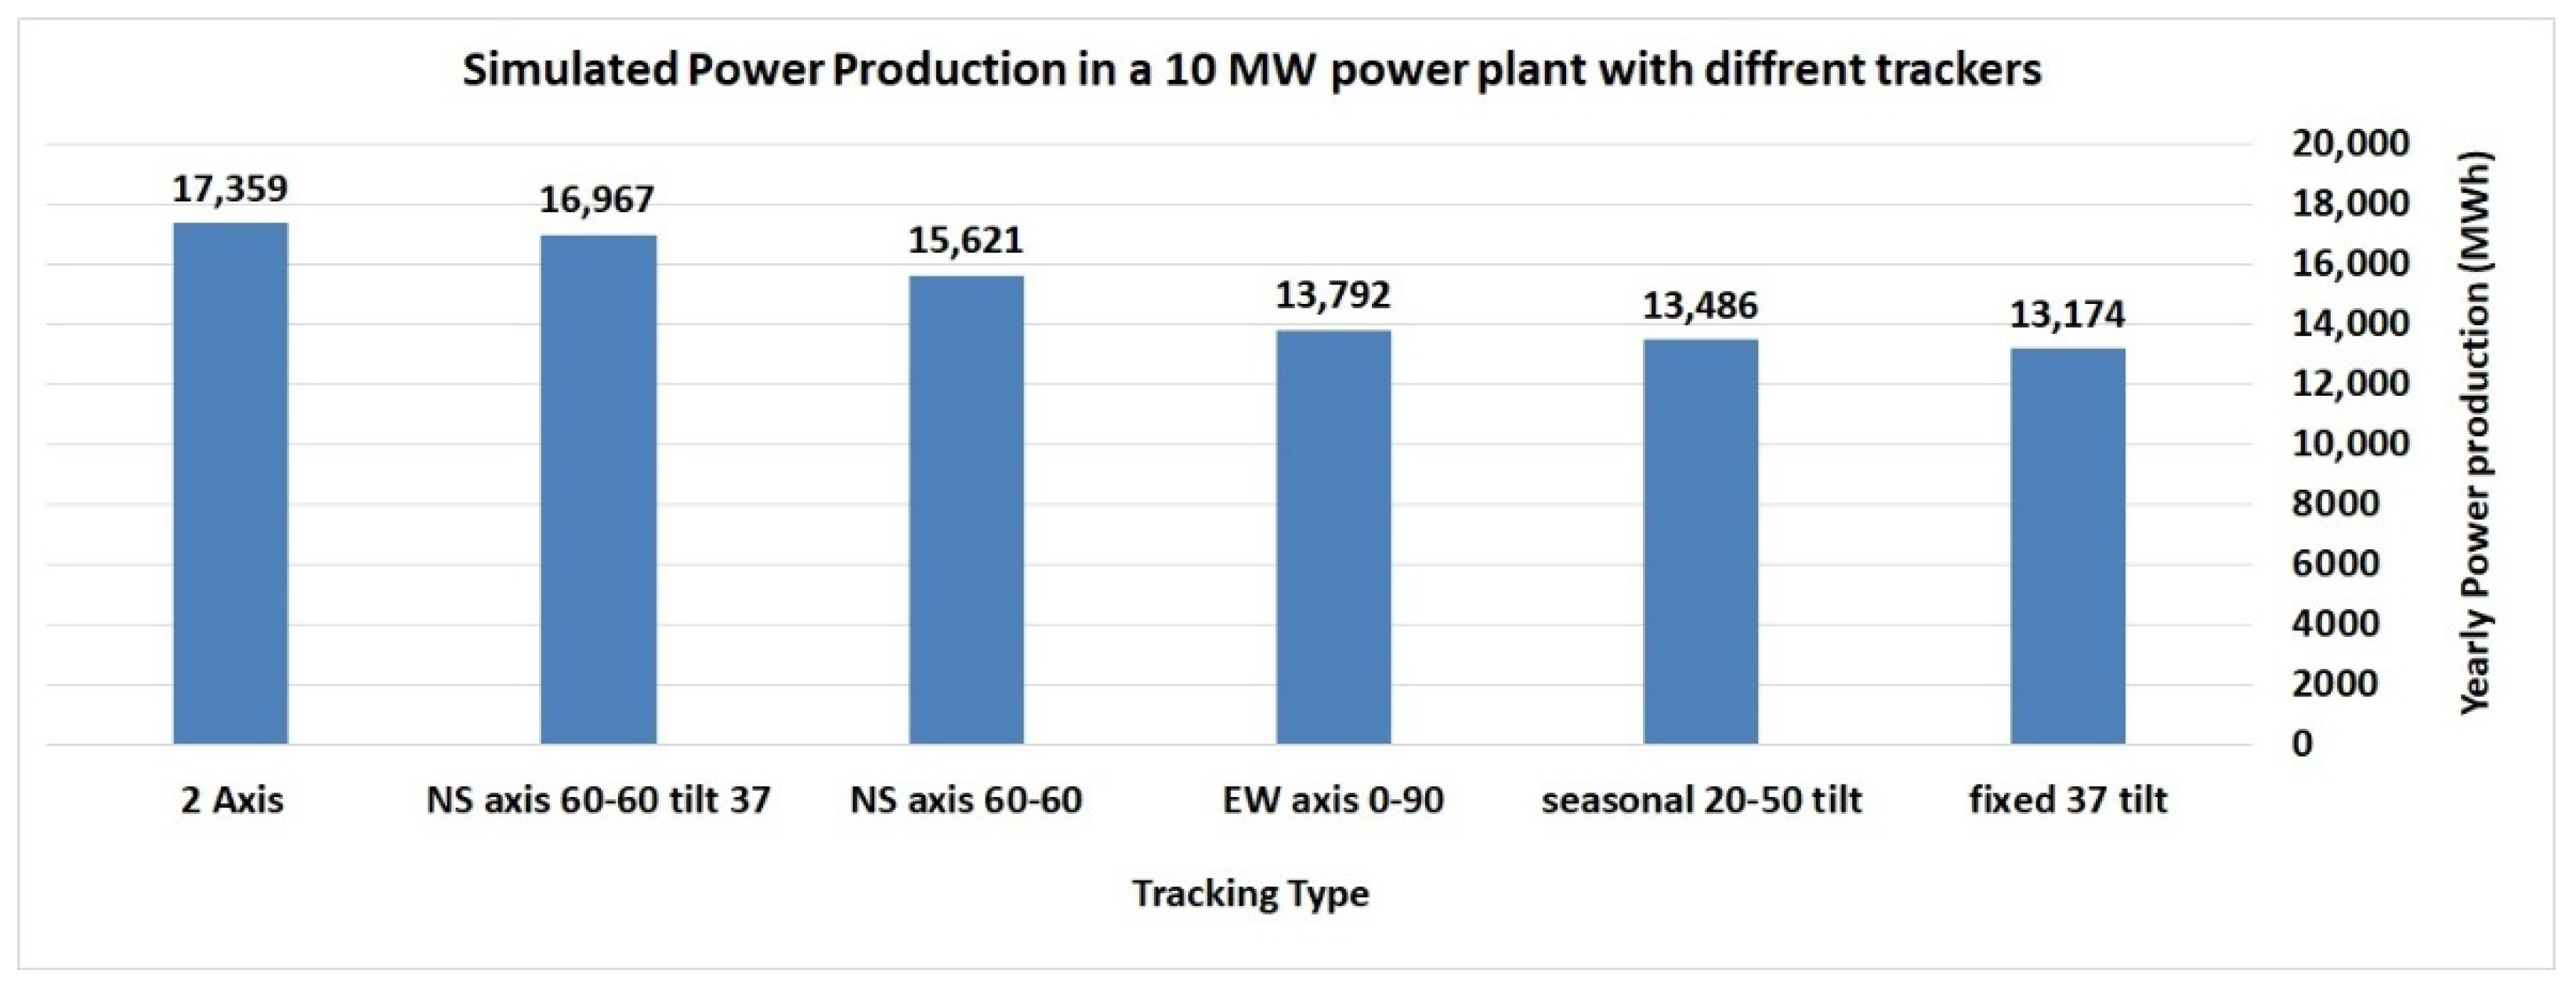
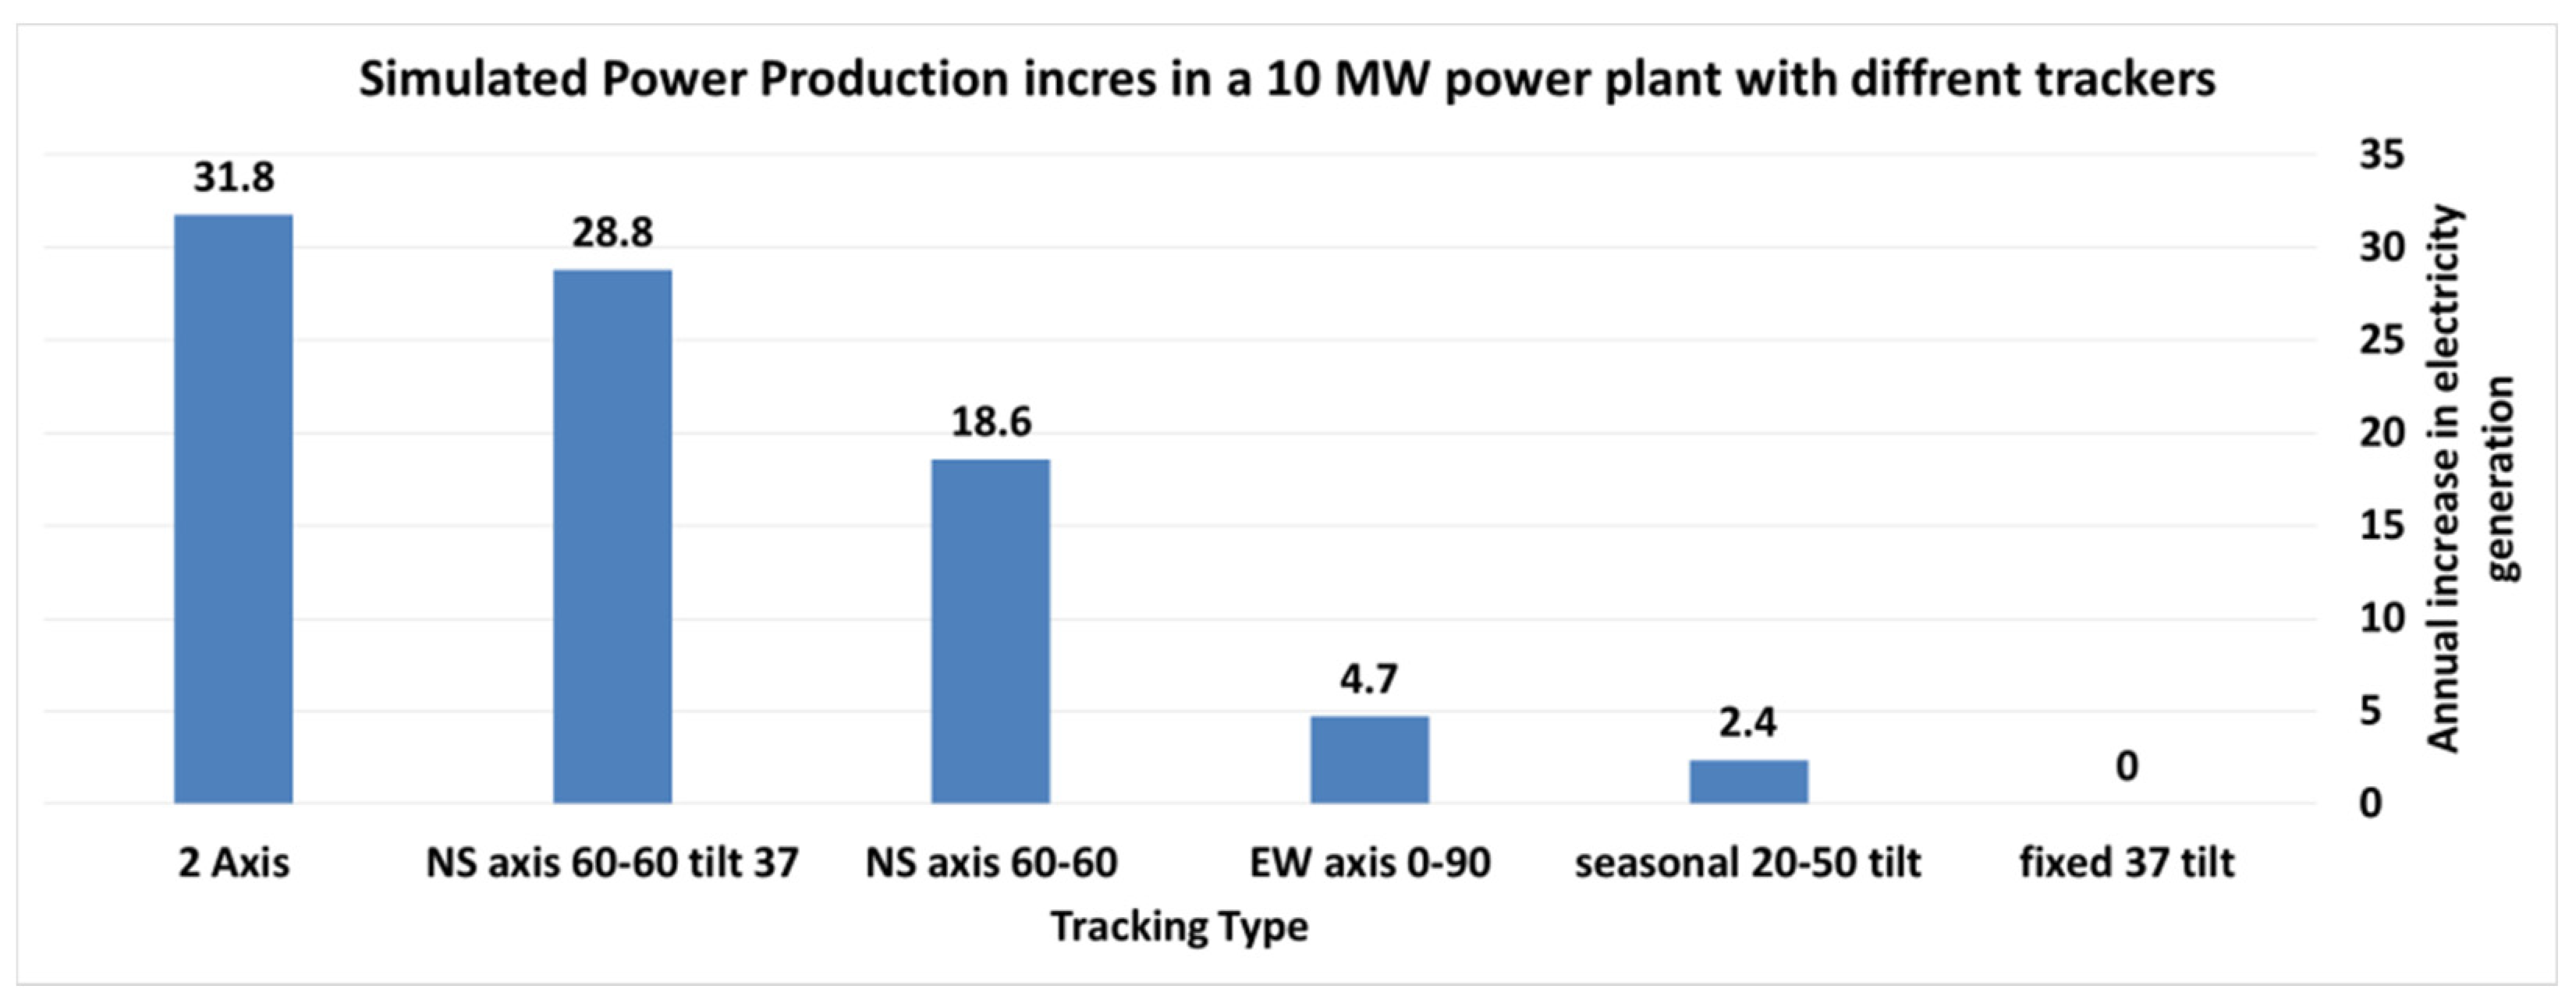
In the following, the production situation is examined in the previously-planned scenarios. For example, as observed in the graphs of
Figure 14, adjusting the panels in two seasonal tilt angle conditions only increases the power generation performance by 4%, while the use of single-axis tracking that detects the sun from south to north leads to an increase in production by 6%. If the single-axis tracker is designed to track the sun from east to west, the production can increase by 18%. If the power plant panels are installed under special conditions with an optimal angle towards the south, the production can improve even further by 27%. Finally, if the two-axis detector is used in the power plant, the production can be increased by nearly 31%, as shown in
Figure 15.
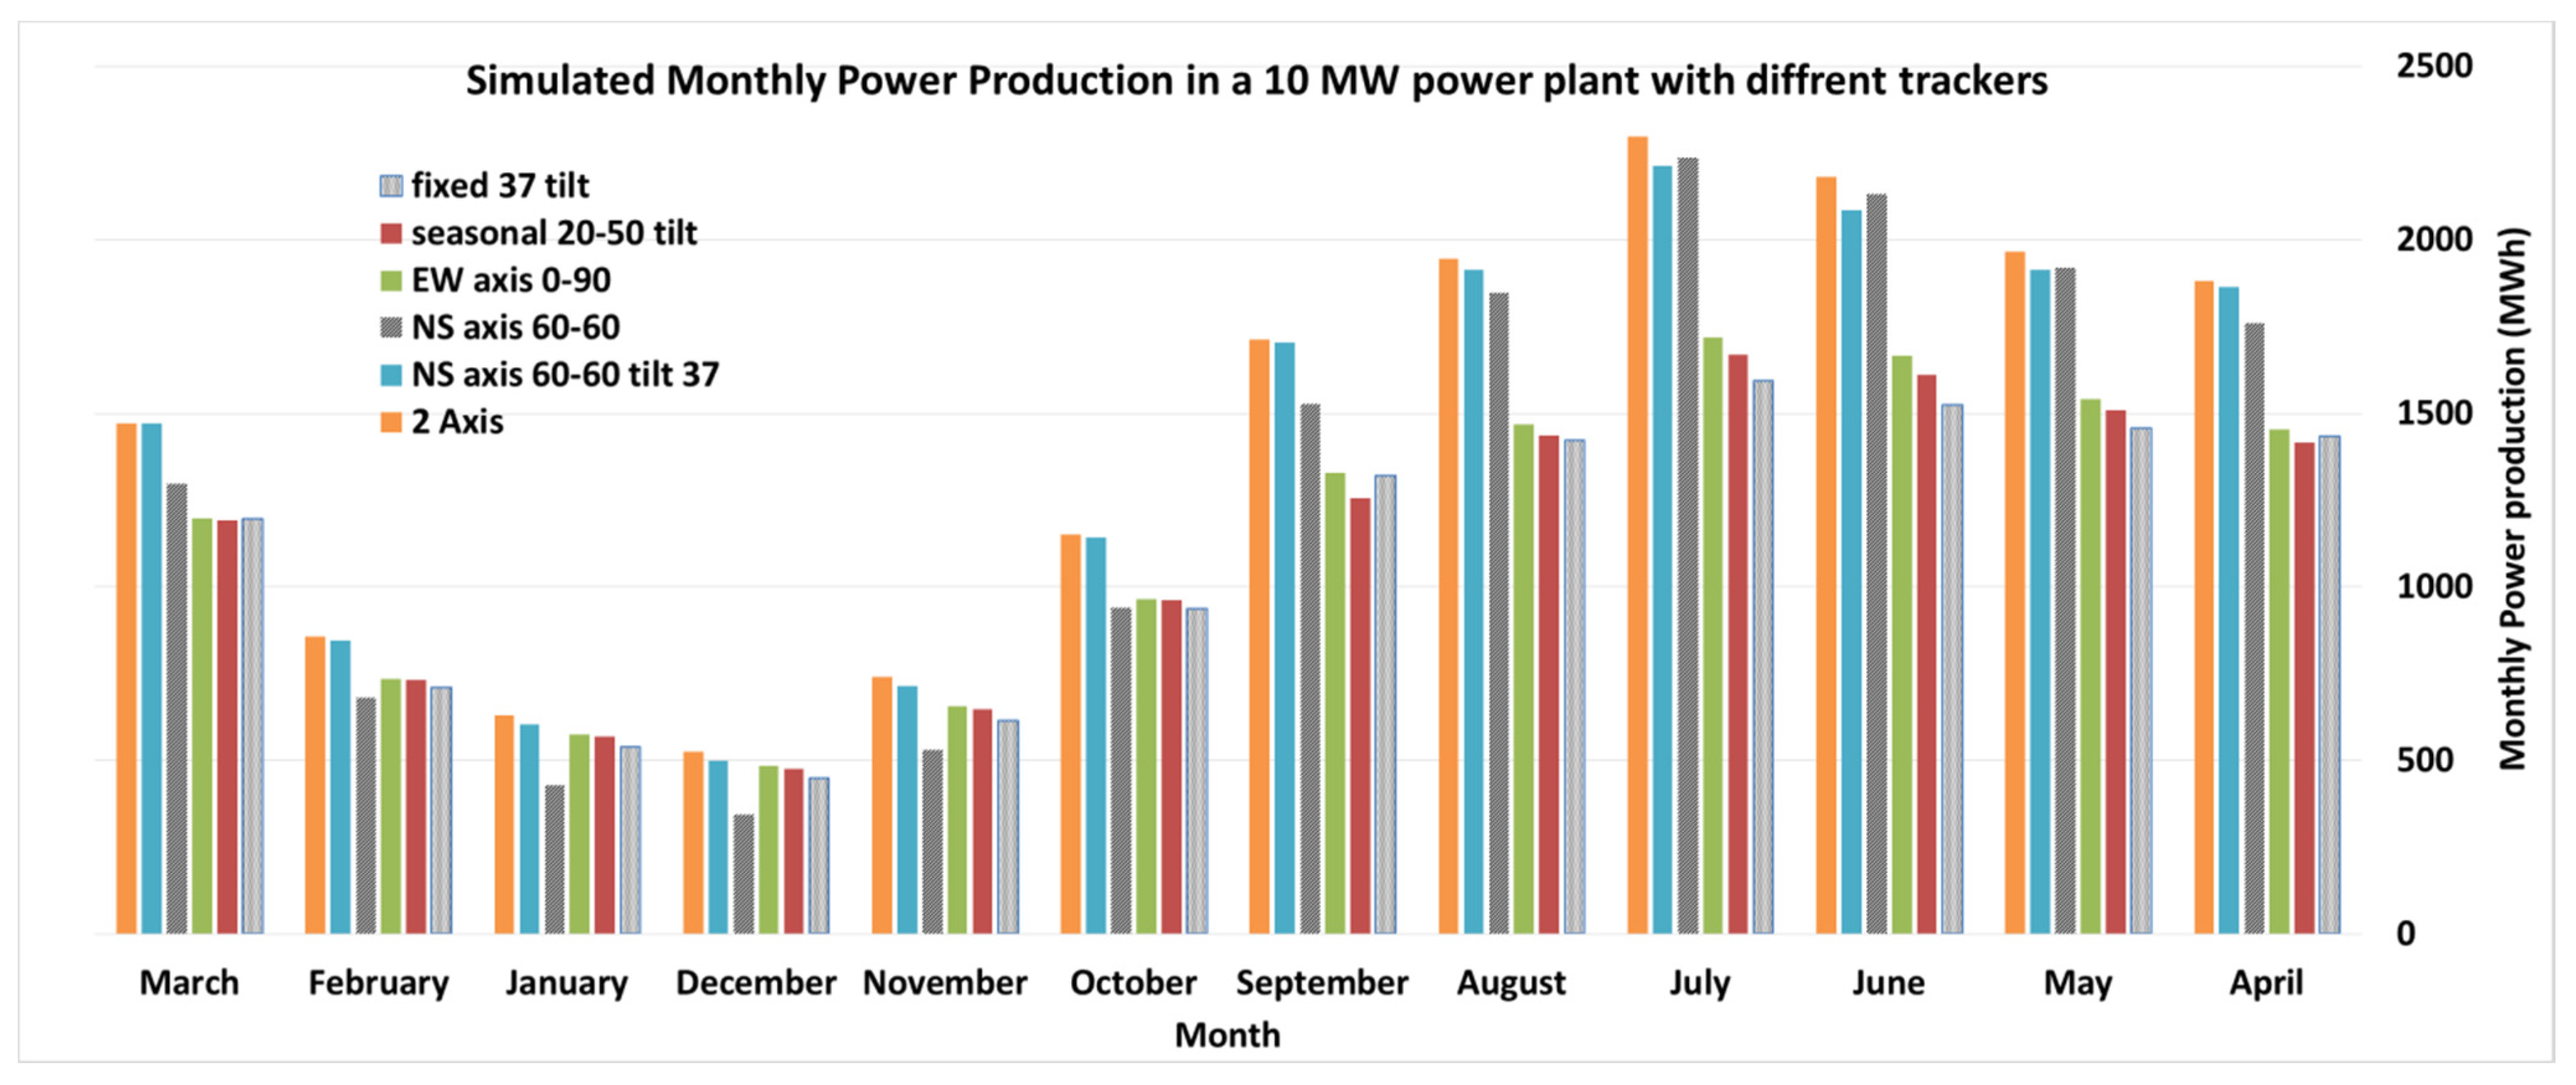
Figure 16 gives a comparison of the maximum monthly energy production that can be obtained from the power plant in different tracking scenarios. The power plants with two-axis or east-west trackers and a suitable tilt angle to the south have the best performance in different months of the year.
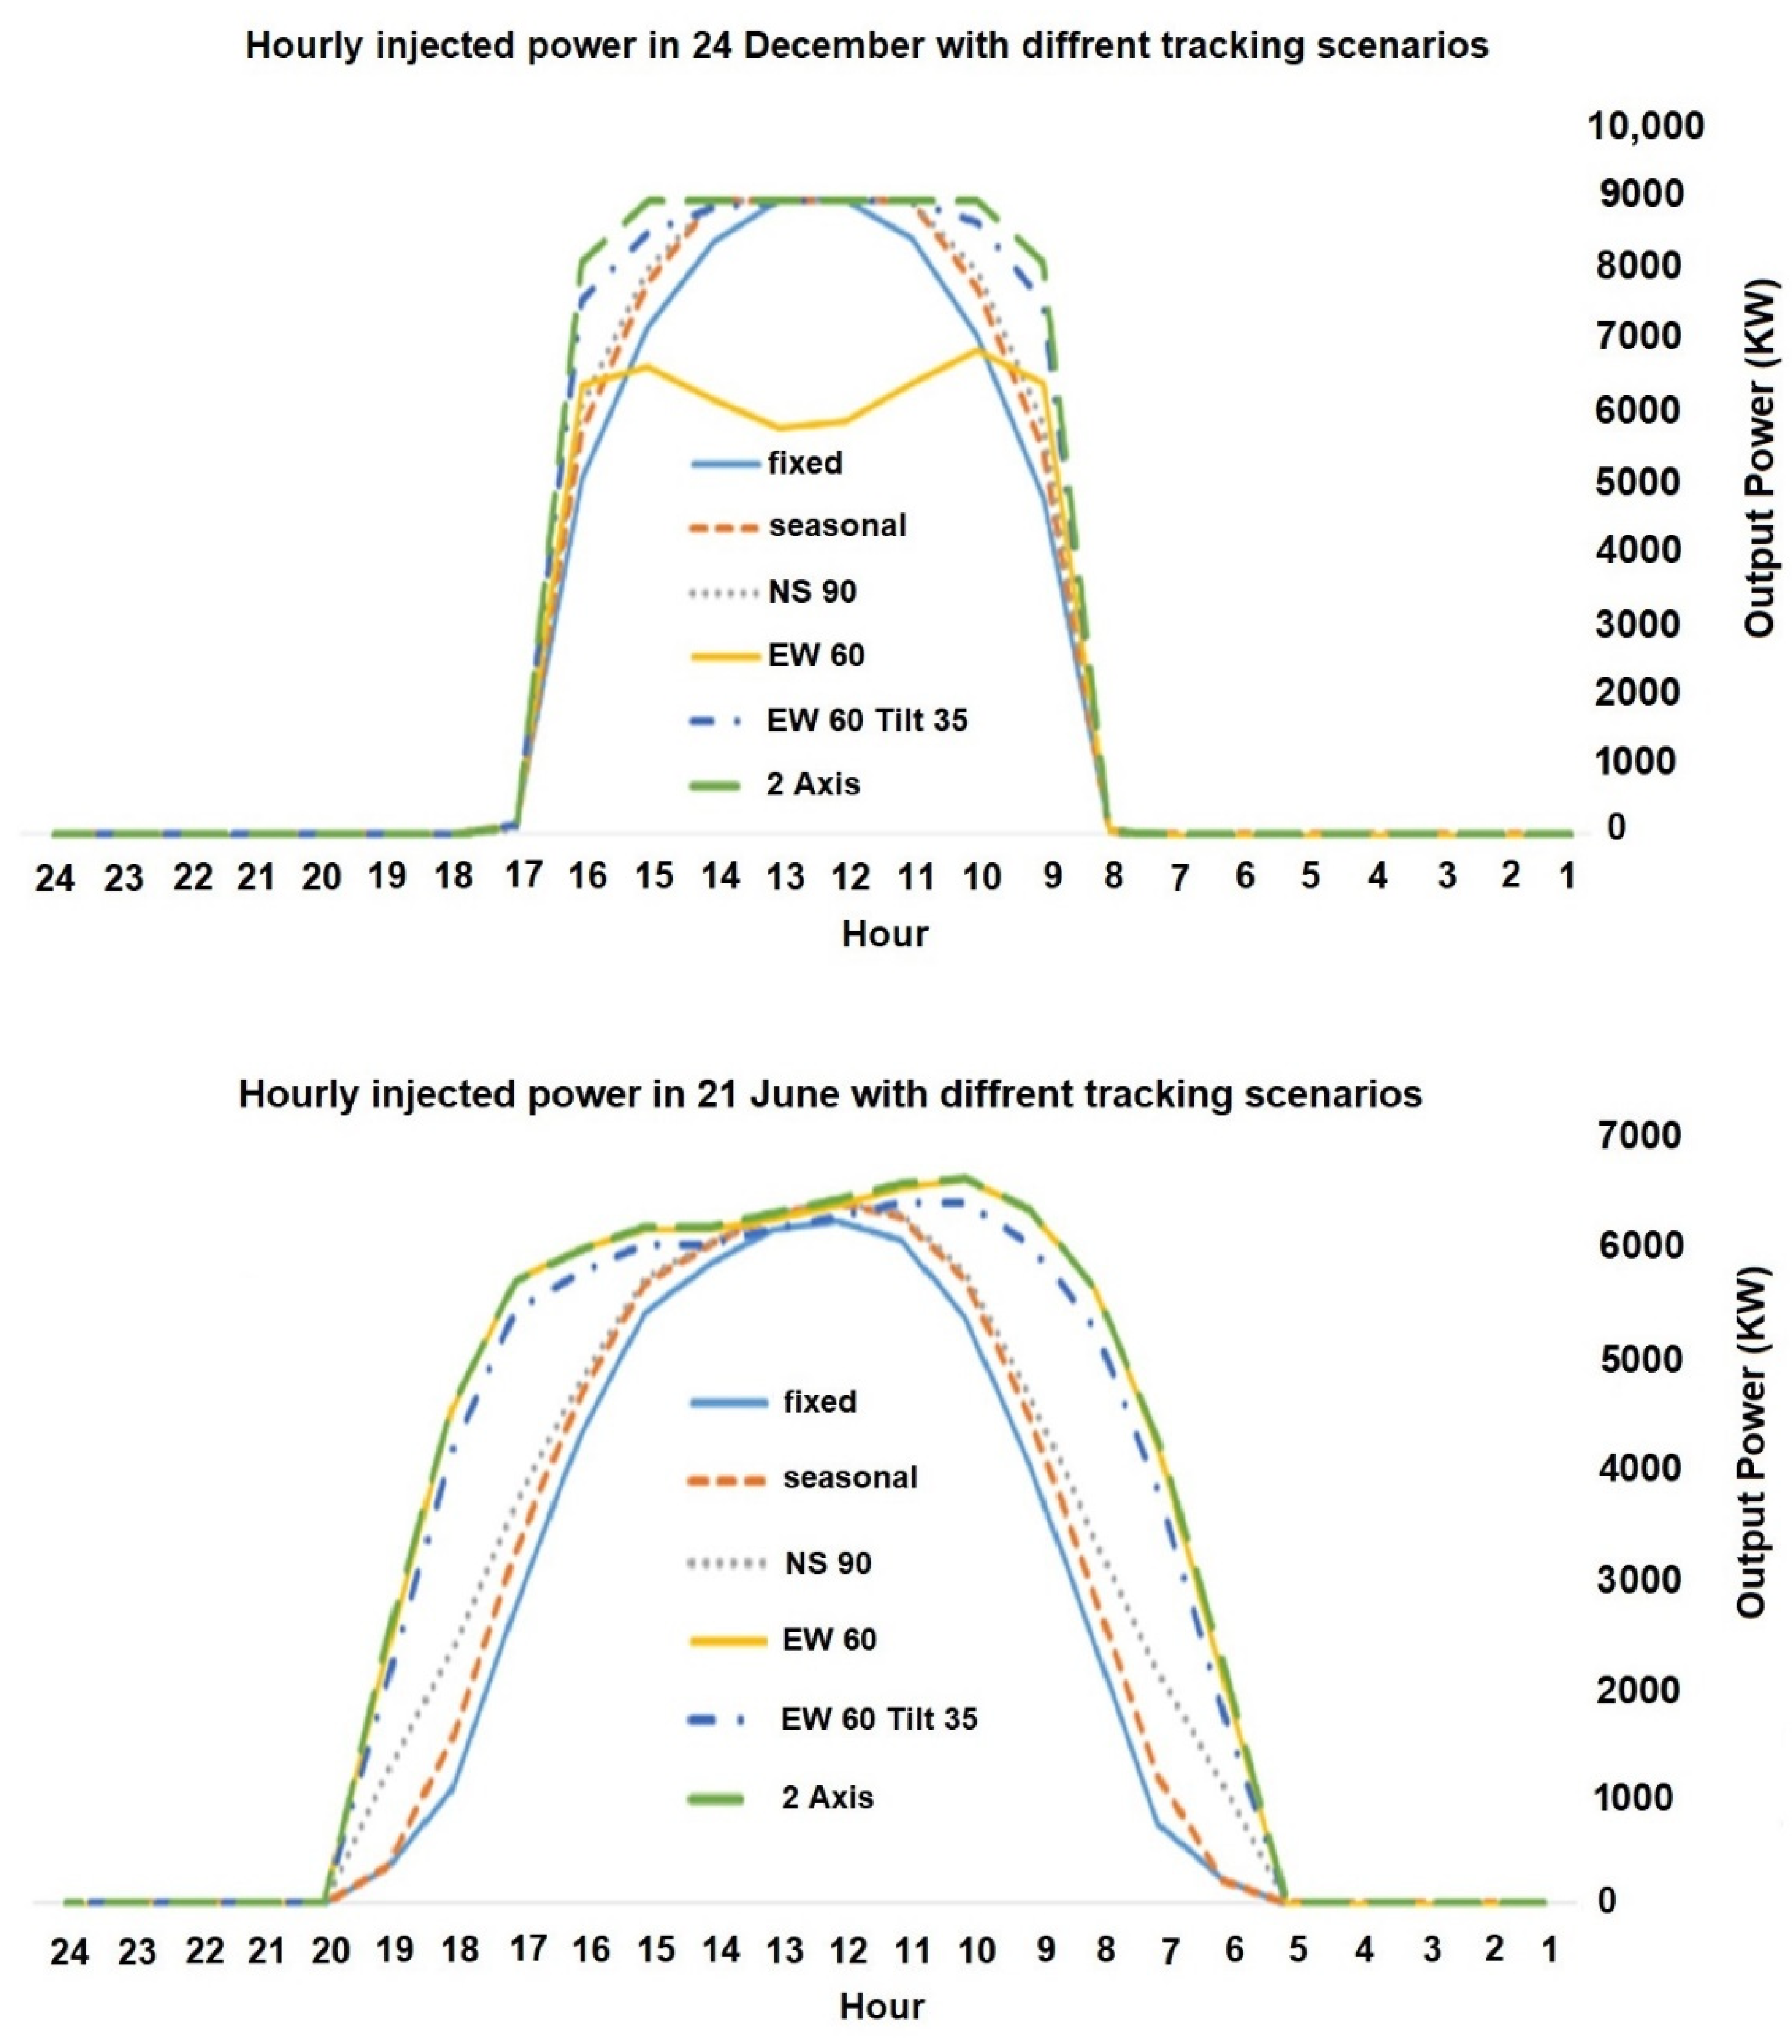
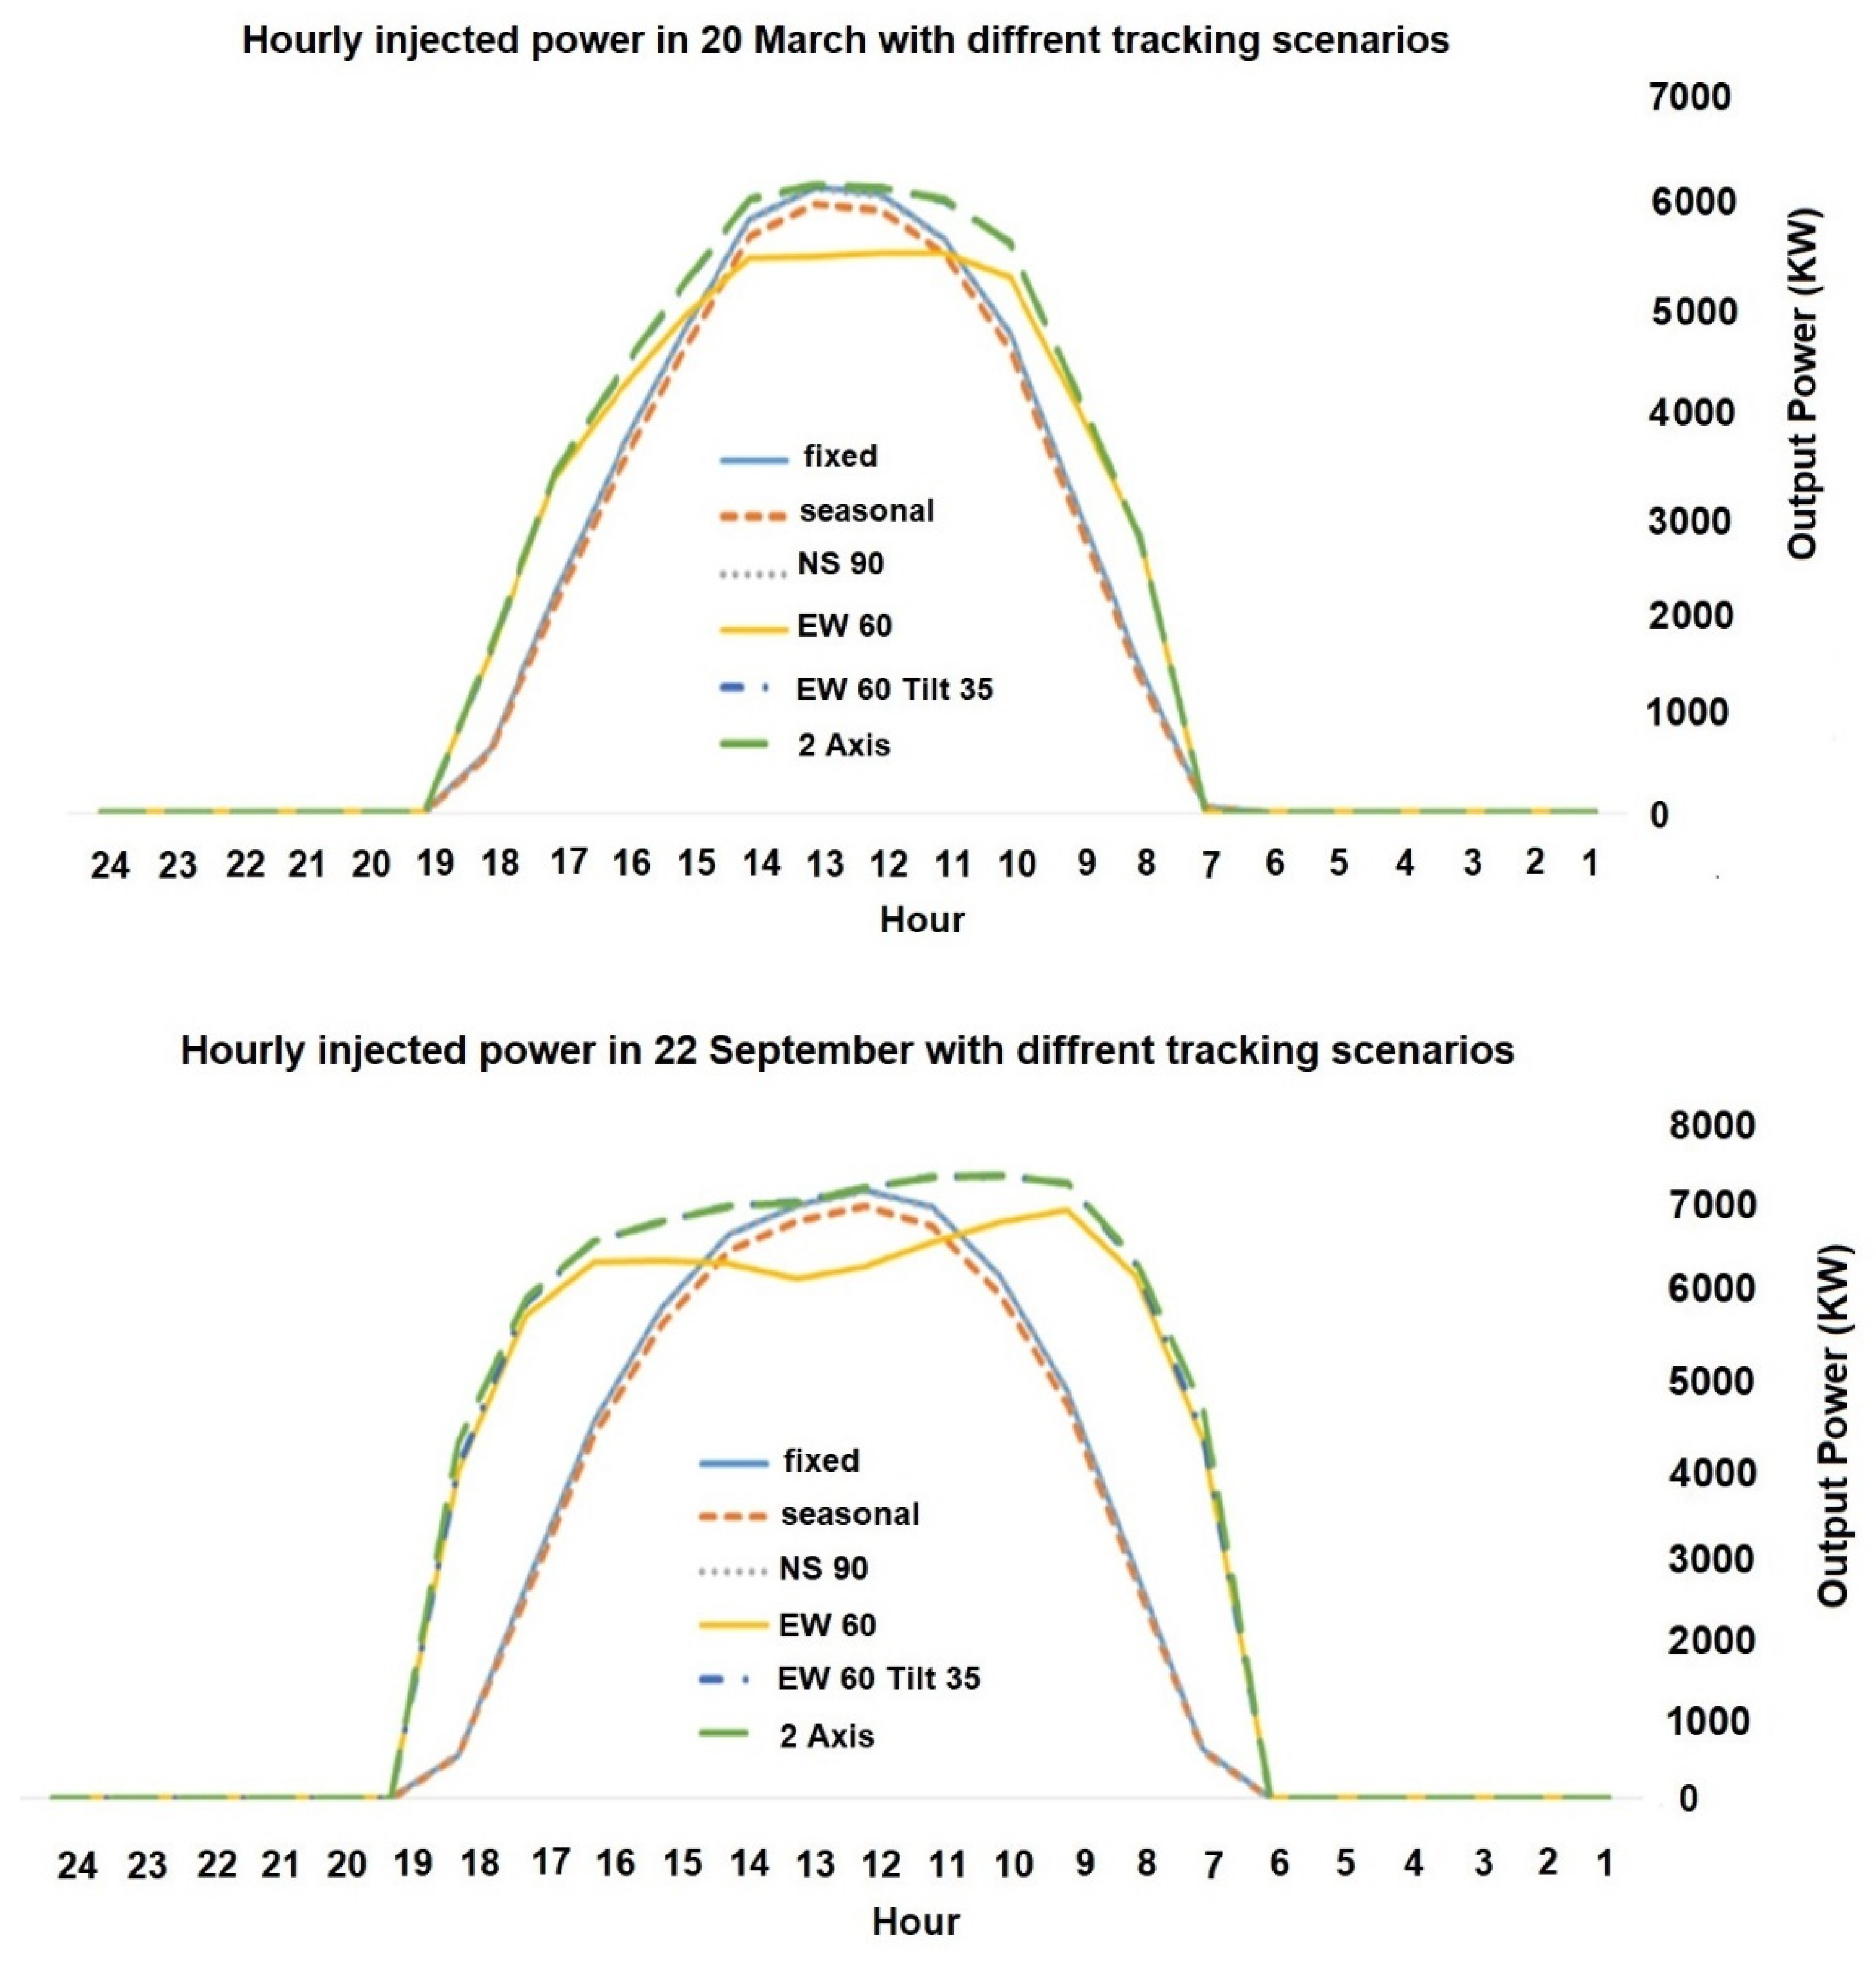
In the final step, four days of the year in each season with no significant atmospheric interventions were selected for the daily comparison of energy production in different scenarios of using trackers. As can be seen from the graphs, the effectiveness of various sun-tracking methods in energy production is strongly influenced by the position of the sun in the sky during the day. As
Figure 17 shows, the production varies on different days, and the effectiveness factor of using trackers is variable.
5. Conclusions
In this research, electricity production in power plants equipped with an east-west tracker and without a tracker was compared based on daily, monthly and annual production data. The results showed that the power plants fitted with this type of tracker produce up to 20% more energy in a year. The range of production changes in this technology is such that the amount of production varies from a 44% increase on a summer day to a 15% decrease on a winter day, compared to models without a tracker. Generally, a power plant equipped with an east-west tracker for eight months of the year can have higher production than power plants without trackers. In addition, it should be noted that with the same installed capacity in similar latitudes and climatic conditions, the design and specifications of the equipment used in the power plant significantly impact energy production. Investigating the performance of power plants equipped with trackers shows that the annual utilization factor in this type of power plant is about 25%.
By examining the energy production curve in solar power plants equipped with trackers, it was determined that the hourly production curve, which follows a bell pattern in solar power plants without trackers, changes into a trapezoid shape with the installation of east-west trackers. In this case, the time range of energy production is increased. In the morning, it starts earlier than the power plants without trackers, and the curve rises with a steep slope. The energy production in the midday hours is stabilized uniformly with the performance of the tracker. In the final hours of the day, it descends proportionally to the steep slope in the morning. Considering the stabilization of energy production in the midday hours, this technology can well cover the middle peak hours of the day in the electricity grid, especially in the summer season. Generally, if only mid-day peak hours from June 15 to September 15 are considered, the tracking power plants can produce more than 74% of their capacity. For the peak hours (11 to 15 and 18 to 22) in the same period, they can produce by 41% of their capacity.
In the PVsyst software, the power plant models were developed in different modes of fixed, seasonal, north-south orientation, east-west orientation, east-west orientation with a suitable tilt angle towards the south and biaxial movement for a power plant with technical specifications similar to the 10 MW Q power plant located near the city of Qom. The results of these simulations are consistent with the annual production of the power plant, so using the east-west single-axis tracker in the mentioned solar power plant increased the production efficiency by 18%, and if using the two-axis tracker, this number can increase up to 31%.
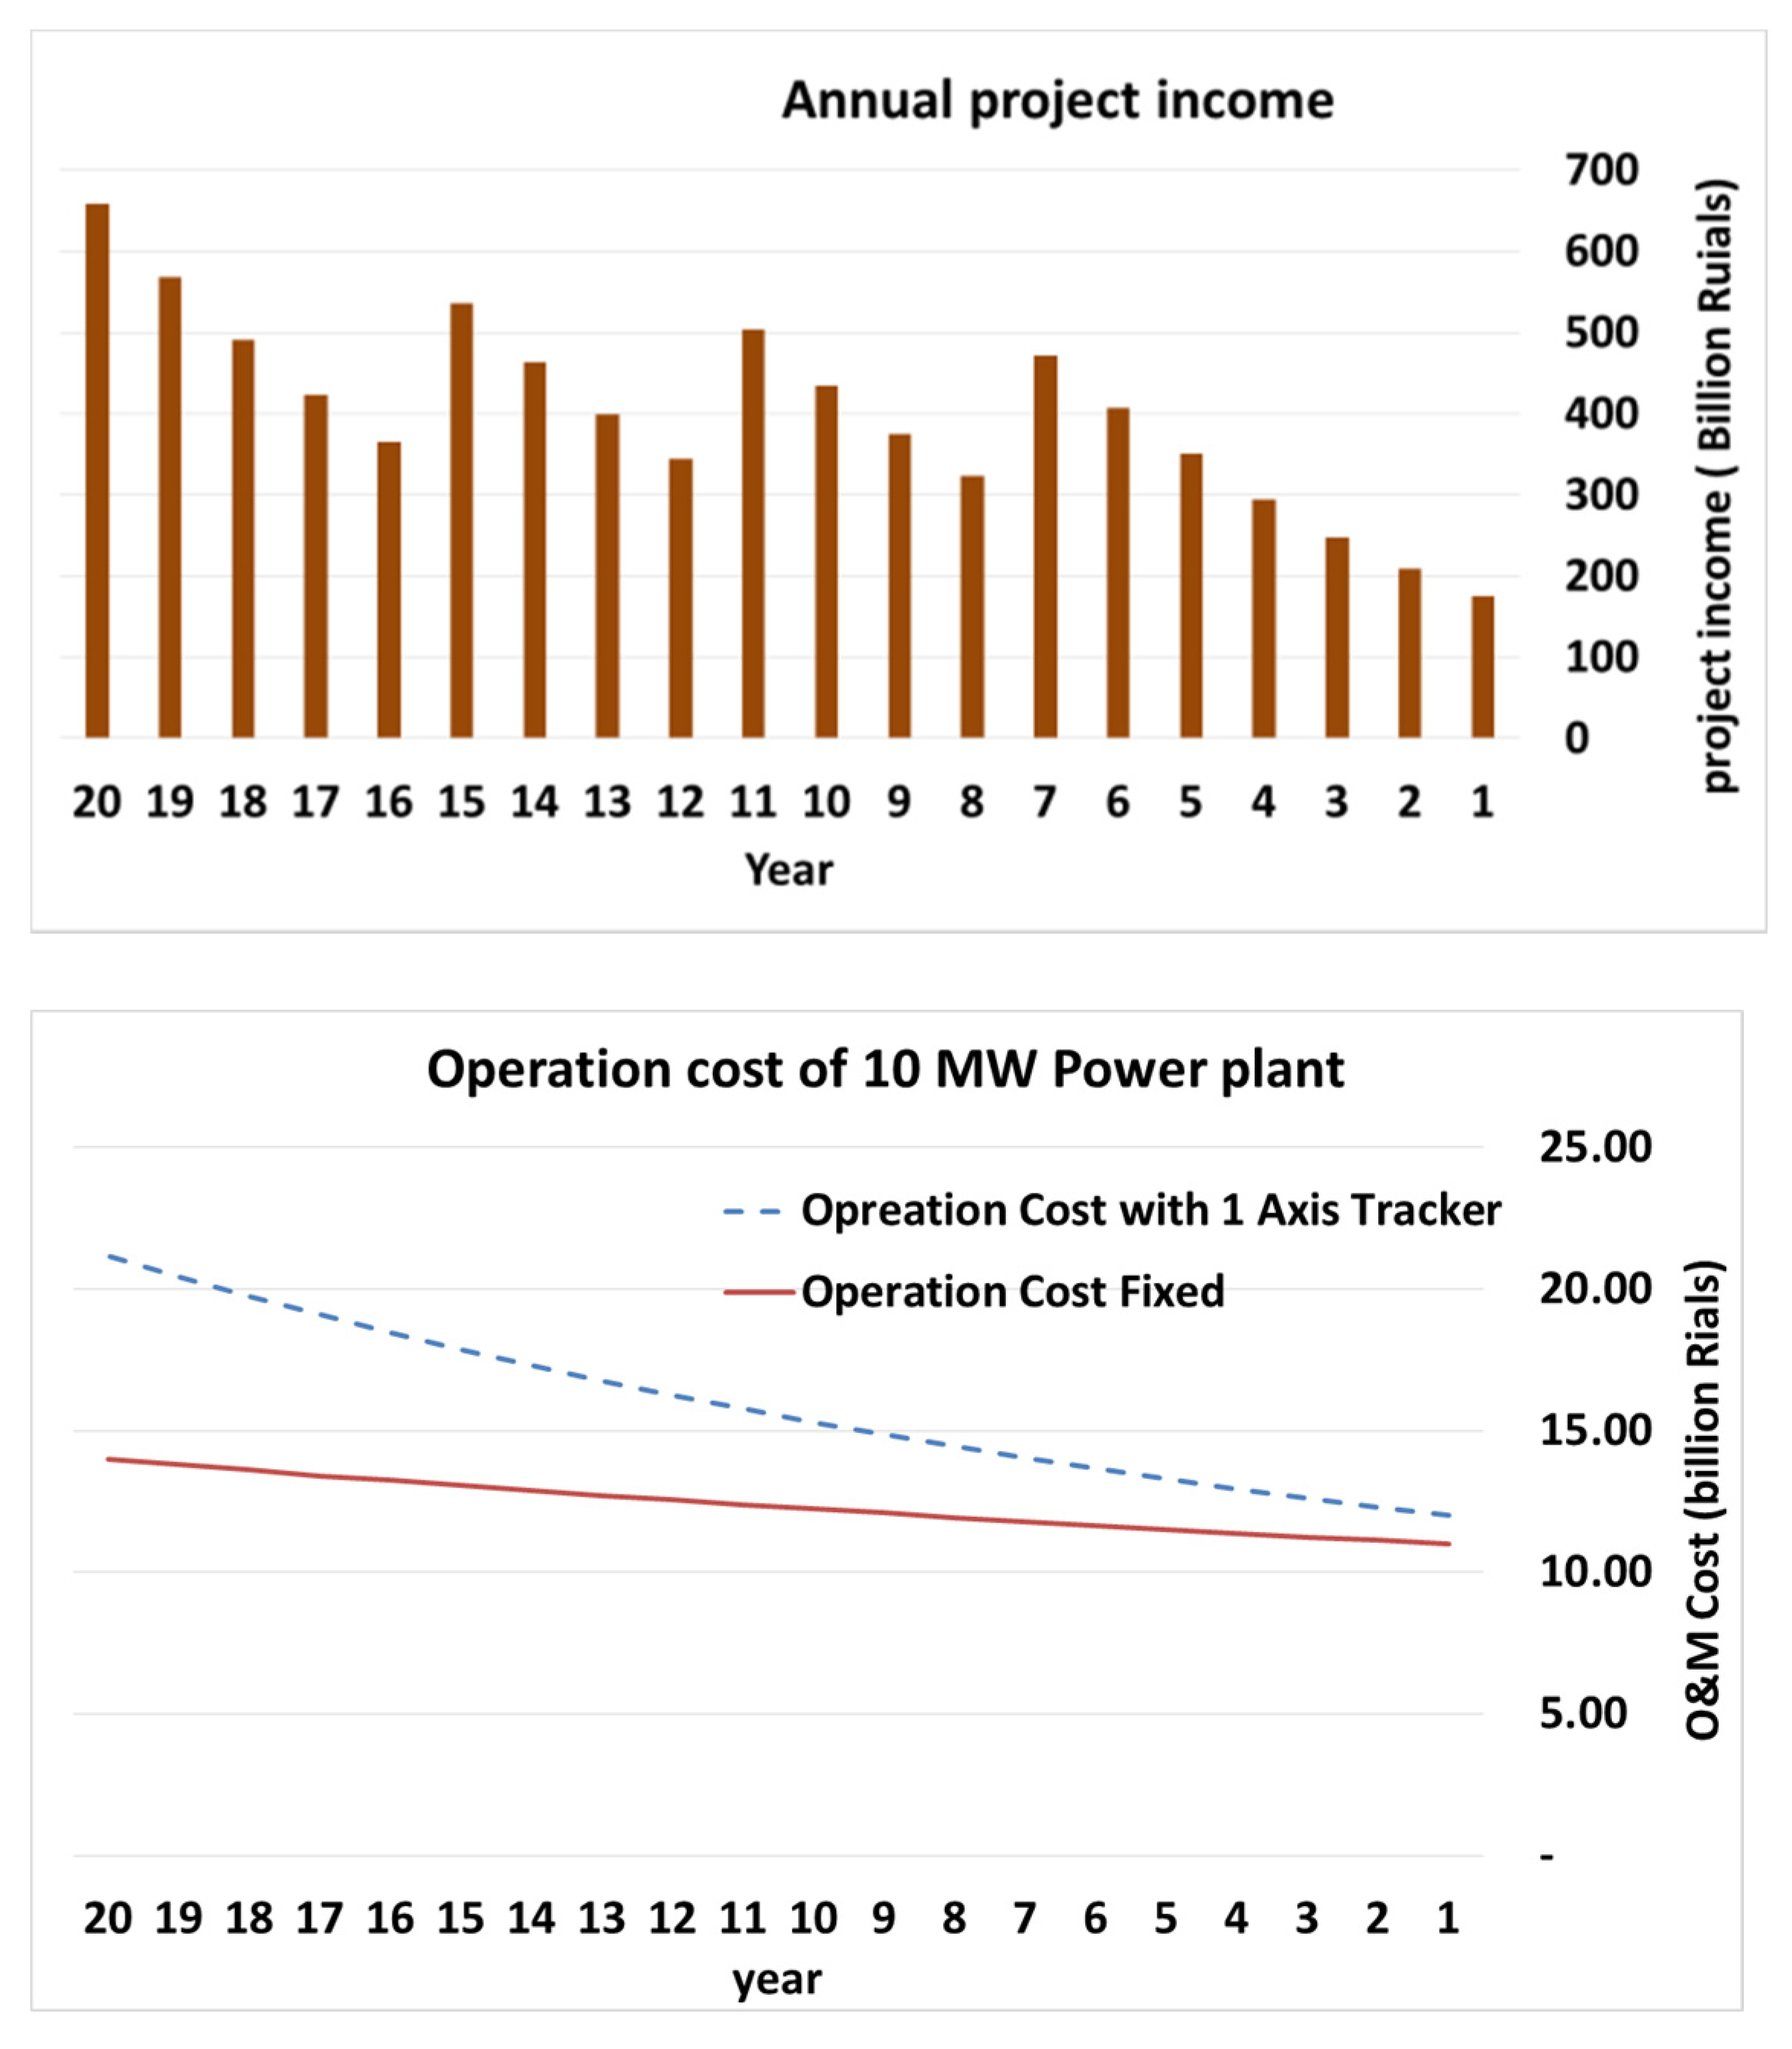
Considering that the cost of the panel support structure is approximately 10% of the total cost of the power plant, the addition of a single-axis tracker can increase it up to 80% and a two-axis tracker up to 400%. The cost required to build a power plant with a single-axis tracker is estimated to be nearly 8% higher than that of a fixed power plant, and if a two-axis tracker is used, the cost increase can be up to 40%. In addition, the repair and maintenance costs of solar trackers depend on factors such as the cost of workforce, weather conditions, and equipment used in the power plant. Solar trackers can cause an increase in repair and maintenance costs in the range of 10 to 100%. The techno-economic aspect of using a tracker was investigated for a 10 MW solar power plant in Yazd province with the current conditions of guaranteed electricity purchase. Assuming an internal rate of return of around 12% will yield a return of capital of 8 years and an NPV of −60 billion IRR, making the construction of solar power plants unattractive for investors. In this case, the use of trackers causes a slight improvement in the internal rate of return and the return of capital and reduces the NPV of the project. The second scenario is based on improvement of the economic conditions of the country, and reducing the exchange rate of US dollar to IRR to 180,000 IRR (or increasing the guaranteed purchase price of electricity from 8920 IRR to 13,300 IRR per kilowatt or reducing the investment cost of building a power plant from 800 to below 525 dollars per kilowatt). Based on the current guaranteed electricity purchase method, the calculations showed that the internal rate of return would be about 18%, the NPV would become positive, and the return of capital would be reduced to about five years.
The limitations of this study are as follows:
Limited number of tracking PV power plants in different geographical regions of Iran.
Limited operation period of PV power plants (maximum 3 years).
Opportunities for future research are as follows:
Investigation of electricity production in bifacial PV power plants and their interactions with tracking systems in different regions of Iran.
Investigation of operation and maintenance costs in tracking power plants in comparison with fixed ones.


 ,
, 


