
Social, Economic, and Environmental Effects of Electricity and Heat Generation in Yenisei Siberia: Is there an Alternative to Coal?


Abstract
1. Introduction
2. Materials and Methods
3. Results
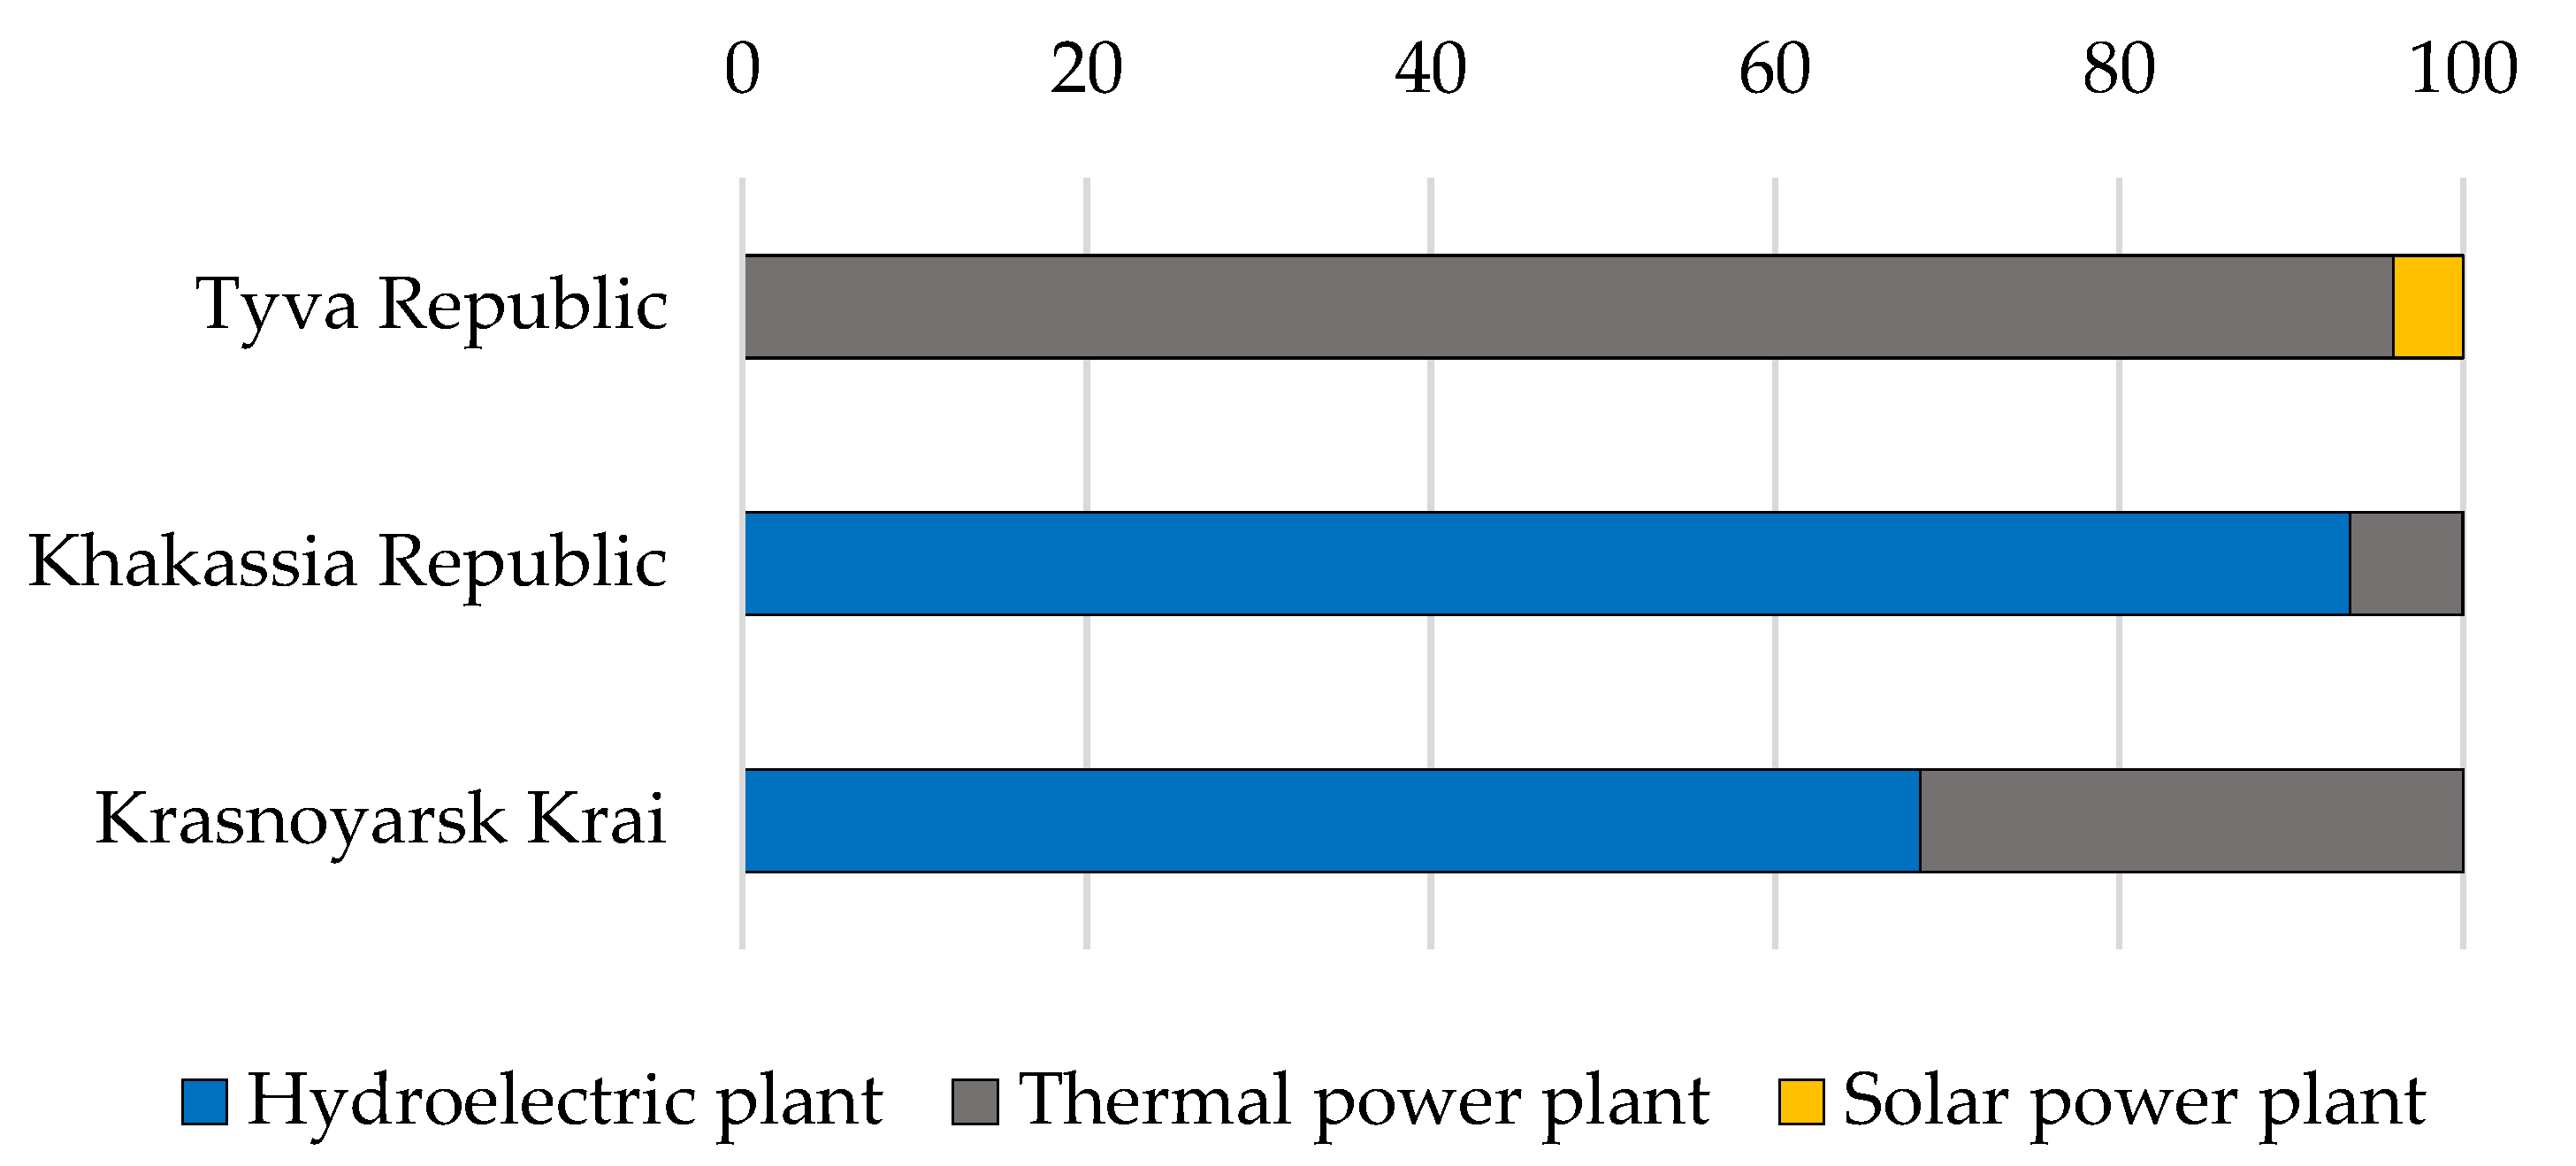
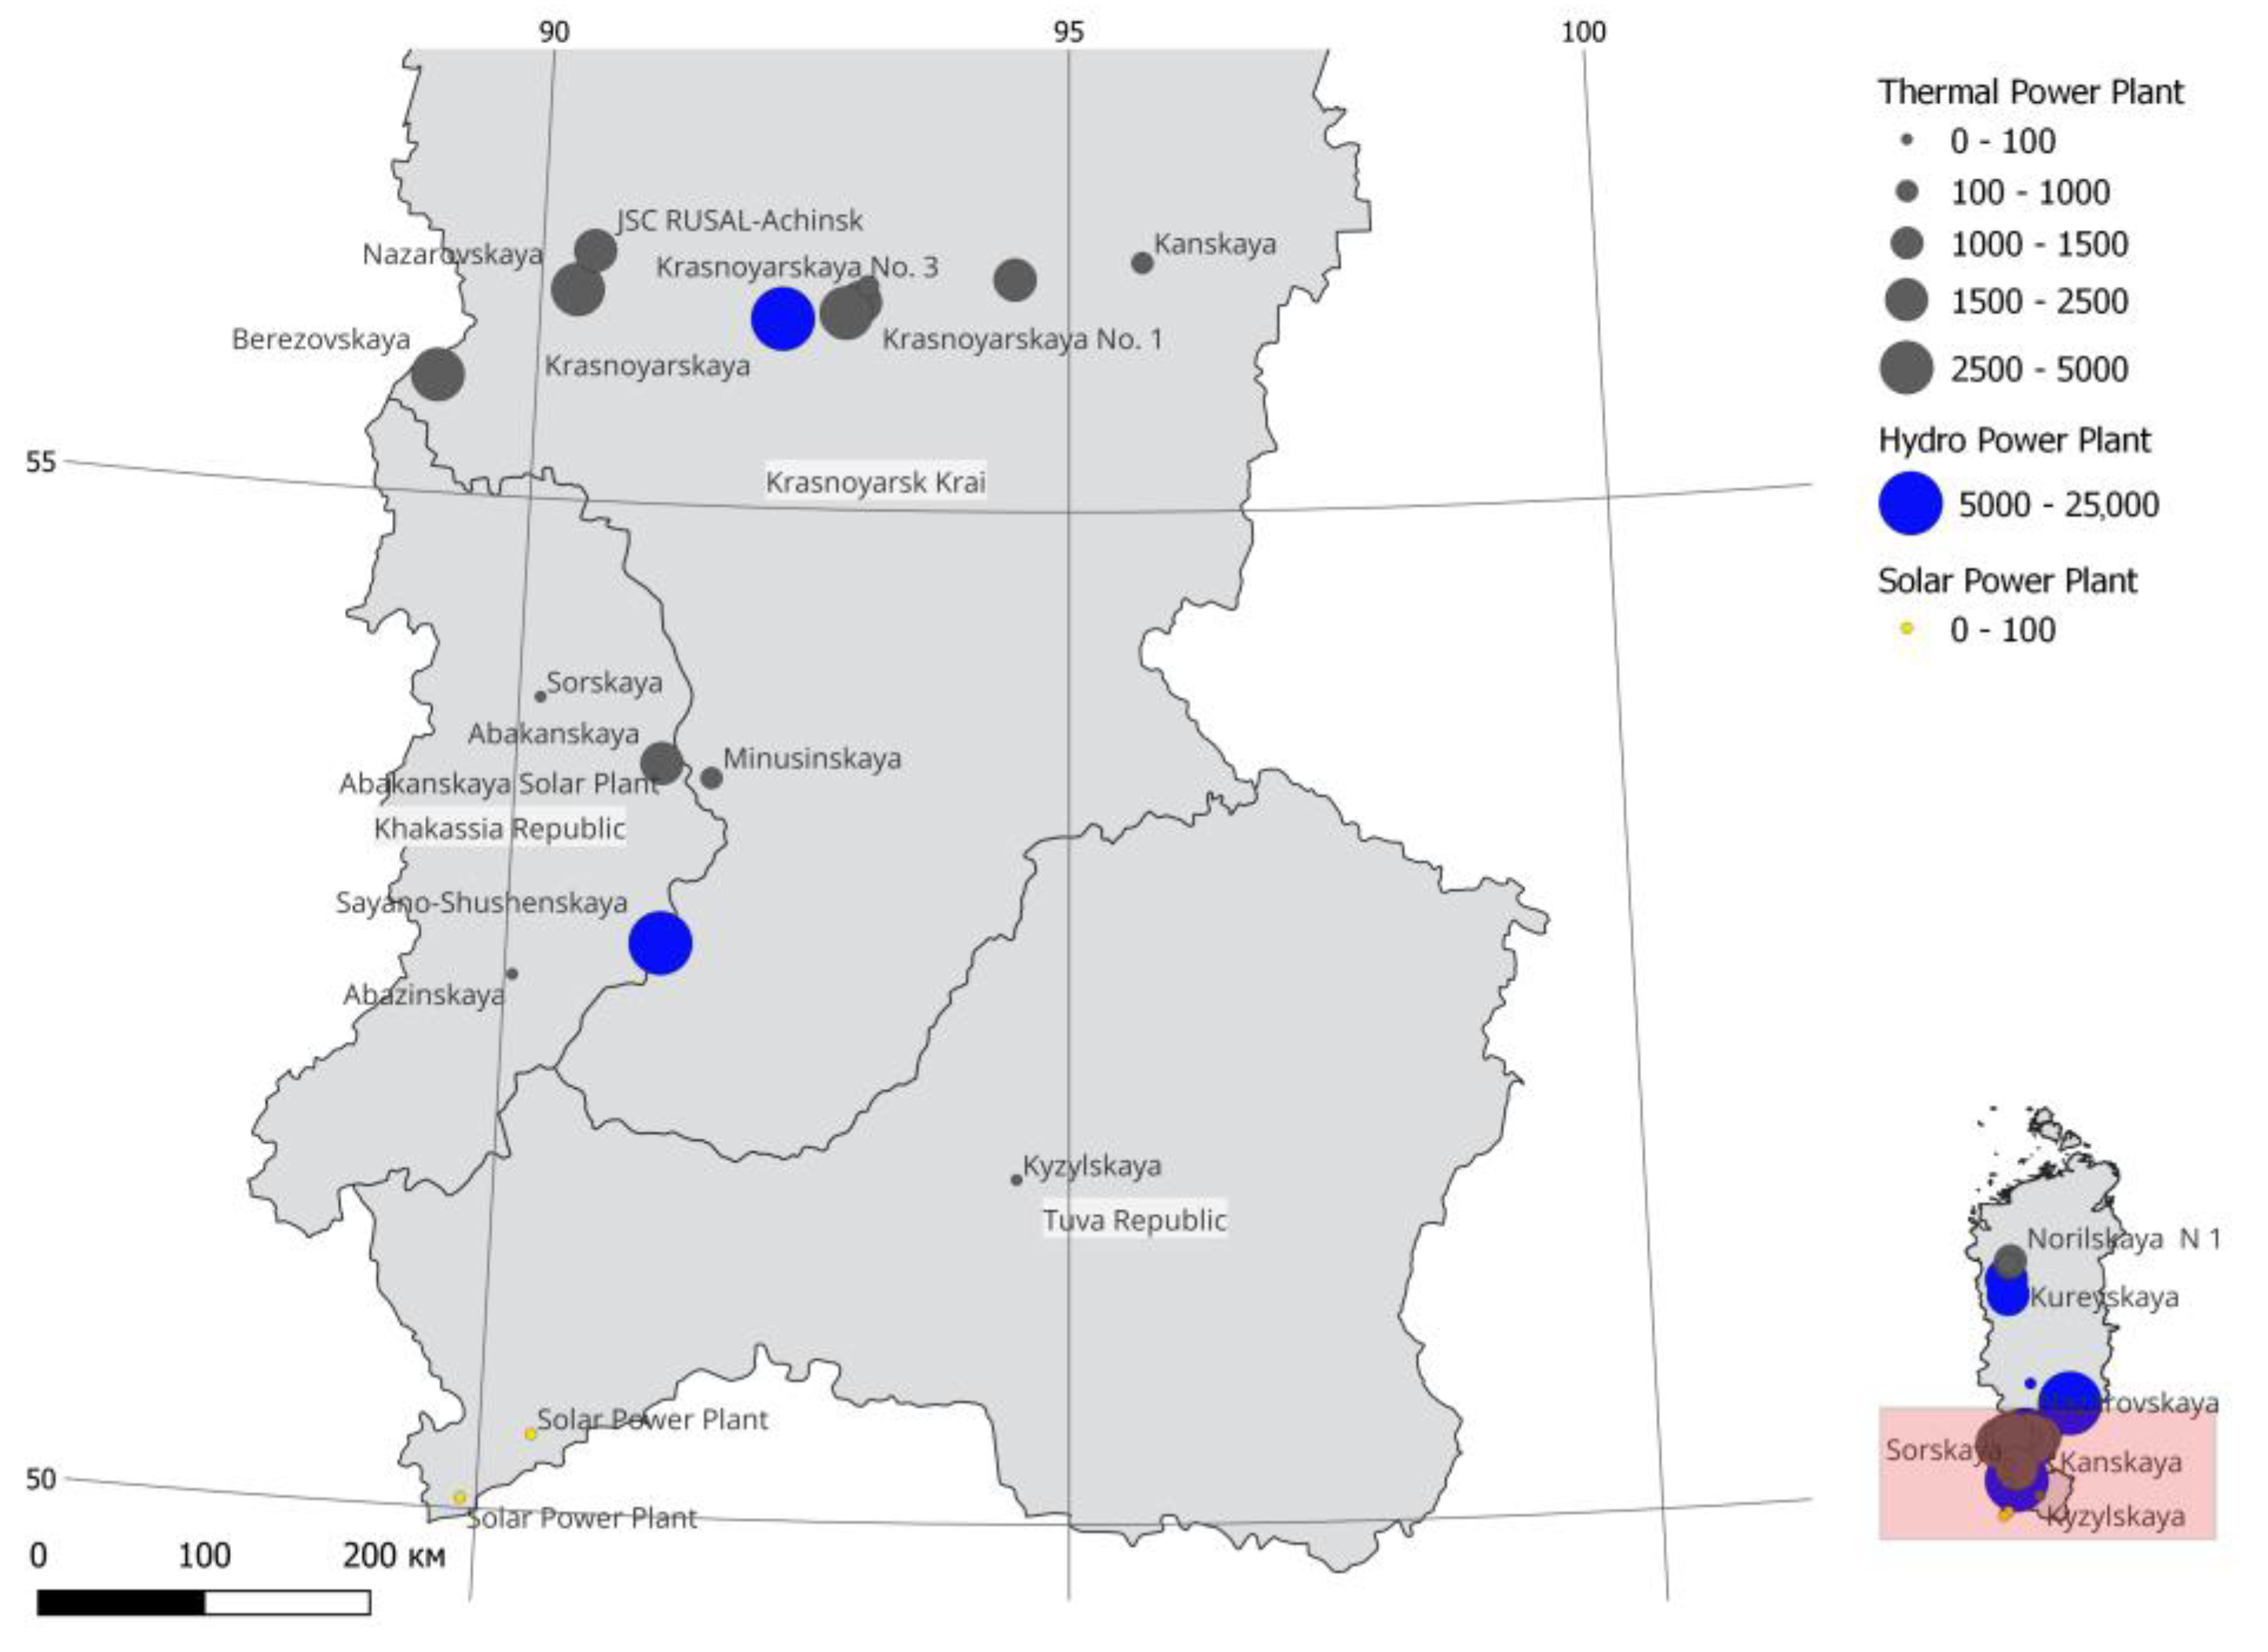
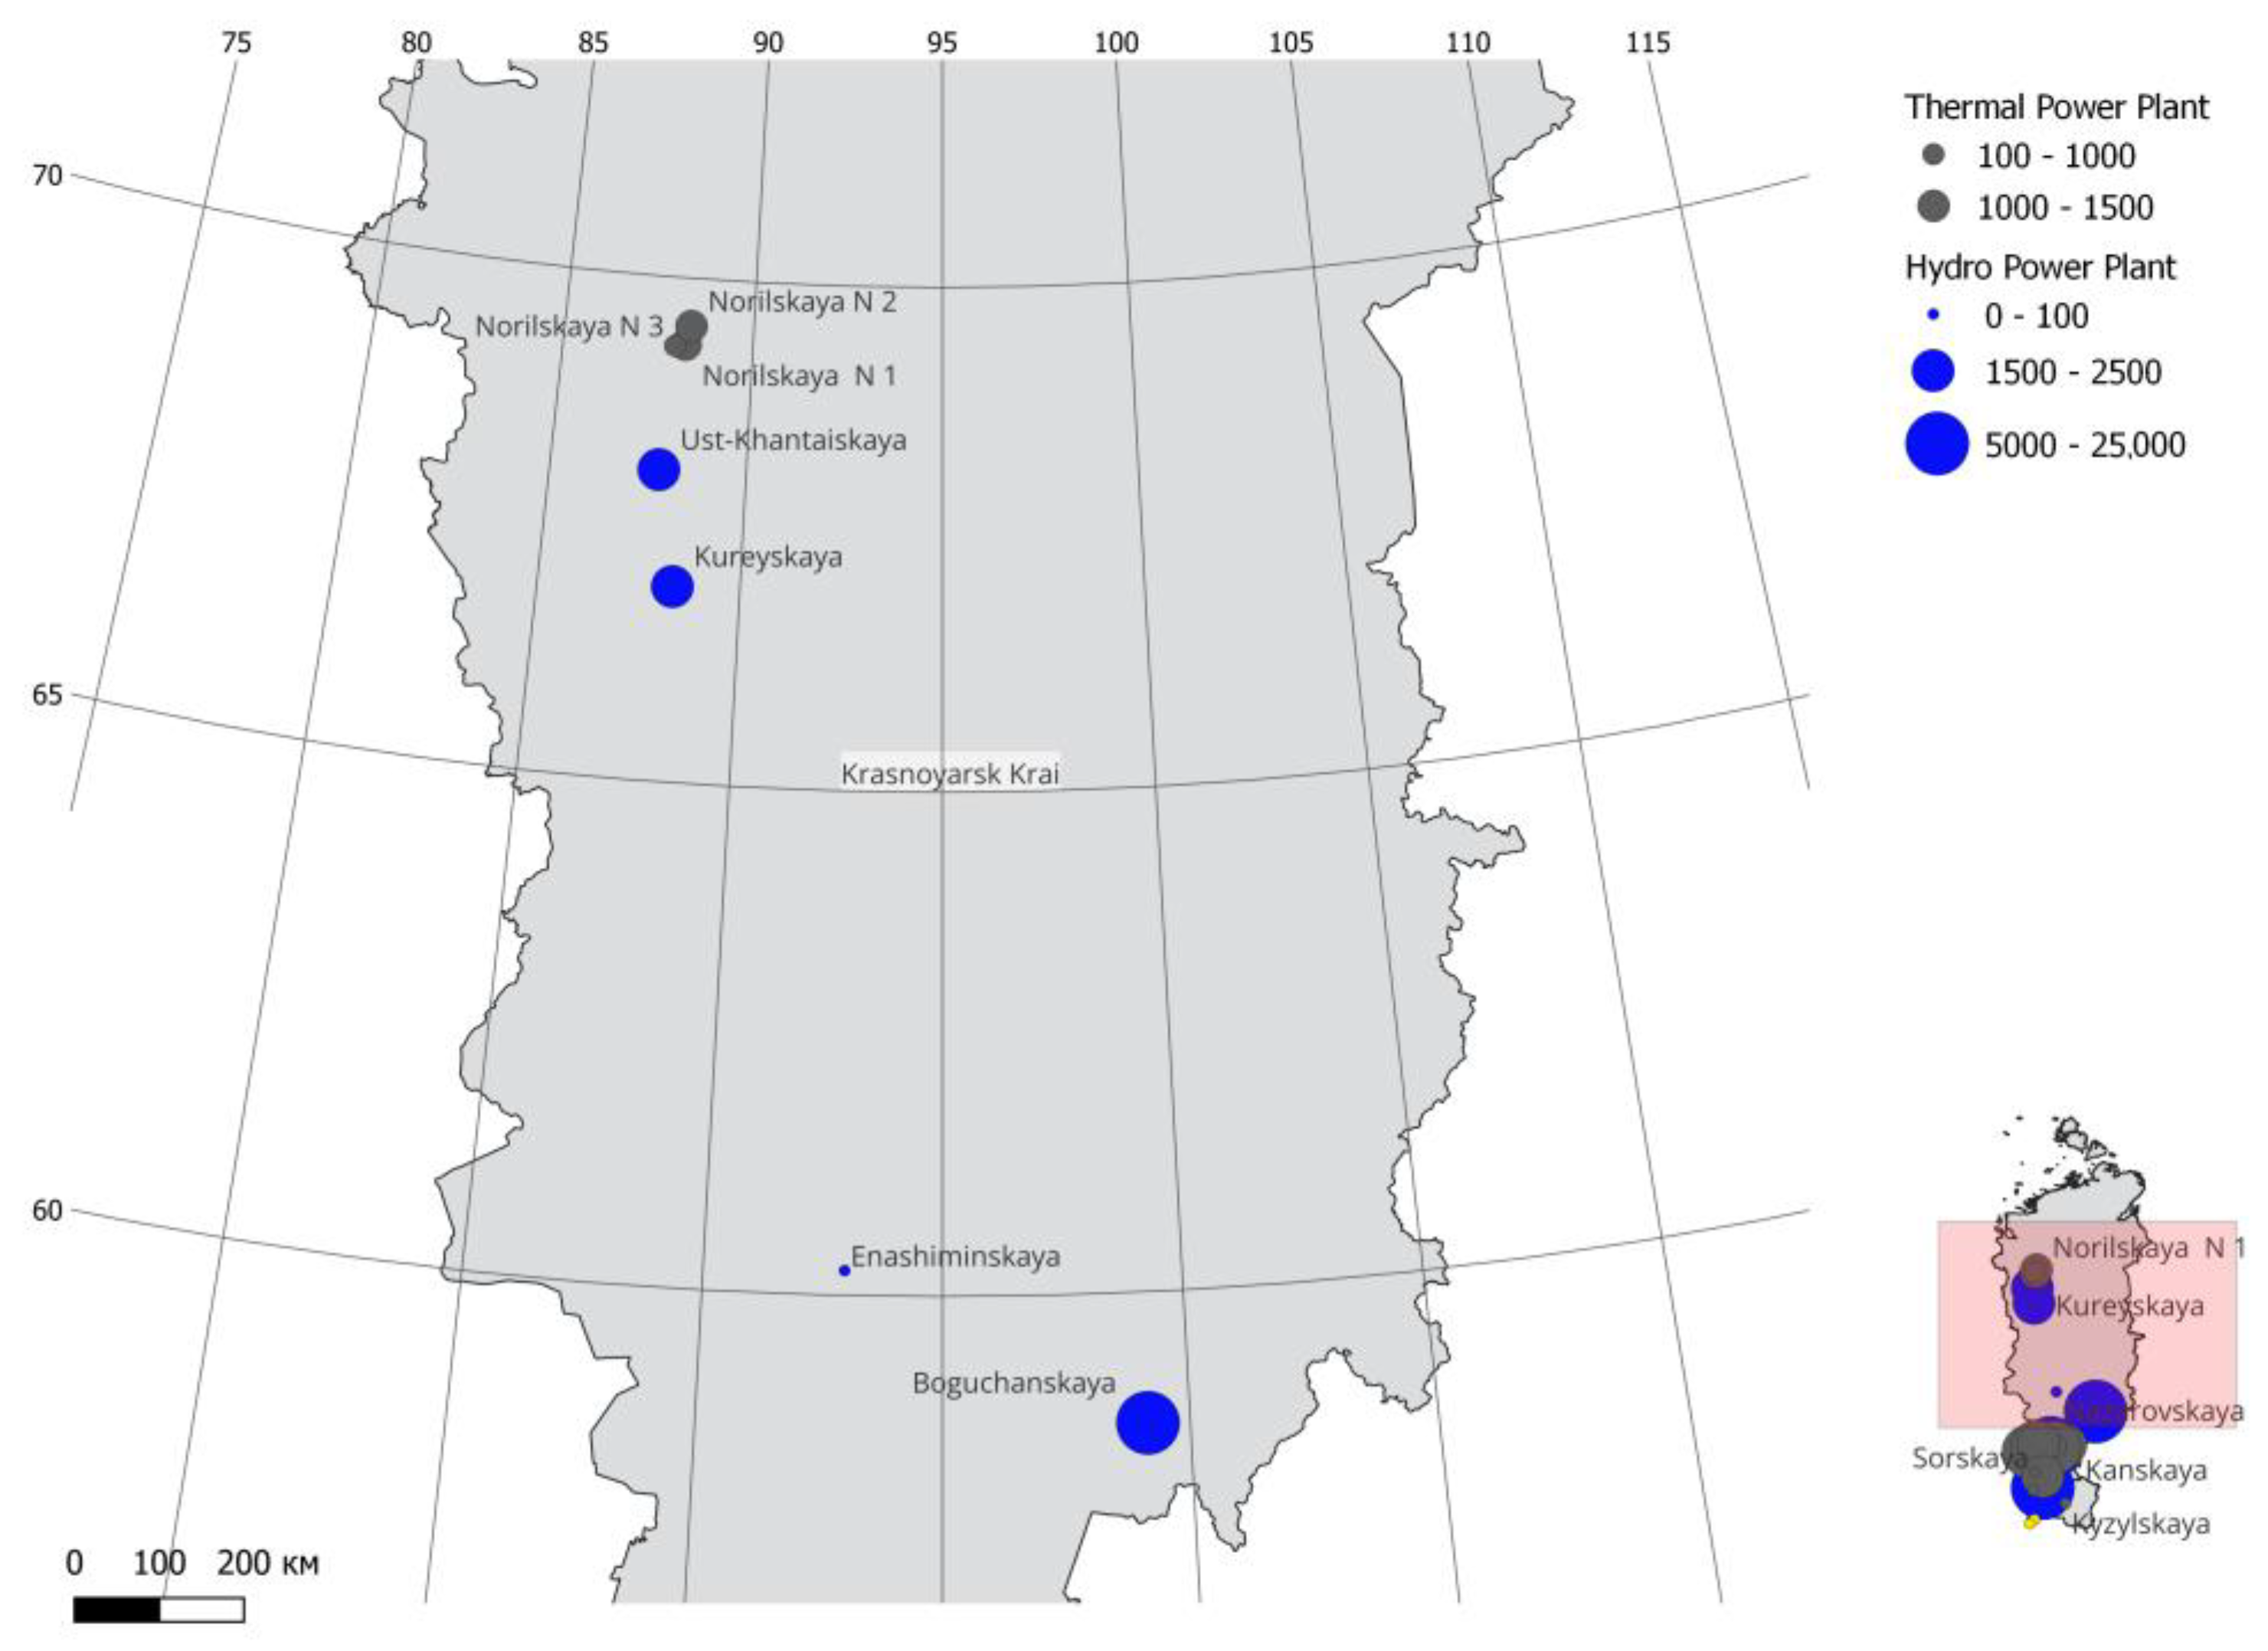
3.1. Electricity Generation
3.2. Heat Generation
3.3. The Impact of Energy Production on the Quality of Atmospheric Air
3.3.1. Electricity Generation
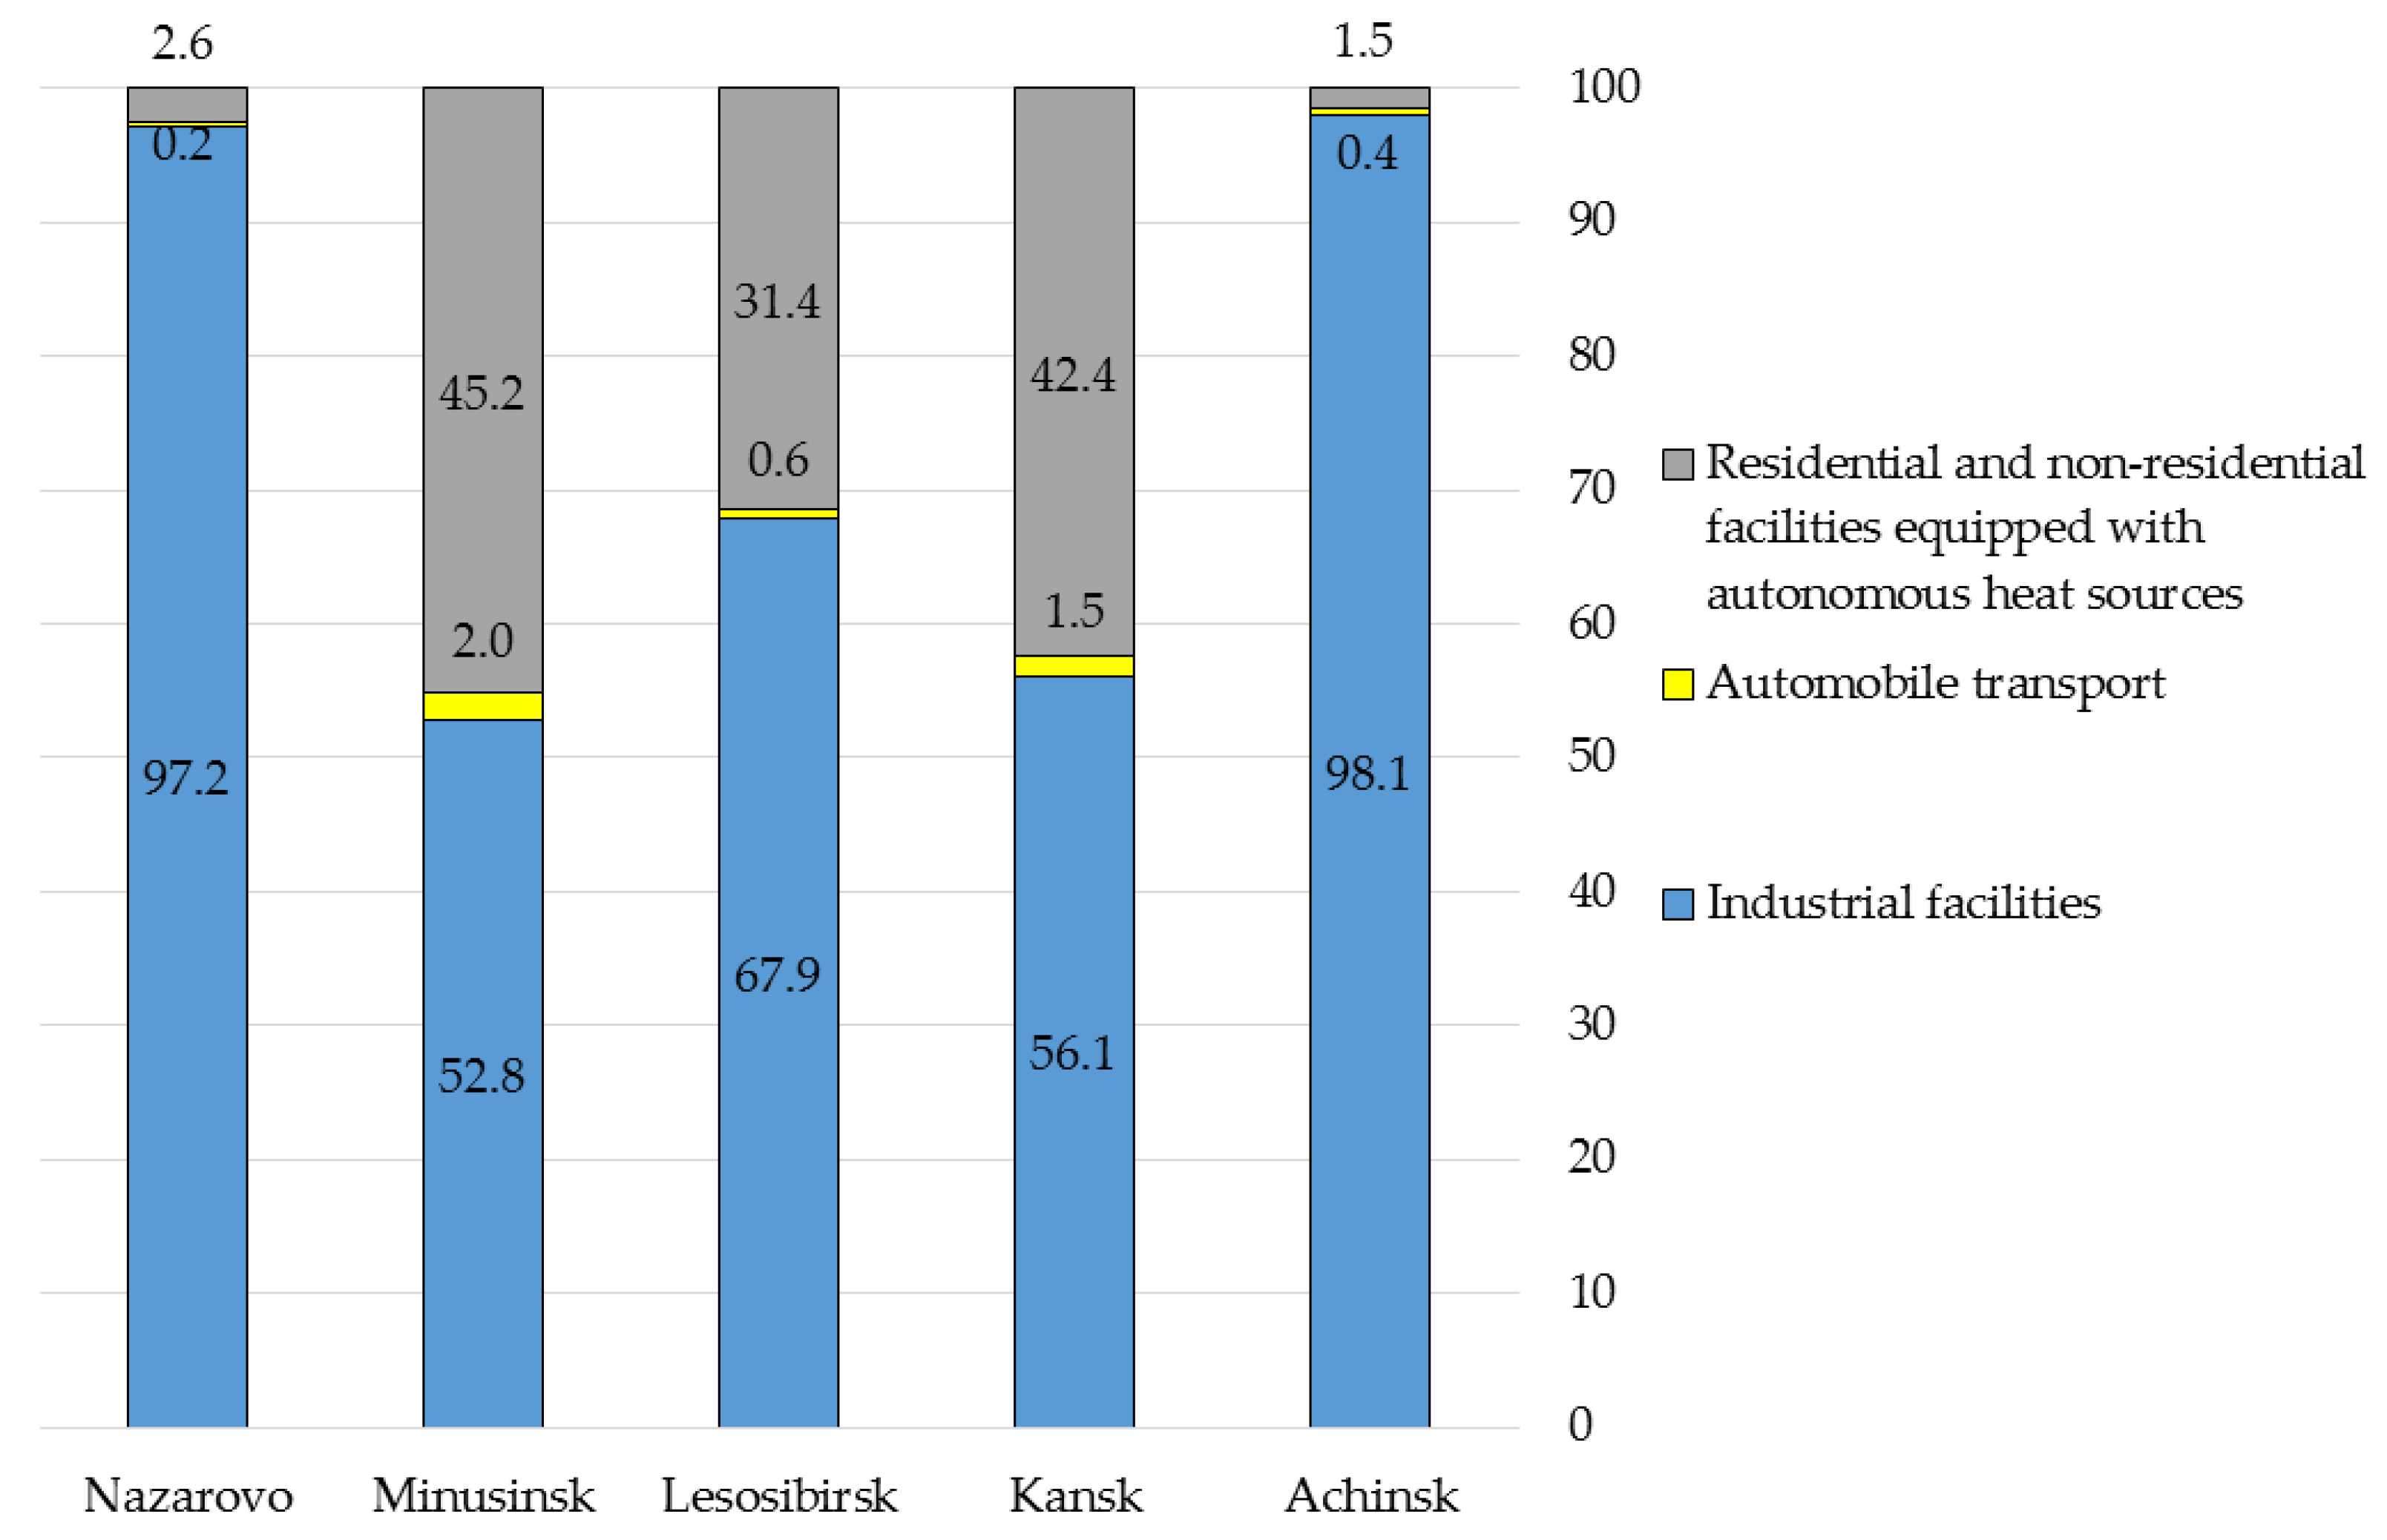
3.3.2. Heat Generation
3.4. Social and Economic Effects of Energy Generation
3.4.1. Public Health
3.4.2. Economic Effects
4. Conclusions
Author Contributions
Funding
Data Availability Statement
Acknowledgments
Conflicts of Interest
References
- Mahmud, M.A.P.; Farjana, S.H. Comparative Life Cycle Environmental Impact Assessment of Renewable Electricity Generation Systems: A Practical Approach towards Europe, North America and Oceania. Renew. Energy 2022, 193, 1106–1120. [Google Scholar] [CrossRef]
- Nugent, D.; Sovacool, B.K. Assessing the Lifecycle Greenhouse Gas Emissions from Solar PV and Wind Energy: A Critical Meta-Survey. Energy Policy 2014, 65, 229–244. [Google Scholar] [CrossRef]
- Amponsah, N.Y.; Troldborg, M.; Kington, B.; Aalders, I.; Hough, R.L. Greenhouse Gas Emissions from Renewable Energy Sources: A Review of Lifecycle Considerations. Renew. Sustain. Energy Rev. 2014, 39, 461–475. [Google Scholar] [CrossRef]
- Gorbacheva, N. True Value of Electricity in Siberia: Cost-Benefit Analysis. HSE Econ. J. 2020, 24, 340–371. [Google Scholar] [CrossRef]
- Ortiz, P.S.; Flórez-Orrego, D.; de Oliveira Junior, S.; Filho, R.M.; Osseweijer, P.; Posada, J. Unit Exergy Cost and Specific CO2 Emissions of the Electricity Generation in the Netherlands. Energy 2020, 208, 118279. [Google Scholar] [CrossRef]
- Rojas-Rueda, D.; Morales-Zamora, E.; Alsufyani, W.A.; Herbst, C.H.; AlBalawi, S.M.; Alsukait, R.; Alomran, M. Environmental Risk Factors and Health: An Umbrella Review of Meta-Analyses. Int. J. Environ. Res. Public Health 2021, 18, 704. [Google Scholar] [CrossRef]
- Chen, X.; Shao, S.; Tian, Z.; Xie, Z.; Yin, P. Impacts of Air Pollution and Its Spatial Spillover Effect on Public Health Based on China’s Big Data Sample. J. Clean. Prod. 2017, 142, 915–925. [Google Scholar] [CrossRef]
- Sun, H.; Leng, Z.; Zhao, H.; Ni, S.; Huang, C. The Impact of Air Pollution on Urban Residents’ Health Expenditure: Spatial Evidence from Yangtze River Delta, China. Air Qual. Atmos. Health 2021, 14, 343–350. [Google Scholar] [CrossRef]
- Clancy, L.; Goodman, P.; Sinclair, H.; Dockery, D.W. Effect of Air-Pollution Control on Death Rates in Dublin, Ireland: An Intervention Study. Lancet 2002, 360, 1210–1214. [Google Scholar] [CrossRef]
- Brown, K.E.; Henze, D.K.; Milford, J.B. Accounting for Climate and Air Quality Damages in Future U.S. Electricity Generation Scenarios. Environ. Sci. Technol. 2013, 47, 3065–3072. [Google Scholar] [CrossRef]
- Hou, G.; Sun, H.; Jiang, Z.; Pan, Z.; Wang, Y.; Zhang, X.; Zhao, Y.; Yao, Q. Life Cycle Assessment of Grid-Connected Photovoltaic Power Generation from Crystalline Silicon Solar Modules in China. Appl. Energy 2016, 164, 882–890. [Google Scholar] [CrossRef]
- Grachev, V.A.; Plyamina, O.V. Environmental Performance of Various Methods of Electric Power Generation. At. Energiya 2017, 123, 160–164. [Google Scholar]
- Greenhouse Gas Emissions from Energy Data Explorer—Data Tools. Available online: https://www.iea.org/data-and-statistics/data-tools/greenhouse-gas-emissions-from-energy-data-explorer (accessed on 29 November 2022).
- Craig, C.A.; Feng, S. Exploring Utility Organization Electricity Generation, Residential Electricity Consumption, and Energy Efficiency: A Climatic Approach. Appl. Energy 2017, 185, 779–790. [Google Scholar] [CrossRef]
- Zhang, M.; Liu, X.; Wang, W.; Zhou, M. Decomposition Analysis of CO2 Emissions from Electricity Generation in China. Energy Policy 2013, 52, 159–165. [Google Scholar] [CrossRef]
- Dong, K.; Sun, R.; Hochman, G. Do Natural Gas and Renewable Energy Consumption Lead to Less CO2 Emission? Empirical Evidence from a Panel of BRICS Countries. Energy 2017, 141, 1466–1478. [Google Scholar] [CrossRef]
- Apt, J. The Other Reason to Shift Away from Coal: Air Pollution That Kills Thousands Every Year. Available online: http://theconversation.com/the-other-reason-to-shift-away-from-coal-air-pollution-that-kills-thousands-every-year-78874 (accessed on 22 November 2022).
- Ladage, S.; Blumenberg, M.; Franke, D.; Bahr, A.; Lutz, R.; Schmidt, S. On the Climate Benefit of a Coal-to-Gas Shift in Germany’s Electric Power Sector. Sci. Rep. 2021, 11, 11453. [Google Scholar] [CrossRef]
- Revich, B.A. Assessment of the Effect Produced by the Fuel and Energy Complex on the Environment and Health. Stud. Russ. Econ. Dev. 2010, 21, 403–410. [Google Scholar] [CrossRef]
- Wang, Y. The Analysis of the Impacts of Energy Consumption on Environment and Public Health in China. Energy 2010, 35, 4473–4479. [Google Scholar] [CrossRef]
- Bhattacharya, M.; Awaworyi Churchill, S.; Paramati, S.R. The Dynamic Impact of Renewable Energy and Institutions on Economic Output and CO2 Emissions across Regions. Renew. Energy 2017, 111, 157–167. [Google Scholar] [CrossRef]
- Singh, N.; Nyuur, R.; Richmond, B. Renewable Energy Development as a Driver of Economic Growth: Evidence from Multivariate Panel Data Analysis. Sustainability 2019, 11, 2418. [Google Scholar] [CrossRef]
- Lambert, R.J.; Silva, P.P. The Challenges of Determining the Employment Effects of Renewable Energy. Renew. Sustain. Energy Rev. 2012, 16, 4667–4674. [Google Scholar] [CrossRef]
- Wei, M.; Patadia, S.; Kammen, D.M. Putting Renewables and Energy Efficiency to Work: How Many Jobs Can the Clean Energy Industry Generate in the US? Energy Policy 2010, 38, 919–931. [Google Scholar] [CrossRef]
- Çelik, O. Assessment of the Relationship between Renewable Energy and Employment of the United States of America: Empirical Evidence from Spectral Granger Causality. Environ. Sci. Pollut. Res. 2021, 28, 13047–13054. [Google Scholar] [CrossRef]
- Hillebrand, B.; Butterman, H.; Behringer, J.; Bleuel, M. The Expansion of Renewable Energies and Employment Effects in Germany. Energy Policy 2006, 34, 3484–3494. [Google Scholar] [CrossRef]
- District Heating—Analysis. Available online: https://www.iea.org/reports/district-heating (accessed on 29 November 2022).
- Global Electricity Review 2022. Available online: https://ember-climate.org/insights/research/global-electricity-review-2022/ (accessed on 29 November 2022).
- Power Sector Emissions Jumped to Record as World Turned to Coal. 2022. Available online: https://www.bnnbloomberg.ca/power-sector-emissions-jumped-to-record-as-world-turned-to-coal-1.1744947 (accessed on 18 November 2022).
- Diluiso, F.; Walk, P.; Manych, N.; Cerutti, N.; Chipiga, V.; Workman, A.; Ayas, C.; Cui, R.Y.; Cui, D.; Song, K.; et al. Coal Transitions—Part 1: A Systematic Map and Review of Case Study Learnings from Regional, National, and Local Coal Phase-out Experiences. Environ. Res. Lett. 2021, 16, 113003. [Google Scholar] [CrossRef]
- Farsaei, A.; Syri, S.; Olkkonen, V.; Khosravi, A. Unintended Consequences of National Climate Policy on International Electricity Markets—Case Finland’s Ban on Coal-Fired Generation. Energies 2020, 13, 1930. [Google Scholar] [CrossRef]
- Kryukov, V.A.; Suslov, N.I.; Kryukov, Y.V. Asian Russia’s Energy Complex in Changing World. World Econ. Int. Relat. 2021, 65, 101–128. [Google Scholar] [CrossRef]
- Veselov, F.V.; Erokhina, I.V.; Makarova, A.S.; Solyanik, A.I.; Urvantseva, L.V. Scales and Consequences of Deep Decarbonization of the Russian Electric Power Industry. Teploenergetika 2022, 10, 32–44. [Google Scholar] [CrossRef]
- Porfiryev, B.N. Effective Action Strategy to Cope with Climate Change and Its Impact on Russia’s Economy. Stud. Russ. Econ. Dev. 2019, 30, 3–16. [Google Scholar] [CrossRef]
- Porfiryev, B.; Shirov, A.; Kolpakov, K. Low-Carbon Strategy: Prospects for the Russian Economy. World Econ. Int. Relat. 2020, 9, 15–25. [Google Scholar] [CrossRef]
- Gorbacheva, N.V. Siberia Energy Choice: Cost-Benefit Analysis; Institute of Economics and Industrial Engineering: Novosibirsk, Russia, 2020. [Google Scholar]
- Report on the State of the Heating and District Heating in the Russian Federation in 2020. Available online: https://minenergo.gov.ru/node/22832 (accessed on 22 November 2022).
- Gonzalez-Salazar, M.; Langrock, T.; Koch, C.; Spieß, J.; Noack, A.; Witt, M.; Ritzau, M.; Michels, A. Evaluation of Energy Transition Pathways to Phase out Coal for District Heating in Berlin. Energies 2020, 13, 6394. [Google Scholar] [CrossRef]
- Müller, K. Heat Pipelines and Climate Camps: Coal Mining’s in/Visible Infrastructure. Extr. Ind. Soc. 2021, 8, 100944. [Google Scholar] [CrossRef]
- Veselova, E.S. “Yenisei Siberia”—The first macro-region of Russia. Eko 2018, 6, 20–37. [Google Scholar]
- Romanov, A.A.; Gusev, B.A.; Leonenko, E.V.; Tamarovskaya, A.N.; Vasiliev, A.S.; Zaytcev, N.E.; Philippov, I.K. Graz Lagrangian Model (GRAL) for Pollutants Tracking and Estimating Sources Partial Contributions to Atmospheric Pollution in Highly Urbanized Areas. Atmosphere 2020, 11, 1375. [Google Scholar] [CrossRef]
- Program and Scheme of Perspective Development of the Krasnoyarsk Krai Electric Power Industry for the Period 2022–2026. Available online: http://www.consultant.ru/regbase/cgi/online.cgi?req=doc;base=RLAW123;n=269443#8sNMpQTDyvQaPUzT (accessed on 16 November 2022).
- Program and Scheme of Perspective Development of the KHAKASSIA REPUBLIC Electric Power Industry for the Period 2022–2026. Available online: https://r-19.ru/documents/7891/115056.html (accessed on 16 November 2022).
- Program and Scheme of Perspective Development of the Tuva Republic Electric Power Industry for the Period 2018–2022. Available online: https://docs.cntd.ru/document/550210025 (accessed on 16 November 2022).
- Record-Low Water Level in the Yenisei Forced Power Engineers to Redistribute Load at Power Plants. Available online: http://vesti-19.ru/news/19586-rekordno-nizkiy-uroveny-vodi-v-enisee-zastavil-energetikov-pereraspredelity-nagruzku-na-stantsii/ (accessed on 16 November 2022).
- Autonomous Hybrid Power Plants in the Republic of Tyva. Available online: https://www.hevelsolar.com/projects/avtonomnye-gibridnye-energoustanovki-v-respublike-tyva/ (accessed on 18 November 2022).
- Abakan Solar Power Plant. Available online: https://enplusgroup.com/ru/company/map/abakan-solar-power-plant-abakan-spp/ (accessed on 16 November 2022).
- Semikashev, V.V. Heat Supply in Russia: Current State and Problems Investment Development. Eco 2019, 9, 23–47. [Google Scholar] [CrossRef]
- State Report on the State and Use of Mineral Resources of Russia in 2020. Available online: https://www.mnr.gov.ru/docs/gosudarstvennye_doklady/gosudarstvennyy_doklad_o_sostoyanii_i_ispolzovanii_mineralno_syrevykh_resursov_2020/ (accessed on 16 November 2022).
- Gorbacheva, N.V. Coal-Fired Power in the New Industrial Development. World Econ. Int. Relat. 2016, 60, 42–51. [Google Scholar] [CrossRef]
- Report on the State and Use of Water Resources of the Russian Federation in 2020. Available online: http://www.priroda.ru/lib/ (accessed on 16 November 2022).
- Scientists Assessed the Impact of the Emergency at Norilsk CHPP-3 on the Ecosystem. Available online: https://www.interfax.ru/russia/740879 (accessed on 18 November 2022).
- State Report on the State and Protection of the Environment in the Krasnoyarsk Krai in 2020. Available online: http://www.mpr.krskstate.ru/envir/page5849 (accessed on 18 November 2022).
- Heat Supply Schemes of Krasnoyarsk. Available online: http://www.admkrsk.ru/citytoday/municipal/energy/sezon1/pages/default.aspx (accessed on 18 November 2022).
- Saneev, B.G.; Maysyuk, E.P. Assessment of the Impact of Fuel and Energy Sector of the Irkutsk Region on the Environment. Bull. Baikal State Univ. 2018, 28, 249–256. [Google Scholar] [CrossRef]
- Saneev, B.G.; Maysyuk, E.P.; Muzychuk, S.J. Environmental Assessment of Applying Innovations in the Energy Sector of the Region (Based on Irkutsk Region). J. Volgogr. State Univ. Econ. 2020, 22, 95–107. [Google Scholar] [CrossRef]
- SGK Will Replace and Reconstruct 121 Obsolete Boiler Plants by 2025. Available online: https://sibgenco.online/news/element/kak-umenshit-na-sotnyu-kolichestvo-kotelnykh-v-gorodakh-sgk-k-2025-godu (accessed on 18 November 2022).
- Conclusions on the Summary Calculations of Atmospheric Air Pollution. Available online: http://www.krasecology.ru/About/SummaryCalculations (accessed on 18 November 2022).
- Pyzhev, A.I.; Sharafutdinov, R.A.; Zander, E.V. Environmental Consequences of Economic Development of Large Industrial Cities in Resource Regions (A Case study of Krasnoyarsk, Russia). Eco 2021, 7, 4–55. [Google Scholar] [CrossRef]
- Heat Supply Schemes of Nazarovo. Available online: http://www.nazarovograd.ru/gov/arch/doc/3/28.html (accessed on 18 November 2022).
- Sharypovo Development Strategy. Available online: http://www.gorodsharypovo.ru/page/strategiya-razvitiya-do-2030-goda/ (accessed on 18 November 2022).
- Semikashev, V.V.; Gaivoronskaya, M.S. Analysis of the Present and Prospects of Gasification in Russia for the Period up to 2030. Stud. Russ. Econ. Dev. 2022, 33, 91–100. [Google Scholar] [CrossRef]


| Tyva Republic | Khakassia Republic | Krasnoyarsk Krai | |
|---|---|---|---|
| Consumption | 802.5 | 16,588 | 54,306.4 |
| Power plant production | 37.2 | 30,086 | 65,406.4 |
| Receiving electricity from adjacent regions | 889.7 | NA | 6352.8 |
| Transmission of electric power to adjacent regions | –124.4 | –13,498 | –17,452.8 |
| Region | Heat Generation Facilities (Thermal Power Plant) | Main Fuel Type |
|---|---|---|
| Tyva Republic | Kyzylskaya | Kaa-Khem hard coal |
| Khakassia Republic | Abakanskaya Abazinskaya Sorskaya | Irsha-Borodinsky, Chernogorsky brown coal grades |
| Krasnoyarsk Krai | Berezovskaya Nazarovskya Krasnoyarskaya GRES-2 Krasnoyarskaya No. 1 Krasnoyarskaya No. 2 Krasnoyarskaya No. 3 Kanskaya Zheleznogorskaya Minusinskaya JSC RUSAL-Achinsk LLC Teplo-Sbyt-Servis | Berezovsky, Nazarovsky, Borodinsky, Irsha-Borodinsky brown coal grades |
| Norilsk industrial district | Norilskaya No. 1 Norilskaya No. 2 Norilskaya No. 3 | Natural gas |
| Region | Particulate Matter | Sulfur Dioxide | Nitrogen Oxide | Carbon Dioxide |
|---|---|---|---|---|
| Tyva Republic | 94.8 | 99.6 | 96.0 | 98.7 |
| Khakassia Republic | 46.6 | 54.3 | 74.8 | 16.7 |
| Krasnoyarsk Krai | 60.2 | 4.9 | 65.7 | 23.6 |
| Municipality | Generation Facility (Thermal Power Plant) | Emissions of Pollutants from the Generation Facility in 2020, Thousand tons | Share of Generation Facility Emissions in the Total Emissions of the Municipality, % |
|---|---|---|---|
| Kyzyl | Kyzylskaya | 1.1 | 25.8 |
| Abakan | Abakanskaya | 11.2 | 92.6 |
| Abaza | Abazinskaya | 1.6 | 69.6 |
| Sharypovo district | Berezovskaya | 13.1 | 90.9 |
| Nazarovo | Nazarovskya | 29.4 | 92.7 |
| Krasnoyarsk | Krasnoyarsk No. 1, No. 2, No. 3 | 36.7 | 33.5 |
| Kansk | Kanskaya | 2.1 | 16 |
| Zelenogorsk | Krasnoyarskaya GRES-2 | 3.9 | 19.6 |
| Minusinsk district | Minusinskaya | 2.9 | 80.6 |
| Substance | Total for Registered Energy Sources | Thermal Power Plants | Recorded Boiler Houses | ||
|---|---|---|---|---|---|
| Tons per Year | Tons per Year | % | Tons per Year | % | |
| Nitrogen dioxide | 9985.8 | 8219.7 | 82.3 | 1766.1 | 17.7 |
| Nitrogen oxide | 4664.5 | 4378.3 | 93.9 | 286.2 | 6.1 |
| Carbon (soot) | 1105.5 | 238.2 | 21.5 | 867.2 | 78.4 |
| Sulfur dioxide | 25,515.2 | 20,039.4 | 78.5 | 5475.8 | 21.5 |
| Carbon oxide | 7356.1 | 1554.6 | 21.1 | 5801.5 | 78.9 |
| Benzapyrene | 0.0 | 0.0 | 50.0 | 0.0 | 50.0 |
| Inorganic dust: 70–20% silicon dioxide | 19,183.5 | 14,280.7 | 74.4 | 4902.7 | 25.6 |
| Total | 67,810.5 | 48,710.9 | 71.8 | 19,099.6 | 28.2 |
| Region | Population | 2015 | 2016 | 2017 | 2018 | 2019 | 2020 |
|---|---|---|---|---|---|---|---|
| Russian Federation | All population | 337.9 | 351.6 | 353.5 | 359.8 | 356.2 | 370.6 |
| Children (0–14 years old) | 1157.6 | 1173.8 | 1168.3 | 1171 | 1160 | 1020 | |
| Tyva Republic | All population | 296.3 | 260.4 | 260.2 | 258.5 | 266.8 | 259.4 |
| Children (0–14 years old) | 670.8 | 535.5 | 545.8 | 543.6 | 570 | 511 | |
| Khakassia Republic | All population | 311.7 | 348 | 370.6 | 368.2 | 378.1 | 364.9 |
| Children (0–14 years old) | 898.2 | 1077.6 | 1155.3 | 1145.5 | 1165 | 961 | |
| Krasnoyarsk Krai | All population | 276.1 | 289.3 | 297 | 294.5 | 296.3 | 336 |
| Children (0–14 years old) | 983 | 992.3 | 997 | 996.1 | 964 | 877 |
| Region | Share of the Activity, % | Wages in Sector to the Average Wage in the Economy | ||
|---|---|---|---|---|
| In Gross Value Added | in Employment (Including Coal Mining) | All Economy | Industry Average | |
| Tyva Republic | 2.2 | 2 (2.6) | 1.01 | 0.75 |
| Khakassia Republic | 11.8 | 3 (5.2) | 1.27 | 2.17 |
| Krasnoyarsk Krai | 3.3 | 3.2 (3.6) | 1.08 | 1.27 |
| Region | Fuel Type | Unit of Measure | Calorific Value, Kcal per Unit | Price, RUB per Unit | Unit Price, RUB per Kcal |
|---|---|---|---|---|---|
| Tyva Republic | 2BR Coal | kg | 4100 | 2.868 | 0.0007 |
| Khakassia Republic | 3.017 | 0.0007 | |||
| Krasnoyarsk Krai | 2.518 | 0.0006 | |||
| Tyva Republic | Mixed firewood | kg | 2600 | 2.260 | 0.0009 |
| Khakassia Republic | 1.709 | 0.0007 | |||
| Krasnoyarsk Krai | 3.489 | 0.0014 | |||
| Tyva Republic | Pellets | kg | 4100 | 6.400 | 0.0016 |
| Khakassia Republic | 0.0016 | ||||
| Krasnoyarsk Krai | 0.0016 | ||||
| Tyva Republic | Electricity | kW per hour | 864 | 3.650 | 0.0042 |
| Khakassia Republic | 2.360 | 0.0027 | |||
| Krasnoyarsk Krai | 2.830 | 0.0033 |
| City | Difference in Cost Compared to Coal, RUB per Kcal | Heating Rate, Gcal per One Square Meter of Total Living Space per Month | Additional Household Spending on Heating, RUB per Year | Stoves in the Private Sector are Counted, pcs | Total Cost of Switching to a more Environmentally Friendly Fuel, RUB One Million | |
|---|---|---|---|---|---|---|
| Achinsk | Pellets | 0.001 | 0.0504 | 45,360 | 6361 | 288.5 |
| Electricity | 0.0027 | 122,472 | 779.0 | |||
| Kansk | Pellets | 0.001 | 0.0494 | 44,460 | 7060 | 313.9 |
| Electricity | 0.0027 | 120,042 | 847.5 | |||
| Minusinsk | Pellets | 0.001 | 0.0234 | 21,060 | 11,747 | 247.4 |
| Electricity | 0.0027 | 56,862 | 668.0 | |||
| Nazarovo | Pellets | 0.001 | 0.0458 | 41,220 | 4480 | 184.7 |
| Electricity | 0.0027 | 111,294 | 498.6 | |||
Disclaimer/Publisher’s Note: The statements, opinions and data contained in all publications are solely those of the individual author(s) and contributor(s) and not of MDPI and/or the editor(s). MDPI and/or the editor(s) disclaim responsibility for any injury to people or property resulting from any ideas, methods, instructions or products referred to in the content. |
© 2022 by the authors. Licensee MDPI, Basel, Switzerland. This article is an open access article distributed under the terms and conditions of the Creative Commons Attribution (CC BY) license (https://creativecommons.org/licenses/by/4.0/).
Share and Cite
Syrtsova, E.; Pyzhev, A.; Zander, E. Social, Economic, and Environmental Effects of Electricity and Heat Generation in Yenisei Siberia: Is there an Alternative to Coal? Energies 2023, 16, 212. https://doi.org/10.3390/en16010212
Syrtsova E, Pyzhev A, Zander E. Social, Economic, and Environmental Effects of Electricity and Heat Generation in Yenisei Siberia: Is there an Alternative to Coal? Energies. 2023; 16(1):212. https://doi.org/10.3390/en16010212
Chicago/Turabian StyleSyrtsova, Ekaterina, Anton Pyzhev, and Evgeniya Zander. 2023. "Social, Economic, and Environmental Effects of Electricity and Heat Generation in Yenisei Siberia: Is there an Alternative to Coal?" Energies 16, no. 1: 212. https://doi.org/10.3390/en16010212
APA StyleSyrtsova, E., Pyzhev, A., & Zander, E. (2023). Social, Economic, and Environmental Effects of Electricity and Heat Generation in Yenisei Siberia: Is there an Alternative to Coal? Energies, 16(1), 212. https://doi.org/10.3390/en16010212