
Zero Waste as a Determinant of Shaping Green Economy Processes on the Example of Communes of Eastern Poland in 2010–2020

 , ,
, ,  ,
,  and
and
Abstract
1. Introduction
2. Literature Review
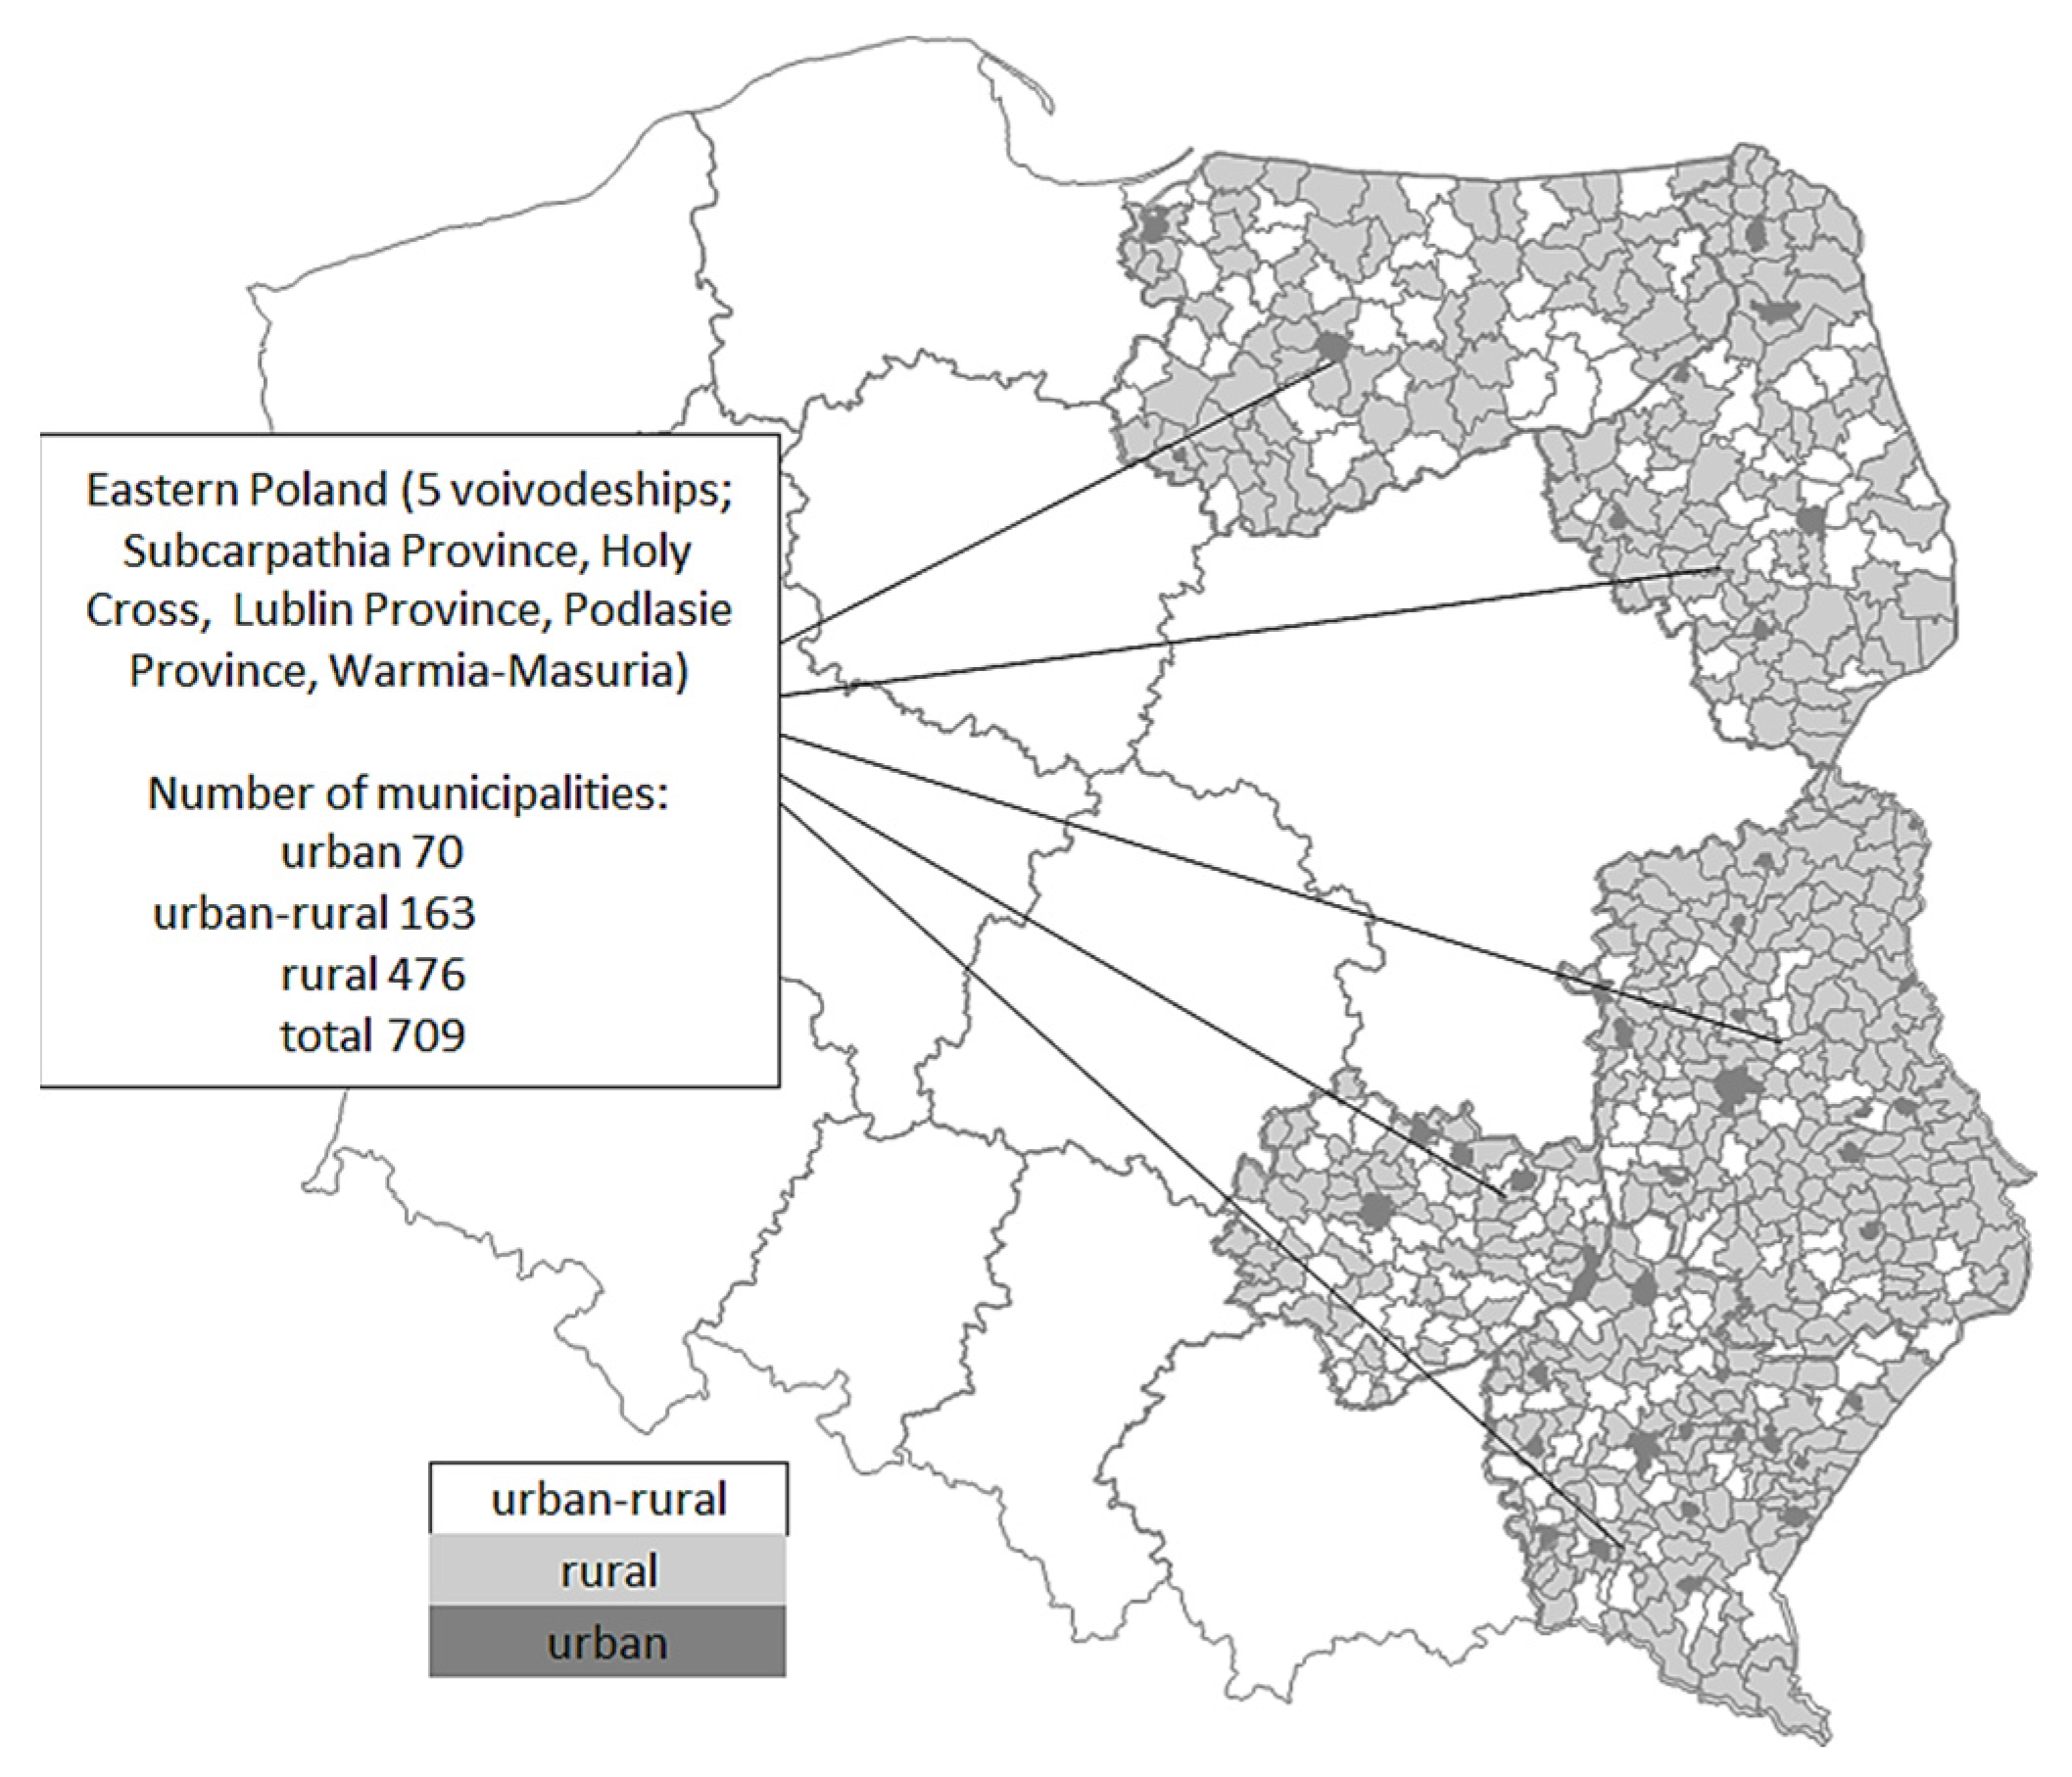
3. Materials and Methods
- (a)
- distances of objects from the pattern:
- (b)
- distances of objects from the anti-pattern:
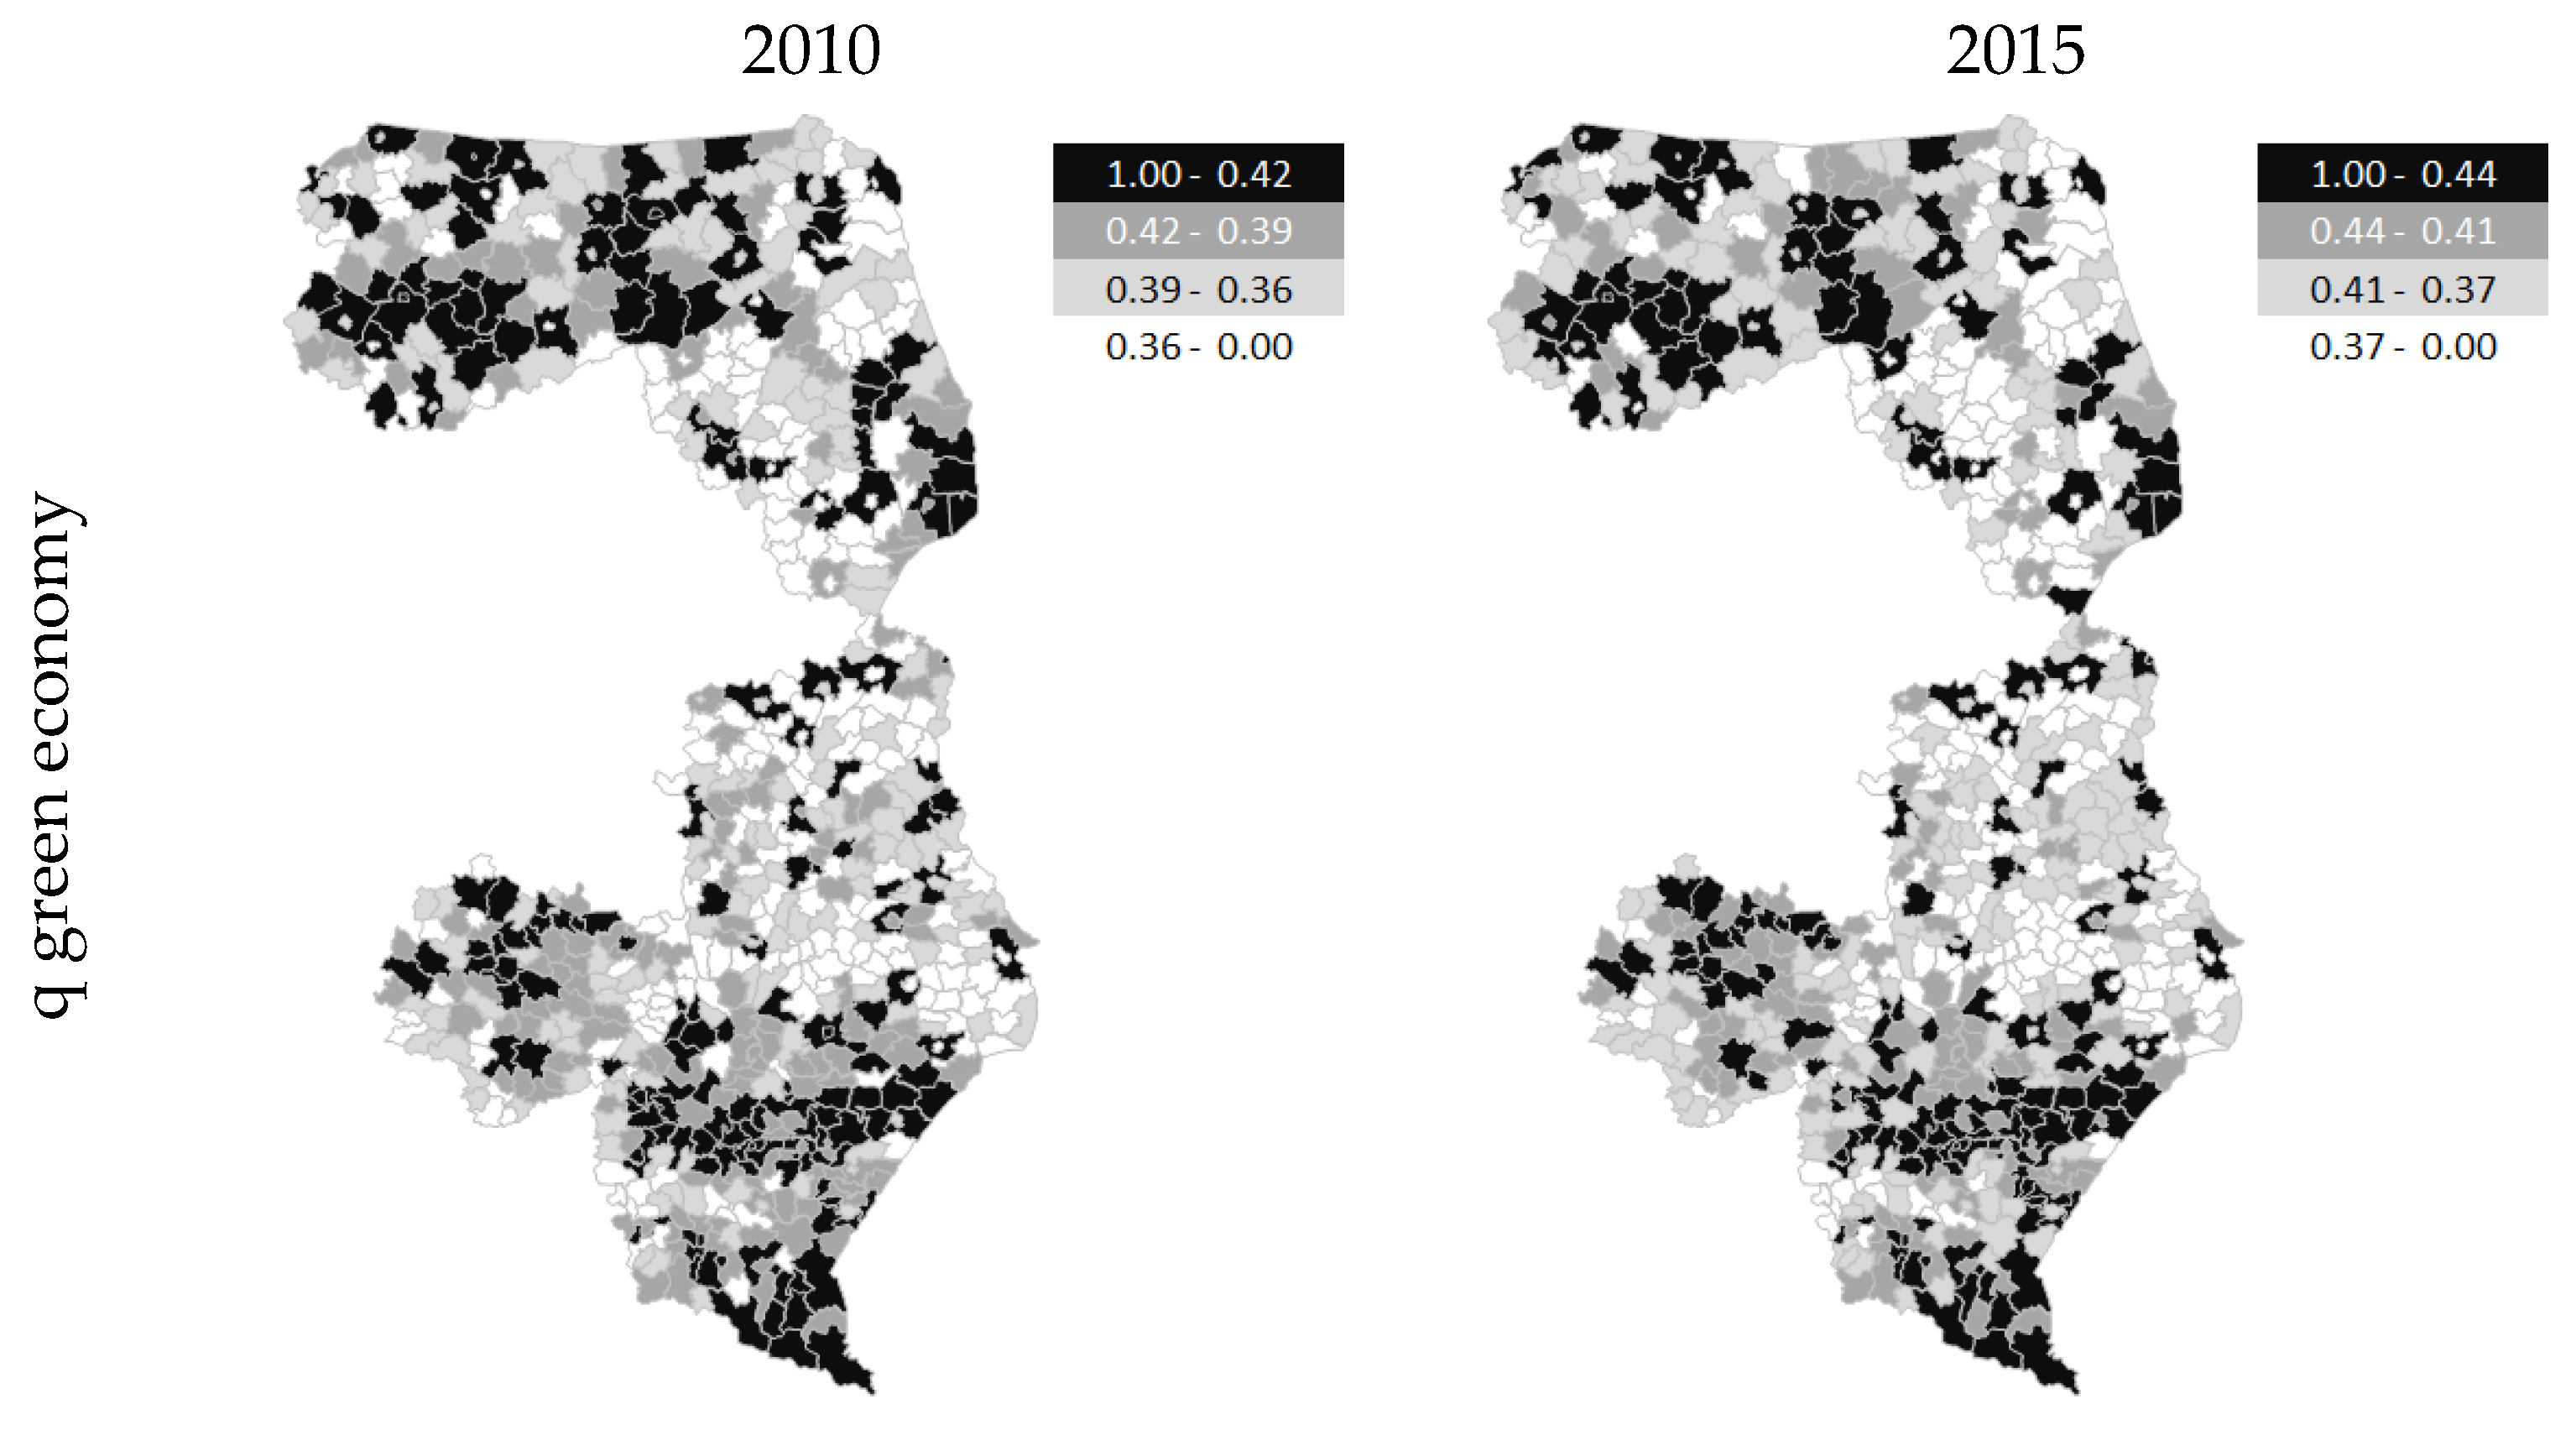
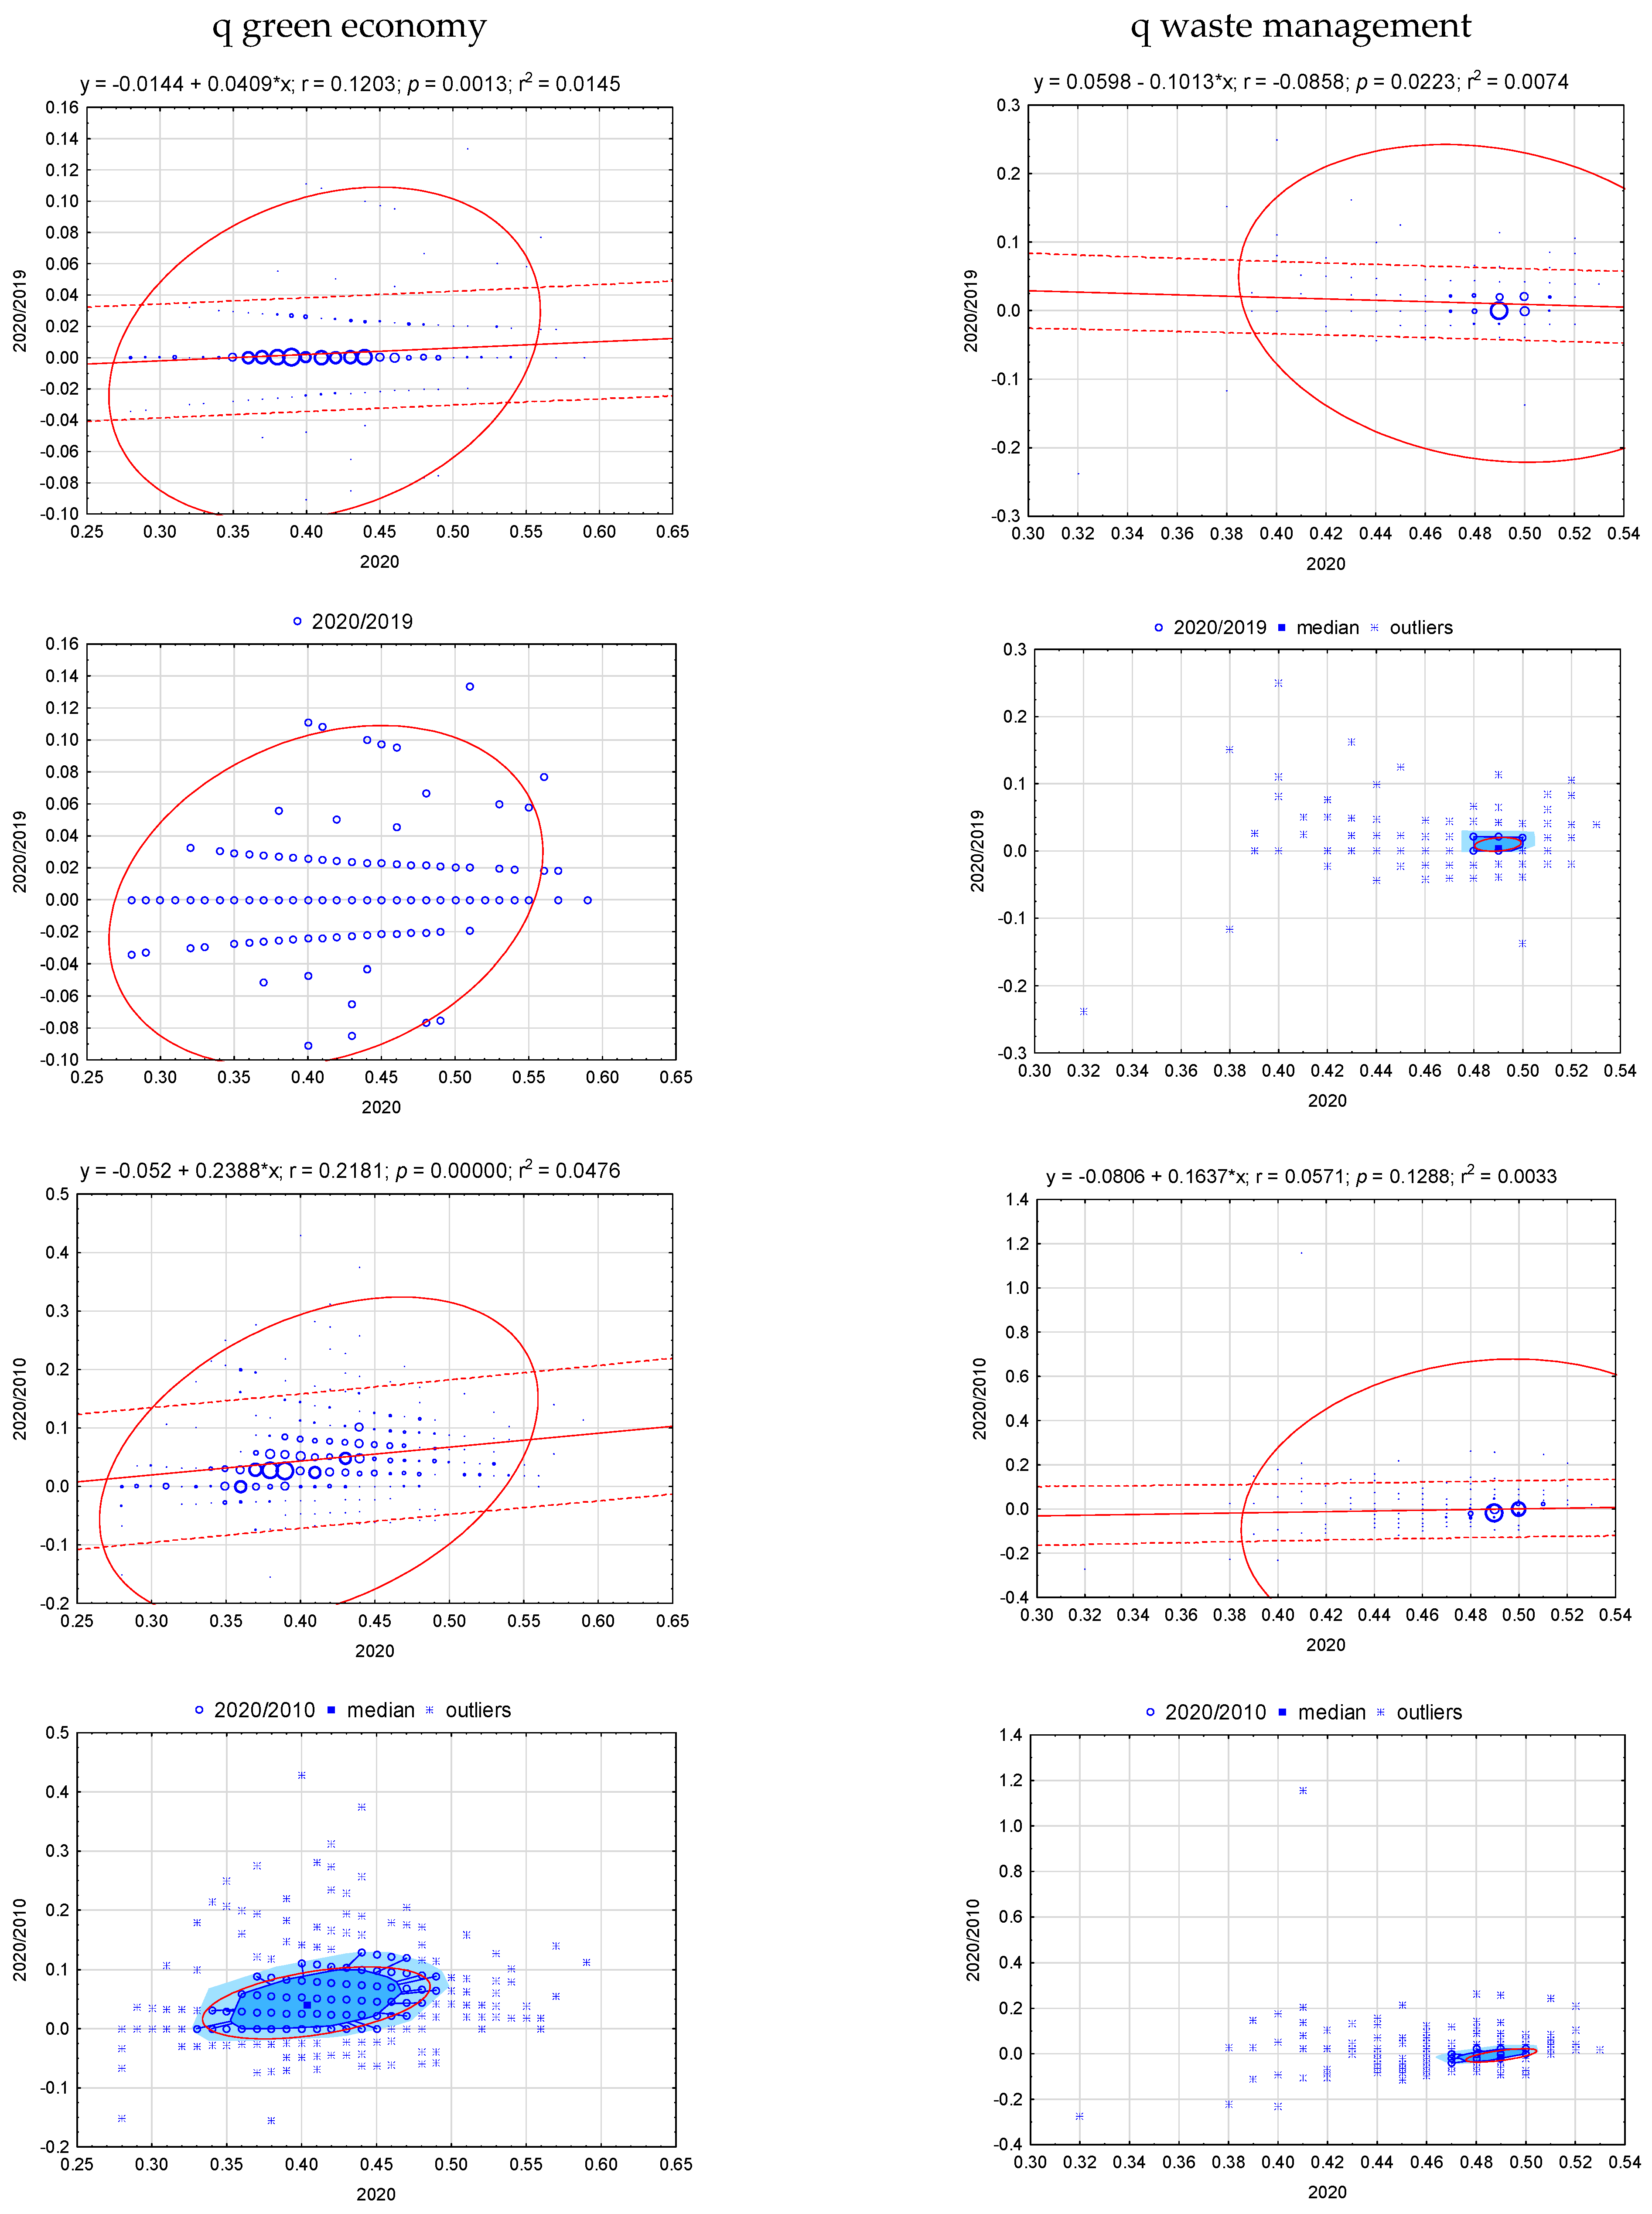
4. Results
5. Discussion
6. Conclusions
Author Contributions
Funding
Conflicts of Interest
References
- Stanny, M. Zróżnicowanie poziomu rozwoju obszarów wiejskich w Polsce a problem realizacji polityki spójności. Wieś I Rol. 2009, 4, 246–257. [Google Scholar]
- Główny Urząd Statystyczny, Urząd Statystyczny w Białymstoku. In Wskaźniki Zielonej Gospodarki w Polsce 2020; Główny Urząd Statystyczny, Urząd Statystyczny w Białymstoku: Warszawa, Poland; Białystok, Poland, 2020.
- A Toolkit of Policy Options to Support Inclusive Green Growth. OECD. Available online: https://www.undp.org/sites/g/files/zskgke326/files/publications/IGG-ToolkitAfDB-OECD-UN-WB-revised_July_2013.pdf (accessed on 13 November 2022).
- Towards a Green Economy: Pathways to Sustainable Development and Poverty Eradication. UNEP (United Nations Environment Programme). Available online: https://sustainabledevelopment.un.org/content/documents/126GER_synthesis_en.pdf (accessed on 13 November 2022).
- OECD. Interim Report of the Green Growth Strategy: Implementing our Commitment for a Sustainable Future. In Proceedings of the Meeting of the OECD Council at Ministerial Level, Paris, France, 27–28 May 2010. [Google Scholar]
- Sun, X. Green city and regional environmental economic evaluation based on entropy method and GIS. Environ. Technol. Innov. 2021, 23, 101667. [Google Scholar] [CrossRef]
- Lombardi, E. Zero Landfill is not Zero waste. BioCycle Mag. 2011, 52, 44. [Google Scholar]
- Czaplicka-Kolarz, K.; Kruczek, M. Wybrane aspekty gospodarki odpadami komunalnymi w województwie śląskim. Zesz. Nauk. Politech. Śląskiej 2018, 121, 61–73, Seria: Organizacja i Zarządzanie z. [Google Scholar]
- Parysek, J.J. Podstawy Gospodarki Lokalnej; Wydawnictwo Naukowe Uniwersytetu Adama Mickiewicza: Poznań, Poland, 2001. [Google Scholar]
- Brol, R. Rozwój lokalny—Nowa logika rozwoju gospodarczego. Pr. Nauk. Akad. Ekon. We Wrocławiu 1998, 785, 11–15. [Google Scholar]
- OECD. Towards Green Growth: Monitoring Progress OECD Indicators; OECD: Paris, France, 2011. [Google Scholar]
- Verma, S.; Kandpal, D. Green Economy and Sustainable Development: A Macroeconomic Perspective. In Environmental Sustainability and Economy; Singh, P., Verma, P., Perrotti, D., Srivastava, K.K., Eds.; Elsevier: Amsterdam, The Netherlands, 2021; pp. 325–343. [Google Scholar] [CrossRef]
- Ryszawska, B. Zielona Gospodarka w dokumentach strategicznych Unii Europejskiej. Ekon. I Sr. 2013, 3, 26–37. [Google Scholar]
- OECD. Applications of Complexity Science for Public Policy; OECD: Paris, France, 2009. [Google Scholar]
- United Nations. Contribution by the European Union and its Member States. In Proceedings of the UN Conference RIO+20, United Nations Conference on Sustainable Development, Rio de Janeiro, Brazil, 20–22 June 2012. [Google Scholar]
- Hahnel, R. Green Economics: Confronting the Ecological Crisis; M.E. Sharpe: New York, NY, USA, 1998. [Google Scholar]
- Dabyltayeva, N.; Rakhymzhan, G. The Green Economy Development Path: Overview of Economic Policy Priorities. J. Secur. Sustain. Issues 2019, 8, 643–651. [Google Scholar] [CrossRef]
- Allen, C.; Clouth, S. A Guidebook to the Green Economy; UNDESA: New York, NY, USA, 2012; pp. 6–8. [Google Scholar]
- Green Economy Definition. Available online: https://greeneconomygroup.com/company/green-economy-definition/ (accessed on 14 November 2022).
- Ayres, R.; van der Lugt, C. Manufacturing. Investing in Energy and Resource Eficiency. In Green Economy Report, Towards a Green Economy: Pathways to Sustainable Development and Poverty Eradication; UNEP: Athens, Greece, 2011. [Google Scholar]
- Mikhno, I.; Koval, V.; Shvets, G.; Garmatiuk, O.; Tamošiūnienė, R. Green Economy in Sustainable Development and Improvement of Resource Efficiency. Central Eur. Bus. Rev. 2021, 10, 99–113. [Google Scholar] [CrossRef]
- Berger, R. Strategy Consultants Gmbh. Green Growth, Green Profit: How Green Transformation Boosts Business; Palgrave Macmillan: Basingstoke, UK, 2011; p. 21. [Google Scholar]
- Newton, A.C. The green economy and the knowledge economy: Exploring the interface. Int. J. Green Econ. 2011, 5, 231. [Google Scholar] [CrossRef]
- UNEP; Green Growth; OECD. Strategia Europa. In Global Green New Deal, Green Economy; UNEP: Nairobi, Kenya; OECD: Paris, France, 2020. [Google Scholar]
- WWF. International Chamber of Commerce Living Planet Report 2010, Biodiversity, biocapacity and development. In Green Economy Roadmap. A Guide for Bussiness, Policymakers and Society; WWF International: Gland, Switzerland, 2010. [Google Scholar]
- Elimam, H. How Green Economy Contributes in Decreasing the Environment Pollution and Misuse of the Limited Resources. Environ. Pollut. 2017, 6, 10. [Google Scholar] [CrossRef][Green Version]
- Venkata Mohan, S.; Modestra, J.A.; Amulya, K.; Butti, S.K.; Velvizhi, G. Biogospodarka o obiegu zamkniętym z bioproduktami z sekwestracji CO2. Trendy Biotechnol. 2016, 34, 506–519. [Google Scholar] [CrossRef] [PubMed]
- Godlewska, J.; Sidorczuk-Pietraszko, E. Taxonomic Assessment of Transition to the Green Economy in Polish Regions. Sustainability 2019, 11, 5098. [Google Scholar] [CrossRef]
- Cato, M.S. Green Economics: An Introduction to Theory, Policy and Practice; Earthscan: London, UK, 2009. [Google Scholar]
- Domański, R. Gospodarka Przestrzenna; Wydawnictwo Naukowe PWN: Warszawa, Poland, 2002. [Google Scholar]
- Green Economy: Future Of World Economy. Available online: https://mittikerang.medium.com/green-economy-future-of-world-economy-ebc399778c21 (accessed on 14 November 2022).
- Aldieri, L.; Vinci, C.P. Green Economy and Sustainable Development: The Economic Impact of Innovation on Employment. Sustainability 2018, 10, 3541. [Google Scholar] [CrossRef]
- Genovese, A.; Acquaye, A.A.; Figueroa, A.; Koh, S.C.L. Sustainable supply chain management and the transition towards a circular economy: Evidence and some applications. Omega 2017, 66, 344–357. [Google Scholar] [CrossRef]
- Yong, R. The circular economy in China. J. Mater. Cycles Waste Manag. 2007, 9, 121–129. [Google Scholar] [CrossRef]
- D’Amato, D.; Droste, N.; Allen, B.; Kettunen, M.; Lähtinen, K.; Korhonen, J.; Leskinen, P.; Matthies, B.D.; Toppinen, A. Green, circular, bio economy: A comparative analysis of sustainability avenues. J. Clean. Prod. 2017, 168, 716–734. [Google Scholar] [CrossRef]
- Degórski, M. Gospodarka o obiegu zamkniętym circular economy—Nowe podejście w rozumieniu relacji człowiek–środowisko. Studia KPZK 2018, 183, 27–35, (Teoretyczne i aplikacyjne wyzwania współczesnej geografii społeczno-ekonomicznej). [Google Scholar]
- Santeramo, F.G. Circular and green economy: The state of the art. Heliyon 2022, 8, e09297. [Google Scholar] [CrossRef]
- Zero Waste-Co to Jest? Available online: https://www.jozefow.pl/zero-waste-co-to-jest-1488 (accessed on 14 November 2022).
- Ozga, P. Gospodarka odpadami a stan zanieczyszczenia środowiska naturalnego w Polsce w 2015 roku. Przegląd Reg. Metod. Ilościowe W Bad. Ekon. 2017, 18, 304–313. [Google Scholar] [CrossRef]
- Zaman, A.U. Identification of key assessment indicators of the zero waste management systems. Ecol. Indic. 2014, 36, 682–693. [Google Scholar] [CrossRef]
- Pietzsch, N.; Ribeiro, J.L.D.; de Medeiros, J.F. Benefits, challenges and critical factors of success for Zero Waste: A systematic literature review. Waste Manag. 2017, 67, 324–353. [Google Scholar] [CrossRef] [PubMed]
- Michniewska, K.; Grodkiewicz, P. Zero odpadów-utopia czy rozwiązanie zbyt rozwiniętego konsumeryzmu? Logistyka Odzysku 2017, 2, 39–43. [Google Scholar]
- Song, Q.; Li, J.; Zeng, X. Minimizing the increasing solid waste through zero waste strategy. J. Clean. Prod. 2015, 104, 199–210. [Google Scholar] [CrossRef]
- Lysenko, K. Zrównoważona gospodarka odpadami na przykładzie Rzeszowa. Stud. Miej. 2004, 15, 31–41. [Google Scholar]
- Shpak, N.; Kuzmin, O.; Melnyk, O.; Ruda, M.; Sroka, W. Implementation of a Circular Economy in Ukraine: The Context of European Integration. Resources 2020, 9, 96. [Google Scholar] [CrossRef]
- Kumar, S.; Vardhan Bhati, H. Waste Management to Zero Waste: Global Perspectives and Review of Indian Law and Policy. In Emerging Trends to Approaching Zero Waste; Mustansar Hussain, C.H., Singh, S., Goswami, L., Eds.; Elsevier: Amsterdam, The Netherlands, 2022; pp. 79–101. [Google Scholar]
- Singh, P.P. Solid Waste Management Through the Concept of Zero Waste. In Emerging Trends to Approaching Zero Waste; Mustansar Hussain, C.H., Singh, S., Goswami, L., Eds.; Elsevier: Amsterdam, The Netherlands, 2022; pp. 293–318. [Google Scholar]
- Burlakovs, J.; Jani, Y.; Kriipsalu, M.; Vincevica-Gaile, Z.; Kaczala, F.; Celma, G.; Ozola, R.; Rozina, L.; Rudovica, V.; Hogland, M.; et al. On the way to ‘zero waste’ management: Recovery potential of elements, including rare earth elements, from fine fraction of waste. J. Clean. Prod. 2018, 186, 81–90. [Google Scholar] [CrossRef]
- Vargas-Merino, J.A.; Rios-Lama, C.A.; Panez-Bendezú, M.H. Circular Economy: Approaches and Perspectives of a Variable with a Growing Trend in the Scientific World—A Systematic Review of the Last 5 Years. Sustainability 2022, 14, 14682. [Google Scholar] [CrossRef]
- Ustawa z dnia 14 grudnia 2012 r. O Odpad. Dz. U. 2013, 21.
- Grzymała, Z. (Ed.) Wydatki na Usługi Komunalne w Strukturze Wydatków Mieszkańców Gmin—Ocena w Układzie Regionalnym; SGH: Warszawa, Poland, 2015. [Google Scholar]
- Famielec, J. Gospodarka Odpadami Komunalnymi Jako Działalność Gospodarcza Realizowana w Ogólnym Interesie Gospodarczym. In Pomoc Publiczna. Doświadczenia Wybranych Sektorów Gospodarki; Kożuch, M., Ed.; Fundacja Uniwersytetu Ekonomicznego w Krakowie: Kraków, Poland, 2017. [Google Scholar]
- Amaral, R.E.; Brito, J.; Buckman, M.; Drake, E.; Ilatova, E.; Rice, P.; Sabbagh, C.; Voronkin, S.; Abraham, Y.S. Waste Management and Operational Energy for Sustainable Buildings: A Review. Sustainability 2020, 12, 5337. [Google Scholar] [CrossRef]
- Strahl, D. Możliwości wykorzystania miar agregatowych do oceny konkurencyjności regionów. Pr. Nauk. Akad. Ekon. We Wrocławiu 2020, 860, 106–120. [Google Scholar]
- Zeliaś, A. (Ed.) Ekonometria Przestrzenna; Wydawnictwo Ekonomiczne: Warszawa, Poland, 1991. [Google Scholar]
- Młodak, A. Analiza Taksonomiczna w Statystyce Regionalnej; Difin: Warszawa, Poland, 2006. [Google Scholar]
- Malina, A.; Zieliaś, A. Taksonomiczna Analiza Przestrzennego Zró żnicowania Jakości Życia Ludności w Polsce w 1994 r. In Ekonometryczne Modelowanie Danych Finansowo-Księgowych; Nowak, E., Urbaniak, M., Eds.; UMCS: Lublin, Poland, 1996; pp. 85–89. [Google Scholar]
- Kukuła, K.; Luty, L. O wyborze metody porządkowania liniowego do oceny gospodarki odpadami w Polsce w ujęciu przestrzennym. Zesz. Nauk. Szkoły Głównej Gospod. Wiej. W Warszawie 2018, 18, 183–192. [Google Scholar] [CrossRef]
- Malina, A.; Zeliaś, A. O budowie taksonomicznej miary jakości życia. Syntetyczna miara rozwoju jest narzędziem statystycznej analizy porównawczej. Taksonomia 1997, 4, 238. [Google Scholar]
- Malina, A. Wielowymiarowa Analiza Przestrzennego Zróżnicowania Struktury Gospodarki Polski Według Województw. Akademii Ekonomicznej w Krakowie: Krakow, Poland, 2004; pp. 96–97. [Google Scholar]
- Chojnicki, Z.; Czyż, T. Problemy metodologiczne zastosowania analizy czynnikowej w geografii. Przegląd Geogr. 1975, 47, 3. [Google Scholar]
- Adamowicz, M.; Janulewicz, P. Wykorzystanie analizy czynnikowej do oceny rozwoju społeczno-gospodarczego w skali lokalnej. Pr. Nauk. Uniw. Ekon. We Wrocławiu 2013, 305, 15–23. [Google Scholar]
- Malina, A. Analiza czynnikowa jako metoda klasyfi kacji regionów Polski. Przegląd Stat. 2006, 53, 33–48. [Google Scholar]
- Program Operacyjny Polska Wschodnia 2014-2020 (POPW). Available online: https://www.funduszeeuropejskie.gov.pl/media/109416/POPW_20220628.pdf (accessed on 14 November 2022).
- Ustawa z dnia 8 marca 1990 r. O Samorz. Gm. 2001, 142, 1591.
- Wysocki, F. Metody Taksonomiczne w Rozpoznawaniu Typów Ekonomicznych Rolnictwa i Obszarów Wiejskich; Wyd. Uniwersytetu Przyrodniczego w Poznaniu: Poznań, Poland, 2010. [Google Scholar]
- Łuczak, A.; Wysocki, F. Wykorzystanie Metod Taksonometrycznych i Analitycznego Procesu Hierarchicznego do Programowania rozwoju Obszarów Wiejskich; Wydawnictwo Akademii Rolniczej im. Augusta Cieszkowskiego w Poznaniu: Poznań, Poland, 2005. [Google Scholar]
- Grabiński, T. Metody określania charakteru zmiennych w wielowymiarowej analizie porównawczej. Zesz. Nauk. Akad. Ekon. W Krakowie 1985, 213, 35–63. [Google Scholar]
- Grabiński, T.; Wydymus, S.; Zeliaś, A. Metody Taksonomii Numerycznej w Modelowaniu Zjawisk Społeczno-Gospodarczych; PWN: Warszawa, Poland, 1989. [Google Scholar]
- Walesiak, M. Problemy selekcji i ważenia zmiennych w zagadnieniu klasyfikacji. Pr. Nauk. AE We Wroc. 2005, 12, 106–118. [Google Scholar]
- Hellwig, Z. Zastosowanie metody taksonomicznej do typologicznego podziału krajów ze względu na poziom ich rozwoju oraz zasoby i strukturę wykwalifikowanych kadr. Przegląd Stat. 1968, 4, 307–326. [Google Scholar]
- Hellwig, Z. Taksonometria Ekonomiczna, jej Osiągnięcia, Zadania i Cele, w: Taksonomia—Teoria i jej Zastosowania; Akademia Ekonomiczna w Krakowie: Kraków, Poland, 1990. [Google Scholar]
- Rogowski, W.; Krysiak, M. Zastosowanie metody wzorca do tworzenia klas ryzyka kredytowego. Bank I Kredyt 1997, 7–8, 92–103. [Google Scholar]
- Kukuła, K. Metoda Unitaryzacji Zerowanej; Wyd. Naukowe PWN: Warszawa, Poland, 2000. [Google Scholar]
- Wysocki, F.; Lira, J. Statystyka Opisowa; Wyd. AR: Poznań, Poland, 2005. [Google Scholar]
- Prus, P.; Dziekański, P.; Bogusz, M.; Szczepanek, M. Spatial Differentiation of Agricultural Potential and the Level of Development of Voivodeships in Poland in 2008–2018. Agriculture 2021, 11, 229. [Google Scholar] [CrossRef]
- Dziekański, P.; Prus, P. Financial Diversity and the Development Process: Case study of Rural Communes of Eastern Poland in 2009–2018. Sustainability 2020, 12, 6446. [Google Scholar] [CrossRef]
- Kukuła, K. Metoda unitaryzacji zerowanej na tle wybranych metod normowania cech diagnostycznych. Acta Sci. Acad. Ostroviensis 1999, 4, 5–31. [Google Scholar]
- Kukuła, K.; Bogocz, D. Zero Unitarization, Method and Its Application in Ranking Research in Agriculture. Econ. Reg. Stud. 2014, 7, 5–13. [Google Scholar]
- Lenormand, M.; Deffuant, G. Generating a Synthetic Population of Individuals in Households: Sample-Free Vs Sample-Based Methods. J. Artif. Soc. Soc. Simul. 2013, 16, 1–12. [Google Scholar] [CrossRef]
- Malina, A. Analiza przestrzennego zróżnicowania poziomu rozwoju społeczno-gospodarczego województw Polski w latach 2005–2017. Soc. Inequalities Econ. Growth 2020, 61, 138–155. [Google Scholar] [CrossRef]
- Kozak, J.M.; Mrówczyńska-Kamińska, A.; Wołoszyn, A. Multidimensional assessment of the financial position of polish households and its regional diversity. Heliyon 2022, 8, e09483. [Google Scholar] [CrossRef] [PubMed]
- Sompolska-Rzechuła, A.; Kurdyś-Kujawska, A. Assessment of the Development of Poverty in EU Countries. Int. J. Environ. Res. Public Health 2022, 19, 3950. [Google Scholar] [CrossRef]
- Vavrek, R.; Papcunová, V.; Tej, J. Evaluation of Financial Management of Towns in relation to Political Cycles using CV-TOPSIS. Lex localis-J. Local Self-Government 2020, 18, 231–252. [Google Scholar] [CrossRef]
- Velasquez, M.; Hester, P.T. An Analysis of Multi-Criteria Decision Making Methods. Int. J. Oper. Res. 2013, 2, 56–66. [Google Scholar]
- Kim, Y.; Chung, E.S.; Jun, S.M.; Kim, S.U. Prioritizing the best sites for treated wastewater instream use in an urban watershed using fuzzy {TOPSIS}. Resour. Conserv. Recycl. 2013, 73, 23–32. [Google Scholar] [CrossRef]
- Wójcik-Leń, J.; Leń, P.; Mika, M.; Kryszk, H.; Kotlarz, P. Studies regarding correct selection of statistical methods for the needs of increasing the efficiency of identification of land for consolidation—A case study in Poland. Land Use Policy 2019, 87, 104064. [Google Scholar] [CrossRef]
- Bąk, A. Zastosowanie metod wielowymiarowej analizy porównawczej do oceny stanu środowiska w województwie dolnośląskim. Wiadomości Stat. 2018, 1, 7–20. [Google Scholar]
- Behzadian, M.; Otaghsara, S.K.; Yazdani, M.; Ignatius, J. A state-of the-art survey of TOPSIS applications. Expert Syst. Appl. 2012, 39, 13051–13069. [Google Scholar] [CrossRef]
- Hwang, C.L.; Yoon, K. Multiple Attribute Decision Making: Methods and Applications; Springer: Berlin, Germany, 1981. For: Bieniasz, A.; Gołaś, Z.; Łuczak, A. Zróżnicowanie kondycji finansowej gospodarstw rolnych wyspecjalizowanych w chowie owiec i kóz w krajach Unii Europejskiej. Rocz. Ekon. Rol. I Rozw. Obsz. Wiej. 2013, 100, 1. [Google Scholar]
- Jahanshahloo, G.R.; Lotfi, F.H.; Izadikhah, M. An Algorithmic Method to Extend {TOPSIS} for Decision-Making Problems with Interval Data. Appl. Math. Comput. 2006, 2, 1375–1384. [Google Scholar] [CrossRef]
- Özkan, B.; Özceylan, E.; Kabak, M.; Dikmen, A.U. Evaluation of criteria and COVID-19 patients for intensive care unit admission in the era of pandemic: A multi-criteria decision making approach. Comput. Methods Programs Biomed. 2021, 209, 106348. [Google Scholar] [CrossRef]
- Kozera, A.; Dworakowska-Raj, M.; Standar, A. Role of Local Investments in Creating Rural Development in Poland. Energies 2021, 14, 1748. [Google Scholar] [CrossRef]
- Krukowska, D. Makrospołeczne Determinanty Dystrybucji Dochodów. In Zróżnicowanie Społeczne w Perspektywie Porównawczej; Wesołowski, W., Słomczyński, K., Eds.; Zakł. Narod. im. Osolińskich: Wrocław, Poland, 1981. [Google Scholar]
- Makarewicz-Marcinkiewicz, A. Nierówności Społeczne na Drodze do Zrównoważonego Rozwoju. Problem Polityki Społecznej i Gospodarczej; Wydawnictwo Adam Marszałek: Toruń, Poland, 2015. [Google Scholar]
- Cui, L.; Mu, Y.; Shen, Z.; Wang, W. Energy transition, trade and green productivity in advanced economies. J. Clean. Prod. 2022, 361, 132288. [Google Scholar] [CrossRef]
- Drobniak, A.; Janiszek, M.; Plac, K. Zielona gospodarka i zielona infrastruktura jako mechanizmy wzmacniania gospodarczo-środowiskowego wymiaru prężności. Res. Pap. Wrocław Univ. Econ. 2016, 443, 57–69. [Google Scholar]
- Loiseau, E.; Saikku, L.; Antikainen, R.; Droste, N.; Hansjürgens, B.; Pitkänen, K.; Thomsen, M. Green economy and related concepts: An overview. J. Clean Prod. 2016, 139, 361–371. [Google Scholar] [CrossRef]
- Mardani, A.; Streimikiene, D.; Nilashi, M.; Aranda, D.A.; Loganathan, N.; Jusoh, A. Energy consumption, economic growth, and CO2 emissions in G20 countries: Application of adaptive neuro-fuzzy inference system. Energies 2018, 11, 2771. [Google Scholar] [CrossRef]
- Lorek, S.; Spangenberg, J.H. Sustainable consumption within a sustainable economy—Beyond green growth and green economies. J. Clean. Prod. 2014, 63, 33–44. [Google Scholar] [CrossRef]
- Hickel, J. Less is More: How Degrowth Will Save the World (Mniej Znaczy Lepiej. O Tym jak Odejście od Wzrostu Gospodarczego Ocali Świat); Wyd. Karakter: Krakow, Poland, 2021. [Google Scholar]
- Vukovic, N.; Pobedinsky, V.; Mityagin, S.; Drozhzhin Mingaleva, Z. A Study on Green Economy Indicators and Modeling: Russian Context. Sustainability 2019, 11, 462. [Google Scholar] [CrossRef]
- Swainson, L.; Mahanty, S. Green economy meets political economy: Lessons from the “Aceh Green” initiative, Indonesia. Glob. Environ. Chang. 2018, 53, 286–295. [Google Scholar] [CrossRef]
- Bina, O.; La Camera, F. Promise and shortcomings of a green turn in recent policy responses to the ‘double crisis’. Ecol. Econ. 2011, 70, 2308–2316. [Google Scholar] [CrossRef]
- Bailey, I.; Caprotti, F. The green economy: Functional domains and theoretical directions of enquiry. Environ. Plan. A 2014, 46, 1797–1813. [Google Scholar] [CrossRef]
- Zaman, A.U. A comprehensive review of the development of zero waste management: Lessons learned and guidelines. J. Clean. Prod. 2015, 91, 12–25. [Google Scholar] [CrossRef]
- Minelgaitė, A.; Liobikienė, G. Waste problem in European Union and its influence on waste management behaviours. Sci. Total Environ. 2019, 667, 86–93. [Google Scholar] [CrossRef]
- Liang, X.; Ji, L.; Xie, Y.; Huang, G. Economic-Environment-Energy (3E) objective-driven ntegrated municipal waste management under deep complexities—A novel multi-objective approach. Sustain. Cities Soc. 2022, 87, 104190. [Google Scholar] [CrossRef]
- Cole, C.; Osmani, M.; Quddus, M.; Wheatley, A.; Kay, K. Towards a Zero Waste Strategy for an English Local Authority. Resour. Conserv. Recycl. 2014, 89, 64–75. [Google Scholar] [CrossRef]
- Lorens, A. Ekonomia cyrkularna jako zrównoważony, odpowiedzialny proces wyrażony w architekturze i projektowaniu produktu. Builder 2021, 25, 37–39. [Google Scholar] [CrossRef]
- Deselnicu, D.C.; Militaru, G.; Deselnicu, V.; Zainescu, G.; Albu, L. Towards a circular economy–A Zero Waste programme for Europe. In Proceedings of the 7th International Conference on Advanced Materials and Systems ICAMS 2018, Bucharest, Romania, 18–20 October 2018; pp. 563–568. [Google Scholar] [CrossRef]
- Bogusz, M.; Matysik-Pejas, R.; Krasnodębski, A.; Dziekański, P. The Concept of Zero Waste in the Context of Supporting Environmental Protection by Consumers. Energies 2021, 14, 5964. [Google Scholar] [CrossRef]
- Kłos, L. Gospodarka odpadami komunalnymi—wyzwanie xxi wieku. Zesz. Nauk. Uniw. Szczecińskiego. Stud. I Pr. Wydziału Nauk. Ekon. I Zarządzania 2012, 28, 131–143. [Google Scholar]
- Kozłowska, B. Charakterystyka i postępowanie z odpadami. Przegląd Komunal. 2002, 4, 84–88. [Google Scholar]
- Wilson, D.C. Development drivers for waste management. Waste Manag. Res. 2007, 25, 198–207. [Google Scholar] [CrossRef]
- Licastro, A.; Sergi, B.S. Drivers and barriers to a green economy. A review of selected balkan countries. Clean. Eng. Technol. 2021, 4, 100228. [Google Scholar] [CrossRef]
- Ciechelska, A. Recykling odpadów komunalnych jako miernik realizacji gospodarki o obiegu zamkniętym na przykładzie Polski i Słowenii. Res. Pap. Wrocław Univ. Econ. 2017, 491, 63–74. [Google Scholar]
- Zaman, A.U.; Lehmann, S. The zero waste index: A performance measurement tool for waste management systems in a ‘zero waste city’. J. Clean. Prod. 2013, 50, 123–132. [Google Scholar] [CrossRef]


| No. | Zero Waste—Diagnostic Variables | Unit | S/D |
|---|---|---|---|
| X1 | Expenses in the department: Urban and rural cleansing the year per 1000 capita | [PLN/pc] | S |
| X2 | Total waste generated during the year per 1000 capita | [thousand t.] | D |
| X3 | Total recycled waste per 1000 capita | [thousand t.] | S |
| X4 | Total disposed waste per 1000 capita | [thousand t.] | S |
| X5 | Waste stored to date (accumulated) in own facilities total per 1 km2 | [thousand t.] | D |
| X6 | Share of recovered waste in the amount of waste generated during the year | [%] | S |
| X7 | Total mixed waste collected during the year per 1 inhabitant | [kg] | D |
| X8 | Landfills—as of 31 December | [pcs] | D |
| X9 | Area of landfill sites not reclaimed per 1 km2 | [ha] | D |
| X10 | Area of active landfills where municipal waste is disposed of—as of 31 December | [ha] | S |
| X11 | Area of wild landfills per 100 km2 of total area | [pcs] | D |
| X12 | Municipal waste collected during liquidation of wild dumps—during the year | [t.] | D |
| Green economy—diagnostic variables | |||
| X13 | Expenses in the department: Health care | [PLN/pc] | S |
| X14 | Expenditures in the department: Utilities and environmental protection | [PLN/pc] | S |
| X15 | Electricity consumption in urban households per capita | [kWh] | D |
| X16 | Electricity consumption by location of consumer in rural areas per capita | [kWh] | D |
| X17 | Users of installations in % of total population—water supply | [%] | S |
| X18 | Users of installations in % of total population—sewerage system | [%] | S |
| X19 | Distribution network per 100 km2—water supply network | [km] | S |
| X20 | Distribution network per 100 km2—sewerage network | [km] | S |
| X21 | Distribution network per 100 km2—gas network | [km] | S |
| X22 | Heat sales per year by location total—residential buildings offices and institutions (per 1 inhabitant) | [GJ] | S |
| X23 | Forest land area in total area | [%] | S |
| X24 | Water consumption per 1 inhabitant | [m3] | D |
| X25 | Share of industry in total water consumption | [%] | D |
| X26 | Share of treated wastewater in total discharged wastewater | [%] | S |
| X27 | Treated wastewater per year discharged per capita | [dam3] | D |
| X28 | Population using wastewater treatment plants in % of total population | [%] | S |
| X29 | Share of recycled waste in waste generated during the year | [%] | S |
| X30 | Total mixed waste collected during the year per capita | [kg] | D |
| X31 | Municipal wastewater treated per 100 km2 | [dam3] | D |
| X32 | Share of legally protected areas in total area | [%] | S |
| Indicator Name | 2010 | 2015 | 2019 | 2020 | 2010 | 2015 | 2019 | 2020 |
|---|---|---|---|---|---|---|---|---|
| q green economy | q waste management | |||||||
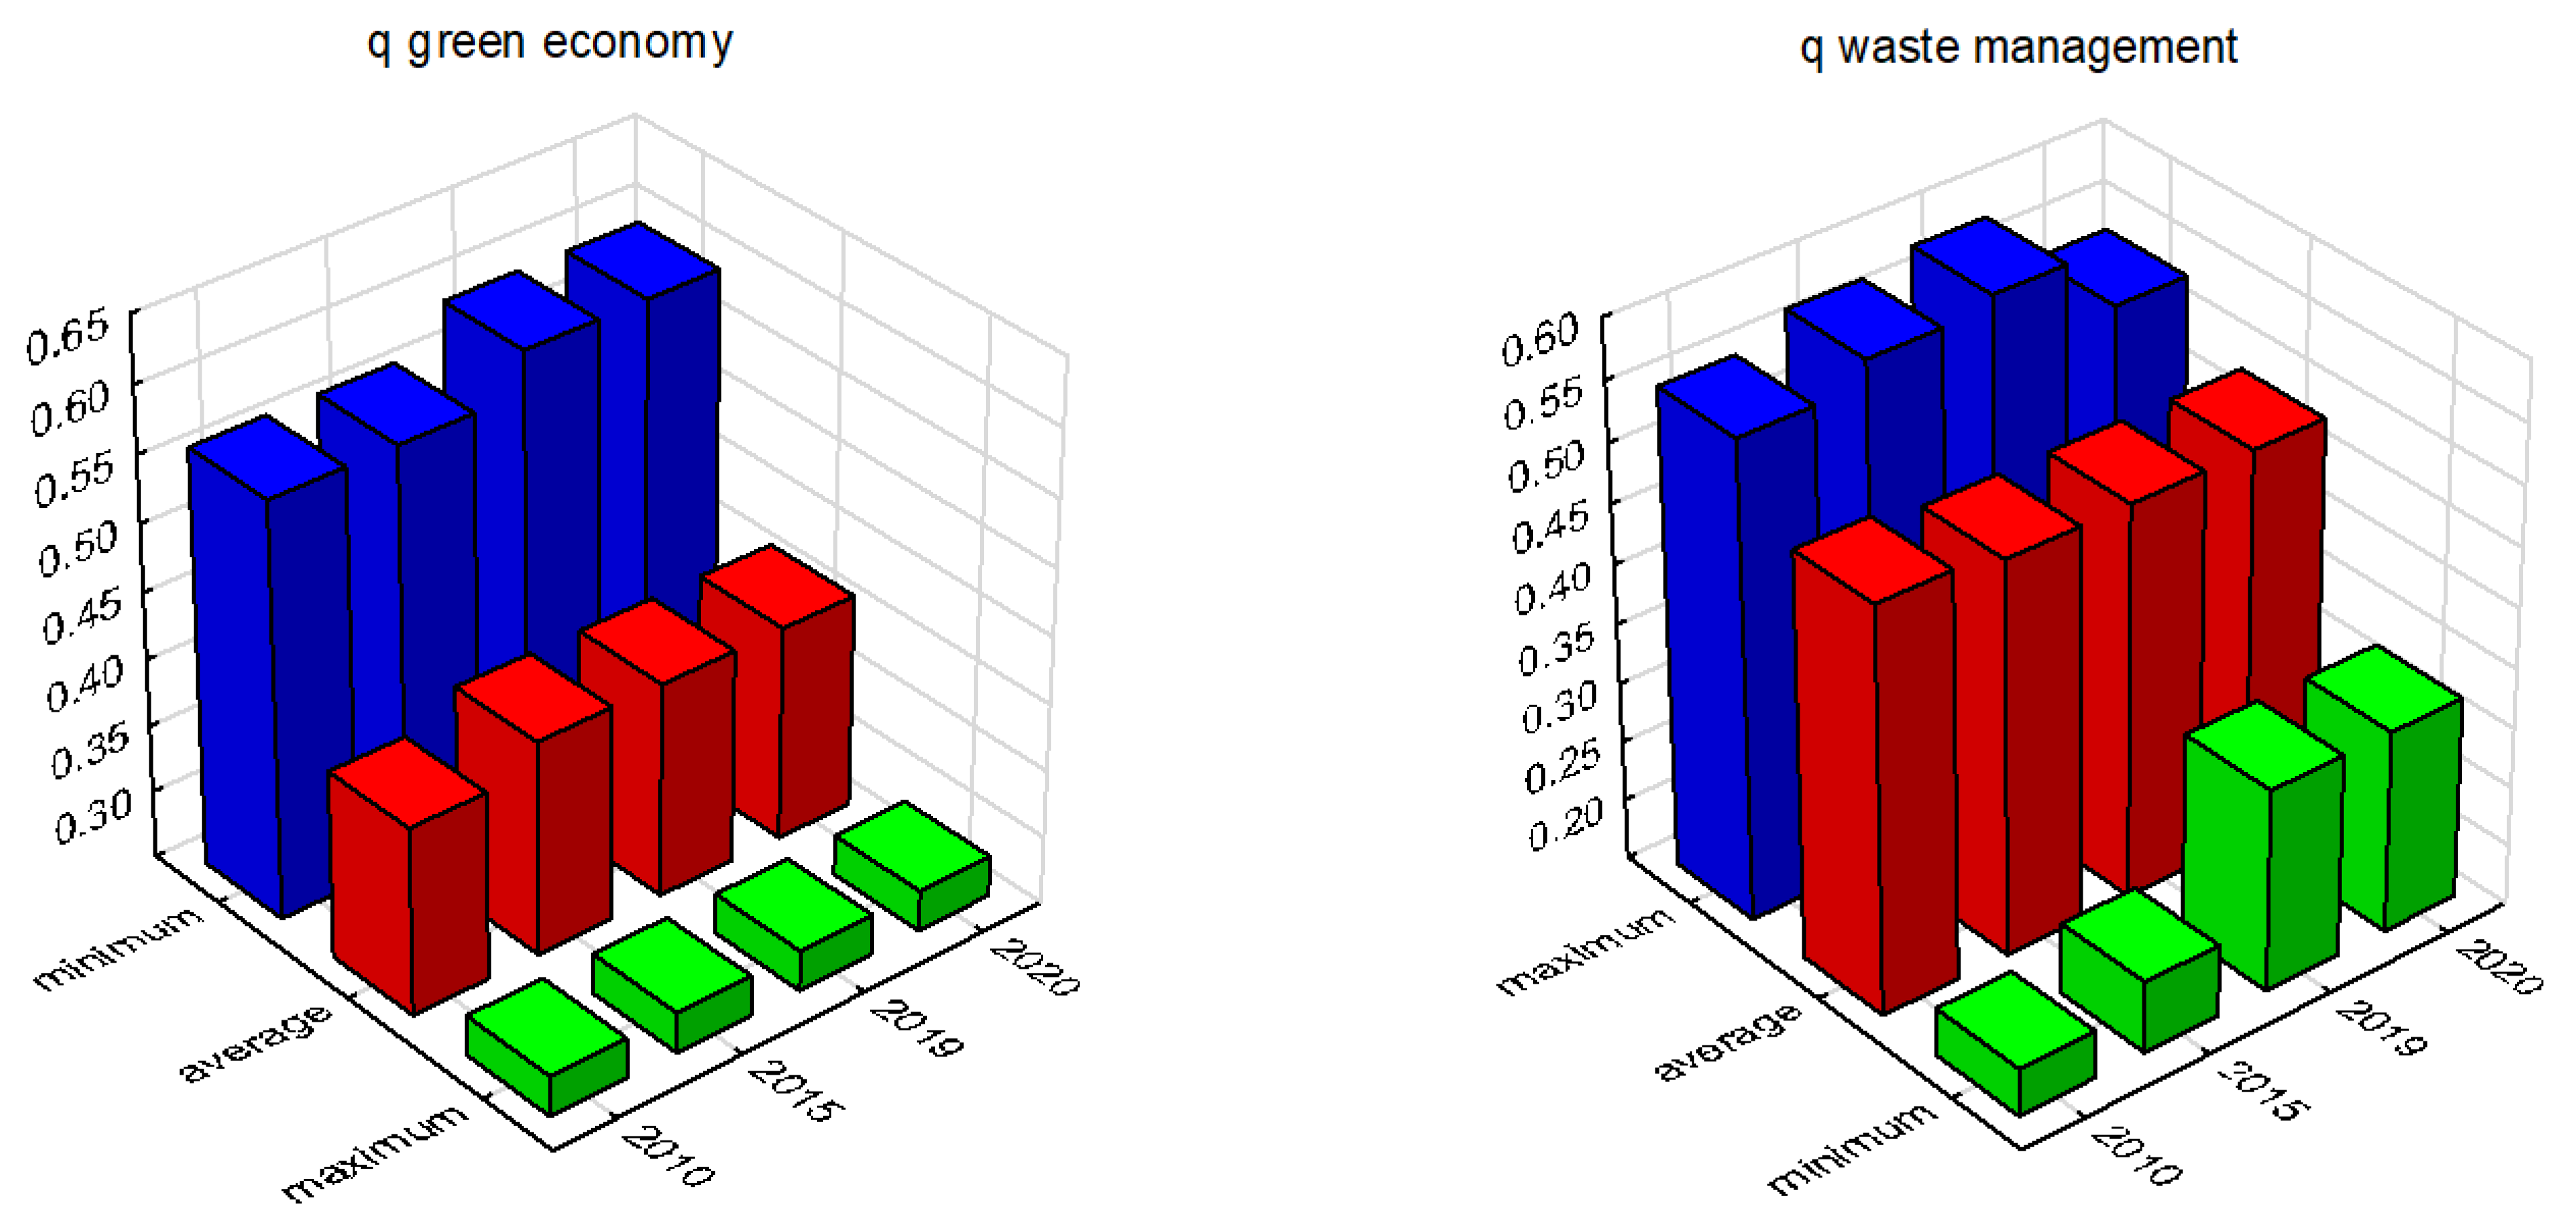
| Average | 0.49 | 0.48 | 0.48 | 0.48 | 0.39 | 0.41 | 0.41 | 0.41 |
| Median | 0.50 | 0.49 | 0.49 | 0.49 | 0.39 | 0.41 | 0.41 | 0.41 |
| Min | 0.19 | 0.21 | 0.32 | 0.32 | 0.28 | 0.28 | 0.28 | 0.28 |
| Max | 0.55 | 0.57 | 0.58 | 0.53 | 0.56 | 0.56 | 0.59 | 0.59 |
| Lower Quartile | 0.48 | 0.48 | 0.47 | 0.48 | 0.36 | 0.37 | 0.38 | 0.38 |
| Top Quartile | 0.50 | 0.50 | 0.49 | 0.50 | 0.42 | 0.44 | 0.45 | 0.45 |
| Gap | 0.36 | 0.36 | 0.26 | 0.21 | 0.28 | 0.28 | 0.31 | 0.31 |
| Quartile gap | 0.02 | 0.02 | 0.02 | 0.02 | 0.06 | 0.07 | 0.07 | 0.07 |
| Standard deviation | 0.03 | 0.03 | 0.03 | 0.02 | 0.05 | 0.05 | 0.05 | 0.05 |
| Coefficient of variation | 5.97 | 5.98 | 5.34 | 4.66 | 13.20 | 12.86 | 13.18 | 13.26 |
| Skewness (asymmetry) | −3.50 | −3.27 | −2.17 | −2.29 | 0.27 | 0.15 | 0.12 | 0.13 |
| Kurtosis (measure of concentration) | 20.48 | 18.10 | 7.49 | 8.04 | 0.21 | 0.08 | 0.09 | 0.15 |
| Variables | q Green Economy | q Waste Management |
|---|---|---|
| Expenses in the department: Urban and rural cleansing | 0.2074 | −0.1399 |
| Expenses in department: Maintenance of greenery in cities and municipalities | 0.3469 | −0.2991 |
| Expenditures in department: Municipal waste management | 0.3037 | −0.1478 |
| Expenditures in department: Health protection | 0.2632 | −0.2878 |
| Users of installations as % of total population—water supply | 0.3224 | −0.2523 |
| Users of installations in % of total population—sewerage | 0.8663 | −0.4725 |
| Users of installations in % of total population—gas | 0.4898 | −0.2556 |
| Distribution network per 100 km2—water supply network | 0.5302 | −0.5905 |
| Distribution network per 100 km2—sewerage network | 0.6845 | −0.5727 |
| Distribution network per 100 km2—gas network | 0.5539 | −0.4938 |
| Share of industry in total water consumption | 0.279 | −0.2617 |
| Share of wastewater treated discharged in wastewater treated | 0.7669 | −0.4752 |
| Population using urban and rural wastewater treatment plants | 0.8465 | −0.4237 |
| Share of industrial wastewater treated in wastewater requiring treatment | 0.3938 | −0.1775 |
| Share Legally protected areas in total area | 0.216 | 0.1453 |
| Share of green areas in total area | 0.5146 | −0.4946 |
| Forest land area | 0.1566 | 0.1932 |
| Mixed waste collected during | 0.4934 | −0.8199 |
| Waste collection units in the year under review by area of operation | 0.3786 | −0.3481 |
| q green economy | 1 | −0.4591 |
| Expenses in the department: Urban and rural cleansing | 0.2074 | −0.1399 |
| Expenditures in department: Municipal waste management | 0.3037 | −0.1478 |
| Total mixed waste collected during the year | 0.5387 | −0.7801 |
| Total mixed waste collected during the year | 0.4934 | −0.8199 |
| Household waste | 0.421 | −0.8242 |
| q Waste management | −0.4591 | 1 |
Disclaimer/Publisher’s Note: The statements, opinions and data contained in all publications are solely those of the individual author(s) and contributor(s) and not of MDPI and/or the editor(s). MDPI and/or the editor(s) disclaim responsibility for any injury to people or property resulting from any ideas, methods, instructions or products referred to in the content. |
© 2022 by the authors. Licensee MDPI, Basel, Switzerland. This article is an open access article distributed under the terms and conditions of the Creative Commons Attribution (CC BY) license (https://creativecommons.org/licenses/by/4.0/).
Share and Cite
Dziekański, P.; Wyszkowski, A.; Prus, P.; Pawlik, A.; Maitah, M.; Wrońska, M. Zero Waste as a Determinant of Shaping Green Economy Processes on the Example of Communes of Eastern Poland in 2010–2020. Energies 2023, 16, 19. https://doi.org/10.3390/en16010019
Dziekański P, Wyszkowski A, Prus P, Pawlik A, Maitah M, Wrońska M. Zero Waste as a Determinant of Shaping Green Economy Processes on the Example of Communes of Eastern Poland in 2010–2020. Energies. 2023; 16(1):19. https://doi.org/10.3390/en16010019
Chicago/Turabian StyleDziekański, Paweł, Adam Wyszkowski, Piotr Prus, Andrzej Pawlik, Mansoor Maitah, and Magdalena Wrońska. 2023. "Zero Waste as a Determinant of Shaping Green Economy Processes on the Example of Communes of Eastern Poland in 2010–2020" Energies 16, no. 1: 19. https://doi.org/10.3390/en16010019
APA StyleDziekański, P., Wyszkowski, A., Prus, P., Pawlik, A., Maitah, M., & Wrońska, M. (2023). Zero Waste as a Determinant of Shaping Green Economy Processes on the Example of Communes of Eastern Poland in 2010–2020. Energies, 16(1), 19. https://doi.org/10.3390/en16010019