Abstract
Due to the highly recent innovations in energy optimization research, this study presents a systematic overview of the area, exposing gaps and interesting directions for future research. The current study investigated the trend of research growth using 24,946 research paper with 731,873 references data gathered from the Web of Science Core Collection database (WOS), from the period between 1990 and September 2022, using bibliographic coupling and keyword co-occurrence. The aim of this research is to analyze bibliometric efficiency criteria, such as publishing and citation trends, the top ten institutions, countries, and the most frequently referenced articles. The Matlab and Vos viewer software illustrate the current state of visualization research articles. Science maps as result of indicators, such as the most often used keywords plus and keywords, citation and co-citation, and collaboration is also being established for in-depth research. The study findings enable us to conclude that the number of publications in this field show that the importance has grown tremendously over the last 30 years, with China, United States, Germany, and India emerging as the countries that publish the most. The top ten researchers in led energy optimization were also identified. Academics should become acquainted with the hotspots in this discipline as soon as possible. This is also the first study to use bibliometric research to thoroughly evaluate the energy optimization literature. It will help researchers widen their knowledge and quickly comprehend the present condition and trend of development.
1. Introduction
Energy optimization refers to the use of—and avoidance of—energy in the built environment in order to optimize environmental and human benefits. From a resource aspect, we are talking about a four-legged stool: monitoring [1], evaluation [2], optimization [3], and benchmarking [4].
Improving energy efficiency has been highlighted as a viable option for the means of promoting energy savings, lowering emissions, and achieving sustainable development. There are several widely scattered methods for improving energy performance in the direction of sustainable manufacturing, resulting in inadequacy in terms of overall strategy and system integration. A thorough study and analysis of energy monitoring, assessment, benchmarking, and optimization from several viewpoints is required in order to comprehend the energy usage trend and put in place effective energy-saving methods [5].
Energy monitoring and assessment might aid company energy administrators in determining energy use and analyzing the potential for energy savings, benchmarking, and energy optimization, which are helpful in establishing the best standards and dominance in energy. From either a practical standpoint, this study outlines and covers a wide range of approaches for improving energy efficiency in manufacturing through categorization; it might be an advantageous reference for method selection in real-world situations. In addition, our approach can help manufacturing employees manage energy use and run production operations more efficiently [6].
Users may make educated energy management decisions and save money by using energy-monitoring devices, which collect data about their use habits. This research highlights the importance of having real-time access to energy use patterns. It is necessary for seeing and comprehending the savings possibilities. From this perspective, this paper describes the creation of an embedded system calibrated by itself for monitoring, measuring, controlling, and forecasting the consumption of electrical loads, allowing for increased energy efficiency through the handling of demand-side loads [7].
Researchers provide a methodological framework for systematically evaluating and monitoring savings and the performance of energy in textile wet processing procedures. The technique was then expanded to examine energy-effectiveness-monitoring procedures and find energy-reduction strategies. The suggested structure was created using a detailed investigation in regard to the production process of textile wet processing facilities, as well as ISO 50001 standards [8]. Based on monitoring data, the research attempted to evaluate equipment ratio and the time series of power used by homes throughout the town. Nevertheless, because the number of families tracked was modest, the system was unlikely to be considered representative [9].
The simulation of a facility producing solar thermal energy is now ongoing. The climate information utilized is from two Ecuadorian coastal cities and one island. This study contributes by simulating a comprehensive model of power conversion system and solar collector field that includes the parameters of oil flow and outlet temperature at the same time. Initially, the outlet temperature was simply used to evaluate power plants. The thermo-solar plant model is made up of a solar collector’s field, an energy conversion mechanism, and a storage tank. As a consequence, they have a thermo-solar plant model, which will enable us to judge once, contemplating the inclusion of micro-networks in systems that are not connected to the electrical network [10].
In this study, a model of multi-level energy flow with indications of energy that incorporate producing energy are defined. Consequently, based on data and IoT, a system for managing energy for evaluating energy efficiency is established. The energy consumption statistics are intended for gathering, transmitting, storing, processing, mining, and application. Furthermore, given the data on system energy usage, a comprehensive assessment of an energy efficiency approach is outlined [11].
This research presents a method to assess energy consumption in a cloud computing data center, starting by creating a model for assessing energy use, then examining relationship using multiple linear and nonlinear mathematical models between independent and dependent parameters, then finally utilizing average and relative deviation to determine the reliability of the evaluation findings. The depth learning mechanism is added to complete the mapping of regression parameters, and also the depth residual network is used for iteratively training polynomial parameters. Completely extracting the energy consumption model’s regression parameters solves the assessment of the energy usage function, reconstructing energy usage in cloud computing data centers model using the sub strategy parameters by saving them in the memory playback pool [12].
The energy standard or benchmark is widely acknowledged as a useful management tool and analytical approach for increasing energy conservation. However, investigations into the automated guided vehicles energy standard is missing. Many AGV path plans are viable to complete a transport assignment, then constructing an energy standard to assess every option plan and pick the most energy-efficient one. Likewise, constructing a dynamic energy efficiency grading framework that is commensurate with the energy saving potentials of the transportation job [13].
Lastly, there are several definitions of energy standard or benchmarking in systems for mechanical manufacturing based on various operational processes, items, and applications [14]. Machine learning was used to create an energy usage baseline for Brazilian colleges. The primary scientific contribution is the creation of benchmarking for every institution, not just one location. Machine learning enables the benchmarking approach to be generalized [15].
To construct leveraging real-time big data to create a scalable room-level energy benchmark, a unique process model was presented, with the goal of finding typical energy use patterns and promoting tenant behavior modification to conserve energy in buildings. It was utilized as a case study. The new technique was developed to differ from the previous approach in three ways: (a) the space unit; (b) the time unit; and (c) the equipment unit to which occupants can accurately reply [16].
Several researchers have developed hybrid approaches to enhance precision, consistency, and overall efficiency. However, in the literature, most algorithms focus on methodology, with little emphasis made to the development of objective functions, resulting in a theoretical gap in this field of research [17].
A study uses an optimization-based curve-fitting technique to evaluate the function parameters of many mathematical models reported in the literature for simulating lightning impulses. The simulation findings suggest that this is an efficient, reliable, and easy tool for consistently extracting the tail durations, specific energy, peak value, front and current derivative, and charge of lightning impulse forms [18].
Optimal parameters are applied to four varying situations of urban energy supply. There are several energy sustainability metrics available; however, several of them are appropriate for usage in an urban energy optimization of structure modeling. The elimination of upstream energy supply networks causes flaws, restricted skills to compare small energy systems, and unnecessary accounting expenditure [19].
In addition to increasing climate change, fuel prices have heightened interest in alternate energy sources. Renewable energy sources, particularly hybrid systems, are increasingly becoming a source of alternative energy [20]. Because of the hybrid energy system integration within the primary grid, microgrids that run either off or on grid manners are now possible. Hybrid microgrid systems optimization has received a lot of attention in the bibliography. This study assesses three important themes in order to provide fair and valuable information for future research trends.
A demand response logistic function-based model is built to optimize the dynamic charging/discharging electricity pricing, and the load characteristics of electric cars is evaluated. Using the information gap decision theory, a coordinated optimum model is built to deal with the uncertainty of dispersed generation while also ensuring the resilience of the active distribution network and operational economy [21].
Conversely, for smart home stakeholders, the objective of minimizing energy usage is always a major issue. Because a review of successful energy conservation approaches is useful for getting a rapid overview of bibliography techniques, a complete overview of energy management approaches may generate fresh leads for further study and might provide additional strategies for improving current methods. The purpose of this review research is to offer an overview of previously presented energy-saving recommendations and energy conservation approaches [22]. To do a comparison study across different strategies, they identify many essential elements in energy-saving techniques, such as peak and off load scheduling, user energy, and appliance energy profiling.
This study will offer a detailed assessment of current developments in SAPV system design based on multi-criteria decision-making approaches and multi-objective optimization, as well as the analytical models used to calculate storage battery output power and PV module. Eventually, the technoeconomic parameters to evaluate the SAPV system’s effectiveness are reviewed. This will assist designers and consumers in selecting the most appropriate design prior to deploying the SAPV system [23].
Unfortunately, bibliometric analysis of energy optimization is seldom examined; therefore, there is a current need for systematic and objective analysis and quantitative assessment of entire published data for a better understanding of possible research tendencies and hotspots [24].
Researchers undertake bibliometric analyses largely using the Scopus and Web of Science databases. Many researchers evaluate one of the pair [25], while just a handful employ both. As researchers utilize both databases, they study them individually due to the fact that it is impossible to blend the two manually, owing to differing area tags. For instance, author citations in WOS are signified by the “Cited-Reference” label area; this is also comparable to the “Cited-By” label in Scopus. As a result, even if a researcher receives articles utilizing the same bibliography structure as the bib file, from the two databases, it is challenging to mix the two to undertake distinctive analysis, particularly when the databases are vast.
Insufficient studies integrate the two datasets in order to perform a single analysis, and when they do they make no mention of how they accomplished it, which is significant if the combined file approach is ineffective as this would mean that all upcoming bibliometric analyses are most likely to be ineffective.
To address this issue, they undertake bibliometric analysis using both sets of data, WOS and Scopus. Next, they complete three bibliometric studies using a merged database, WOS and Scopus, with the goal of revealing discrepancies between the merged database and Scopus bibliometric analysis, in addition to WOS and the merged database. This study adds to the bibliometric analysis literature by demonstrating that the results of the WOS and Scopus databases differ from the merged database. They specifically contend that comparison studies between the Scopus and WOS databases are ineffective, since none of them are comparable to the merged database [26].
Because it outlines a systematic process for choosing studies, bibliometric analysis makes a vital addition to the subject of FI and corporate sustainability research; bibliometrics is widely used in many disciplines of research [27]. Furthermore, the findings of current research may be used to highlight the boundaries of knowledge in the chosen study subject, allowing for a more effective identification of existing research gaps. In brief, the bibliometric review approach is a statistical examination of scientific literature that gives important statistics and a full image for academics working on evaluating scientific activity in a certain topic. The procedure, also known as scientific mapping, can be used to attain a large or small domain of interest [28].
Pritchard’s bibliometric analysis is an excellent tool for statistically examining the present condition and trend of scientific research, utilizing mathematical statistics and visualization approaches based on the vast majority of publications. The statistical data may be used to assess the quantity of interlinked investigations that varies year by year, the significant international collaboration, and worldwide output performance, identifying hot spots in the field, as well as, consequently and finally, recommending future investigation objectives, with a focus on the amount and type of documents produced, the countries that have contributed the most to this evolution, and the main researchers that have focused the most on the topic. The study provided here, in particular, seeks to answer three essential questions, the answers to which are expected to contribute to a greater and more effective understanding of the reality that is felt in terms of 3D-printed polymer composites, namely:
- −
- What is the reality that has been noticed in terms of energy optimization—What?
- −
- Which countries have made the largest contributions to the study—and where?
- −
- Who has made the greatest contribution in terms of energy optimization—Who?
2. Methodology
This work aims to clarify and quantify research development on the topic of energy optimization from 1999 until 28 September 2022. The bibliometric analysis approach will be employed in this study, based on USA-based descriptive and content analysis. It is one of the most often used content analysis methodologies, and when used to study and measure texts and information, it not only allows for the study and measurement of enormous amounts of data but is also strongly validated by solid theories.
The required bibliographic data were obtained and saved in an Excel file. The document included ‘meta data’ that was commonly kept separate to an individual document, as shown in Table 1. The data was prepared for analysis at this point by creating a file designated as a thesaurus file. The thesaurus document was utilized during the study to ‘disambiguate’ comparable phrases in order to conduct credible analysis. For example, a data file that might have had texts written by the same researcher but with various names. The same issue arises when phrases with similar keywords, such as ‘optimisation’ and ‘optimization’, are used. Thesaurus files can help improve analysis accuracy by integrating distinct variations of words, author name(s), and so on.

Table 1.
Web of Science core collection.
The application of statistical methods to assess bibliometric publishing data, such as peer reviewed journal articles, reviews, conference proceedings, chapters, books, is characterized as bibliometric [29]. It is extensively used to demonstrate the relationships between research fields and quantitative approaches. It is a method for monitoring, studying, and measuring scientific published papers by individuals and institutions over a specific time period and location, as well as the relationships between these publications. An examination of a set of papers on energy optimization using quantitative indicators, such as most prolific researcher, temporal evolution, number of citations, and so on. The numerical study of publications published by persons or institutions, time period, and location, as well as the relationships or connection points between these publications, shows an attempt to judge a journal or researcher’s academic quality quantitatively using statistical approaches, such as citation rates and TC index. This also includes the utilization of publishing trends to detect technological developments, as well as the gaps in the field.
The research paper input was gathered from the Web of Science Core Collection (WOS) database. It is a well-known and extensively used database in research, readily available to researchers, and provides a baseline for the successful combining and interaction of data provided by it. In this sense, stating the potential provided by WOS and the literature review carried out, with theme selection of “energy” and “optimization,” which was the basis of the research carried out within the scope of bibliometric analysis in 6370 sources (journal, book, etc.), was the basis of the research conducted, as shown in Table 2.
Table 2.
Main information.
The key concept of this work was to identify research articles that concentrated on all disciplines that contained “Energy” and “Optimization”. The earliest publications were dictated in 1990, with the most current dates of publication in 2023. The search question string used was: TITLEABS (“Energy” AND “Optimization”) AND (LIMIT-TO (SRCTYPE, “All document types”)) AND (LIMIT-TO (DOCTYPE, “All document types”)) NOT (EXCLUDE (PUBYEAR, 2023) NOT (LIMIT-TO (LANGUAGE, “English”)). As a consequence of this query string’s output, 24,946 documents were retrieved.
Articles with a weight of 73.2 percent (18,261 documents) of the categories of documents released take precedence here, followed by proceedings paper (17.8%—4452 documents) and review (4 percent—1001 documents) and other categories (Figure 1).
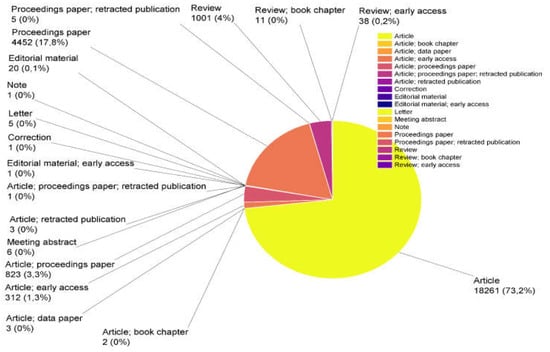
Figure 1.
Document type.
Therefore, the database was continuously updated, and all systematic search was conducted on a separate day to prevent any potential bias. WOS’s “export” function was used to export “proper documentation and cited references” of returned records as “tab delimited text (.txt)” to bibliometric tools for further processing. Then, extensive data on general information was gathered, including locations, institutions, annual publications, source journals, authors, funding sources, research topics, H-index, and number of citations. The above approach was carried out separately by two investigators, and any inconsistencies were resolved through discussions.
3. Results and Discussion
Co-occurrence analysis of keywords can highlight the link between study subjects and identify more comprehensive and relevant research trends. Furthermore, this technique may recognize common links between specific terms, explore new terminology that have received little attention, and disclose current and upcoming themes in energy optimization research. In this study, 78,086 keywords were identified, including author keywords and keywords derived from the title and abstract, from 24,946 documents. The co-occurrence network knowledge mapping was shown; word repetition was restricted to three times. A list of keywords of higher research value were further selected, resulting in a co-occurrence network view of the top 5884 keywords, as shown in Figure 2.
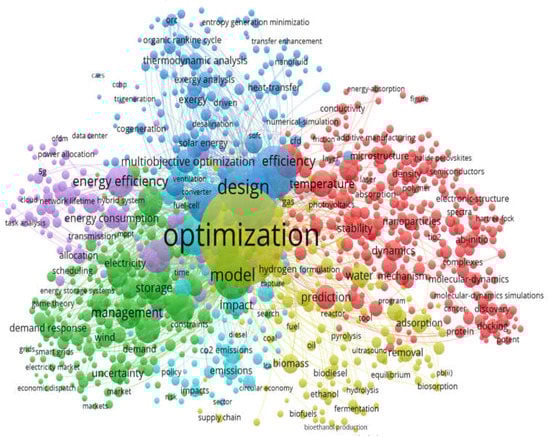
Figure 2.
Network chart of the top 1000 keywords based on co-occurrence.
Thus, every node represented a distinct keyword. The area of the circle denoted the number of times each term appeared. The curve linking the circles signified co-occurrence, similarly its thickness was proportionate to the intensity of the relationship. Near keywords were often more strongly linked than distant keywords, and the color denoted keyword clusters. The top 10 leading keywords were: “optimization” “additive design”, “performance”, “energy”, “model”, “system”, “simulation”, “systems”, “generation”, “efficiency”, “managements”, and “renewable energy”. It was clear that energy optimization was the primary focus of the research.
The keywords were then grouped into six major clusters, which were represented by the colors red, green, blue, yellow, purple, and blue. The red cluster with the most items (299 items) was focused on energy absorption, correlation energy, electrical properties, electrochemical performance, and so on. The green category was mostly concerned with batteries and battery storage (225 items), such as “charge”, “control strategy”, and “distributed control”, as well as distributed “power energy”, among others. The blue category focused mostly on system, design, and performance, including “energy recovery,” “dynamic simulation,” “energy analysis”, “entropy generation”, and “exergoeconomic analysis”. Finally, the yellow, purple, and blue clusters include terms associated with “biomass”, “biomass gasification”, “algorithm”, “ant colony optimization”, artificial intelligence”, and “cloud computing”, among others.
The statistical dispersion of articles associated with energy optimization was examined, and the annual distribution is given in Figure 3. The articles about energy optimization started appearing in 1990, and the quantity of articles continuously grew with minor changes over time. In general, it had only recently received major scientific attention.
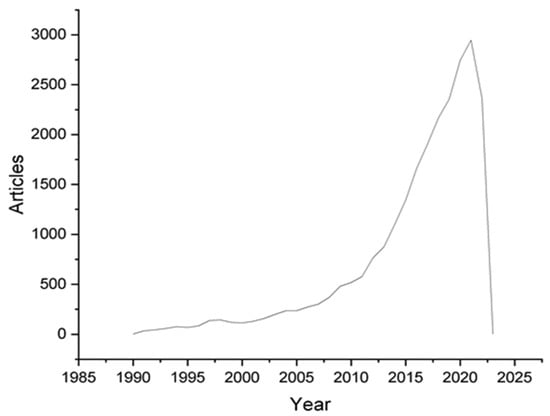
Figure 3.
Publications growth trend research from 2005 to 2022.
According to the article’s growth tendency, the entire era was separated into two major stages: the emerging stage (1990–2014) and the affluence stage (2014–2021). The number of published publications was quite low in the early stages, less than 50 per year; similarly, the yearly growth rate was slight. Following that, energy optimization had a burst, with the number of publications jumping from 1100 in 2014 to 2365 in 2022.
This rise may be attributed not only to increasing research interest but also to the fact that as the different factors costing productions evolved, it became clear that the identification of appropriate energy optimization strategies and financial strategies contributed to a 2.15 time increase in publications compared to 2014. It is worth mentioning that this increasing tendency has been reinforced as technology has developed and the energy prices have decreased.
Focusing on published papers, there are five sources that have made more materials available in this field of research throughout the years under consideration. Figure 4 shows the top ten most productive journals, which are Energies (797), Energy (601), Applied Energy (565), Energy Conversion and Management (377), and the Journal of Cleaner Production (293). With a steadily rising trend (Figure 5), the previous five years have definitely demonstrated the significance that the topic of energy optimization has taken on (168 documents in 2018, 288 in 2019, 472 in 2020, 675 in 2021, and 797 in 2022, with 2023 already having 797 documents published).
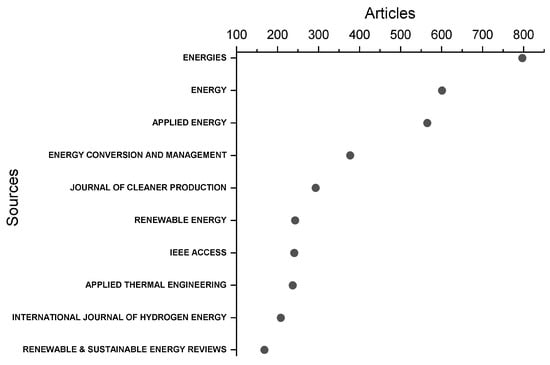
Figure 4.
Source documents by year.
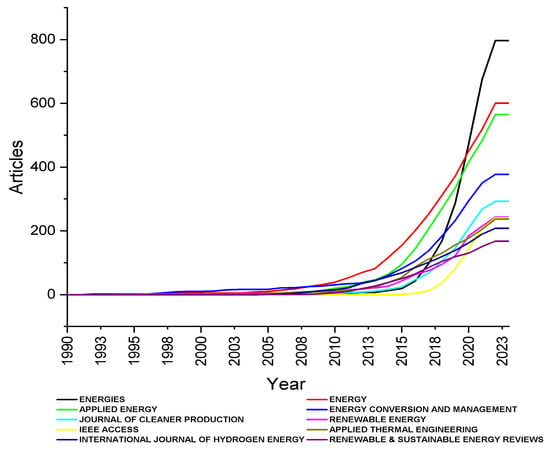
Figure 5.
Source documents by year.
With a significant expression in the last 5 years, these journals with the largest number of documents published have been seeing a steady growth in their number of local citations, with special significance to Applied Energy, with a number of local citations 19,685; followed by Energy, with a number of local citations 19,170; followed by Renewable and Sustainable Energy Reviews, with 13,887 citations; and Energy Conversion and Management, with 13,183 local citations, as shown in Figure 6.
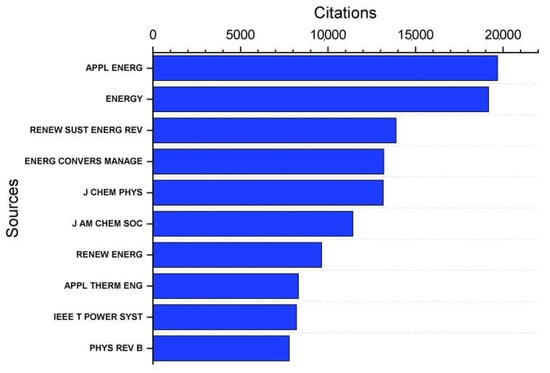
Figure 6.
Source citations.
Figure 7 shows when each author provided literature in this field. There were authors who were working from 1993 and 1995.
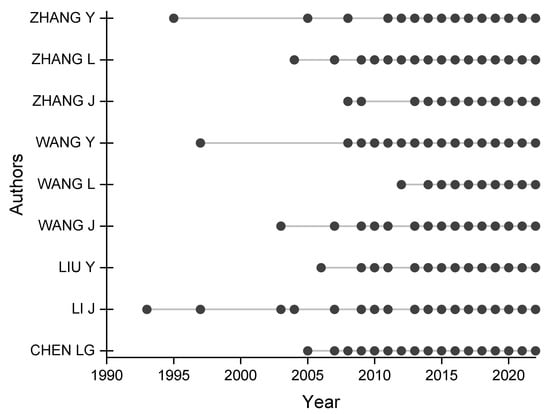
Figure 7.
A summary of the author’s work over time (1993–2023).
The total output was produced by 70,098 authors, with 911 authors of single-authored documents. Thus, the number of authors per publication on average is 0.35, and the average co-authors per paper is 4.31, with a collaboration index equal to 26.59%. Cheng L.G. from China topped the list with 31 Fractionalized Documents (FD), followed by Zhang Y. with 24.7 FD, Li J. with 22.8 FD, Wang Y. with 22.3 FD, Liu Y. with 17.7 FD, Li Y. with 17.4 FD, Zhang L. with 16.9 FD, Wang J. with 16.4 FD, Zhang J. with 15.8 FD, and Wang L. with 12 FD; these are among the key researchers (Figure 8). As previously said, energy optimization is viewed as an essential driver in the promotion and development of working processes, and a significant number of academics have been paying close attention to the subject in recent years.
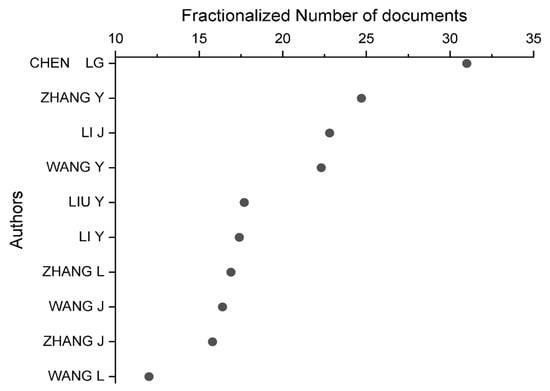
Figure 8.
Most relevant authors.
The top ten author level metrics based on H-G-M indexes are presented in Table 3. The H-index reflects both production and the influence of publishing; an author has H publications, and each article with H or more citations is how the H-index is determined, while the G-index is a subtype of the H-index that recognizes highly cited authors in the dataset. According to its developer, highly cited publications are important in determining the H-index.
Table 3.
H-Index top ten authors.
The identified article for the top H category is then discarded for further H-index determination throughout time. This suggests that the publications in the top category have no effect on the H-index of succeeding years, irrespective of the frequency of citations that grows with time [30]. G-index values are always equal to or larger than H-index values. Table 3 compares the M index authors who work in the field of agent-based modeling but have drastically varied career spans. The H-index is limited in that it is field-specific and time-based, and it disregards extensively referenced publications. Bibliometrics that account for time, such as the M-index, ought to be examined in the discovery of young researchers at an early stage, ideally in conjunction with critical peer review. The M-index offers the greatest potential for locating promising early stage researchers. According to a proposed a general guideline for understanding the index, an M-index > 2 is unusual, 1–2 is above average, and 1 is typical.
Highly cited authors who were cited more than 215 times have been depicted in Figure 9; the most highly cited author who received more than 522 citations originated from China. As shown, Chen L.G. is the most frequently referenced author (660 citations), followed by Sun F.R. with 391, Jorgensen W.L. (321), Abel R. (304), Sherman W. (258), Friesner R.A. (242), Mobley D.L. (241), Wang L. (225), Berne B.J. (215), and Lin T. (215). So, the number of received citations is impacted by the citation window, or the time period for which citations were computed, cumulative citations per year were used to regulate the fluctuation in citations.
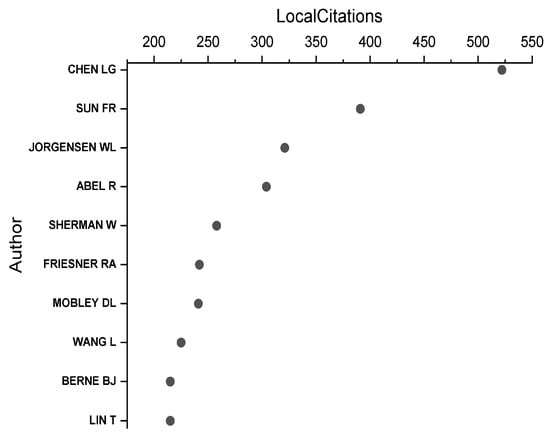
Figure 9.
Most locally cited authors.
According to the findings, four distinct publishers were chosen as the top ten most locally cited documents (Figure 10). These were the American Physical Society [31,32,33,34], the American Institute of Physics [35,36], IEEE Explore [37,38], Science [39], and Cambridge University Press [40]. The bulk of the journals, four in all, were published by the American Physical Society, whereas IEEE Explore and the American Institute of Physics published more than one. Science and Cambridge University Press had one document in total and were other prominent publishers rated in the top ten.
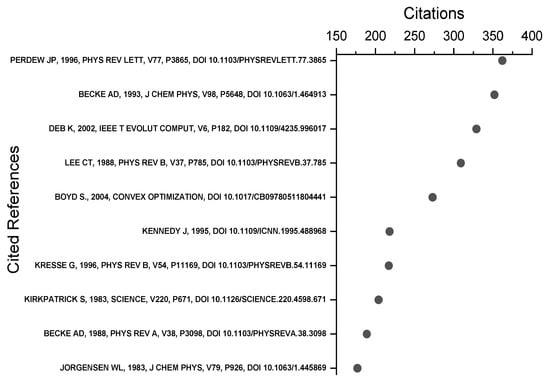
Figure 10.
Most top ten locally cited papers [31,32,33,34,35,36,37,38,39,40].
In line with our findings, six distinct publishers were chosen as the top ten most globally cited documents, as shown in Table 4. These were Elsevier, Wiley, Nature, the American Institute of Physics, the American Physical Society, and the ACS publication. The bulk of the journals, three in all, were published by Elsevier, whereas Wiley published two. Nature, the American Institute of Physics, the American Physical Society, and the ACS publication had one document in total.
Table 4.
Most of the top 25 globally cited papers.
Based on a review of the most-cited publications in the literature, the Quantum ESPRESSO open-source research software in electronics, simulation, and optimization is a collection concerns software applications designed for materials modeling and calculations of electronic structures. Its primary concentration remains on innovation and efficiency, with a particular emphasis on massively parallel architectures, and a strong emphasis on usability. The GNU General Public License makes it freely accessible to researchers all over the world [41].
They discussed how the GPW approach is now implemented in the QUICKSTEP application. The charge density’s dual representation enables an effective handling of the Hartree terms while maintaining the atomic orbital basis’s concise description of wave functions. In addition, because the function of the wave is entirely described in a localized basis, the Kohn–Sham matrix generation with linear scaling is achieved by monitoring procedures that result in sparse matrices. They demonstrated that high accuracy may be acquired by combining proven quality pseudopotentials with a succession of gradually increasing basis sets, as well as in the gaseous state and in the solution [42].
Supercapacitors represent a possible alternative way to fulfill the growing power demands of portable electronic gadgets, in particular, and energy storage systems in general. Because the energy storage mechanism is straightforward charge separation, supercapacitors can stock and transfer energy at comparatively high levels. The huge improvements in capacitance-attained supercapacitors work as a result of a combination of an exceedingly tiny distance between the opposing charges, by way of highly porous electrodes with a very large surface area and specified electric double-layer. Because of their unusually low cost, relatively high electrical conductivity, and high surface areas, a number of porous forms of carbon are now used as electrode materials. The power and energy-storage capacity of these items are inextricably linked to the chemical and physical features of the carbon electrodes [43].
It is demonstrated in this paper that using a high-level QM-based energy surface directly for the peptide backbone typically provides better agreement with experimental distributions than using the CHARMM22 force field [44].
Whereas docking and scoring rely on numerous approximations, their use during lead optimization, frequently in conjunction with other numerical algorithms, already extends more conventional methods to structure-based design [45].
Based on the particle swarm optimization approach utilized in the CALYPSO algorithm, they developed a complete framework for crystal structure prediction [46]. In complicated systems, their technique efficiently searched atomic arrangement for the free-energy space and ground-state of a solid’s lattice shape and metastable structures. The fundamental features in terms of the projected strategy are the PSO algorithm, the review ab initio structural optimization that is density-functional and theory-based, the geometrical structure parameter technique for eliminating comparable structures, and the symmetry constraint on structural creation. They developed a variable cell-size approach that allows for the intelligent selection of appropriate cell sizes, considerably lowering computing costs. This approach has been implemented successfully to a variety of conventional experimental structures on binary, ternary, and elemental compounds with covalent, ionic, and metallic bonds but not restricted to these.
Figure 11 illustrates the most prominent author keywords. The majority of the keywords are linked to optimization (1862), energy efficiency (692), and renewable energy (405). Author keywords demonstrated comparable research tendencies overall; the keywords highlighted the concentration of energy-related studies. As shown, author keywords focused energy sources, methods, and techniques, such as “renewable energy”, “solar energy”, “particle swarm optimization”, “machine learning”, etc.
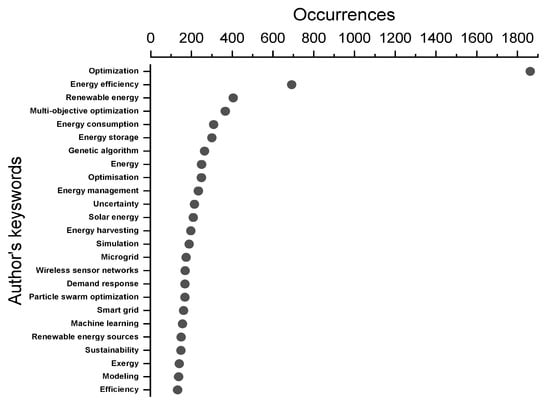
Figure 11.
Most relevant keywords. Data obtained from Web of Science.
Another intriguing factor to explore is the annual increase in the top ten keywords. Overall, every keyword climbed year after year, demonstrating the continued and steady expansion of energy optimization, the trend of which from 2014 to 2023 is clearly depicted in Figure 12. The facts show that “Optimization” has maintained the most common occurrence during the last decade. Since 2015, the second most common occurrence has been “Design”, with a substantial increase in the curve. “Performance” has gone up significantly since 2017, and it will be the third most popular term in 2023. Although “Design” has shown a considerable growth since 2014, it is expected to keep growing in the future.
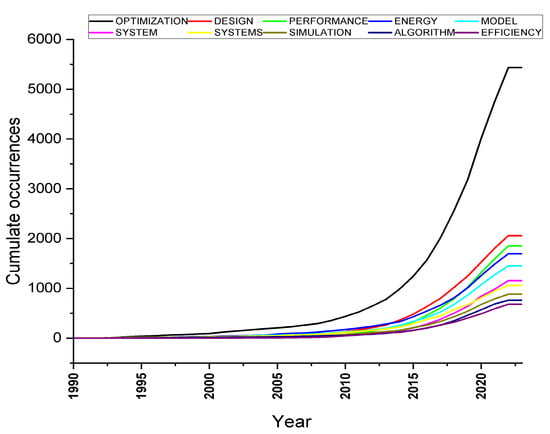
Figure 12.
Growth of the top 10 keywords.
A thematic map visualizes four different typologies of themes constructed on two dimensions, namely centrality and density. The motor themes, localized in upper-right quarter, have clusters that are important and well developed in energy optimization. Cluster 1 contains “Renewable energy” and “energy storage”, whereas Cluster 2 includes “energy efficiency”, “energy consumption”, and “energy harvesting”. Cluster 1’s position demonstrates the greatest density among these terms, as well as its above-average significance, as shown in Figure 13.
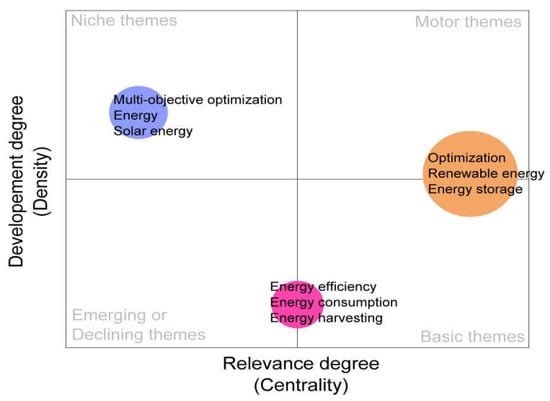
Figure 13.
Thematic map of keywords.
The niche themes quadrant in the upper-left quarter contains clusters that are well developed but not critical to the field. Cluster 1 comprises “multi-objective optimization”, “energy”, and “solar energy” from this quadrant.
Clusters with lower centrality and density in energy optimization may be not seen in the bottom-left quadrant labeled developing or decreasing topics. Furthermore, the lower-right quadrant, labeled fundamental themes, contains clusters that are important for the domain but are underdeveloped or clusters that are domain basis.
Figure 14 shows a Sankey diagram created to evaluate the theme progression. A Sankey diagram is used to showcase how several topics are related and have progressed earlier. Each box on the map represents the size of the boxes and the theme is proportionate to the frequency with which the topic occurs. The flows link each box, displaying the theme’s evolution traces; the greater connection between the two subjects, the thicker the connecting line. Analysts can easily determine the most prominent contributions, since each flow has a varying height depending on its quantity. Overall, it can be seen that as time passes, optimization subjects become increasingly widespread, most likely due to the rising attraction of scientists from many professions.
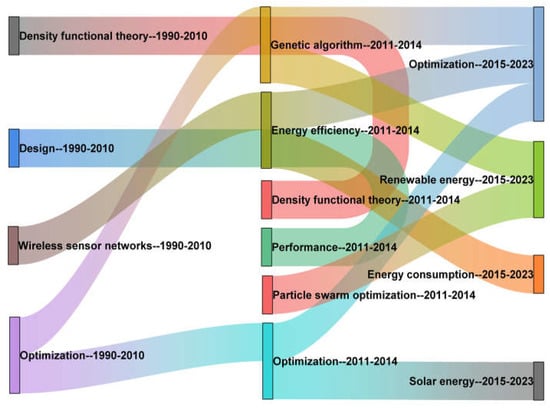
Figure 14.
Thematic evolution.
It is worth noting that the term “Optimization” originally originated between 1990–2010, was further refined during the next ten years, and has remained popular. Furthermore, between 2015 and 2023, this was the most popular topic.
China published the most articles (11,031 documents), followed by the United States of America with 7506 documents, Germany (3212), and India (2887), which contributed far fewer papers, as compared to the USA and China. Thus, these two countries together produced about 74 per cent of the total output. Canada, United Kingdom, Italy, France, and Spain were among the other countries of origin (Figure 15).
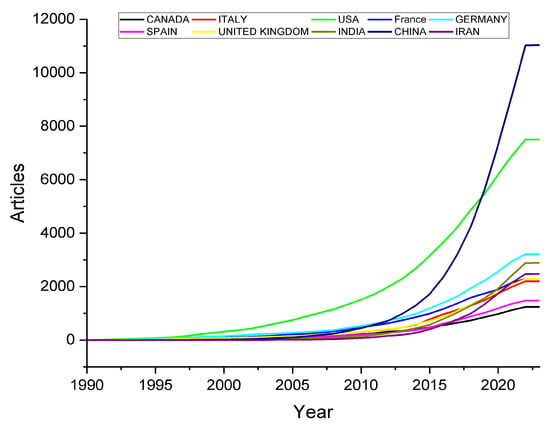
Figure 15.
Number of articles over time according to country of origin.
The output pattern indicates a highly skewed distribution of research production, since the output of the other countries not represented in Figure 16 ranged from 1 to 100 publications in total. The most mentioned nations are the United States (103,310 citations), China (84,614), Italy (36,155), United Kingdom (30,830), and Germany (27,748). Iran (21,748), India (18,087), France (17,728), Spain (15,410), and Australia (12,430) were among the other nations represented (Figure 16).
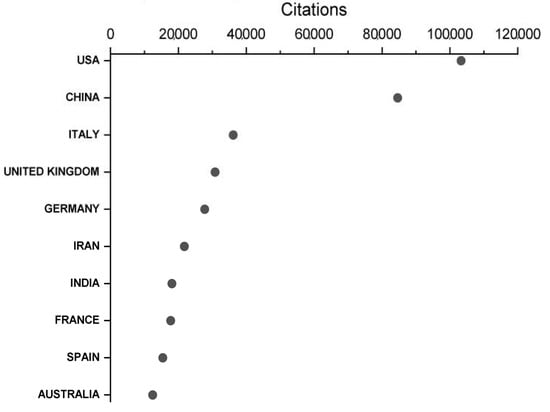
Figure 16.
Number of articles over time according to country of origin.
Noting that an issue, in order to be credited to a nation’s scientific production, needs at least one of the authors to be affiliated with an educational and/or research institution of that country, tells us that it is conceivable that the same scientific article is accounted for in more than one country; furthermore, in this study it is possible to see that there are documents that are common to numerous writers, which suggests that the same scientific document may be accounted for in more than one country.
4. Limitations of Analysis
This study has certain shortcomings that might be used as a starting point for further research. These limitations originate from the fact that it is dependent on quantitative analysis, and hence qualitative factors are ignored. Similarly, the study only looked at scientific publications from the WOS database; utilizing other databases, such as the Scopus, google scholar, Pro-Quest and PubMed databases, may yield somewhat different findings. Future research areas should also combine then compare the other databases not examined in this study to determine the veracity of the present findings.
5. Conclusions
The top ten authors who have engaged and published the most on the topic of energy optimization in its many aspects, as well as the primary sources of publishing and the associated citations, were identified. According to the analysis, it is from 2014 onwards that this topic begins to gain attention, with the number of publications progressively increasing over the previous few years. Assuming that the energy optimization topic is increasingly significant, papers published in top journals are the main vehicles sought by authors to communicate their work. The countries where these documents come from were also identified, demonstrating great interaction between the researchers and the origins of the work developed and the increasing research that has already been developed in energy optimization. The present investigation is of particular theoretical and practical importance because it contributes to a better understanding not only of the main work that has been developed in the area of energy optimization but also of the main sources of publication in the area, either in terms of countries or in terms of the main journals, and especially of the main authors who have been devolved. Given the considerable engagement that researchers of various nationalities have with each other, this work is also an important contribution to reflecting on collaborative development to be established, leading to improved levels of competitiveness and growth for the concerned institutions and nations.
Indeed, it is congruent with a recent bibliometric study in energy optimization that although there is a rising rate of interest in energy optimization research, industrialized nations provide over 90% of the production. Immediate focus should be placed outside traditional university research institutes to expanding the density of energy optimization research. This means that a structured research financing scheme is required. This will help to accelerate the advancement of energy optimization research, particularly in developing nations.
Remarkably, there has been an expanding pattern of growth over the last decades in the energy optimization study domain produced by experts from underdeveloped countries. As a result, energy optimization experts anticipate a favorable response. They must respond to energy optimization initiatives in order to pique interest, build expertise, and encourage empirical investigations in this field, particularly in developing nations.
This study’s conclusions are based on a list of key publications, papers, and empirically confirmed writers who shape the discourse of this subject. Our findings can be useful to researchers working in this sector. Furthermore, the discoveries of prominent academics and substantial materials gathered give opportunities for access points, particularly for fresh researchers. Furthermore, this research aids in the acceleration of discoveries on major conceptual issues and empirical research.
Finally, this study has bolstered the rising acknowledgment of the need of energy efficiency in attaining global sustainable development. It is clear that the obvious development trajectory of energy optimization research and its cross-disciplinary research are related to the dependability and quality of researchers working in this study issue.
Author Contributions
Conceptualization, I.H., B.S. and L.C.; methodology, I.H., B.S. and L.C.; software, I.H.; validation, I.H., B.S. and L.C.; formal analysis, I.H., B.S., A.B.H. and L.C.; investigation, I.H., B.S., A.B.H. and L.C.; resources, I.H.; data curation, I.H., B.S. and L.C.; writing—original draft preparation, I.H., B.S. and L.C.; writing—review and editing, I.H., B.S., A.B.H. and L.C.; visualization, I.H.; supervision, I.H., B.S. and L.C.; project administration, I.H., B.S. and L.C.; funding acquisition, L.C. All authors have read and agreed to the published version of the manuscript.
Funding
This work was granted by PHC Maghreb (Program Hubert Curien) MELINA (Mastering Efficient Lighting in North Africa, Grant number 43981ZG) and supported by the Ministry of Europe and Foreign Affairs (MEAE) in conjunction with the Ministry of Higher Education, Research and Innovation (MESRI) in France, and, in Morocco, by the Ministry of Higher Education, Scientific Research and Innovation, in partnership with the National Center for Scientific and Technical Research (CNRST).
Conflicts of Interest
The authors declare no conflict of interest.
References
- Yang, W.; Pang, C.; Huang, J.; Zeng, X. Sequence-to-Point Learning Based on Temporal Convolutional Networks for Nonintrusive Load Monitoring. IEEE Trans. Instrum. Meas. 2021, 70, 2512910. [Google Scholar] [CrossRef]
- Na, H.; Sun, J.; Qiu, Z.; Yuan, Y.; Du, T. Optimization of energy efficiency, energy consumption and CO2 emission in typical iron and steel manufacturing process. Energy 2022, 257, 124822. [Google Scholar] [CrossRef]
- Bilgaa, P.S.; Singha, S.; Kumar, R. Optimization of energy consumption response parameters for turning operation using Taguchi method. J. Clean. Prod. 2016, 137, 1406–1417. [Google Scholar] [CrossRef]
- Wen, X.; Cao, H.; Li, H.; Zheng, J.; Ge, W.; Chen, E.; Gao, X.; Hon, B. A dual energy benchmarking methodology for energy-efficient production planning and operation of discrete manufacturing systems using data mining techniques. Energy 2022, 255, 124542. [Google Scholar] [CrossRef]
- Cai, W.; Wang, L.; Li, L.; Xie, J.; Jia, S.; Zhang, X.; Jiang, Z.; Lai, K. A review on methods of energy performance improvement towards sustainable manufacturing from perspectives of energy monitoring, evaluation, optimization and benchmarking. Renew. Sustain. Energy Rev. 2022, 159, 112227. [Google Scholar] [CrossRef]
- Zhu, Y.; Dong, Z.; Cheng, Z.; Huang, X.; Dong, Y.; Zhang, Z. Neural network extended state-observer for energy system monitoring. Energy 2023, 263 Pt A, 125736. [Google Scholar] [CrossRef]
- Silva, E.A.d.; Urzagasti, C.A.; Maciel, J.N.; Ledesma, J.J.G.; Cavallari, M.R.; Ando Junior, O.H. Development of a Self-Calibrated Embedded System for Energy Management in Low Voltage. Energies 2022, 15, 8707. [Google Scholar] [CrossRef]
- Kasturi, S.; Kannappan, B.A. A methodological framework to benchmark and monitor energy performance in textile wet processing small and medium enterprises: Proposal and evaluation. Energy Sustain. Dev. 2022, 71, 585–599. [Google Scholar] [CrossRef]
- Maki, S.; Fujii, M.; Fujita, T.; Shiraishi, Y.; Ashina, S.; Gomi, K.; Sun, L.; Budi, S.; Ryoko, N.; Takahiro, N.; et al. A deep reinforced learning spatiotemporal energy demand estimation system using deep learning and electricity demand monitoring data. Appl. Energy 2022, 324, 119652. [Google Scholar] [CrossRef]
- Ampuño, G.; Lata-Garcia, J.; Jurado, F. Evaluation of Energy Efficiency and the Reduction of Atmospheric Emissions by Generating Electricity from a Solar Thermal Power Generation Plant. Energies 2020, 13, 645. [Google Scholar] [CrossRef]
- Zhang, H.; Li, L.; Li, L.; Cai, W.; Liu, J.; Sutherland, J.W. An integrated energy efficiency evaluation method for forging workshop based on IoT and data-driven. J. Manuf. Syst. 2022, 65, 510–527. [Google Scholar] [CrossRef]
- Ma, H.; Ding, A. Method for evaluation on energy consumption of cloud computing data center based on deep reinforcement learning. Electr. Power Syst. Res. 2022, 208, 107899. [Google Scholar] [CrossRef]
- Hu, L.; Zhao, X.; Liu, W.; Cai, W.; Xu, K.; Zhang, Z. Energy benchmark for energy-efficient path planning of the automated guided vehicle. Sci. Total Environ. 2023, 857 Pt 3, 159613. [Google Scholar] [CrossRef]
- Ragai, I.; Abdalla, A.S.; Abdeltawab, H.; Qiana, F.; Ma, J. Toward smart manufacturing: Analysis and classification of cutting parameters and energy consumption patterns in turning processes. J. Manuf. Syst. 2022, 64, 626–635. [Google Scholar] [CrossRef]
- Quevedo, T.C.; Geraldi, M.S.; Melo, A.P. Applying machine learning to develop energy benchmarking for university buildings in Brazil. J. Build. Eng. 2023, 63 Pt A, 105468. [Google Scholar] [CrossRef]
- Lee, J.; Kim, T.W.; Koo, C. A novel process model for developing a scalable room-level energy benchmark using real-time bigdata: Focused on identifying representative energy usage patterns. Renew. Sustain. Energy Rev. 2022, 169, 112944. [Google Scholar] [CrossRef]
- Ridha, H.M.; Hizam, H.; Mirjalili, S.; Othman, M.L.; Ya’acob, M.E.; Ahmadipour, M. Novel parameter extraction for Single, Double, and three diodes photovoltaic models based on robust adaptive arithmetic optimization algorithm and adaptive damping method of Berndt-Hall-Hall-Hausman. Sol. Energy 2022, 243, 35–61. [Google Scholar] [CrossRef]
- Gajic, I.M.S.; Savic, I.M. Optimization of ultrasound procedure for the sustainable production of oil from plum seeds. Carbon Resour. Convers. 2023, 6, 20–26. [Google Scholar] [CrossRef]
- Klemm, C.; Wiese, F. Indicators for the optimization of sustainable urban energy systems based on energy system modeling. Energy Sustain. Soc. 2022, 12, 3. [Google Scholar] [CrossRef]
- Tahir, K.A.; Zamorano, M.; García, J.O. Scientific mapping of optimization applied to microgrids integrated with renewable energy systems. Int. J. Electr. Power Energy Syst. 2023, 145, 108698. [Google Scholar] [CrossRef]
- Chen, Q.; Wang, W.; Wang, H.; Dong, Y.; He, S. Information gap-based coordination scheme for active distribution network considering charging/discharging optimization for electric vehicles and demand response. Int. J. Electr. Power Energy Syst. 2023, 145, 108652. [Google Scholar] [CrossRef]
- Fakhar, M.Z.; Yalcin, E.; Bilge, A. A survey of smart home energy conservation techniques. Expert Syst. Appl. 2023, 213 Pt B, 118974. [Google Scholar] [CrossRef]
- Ridha, H.M.; Gomes, C.; Hizam, H.; Ahmadipour, M.; Heidari, A.A.; Chen, H. Multi-objective optimization and multi-criteria decision-making methods for optimal design of standalone photovoltaic system: A comprehensive review. Renew. Sustain. Energy Rev. 2021, 135, 110202. [Google Scholar] [CrossRef]
- Zhang, L.; Ling, J.; Lin, M. Artificial intelligence in renewable energy: A comprehensive bibliometric analysis. Energy Rep. 2022, 8, 14072–14088. [Google Scholar] [CrossRef]
- Kumar, R.; Rani, S.; Al Awadh, M. Exploring the Application Sphere of the Internet of Things in Industry 4.0: A Review, Bibliometric and Content Analysis. Sensors 2022, 22, 4276. [Google Scholar] [CrossRef]
- Echchakoui, S. Why and how to merge Scopus and Web of Science during bibliometric analysis: The case of sales force literature from 1912 to 2019. J. Mark. Anal. 2020, 8, 165–184. [Google Scholar] [CrossRef]
- Popescu, D.V.; Dima, A.; Radu, E.; Dobrotă, E.M.; Dumitrache, V.M. Bibliometric Analysis of the Green Deal Policies in the Food Chain. Amfiteatru Econ. 2022, 24, 410–428. [Google Scholar] [CrossRef]
- Dima, A.; Bugheanu, A.-M.; Dinulescu, R.; Potcovaru, A.-M.; Stefanescu, C.A.; Marin, I. Exploring the Research Regarding Frugal Innovation and Business Sustainability through Bibliometric Analysis. Sustainability 2022, 14, 1326. [Google Scholar] [CrossRef]
- Rousseau, R. Forgotten founder of bibliometrics. Nature 2022, 510, 218. [Google Scholar] [CrossRef]
- Hirsch, J.E. An index to quantify an individual’s scientific research output. Proc. Natl. Acad. Sci. USA 2005, 102, 16569–16572. [Google Scholar] [CrossRef]
- Perdew, J.P.; Burke, K.; Ernzerhof, M. Generalized Gradient Approximation Made Simple. Phys. Rev. Lett. 1996, 77, 3865. [Google Scholar] [CrossRef] [PubMed]
- Lee, C.; Yang, W.; Parr, R.G. Development of the Colle-Salvetti correlation-energy formula into a functional of the electron density. Phys. Rev. B 1998, 37, 785. [Google Scholar] [CrossRef] [PubMed]
- Kresse, G.; Furthmüller, J. Efficient iterative schemes for ab initio total-energy calculations using a plane-wave basis set. Phys. Rev. B 1996, 54, 11169. [Google Scholar] [CrossRef] [PubMed]
- Becke, A.D. Density-functional exchange-energy approximation with correct asymptotic behavior. Phys. Rev. A 1988, 38, 3098. [Google Scholar] [CrossRef] [PubMed]
- Becke, A.D. Density-functional thermochemistry. III. The role of exact exchange. J. Chem. Phys. 1993, 98, 5648. [Google Scholar] [CrossRef]
- Jorgensen, W.L.; Chandrasekhar, J.; Madura, J.D. Comparison of simple potential functions for simulating liquid water. J. Chem. Phys. 1983, 79, 926. [Google Scholar] [CrossRef]
- Deb, K.; Pratap, A.; Agarwal, S.; Meyarivan, T.A. Fast and elitist multiobjective genetic algorithm: NSGA-II. IEEE Trans. Evol. Comput. 2002, 6, 182–197. [Google Scholar] [CrossRef]
- Kennedy, J.; Eberhart, R. Particle swarm optimization. In Proceedings of the ICNN’95—International Conference on Neural Networks, Perth, WA, Australia, 27 November–1 December 1995; Volume 4, pp. 1942–1948. [Google Scholar] [CrossRef]
- Kirkpatrick, S.; Gelatt, C.D.; Vecchi, M.P. Optimization by Simulated Annealing. Science 1983, 220, 671–680. [Google Scholar] [CrossRef]
- Boyd, S.; Vandenberghe, L. Convex Optimization; Cambridge University Press: New York, NY, USA, 2004; pp. 136–138, 234–236. [Google Scholar] [CrossRef]
- Giannozzi, P. QUANTUM ESPRESSO: A modular and open-source software project for quantum simulations of materials. J. Phys. Condens. Matter. 2009, 21, 395502. [Google Scholar] [CrossRef]
- VandeVondele, J.; Krack, M.; Mohamed, F.; Parrinello, M.; Chassaing, T.; Hutter, J. Quickstep: Fast and accurate density functional calculations using a mixed Gaussian and plane waves approach. Comput. Phys. Commun. 2005, 167, 103–128. [Google Scholar] [CrossRef]
- Pandolfo, A.G.; Hollenkamp, A.F. Carbon properties and their role in supercapacitors. J. Power Sources 2006, 157, 11–27. [Google Scholar] [CrossRef]
- Mackerell, A.D., Jr.; Feig, M.; Brooks, C.L., III. Extending the treatment of backbone energetics in protein force fields: Limitations of gas-phase quantum mechanics in reproducing protein conformational distributions in molecular dynamics simulations. J. Comput. Chem. 2004, 25, 1400–1415. [Google Scholar] [CrossRef] [PubMed]
- Kitchen, D.; Decornez, H.; Furr, J. Docking and scoring in virtual screening for drug discovery: Methods and applications. Nat. Rev. Drug Discov. 2004, 3, 935–949. [Google Scholar] [CrossRef] [PubMed]
- Wang, Y.; Lv, J.; Zhu, L.; Ma, Y. Crystal structure prediction via particle-swarm optimization. Phys. Rev. B 2010, 82, 094116. [Google Scholar] [CrossRef]
- Ye, S.; Xiao, F.; Pan, Y.X.; Ma, Y.Y.; Zhang, Q.Y. Phosphors in phosphor-converted white light-emitting diodes: Recent advances in materials, techniques and properties. Mater. Sci. Eng. R Rep. 2010, 71, 1–34. [Google Scholar] [CrossRef]
- Peterson, K.A. Accurate correlation consistent basis sets for molecular core–valence correlation effects: The second row atoms Al–Ar, and the first row atoms B–Ne revisited. J. Chem. Phys. 2002, 117, 10548. [Google Scholar] [CrossRef]
- Cheng, F.; Liang, J.; Tao, Z.; Chen, J. Functional Materials for Rechargeable Batteries. Adv. Mater. 2011, 23, 1695–1715. [Google Scholar] [CrossRef]
- Shi, X.; Yang, J.; Salvador, J.R.; Chi, M.; Cho, J.Y.; Wang, H.; Bai, S.; Yang, J.; Zhang, W.; Chen, L. Multiple-Filled Skutterudites: High Thermoelectric Figure of Merit through Separately Optimizing Electrical and Thermal Transports. J. Am. Chem. Soc. 2011, 133, 7837–7846. [Google Scholar] [CrossRef]
- Zoete, V.; Cuendet, M.A.; Grosdidier, A.; Michielin, O. SwissParam: A fast force field generation tool for small organic molecules. J. Comput. Chem. 2011, 32, 2359–2368. [Google Scholar] [CrossRef]
- Huang, C.; Zappone, A.; Alexandropoulos, G.C.; Debbah, M.; Yuen, C. Reconfigurable Intelligent Surfaces for Energy Efficiency in Wireless Communication. IEEE Trans. Wirel. Commun. 2019, 18, 4157–4170. [Google Scholar] [CrossRef]
- Zeng, Y.; Zhang, R. Energy-Efficient UAV Communication with Trajectory Optimization. IEEE Trans. Wirel. Commun. 2017, 16, 3747–3760. [Google Scholar] [CrossRef]
- Nielsen, C.B.; Holliday, S.; Chen, H.Y.; Cryer, S.J.; McCulloch, I. Non-Fullerene Electron Acceptors for Use in Organic Solar Cells. Acc. Chem. Res. 2015, 48, 2803–2812. [Google Scholar] [CrossRef] [PubMed]
- Tao, X.; Wang, J.; Liu, C.; Wang, H.; Yao, H.; Zheng, G.; Seh, Z.W.; Cai, Q.; Li, W.; Zhou, G.; et al. Balancing surface adsorption and diffusion of lithium-polysulfides on nonconductive oxides for lithium–sulfur battery design. Nat. Commun. 2016, 7, 11203. [Google Scholar] [CrossRef]
- Alecu, I.M.; Zheng, J.; Zhao, Y.; Truhlar, D.G. Computational Thermochemistry: Scale Factor Databases and Scale Factors for Vibrational Frequencies Obtained from Electronic Model Chemistries. J. Chem. Theory Comput. 2010, 6, 2872–2887. [Google Scholar] [CrossRef] [PubMed]
- Shimoni-Livny, L.; Glusker, J.P.; Bock, C.W. Lone Pair Functionality in Divalent Lead Compounds. Inorg. Chem. 1998, 37, 1853–1867. [Google Scholar] [CrossRef]
- Sun, D.; Roth, S.; Black, M.J. Secrets of optical flow estimation and their principles. In Proceedings of the IEEE Computer Society Conference on Computer Vision and Pattern Recognition, San Francisco, CA, USA, 13–18 June 2010; pp. 2432–2439. [Google Scholar] [CrossRef]
- Schwartz, B.J. Conjugated Polymers as Molecular Materials: How Chain Conformation and Film Morphology Influence Energy Transfer and Interchain Interactions. Annu. Rev. Phys. Chem. 2003, 54, 141–172. [Google Scholar] [CrossRef] [PubMed]
- Canutescu, A.A.; Shelenkov, A.A.; Dunbrack, R.L., Jr. A graph-theory algorithm for rapid protein side-chain prediction. Protein Sci. 2003, 12, 2001–2014. [Google Scholar] [CrossRef]
- Zhang, H.; Chen, G.; Bahnemann, D.W. Photoelectrocatalytic materials for environmental applications. J. Mater. Chem. 2009, 19, 5089–5121. [Google Scholar] [CrossRef]
- Burgard, A.P.; Pharkya, P.; Maranas, C.D. Optknock: A bilevel programming framework for identifying gene knockout strategies for microbial strain optimization. Biotechnol. Bioeng. 2003, 84, 647–657. [Google Scholar] [CrossRef]
- Tie, S.F.; Tan, C.W. A review of energy sources and energy management system in electric vehicles. Renew. Sustain. Energy Rev. 2013, 20, 82–102. [Google Scholar] [CrossRef]
- Oganov, A.R.; Lyakhov, A.O.; Valle, M. How Evolutionary Crystal Structure Prediction Works—And Why. Acc. Chem. Res. 2011, 44, 227–237. [Google Scholar] [CrossRef] [PubMed]
- Malik, A. Metal bioremediation through growing cells. Environ. Int. 2004, 30, 261–278. [Google Scholar] [CrossRef] [PubMed]
Disclaimer/Publisher’s Note: The statements, opinions and data contained in all publications are solely those of the individual author(s) and contributor(s) and not of MDPI and/or the editor(s). MDPI and/or the editor(s) disclaim responsibility for any injury to people or property resulting from any ideas, methods, instructions or products referred to in the content. |
© 2022 by the authors. Licensee MDPI, Basel, Switzerland. This article is an open access article distributed under the terms and conditions of the Creative Commons Attribution (CC BY) license (https://creativecommons.org/licenses/by/4.0/).