Abstract
In furtherance of the quest for green renewable and sustainable energy, an effort was made in this laboratory study to generate and harvest electric power from hot-mix asphalt (HMA); a viscoelastic material that is widely used for road construction. The underlying hypothesis is that the mechanical vibrations and strain energy induced by vehicle loading on the road (pavement) can be harnessed and converted into usable electric power by embedding piezoelectric sensors within the HMA layers of the pavement structure. To investigate the effects of HMA mix type on the generated energy, four commonly used Texas mix types, namely Type B (coarse-graded), Type C (dense-graded), Type D (dense-to-fine graded), and Type F (fine-graded), with up to seven different HMA mix-design volumetric characteristics were comparatively evaluated in the laboratory. In the study, the effects of loading, namely load magnitude and loading frequency, were investigated by simulating the traffic loading in the laboratory through comparative testing with the Hamburg wheel-tracking tester (HWTT) and the universal testing machine (UTM), respectively, at different temperature conditions. A prototype highway sensing and energy conversion (HiSEC) module with piezoelectric sensors was utilized for converting the applied stress on the HMA into harvestable electric energy during HWTT and UTM laboratory testing, respectively. The generated electric current, voltage, and power were measured and quantified using a multipurpose power meter. Overall, the study demonstrated that there is promising potential to harvest energy from HMA when subjected to transient loading under different temperature conditions. However, further refinement of the HiSEC module and piezoelectric sensors is still warranted to optimize the power generation and harvesting capacity, both in terms of efficiency and power output.
1. Introduction
With the growing worldwide quest for sustainable renewable and eco-friendly energy (i.e., green energy), various technological concepts are actively being explored. One such technological concept is the use of piezoelectric sensors to harvest energy from motion and mechanical vibrations [1,2,3]. Piezoelectric sensors convert any change in applied stress or strain, into an electric charge, thereby quantifying and enabling the measurement of the applied change. The theory behind piezoelectricity is that the displacement of ions from their equilibrium positions caused by mechanical loading (stress) in certain crystals (piezoelectric crystal) that lack a center of symmetry results in the generation of an electric moment or electric polarization [4,5,6].
1.1. Literature Review and Current Technologies
Randriantsoa et al. [7] have examined various existing energy harvesting systems ranging from the ambient energy sources (such as thermal energy from the sun) to mechanical vibrations from moving vehicles and concluded that these systems are potential renewable and eco-friendly energy supplements for diminishing fossil fuels. A previous study by Lallmamode et al. [8] had also reported similar findings that thermoelectric and piezoelectric energy harvesting systems can potentially convert thermal energy from solar radiation and mechanical strains from moving vehicles to generate electricity. Hossain et al. [9] echoed similar findings and concluded that solar and mechanical energy harvesting from asphalt pavements was eco-friendly, renewable (sustainable), and could also be implemented at pedestrian road crossings and intersections to alert distracted drivers at the time of a pedestrian crossing, with the likelihood of improving pedestrian safety as well. On the other hand, Vizzari et al.’s [10] review of pavement energy harvesting technologies indicated that electricity can be harvested using solar cells placed under a semi-transparent layer (photovoltaic road), or by means of a heat-transfer fluid (thermal solar systems).
In their field exploration study of a hydronic asphalt pavement (HAP) system, Saleh et al. [11] observed that the material properties, particularly the conductivity, of the asphalt layers was an influencing factor worth considering for optimizing the HAP system’s energy harvesting efficiency from the pavement. However, whilst Jiang et al. [12], Mona et al. [13], Ahmad et al. [14], and Al-Qadami et al. [15] inferred that solar and geothermal energy harvesting are some of the most efficient and mature technologies, these researchers also pointed out that (unlike other sources such as solar which is weather dependent) piezoelectric energy harvesting represents a potentially infinite source of renewable, sustainable, clean, and eco-friendly energy for as long as there is vehicular traffic moving on the road pavement. Duarte et al. [16] had also echoed similar sentiments that, whilst solar energy technology and photovoltaic systems are efficiently more advanced, their implementation on road pavements remains a challenge. They recommended more research studies to enhance the energy conversion efficiency of the piezoelectric (PZT) energy harvesting technology and associated systems.
Sherren et al. [17] have analytically explored harvesting energy using PZT modules (also called stacks) to power selected highways, tolls, and bridges in the USA state of Pennsylvania. The proposed smart highway road PZT energy harvesting (denoted as RPEH) system was computationally simulated using MATLAB and SOLIDWORKS to investigate the effects of the RPEH module parameters on the harvested voltage, current, power, and energy. Their numerical findings yielded 2mm as the optimum PZT stack thickness to maximize energy generation. Whilst acknowledging its infancy and high capital costs, Kim et al. [18], Al-Yafeai et al. [19], and Catak et al. [20] concluded that PZT-based energy harvesting has plausibly promising energy generation and competitive potential worthy of further exploration, research, and development into an efficient and mature implementable technology for renewable energy harvesting.
Although various recent research studies have paid attention to the energy harvesting technology using PZT sensors, limited studies have been conducted on in-service highways or full-scale test sections to determine the concept’s practical feasibility and economic competitiveness [21,22,23,24,25]. Thus, there is presently limited data in the literature on the field applications of piezoelectricity from highway pavements [26,27,28,29]. Wang et al. [30] conducted a comprehensive review study on the energy harvesting technologies on roadways and bridges. Their findings indicated that the generated power out of individual PZT transducers per passing vehicle is usually low. As highlighted by Iqbal et al. [31], this means that both repeated traffic loading and optimization of the PZT harvesters are necessary to improve the quantities of the generated power output. Evidently, this highlights the importance of investigating the effects of repetitive loading on PZT materials [30,32]. In this regard, this laboratory study was carefully crafted to establish a detailed protocol and methodology to test and evaluate the potential of an innovatively developed highway sensing and energy conversion (HiSEC) module and PZT sensors by simulating near-field conditions in the laboratory. The output generated from the study was aimed at serving as a means of quantifying and assessing the potential of PZT energy generation under simulated field applications. The methodology adopted was also envisioned, eventually, to serve as a measure for rating the energy output and capabilities of the prototype HiSEC module by customizing the test setup to imitate field loading and environmental conditions.
1.2. Study Goals and Objectives
In this laboratory study, the potential to generate and harvest the electric polarization of the PZT sensors when placed between the layers of conventional hot-mix asphalt (HMA) mixes was explored. A prototype of the highway sensing and energy conversion (HiSEC) module was developed for investigating its power harvesting potential in the laboratory using PZT sensors. The mechanical loading was simulated in the laboratory through testing with the Hamburg wheel-tracking tester (HWTT) and the universal testing machine (UTM), respectively, at different loading and temperature conditions for different HM mixes and mix-design volumetrics.
Understanding the key factors affecting the performance of energy harvesting systems is critical to improving the design and efficiency of such product systems as the HiSEC module. In this regard, this study’s primary goal was to systematically evaluate and optimize the performance of the PZT-based HiSEC energy harvesting system based on laboratory experimentation testing using different HMA mixes under HWTT and UTM loading, respectively. The specific objectives of this laboratory study were:
- ○
- Design and develop an energy harvesting module (HiSEC) capable of harvesting energy from laboratory load-induced stresses and strains.
- ○
- Investigate the effects of different types of HMA mixes and their mix-design volumetrics on the PZT (HiSEC) generated energy.
- ○
- Examine the influence of temperature on the performance of the HiSEC module.
- ○
- Determine the effects of loading magnitude and frequency on the HiSEC generated output power and energy,
- ○
- Comparatively evaluate the performance/capability of the HWTT and UTM test methods for simulating traffic loading, in the laboratory examination of the HiSEC module and PZT energy harvesting potential.
To achieve these objectives, the HiSEC module was tested with different HMA mix types and sample types/configurations under an array of different laboratory loading and temperature conditions. Concurrently, these simulated laboratory test variations also enabled our making rational recommendations for the concept, PZT sensor, and module improvements/modifications for energy generation optimization. As documented herein, descriptive statistical analysis, namely the coefficient of variation (CoV), was used to comparatively assess and quantitatively substantiate the quality, reliability, and validity of the laboratory test data and the corresponding HiSEC concepts.
1.3. Study Methology and Scope of Work
As aforementioned, one of the central objectives of this study was to identify the key factors that would potentially optimize and maximize the energy generated from the envisioned HiSEC module and PZT sensor setup when embedded in HMA mixes/layers and subjected to transient loading [21]. To accomplish these objectives and as elaborated subsequently, the study methodology and scope of work incorporated five strategic tasks, namely: (a) HiSEC module conceptualization and prototype fabrication; (b) HiSEC and PZT sensor laboratory test setup; (c) HWTT/UTM laboratory testing and energy measurements; (d) data processing and analysis; and (e) synthesis of the results and findings to draw up conclusions/recommendations. As discussed in the subsequent sections of this paper, whilst the HWTT and UTM were used to simulate the field conditions and provided the transient loading needed for generating the energy, the HMA mixes comprised of commonly used Texas mixes with different mix-design volumetrics. Note, however, that the scope of this laboratory study did not include the harvesting or storing of the generated energy; rather, it was limited to testing and ascertaining the practical feasibility of using the HiSEC technological concepts and PZT sensors for possible future real field applications [22,23,24]. Similarly, cost-effectiveness, life-cycle cost analysis (LCCA), and environmental sustainability assessments were outside the scope of this paper [25].
In the subsequent sections of this paper, the laboratory experimentation plan is discussed and includes the HiSEC module, PZT sensor, HWTT, and UTM test setups as well as the asphalt (HMA) mixes that were evaluated. The laboratory energy measurements and test results are thereafter presented, analyzed, and synthesized. The paper then concludes with a summary of the key findings and recommendations.
2. Laboratory Experimentation Plan
The laboratory test plan including the HiSEC module, HWTT, and UTM setup is discussed in the subsequent text. The discussion also includes the PZT sensors and the corresponding energy measurement units. The asphalt (HMA) mixes evaluated are also discussed in this section.
2.1. The HiSEC Module and Piezoelectric Sensors
The HiSEC module prototype was fabricated in a scaled-down version to facilitate laboratory investigation in the HWTT and UTM laboratory test setups. The 4-inch long × 2.5-inch wide × 1.5-inch thick (i.e., 101.6 mm × 63.5 mm × 38.1 mm) module comprises seven commercially sourced Steiner–Martins (SM111) piezoelectric (PZT) sensor disks (30 mm radius by 5 mm thickness) with copper foils inserted in between to make positive and negative electric contacts [33]. The disks were soldered together to make a stack that is wired with alternating disks sharing a common ground and operating mechanically in series, but electrically in parallel. As shown in Figure 1, the stack was then placed in a metal enclosure to tightly fit between the top and the bottom plates so that majority of the applied load would go through the PZT disks, as opposed to being carried by the module’s side walls. The disks used in the HiSEC module setup were made of SM111 piezoceramic material, which according to the technical characteristics by Steminc [33] is equivalent to modified PZT-4, Navy Type I sensor material. Detailed technical characteristics and material properties of the PZT sensors used in this study (namely modified PZT-4) can be found in the catalogue/brochure publication by Steminc [33].
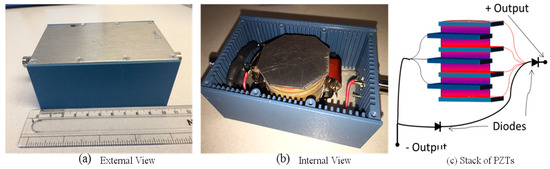
Figure 1.
The HiSEC Prototype Module Components.
A pair of rectifier diodes, in a full wave bridge configuration (namely Type BAT46 Schottky rectifiers), were then attached to either node of the circuit and included a Bayonet Neill–Concelman (BNC) cable connected to the electricity measurement device. An equivalent circuit model is schematically illustrated in Figure 2. Note that the load in Figure 2 is shown as a pure capacitor (C4 in this case) because it was felt at the time that energy storage for use in the battery charging schemes would be developed at a later stage.
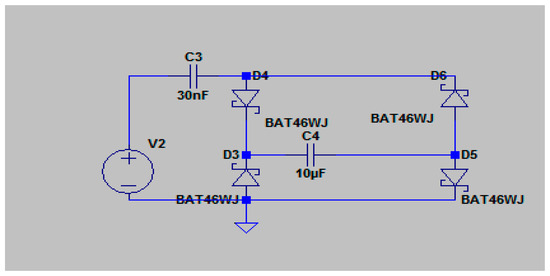
Figure 2.
Schematic Illustration of Equivalent Circuit Model.
In Figure 2, BAT46WJ represents the Schottky diodes forming a full-wave bridge rectifier for the PZT sensor-stack represented by V2 in series with capacitor C3. C4 represents the charge storage capacitor, which would (in a real application) be used as the input voltage source for a direct-current (DC-DC) converter to regulate the voltage output. The quantitative value of C3 is determined by the actual measurement of the PZT stack capacitance, and the value of C4 (10 uF) was determined by simulating different values in the range of 0.1 uF to 100 uF and finding a maximum in the rate of energy accumulation in C4 at about 30 uF.
Aluminum and steel were initially considered as the HiSEC casing materials (top and bottom plates); the latter was selected due to its quantitatively considerably higher stiffness (elastic modulus of steel = 220 GPa as compared to 71.7 GPa for aluminum).
2.2. HiSEC Module Setup and HWTT Testing
The Hamburg wheel-tracking test (HWTT) device is a laboratory performance test that is traditionally used for testing the rutting and stripping (moisture) susceptibility of HMA mixes [34,35]. The HWTT equipment comprises a steel wheel of known weight (158 lbs [0.703 kN]) that moves back and forth over compacted HMA samples at a user-defined speed and test temperature (under dry conditions or in a water bath) to simulate the movement of traffic wheels on the roadway pavement.
In this study, both the HMA sample setup and HWTT loading configuration were slightly modified to accommodate the HiSEC module. Instead of the standard 2-inch (50 mm) thick single HMA thickness, the HMA samples were placed in two layers. The bottom layer of HMA samples was fabricated to a 1.5-inch (37.5 mm) thickness to match the HiSEC module height and was placed on either side of the module to provide lateral confinement. Two 2-inch (50 mm) thick HMA samples were then placed on top of the HiSEC module. As illustrated in Figure 3, the HiSEC module is fully confined as compared to pavement materials in real field conditions.
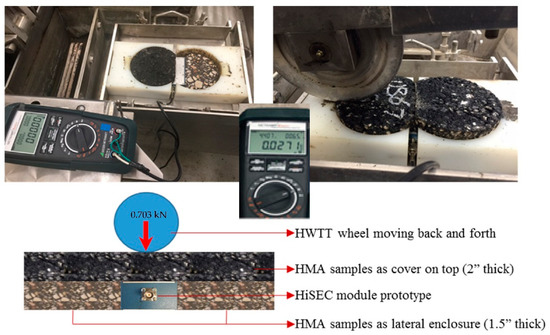
Figure 3.
The HWTT Loading Configuration and HiSEC Module Setup.
The HiSEC module was connected to a Metrameter® Energy multimeter using BNC cables to measure the current, voltage, and power output. The HWTT test was conducted in dry conditions at an ambient temperature of 20 °C [34]. The HWTT wheel speed was set at 60 passes per minute, which corresponds to about 1 Hz loading frequency (i.e., 0.1 s loading time and 0.9 s rest time) and approximately 1.2 ft/s (~36.6 cm/s) linear wheel speed. With a vertical load of 158 lbs (0.703 kN) and a wheel–surface contact area of about 2.325 inch2 (~1500 mm2), the applied vertical stress on the top HMA sample surface was approximately 68 psi (469 kPa).
2.3. HiSEC Module Setup and UTM Testing
The standard universal testing machine (UTM) consists of an environmental chamber with a two rigid column loading frame and a vertically movable actuator that facilitates various testing applications. The prototype HiSEC module was tested by placing it in between two 50 mm (2-inch) HMA samples and loaded dynamically in a stress-controlled Haversine loading mode. The HMA sample and HiSEC module setup in the UTM are illustrated in Figure 4.
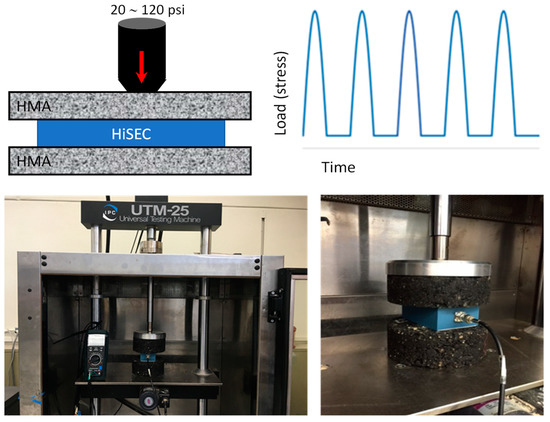
Figure 4.
The UTM Loading Configuration and HiSEC Module Setup.
Laboratory testing in the UTM was conducted at three test temperatures, namely 20, 40, and 50 °C, respectively. The applied vertical stress on the surface of the top HMA sample was varied from 20 to 120 psi in a 20-psi increment at two loading frequencies, namely 1 and 5 Hz, respectively, with some rest periods. As opposed to the HWTT setup, the UTM setup did not employ any lateral confinement to the HiSEC module to keep the test setup simple. However, the absence of lateral confinement did not significantly influence the generated energy and power output, as most of the stress was presumably transferred to the HiSEC module and PZT sensors.
2.4. Energy Measurements and Quantification
In both the HWTT and UTM tests, the energy generated was measured and quantified using a Metrameter® for the readings and recording of voltage, current, and power output. Figure 3 and Figure 4 illustrated the laboratory test setup for connecting the HiSEC module to the electricity measurement device for both the HWTT and UTM. The HiSEC module being tested was connected to the Metrameter® using a coaxial cable with a BNC connector. Once the load is applied, the live electricity measurements are displayed and recorded by the Metrameter®. As exemplified in Figure 3, the instantaneous voltage, current, and power measurements from the HWTT test were read and interpreted as follows: voltage = 4.407 V, power = 0.0271 mW, and current = 6.5 µA.
As stated above and exemplified in Figure 3, the energy generation and power output were measured directly using a Metrawatt meter, namely the Metrameter, that was sourced from the Gossen Metrawatt Company of Nürnberg (Nuremberg), Germany. To ensure maximum power output, the external resistance (RL) in the circuit should generally be equal to the internal resistance (RS) of the prototype HiSEC to obtain the maximum power, which is defined as impedance matching [36]. The internal capacitance of the prototype HiSEC depends on the number of PZT disks. The theoretically calculated resistance is an approximate and, therefore, another attempt was made in the study to measure the optimum resistance, RS. To achieve this, several electrical load values close to the calculated RS were applied to the HiSEC circuit using an external resistance substitution box [22]. In practice, however, the Metrameter’s input impedance is very high. This is primarily because it is designed to make simultaneous voltage and current measurements, which are not part of the loading of the circuit.
2.5. Materials and Asphalt (HMA) Mixes Evaluated
To investigate the effects of HMA mix type on the generated energy, four commonly used Texas mix types, namely Type B (coarse-graded), Type C (dense-graded), Type D (dense-to-fine graded), and Type F (fine-graded), with up to seven different HMA mix-design characteristics were comparatively evaluated. The HMA mix-design details are listed in Table 1 and include the mix type, highway, asphalt-binder type, and content (by weight of the aggregate), aggregate type, etc. These HMA mixes were selected to include the typical aggregate gradations ranging from fine- to coarse-graded as well as geographical coverage of some of the main climatic zones of Texas, namely wet–warm (WW), wet–cold (WC), and moderate (M) climatic regions.

Table 1.
HMA Mixes and Volumetric Characteristics.
All the HMA samples tested were molded and fabricated in the laboratory from plant-produced mixes using the Superpave gyratory compactor. Consistent with the Texas specifications for laboratory performance testing, all the HMA samples were molded to a target density of 93 ± 1%, i.e., 7 ± 1% air voids (AV) [34]. Three replicate samples of each HMA mix were tested per test type per test condition, with the output data and variability/repeatability assessed at 95% confidence (reliability) level [37,38]. The HMA mixes’ corresponding moduli values at 5 Hz are exemplified in Figure 5 as a function of temperature. A similar moduli response trend was also observed at 1 Hz.
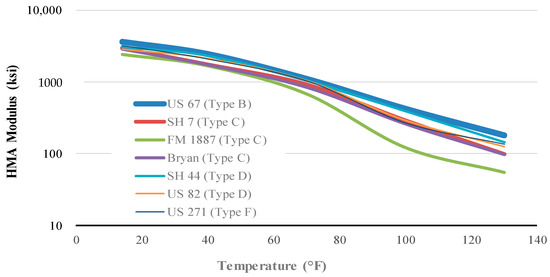
Figure 5.
HMA Moduli Values at 5 Hz.
3. Laboratory Test Results and Analysis
This section presents the HWTT and UTM laboratory test results and the corresponding analyses based on the HiSEC module testing with PZT sensors. However, it should be noted here that these laboratory test results pertain only to the HMA mixes, HiSEC module, PZT sensors, and the laboratory test conditions defined in this study. Therefore, the overall findings and conclusions may not be exhaustive.
3.1. HWTT-HiSEC Test Results—Asphalt (HMA) Type Variation
As described earlier in the HWTT test setup, the HiSEC prototype module was subjected to repeated wheel loading at about 1 Hz loading frequency at room temperature (20 °C). Five different HMA mixes with three different mix types/gradations, namely Type B, Type C, and Type D, were used and the corresponding test results in terms of the current, voltage, and power outputs are presented in Figure 6.
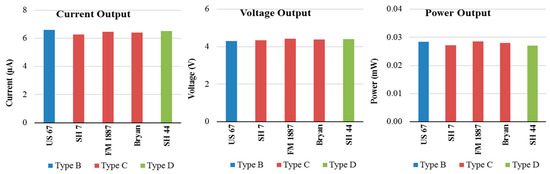
Figure 6.
HWTT-HiSEC Energy Generation—HMA Variation (1 Hz and 20 °C).
Figure 5 shows no significant effect of mix type variation and gradation on the energy generation potential of the HiSEC module and PZT sensors at 20 °C with 50 mm top HMA cover. Due to the rigidity and stiffness (i.e., high modulus values) of the HMA mixes at the 20 °C testing temperature, an almost identical transfer of the applied wheel load onto the module is achieved irrespective of the asphalt (HMA) mix type. As a result of the applied stress being transferred almost equally using different HMA types, mix-designs, volumetrics, and gradations, one can infer that the HMA properties at ambient and cold temperatures have no major impact on the HiSEC’s energy generation and power output.
The laboratory test results shown in Figure 6 also indicate that the power output is of very low magnitude. This is possibly due to the relatively low applied load level of 0.703 kN in the HWTT setup versus about 20 kN for a typical truck wheel load [39]. The HWTT test setup adapted in this study had limitations and challenges in terms of its ability to vary the test temperature and applied loading. Therefore, it is less suitable for routine laboratory evaluation of the energy generation and harvesting potential of the HiSEC modules compared to a system where the test temperature, frequency, and applied stress can be easily varied such as the UTM, which is discussed in the subsequent section of this paper. However, one key advantage of the HWTT is the ability to simulate an actual moving wheel load over the HiSEC module, thus representing near field traffic-loading patterns to a limited extent.
Although of relatively small magnitude, the test results are nonetheless indicative of the potential to generate and harvest energy from HMA through HWTT testing with the aid of the HiSEC module and PZT sensors. Similarly, the HiSEC module, through use of PZT sensors, has demonstrated its potential to convert the applied stress into electric power when embedded within the HMA samples. Work by Dessouky et al. [40] has already shown that optimization of the HiSEC module can increase the power output by up to fourfold. Thus, further modification and enhancement of the HWTT test setup along with the refinement of the HiSEC module is likely to yield higher power output.
3.2. UTM-HiSEC Test Results—Frequency and Load (Stress) Variation
The HiSEC module and PZT sensors were extensively tested in the UTM setup with varying applied stress, test temperature, and loading frequencies. The applied stress on the surface of the top HMA sample was varied between 20 to 120 psi (138–827 kPa) in a 20-psi (138 kPa) increment. Three test temperatures, namely 20, 40, and 50 °C were adopted to test the HiSEC module’s sensitivity to temperature variation. Two loading frequencies, namely 1 Hz and 5 Hz, were initially tried with 0.9 s and 0.1 s rest period, respectively (see Figure 7). The corresponding current, voltage, and power output for these two loading frequencies are presented in Figure 8 for a dense-to-fine-graded Type D mix from highway US 82 in the Paris District of Texas.

Figure 7.
UTM Loading Scheme for Testing the HiSEC Module.
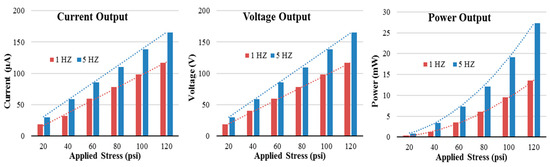
Figure 8.
UTM-HiSEC Energy Generation—Frequency Variation (US 82, Type D, 20 °C).
As can be observed from Figure 8, for each applied stress level on the HiSEC module, higher loading frequency (i.e., 5 Hz with shorter rest periods of 0.1 s) yielded higher current, voltage, and power output, respectively. This is theoretically expected since, at higher loading frequency (with shorter rest periods), the PZT sensor disks get more actuations in one second, resulting in the generation of more electric charge than 1 Hz. That is five loading cycles with shorter rest periods of about 0.1 s each are applied at 5 Hz as opposed to 1 Hz with only one load cycle and a 0.9 s rest period within the same one-second timeframe. In summary, the higher the loading frequency (i.e., shorter rest periods), the greater the generated energy. However, the 1 Hz loading frequency was adapted for further HMA testing to facilitate easy comparison with the HWTT test results whose loading pattern/frequency is closer to 1 Hz.
Figure 9 shows the stress–energy correlations for four typical Texas mixes, ranging from coarse- to fine-graded HMA mixes, i.e., Type B (coarse-graded), Type C (dense-graded), Type D (dense-to-fine-graded), and Type F (fine-graded) at 1 Hz and 20 °C, respectively.
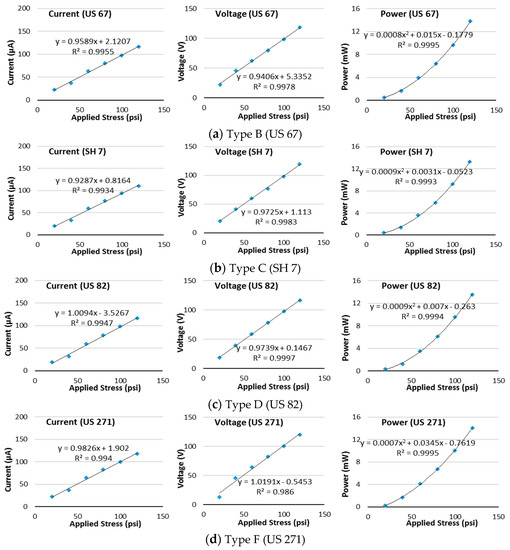
Figure 9.
UTM-HiSEC Stress-Energy Correlations (1 Hz, 20 °C).
The effects of the applied stress on the generated energy output are clear in Figure 9. The correlation between the current and voltage output follows a linear relationship with the applied stress, with a coefficient of correlation (R2) of 99%. However, the correlation of the resulting power (P) with the applied stress is better described by a second order polynomial function (see Figure 9). This is indifferent to the expected square-law power-stress relationship for PZT sensors. Overall, the results in both Figure 8 and Figure 9 suggest that a highway location with frequent (i.e., less headway between consecutive vehicles) and heavy traffic loading (i.e., higher applied vertical stress) is more suited for HiSEC module and PZT sensor deployment to maximize the power generation potential.
3.3. UTM-HiSEC Test Results—Asphalt (HMA) Mix Type Variation
To evaluate the effects of HMA mix type on the HiSEC energy harvesting, the module was tested with seven different HMA mix-designs and gradations, as was described in Table 1. The generated current, voltage, and power output for each HMA mix type are presented in Figure 10. Like the HWTT test results, Figure 10 suggests that the current, voltage, and power outputs do not significantly vary with respect to HMA mix type and aggregate gradation. Considering that the HiSEC module was not confined, and due to the rigidity/stiffness (modulus) of the HMA mixes, the PZT sensors receive an almost equal value of the applied stress and are subjected to the same ratio of rest period to loading time (i.e., RP-LT ratio); hence, they result in similar energy outputs.
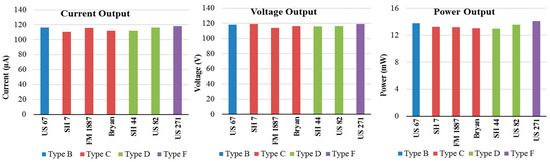
Figure 10.
UTM-HiSEC Energy Generation HMA Variation (1 Hz, 20 °C).
3.4. UTM-HiSEC Test Results—Temperature Variation
As a viscoelastic material [41], the HMA response behavior is highly dependent on temperature variation. Therefore, it was theoretically anticipated that the test temperature would affect the efficiency of the HMA layer on top of the HiSEC module in transferring the applied vertical stress as a function of the RP–LT ratio, thus affecting the energy generation and harvesting potential of the HiSEC module. Figure 11 presents the current, voltage, and power output for the module at different test temperatures, i.e., 20, 40, and 50 °C with a US 82 Type D mix (dense-to-fine-graded) as the HMA top 50 mm thick layer.
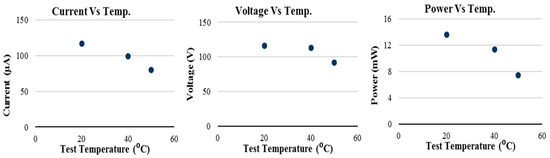
Figure 11.
UTM-HiSEC Energy Generation—Temperature Variation (US 82 Type D, 1 Hz).
As was theoretically expected, the energy outputs in Figure 11 show sensitivity to test temperature. The decreasing energy output with increasing temperature indicates that at higher temperatures, the HMA mix becomes softer, and this affects how the applied vertical stress transfers along the HMA depth. Theoretically, this is so because the HMA mix needs more time to recover itself; hence the increasing RP-LT ratio. Under high-temperature conditions, the applied stress is transferred in a longer period, in both the loading and unloading phases. Therefore, the actual loading waveform on the PZT disks is more stretched compared to the initial loading waveform applied by the UTM on the surface of the top HMA sample. This observation suggests that colder climatic regions with longer winter seasons and high traffic loading will be more suited for the deployment of the HiSEC module to maximize energy harvesting.
Nonetheless, these results may also warrant the exploration of means to further stabilize and optimize the HiSEC energy generation potential and output performance at high UTM test temperatures in future follow-up studies. On the other hand, this could also be an inherent limitation, suggesting that the current UTM laboratory test setup (without custom modification) may not be ideal for HiSEC energy generation at elevated temperatures exceeding 40 °C.
4. Synthesis of the Results and Findings
The results and findings from the laboratory testing presented herein confirm the expected theoretical trends in terms of the amount of energy generated with respect to varying temperatures and loading frequencies. One such observed response-trend was that the energy output increased as the loading frequency was increased from 1 Hz to 5 Hz in the UTM test setup. Similarly, and as expected, the energy output dropped with an increase in the test temperature of the HMA samples; this is owing to the inherent deterioration of the HMA capacity to transfer the applied stresses and change in the loading waveform at higher temperatures. Another significant outcome of this study was the fact that HMA mix type and aggregate gradation was found not to significantly affect the energy output at low to ambient temperatures. The significance of these trends/patterns with respect to varying loads and test temperatures is discussed in the subsequent text and elicits further studies for better understanding of the HiSEC conceptual application for energy generation from HMA and asphalt roads.
4.1. Comparison of the HWTT-UTM Test Results
Both the HWTT and UTM tests are well established and proven methods to measure and evaluate the performance of HMA in the laboratory. Although they are employed to achieve a common objective, these test methods fundamentally operate based on completely different theories and loading configurations. The UTM, for instance, applies dynamic vertical loading on the HMA sample at a user-defined loading frequency, temperature, and applied stress levels, whereas the HWTT setup applies a constant load dynamically by means of a moving steel wheel that weighs 158 lbs (0.703 kN) and whose speed is user-controlled just as is the test temperature of the HMA samples.
In this study, the speed of the HWTT wheel and the number of passes were modified to achieve the 1Hz frequency of loading, which is the lowest possible loading frequency supported by the UTM. By analyzing the video of the wheel motion captured during the HWTT frame by frame, it was determined that the time taken for the wheel to pass over the HiSEC module placed exactly at the center of the HMA sample setup was close to 0.1 sec (when the HWTT wheel was set at 60 passes/min). The resultant energy generated from both the HWTT and UTM tests at similar loading frequencies were compared. The comparison corroborated the theoretical assumption that the HWTT results would be significantly lower than its UTM counterpart owing to the dynamic and transient nature of the applied wheel load as well as the lateral confinement.
Although of a small magnitude, the results are nonetheless indicative of the potential to generate and harvest energy from highway traffic with the aid of the HiSEC module and PZT sensors. Similarly, the HiSEC module has demonstrated its potential to successfully convert the applied stress into energy (power) when embedded within the HMA samples and subjected to laboratory HWTT or UTM loading. Evidently, future refinement/enhancement of the HiSEC module and modification improvements to the laboratory test setups are likely to yield more favorable results in terms of the energy output.
4.2. Statistical Viability of the Concept and Test Methods
The results generated by the chosen test methods (namely HWTT and UTM) were found to be statistically sound at 95% reliability level in terms of the consistency of the output data at all the test temperatures and loading frequencies considered. The HiSEC module with PZT sensors was tested multiple times by simulating the same set of loading and temperature conditions on different occasions to check for inconsistencies and statistical repeatability. As exemplified by the Type F mix (US 271) in Table 2, the statistical measure of dispersion or the coefficient of variation (CoV) of the output data was calculated for all HMA mix types and test temperatures [38,42,43,44].
Table 2.
CV Results for Type F (US 271).
As the CoV data presented in Table 2 clearly shows, the degree of dispersion is very minimal and below 5% for all the test temperatures and applied loads that were evaluated. Similar CoV trends were recorded for all the HMA mixes and test conditions considered in the study. Considering a reliability level of 95% [45], these low CoV values are a statistical validation that the adapted laboratory test protocols and the prototype HiSEC module (with PZT sensors) are very repeatable and reliable devices with very low variability in the output data; the computed CoV values were significantly lower than the 30% threshold (i.e., CoV < 30%) that is typically used to measure the repeatability, data quality, and statistical credibility of laboratory HMA testing [43].
4.3. Refinement of the HiSEC Module and Piezoelectric Sensors
From the perspective of the laboratory tests used in this study, the prototype HiSEC module can be further refined and enhanced to produce better and more efficient results, i.e., maximize energy (power) output. For instance, the laboratory tests conducted in the UTM would yield results that are probably more accurate and generate more energy if the shape of the HiSEC module were to mimic the shape of the HMA samples that encompass it. Although a customized circular HiSEC module would prove to be redundant in the field, the suggested refinement would produce more energy in terms of both quantity and accuracy in a laboratory setup. Similarly, customizing the HiSEC module to adapt to the HWTT setup would likely improve the energy yield and reliability of the results produced.
One of the most critical features of using PZT sensors within the HMA is their durability. Roshani et al. [24] conducted a research study on the durability performance of the PZT-based prototypes under simulated traffic loading by applying a total of 43,200 load cycles using an asphalt pavement analyzer (APA) machine. The corresponding test results showed that the output power was consistent under repetitive loading, indicating a low risk of premature deterioration in the laboratory, but with an obvious need for field experimentation and validation studies. On installation of these PZT sensors and HiSEC modules in the field, exposure to rain and other extreme varying climatic conditions could potentially lead to an array of probable issues to deal with. For instance, prolonged exposure to water (rain) might affect the structural integrity of the module and its sensitivity. To fully exploit its potential, further studies must be conducted to explore ways to optimize the HiSEC module by reducing its susceptibility to physical or climatic changes around it. With the current prototype, there is more scope for refinement in terms of the structural integrity of the HiSEC module, as aforementioned, to cater to the specific needs of the environment around it. The shape and geometry of the module need to be further experimented with to find an optimum design both structural-wise and in terms of energy generation/harvesting potential including conducting field verification and validation studies.
4.4. Study Limitations and Future Perspectives
Seven HMA mixes were evaluated in this study; of which 71% were dense-to-fine graded with the asphalt-binder ranging from 4.1% to 6.8%, mostly PG 64-22. Only one HMA mix each were coarse- and fine-graded, respectively, with majority of the aggregates being limestone, gravel, sandstone, RAP, and RAS. To further supplement and substantiate the results documented herein, a diverse array of HMA mixes with varied mix-design volumetrics need to be evaluated to better ascertain which HMA mix types provide the best compatibility and energy yield with the HiSEC module.
Whilst the HWTT was run at one loading frequency of 1 Hz, one loading level (0.703 kN), and one temperature (20 °C), the UTM was conducted at multiple test temperatures (20~50 °C), load levels (20~120 psi), and two loading frequencies of 1 Hz and 5 Hz, respectively. Therefore, there is need to vary the HWTT test loading parameters to better simulate the field conditions. Furthermore, the HWTT test was conducted under laterally confined dry conditions that might have impacted the HiSEC’s energy generation potential. Therefore, there is a need to explore other environments and field-simulated conditions.
In the UTM test setup, there was no lateral confinement, and it was more like an impact dynamically applied vertical loading to the HiSEC–HMA sample setup. Furthermore, a significant decay in the HiSEC generated energy was also recorded for high test temperatures exceeding 40 °C. Thus, custom modification and enhancements may be warranted in future studies for the UTM–HiSEC test setup to be able to accommodate elevated temperatures. Whilst HMA sample fabrication/compatibility presented its own challenges, particularly with the HWTT test setup, it was also observed that modification/enhancement and refinement of the HiSEC module geometry as well as the PZT materials were also deemed to be critical aspects worth exploring in future studies.
In general, however, the study yielded plausible and potentially promising results worthy of continued future exploration. To further substantiate this laboratory study’s findings and enhance the energy generation efficiency of the HiSEC module, the following are recommended: (a) enhancing the HiSEC module geometry; (b) trying different HiSEC and PZT materials that are both cost-effective and have high energy generation potential; (c) exploring different PZT circuitry configurations; (d) exploring other laboratory tests and HMA sample setups such as the APA; and (e) evaluating more HMA mixes with different materials and a diverse array of mix-design volumetrics. Furthermore, in addition to field testing and validation of the HiSEC module, future prospective studies should also consider comparisons with other energy sources in terms of the energy output, costs, system maintenance/durability, economic, LCCA, sustainability, and environmental impacts.
5. Summary and Recommendations
The energy generation potential of the prototype HiSEC module (with PZT sensors) was evaluated in the laboratory with two test setups, the HWTT and the UTM. A variety of loading conditions were used for the laboratory investigation by varying the loading frequency, applied stress, test temperature, and HMA mix type/gradation. The findings and recommendations from these laboratory tests are summarized as follows:
- ○
- The results of the HWTT and UTM tests indicated that the influence of HMA properties, such as asphalt mix type, at ambient and cold temperatures has no major impact on the HiSEC’s energy generation and power output potential,
- ○
- At 20 °C test temperature and 1 Hz loading frequency, the HMA type was found not to affect the generated voltage, current, or power in either the HWTT or UTM test setups. At these laboratory loading conditions, due to the stiffness (i.e., high modulus values) of the HMA mixes, the HiSEC module experiences almost equivalent values and forms of the vertical stress. For the laboratory tests performed and asphalt mixes considered, it was therefore concluded that the HMA mix-design properties have negligible effect on the HiSEC’s energy output.
- ○
- Due to the viscoelastic nature of HMA, the energy generation potential of the HiSEC module is affected by the test temperature. At higher temperatures, the HMA layer on top of the HiSEC module becomes softer and causes a delay in both the loading and unloading phases, resulting in a stretched loading waveform applied on the PZT sensor disks, which consequently leads to a lower energy (power) output.
- ○
- Higher loading frequency results in higher energy generation from the HiSEC module. Moreover, higher applied vertical stress generates higher power; that is, the higher the loading, the greater the amount of energy generated.
- ○
- The laboratory test results inferred that a highway (road) with frequent, high volume, and heavy traffic loading in colder climatic conditions will be more suited for deploying the HiSEC module for maximizing energy harvesting. However, field validation is still warranted to substantiate these inferences.
- ○
- The voltage generated from the HiSEC module in the UTM setup was found to be reasonably high, namely in the range of 120 volts for 120 psi (~827.37 kPa) applied stress at 20 °C test temperature and 1 Hz loading frequency. However, the power output was relatively low, in the range of 13~14 mW.
- ○
- The HWTT test setup can apply repeated wheel loading to the HiSEC module in a laterally confined condition. However, the generated current, voltage, and power output are relatively low due to the low applied vertical loading.
- ○
- The HWTT setup explored in the study uses a fixed wheel load of 158 lbs (0.703 kN) and cannot vary the test temperature while running in dry conditions. Moreover, the sample preparation and the overall test setup in the HWTT is slightly more complicated than the UTM. The UTM test setup, on the other hand, has provisions for varying the test temperature, applied stress, and frequency and, overall, it is a simpler test setup. Therefore, the UTM test setup would be recommended for continued exploration and optimization of energy harvesting with PZT sensors and the HiSEC module.
Overall, this laboratory study provided evidence that there is promising potential to generate and sustainably harvest energy through the insertion of PZT sensors in asphalt (HMA) layers within the highway pavement structures. While the concept is still in its infancy, there is potential for maximizing power output, particularly with further refinement and enhancement of the HiSEC module to improve its efficiency, sensitivity, and robustness. Thus, more laboratory testing and evaluation of the HiSEC module are strongly recommended along with trial field testing, either through accelerated pavement testing or on in-service highways. In addition to the HiSEC durability and reusability analysis, future follow-up studies should also include cost-effectiveness, life-cycle cost analysis (LCCA), socioeconomic impacts, and environmental sustainability assessment, as well as exploring means to optimize the HiSEC’s energy generation potential at high UTM test temperatures or custom modification of the UTM test setup.
Author Contributions
Conceptualization, L.F.W.; methodology, A.N.M.F. and L.F.W.; validation, A.N.M.F., L.F.W. and A.M.; formal analysis, A.N.M.F. and L.F.W.; investigation, A.N.M.F. and L.F.W.; resources, L.F.W., J.H. and S.D.; data curation, A.N.M.F., H.R. and L.F.W.; writing—original draft preparation, L.F.W. and A.N.M.F.; writing—review and editing, A.N.M.F., L.K., J.H., L.F.W. and S.D.; visualization, A.N.M.F., A.M., H.R. and L.K.; supervision, L.F.W.; study administration, L.F.W. and S.D. All authors have read and agreed to the published version of the manuscript.
Funding
This research received no external funding.
Data Availability Statement
Data is contained within the article.
Acknowledgments
Special thanks also go to all those who aided during this study.
Conflicts of Interest
The authors declare no conflict of interests.
Disclaimer
The contents of this paper reflect the views of the authors who are solely responsible for the facts and accuracy of the data presented herein and do not necessarily reflect the official views or policies of any agency or institute. This paper does not constitute a standard specification, nor is it intended for design, construction, bidding, contracting, tendering, certification, or permit purposes. Trade names were used solely for information purposes and not for product endorsement, advertisement, or certification.
References
- Ali, S.F.; Friswell, M.I.; Adhikari, S. Analysis of Energy Harvesters for Highway Bridges. J. Intell. Mater. Syst. Struct. 2011, 22, 1929–1938. [Google Scholar] [CrossRef]
- Baldwin, J.D.; Roswurm, S.; Nolan, J.; Holliday, L. Energy Harvesting on Highway Bridges; Oklahoma Department of Transportation: Oklahoma City, OK, USA, 2011; 24p.
- Hill, D.; Tong, N. Assessment of Piezoelectric Materials for Roadway Energy Harvesting; California Energy Commission: Sacramento, CA, USA, 2013; Publication Number: CEC-500-2013-007.
- Abbasi, A. Application of Piezoelectric Materials in Smart Roads and MEMS, PMPG Power Generation with Transverse Mode Thin Film PZT. Int. J. Electr. Comput. Eng. 2013, 3, 205–209. [Google Scholar]
- Jeon, Y.; Sood, R.; Jeong, J.-H.; Kim, S.-G. MEMS Power Generator with Transverse Mode Thin Film PZT. Sensors Actuators A: Phys. 2005, 122, 16–22. [Google Scholar] [CrossRef]
- Anton, S.R.; Sodano, H.A. A Review of Power Harvesting Using Piezoelectric Materials (2003–2006). Smart Mater. Struct. 2007, 16, R1. [Google Scholar] [CrossRef]
- Randriantsoa, A.N.A.; Fakra, D.A.H.; Rakotondrajaona, L.; Steyn, W.J.V.D.M. Recent Advances in Hybrid Energy Harvesting Technologies Using Roadway Pavements: A Review of the Technical Possibility of Using Piezo-thermoelectrical Combinations. Int. J. Pavement Res. Technol. 2022, 1–26. [Google Scholar] [CrossRef]
- Lallmamode, M.M.; Al-Obaidi, A.M. Harvesting Energy from Vehicle Transportation on Highways Using Piezoelectric and Thermoelectric Technologies. In Journal of Physics: Conference Series; IOP Publishing: Bristol, UK, 2021; Volume 2120, p. 012016. [Google Scholar]
- Hossain, F.T.; Dessouky, S.; Biten, A.B.; Montoya, A.; Fernandez, D. Harvesting Solar Energy from Asphalt Pavement. Sustainability 2021, 13, 12807. [Google Scholar] [CrossRef]
- Vizzari, D.; Gennesseaux, E.; Lavaud, S.; Bouron, S.; Chailleux, E. Pavement Energy Harvesting Technologies: A Critical Review. RILEM Tech. Lett. 2021, 6, 93–104. [Google Scholar] [CrossRef]
- Saleh, N.F.; Zalghout, A.A.; Din, S.A.S.A.; Chehab, G.R.; Saad, G.A. Design, Construction, And Evaluation of Energy-Harvesting Asphalt Pavement Systems. Road Mater. Pavement Des. 2020, 21, 1647–1674. [Google Scholar] [CrossRef]
- Jiang, W.; Yuan, D.; Xu, S.; Hu, H.; Xiao, J.; Sha, A.; Huang, Y. Energy Harvesting from Asphalt Pavement Using Thermoelectric Technology. Appl. Energy 2017, 205, 941–950. [Google Scholar] [CrossRef]
- Mona, Y.; Jitsangiam, P.; Punyawudho, K. A Comparison of Energy Harvesting from Cement and Asphalt on Road Pavement Using Thermoelectric Module. Energy Rep. 2021, 7, 225–229. [Google Scholar] [CrossRef]
- Ahmad, A.F.; Razali, A.R.; Romlay, F.R.M.; Razelan, I.S.M. Energy Harvesting on Pavement A Review. Int. J. Renew. Energy Res. 2021, 11, 1250–1266. [Google Scholar]
- Al-Qadami, E.H.H.; Mustaffa, Z.; Al-Atroush, M.E. Evaluation of the Pavement Geothermal Energy Harvesting Technologies towards Sustainability and Renewable Energy. Energies 2022, 15, 1201. [Google Scholar] [CrossRef]
- Duarte, F.; Ferreira, A. Energy Harvesting on Road Pavements: State of the Art. Proc. Inst. Civ. Eng. Energy 2016, 169, 79–90. [Google Scholar] [CrossRef]
- Sherren, A.; Fink, K.; Eshelman, J.; Taha, L.Y.; Anwar, S.; Brennecke, C. Design and Modelling of Piezoelectric Road Energy Harvesting. Open J. Energy Effic. 2022, 11, 24–36. [Google Scholar] [CrossRef]
- Kim, S.; Shen, J.; Ahad, M.; Tucker, Z. Piezoelectric Energy Harvesting System Assessment for Highway Sustainability. In Proceedings of the 52nd ASC Annual International Conference Proceedings, Provo, UT, USA, 13–16 April 2016. [Google Scholar]
- Al-Yafeai, D.; Darabseh, T.; Mourad, A.H.I. A State-Of-The-Art Review of Car Suspension-Based Piezoelectric Energy Harvesting Systems. Energies 2020, 13, 2336. [Google Scholar] [CrossRef]
- Catak, M.; Bogammaz, F.; AlAjmi, S.; AlObaid, S.; AlOmar, I.; AlKafeef, B. Energy Harvesting from The Highways Based on Piezoelectric Sensors. In Proceedings of the 2021 International Conference on Technology and Policy in Energy and Electric Power (ICT-PEP), Yogyakarta, Indonesia, 29–30 September 2021; pp. 281–284. [Google Scholar]
- Gholikhani, M.; Sharzehee, M.; Tahami, S.A.; Martinez, F.; Dessouky, S.; Walubita, L.F. Effect of Electromagnetic Energy Harvesting Technology on Safety and Low Power Generation in Sustainable Transportation: A Feasibility Study. Int. J. Sustain. Eng. 2019, 13, 373–386. [Google Scholar] [CrossRef]
- Roshani, H.; Dessouky, S.; Montoya, A.; Papagiannakis, A. Energy Harvesting from Asphalt Pavement Roadways Vehicle-Induced Stresses: A Feasibility Study. Appl. Energy 2016, 182, 210–218. [Google Scholar] [CrossRef]
- Roshani, H.; Dessouky, S.; Papagiannakis, A.T. Experimental Assessment of Using PZT Elements for Power Harvesting in Roadway Pavement. In Proceedings of the Construction Research Congress 2018 American Society of Civil Engineers, New Orleans, LA, USA, 2–4 April 2018. [Google Scholar] [CrossRef]
- Roshani, H.; Jagtap, P.; Dessouky, S.; Montoya, A.; Papagiannakis, A.T. Theoretical and Experimental Evaluation of Two Roadway Piezoelectric-Based Energy Harvesting Prototypes. J. Mater. Civ. Eng. 2018, 30, 04017264. [Google Scholar] [CrossRef]
- Walubita, L.F.; Djebou, D.C.S.; Faruk, A.N.M.; Lee, S.I.; Dessouky, S.; Hu, X. Prospective of Societal and Environmental Benefits of Piezoelectric Technology in Road Energy Harvesting. Sustainability 2018, 10, 383. [Google Scholar] [CrossRef]
- Kim, S.; Shen, J.; Ahad, M. Piezoelectric-Based Energy Harvesting Technology for Roadway Sustainability. Int. J. Appl. Sci. Technol. 2015, 5, 20–25. [Google Scholar]
- Xiong, H. Piezoelectric Energy Harvesting for Public Roadways. Ph.D. Dissertation, Department of Civil Engineering, Virginia Polytechnic Institute and State University, Blacksburg, VA, USA, 2014. [Google Scholar]
- Huang, R.B.; Niu, Y.L.; Zhao, H.D.; Chang, H.B. Technical Approach and Research Prospect of Piezoelectric Energy Harvest from Highway. Zhongguo Gonglu Xuebao/China J. Highw. Transp. 2012, 25, 1–8. [Google Scholar]
- Kim, C.-I.; Lee, J.-H.; Kim, K.-B.; Jeong, Y.-H.; Cho, J.-H.; Paik, J.-H.; Lee, Y.-J.; Nahm, S. Design and Electrical Properties of Piezoelectric Energy Harvester for Roadway. J. Korean Inst. Electr. Electron. Mater. Eng. 2011, 24, 554–558. [Google Scholar] [CrossRef][Green Version]
- Wang, H.; Jasim, A.; Chen, X. Energy Harvesting Technologies in Roadway and Bridge for different Applications–A Comprehensive Review. Appl. Energy 2018, 212, 1083–1094. [Google Scholar] [CrossRef]
- Iqbal, M.; Khan, F.U. Hybrid Vibration and Wind Energy Harvesting Using Combined Piezoelectric and Electromagnetic Conversion for Bridge Health Monitoring Applications. Energy Convers. Manag. 2018, 172, 611–618. [Google Scholar] [CrossRef]
- Jasim, A.; Yesner, G.; Wang, H.; Safari, A.; Maher, A.; Basily, B. Laboratory Testing and Numerical Simulation Of Piezoelectric Energy Harvester For Roadway Applications. Appl. Energy 2018, 224, 438–447. [Google Scholar] [CrossRef]
- Steminc. STEMiNC–Steiner & Martins, Inc. 2022. Available online: https://www.steminc.com/piezo/PZ_property.asp (accessed on 25 November 2022).
- TxDOT. Texas Department of Transportation. Standard Specifications for Construction and Maintenance of Highways, Streets, and Bridges. Austin, Texas. 2014. Available online: https://www.txdot.gov/content/txdot/en/inside-txdot/division/materials-and-tests/txdot-specifications.html (accessed on 25 November 2022).
- Walubita, L.; Lee, S.; Zhang, J.; Faruk, A.; Nguyen, S.; Scullion, T. HMA Shear Resistance, Permanent Deformation, and Rutting Tests for Texas Mixes: Year-1 Report; Technical Report SWUTC/13/0-6744-1; Texas A&M Transportation Institute: College Station, TX, USA, 2014.
- Thompson, S.P. Dynamo-Electric Machinery; A Manual for Students of Electrotechnics; Biblio Bazaar: Charleston, SC, USA, 2009. [Google Scholar]
- Walubita, L.F.; Faruk, A.N.; Zhang, J.; Hu, X. Characterizing the Cracking and Fracture Properties of Geosynthetic Interlayer Reinforced HMA Samples using the Overlay Tester (OT). Constr. Build. Mater. 2015, 93, 695–702. [Google Scholar] [CrossRef]
- Walubita, L.F.; Faruk, A.N.; Zhang, J.; Hu, X.; Lee, S.I. The Hamburg Rutting Test–Effects of HMA Sample Sitting Time and Test Temperature Variation. Constr. Build. Mater. 2016, 108, 22–28. [Google Scholar] [CrossRef]
- Faruk, A.N.; Liu, W.; Lee, S.I.; Naik, B.; Chen, D.H.; Walubita, L.F. Traffic Volume and Load Data Measurement Using a Portable Weigh In Motion System: A Case Study. Int. J. Pavement Res. Technol. 2016, 9, 202–213. [Google Scholar] [CrossRef]
- Dessouky, S.; Guo, R.; Montoya, A.; Walubita, L.; Helffrich, J.; Papagiannakis, A.T.; Bhalla, A. Phase 1: Development of Highway Sensing and Energy Conversion (HISEC) Modules for Generating Power; FHWA/TX-16/0-7821; Technical Report for Texas Department of Transportation; Texas Department of Transportation: Austin, TX, USA, 2016.
- Walubita, L.T.; Zhang, J.T.; Alvarez, A.E.; Hu, X. Exploring the Flow Number (FN) Index as a Means to Characterize the HMA Permanent Deformation Response Under FN Testing. J. South Afr. Inst. Civ. Eng. 2013, 55, 103–112. [Google Scholar]
- Walubita, L.F.; Zhang, J.; Das, G.; Hu, X.; Mushota, C.; Alvarez, A.E.; Scullion, T. Hot-Mix Asphalt Permanent Deformation Evaluated by Hamburg Wheel Tracking, Dynamic Modulus, and Repeated Load Tests. Transp. Res. Rec. J. Transp. Res. Board 2012, 2296, 46–56. [Google Scholar] [CrossRef]
- Walubita, L.F.; Fuentes, L.; Lee, S.I.; Dawd, I.; Mahmoud, E. Comparative Evaluation of Five HMA Rutting-Related Laboratory Test Methods Relative to Field Performance Data: DM, FN, RLPD, SPST, and HWTT. Constr. Build. Mater. 2019, 215, 737–753. [Google Scholar] [CrossRef]
- Walubita, L.F.; Faruk, A.N.; Fuentes, L.; Prakoso, A.; Dessouky, S.; Naik, B.; Nyamuhokya, T. Using the Simple Punching Shear Test (SPST) for Evaluating the HMA Shear Properties and Predicting Field Rutting Performance. Constr. Build. Mater. 2019, 224, 920–929. [Google Scholar] [CrossRef]
- Walubita, L.F.; Gonzalez-Hernandez, J.G.; Martinez-Arguelles, G.; Tanvir, H.; Fuentes, L.; Tahami, S.A. Statistical Evaluation of the Material-Source Effects on the DSR Rheological Properties of Plant-Mix Extracted Asphalt-Binders. Materials 2021, 14, 1931. [Google Scholar] [CrossRef] [PubMed]
Disclaimer/Publisher’s Note: The statements, opinions and data contained in all publications are solely those of the individual author(s) and contributor(s) and not of MDPI and/or the editor(s). MDPI and/or the editor(s) disclaim responsibility for any injury to people or property resulting from any ideas, methods, instructions or products referred to in the content. |
© 2022 by the authors. Licensee MDPI, Basel, Switzerland. This article is an open access article distributed under the terms and conditions of the Creative Commons Attribution (CC BY) license (https://creativecommons.org/licenses/by/4.0/).