Article

Long Term Performance Assessment of a Residential PV/Thermal Hybrid System

1
Sydney Institute of Business and Technology, Sydney City Campus, Western Sydney University, Sydney, NSW 2000, Australia
2
School of Engineering, Sydney City Campus, Western Sydney University, Sydney, NSW 2000, Australia
*
Author to whom correspondence should be addressed.
Energies 2023, 16(1), 121; https://doi.org/10.3390/en16010121
Submission received: 22 November 2022 / Revised: 14 December 2022 / Accepted: 19 December 2022 / Published: 22 December 2022

Abstract

:
The application of residential rooftop PV systems increased significantly in the last 10 years in many countries and became a major source of clean energy in dwellings besides traditional solar hot water technology. To optimise the performance of these green energy systems, the incorporation of PV/thermal hybrid systems is a future option for sustainable residential building designs. In this work, a novel design of PV/Thermal (PVT) hybrid panels, using heat pipe technology, is proposed with the aim of fulfilling the hot water and electricity demand of a house in Sydney. The heat pipe system is integrated into a traditional PV panel to transfer the heat stored within the PV panel material to a header that is connected to the household hot water cycle. A preliminary analysis of the test results for the proposed PVT system design under different weather conditions in Sydney is conducted, where the transient variation of the output water temperature as well as power production is investigated. The results show that the hot water temperature at the header outlet reaches around a maximum of 50 °C on a typical summer day and a minimum of 30 °C on a typical winter day. The daily heat delivered to the hot water tank is found to be in the range of 3.7–5.2 MJ per m2 of the PVT panel surface area. The results show that the energy efficiency of the adopted PVT panel design could reach more than 4 times higher than the traditional PV panel.

1. Introduction

The photovoltaic thermal (PVT) panel is a hybrid system that produces heat and electricity from the solar energy intercepted by the traditional PV panel. This type of panel design not only saves space but also reduces its surface temperature hence increasing the system’s overall performance. Research on this kind of renewable energy system becomes significant, especially after the rapid increase in rooftop PV system applications which has the potential to achieve zero-energy cities as outlined by Odeh and Nguyen [1]. Extensive research has been conducted on the feasibility of the different types of PVT systems. Chow et al. [2] conducted research on the residential application of the hybrid photovoltaic-thermosyphon systems in areas of China where there are hot summers and cold winters. The model used in this research is an “aluminum-alloy flat-box type PVT collector” where PV panels are used to generate electricity and a flat box absorber is used to generate thermal energy. The daily average thermal and electrical efficiency on a typical winter day was found to be 10.3% and 37.6%, respectively and on a typical summer day was found to be 12.3% and 48.2%, respectively. Gang et al. [3] utilized a heat pipe PVT system to test its performance under extreme environmental conditions in areas of China. The daily electrical and thermal efficiency was found to be 9.4% and 41.9%, respectively, and the average electrical and heat gain was found to be 62.3 W/m2 and 276.9 W/m2, respectively. Wu et al. [4] developed a PVT model consisting of an array of heat pipes placed underneath the PV panel to absorb excessive heat from the PV panel in buildings. The parametric investigation of the system was performed by using the first and second laws of thermodynamics. The theoretical result has shown an overall electrical, thermal and exergy efficiency of 8.45%, 63.65% and 10.26%, respectively. Another study conducted by Huang et al. [5] on the performance of a flat plate PVT system found that its thermal and electrical efficiency is about 35.3% and 12.8% respectively. Modelling of the PVT system was also performed by Herrando et al. [6] to study the feasibility of the system for household application in areas of Zaragoza (Spain) and London (UK). The model showed that the PVT system is capable of covering 77% of thermal demand and 145% of electricity demand in Zaragoza; and 55% of thermal demand and 153% of electricity demand in London over the seasons. A similar study was also conducted under London’s weather conditions by Herrando et al. [7] to compare PVT system performance with the traditional PV panel system. The study showed that PVT systems can cover 51% and 36% of the annual electricity and hot water demand compared to the traditional PV system which generates only 49% of annual electricity demands. The application of the PVT system in domestic applications could reduce 36% of CO2 emissions over its lifetime compared to the PV panel system. The annual performance of a building-integrated PVT system was tested by Hui et al. [8] under typical weather conditions in Hong Kong. The annual thermal and electrical efficiency was found to be 35% and 10%, respectively. Diallo et al. [9] performed a numerical analysis on a novel loop heat pipe PVT system. The result obtained from the parametric analysis showed that the overall efficiency of the system is 67.8%, which is 28% higher than the conventional system. Abdul-Ganiyu et al. [10] assessed the performance of PVT and PV panel systems under the weather condition of Ghana. The testing rig used a water-based mono-crystalline silicon panel and an ordinary mono-crystalline silicon PV panel. The highest overall efficiency (electrical/thermal) of the PVT was found to be 56.1% compared to 12.7% of the traditional PV panel. Sheshpoli et al. [11] investigated the performance of a hybrid PVT system that consists of a PV panel for electricity generation and a serpentine tube for the thermal collector. The panel was tested under extreme weather conditions (cold and heavy snowfall in winter, hot and dry in summer). They found that this configuration of the PVT panel increases the electrical efficiency by 7.3% and the thermal efficiency by 48.4% compared to the traditional PV panel and solar thermal collector system. Modelling of a standalone PVT System for domestic application was conducted using TRNSYS simulation to explore the amount of electric and thermal energy production in European warm sites [12]. The study showed that the panel temperature was reduced by 20% and the electrical power output increased by 12%. A recent study conducted by Xie et al. [13] presented a comparative study between tank PVT systems and heat pipe PVT systems. Both systems were tested under cold weather conditions over a 10-day period. The result showed that the tank PVT system has an electrical, thermal and overall efficiency of 15.6%, 43.8% and 58.1%, respectively, whereas the heat pipe PVT system has an electrical, thermal and overall efficiency of 12.2%, 41.2% and 53.4%, respectively. From this result, it was concluded that the tank PVT system has better performance than the heat pipe PVT system. The effect of the filling ratio of the working fluid within the heat pipe on the performance of the PVT system was studied by Eshghi et al. [14]. The PVT panel design consists of a single circular heat pipe integrated into the back of the PV panel by an aluminium plate. The optimum performance of the panel was obtained at a 45% filling ratio of the working fluid. Compared to the conventional PV panel the single circular heat pipe PVT system was able to produce 3.2% more electricity.
In this research work, a novel design of a PVT panel patent developed by Odeh and Habbouchi [15] is tested under the Australian weather conditions to evaluate its effectiveness in residential applications for heat and electrical power generation. The test is conducted over different seasons to estimate the solar energy contribution, number of PVT panels required for a specified hot water demand, and long-term performance and financial assessment of the proposed system.

2. Materials and Methods

2.1. System and Test Rig Design

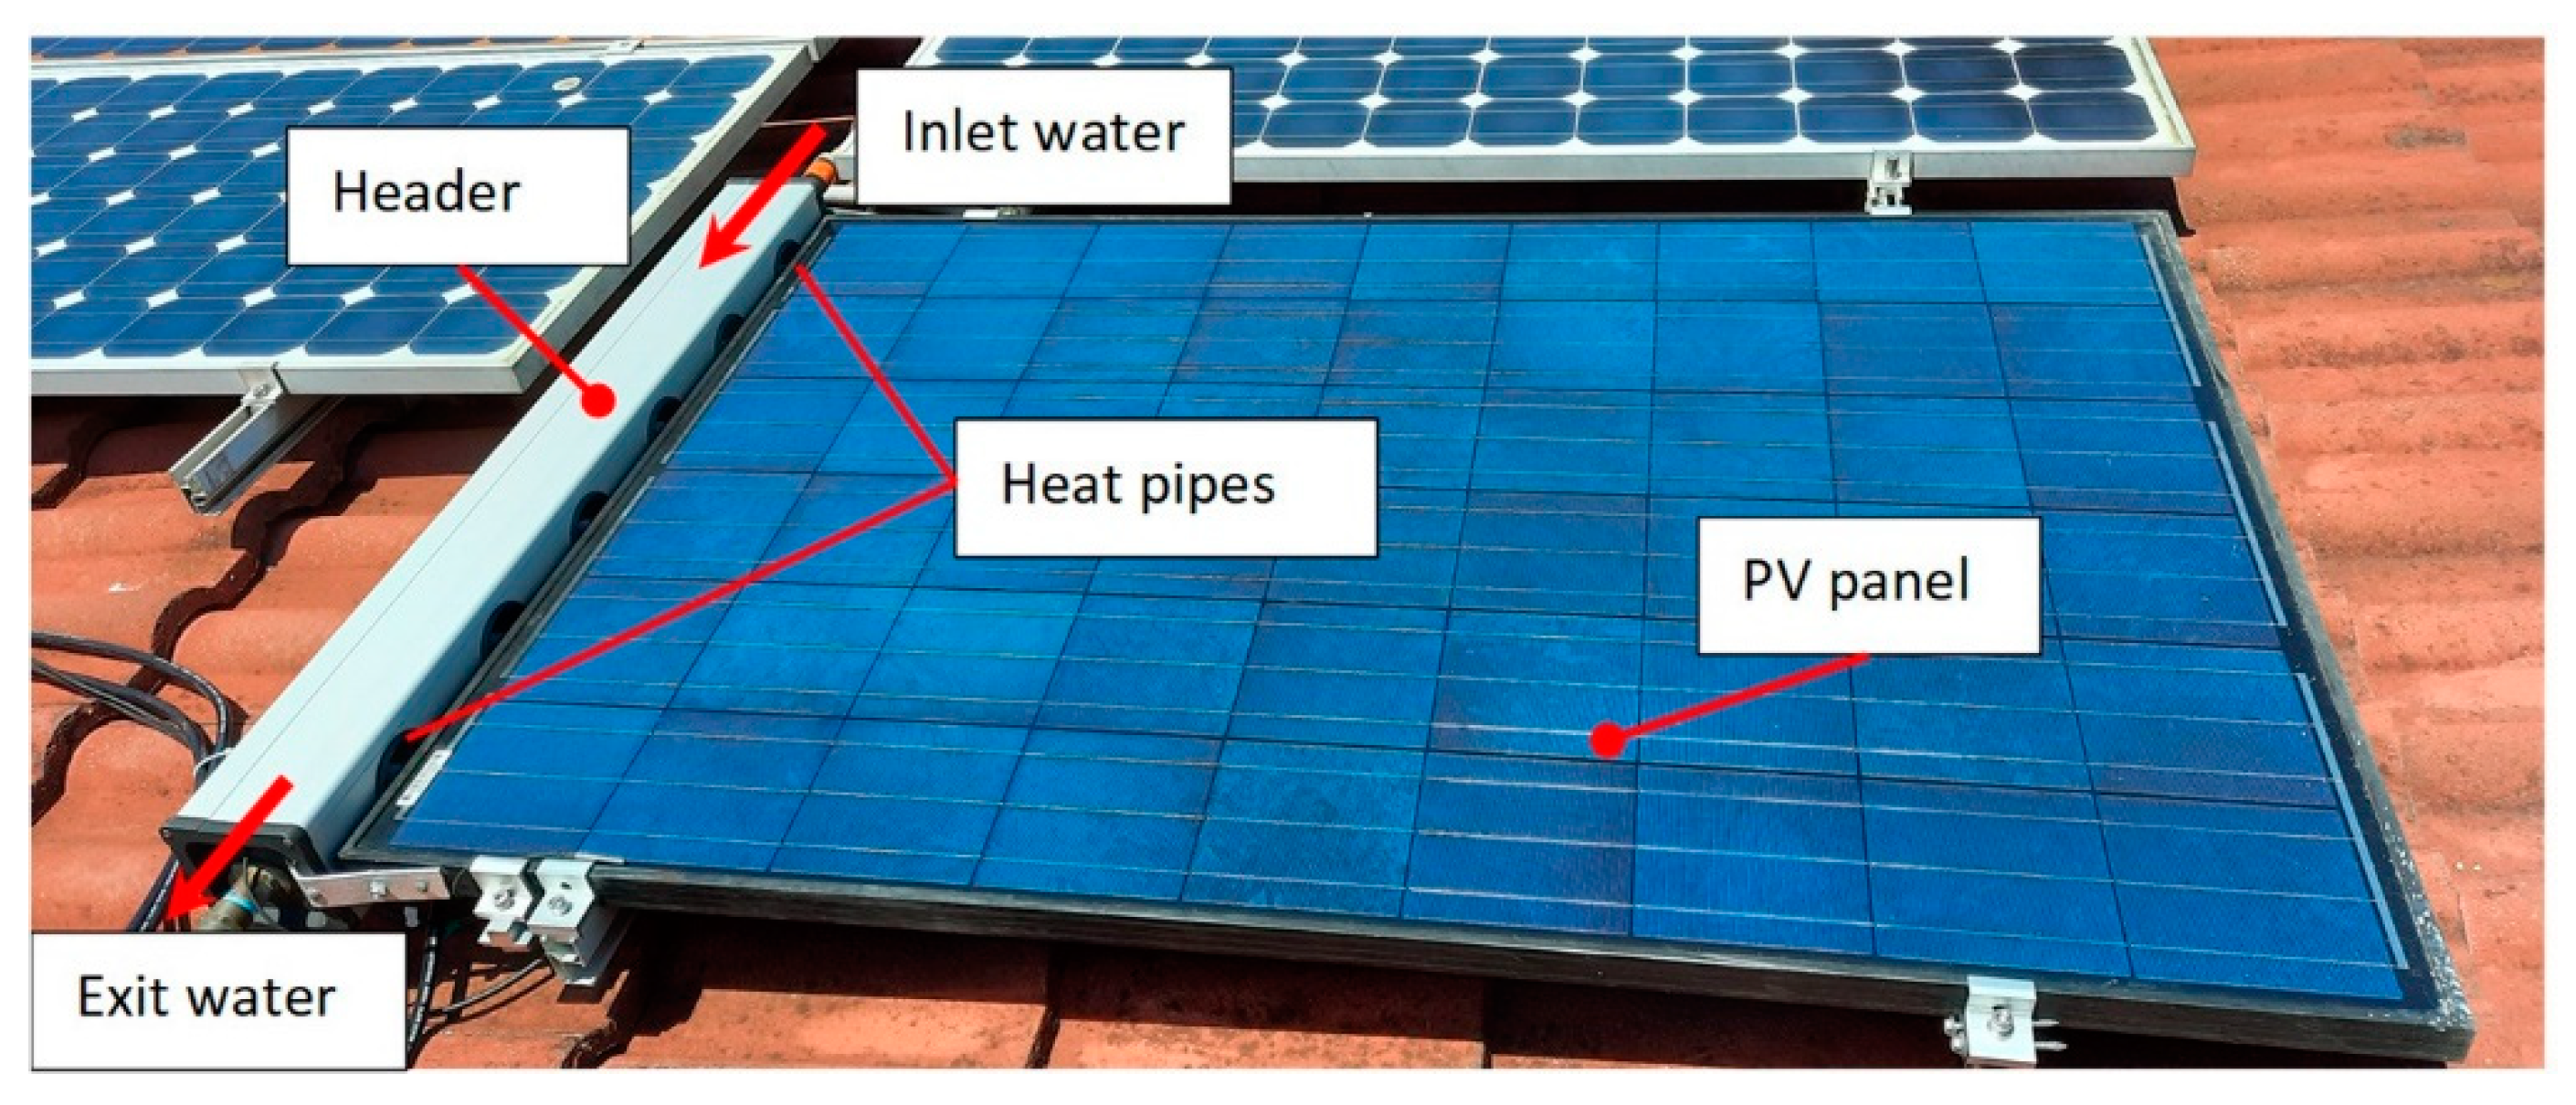
The PVT panel model used in the test of this study is adapted from the novel PVT system design proposed by Odeh and Habbouchi [15]. The PVT panel consists of a conventional PV panel (1.47 m2), a heat pipe array (six pipes) attached to the back of the panel and connected at the top of the panel to a water header to collect the absorbed heat by the heat pipes. Figure 1 depicts the layout of the test rig which comprises a water flow circuit to heat the water tank, a DC electric circuit to charge the battery and run the water pump, and a weather data station. Three wireless temperature sensors (of typical accuracy ±0.3 °C) are used to register every minute to the cloud, the temperature of the PV panel surface (Tsurface), the inlet water temperature (tank temperature) to the PVT header (Tin), and the exit water temperature from the PVT header (Tout). The weather data station is installed close to the rig to register to the cloud every minute the ambient temperature, wind speed, and solar irradiation which was calibrated with data derived from Solcast [16] for the specified site in Sydney. The electric circuit uses a battery charge controller to charge a 2 × 12 volts battery that provides power to the 12 volts DC water pump. The maximum water pump input power was found to be about 9% of the PVT panel capacity. Further details and specifications of the different test rig components are presented in Table 1. The PVT panel which is tested under Sydney weather conditions is located at latitude 33.8° and mounted on a house roof that faces north and is tilted 22° (see Figure 2).

2.2. Performance Analysis of PVT Panel

The energy consumed by a traditional hot water tank can be estimated by considering the conventional energy equation and the average hot water tank temperature permissible for residential use which is (a minimum of 60 °C) set by the Australian standard AS/NZS 3500.4. Therefore, the energy consumed by a residential hot water tank can be determined by
Q H W = M . c w . ( 60 T i )    ( J )
where M—mass of the tank water (kg), Ti—initial temperature of the water in the tank (°C), and Cw—Specific heat of water (J/kg °C)
The transient heat gain by the PVT system can be estimated following this equation
q H W S = m ˙ . c w . ( T i + 1 T i )    ( W ) th
where m ˙ is the water flow rate (kg/s) and 𝑇i+1 and 𝑇i tank water temperature (°C) between two-time steps.
The daily energy provided by a single PVT panel can be found by integrating the transient heat gain between the start time of the PVT water pump operation (initial hour hri) and the time when the maximum temperature reached in the tank (final hour hrf)
Q H W S = h r i h r f q H W S d h r    ( J )
Equation (3) can be solved using Simpson’s rule between the initial time of water pump operation and the time when the maximum temperature is reached in the tank. Thus
Q H W S h r 3 ( q ( h r i ) + 4 q ( h r i + 1 ) + 2 q ( h r i + 2 ) + . + q ( h r f ) )    ( J )
If the required tank temperature is not met by the PVT system, then an energy booster is used to increase the temperature up to (60 °C). The energy supplied by the booster can be calculated by the following equation.
Q B = M . c w . ( 60 T m a x )    ( J )
where 𝑇𝑚𝑎𝑥 is the maximum temperature that the PVT panel can produce on a typical day
Considering the maximum temperature (𝑇𝑚𝑎𝑥) that can be reached by the PVT panel, the total energy (𝑄𝐻𝖶𝑆)𝑇 in kJ provided by the PVT system per day for a specified hot water mass M (tank size) is found by
( Q H W S ) T = M . c w . ( T m a x T i )    ( J )
Also,
( Q H W S ) T = Q H W S . N P V T    ( J )
where NPVT is the required number of PVT panels.
By solving Equations (6) and (7) the number of PVT panels can be found for each hot water tank size
N P V T = ( Q H W S ) T Q H W S
Heat gained (Qg) per m2 of PVT panel is
Q g = Q H W S A    ( J / m 2 )
Additionally, solar energy contribution in the hot water system is found by
S o l a r   e n e r g y   c o n t r i b u t i o n = ( Q H W S ) T Q H W
To estimate the overall thermal/electrical efficiency of the PVT system the transient power (P) generated by the PV panel is estimated in (W)e by [17],
P = ( I s c ( o p ) × V o c ( o p ) ) × R P    ( W ) e
where 𝐼𝑠𝑐(o𝑝) is the transient short-circuit current of the PV panel and it is proportional to the global solar irradiation on the surface (GT) which varies throughout the day. The 𝐼𝑠𝑐(o𝑝) can be calculated by multiplying the short-circuit current 𝐼𝑠𝑐(st) at standard condition (1000 W/m2) by the transient solar irradiation GT (W/m2) [17]
I s c ( o p ) = I s c ( s t ) × G T 1000    ( A )
The transient open-circuit voltage 𝑉o𝑐(o𝑝) which depends on the PV panel surface temperature is evaluated from [17]
V o c ( o p ) = V o c ( s t ) 0.0023 × n c ( T c T c ( s t ) )    ( V )
where 𝑉o𝑐(𝑠𝑡) is the open-circuit voltage at standard temperature condition 𝑇𝑐(𝑠𝑡), and 𝑛𝑐 is the number of PV cells in the PVT panel.
The power ratio of the panel (Rp) is constant throughout the operation as it is the property of the PV panel. It is directly proportional to the standard maximum power (𝑃𝑚𝑎𝑥) of the PV panel and inversely proportional to the standard open-circuit voltage (𝑉o𝑐(𝑠𝑡)) and the standard short-circuit current (Isc(st)) [17].
R p = P m a x V o c   ( s t ) × I s c   ( s t )
The total transient energy gained by the PVT panel is the summation of the transient electrical power (P) generated by the PV panel and the transient heat gained by water (𝑞𝐻𝖶𝑆) in (W)th through the heat pipe system; therefore:
P t o t a l = P P w p + m ˙ . c w . ( T o u t T i n )    ( W )
Tout & Tin are the outlet and inlet water temperature (°C) of the PVT panel header (see Figure 2), and Pwp is the water pump input power.
Then, the overall thermal/electrical efficiency of the PVT panel is found by
η = P t o t a l G T × A P V T
where A P V T is the PVT panel aperture area in (m2).

3. Results and Discussions

3.1. Analysis of Test Results

The developed PVT panel system was tested in different seasons under Sydney weather conditions during the year 2021–2022. The major tests data collected during that period were: the temperature of the PV panel surface (Tsurface), inlet water temperature to the PVT header (Tin), the exit water temperature from the PVT header (Tout), ambient temperature, wind speed, and solar irradiation. A typical day was selected to run the test by turning on the water pump to circulate the water between the PVT panel header at the house roof and the hot water tank which is about 5 m away from the panel.
The data were collected over a small-time step (10 min) to examine the effect of instant change of the weather conditions (such as irradiation and wind speed) on PVT panel output. Figure 3 presents the PVT panel temperature measurements in small time intervals of a cloudy summer day of intermittent irradiation and variable wind speed. It can be observed during this short period of time interval that although the PV panel surface temperature (Tsurface) varies with the irradiation level, the rate of temperature rise of Tin and Tout is almost constant due to the thermal storage capacity of the PVT panel header. Additionally, it can be noticed from Figure 3 that the transient PVT surface temperature (Tsurface) is inversely proportional to the wind speed (m/s).
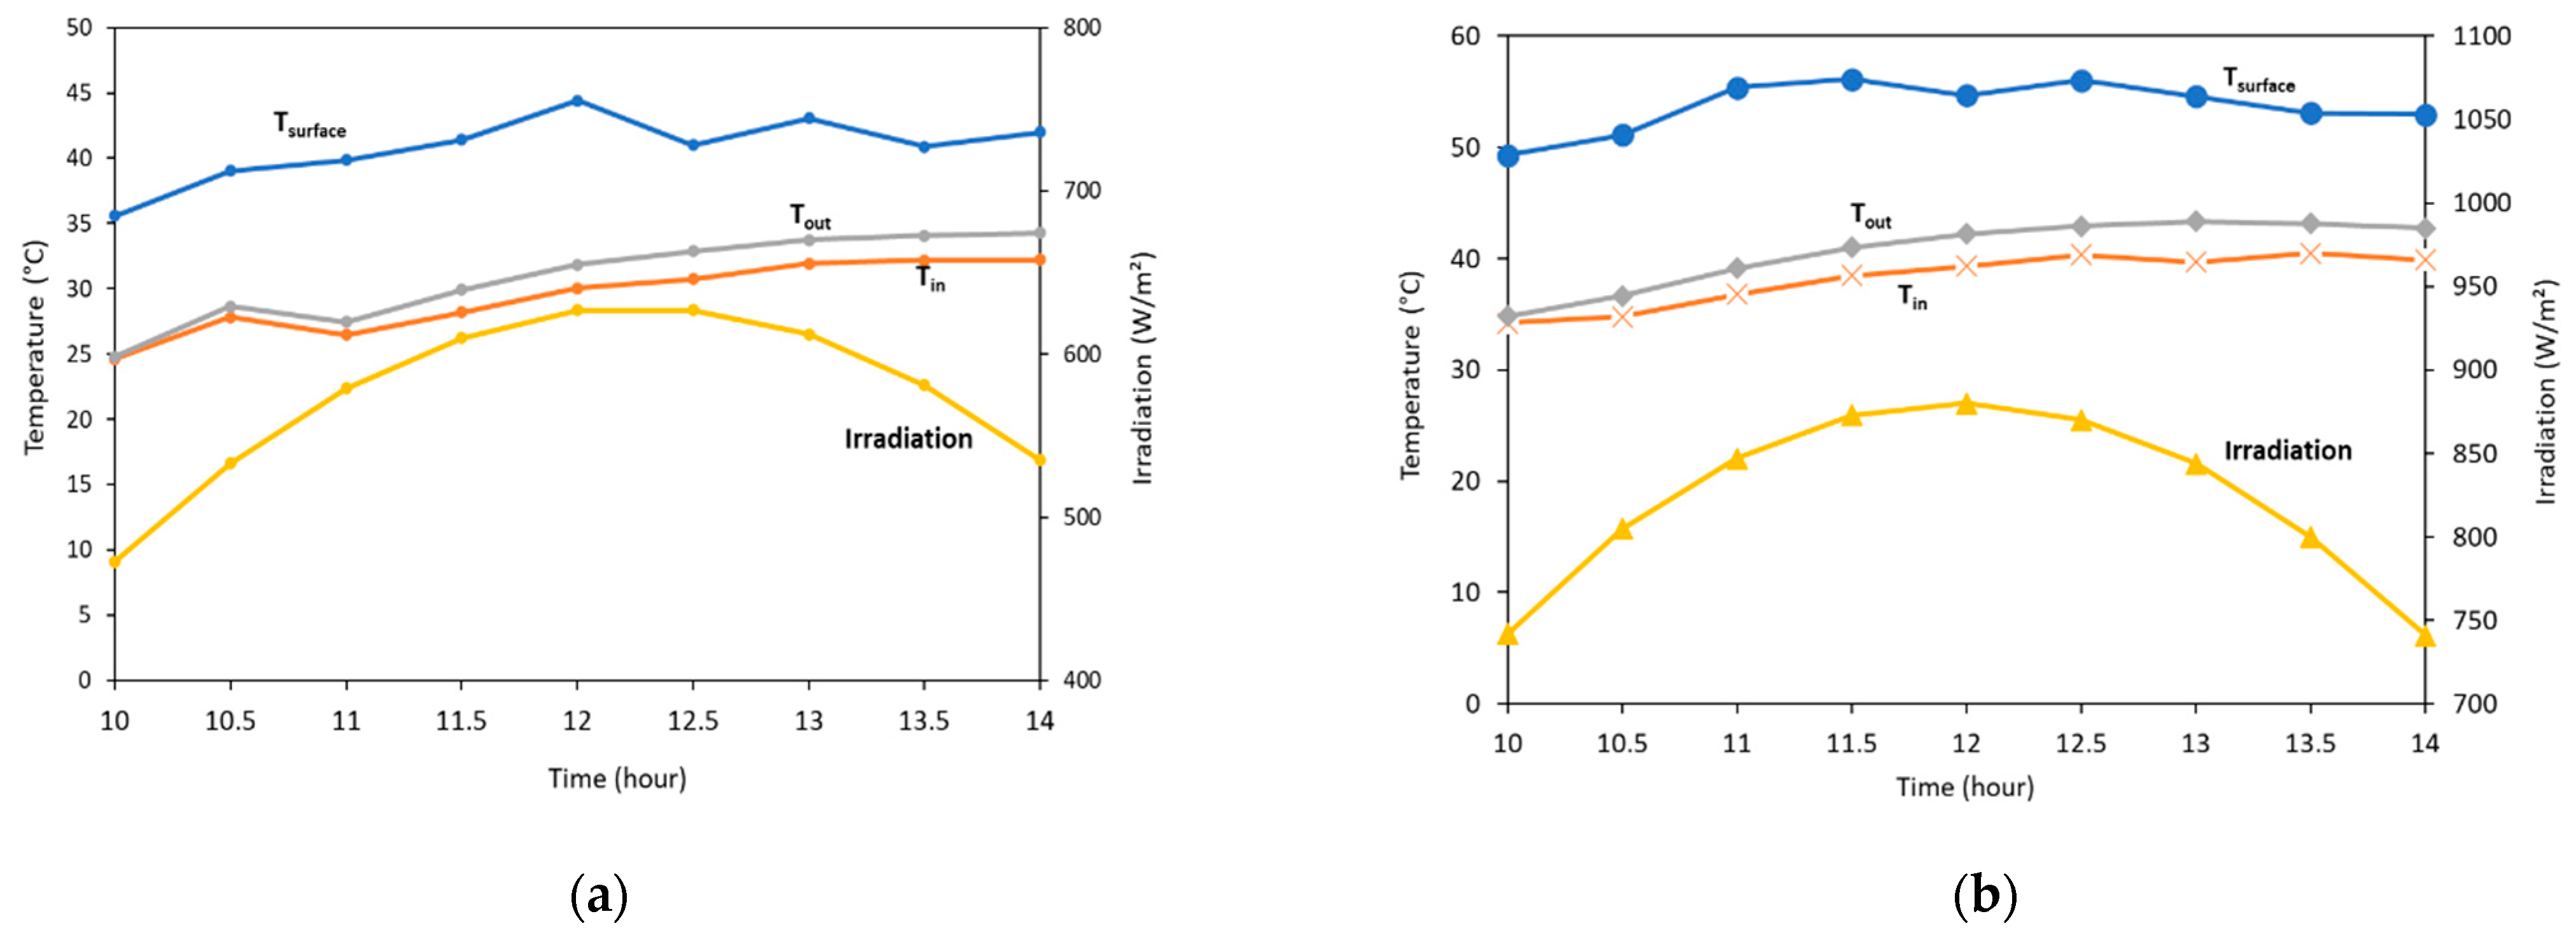
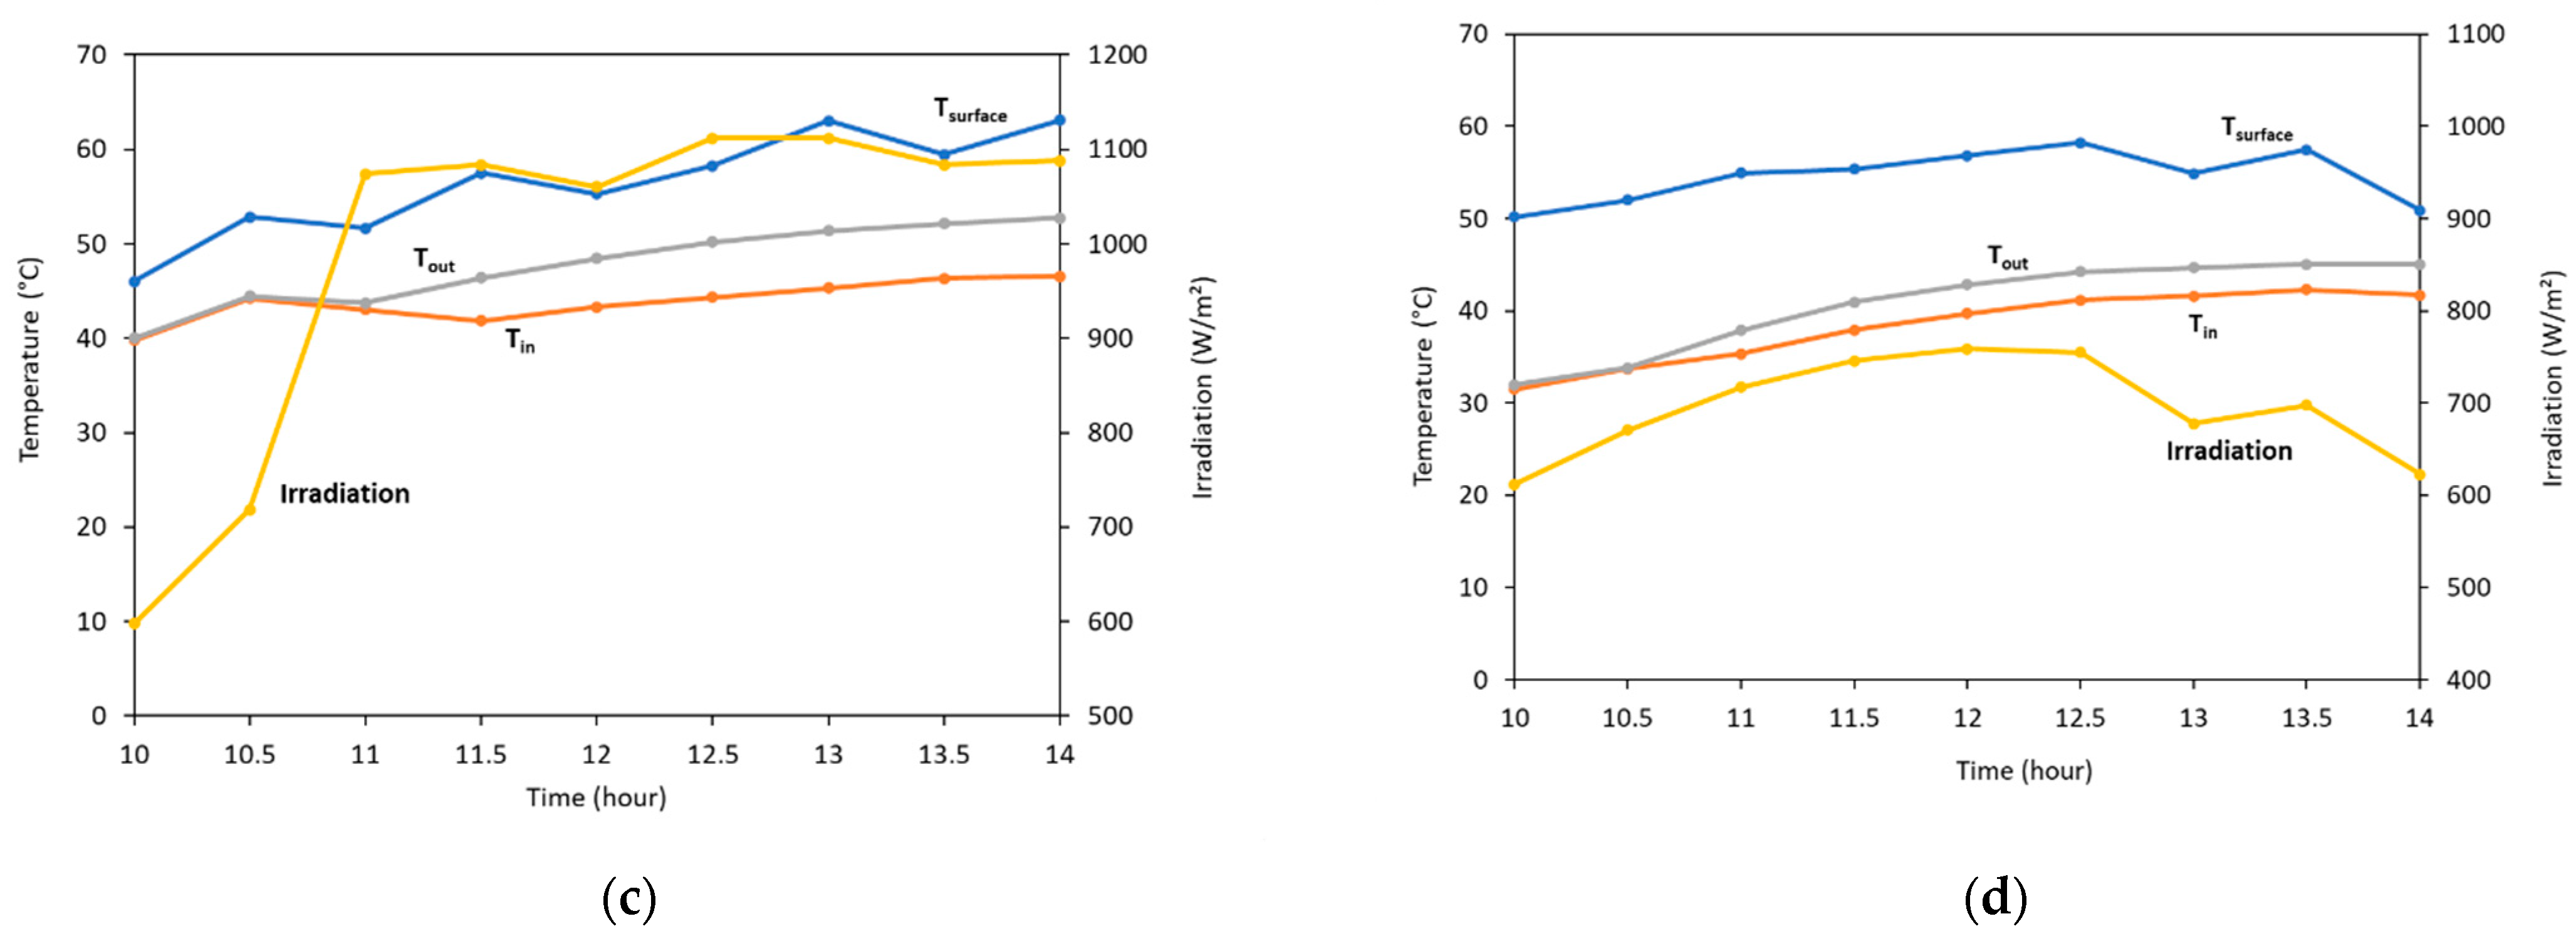
During the year 2021–2022, the weather conditions in Sydney underwent severe changes from the registered record which made the selection of a typical days to test the PVT system a challenging task. However, the small-time step test results of Figure 3 showed that selecting days of small period of intermittent change in weather conditions does not affect much the PVT panel output. Therefore, the system was operated on selected days in each season (summer, autumn, winter, and spring) where it was possible to have clear sky or partially clear sky condition. The data of four typical days (15 December, 11 April, 2 August, and 25 September) were chosen to conduct preliminary investigation of the weather conditions effect on system performance and develop PVT energy model and thermal efficiency equation that could estimate the PVT panel area required for a specified residential demand of hot water. The energy model and thermal efficiency equation is then used to run long term assessment of the proposed residential PVT system using the RETScreen expert software [18]. The test started by turning on the circulating water pump at 9:00 am when the PVT header temperature exceeded the water tank temperature. However, it was noted that the thermal stability of the different points of the system could not be reached before one hour from the start of the water pump operation. Therefore, all measured data were analysed and plotted from the time when the PVT panel reaches thermal stability (around 10 am). The test results of the PVT system on the four typical days in different seasons are presented in Figure 4. The major findings of these tests can be summarised as follows:
  • The PVT panel exit water temperature (Tout) is always between (10–15 °C) below the panel surface temperature Tsurface.
  • The increase in water temperature (Tout–Tin) within the PVT header is almost constant and found between (2–4 °C) in all seasons. This rise of water temperature depends on water flow rate through the 1 m length of PVT header tube. Although this increase looks small for the first moment, the accumulated heat during the sunshine hours of the specified days is significant as the maximum water tank temperature could reach 25–30 °C above its initial temperature. This water temperature increase within the PVT panel was found not far from other studies such as the one presented by [19] which is in the range 2.9–8 °C, and the study presented by [4] which is in the range 2–3 °C.
  • The test shows that the PVT system can provide warm water at a temperature greater than the ambient temperature by almost 10–15 °C.
  • The heat gain and exit water temperature keep rising 2 h after noon time despite the drop in irradiation level and PVT surface temperature due to the effect of the PVT panel thermal capacity.
  • The maximum temperature of the PVT surface varies between 40 °C on a typical winter day to 60 °C on a typical summer day. This PVT surface temperature measurement was compared with similar research [19] and was found to be around 55 °C on typical day in Autumn. Other research [4] shows that PVT surface temperature is in the range 46–53 °C.
  • The water inlet temperature (water tank temperature) that can be reached on a typical cold winter day is 30 °C and on a typical summer day is 50 °C. Almost similar rise in water temperature (from 28–47 °C) was reported by [20] on a typical day of maximum solar irradiation equals to 800 W/m2.
Referring to Equations (1)–(8), the number of PVT panels required to provide thermal heat per 100 L of hot water tank was estimated on each day described in Figure 4. The result of the calculation which is summarized in Table 2 shows that the number of panels required to provide thermal heat per 100 L of hot water tank is between 1.4–1.9 panels. This difference in the number of panels is due to the variation in the total energy (𝑄𝐻𝖶𝑆)𝑇 which is affected by different weather conditions (irradiation, ambient temperature, and wind speed) on each test day. Table 2 shows that solar energy contribution in heating the hot water tank ranges between 22–64% on the selected test days. It can be concluded from Table 2 that the area of PVT panel of residential application required to cover the hot water load in different seasons is around 3 m2 per 100 L of hot water tank capacity.
The overall efficiency of the PVT panel which is the ratio of thermal energy and electricity production to the global irradiation intercepted by the PVT panel is calculated by referring to Equations (11)–(16) and its maximum and minimum values for each typical day are illustrated in Table 3. The maximum value of the overall efficiency during the four seasons ranges between 45–65% and its minimum value ranges between 26–29%. The maximum values of the overall efficiency of the PVT panel found by other studies [20] was around 51.5%.

3.2. PVT Thermal Efficiency Equation

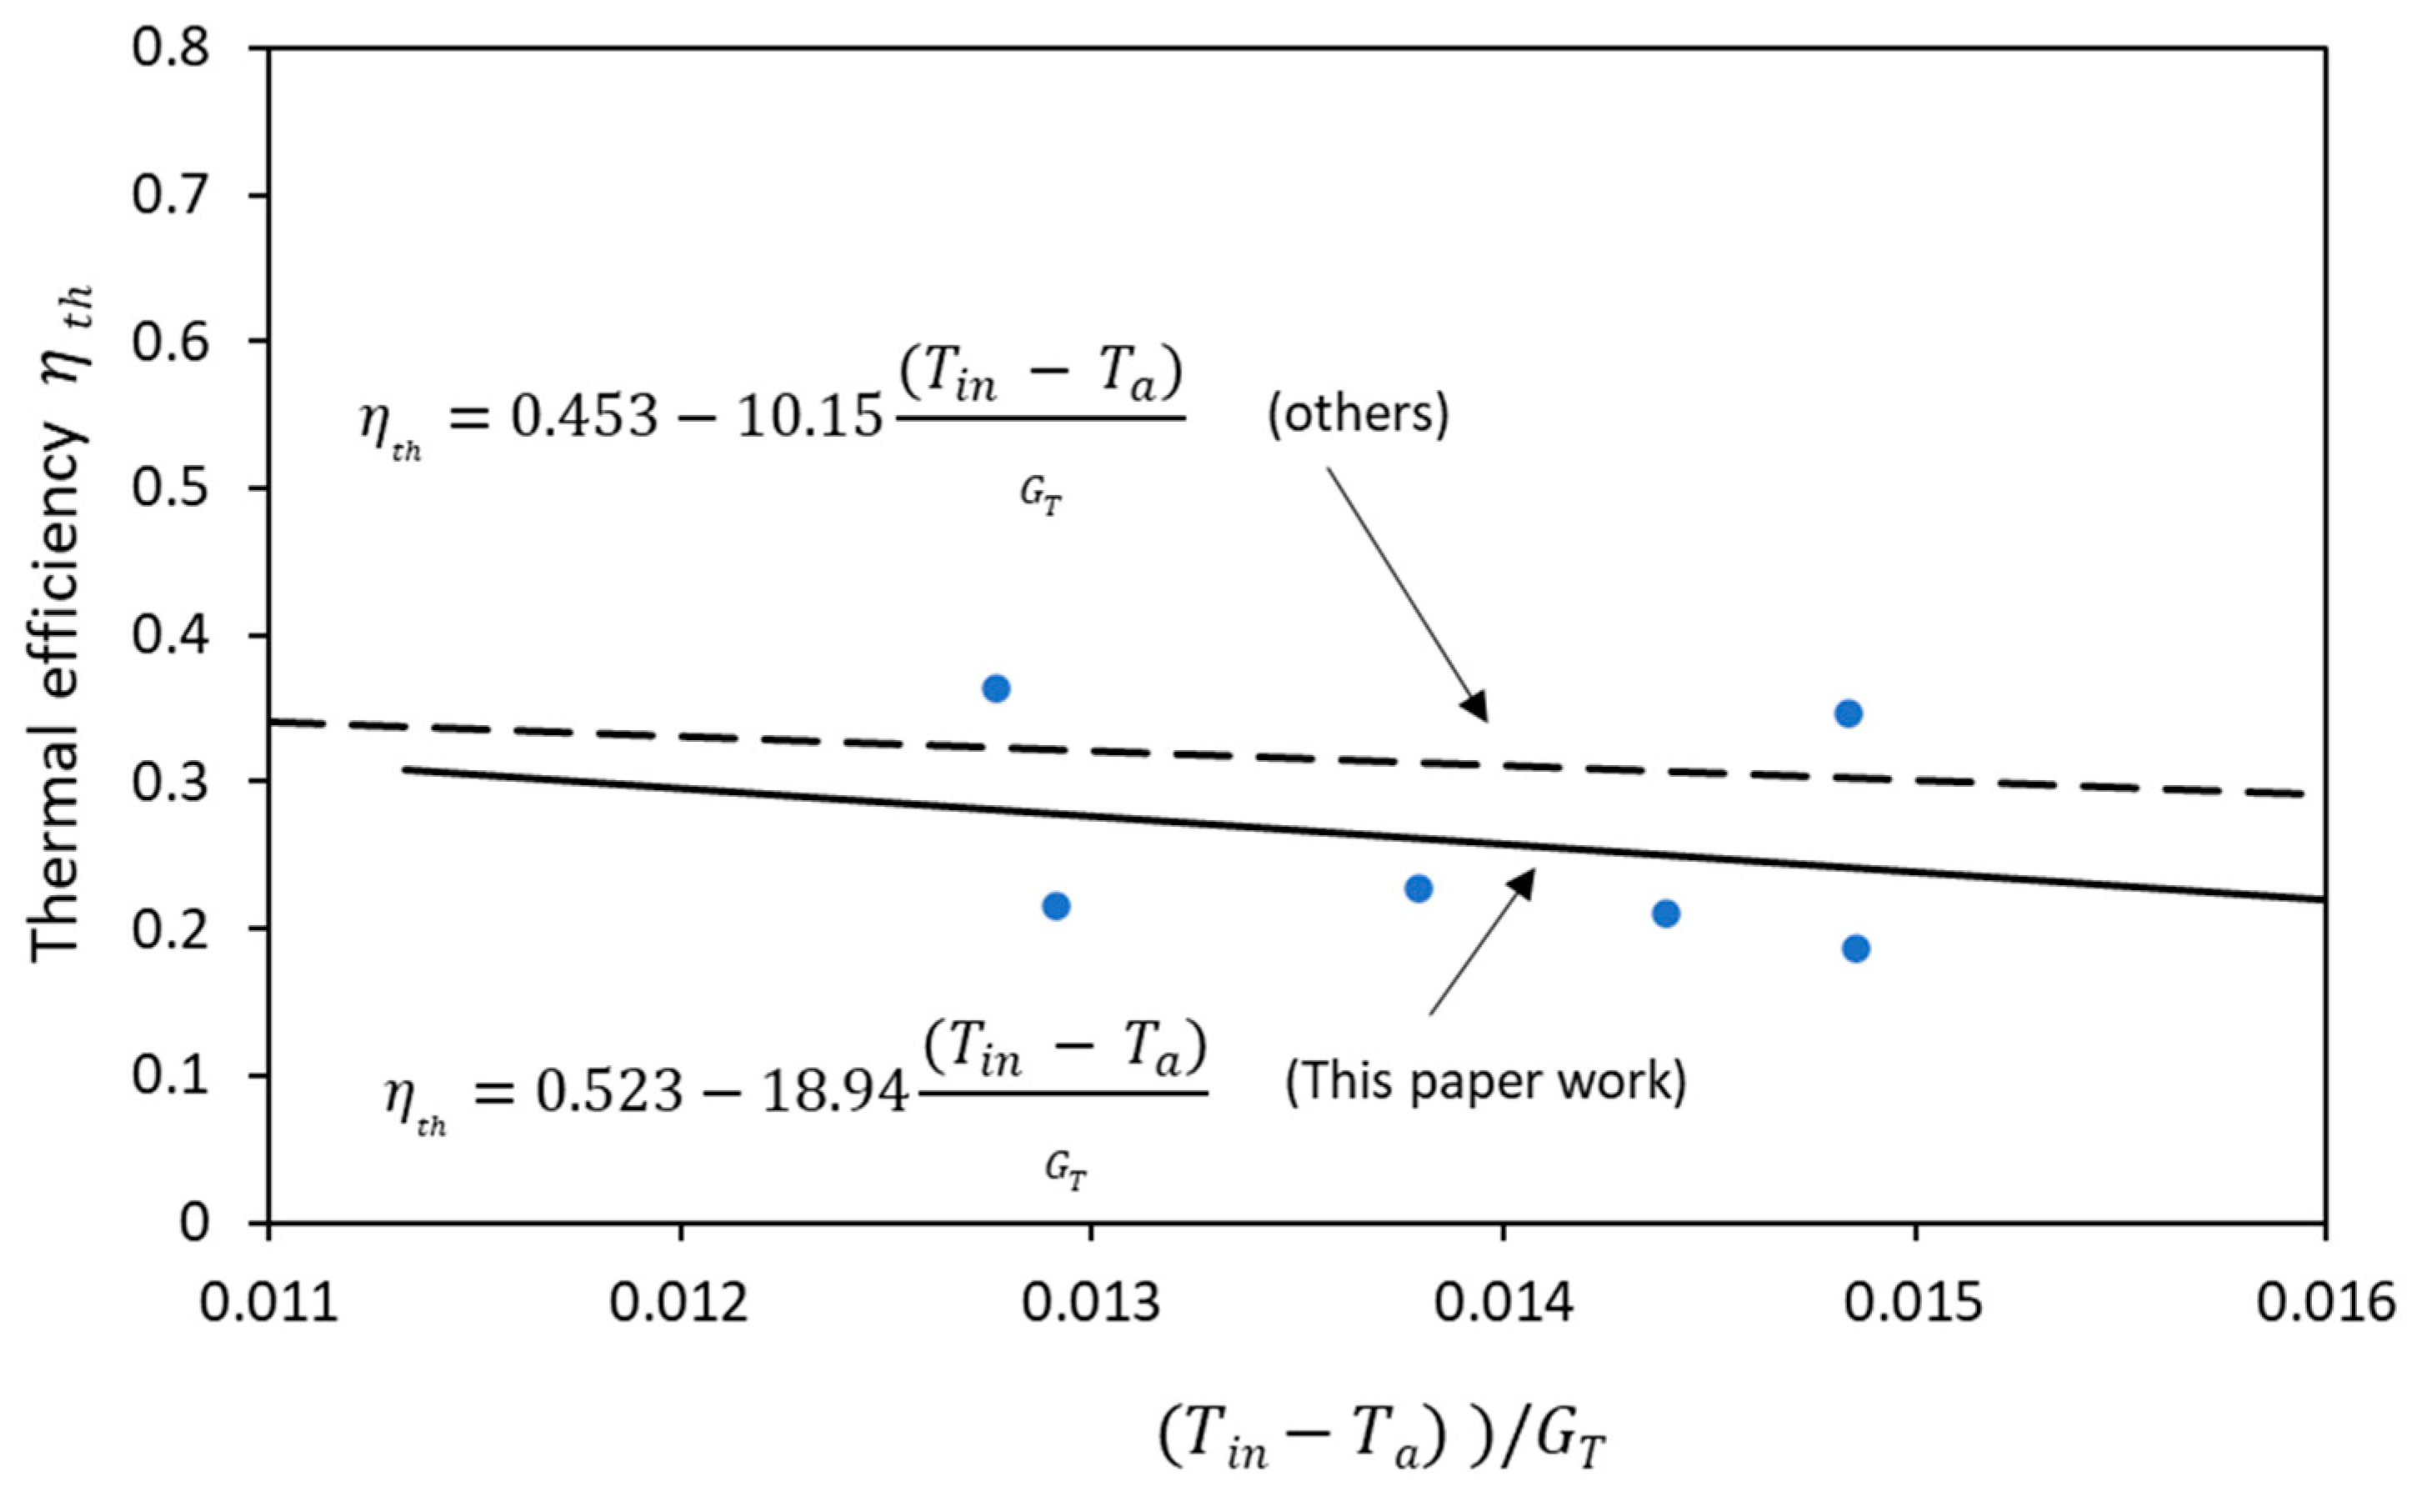
The thermal efficiency of the PVT panel heat pipe system can be estimated by applying the ASHRAE 93-2003 standard flat plate collector test as presented by Duffie and Beckman [21]. Noontime data from different months were selected for this purpose to estimate the PVT panel efficiency equation by plotting the instantaneous thermal efficiency η t h against the value of ( T i n T a )   G T   where:
η t h =   m ˙ . c w . ( T o u t T i n ) G T × A P V T
Additionally, GT is solar irradiation normal to the PVT panel surface (W/m2)
The relationship between the instantaneous values of η t h and ( T i n T a )   G T   is shown in Figure 5 and given by the following straight-line equation:
η t h = 0.523 18.94 ( T i n T a ) G T
The constants of Equation (18), the intercept of the straight line with the η t h axis ( 0.523 ) and the slope of the line ( 18.94 ) are mapped to the parameters FR(τα) and −FRUL of the thermal model of flat plat collector given by [21]; therefore:
η t h = F R ( τ α ) F R U L ( T i n T a ) G T
where FR-heat removal factor:
τα—transmissivity and absorptivity of the PVT surface;
UL—heat transfer coefficient (W/m2 °C).
These two parameters (FR(τα) = 0.523 and FRUL = 18.94) describe how energy is absorbed and lost in the PVT panel.
The selected data of the outdoor test depicted in Figure 5 were measured at noon time on the respective days. Unlike the indoor laboratory test, these data points are not aligned with the trend line due to the difference in weather conditions such as: wind speed, ambient temperature and irradiation between these days. In Figure 5, The trend line of the outdoor test of this study was compared with the study of [22], which has different design of unglazed PVT panel using copper sheet. It is clearly shown that the efficiency equation of both designs, this study and [22] have very close trends as both of them are unglazed.

3.3. Feasibility Test of the PVT System

Long-term performance analysis and feasibility study of the tested PVT system were conducted by using the Clean Energy Management Software RETScreen expert [18]. A typical 200 m2 floor area house in Sydney at latitude −33.9 which has roof of 22° slop oriented toward the north was chosen for this study. The house which has a conventional household appliance, and an average occupancy of four people consumes 17,435 kWh/year of electricity and requires 300 L/day of electric boosted hot water tank at a temperature of 60 °C. A standard-size of rooftop PV system of 5 kW capacity, 26 panels of 200 W each identical to the panel used in the test, is proposed for this house. The number of PVT panels to be integrated into the proposed PV system to supply thermal energy to the hot water tank is 6 out of 26 panels based on Table 2.
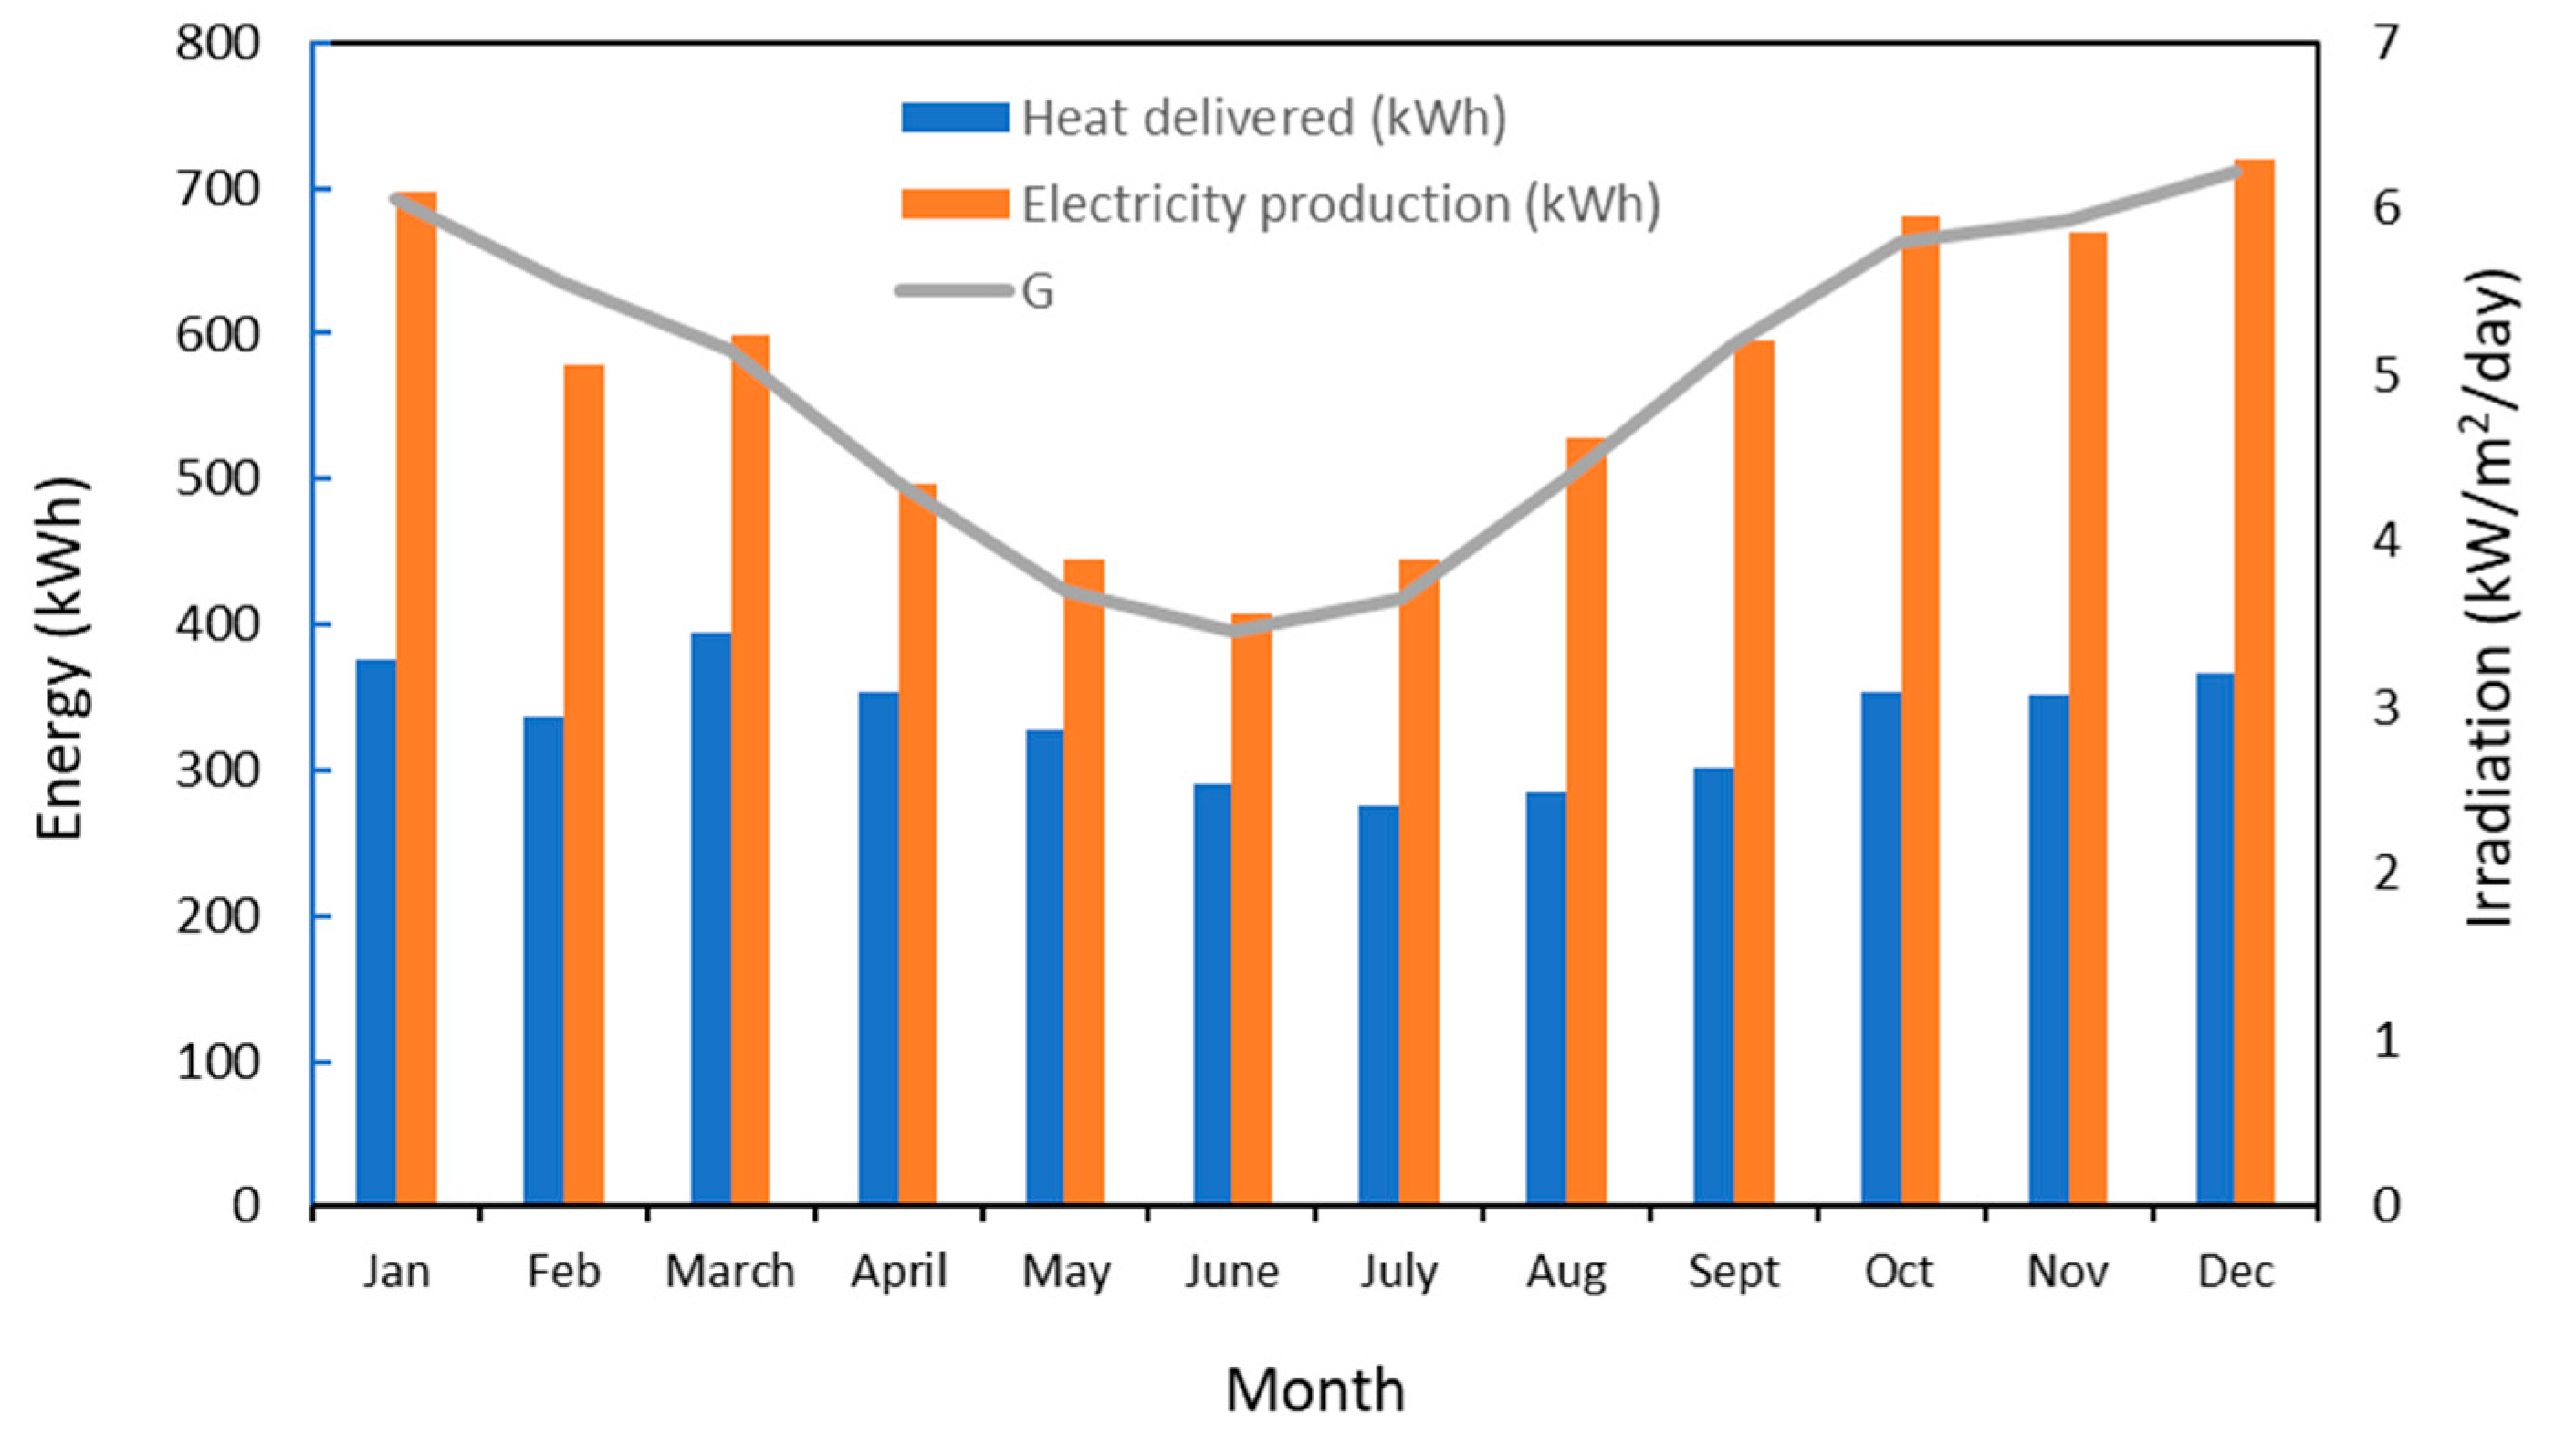
The annual performance of the rooftop PVT system can be identified by the monthly generation of electricity and thermal energy as depicted in Figure 6. The results show that the average deviation in monthly thermal energy production is 10%, while the average deviation of monthly electricity production is around 16%. The monthly energy generation follows the trend of average daily irradiation on PVT surface, yet some differences occur during spring and Autumn months because of the effect of other weather conditions and solar angles. Considering the PVT panel area given in Table 1, it can be concluded from Figure 6 that the monthly heat delivered to the 300 L hot water tank ranges between (31 to 45) kWh/m2 of PVT panel area.
The greenhouse gas emissions analysis by RETScreen expert [18] shows that adopting the proposed model of the PVT panel could reduce 70% of the annual GHG associated with the hot water and electricity consumption of the case study house. This was calculated based on GHG emission factor equal to 0.709 kgCO2/kWh of energy consumed. The GHG emission reduction by adopting the 5 kW capacity PV/Thermal system was found equivalent to excluding 1.7 vehicles/year from the street.
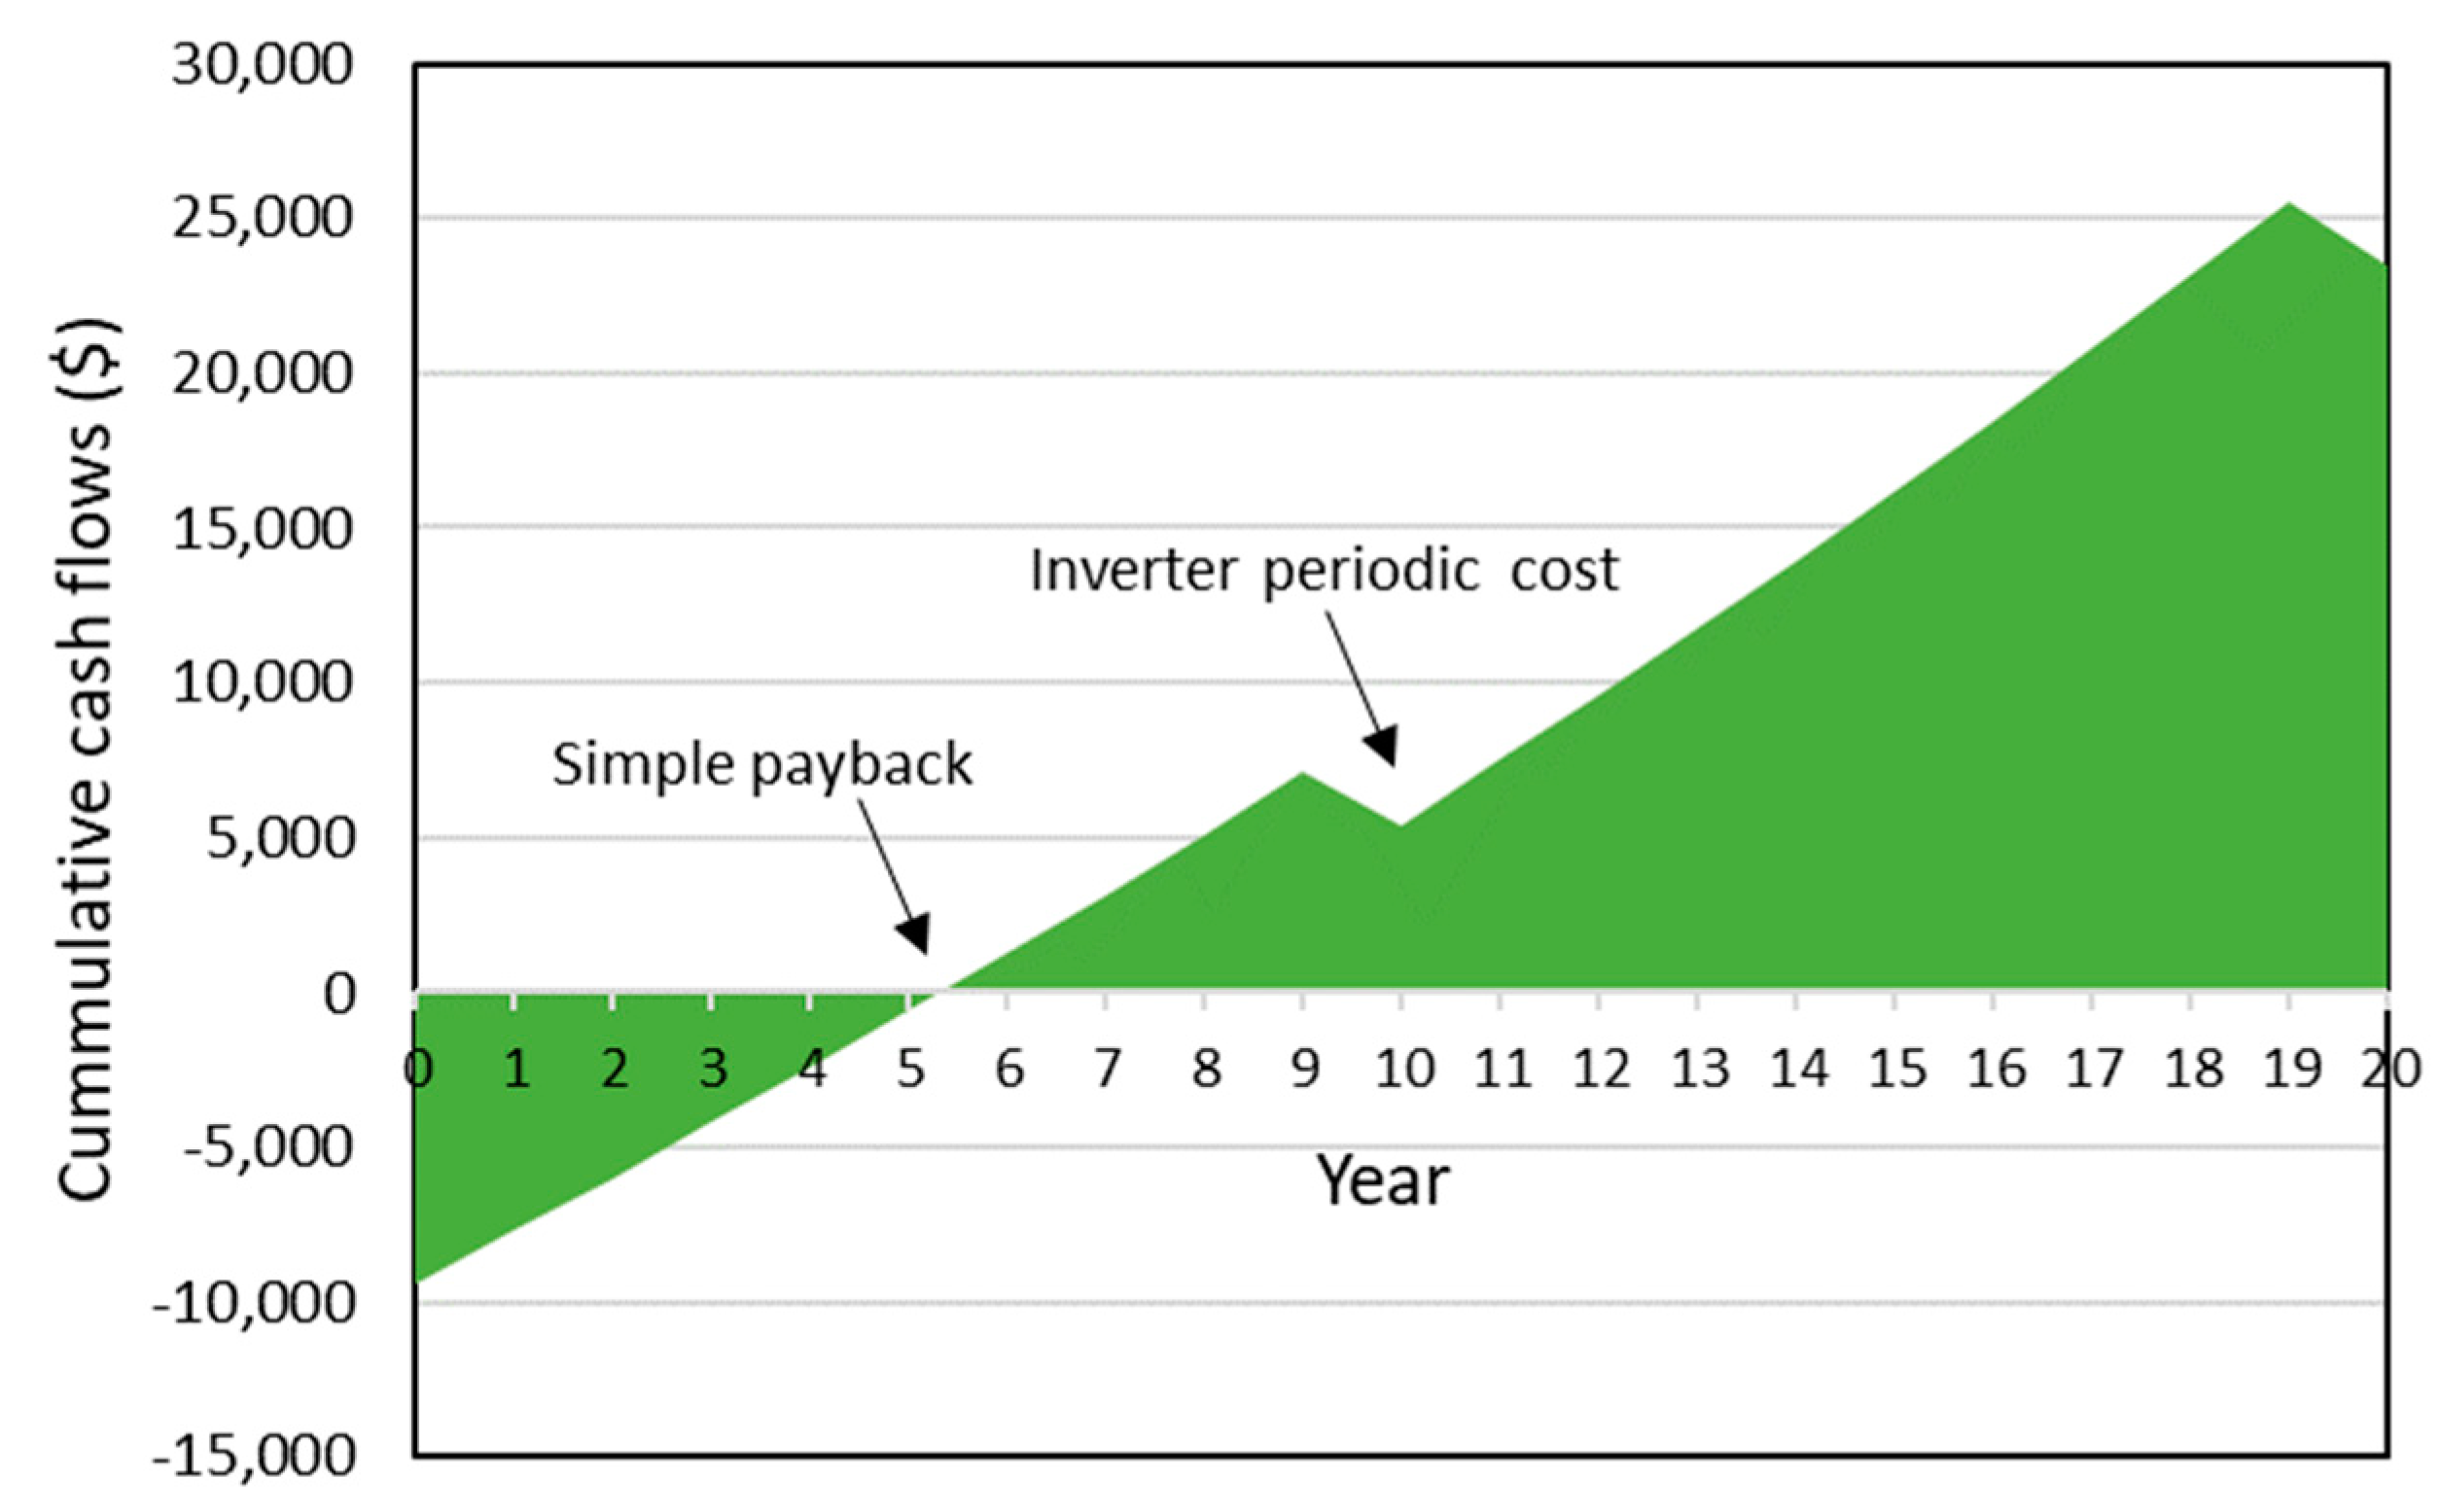
The commutative cash flow presented in Figure 7 was estimated by RETScreen Expert [18] to find the payback period of the PVT system for the proposed house. In the cumulative cash flow calculations, two periodic costs were considered: changing the DC water pump every 5 years and changing the DC/AC inverter every 10 years. Table 4 shows some major financial information related to the PVT system used in the analysis. The payback period of the (6 PVT + 20 PV) system of the proposed house is between 5–6 years. Figure 7 shows that the drop in the commutative cash flow occurs every 10 years due to the expected lifetime of the inverter.

4. Conclusions

Many researchers have studied the performance of the hybrid PV/thermal panel and have proven that it is an efficient method for combined heat and power generation. However, there is no research on this type of panel that shows its real-life design requirements and its feasibility for residential applications. In this paper, a residential PV thermal hybrid system was proposed and tested under the Australian climatic conditions. The PVT panel which consists of a heat pipe unit integrated into a traditional PV panel is mounted on a north-side house roof located at latitude –33.9°. Performance analysis was carried out by evaluating the thermal and electrical energy output on typical days in different seasons. These tests showed that the maximum temperature of the PVT surface varies between 40 °C on a typical winter day and 60 °C on a typical summer day. The maximum water tank temperature that can be reached on a typical cold winter day is 30 °C and on a typical summer day is 50 °C. The PVT area required to cover the residential load of hot water is 3 m2/100 L of hot water tank capacity. The results depicted that the overall efficiency of the PVT panel depends on the amount of heat gained by water and varies between 26–65% which reaches more than 4 times the maximum efficiency (15% at laboratory conditions) of the considered PV panel in this research. The solar energy contribution of the proposed system for the residential hot water heating depends on the season and it ranges between 22–64%. Efficiency equation of the PVT panel was developed and used in long-term performance analysis of the proposed system. The commutative cash flow showed that the payback period of the system is between 5–6 years. The method of analysis presented in this paper verified the viability of the PVT technology for residential applications and showed that it could be easily integrated into the traditional rooftop PV panel array arrangement. The high overall efficiency and reasonable payback period make the proposed system convenient for green building and zero energy house designs.

Author Contributions

Conceptualization, S.O.; methodology, S.O. and J.F.; software, J.F.; validation, S.O. and J.F.; formal analysis, J.F.; investigation, S.O.; resources, S.O. and J.F.; data curation, writing—original draft preparation, S.O. and J.F.; writing—review and editing, S.O. and J.F.; visualization, J.F.; supervision, S.O.; project administration, S.O. All authors have read and agreed to the published version of the manuscript.

Funding

This research received no external funding.

Data Availability Statement

Not applicable.

Conflicts of Interest

The authors declare no conflict of interest.

Abbreviations

APVT panel area, m2
APVTPVT panel aperture area, m2
CwSpecific heat of water, J/kg.°C
FRheat removal factor
GSolar irradiation, W/m2
GTSolar global irradiation on titled surface, W/m2
ImpCurrent at Pmax, A
IscShort-circuit current, A
MMass of tank water, kg
m ˙ Water flow rate, kg/s
ncNumber of PV cell in PV panel
NPVTNumber of PVT
PTransient power generated by PV panel, W
PmaxRated maximum power, W
PtotalTotal transient energy gained by PVT panel, W
PwpWater pump input power, W
QBEnergy provided by booster, J
QgHeat gained by m2 of PVT panel, J
QHWEnergy required by HW tank/day, J
QHWSHeat gained by one PVT, J
(QHWS)TTotal heat required by the PVT system, J
qHWSTransient heat gain by PVT system, W
RpPower ratio
TaAmbient temperature, °C
TcPV cell temperature, °C
TiTank temperature at current time step, °C
Ti+1Tank temperature at next time step, °C
TinTemperature at inlet, °C
TmaxMaximum tank temperature, °C
ToutTemperature at outlet, °C
TsurfacePVT panel surface temperature, °C
ULHeat transfer coefficient, W/m2 °C
VmpVoltage at Pmax, V
VocOpen-circuit voltage, V
ηOverall thermal/electrical efficiency
ηthInstantaneous thermal efficiency
ταTransmissivity and absorptivity of the PVT surface
Subscript
hriFirst hour
hrfLast hour
opOperational condition
stStandard condition
thThermal
eElectric

References

  1. Odeh, S.; Nguyen, T. Assessment Method to Identify the Potential of Rooftop PV Systems in the Residential Districts. Energies 2021, 14, 4240. [Google Scholar] [CrossRef]
  2. Chow, T.T.; He, W.; Ji, J. Hybrid photovoltaic-thermosyphon water heating system for residential application. Sol. Energy 2006, 80, 298–306. [Google Scholar] [CrossRef]
  3. Gang, P.; Fu, H.; Zhang, T.; Ji, J. A numerical and experimental study on a heat pipe PV/T system. Sol. Energy 2011, 85, 911–921. [Google Scholar] [CrossRef]
  4. Wu, S.; Zhang, Q.; Xiao, L.; Guo, F. A heat pipe photovoltaic/thermal (PV/T) hybrid system and its performance Evaluation. Energy Build. 2011, 43, 3558–3567. [Google Scholar] [CrossRef]
  5. Huang, C.; Sung, H.; Yen, K. Experimental Study of Photovoltaic/Thermal (PV/T) Hybrid System. Int. J. Smart Grid Clean Energy 2012, 2, 148–152. [Google Scholar] [CrossRef] [Green Version]
  6. Herrando, M.; Freeman, J.; Ramos, A.; Zabalza, I.; Markides, N.C. Energetic and economic optimization of a novel hybrid PV-thermal system for domestic combined heating and power. In Proceedings of the International Conference on Heat Transfer, Fluid Mechanics and Thermodynamics, Portoroz, Slovenia, 17–19 July 2017; Volume 13, pp. 966–971. [Google Scholar]
  7. Herrando, M.; Markides, N.C.; Hellgardt, K. A UK-based assessment of hybrid PV and solar-thermal systems for domestic heating and power: System performance. Appl. Energy 2014, 122, 288–309. [Google Scholar] [CrossRef] [Green Version]
  8. Hui, L.; Chow, T.; Ji, J. Building-integrated heat pipe photovoltaic/thermal system for use in Hong Kong. Sol. Energy 2017, 155, 1084–1091. [Google Scholar]
  9. Diallo, T.; Yu, M.; Zhou, J.; Zhao, X.; Shittu, S.; Li, G.; Ji, J.; Hardy, D. Energy performance analysis of a novel solar PVT loop heat pipe employing a microchannel heat pipe evaporator and a PCM triple heat exchanger. Energy 2019, 167, 866–888. [Google Scholar] [CrossRef]
  10. Abdul-Ganiyu, S.; Quansah, D.; Ramde, W.E.; Seidu, R.; Adaramola, S.M. Investigation of solar photovoltaic-thermal (PVT) and solar photovoltaic (PV) performance: A case study in Ghana. Energies 2020, 13, 2701. [Google Scholar] [CrossRef]
  11. Sheshpoli, A.Z.; Jahanian, O.; Nikzadfar, K.; Delavar, A.M. Numerical and experimental investigation on the performance of hybrid PV/thermal systems in the north of Iran. Sol. Energy 2020, 215, 108–120. [Google Scholar] [CrossRef]
  12. Khordehgah, N.; Zabnienska-Góra, A.; Jouhara, H. Energy Performance Analysis of a PV/T System Coupled with Domestic Hot Water System. ChemEngineering 2020, 4, 22. [Google Scholar] [CrossRef]
  13. Xie, Y.; Simbamba, M.M.; Cao, X.; Sun, L.; Zhou, J.; Yuan, Y. Comparison Study of a Novel Tank PV/T Hot Water System and a Heat Pipe PV/T System. J. Therm. Sci. 2022, 31, 2009–2021. [Google Scholar] [CrossRef]
  14. Eshghi, H.; Kahani, M.; Zamen, M. Cooling of Photovoltaic Panel Equipped with Single Circular Heat Pipe: An Experimental Study. Renew. Energy Res. Appl. 2022, 3, 229–235. [Google Scholar]
  15. Odeh, S.; Habbouchi, S. Hybrid Energy Production PV Solar Panel. Australian Patent AU 20131000028 B4, 14 March 2013. [Google Scholar]
  16. Solcast API. Live and Forecast Solar and Weather Data. 2022. Available online: https://toolkit.solcast.com.au/legacy-live-forecast (accessed on 2 November 2022).
  17. Odeh, S.; Behnia, M. Development of PV Module Efficiency Using Water Cooling. Heat Transf. Eng. J. 2009, 30, 499–505. [Google Scholar] [CrossRef]
  18. RETScreen Expert, Clean Energy Management Software, Version 8.1, CanmetENERGY; Natural Resources Canada: Vancouver, BC, Canada, 2022.
  19. Jouhara, H.; Szulgowska-Zgrzywa, M.; Sayegh, M.A.; Milko, J.; Danielewicz, J.; Nannou, T.K.; Lester, S.P. The performance of a heat pipe based solar PV/T roof collector and its potential contribution in district heating applications. Energy 2017, 136, 117–125. [Google Scholar] [CrossRef] [Green Version]
  20. Pei, G.; Fu, H.; Zhu, H.; Ji, J. Performance study and parametric analysis of a novel heat pipe PV/T system. Energy 2012, 37, 384–395. [Google Scholar]
  21. Duffie, J.; Beckman, W. Solar Engineering of Thermal Processes, 4th ed.; Wiley & Sons: Hoboken, NJ, USA, 2013; Chapter 6; pp. 288–301. [Google Scholar]
  22. Kim, J.H.; Kim, J.T. Comparison of Electrical and Thermal Performances of Glazed and Unglazed PVT Collectors. Int. J. Photoenergy 2012, 2012, 957847. [Google Scholar] [CrossRef]
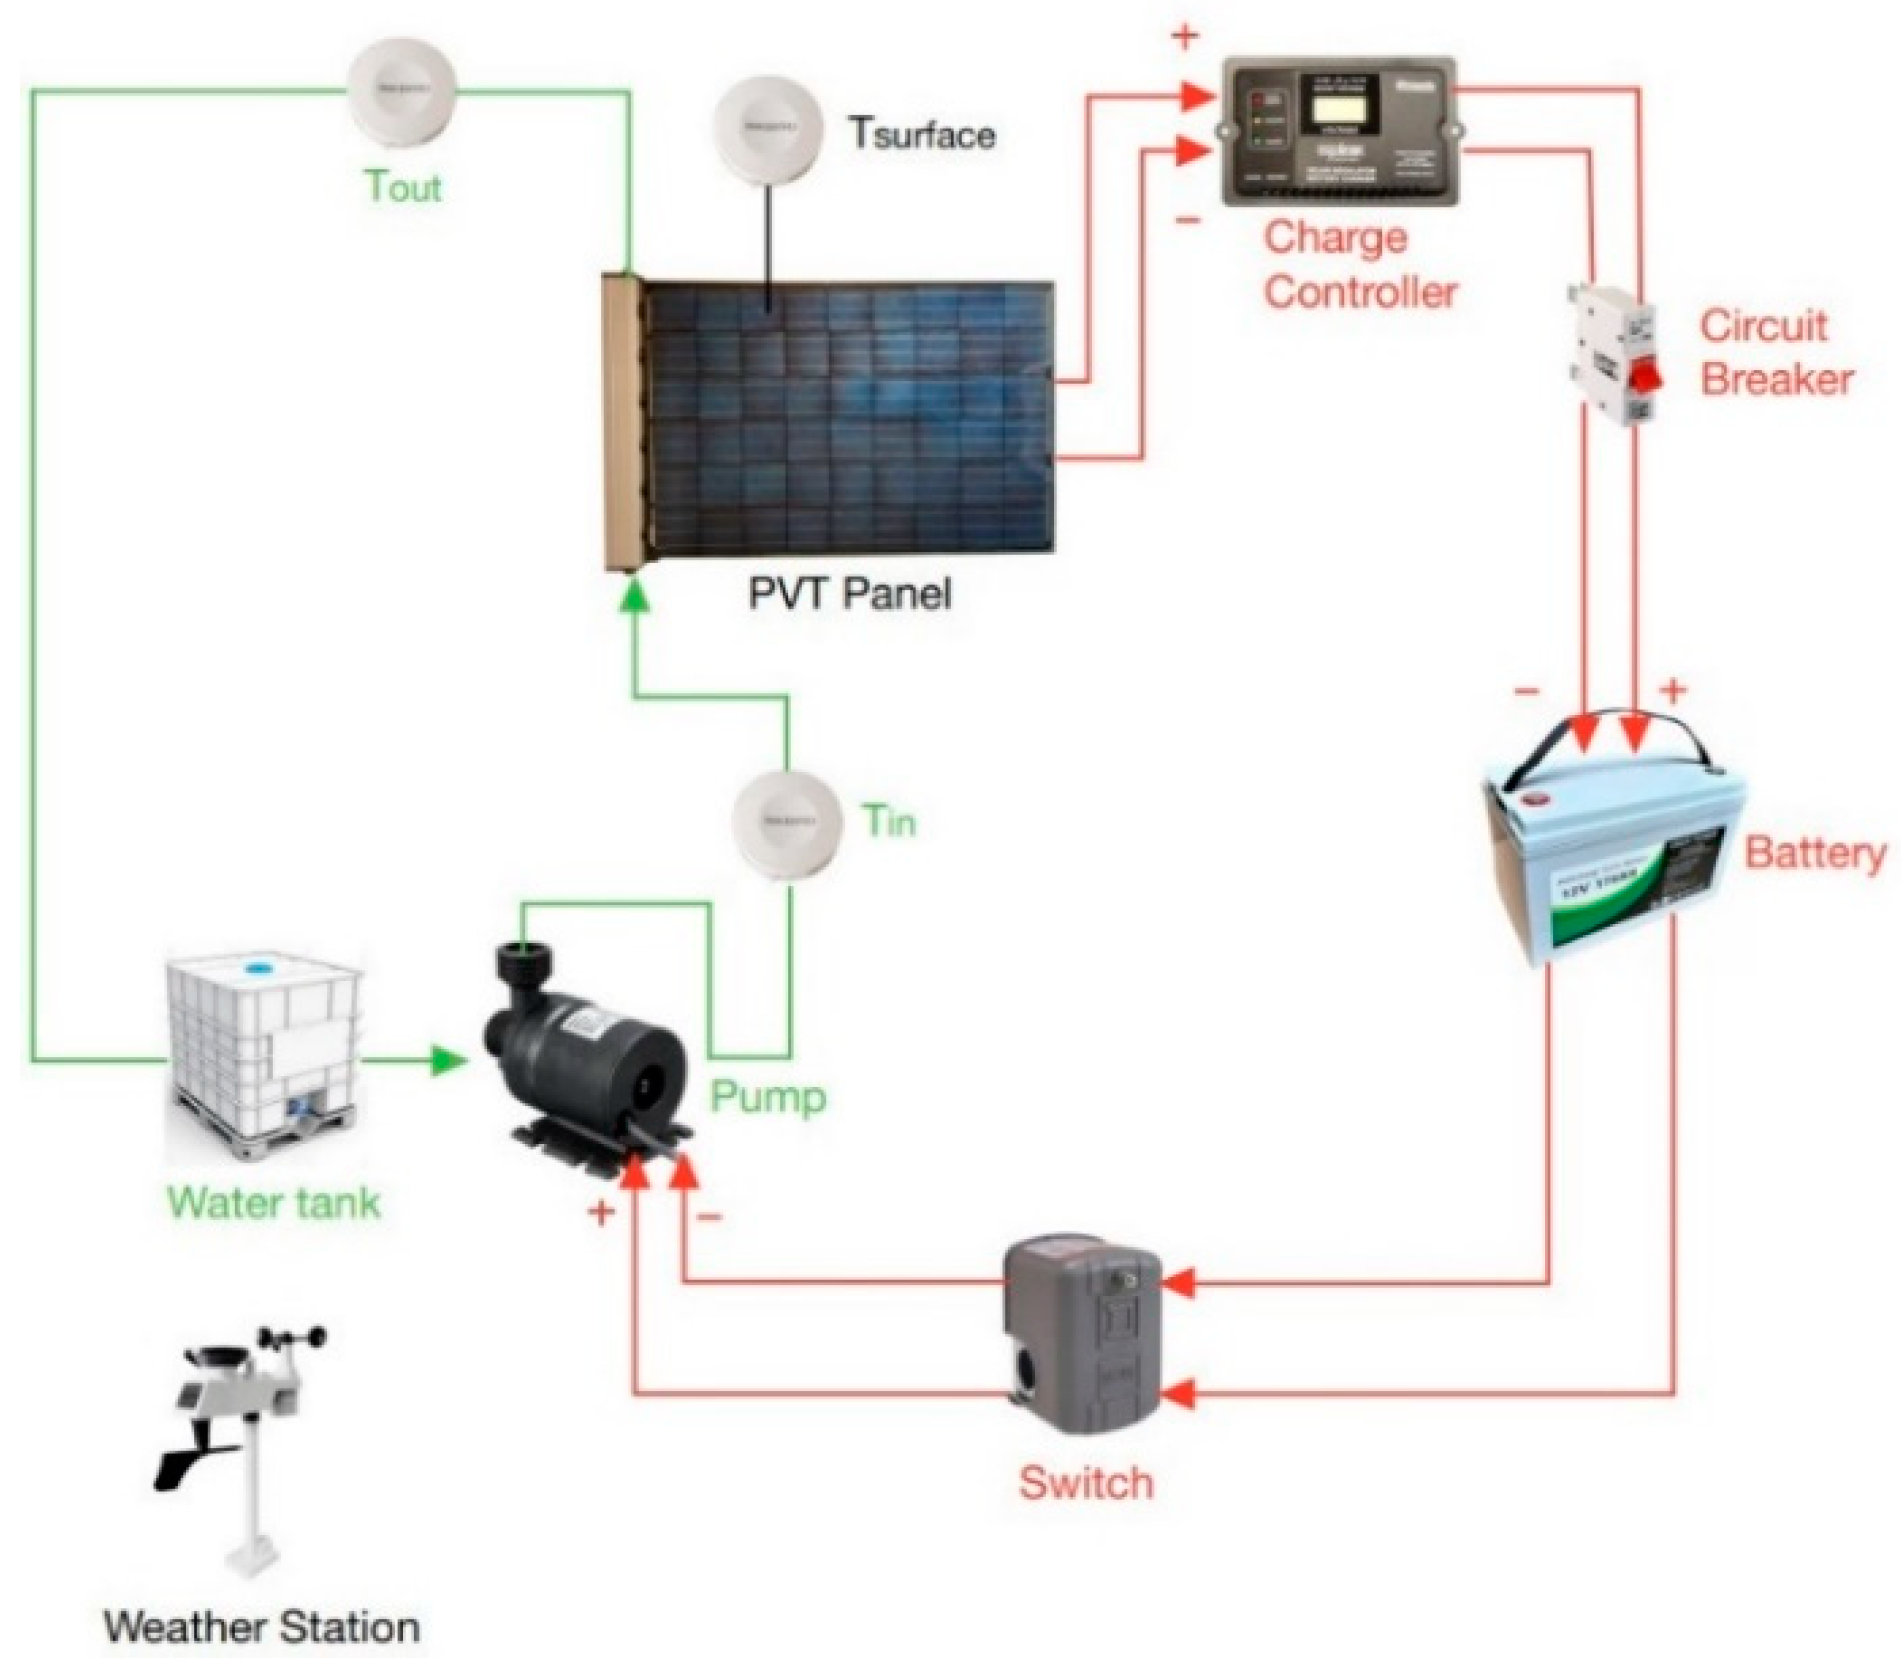
Figure 1. PVT system layout.
Energies 16 00121 g001
Figure 2. PVT panel mounted on the roof.
Energies 16 00121 g002
Figure 3. The transient change of the PVT panel intel and exit water temperatures with different weather conditions.
Energies 16 00121 g003
Figure 4. PVT test results: (a) winter day, (b) spring day, (c) summer day, (d) autumn day.
Energies 16 00121 g004aEnergies 16 00121 g004b
Figure 5. PVT panel efficiency equation test of this paper compared with others [22] work.
Energies 16 00121 g005
Figure 6. Monthly generation of electricity and heat delivered of the rooftop PVT system.
Energies 16 00121 g006
Figure 7. Cumulative cash flow and payback period.
Energies 16 00121 g007
Table 1. PVT system test rig major components.
ComponentSpecification
PVT panelRated Maximum Power (Pmax) = 200 W
Voltage at Pmax (Vmp) = 26.26 V
Current at Pmax (Imp) = 7.63 A
Open-circuit Voltage (Voc) = 33.6 V
Short-circuit current (Isc) = 8.11 A
Number of cells = 54 polycrystalline cells
Cell Technology: Ploy Si
PV panel weight = 17 kg
PVT panel weight = 25 kg
PV panel dimension (mm) = 1488 × 990 × 35
Temperature sensorDimension (mm) = 56 × 19
Weight = 21 g
Temperature range = −40 °C to 100 °C
Wireless range = 50 m
Typical temperature accuracy = ±0.3 °C
Water PumpVoltage = DC-12 V
Working current = 920 mAh ± 15%
Input power = 18 W
Flow = 800 L/H ± 15%
Pump dimensions (mm) = 80 × 77 × 49
Weather stationTemperature range = −40 °C to 100 °C
Wind speed range = 0 to 50 m/s
irradiation = 0 to 1600 W/m2
UV index = 1 to 15+
BatteryVoltage = 2 × 12 V, 9 Ah, deep cycle
Water tankCapacity = 20 L
Table 2. Number of PVT panels and delivered energy per 100 litter hot water tank.
MonthPVT Heat (QWHS) kJ/m2 Booster Energy (QB) kJ Per 100 L TankHW Tank Energy (QHW) kJ Per 100 L TankPVT System Energy (QHWS)T kJ Per 100 L TankNumber of PVT Panels kJ Per 100 L TankSolar Energy Contribution
Winter302411,60420,17385691.90.42
Spring122010,47113,39329221.60.22
Summer3984562215,69610,0741.70.64
Autumn4146880717,33985311.40.49
Table 3. PVT panel overall efficiency.
SeasonMaximum EfficiencyMinimum Efficiency
Autumn49%28%
Summer65%31%
Winter45%26%
Spring58%29%
Table 4. PV and PVT financial information.
PV Panels
Area
PV System CapacityPV Panel CostFeed-In
Tariff
Rooftop PVT AreaPVT System Extra CostHot Water Tank
Capacity
Project Life Inflation Ratio
(m2)kWAU$/kWUA$/kWh(m2)USD/m2 L/dayYear%
31.7510000.158.8500300202
Disclaimer/Publisher’s Note: The statements, opinions and data contained in all publications are solely those of the individual author(s) and contributor(s) and not of MDPI and/or the editor(s). MDPI and/or the editor(s) disclaim responsibility for any injury to people or property resulting from any ideas, methods, instructions or products referred to in the content.