
Artificial Sun—A Stand to Test New PVT Minimodules

 ,
,  , , ,
, , ,
Abstract
:1. Introduction
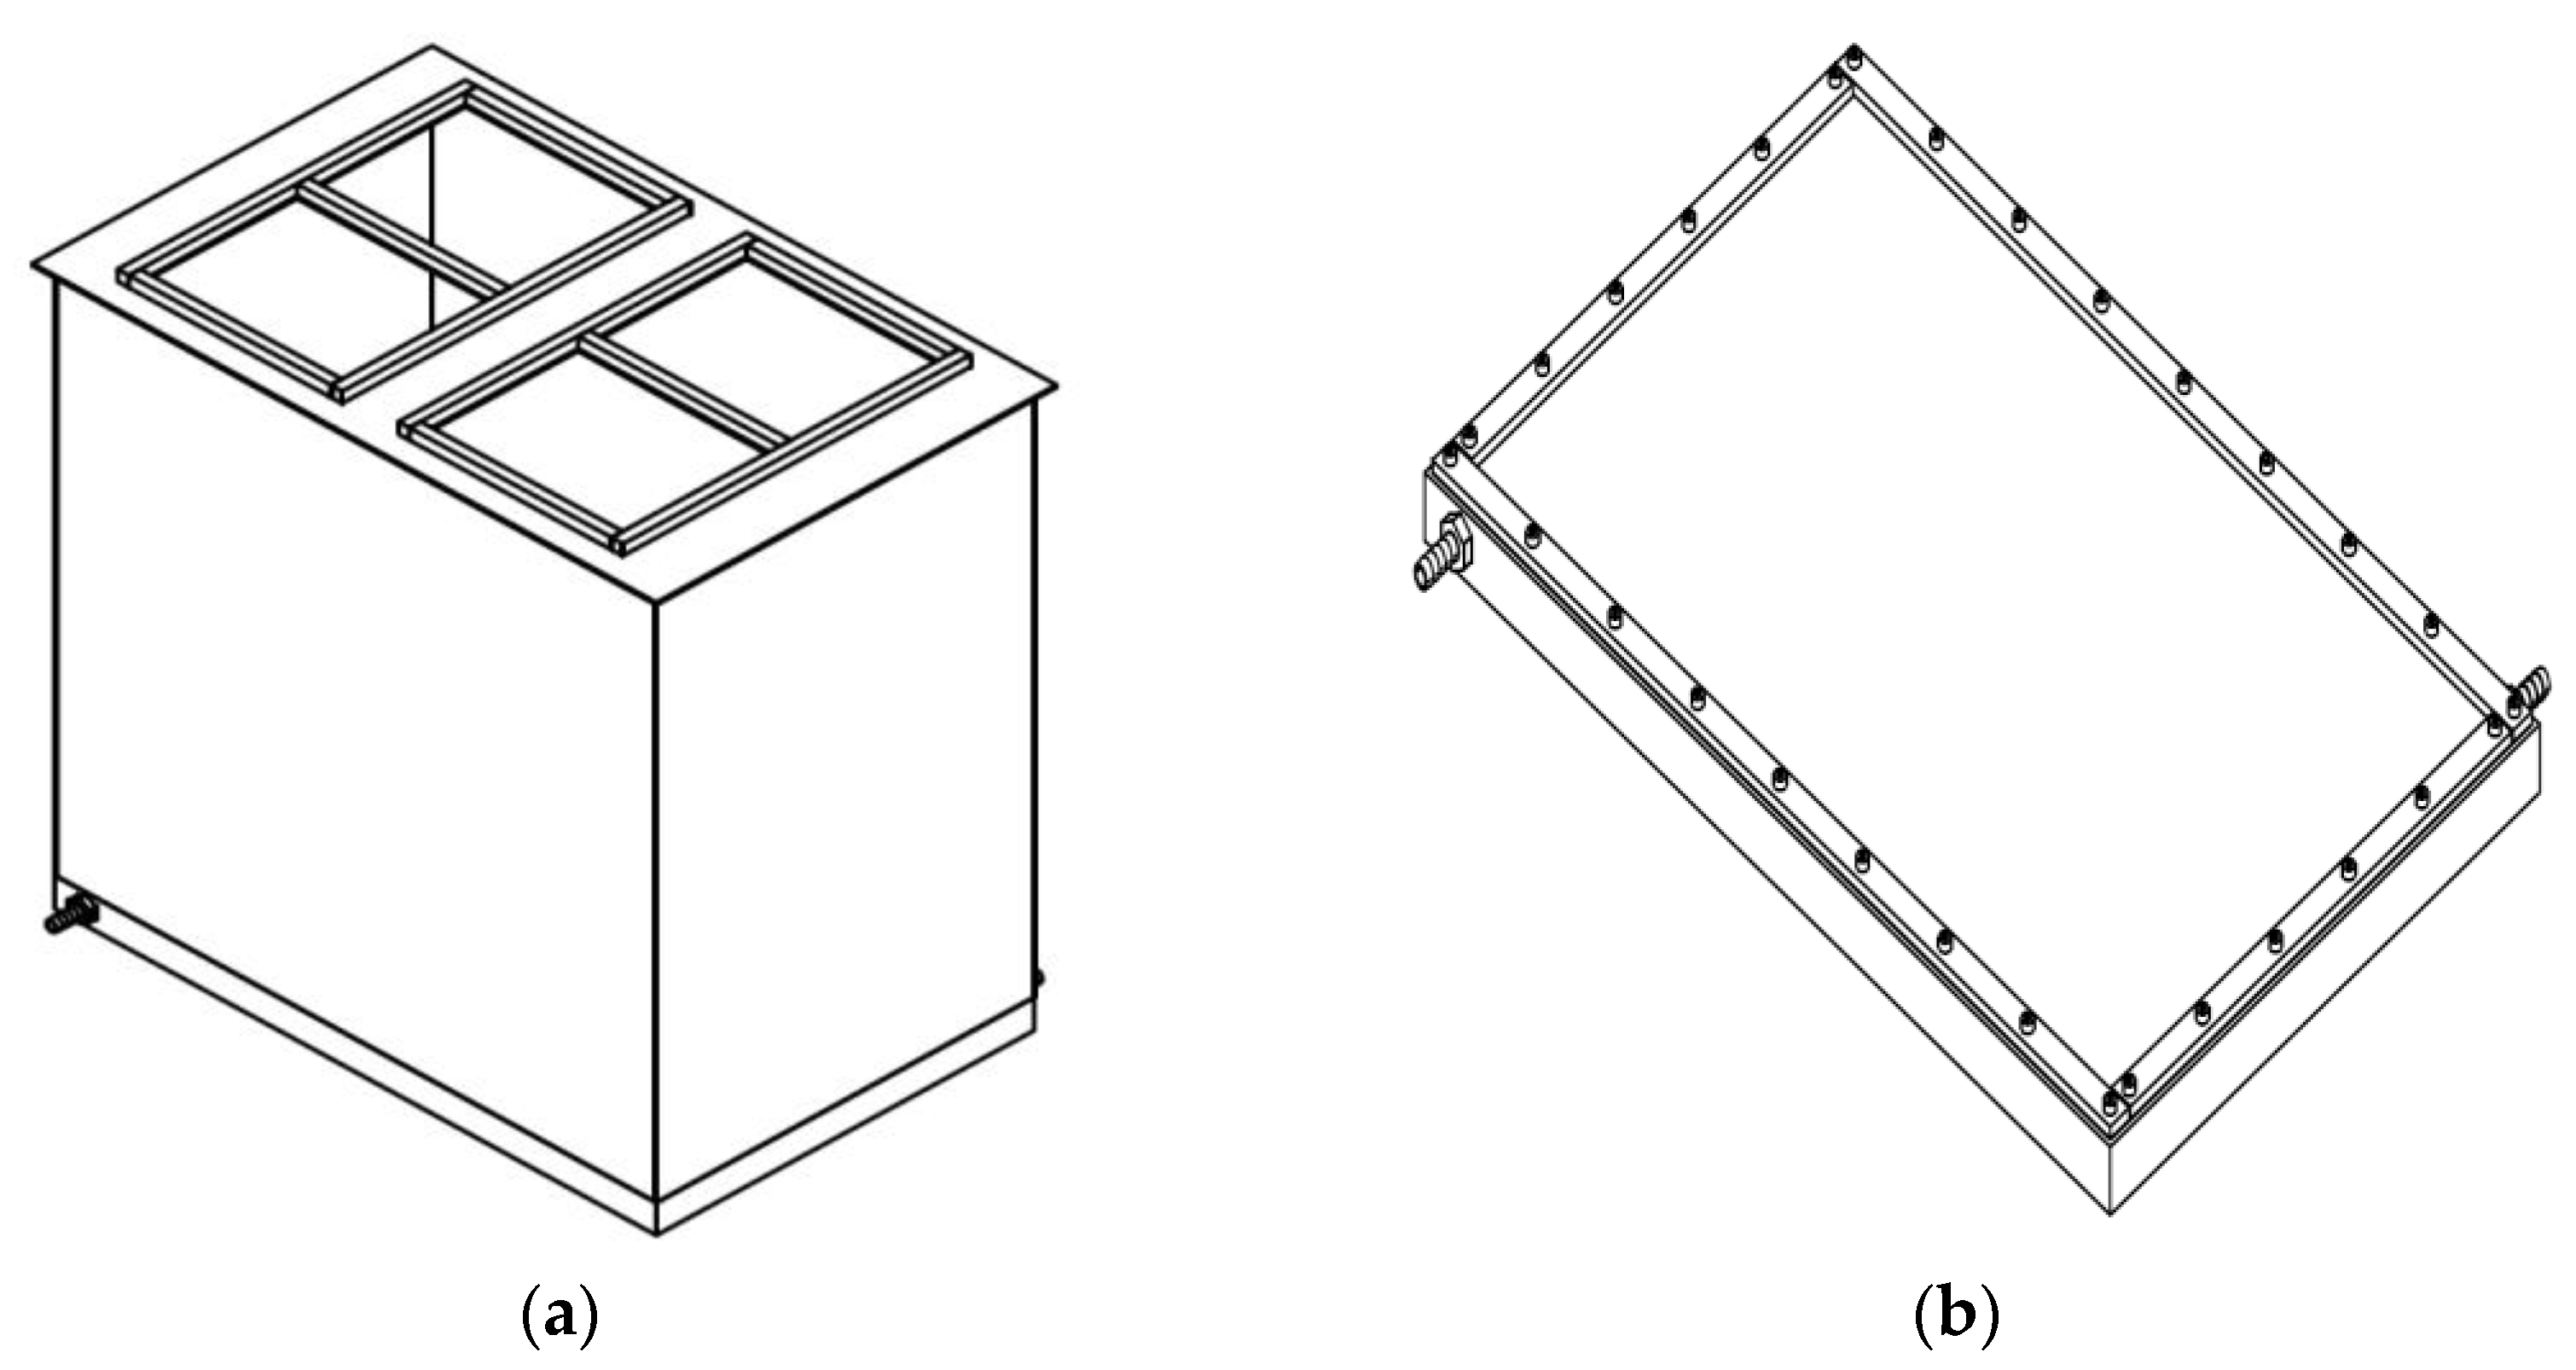
2. Artificial Sun
3. Numerical Analysis
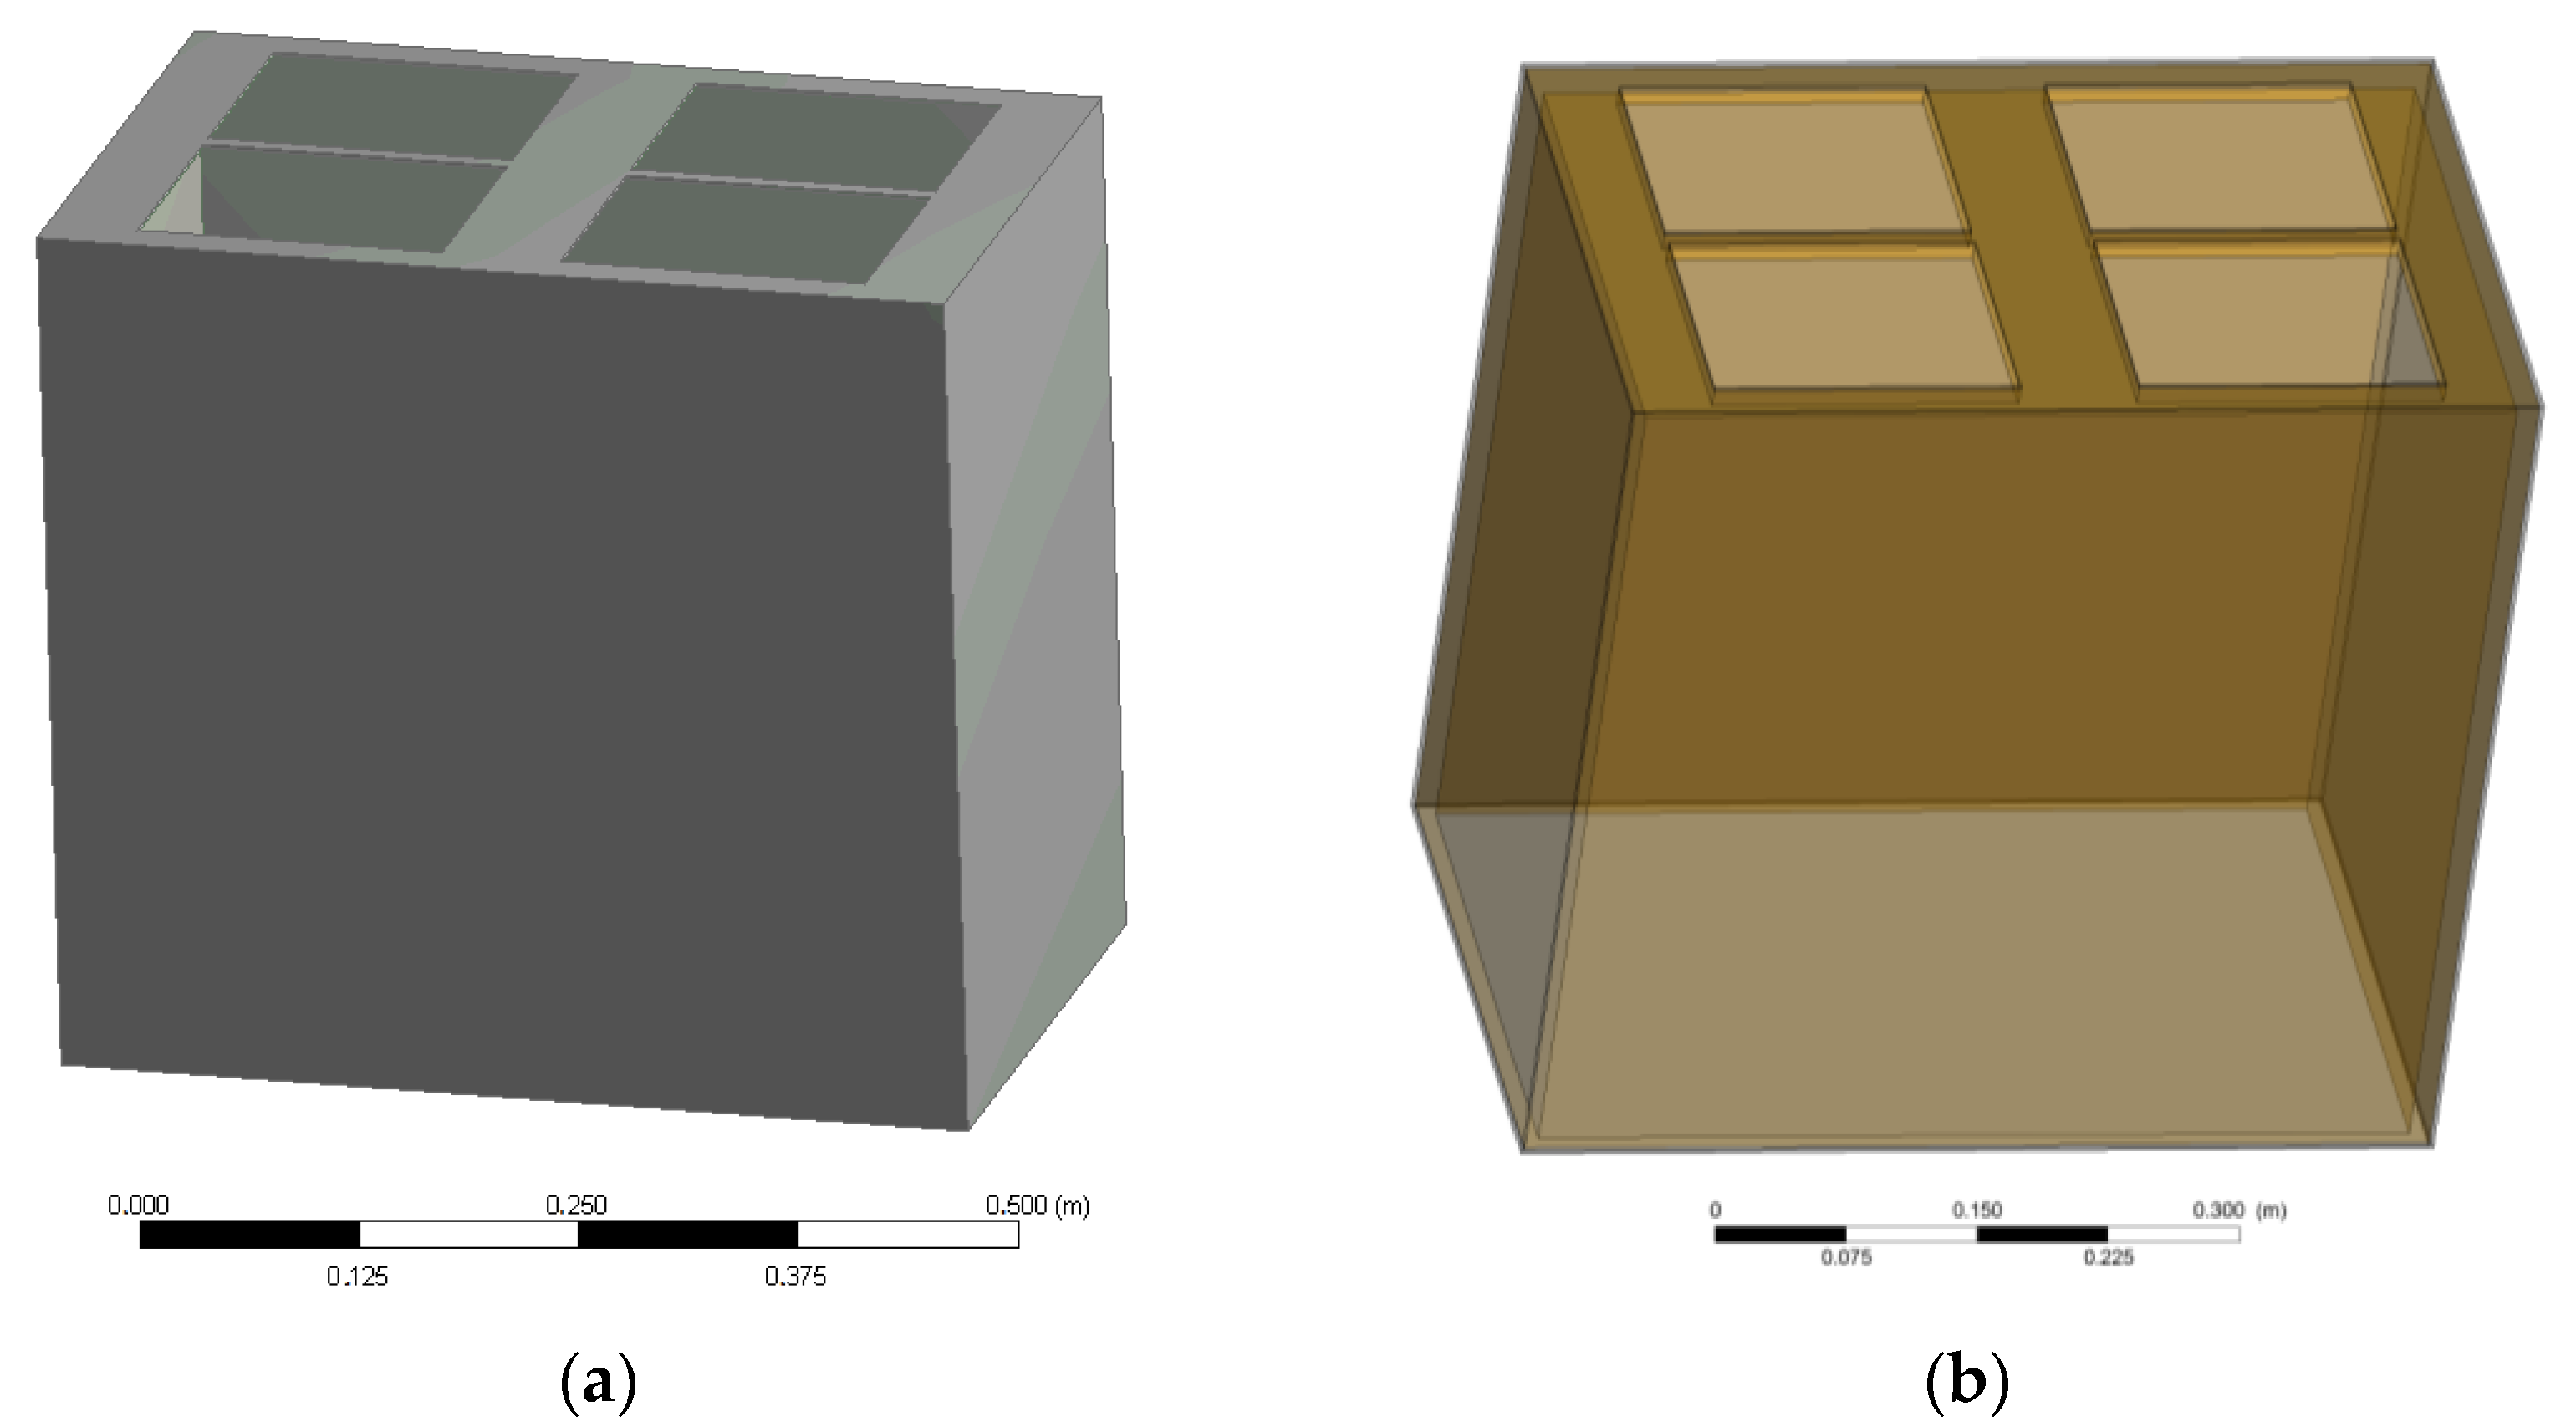
3.1. Numerical Model
- a.
- Insulator with a rough surface;
- b.
- Steel with a reflective surface;
- c.
- Double wall of 5 mm with a rough surface and a steel wall with a 5 mm thick isolator with an untreated surface;
- d.
- Double wall of 5 mm with a reflective surface and a steel wall with a 5 mm thick isolator with an additional reflective layer;
- e.
- Double wall of 10 mm with a reflective surface and a steel wall with a 5 mm thick isolator with an additional reflective layer; and
- f.
- Double wall of 20 mm with a reflective surface and a steel wall with a 5 mm thick isolator with an additional reflective layer.
- The heat flux at every rectangle representing a lamp equals 168,651 W/m2, which corresponds to 170 W in total;
- The temperature at the bottom of the aluminium plate is 32 °C (efficient cooling with the aid of 30 °C liquid coolant is assumed);
- Ambient heat exchange is modelled with the aid of a convection boundary condition with the reference temperature of 25 °C and a heat transfer coefficient of 10 W/m2K, and 2 W/m2K at the side walls and the top wall of the dome, respectively;
- The heat exchange in the enclosure involves thermal radiation (the differential approximation model [24] is used; hence no heat absorption or scattering within the air is analysed), the solid surfaces are opaque, and the emissivity equals:
- ○
- 0.9 for the painted metal surfaces and for the rough layers of the isolator; and
- ○
- 0.1 for the metal surfaces and for the isolators covered with reflective layers.
- The buoyancy model is turned on (free convection with laminar flow) and gravity acceleration is directed perpendicularly to the bottom plate; and
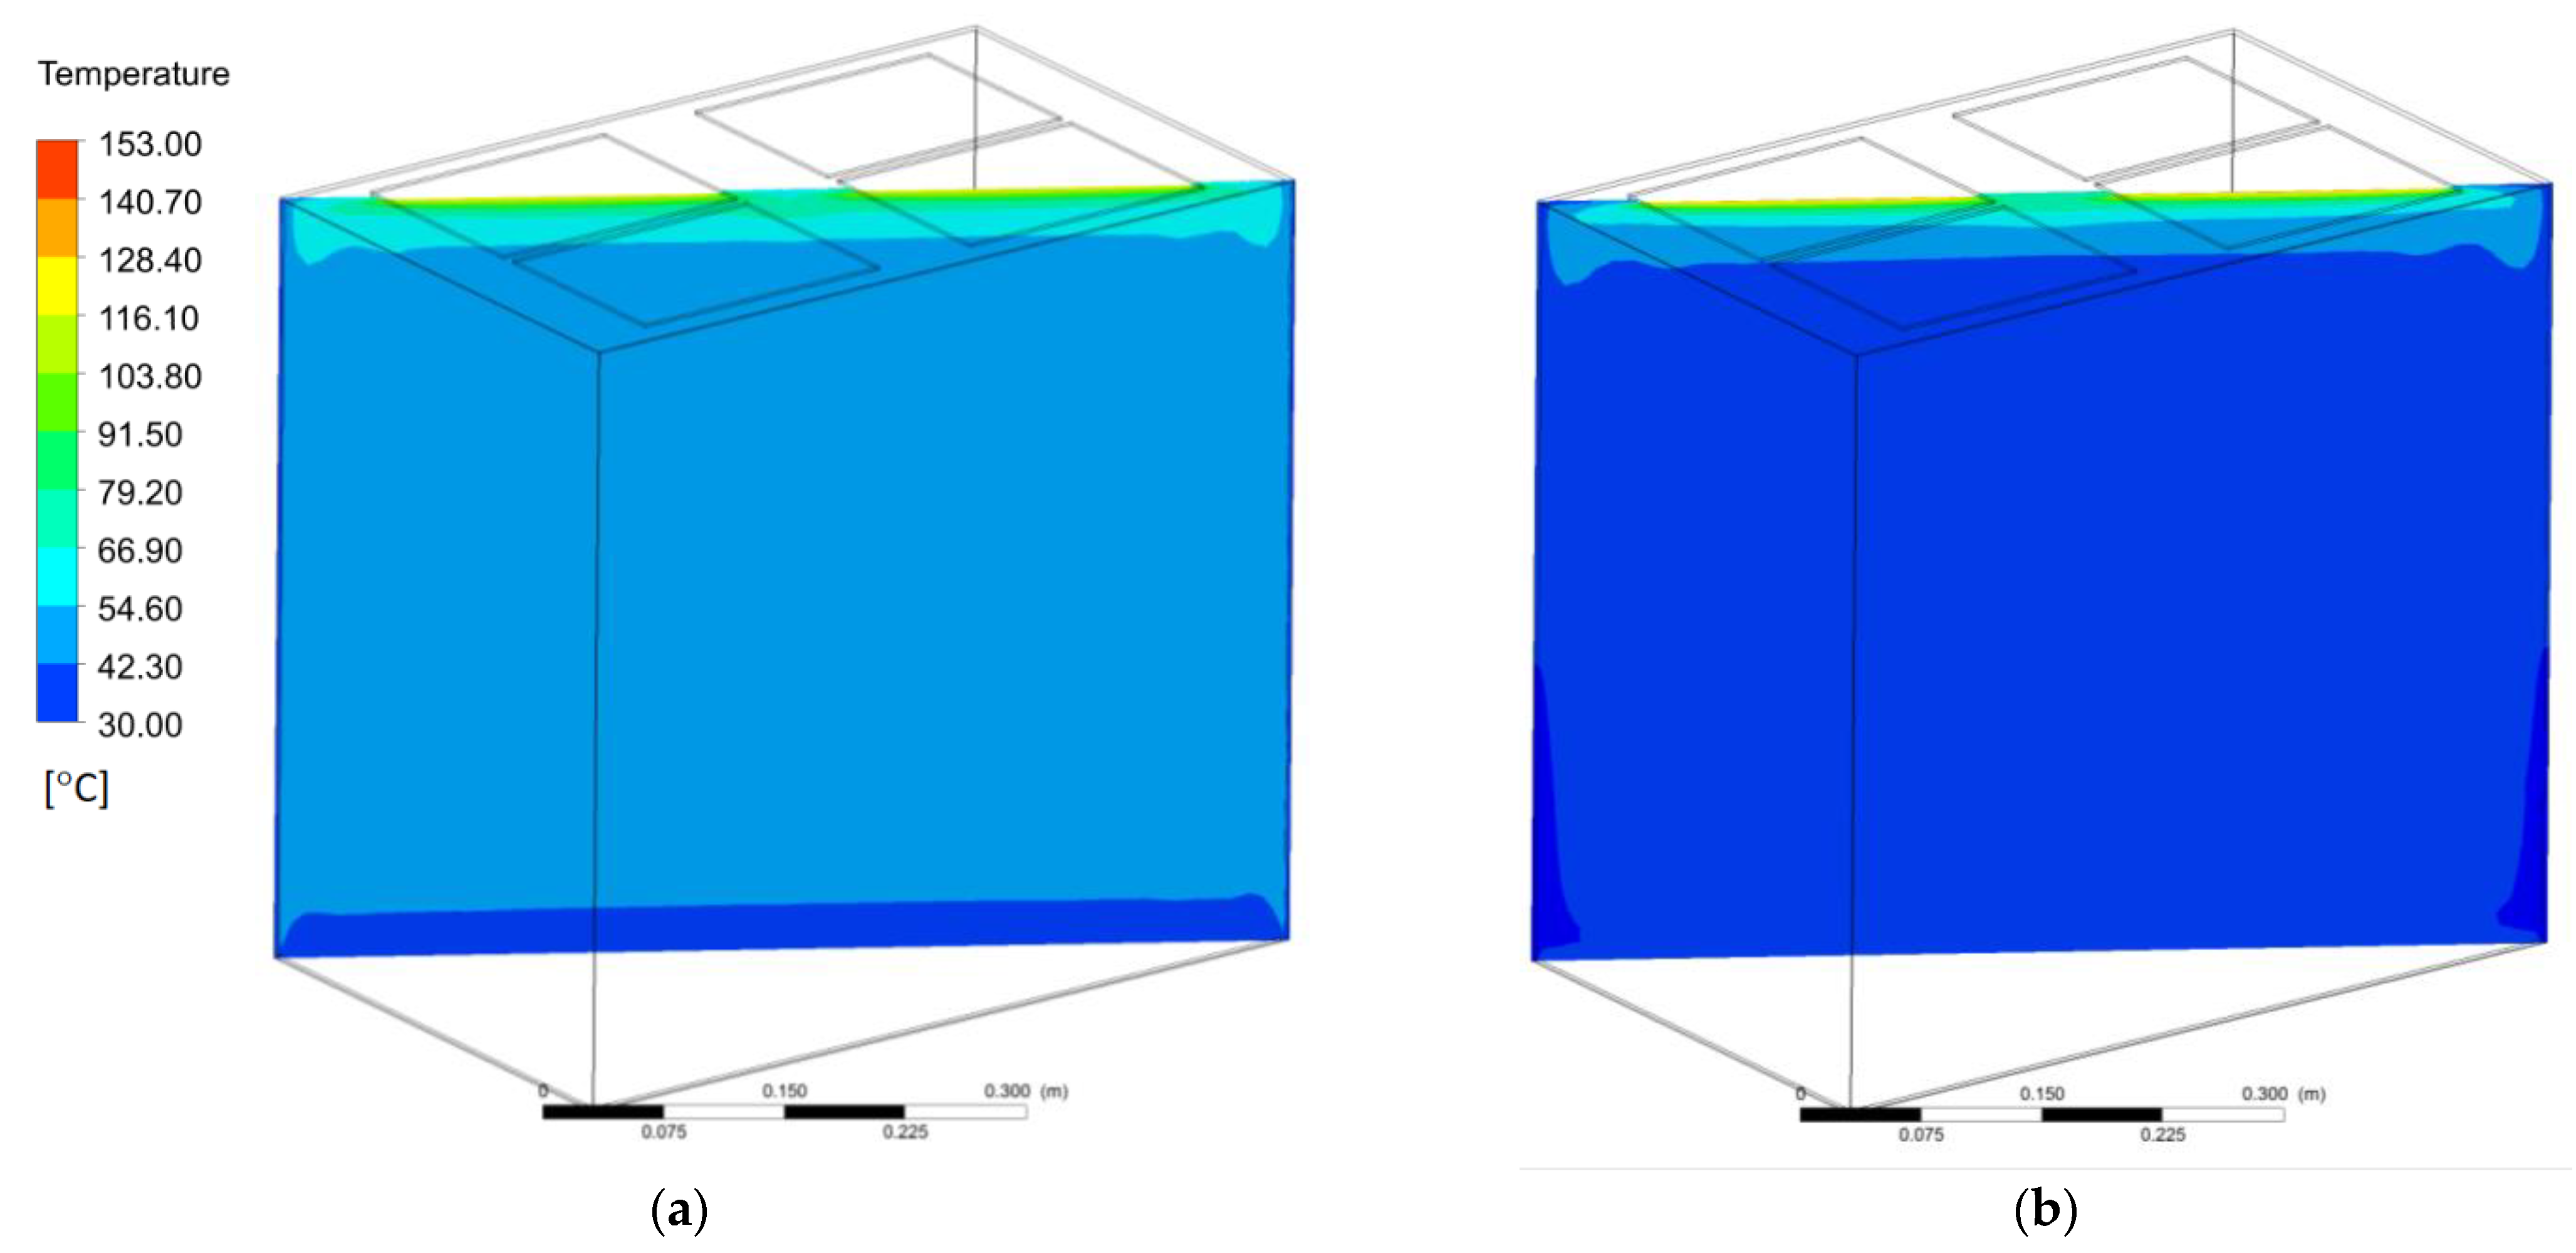
3.2. Results of Simulations
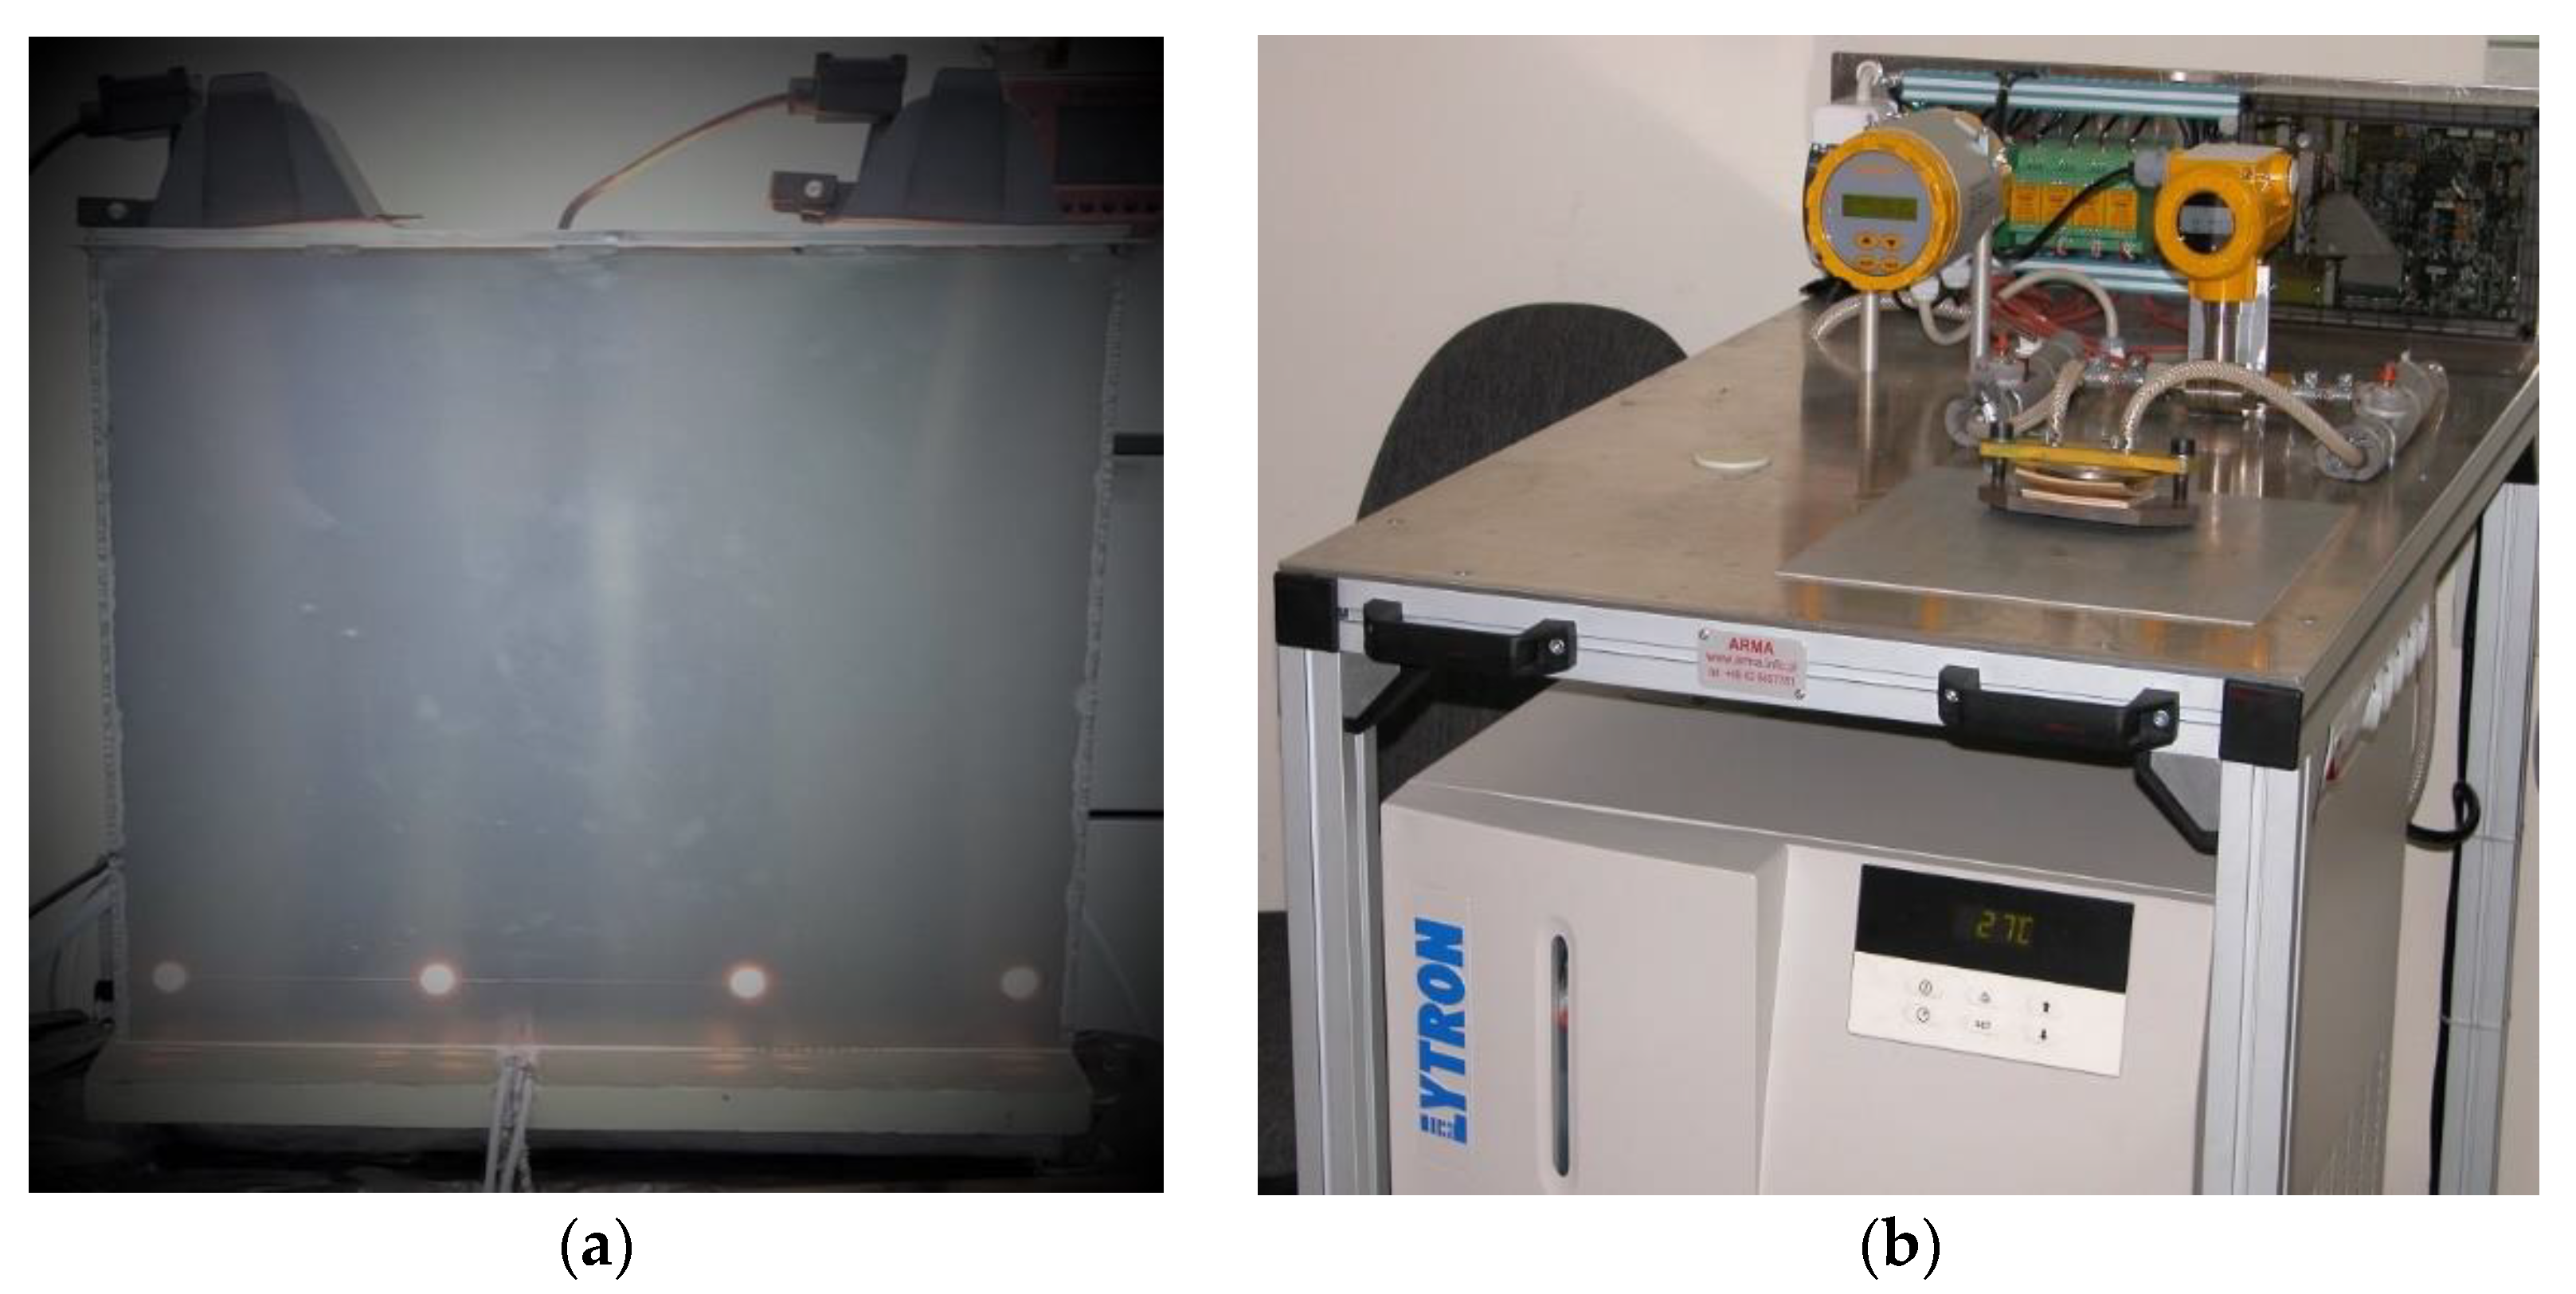
4. Experimental Verification
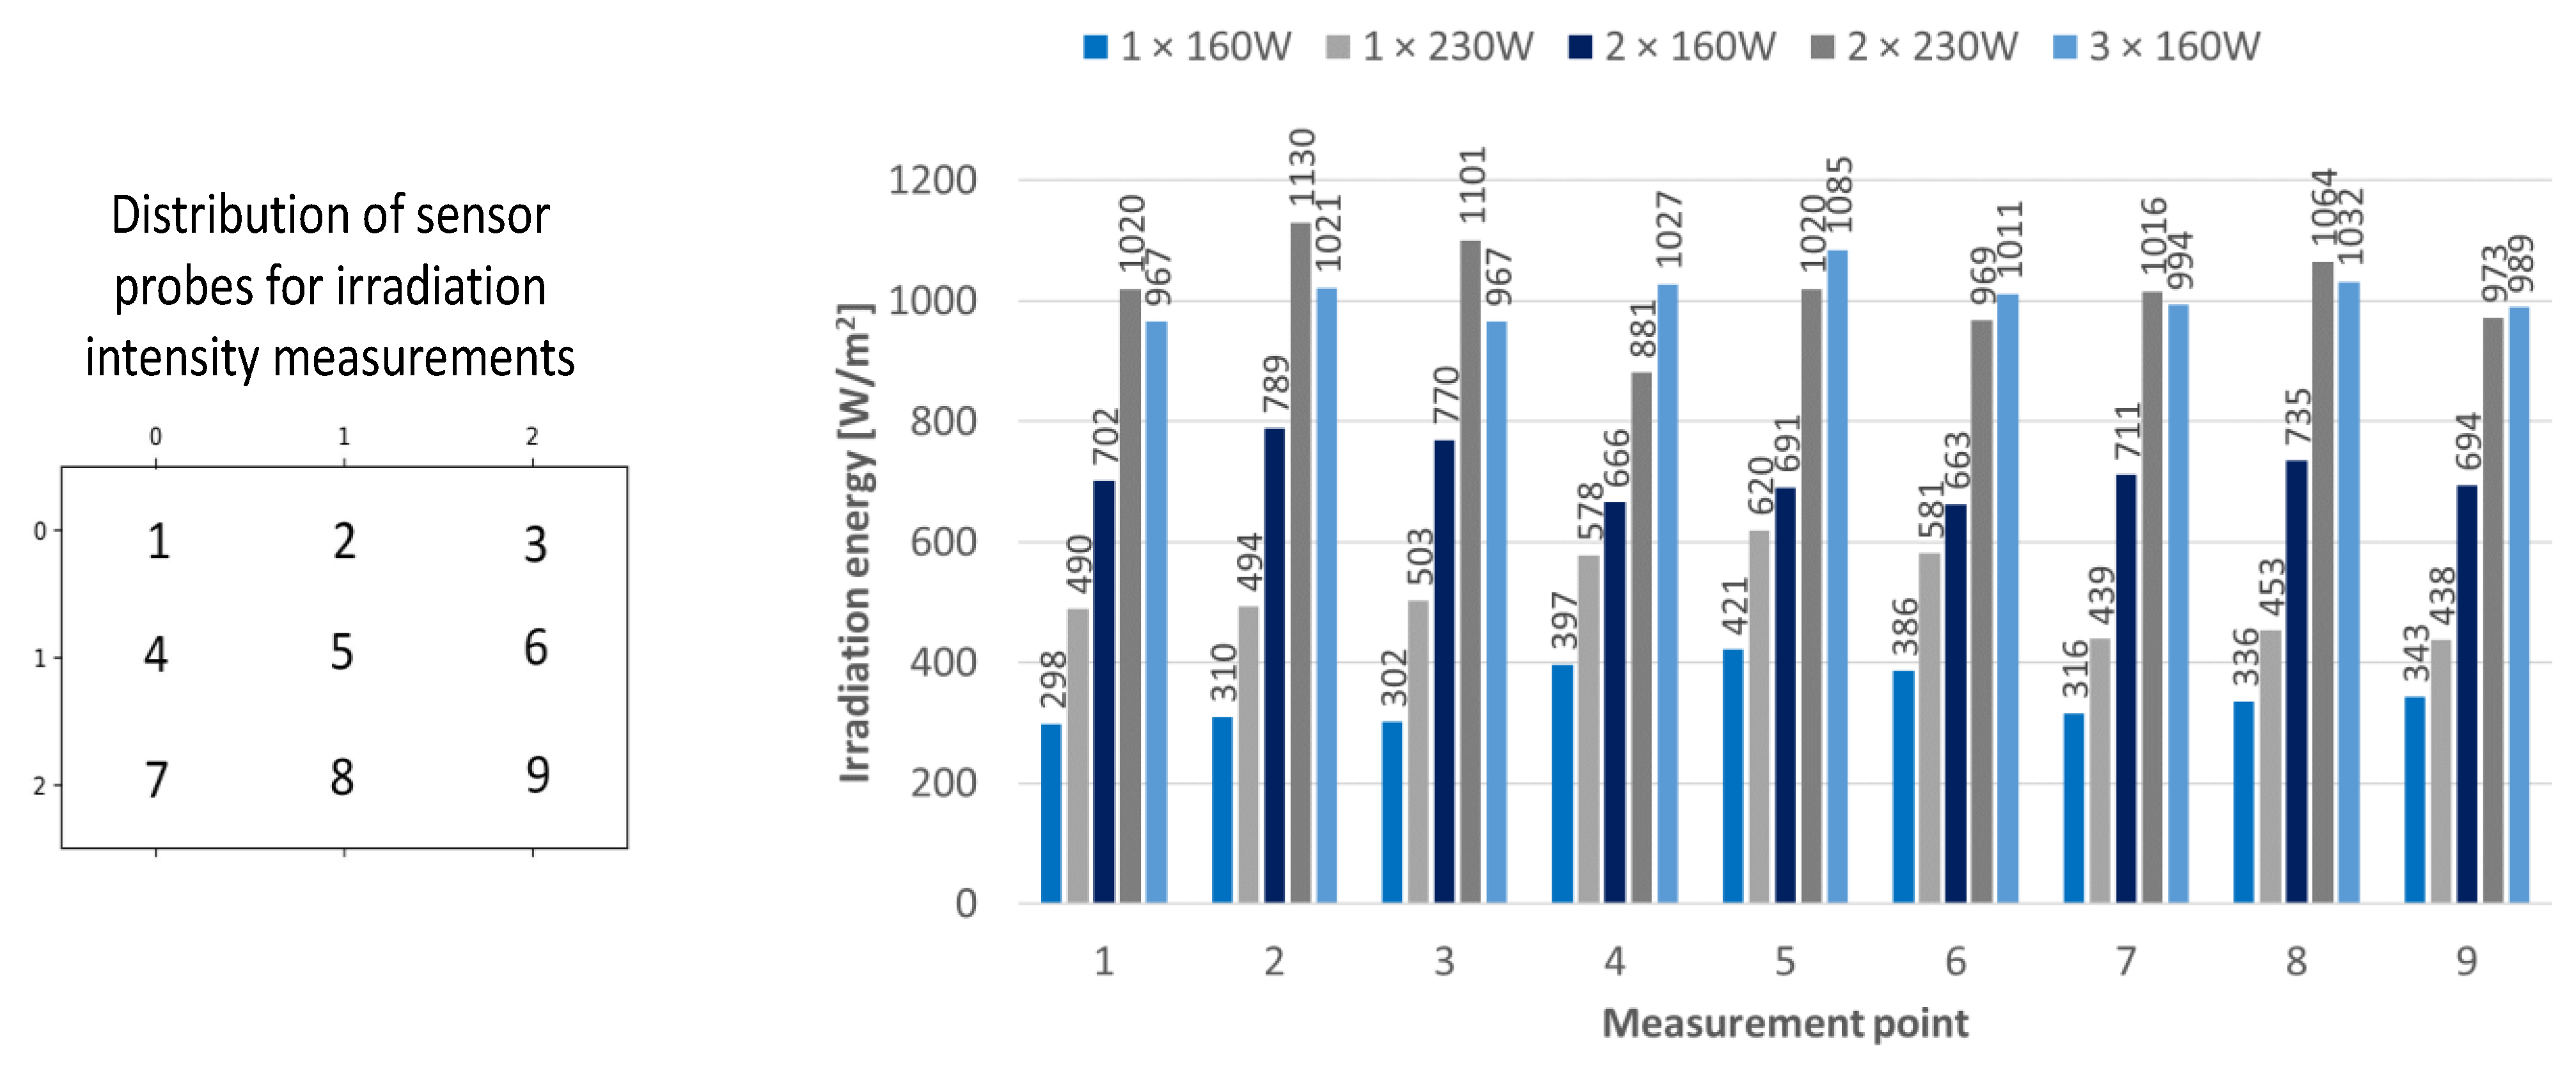
4.1. Experimental Setup
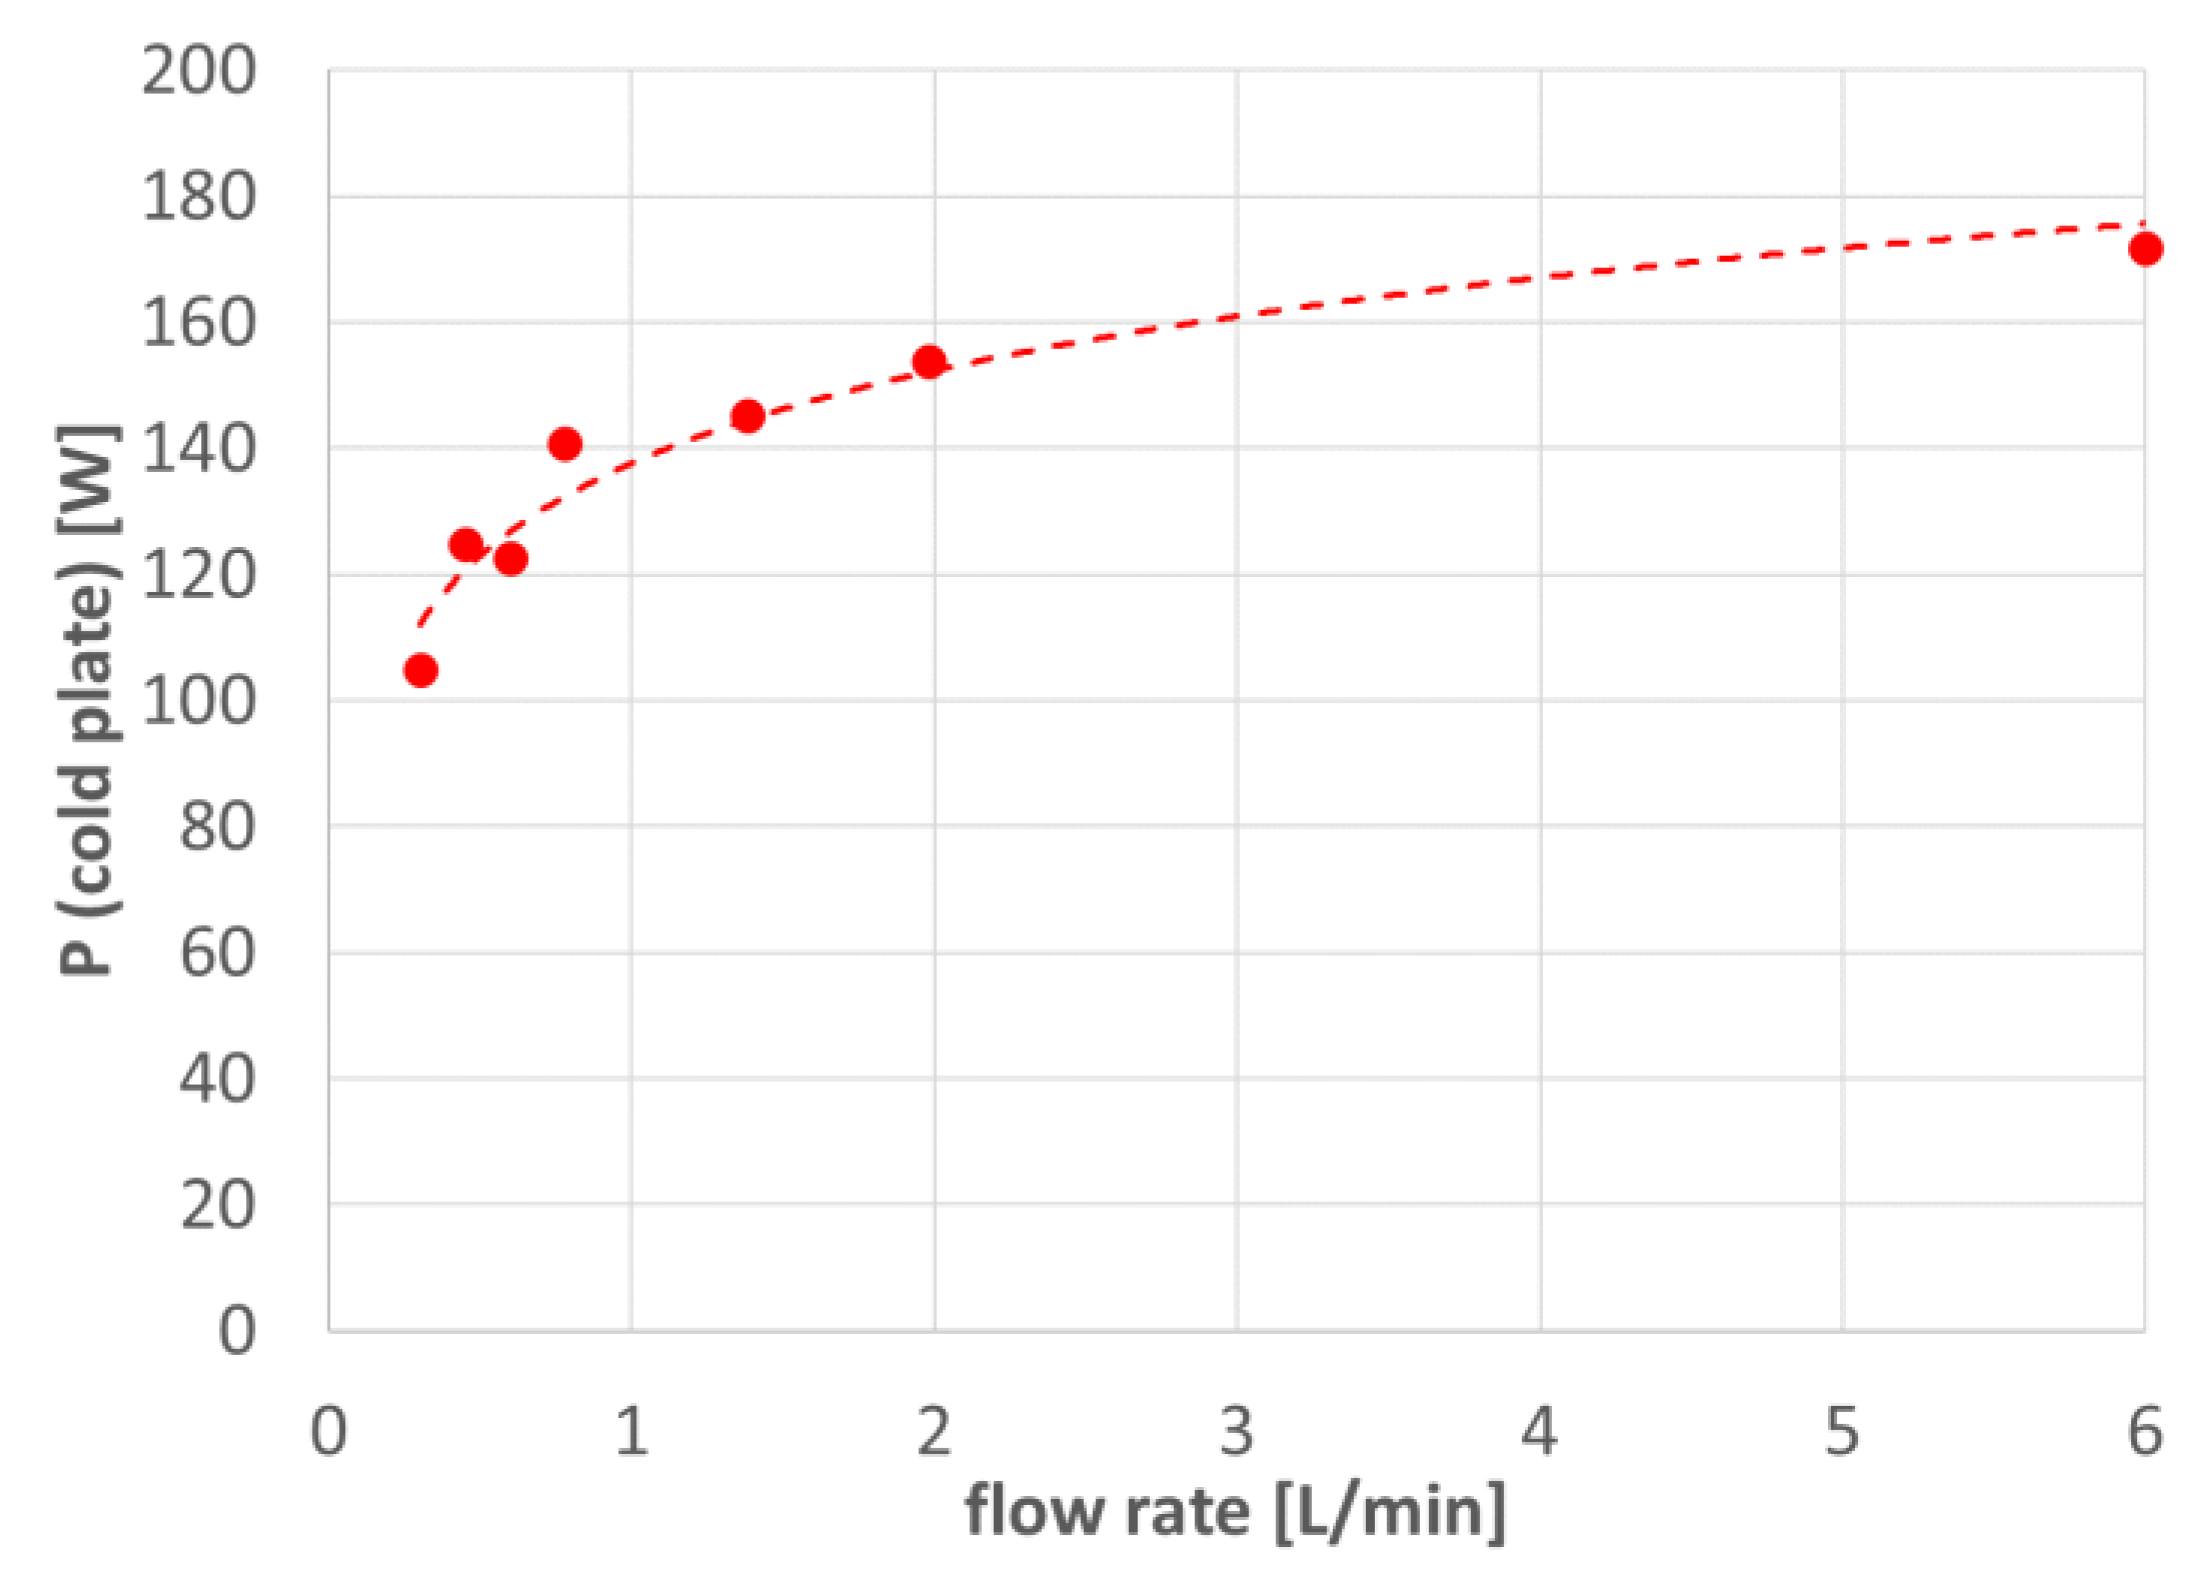
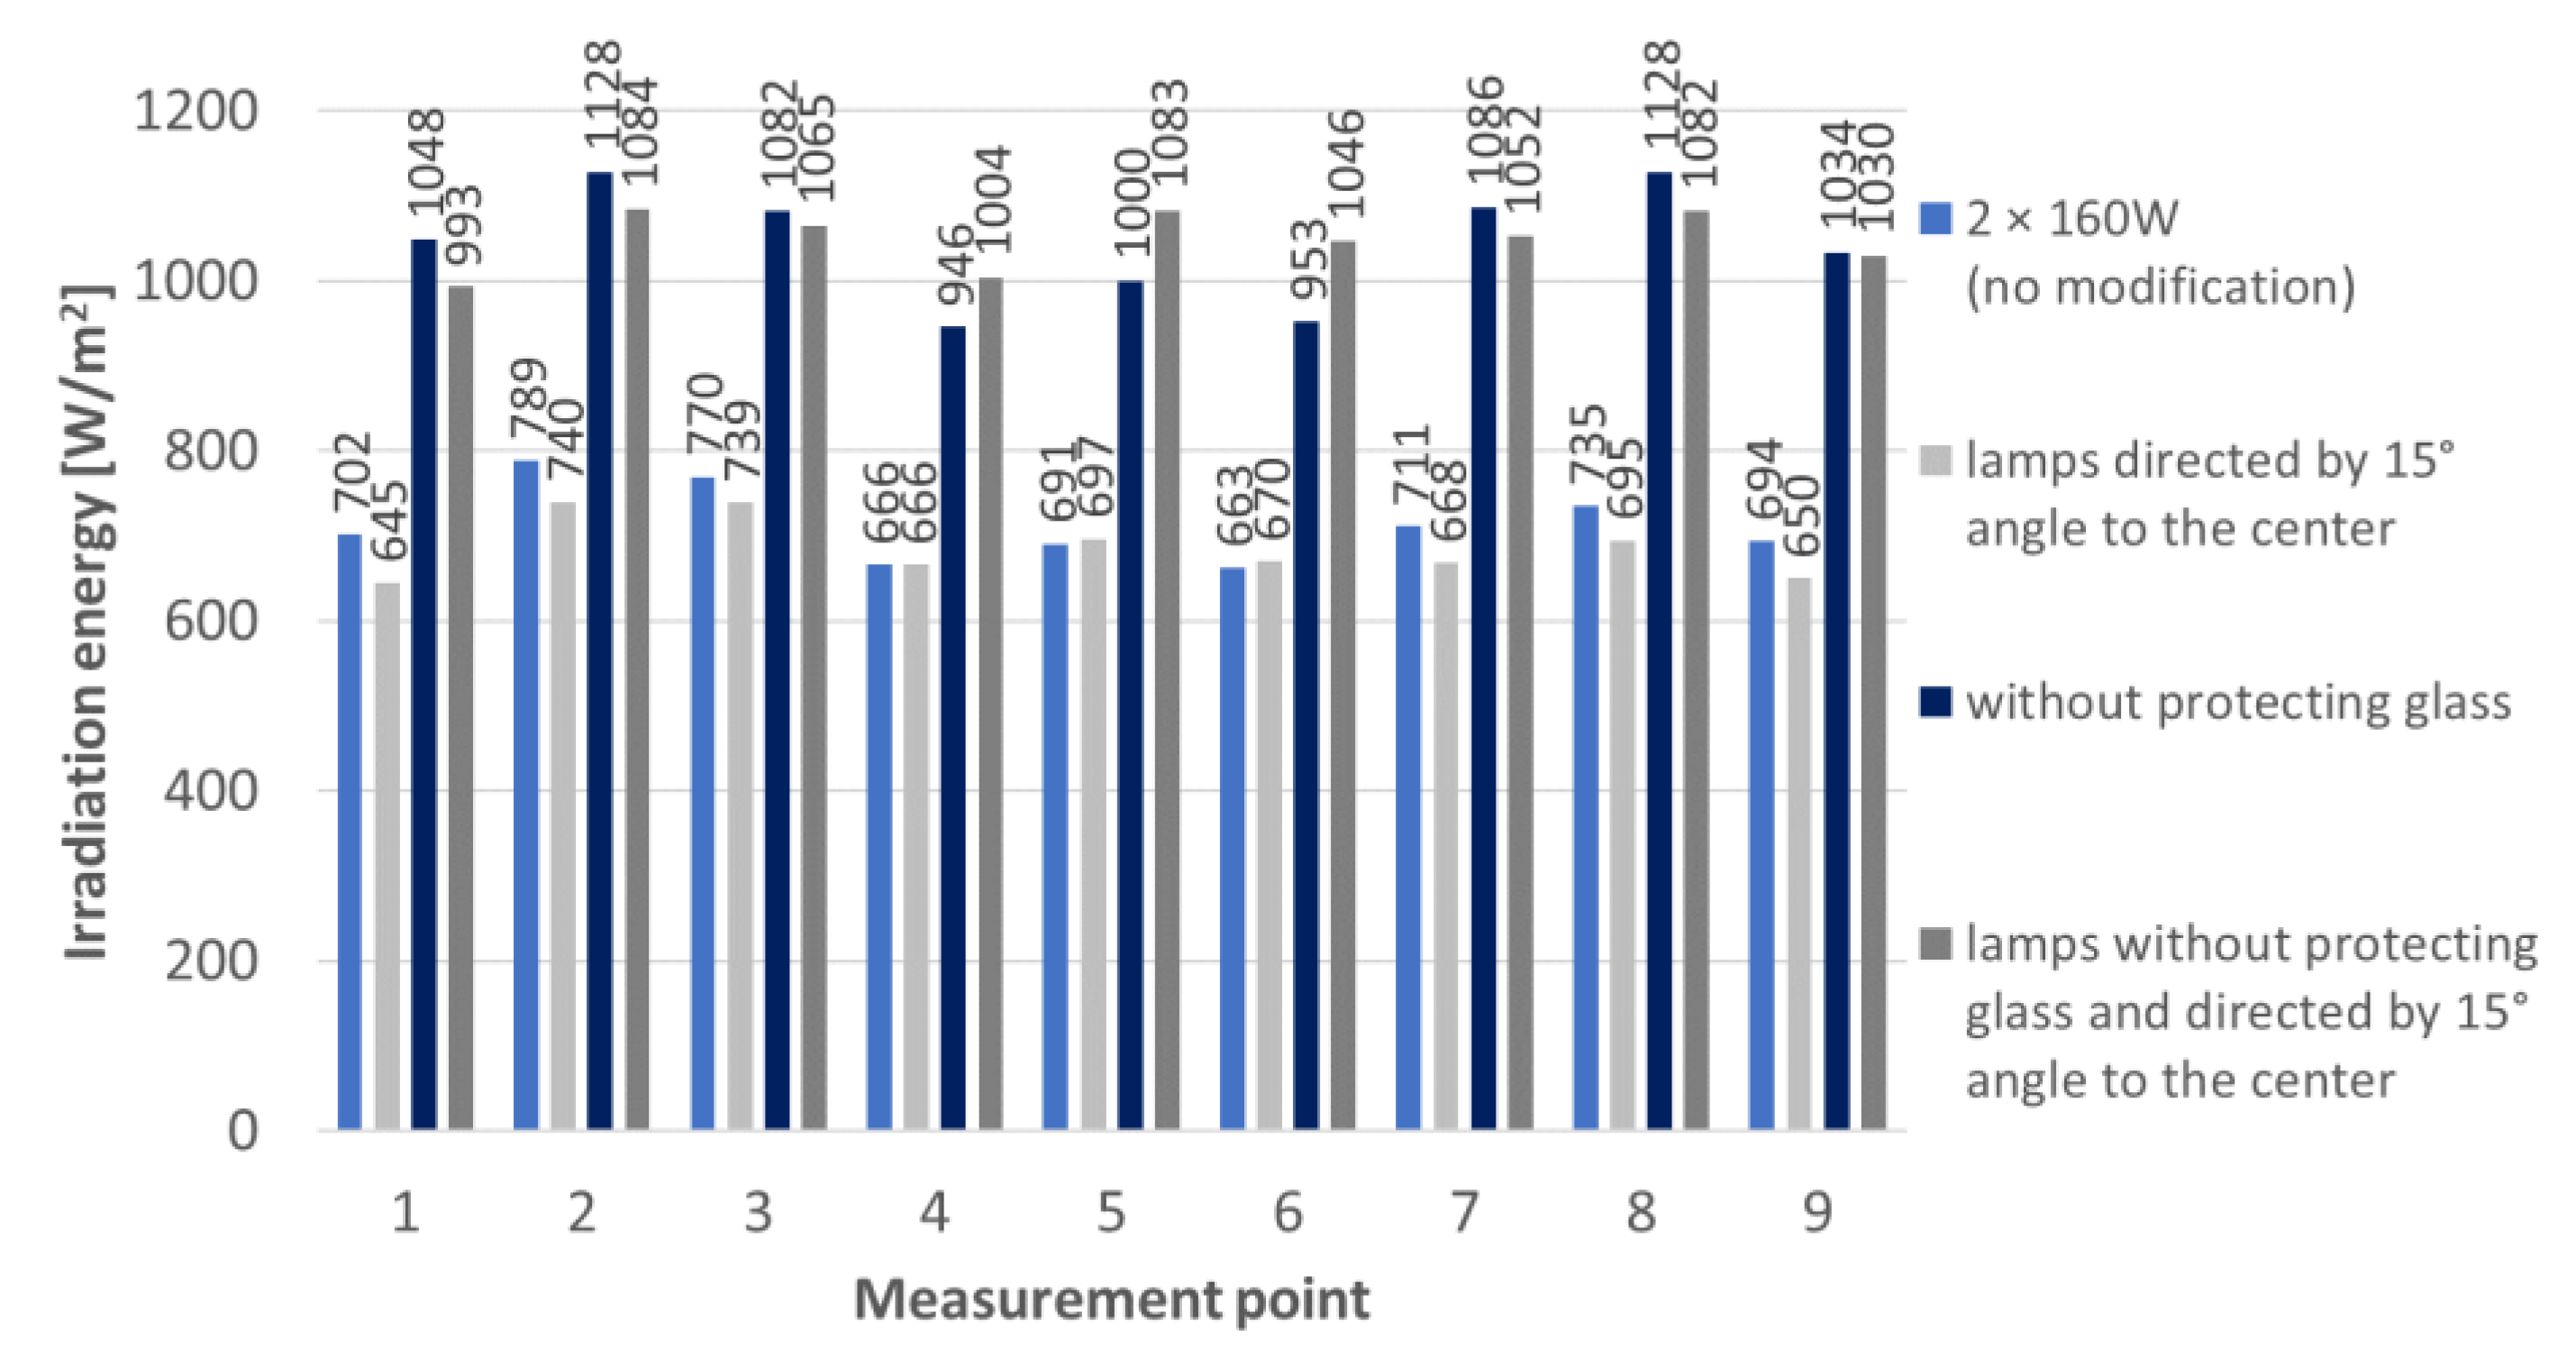
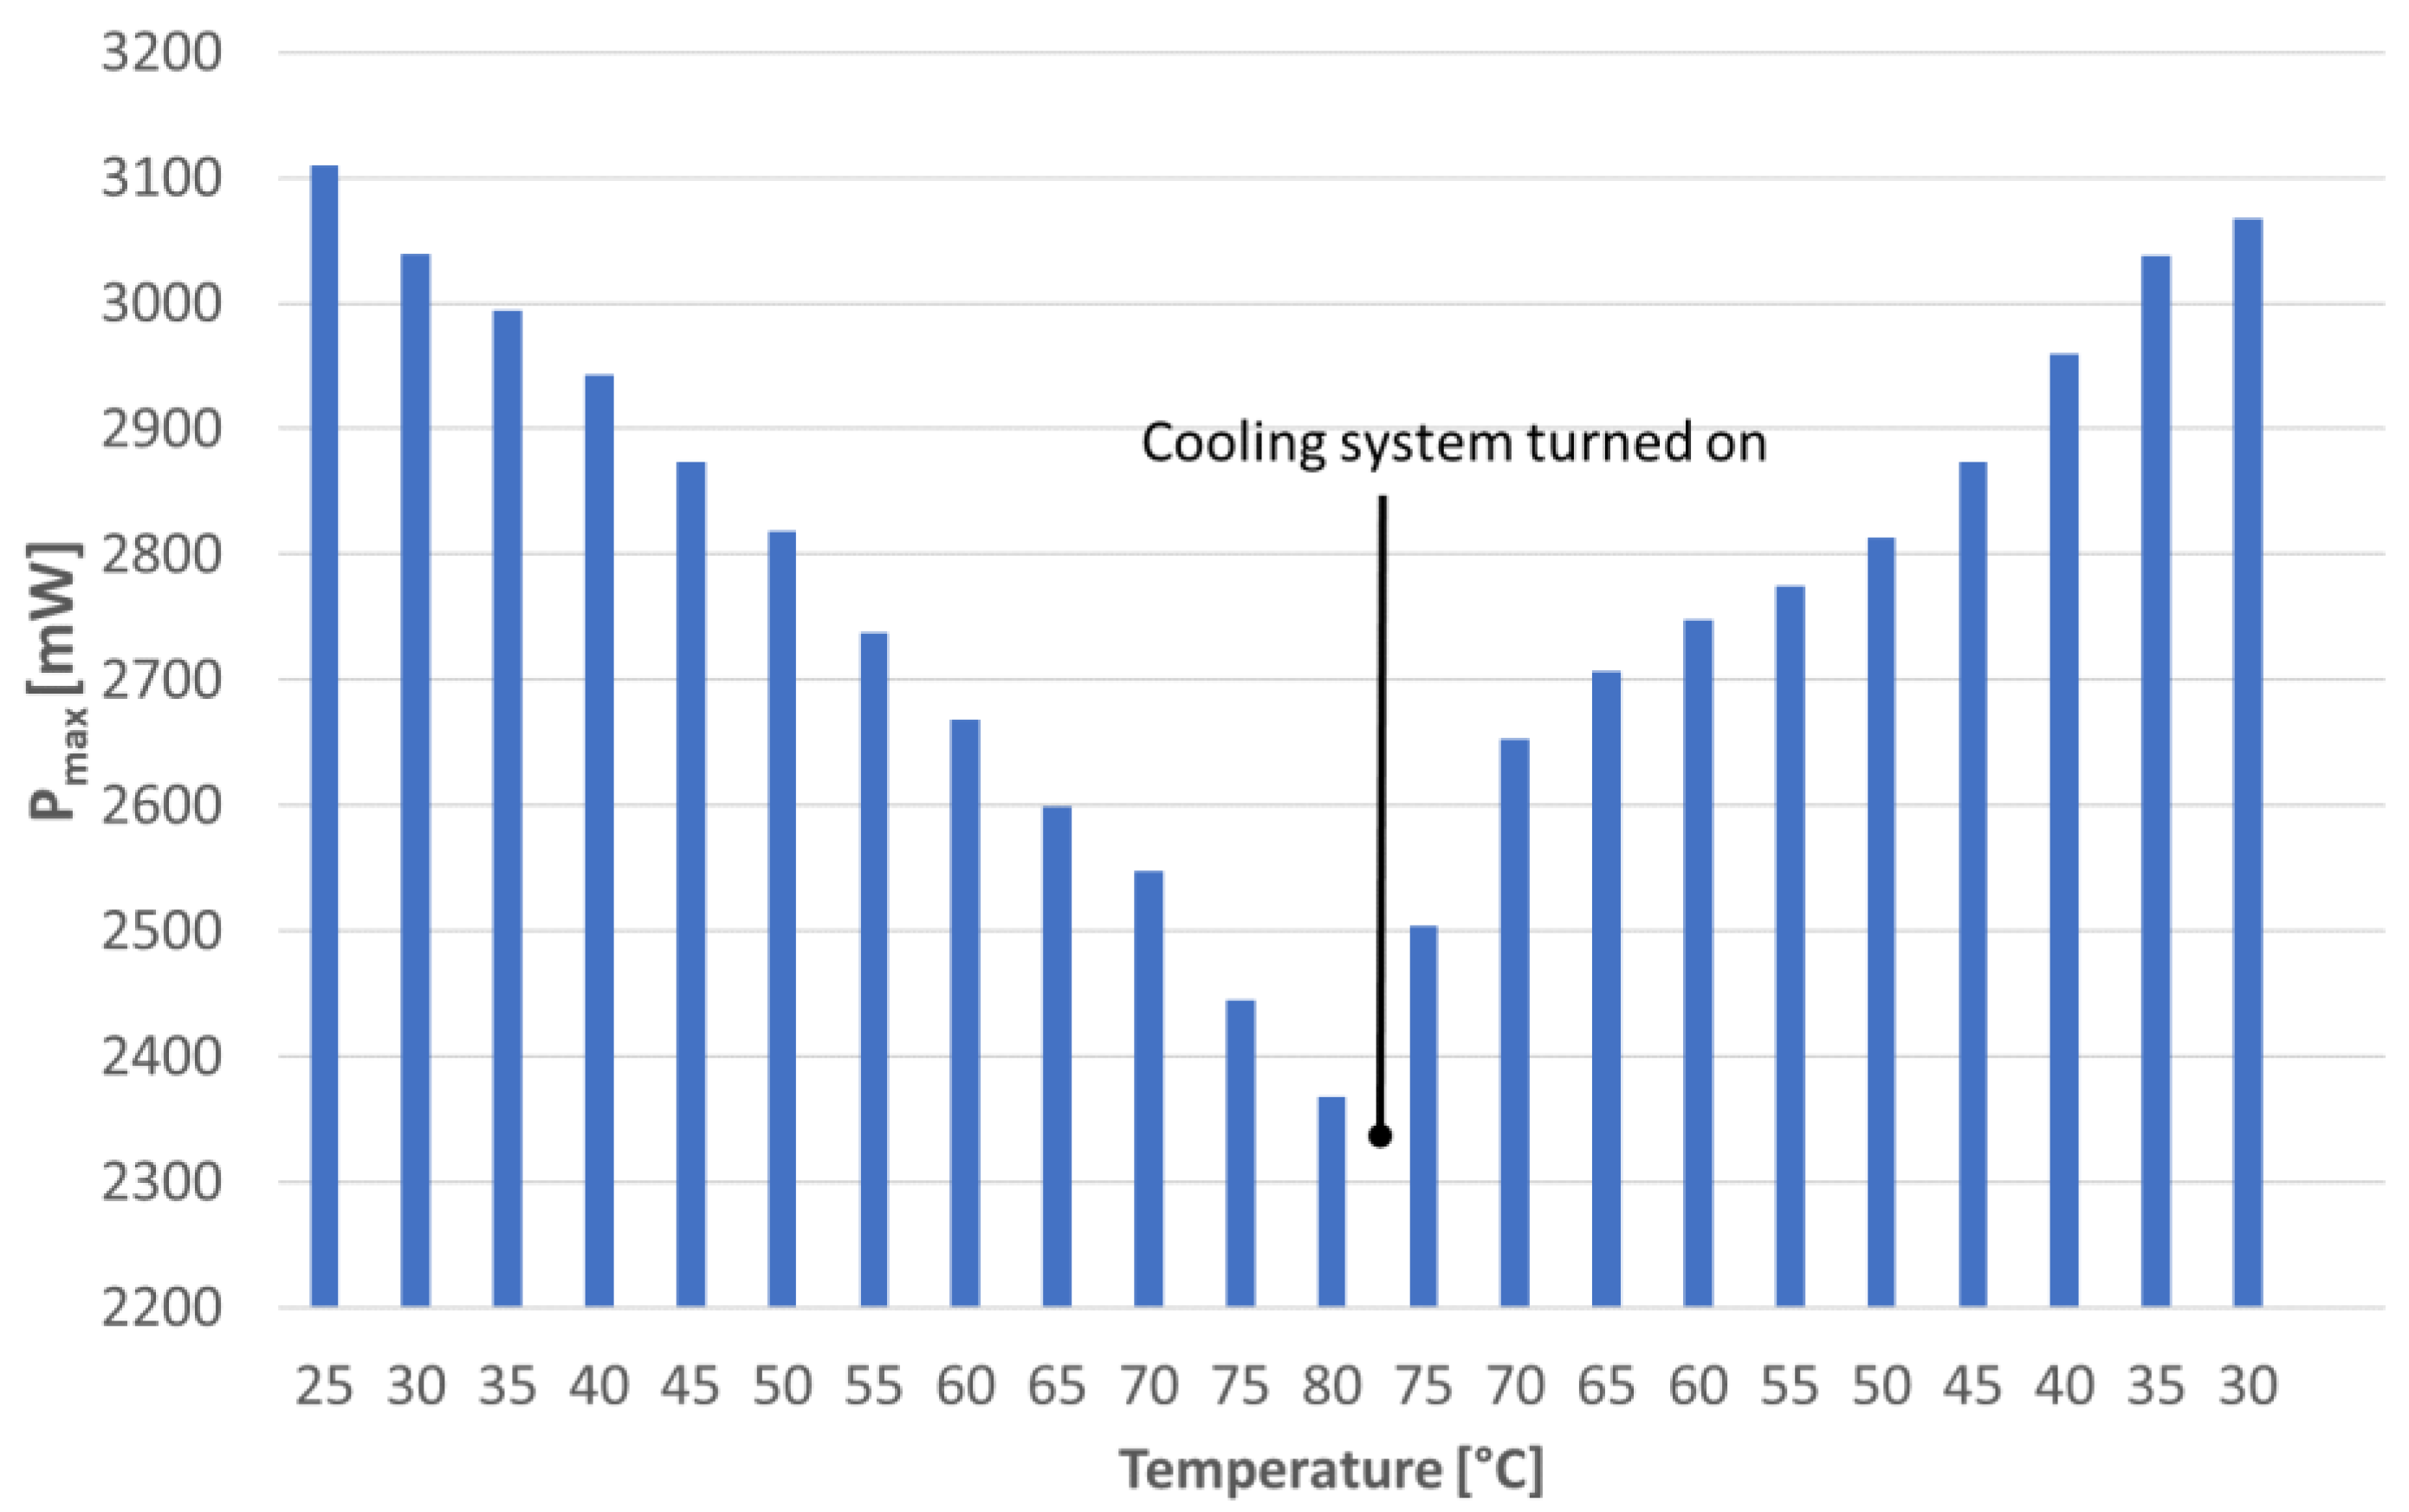
4.2. Results and Discussion
- changing the angle of lamp setup to direct the light into the centre of the plate; and
- removing the covering/protecting glass to increase the incident irradiation value.
5. Conclusions and Discussion
Author Contributions
Funding
Institutional Review Board Statement
Informed Consent Statement
Data Availability Statement
Conflicts of Interest
References
- Wolf, M. Performance analysis of combined heating and photovoltaic power systems for residences. Energy Convers. 1976, 16, 79–90. [Google Scholar] [CrossRef]
- Florschuetz, L.W. Extension of the Hottel-Whillier model to the analysis of combined photovoltaic/thermal flat plate collectors. Sol. Energy 1979, 22, 361–366. [Google Scholar] [CrossRef]
- Chow, T.T. A review on photovoltaic/thermal hybrid solar technology. Appl. Energy 2010, 87, 365–379. [Google Scholar] [CrossRef]
- Bandaru, S.H.; Becerra, V.; Khanna, S.; Radulovic, J.; Hutchinson, D.; Khusainov, R. A Review of Photovoltaic Thermal (PVT) Technology for Residential Applications: Performance Indicators, Progress, and Opportunities. Energies 2021, 14, 3853. [Google Scholar] [CrossRef]
- Eensalu, J.S.; Katerski, A.; Kärber, E.; Weinhardt, L.; Blum, M.; Heske, C.; Yang, W.; Acik, I.O.; Krunks, M. Semitransparent Sb2S3 thin film solar cells by ultrasonic spray pyrolysis for use in solar windows. Beilstein J. Nanotechnol. 2019, 10, 2396–2409. [Google Scholar] [CrossRef] [Green Version]
- Barichello, J.; Vesce, L.; Mariani, P.; Leonardi, E.; Braglia, R.; Di Carlo, A.; Canini, A.; Reale, A. Stable semi-transparent dye-sensitized solar modules and panels for greenhouse application. Energies 2021, 14, 6393. [Google Scholar] [CrossRef]
- Hussain, M.I.; Lee, G.H.; Kim, J.T. A comprehensive performance characterization of a nanofluid-powered dual-fluid pv/t system under outdoor steady state conditions. Sustainability 2021, 13, 13134. [Google Scholar] [CrossRef]
- Chandavar, A.U. Quantifying the performance advantage of using passive solar air heater with chimney for photovoltaic module cooling. Int. J. Energy Res. 2021, 45, 1576–1586. [Google Scholar] [CrossRef]
- Kim, J.H.; Yu, J.S.; Kim, J.T. An experimental study on the energy and exergy performance of an air-type pvt collector with perforated baffle. Energies 2021, 14, 2919. [Google Scholar] [CrossRef]
- Cabral, D.; Gomes, J.; Hayati, A.; Karlsson, B. Experimental investigation of a CPVT collector coupled with a wedge PVT receiver. Sol. Energy 2021, 215, 335–345. [Google Scholar] [CrossRef]
- Nasseriyan, P.; Gorouh, H.A.; Gomes, J.; Cabral, D.; Salmanzadeh, M.; Lehmann, T.; Hayati, A. Numerical and experimental study of an asymmetric CPC-PVT solar collector. Energies 2020, 13, 1669. [Google Scholar] [CrossRef] [Green Version]
- Nteka, N.E.; Kanyarusoke, K.E. Design and Performance of a 1.5 axis Sun tracking Concentrated Photovoltaic System. IOP Conf. Ser. Earth Environ. Sci. 2019, 354, 012008. [Google Scholar] [CrossRef] [Green Version]
- Maadi, S.R.; Khatibi, M.; Ebrahim-bajestan, E.; Wood, D. A parametrical study of a novel PV/T system model which includes the greenhouse effect. In Proceedings of the ISES SWC2019/SHC2019 Conference, Santiago, Chile, 3–7 November 2019; pp. 1–8. [Google Scholar]
- Alexis, L.K.; Kewir, T.J.; Merlain, D.K.B.; Bertholt, S.S.H. Experimental study on the electrical and thermal characteristics of a hybrid photovoltaic/thermal water solar collector model using photovoltaic solar modules of different brands. Energy Convers. Manag. X 2022, 14, 100198. [Google Scholar] [CrossRef]
- Minnaert, B.; Veelaert, P. A proposal for typical artificial light sources for the characterization of indoor photovoltaic applications. Energies 2014, 7, 1500–1516. [Google Scholar] [CrossRef] [Green Version]
- Guarracino, I.; Freeman, J.; Ramos, A.; Kalogirou, S.A.; Ekins-Daukes, N.J.; Markides, C.N. Systematic testing of hybrid PV-thermal (PVT) solar collectors in steady-state and dynamic outdoor conditions. Appl. Energy 2019, 240, 1014–1030. [Google Scholar] [CrossRef]
- Sun, V.; Asanakham, A.; Deethayat, T.; Kiatsiriroat, T. Evaluation of nominal operating cell temperature (NOCT) of glazed photovoltaic thermal module. Case Stud. Therm. Eng. 2021, 28, 101361. [Google Scholar] [CrossRef]
- Allan, J.; Dehouche, Z.; Stankovic, S.; Mauricette, L. Performance testing of thermal and photovoltaic thermal solar collectors. Energy Sci. Eng. 2015, 3, 310–326. [Google Scholar] [CrossRef]
- Yandri, E. Methods for the development and testing of polymeric hybrid photovoltaic thermal (PVT) collector for indoor experiments. MethodsX 2019, 6, 2620–2635. [Google Scholar] [CrossRef]
- Das, D.; Kalita, P.; Dewan, A.; Tanweer, S. Development of a novel thermal model for a PV/T collector and its experimental analysis. Sol. Energy 2019, 188, 631–643. [Google Scholar] [CrossRef]
- Obstawski, P.; Bakoń, T.; Czekalski, D. Comparison of solar collector testing methods—Theory and practice. Processes 2020, 8, 1340. [Google Scholar] [CrossRef]
- Lisik, Z.; Znajdek, K.; Raj, E. Hybrid Solar Panel with a Cooling Plate. Patent No. PL238548B1, 10 June 2021. [Google Scholar]
- Niedzielski, P.; Dionizy, M.; Raj, E.; Lisik, Z. The influence of free convection on the efficiency of heat removal in PV/T modules. Prz. Elektrotechniczny 2021, 1, 196–199. [Google Scholar] [CrossRef]
- ANSYS CFX-Solver Theory Guide. In ANSYS Release 16.2 Documentation; SAS IP, Inc.: Cheyenne, WY, USA, 2015.


| Density ρ [kg/m3] | Thermal Conductivityk [W/(mK)] | Specific Heat cp [J/(kgK)] | Dynamic Viscosity µ [Pa·s] | Expansion Coef. β [1/K] | |
|---|---|---|---|---|---|
| Aluminium | 2702 | 237 | 903 | ||
| Steel | 7854 | 60.5 | 434 | ||
| Polystyrene | 55 | 0.027 | 1210 | ||
| Air (25 °C) | 1.185 | 0.026 | 1004 | 1.83 × 10⁻⁵ | 3.36 × 10³ |
| Material/ Emissivity | P (Cold Plate) [W] | P (Cold Plate)/P Lamps [%] | TEave (Dome External Wall) [°C] | TIave (Dome Internal Wall) [°C] | Tmax (Lamp) [°C] | Tave (Air) [°C] |
|---|---|---|---|---|---|---|
| a. insulator with e = 0.9 | 54.4 | 32 | 44.0 | 125.8 | 49.1 | |
| b. steel with e = 0.1 | 101.2 | 60 | 34.1 | 135.4 | 36.9 | |
| c. double wall 5 mm with e = 0.9 | 70.9 | 42 | 36.5 | 46.4 | 131.1 | 57.8 |
| d. double wall 5 mm with e = 0.1 | 118.2 | 70 | 31.5 | 37.3 | 143.0 | 44.7 |
| e. double wall 10 mm with e = 0.1 | 124.3 | 73 | 30.7 | 40.2 | 147.0 | 51.6 |
| f. double wall 20 mm with e = 0.1 | 132.2 | 78 | 29.6 | 45.3 | 152.3 | 62.6 |
| Modification | Average Irradiation [W/m2] | Standard Deviation [W/m2] | Relative Standard Deviation [%] |
|---|---|---|---|
| None | 713 | 43.6 | 6.11 |
| Angle of 15° | 702 | 29.6 | 4.22 |
| No glass | 1045 | 68.2 | 6.53 |
| Both of the above | 1049 | 33.8 | 3.23 |
Publisher’s Note: MDPI stays neutral with regard to jurisdictional claims in published maps and institutional affiliations. |
© 2022 by the authors. Licensee MDPI, Basel, Switzerland. This article is an open access article distributed under the terms and conditions of the Creative Commons Attribution (CC BY) license (https://creativecommons.org/licenses/by/4.0/).
Share and Cite
Raj, E.; Znajdek, K.; Dionizy, M.; Czarnecki, P.; Niedzielski, P.; Ruta, Ł.; Lisik, Z. Artificial Sun—A Stand to Test New PVT Minimodules. Energies 2022, 15, 3430. https://doi.org/10.3390/en15093430
Raj E, Znajdek K, Dionizy M, Czarnecki P, Niedzielski P, Ruta Ł, Lisik Z. Artificial Sun—A Stand to Test New PVT Minimodules. Energies. 2022; 15(9):3430. https://doi.org/10.3390/en15093430
Chicago/Turabian StyleRaj, Ewa, Katarzyna Znajdek, Mateusz Dionizy, Przemysław Czarnecki, Przemysław Niedzielski, Łukasz Ruta, and Zbigniew Lisik. 2022. "Artificial Sun—A Stand to Test New PVT Minimodules" Energies 15, no. 9: 3430. https://doi.org/10.3390/en15093430
APA StyleRaj, E., Znajdek, K., Dionizy, M., Czarnecki, P., Niedzielski, P., Ruta, Ł., & Lisik, Z. (2022). Artificial Sun—A Stand to Test New PVT Minimodules. Energies, 15(9), 3430. https://doi.org/10.3390/en15093430