
Liquid-Phase Non-Thermal Plasma Discharge for Fuel Oil Processing

 ,
,
Abstract
:1. Introduction
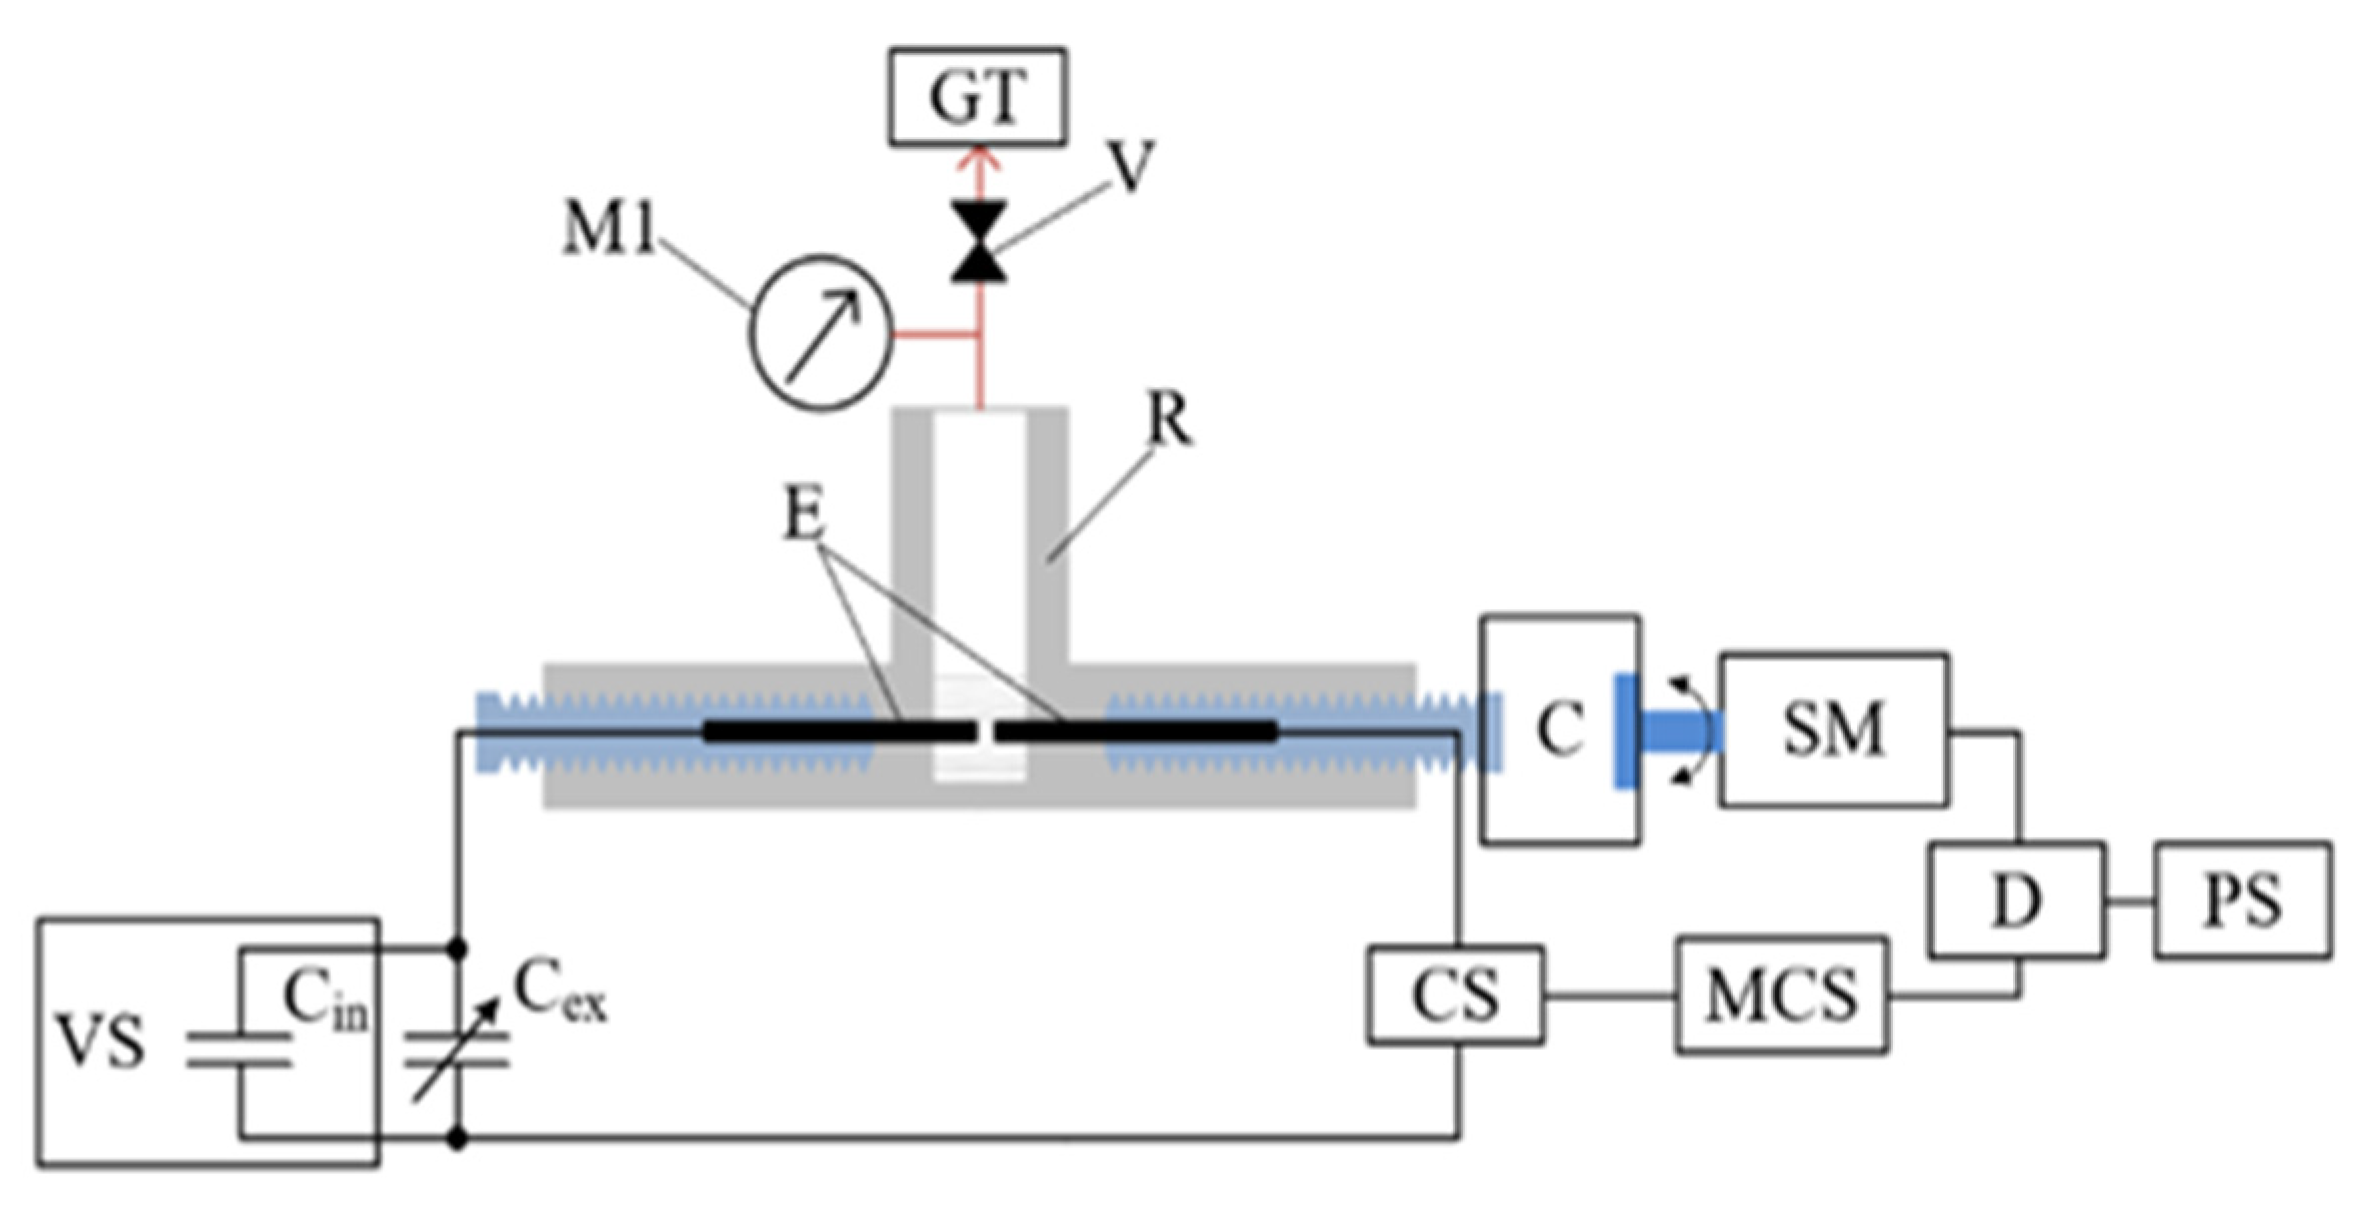
2. Materials and Methods
- -
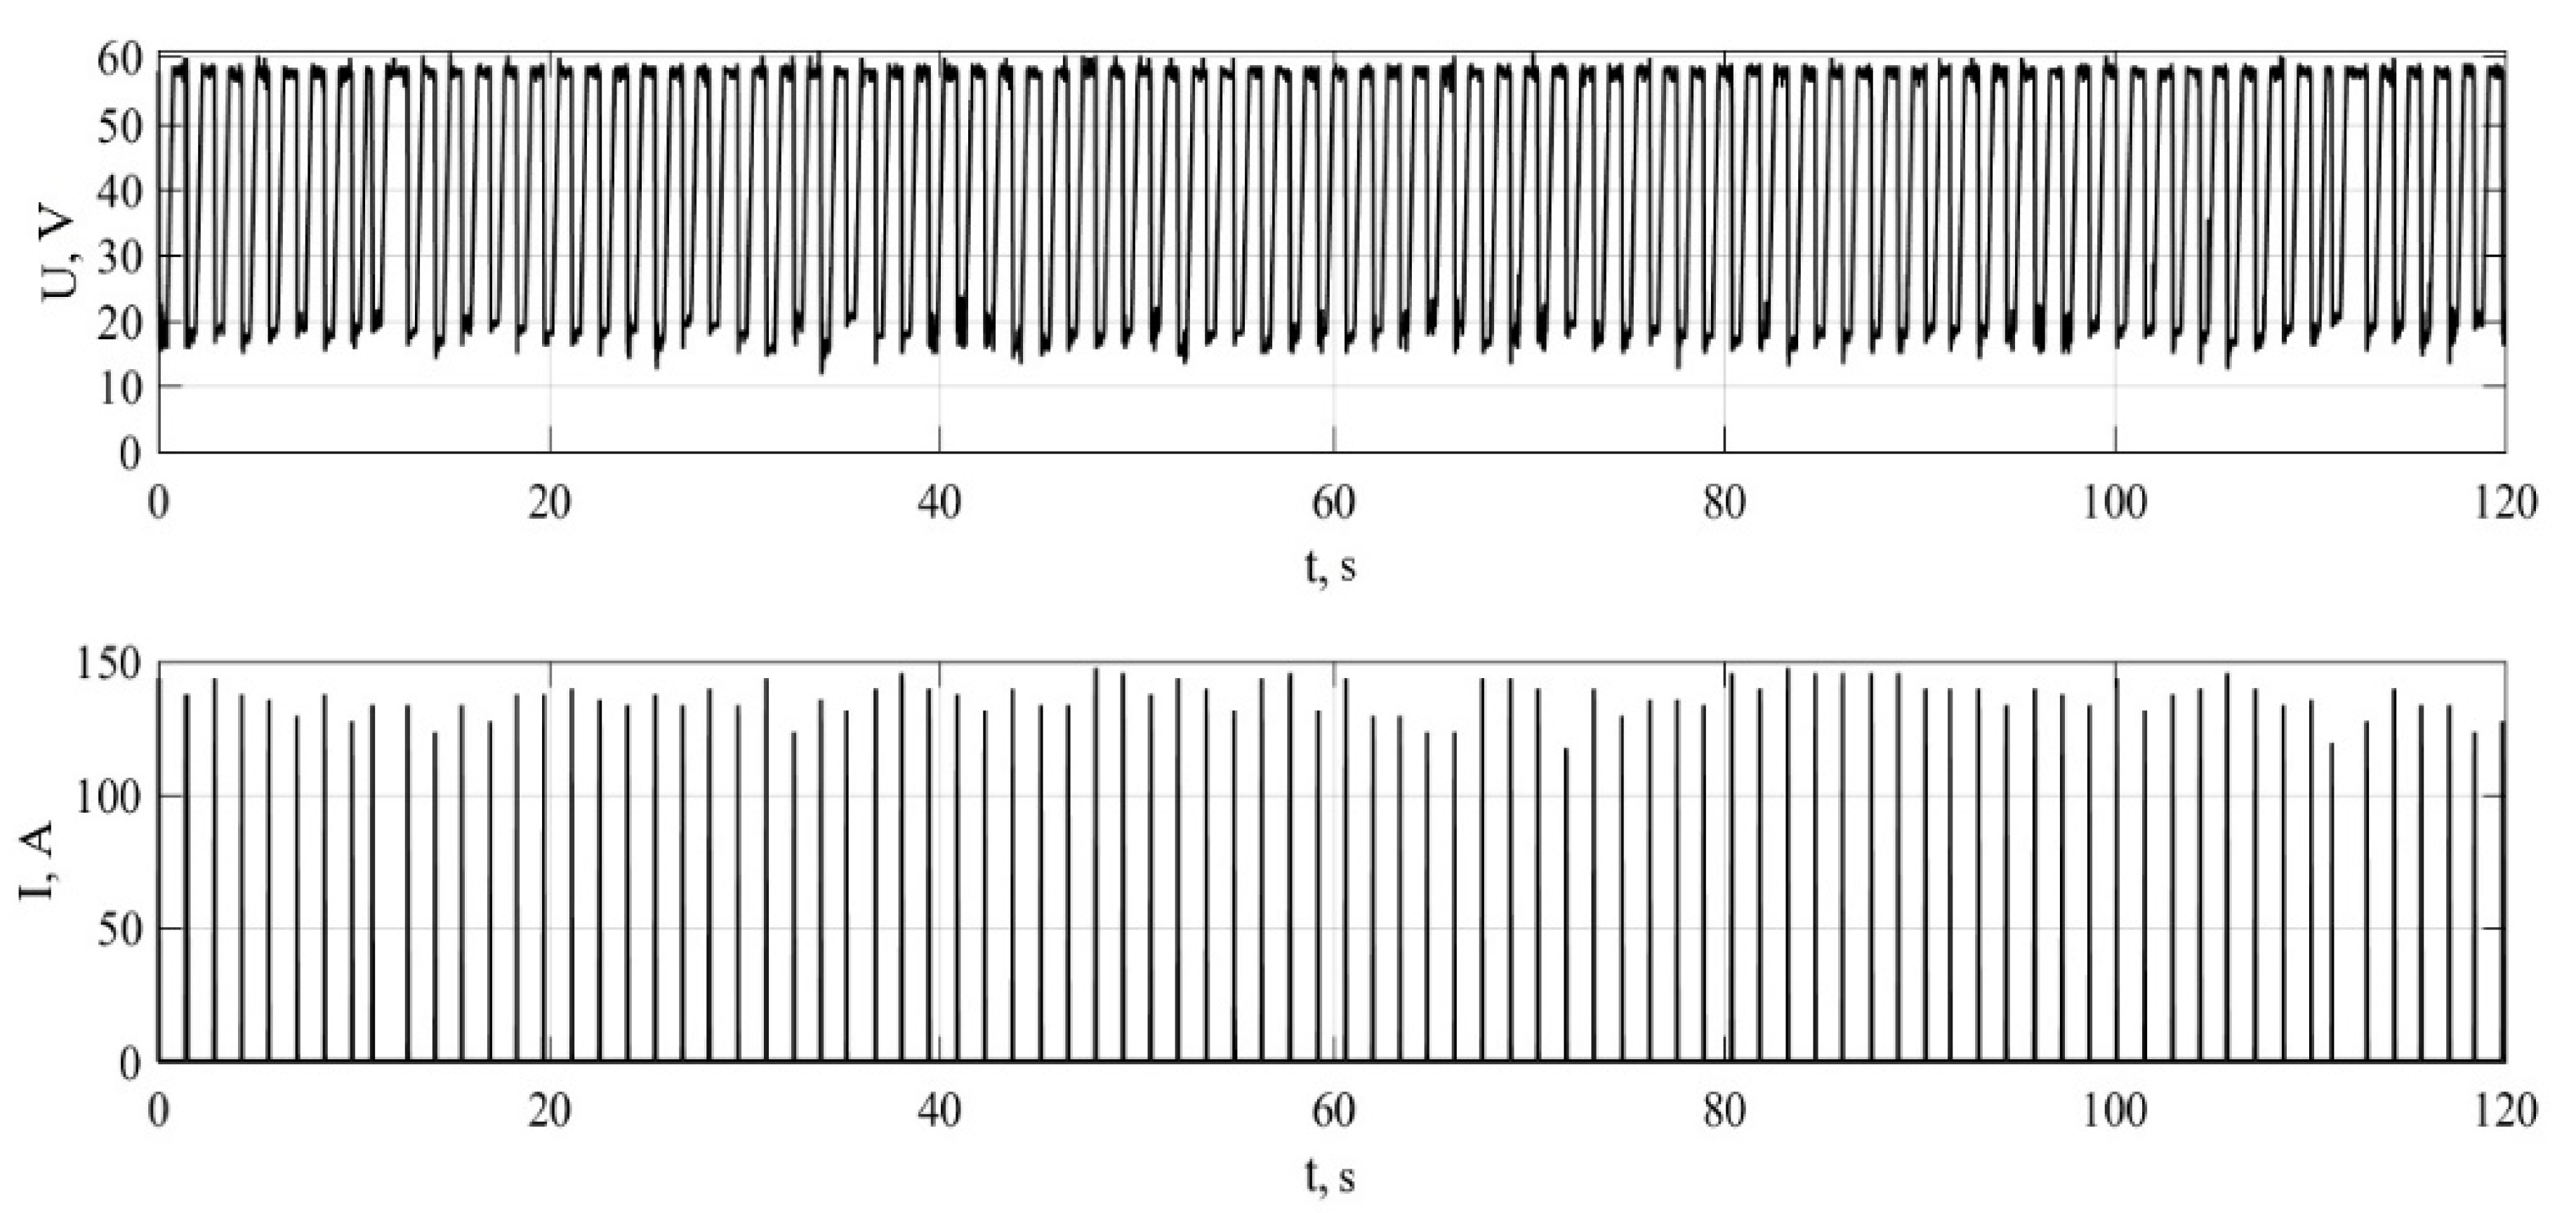
- the average pulse duration
- -
- the average pulse frequency
- -
- the average amplitude of the pulses
- -
- the pulse energy
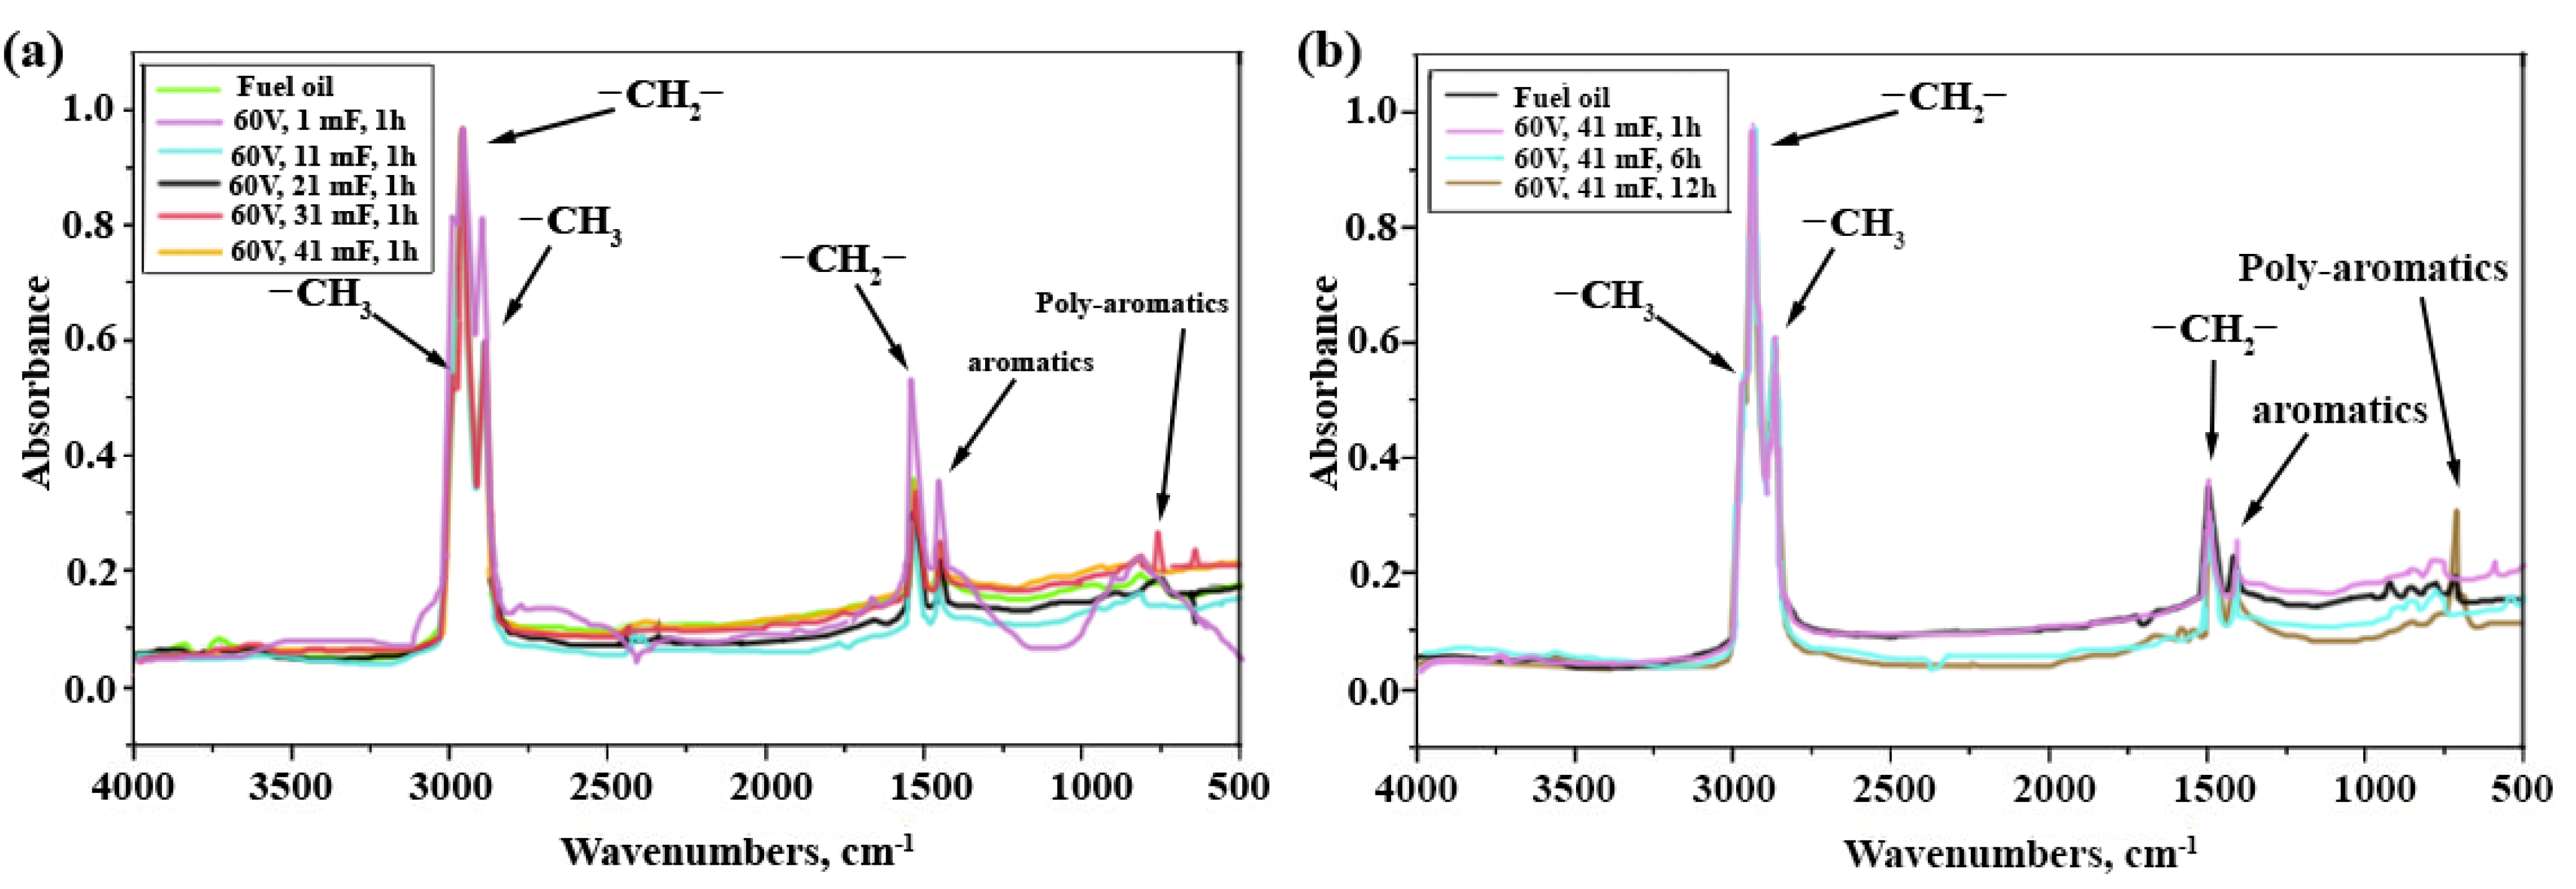
3. Results and Discussion
4. Conclusions
Author Contributions
Funding
Institutional Review Board Statement
Informed Consent Statement
Data Availability Statement
Conflicts of Interest
References
- Ganapathi, R.; Henni, A.; Shirif, E. Solubility of carbon dioxide and ethane in Lloydminster heavy oil: Experimental study and modelling. Can. J. Chem. Eng. 2022, 1. [Google Scholar] [CrossRef]
- Shi, Q.; Zhao, S.; Zhou, Y.; Gao, J.; Xu, C. Development of heavy oil upgrading technologies in China. Rev. Chem. Eng. 2019, 36, 1–19. [Google Scholar] [CrossRef]
- Ahmadi, M.; Chen, Z. Challenges and future of chemical assisted heavy oil recovery processes. Adv. Colloid Interface Sci. 2020, 275, 102081. [Google Scholar] [CrossRef] [PubMed]
- Castañeda, L.C.; Muñoz, J.A.D.; Ancheyta, J. Current situation of emerging technologies for upgrading of heavy oils. Catal. Today 2014, 220–222, 248–273. [Google Scholar] [CrossRef]
- Frątczak, J.; Sharkov, N.; De Paz Carmona, H.; Tišler, Z.; Hidalgo-Herrador, J.M. Cleaner Fuel Production via Co-Processing of Vacuum Gas Oil with Rapeseed Oil Using a Novel NiW/Acid-Modified Phonolite Catalyst. Energies 2021, 14, 8497. [Google Scholar] [CrossRef]
- Ouyang, Z.Y.; Qin, Z.; Cao, H.; Xie, T.Y.; Dai, X.Y.; Wang, Q.W. A spillover network analysis of the global crude oil market: Evidence from the post-financial crisis era. Pet. Sci. 2021, 18, 1256–1269. [Google Scholar] [CrossRef]
- Muñoz, J.A.D.; Ancheyta, J.; Castañeda, L.C. Selection of heavy oil upgrading technologies by proper estimation of petroleum prices. Pet. Sci. Technol. 2022, 40, 217–236. [Google Scholar] [CrossRef]
- Gulyaeva, L.A.; Khavkin, V.A.; Shmel’kova, O.I.; Vinogradova, N.Y. Technology of synthetic oil production from heavy oil stock and solid fuels. Chem. Technol. Fuels Oils 2015, 51, 422–429. [Google Scholar] [CrossRef]
- Tan, J.; Ji, Y.N.; Deng, W.S.; Su, Y.F. Process intensification in gas/liquid/solid reaction in trickle bed reactors: A review. Pet. Sci. 2021, 18, 1203–1218. [Google Scholar] [CrossRef]
- Bruggeman, P.J.; Kushner, M.J.; Locke, B.R.; Gardeniers, J.G.E.; Graham, W.G.; Graves, D.B.; Hofman-Caris, R.C.H.M.; Maric, D.; Reid, J.P.; Ceriani, E.; et al. Plasma-liquid interactions: A review and roadmap. Plasma Sources Sci. Technol. 2016, 25, 053002. [Google Scholar] [CrossRef]
- Huang, W.; Jin, J.; Wen, G.; Yang, Q.; Su, B.; Ren, Q. Effect of Nitrogen/Oxygen Substances on the Pyrolysis of Alkane-Rich Gases to Acetylene by Thermal Plasma. Energies 2018, 11, 351. [Google Scholar] [CrossRef] [Green Version]
- Ma, J.; Zhang, M.; Wu, J.; Yang, Q.; Wen, G.; Su, B.; Ren, Q. Hydropyrolysis of n-Hexane and Toluene to Acetylene in Rotating-Arc Plasma. Energies 2017, 10, 899. [Google Scholar] [CrossRef]
- Bruggeman, P.; Leys, C. Non-thermal plasmas in and in contact with liquids. J. Phys. D Appl. Phys. 2009, 42, 053001. [Google Scholar] [CrossRef]
- Lebedev, Y.A. Microwave discharges in liquid dielectrics. Plasma Phys. Rep. 2017, 43, 685–695. [Google Scholar] [CrossRef]
- Kuzenov, V.V.; Ryzhkov, S.V. Numerical Simulation of Pulsed Jets of a High-Current Pulsed Surface Discharge. Comput. Therm. Sci. 2021, 13, 45–56. [Google Scholar] [CrossRef]
- Bodrikov, I.V.; Ivanova, A.G.; Vasiliev, A.L.; Titov, E.Y.; Titov, D.Y.; Serov, A.I. Influence of low-voltage discharge energy on the morphology of carbon nanostructures in induced benzene transformation. RSC Adv. 2021, 11, 39428–39437. [Google Scholar] [CrossRef]
- Lebedev, Y.A.; Krashevskaya, G.V.; Batukaev, T.S.; Mikhaylyuk, A.V. Time resolved study of ignition of microwave discharge in liquid hydrocarbons. Plasma Process. Polym. 2022, 19, e2100215. [Google Scholar] [CrossRef]
- Bodrikov, I.V.; Kut’in, A.M.; Titov, E.Y.; Titov, D.Y.; Kurskii, Y.A.; Gazizullin, R.R. Fragmentation of thiophene and 3-methyl-2-thiophenecarboxaldehyde by direct liquid phase low-voltage discharges. Plasma Process. Polym. 2018, 15, 1800094. [Google Scholar] [CrossRef]
- Shao, T.; Wang, R.; Zhang, C.; Yan, P. Atmospheric-pressure pulsed discharges and plasmas: Mechanism, characteristics and applications. High Volt. 2018, 3, 14–20. [Google Scholar] [CrossRef]
- Rollier, J.D.; Gonzalez-Aguilar, J.; Petitpas, G.; Darmon, A.; Fulcheri, L.; Metkemeijer, R. Experimental study on gasoline reforming assisted by nonthermal arc discharge. Energy Fuels 2008, 22, 556–560. [Google Scholar] [CrossRef]
- Eliasson, B.; Liu, C.J.; Kogelschatz, U. Direct conversion of methane and carbon dioxide to higher hydrocarbons using catalytic dielectric-barrier discharges with zeolites. Ind. Eng. Chem. Res. 2000, 39, 1221–1227. [Google Scholar] [CrossRef]
- Li, M.W.; Tian, Y.L.; Xu, G.H. Characteristics of carbon dioxide reforming of methane via alternating current (AC) corona plasma reactions. Energy Fuels 2007, 21, 2335–2339. [Google Scholar] [CrossRef]
- Matsui, Y.; Kawakami, S.; Takashima, K.; Katsura, S.; Mizuno, A. Liquid-phase fuel reforming at room temperature using nonthermal plasma. Energy Fuels 2005, 19, 1561–1565. [Google Scholar] [CrossRef]
- Bilera, I.V.; Lebedev, Y.A. Plasma-Chemical Production of Acetylene from Hydrocarbons: History and Current Status (A Review). Pet. Chem. 2022, 62, 329–351. [Google Scholar] [CrossRef]
- Wang, A.; Harrhy, J.H.; Meng, S.; He, P.; Liu, L.; Song, H. Nonthermal plasma-catalytic conversion of biogas to liquid chemicals with low coke formation. Energy Convers. Manag. 2019, 191, 93–101. [Google Scholar] [CrossRef]
- Sarafraz, M.M.; Tran, N.N.; Pourali, N.; Rebrov, E.V.; Hessel, V. Thermodynamic potential of a novel plasma-assisted sustainable process for co-production of ammonia and hydrogen with liquid metals. Energy Convers. Manag. 2020, 210, 112709. [Google Scholar] [CrossRef]
- Nomura, S.; Toyota, H.; Tawara, M.; Yamashita, H.; Matsumoto, K. Fuel gas production by microwave plasma in liquid. Appl. Phys. Lett. 2006, 88, 231502. [Google Scholar] [CrossRef]
- Lin, L.; Zhou, W.; Gao, R.; Yao, S.; Zhang, X.; Xu, W.; Zheng, S.; Jiang, Z.; Yu, Q.; Li, Y.W.; et al. Low-temperature hydrogen production from water and methanol using Pt/α-MoC catalysts. Nature 2017, 544, 80–83. [Google Scholar] [CrossRef]
- Jahanmiri, A.; Rahimpour, M.R.; Shirazi, M.M.; Hooshmand, N.; Taghvaei, H. Naphtha cracking through a pulsed DBD plasma reactor: Effect of applied voltage, pulse repetition frequency and electrode material. Chem. Eng. J. 2012, 191, 416–425. [Google Scholar] [CrossRef]
- Rusanov, V.D.; Babaritskii, A.I.; Baranov, I.E.; Bibikov, M.B.; Deminskii, M.A.; Demkin, S.A.; Zhivotov, V.K.; Konovalov, G.M.; Lysov, G.V.; Moskovskii, A.S.; et al. Nonequilibrium effect of atmospheric-pressure microwave-discharge plasma on methane and kerosene conversion into synthesis gas. Dokl. Chem. 2004, 395, 82–85. [Google Scholar] [CrossRef]
- Wnukowski, M.; Moroń, W. Warm Plasma Application in Tar Conversion and Syngas Valorization: The Fate of Hydrogen Sulfide. Energies 2021, 14, 7383. [Google Scholar] [CrossRef]
- Hartvigsen, J.; Elangovan, S.; Hollist, M.; Czernichowski, P.; Frost, L. Non-thermal plasma reformation of liquid fuels. ECS Trans. 2011, 35, 2825–2833. [Google Scholar] [CrossRef]
- Babaeva, N.Y.; Tereshonok, D.V.; Naidis, G.V. Initiation of breakdown in bubbles immersed in liquids: Pre-existed charges versus bubble size. J. Phys. D Appl. Phys. 2015, 48, 355201. [Google Scholar] [CrossRef]
- Han, R.; Li, C.; Wang, K.; Yuan, W.; Wang, Y.; Ding, W.; Ouyang, J. “Breakdown” of stratified electrical explosion products: Plasma development and its mechanical effect. Phys. Fluids 2021, 33, 107119. [Google Scholar] [CrossRef]
- Liu, Y.; Dou, L.; Zhou, R.; Sun, H.; Fan, Z.; Zhang, C.; Ostrikov, K.K.; Shao, T. Liquid-phase methane bubble plasma discharge for heavy oil processing: Insights into free radicals-induced hydrogenation. Energy Convers. Manag. 2021, 250, 114896. [Google Scholar] [CrossRef]
- Sharma, A.; Levko, D.; Raja, L.L.; Cha, M.S. Kinetics and dynamics of nanosecond streamer discharge in atmospheric-pressure gas bubble suspended in distilled water under saturated vapor pressure conditions. J. Phys. D Appl. Phys. 2016, 49, 395205. [Google Scholar] [CrossRef]
- Titov, E.Y.; Titov, D.Y.; Bodrikov, I.V.; Kut’in, A.M.; Kurskii, Y.A.; Gazizzulin, R.R. A device for generation of low-voltage discharges in liquid dielectric media. High Energy Chem. 2019, 52, 512–513. [Google Scholar] [CrossRef]
- Sanchez-Minero, F.; Ancheyta, J.; Silva-Oliver, G.; Flores-Valle, S. Predicting SARA composition of crude oil by means of NMR. Fuel 2012, 110, 318–321. [Google Scholar] [CrossRef]
- Fridman, A. Plasma Chemistry; Cambridge University Press: Cambridge, UK, 2008. [Google Scholar]
- Cao, Y.B.; Zhang, L.L.; Xia, D.H. Catalytic aquathermolysis of Shengli heavy crude oil with an amphiphilic cobalt catalyst. Pet. Sci. 2016, 13, 463–475. [Google Scholar] [CrossRef] [Green Version]
- Chen, M.; Li, C.; Li, G.-R.; Chen, Y.-L.; Zhou, C.G. In situ preparation of well-dispersed CuO nanocatalysts in heavy oil for catalytic aquathermolysis. Pet. Sci. 2019, 16, 439–446. [Google Scholar] [CrossRef] [Green Version]
- Rakhmatullin, I.Z.; Efimov, S.V.; Tyurin, V.A.; Al-Muntaser, A.A.; Klimovitskii, A.E.; Varfolomeev, M.A.; Klochkov, V.V. Application of high resolution NMR (1H and 13C) and FTIR spectroscopy for characterization of light and heavy crude oils. J. Pet. Sci. Eng. 2018, 168, 256–262. [Google Scholar] [CrossRef]
- Djimasbe, R.; Varfolomeev, M.A.; Al-Muntaser, A.A.; Yuan, C.; Feoktistov, D.A.; Suwaid, M.A.; Kirgizov, A.J.; Davletshin, R.R.; Zinnatullin, A.L.; Fatou, S.D.; et al. Oil dispersed nickel-based catalyst for catalytic upgrading of heavy oil using supercritical water. Fuel 2022, 313, 122702. [Google Scholar] [CrossRef]
- Chesnokov, V.V.; Chichkan, A.S. Effect of catalysts on tar carbonization. Catal. Today 2021, 379, 28–35. [Google Scholar] [CrossRef]
- Kozhevnikov, V.; Kozyrev, A.; Kokovin, A.; Semeniuk, N. The Electrodynamic Mechanism of Collisionless Multicomponent Plasma Expansion in Vacuum Discharges: From Estimates to Kinetic Theory. Energies 2021, 14, 7608. [Google Scholar] [CrossRef]
- Abiev, R.S.; Sladkovskiy, D.A.; Semikin, K.V.; Murzin, D.Y.; Rebrov, E.V. Non-Thermal Plasma for Process and Energy Intensification in Dry Reforming of Methane. Catalysts 2020, 10, 1358. [Google Scholar] [CrossRef]
- Khani, M.R.; Guy, E.D.; Gharibi, M.; Shahabi, S.S.; Khosravi, A.; Norouzi, A.A.; Shokri, B. The effects of microwave plasma torch on the cracking of Pyrolysis Fuel Oil feedstock. Chem. Eng. J. 2014, 237, 169–175. [Google Scholar] [CrossRef]
- Zhang, S.; Gao, Y.; Sun, H.; Fan, Z.; Shao, T. Charge transfer in plasma assisted dry reforming of methane using a nanosecond pulsed packed-bed reactor discharge. Plasma Sci. Technol. 2021, 23, 064007. [Google Scholar] [CrossRef]
- Hou, P.; Zhou, Y.; Guo, W.; Ren, P.; Guo, Q.; Xiang, H.; Li, Y.W.; Wen, X.D.; Yang, Y. Rational design of hydrogendonor solvents for direct coal liquefaction. Energy Fuels 2018, 32, 4715–4723. [Google Scholar] [CrossRef]
- Chen, Q.; Yin, M.; Zhang, L.; Liu, H.; Qin, Z.; Wang, Z. Hydrogen-donated thermal upgrading of Venezuela extra-heavy oil: Identifying the role of hydrogen donor. Pet. Sci. Technol. 2020, 38, 550–555. [Google Scholar] [CrossRef]


| Capacitance of Capacitor, mF | 1 | 11 | 21 | 31 | 41 |
|---|---|---|---|---|---|
| Average pulse duration, ms | 1.02 ± 0.07 | 8.38 ± 0.22 | 13.81 ± 0.33 | 21.24 ± 0.38 | 25.94 ± 0.46 |
| Average pulse frequency, Hz | 0.92 ± 0.12 | 0.85 ± 0.18 | 0.80 ± 0.22 | 0.76 ± 0.22 | 0.71 ± 0.19 |
| Average pulse amplitude, A | 71.3 ± 0.8 | 120.6 ± 0.6 | 125.3 ± 0.7 | 128.6 ± 1.4 | 136.9 ± 1.6 |
| Average pulse energy, J | 0.018 ± 0.003 | 0.65 ± 0.06 | 1.38 ± 0.08 | 2.59 ± 0.10 | 3.62 ± 0.12 |
| Condenser Capacity, mF | 1 | 11 | 21 | 31 | 41 | |||
|---|---|---|---|---|---|---|---|---|
| Experiment time, h | 1 | 1 | 6 | 12 | ||||
| Energy consumption, kWh | 0.04 | 0.05 | 0.07 | 0.08 | 0.09 | 0.55 | 1.08 | |
| Energy consumption, kWh/kg of gas | 668 | 556 | 437 | 308 | 152 | 348 | 493 | |
| Gas flow, ml/h | 84 | 108 | 138 | 156 | 234 | 112 | 74 | |
| Gas yield, wt% | 0.29 | 0.375 | 0.6 | 0.95 | 2.2 | 5.94 | 8.36 | |
| Gas composition, mol% | ||||||||
| H2 | 49.6 | 44.5 | 40.1 | 32.1 | 27.6 | 30.2 | 31.4 | |
| CH4 | 3.9 | 5.8 | 6.4 | 7.9 | 7.5 | 7.9 | 9.1 | |
| C2H4 | 6.9 | 8.1 | 8.4 | 10.2 | 9.9 | 11.6 | 12.1 | |
| C2H6 | 0.3 | 0.5 | 0.6 | 0.7 | 0.8 | 0.8 | 1.0 | |
| C2H2 | 33.6 | 36.6 | 41.1 | 43.5 | 49.1 | 41.2 | 37.2 | |
| C3H8 | 0.7 | 1.3 | 1.4 | 2.2 | 2.1 | 3.3 | 3.7 | |
| C3H4 | 3.1 | 2.3 | 1.2 | 1.8 | 1.4 | 1.4 | 1.3 | |
| 1,3-C4H6 | 0.1 | 0.1 | 0.1 | 0.3 | 0.2 | 0.7 | 0.8 | |
| n-C4H10 | 0.1 | 0.1 | 0.1 | 0.2 | 0.3 | 0.6 | 0.6 | |
| neo-C5H12 | 0.2 | 0.2 | 0.4 | 0.7 | 0.8 | 1.8 | 1.9 | |
| Fuel Oil | NTP Pyrolysis Products | |||
|---|---|---|---|---|
| Experiment time, h | 1 | 6 | 12 | |
| Density at 20 °C, g/cm3 | 0.955 | 0.957 | 0.963 | 0.971 |
| Kinematic viscosity at 100 °C, mm2/s | 31.169 | 33.705 | 40.927 | 95.699 |
| Sulfur content, % | 2.675 | 2.680 | 2.710 | 2.765 |
| Non-volatile residue, % | 30.6 | 45.5 | 48.1 | 52.4 |
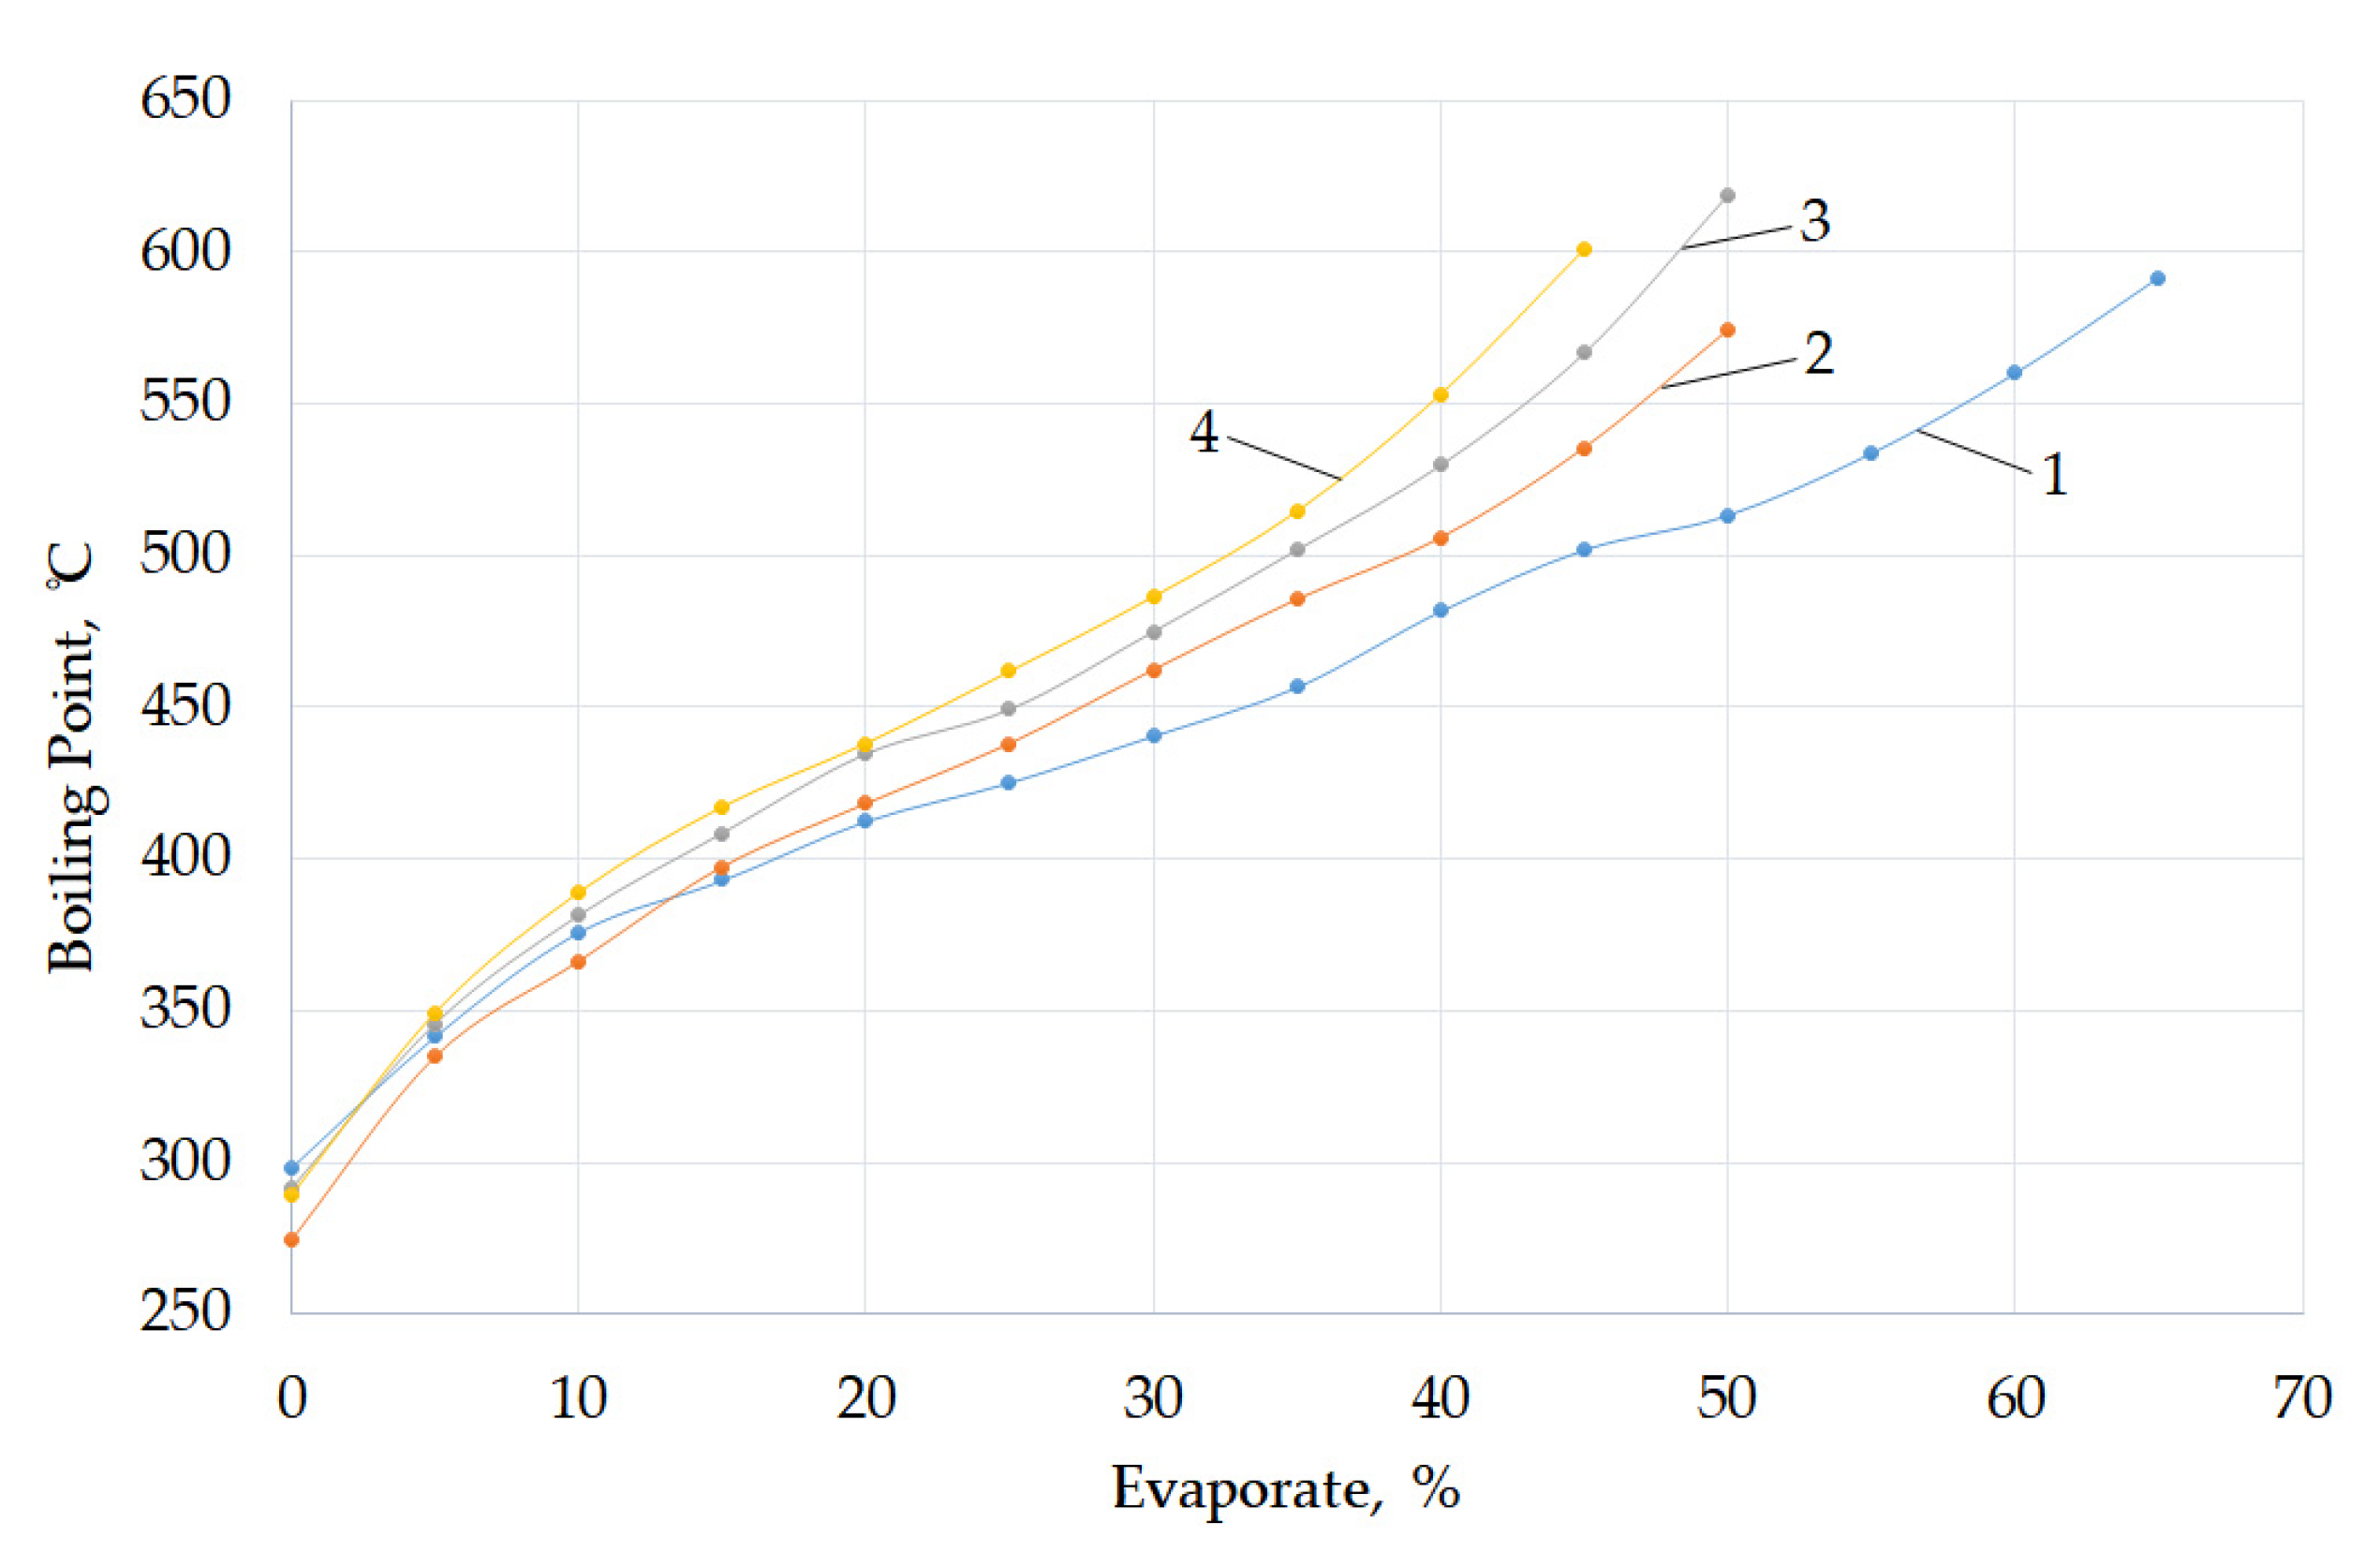
| Initial boiling point, °C | 298.5 | 274.5 | 291.4 | 289.3 |
| Final boiling point, °C | 671.3 | 671.7 | 711.3 | 721.6 |
| Volume of stripping, % | 69.4 | 54.5 | 51.9 | 47.6 |
| NMR 1H Range, ppm | 9.0–8.3 | 8.3–7.3 | 7.24–6.5 | 4.4–2.4 | 2.4–2.1 | 2.1–1.05 | 1.05–0.3 | FHA | |
|---|---|---|---|---|---|---|---|---|---|
| Capacity, mF | Experiment Time, h | Har, % | Hal, % | ||||||
| Fuel oil | 0.19 | 2.26 | 2.55 | 7.85 | 2.78 | 62.83 | 21.55 | 0.0499 | |
| 1 | 1 | 0.22 | 2.38 | 2.51 | 7.89 | 3.10 | 62.35 | 21.55 | 0.0511 |
| 11 | 1 | 0.28 | 2.72 | 2.00 | 8.75 | 2.85 | 61.99 | 21.40 | 0.0500 |
| 21 | 1 | 0.30 | 2.62 | 2.18 | 8.56 | 2.88 | 62.29 | 21.15 | 0.0511 |
| 31 | 1 | 0.30 | 2.77 | 2.00 | 8.45 | 2.91 | 62.23 | 21.34 | 0.0507 |
| 41 | 1 | 0.31 | 2.60 | 2.17 | 8.32 | 2.72 | 62.39 | 21.49 | 0.0508 |
| 41 | 6 | 0.34 | 2.90 | 2.04 | 8.22 | 2.92 | 61.88 | 21.70 | 0.0528 |
| 41 | 12 | 0.20 | 2.73 | 2.50 | 7.45 | 2.79 | 62.25 | 20.07 | 0.0543 |
Publisher’s Note: MDPI stays neutral with regard to jurisdictional claims in published maps and institutional affiliations. |
© 2022 by the authors. Licensee MDPI, Basel, Switzerland. This article is an open access article distributed under the terms and conditions of the Creative Commons Attribution (CC BY) license (https://creativecommons.org/licenses/by/4.0/).
Share and Cite
Titov, E.Y.; Bodrikov, I.V.; Serov, A.I.; Kurskii, Y.A.; Titov, D.Y.; Bodrikova, E.R. Liquid-Phase Non-Thermal Plasma Discharge for Fuel Oil Processing. Energies 2022, 15, 3400. https://doi.org/10.3390/en15093400
Titov EY, Bodrikov IV, Serov AI, Kurskii YA, Titov DY, Bodrikova ER. Liquid-Phase Non-Thermal Plasma Discharge for Fuel Oil Processing. Energies. 2022; 15(9):3400. https://doi.org/10.3390/en15093400
Chicago/Turabian StyleTitov, Evgeniy Yurevich, Ivan Vasilevich Bodrikov, Anton Igorevich Serov, Yuriy Alekseevich Kurskii, Dmitry Yurievich Titov, and Evgenia Ruslanovna Bodrikova. 2022. "Liquid-Phase Non-Thermal Plasma Discharge for Fuel Oil Processing" Energies 15, no. 9: 3400. https://doi.org/10.3390/en15093400
APA StyleTitov, E. Y., Bodrikov, I. V., Serov, A. I., Kurskii, Y. A., Titov, D. Y., & Bodrikova, E. R. (2022). Liquid-Phase Non-Thermal Plasma Discharge for Fuel Oil Processing. Energies, 15(9), 3400. https://doi.org/10.3390/en15093400