Article

Pyrolysis Characteristics of Hailar Lignite in the Presence of Polyvinyl Chloride: Products Distribution and Chlorine Migration

1
State Key Laboratory of High-Efficiency Utilization of Coal and Green Chemical Engineering, College of Chemistry and Chemical Engineering, Ningxia University, Yinchuan 750021, China
2
Co-Innovation Center of Efficient Processing and Utilization of Forest Resources, College of Materials Science and Engineering, Nanjing Forestry University, Nanjing 210037, China
*
Author to whom correspondence should be addressed.
Energies 2022, 15(9), 3377; https://doi.org/10.3390/en15093377
Submission received: 23 March 2022 / Revised: 22 April 2022 / Accepted: 27 April 2022 / Published: 6 May 2022
(This article belongs to the Section B3: Carbon Emission and Utilization)

Abstract

:
This study investigated the effects of polyvinyl chloride (PVC) addition on low-rank coal’s pyrolysis characteristics, especially the products distribution and chlorine migration. Hailar lignite (HLE) with different industrial, pure, PVC-content additions were prepared (the mass percentage of PVC addition was from 5% to 25%), and the co-pyrolysis characteristics of HLE and PVC were performed on a fixed-bed reactor and thermogravimetric analyzer. The chars were characterized with X-ray diffraction (XRD), X-ray fluorescence (XRF), and Fourier-transform infrared (FT-IR) spectroscopy analysis. The gas and tar compositions were analyzed by using gas chromatography (GC) and a gas chromatography–mass spectrometry (GC–MS) system, respectively. The results indicate that the addition of PVC can increase the release amounts of CH4, C2H4, and C2H6, simultaneously reducing the release amount of CO2 and CO; the quality of pyrolysis tar was also improved, especially the alkane content in tar, which increased by 6.9%. The migration of chlorine in PVC was analyzed with the different PVC additions and terminal pyrolysis temperatures. It showed that the content of chlorine in the gas phase first increased with the increasing pyrolysis temperature, but at the terminal temperature of 600 °C, the chlorine in the gas phase began to decrease. The results of the co-pyrolysis char characterization show that the content of the alkali metal oxide gradually decreases in the char, and metal chloride appears during the pyrolysis process. In the co-pyrolysis reaction of coal and PVC, chlorine was fixed in the char, thereby reducing the distribution of chlorine in the gas phase. This also proves that the PVC pyrolysis process, with the participation of low-rank coal, can enrich chlorine into the solid phase, thus reducing the emission of chlorine in the gas phase.

1. Introduction

The plastics industry is developing so rapidly that a large amount of waste plastic products have emerged one after another, and the proportion of urban solid plastic waste has become a serious environmental problem [1,2]. Waste plastic is difficult to degrade and has a long degradation cycle. Therefore, the landfill method has a poor treatment effect and takes up a lot of land resources. Incineration is also a common treatment method for plastic waste currently, but incineration can lead to the emission of hazardous substances, such as dioxins [3]. To achieve sustainable development of the economy and environment, some scholars have begun to choose suitable treatment methods to encourage the recycling of waste plastic resources [4,5]. Pyrolysis technology is a further development of harmless treatment technology. Pyrolytic incineration technology can first transform solid waste gas into residue and gas in the absence of oxygen or hypoxia, and then carry out oxygen-rich combustion, so as to effectively reduce the emission of pollutants. [6]. The reported results show that the pyrolysis and co-pyrolysis are applied for the useful disposal of waste plastics, and the experimental results show that the co-pyrolysis of plastics and biomass has the effect of changing reaction activity and reducing activation energy [7,8].
With the increasing energy demand and the large reduction in high-quality coal resources, low-rank coal has gradually become a precious coal resource [9,10]. Based on plastic liquefaction technology, the co-pyrolysis technology of coal and waste plastics has developed [11]. Using solid plastic waste with a high proportion of H/C atoms as a hydrogen supply material plays a role in the hydrogen supply for the low-rank coal pyrolysis reaction process, which is beneficial to the improvement of liquid product yield [12,13]. The overlapping degradation temperature ranges of coal and plastic are beneficial to the migration of hydrogen from plastic to coal [14]. The hydrogen consumption of coal liquefaction can be reduced by using hydrogen rich in waste plastics [15], such that waste plastics can be utilized for a resource and the composition and structure of low-rank coal pyrolysis products are optimized. This system is an important direction for the effective utilization of low-rank coal and a feasible way to recycle waste plastic products. This report investigated whether coal pyrolysis with PVC improves the surface unevenness of residual carbon and enables it to produce more volatiles and higher reactive coke [16].
Research on the co-pyrolysis of coal and waste plastics is mainly carried out on the pyrolysis of mixed plastics without PVC. At the same time, there are few studies on the migration of chlorine in the co-pyrolysis process of PVC and low-rank coal. Our work aimed to convert PVC into value-added products by co-pyrolysis with low-rank coal. In a series of PVC dechlorination experiments, the metal compounds in metal catalysts fixed chlorine as metal chlorides in solid-phase products instead of releasing HCl gas [17,18,19,20,21], which can achieve directional migration of chlorine.
In this study, the co-pyrolysis of low-rank coal and PVC were investigated. The objectives of this study were the effects of PVC on low-rank coal pyrolysis products and the migration direction of chlorine in PVC, focusing on the solid-phase product such that the migration rule of the chlorine element in co-pyrolysis was established to achieve directional regulation of the chlorine release. Therefore, the co-pyrolysis of chlorine-containing plastics and coal has good prospects for both resource utilization and environmental protection.

2. Experimental Section

2.1. Samples

A low-rank lignite coal from Hailar, Inner Mongolia, China, was used in this study. The coal is defined as HLE in this study. The sample was manually ground and sieved to particle sizes less than 200 mesh (0.075 mm), dried at 105 °C for 12 h, and stored in a desiccator for use. The PVC was selected from powdered, industrial, pure products with a particle size of less than 200 mesh. According to GB/T 212-2008 and GB/T 19143-2003, a German Elementar automatic element analyzer and a 5E-AG6700 automatic industrial analyzer were used for the elemental analysis and industrial analysis of the coal sample and PVC. GB/T 1574-2007 was used for analysis. The proximate and ultimate analyses of the coal sample and PVC are listed in Table 1. The ash compositions of the coal sample and PVC are shown in Table 2. The petrographic analysis and vitrinite reflectivity of the coal sample are shown in Table 3. The method for determining the coal’s vitrinite reflectance with a microscope was GB-T6948-2008, the method for determining the coal’s macerals and minerals was GB-T8899-2013, and the method for preparing the coal and rock analysis samples is GB-T-16773-2008.
The PVC was added to HLE according to following procedures: PVC was proportionally (5 wt%, 10 wt%, 15 wt%, 20 wt%, and 25 wt%) added to the coal sample, mixed mechanically, and then stored in a desiccator.

2.2. Thermogravimetric Analysis

A thermogravimetric analysis was performed with a thermal gravimetric analyzer (SETARAM S1etsys-16, France). During the experiment, approximately 10 mg samples were placed on a corundum-plate crucible. The reactor was heated from room temperature to 800 °C at 10 °C/min with 40 mL/min of argon as a protective gas. Each experiment was repeated three times to give an average value.

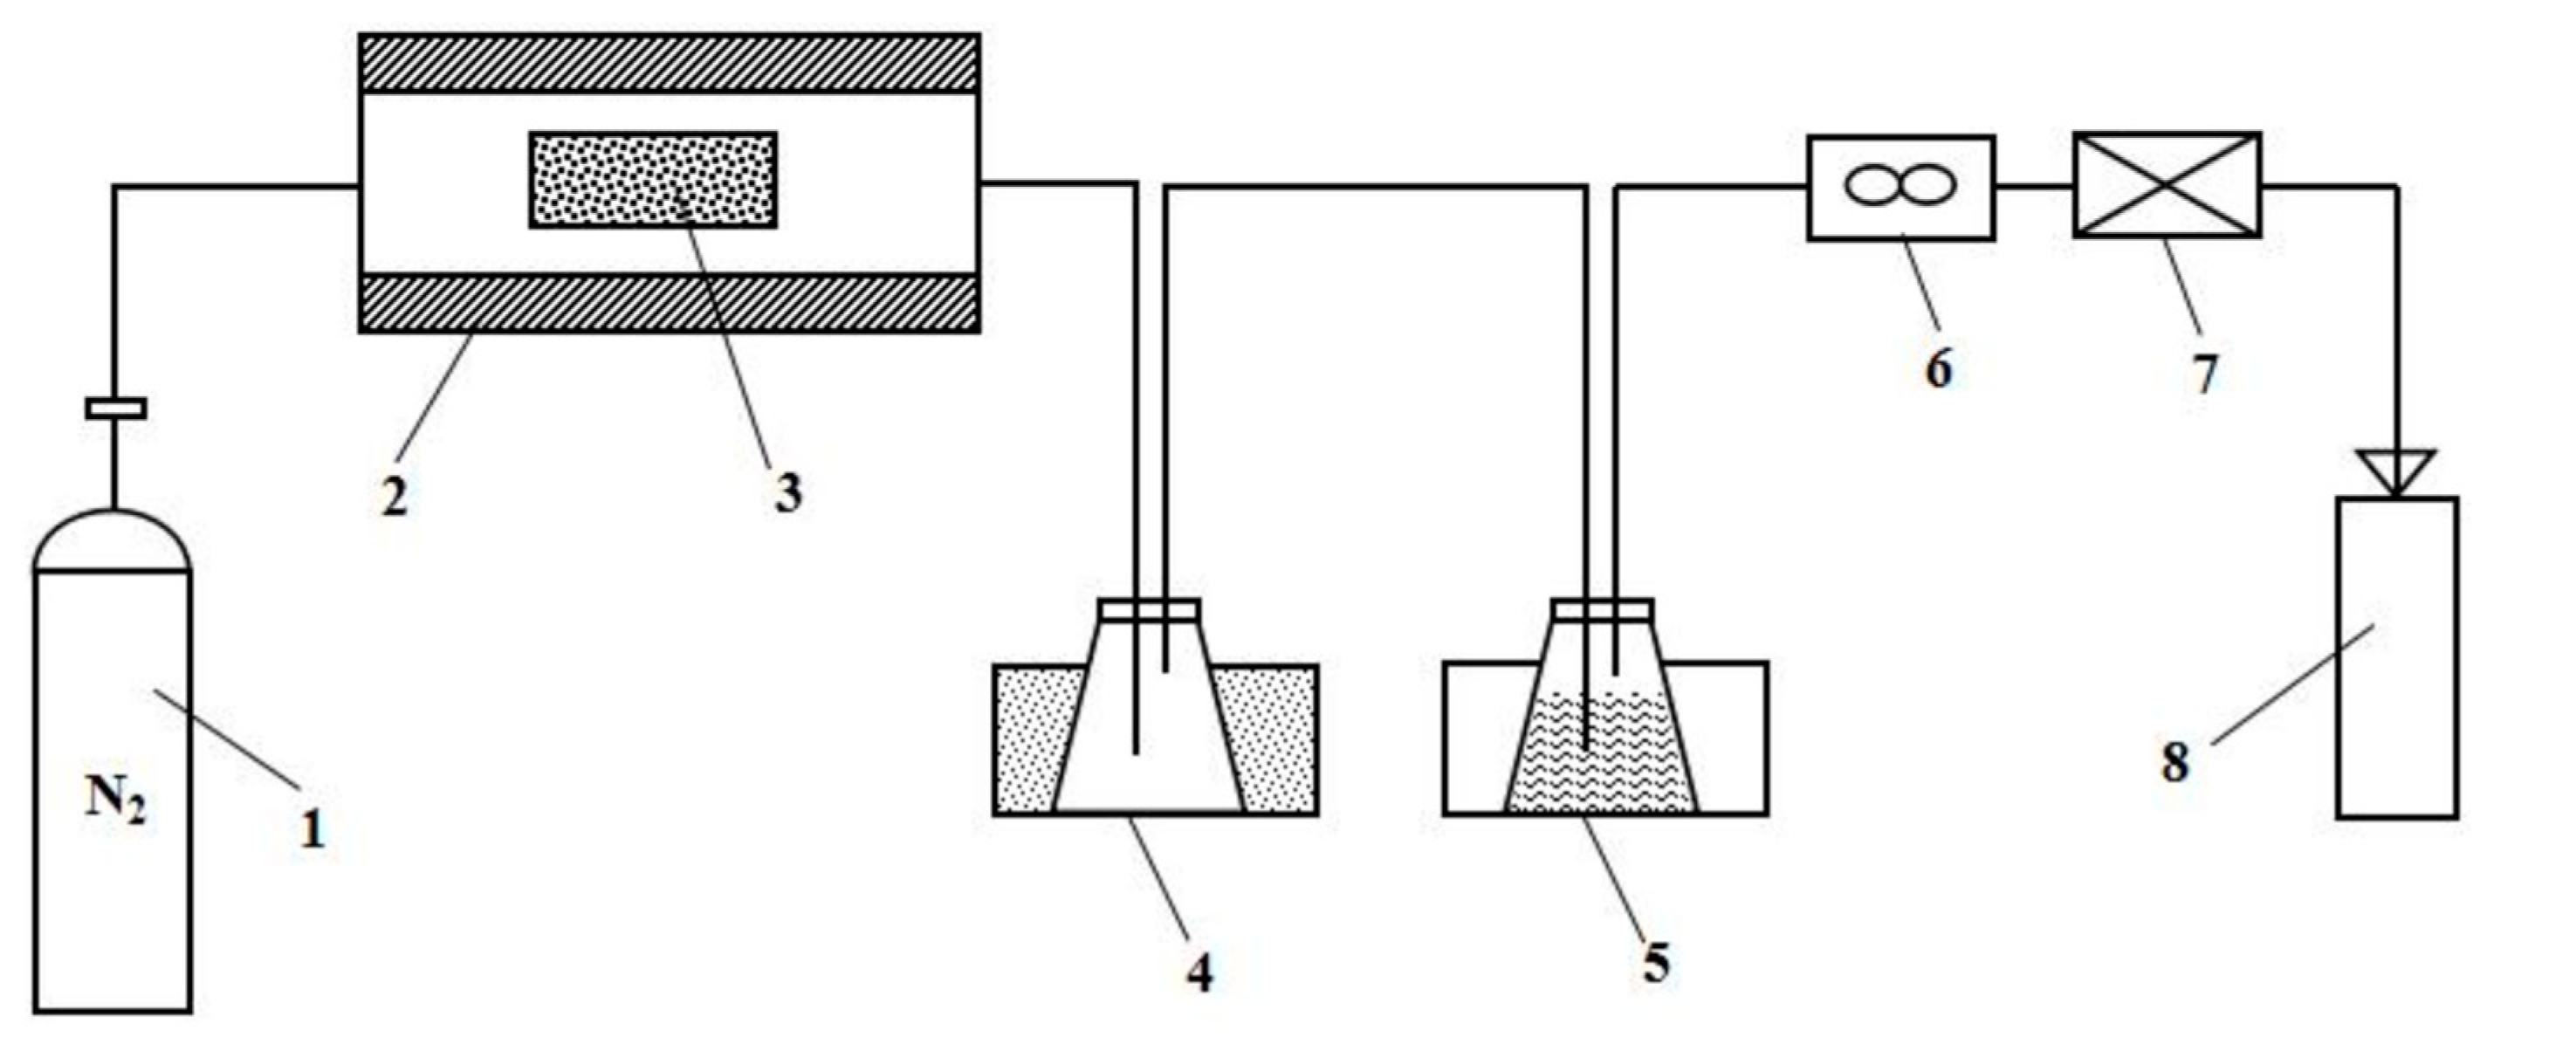
2.3. Co-Pyrolysis in PVC

All pyrolysis experiments were performed in a fixed-bed reactor under nitrogen. The reactor was externally heated using an electric furnace, and the reaction temperature was controlled using a PID controller interfaced with a thermocouple. Nitrogen with a purity of 99.99% was used as the carrier gas. Figure 1 shows the schematic diagram of the experimental apparatus.
After the reactor was set, a 200 mL/min sweep N2 was used to purge the reactor for 30 min. Next, the reactor was heated from room temperature to 110 °C at 5 °C/min under a continuous N2 flow of 100 mL/min and held at 110 °C for 20 min in order to remove the physically absorbed water from the samples. The reactor was then heated from 110 °C to the different pyrolysis terminal temperatures (400 °C, 450 °C, 500 °C, 550 °C, and 600 °C) at 5 °C/min and held for 30 min to ensure the complete release of the volatiles. The tar-containing liquid from pyrolysis was cooled in a cold trap, and the cooling medium was ice water. The hydrogen–chloride that evolved from the degradation of PVC was collected in an Erlenmeyer flask containing deionized water. Then, the gas-phase product was collected in a gas bag. The experiment was repeated under these conditions.

2.4. Product Analysis and Characterization

After the reaction started and the temperature of the reaction tube rose to 100 °C, the gas collection bag was used to collect the pyrolysis gas. After the reaction was completed, the gas collection stopped when the temperature of the reaction tube dropped to 100 °C. The gas composition was analyzed with gas chromatography (GC2008C, Guangzheng Analytical Instrument Co. LTD, Shenyang, China) with two channels (columns: 13X molecular sieve and GDX502) and a TCD detector. The chromatograph was calibrated by an external standard method with the configured standard gas before analysis.
The tar composition was analyzed with gas chromatography–mass spectrometry (QP2010, Shimadzu Corporation, Kyoto, Japan). GC-MS was performed using a 20 m × 0.18 mm capillary column (DB-5ms) with 0.18 mm film. Helium was used as a carrier gas at a flow rate of 1.0 mL/min. The injector of the GC was maintained at 230 °C. The column temperature was maintained at 35 °C for 1 min, was increased to 250 °C with a heating rate of 5 °C/min for 5 min, and finally was kept at 300 °C for 5 min.
The functional groups of raw coal, PVC, and char samples were analyzed using Fourier transform infrared spectroscopy (Spectrum Two, PerkinElmer, OH, USA) (FT-IR). The mixture of samples and KBr (in the ratio of 1:500) were finely ground and pressed into circular flakes, which were collected in the mid-infrared (400–4000 cm−1) region with a resolution of 4 cm−1 and scans of 16.
The co-pyrolysis char was analyzed with an X-ray fluorescence spectrometer (S2RANGER LE, BrukerAXSGmbH, Karlsruhe, Germany) and a X-ray diffractometer (D/max 2200 PC, Rigaku, Tokyo, Japan) with Cu Kα radiation of wavelength λ = 0.1541 nm at 40 kV and 40 mA.
Distilled water was used to absorb HCl generated during pyrolysis and titrated by an automatic potentiometric titrator (RC-600, Taizhou Ruitao Analytical Instrument Co., Ltd., Taizhou, China). The absorption solution was titrated with a silver nitrate solution to determine the concentration of Cl, and the chlorine in the gas phase was calculated based on the concentration of silver nitrate. The experimental data were averaged after repeated experiments.

2.5. Data Analysis

Experimental and theoretical differences regarding pyrolysis product yield at different temperatures and PVC additions were analyzed. The theoretical calculation value was calculated as follows:
Y c a l = Y P V C × F + Y c o a l × ( 1 F )
where Ycal is the theoretical calculation of the yield of the co-pyrolysis product of HLE coal and PVC, YPVC is the individual pyrolysis product yield of PVC, Ycoal is the individual pyrolysis product yield of HLE coal, and F is the mass percentage of PVC addition.
The co-pyrolysis dechlorination rate was calculated using the following equation:
Y C l = [ 1 y C l W c h a r W F y 1 + W ( 1 F ) y 2 ]
where YCl is the co-pyrolysis dechlorination rate, W is the sample weight, Wchar is the char weight, y1 is the chlorine content in PVC, y2 is the chlorine content in HLE coal, and yCl is the chlorine content in char.

3. Results and Discussion

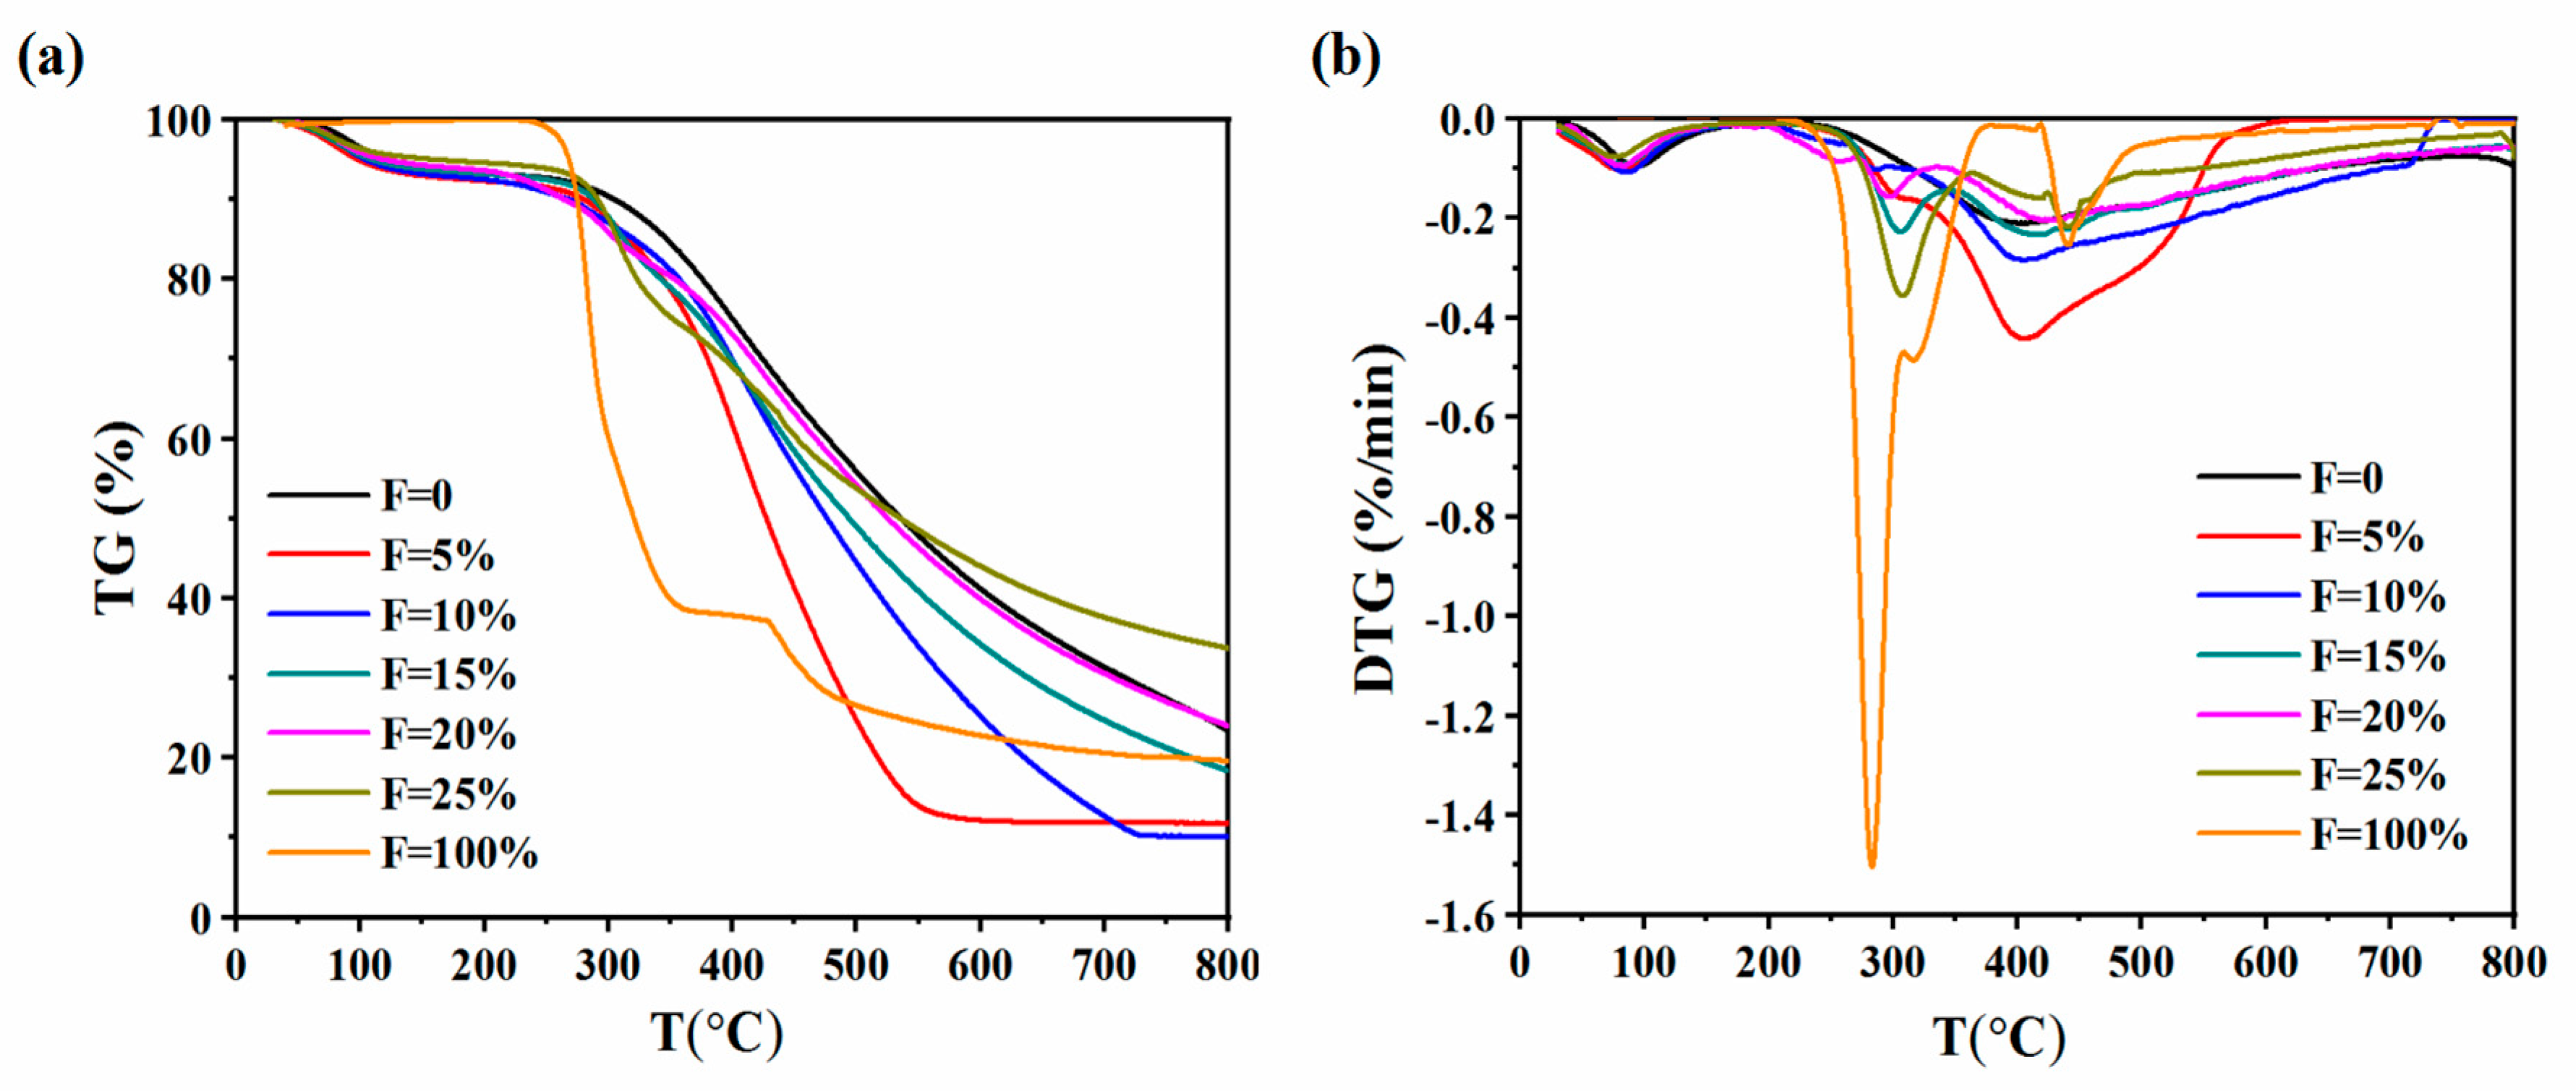
3.1. TG and DTG Analyses

Figure 2 shows the TG and DTG curves of HLE pyrolysis with different PVC additions. The degradation process of PVC can be observed from the TG curve. The weight-loss curve of PVC shows that two peaks at the maximum value appeared at 300 °C and 450 °C. From 200 °C to 380 °C was the first step of the degradation, including the dehydrochlorination reaction. The second step of the degradation corresponded to the peak reaching a maximum at 450 °C, which was related to the carbonization process. A similar conclusion was reached in the past [22,23].
As observed with the addition of PVC, the weight loss of coal increased, and there was a new weight-loss peak before 360 °C. The more PVC that was added, the more obvious the weight-loss peak was. The stage was mainly the pyrolysis of PVC, which coincided with the separate thermal desorption of HCl from PVC. With the increase of PVC addition, the weight loss of the sample was gradually reduced after 360 °C. When the PVC addition amount was more than 20 wt%, the weight loss of the mixed sample was less than the weight loss of the raw coal alone because the compounds produced by PVC in the first stage of co-pyrolysis attach to the surface of coal and “wrap” the coal, hindering the release of volatiles from coal pyrolysis. At the same time, it can be seen from the DTG curve that the maximum weight-loss rate was shifted from a lower temperature to a higher temperature. Because the compound produced by PVC could adhere to the surface of the coal in the first pyrolysis stage, the coal was entrapped, which hindered the evaporation of the coal pyrolysis volatiles. When the PVC addition amount was 5 wt%, the weight loss of the mixed sample was greater than the weight loss of the raw coal, and the pyrolysis process was substantially completed at about 580 °C. In addition, the 5 wt% PVC evaporated more small-molecule free radicals during the pyrolysis process, which promoted the pyrolysis of coal. This indicated that there was a synergistic effect between the coal and corresponding PVC additions.

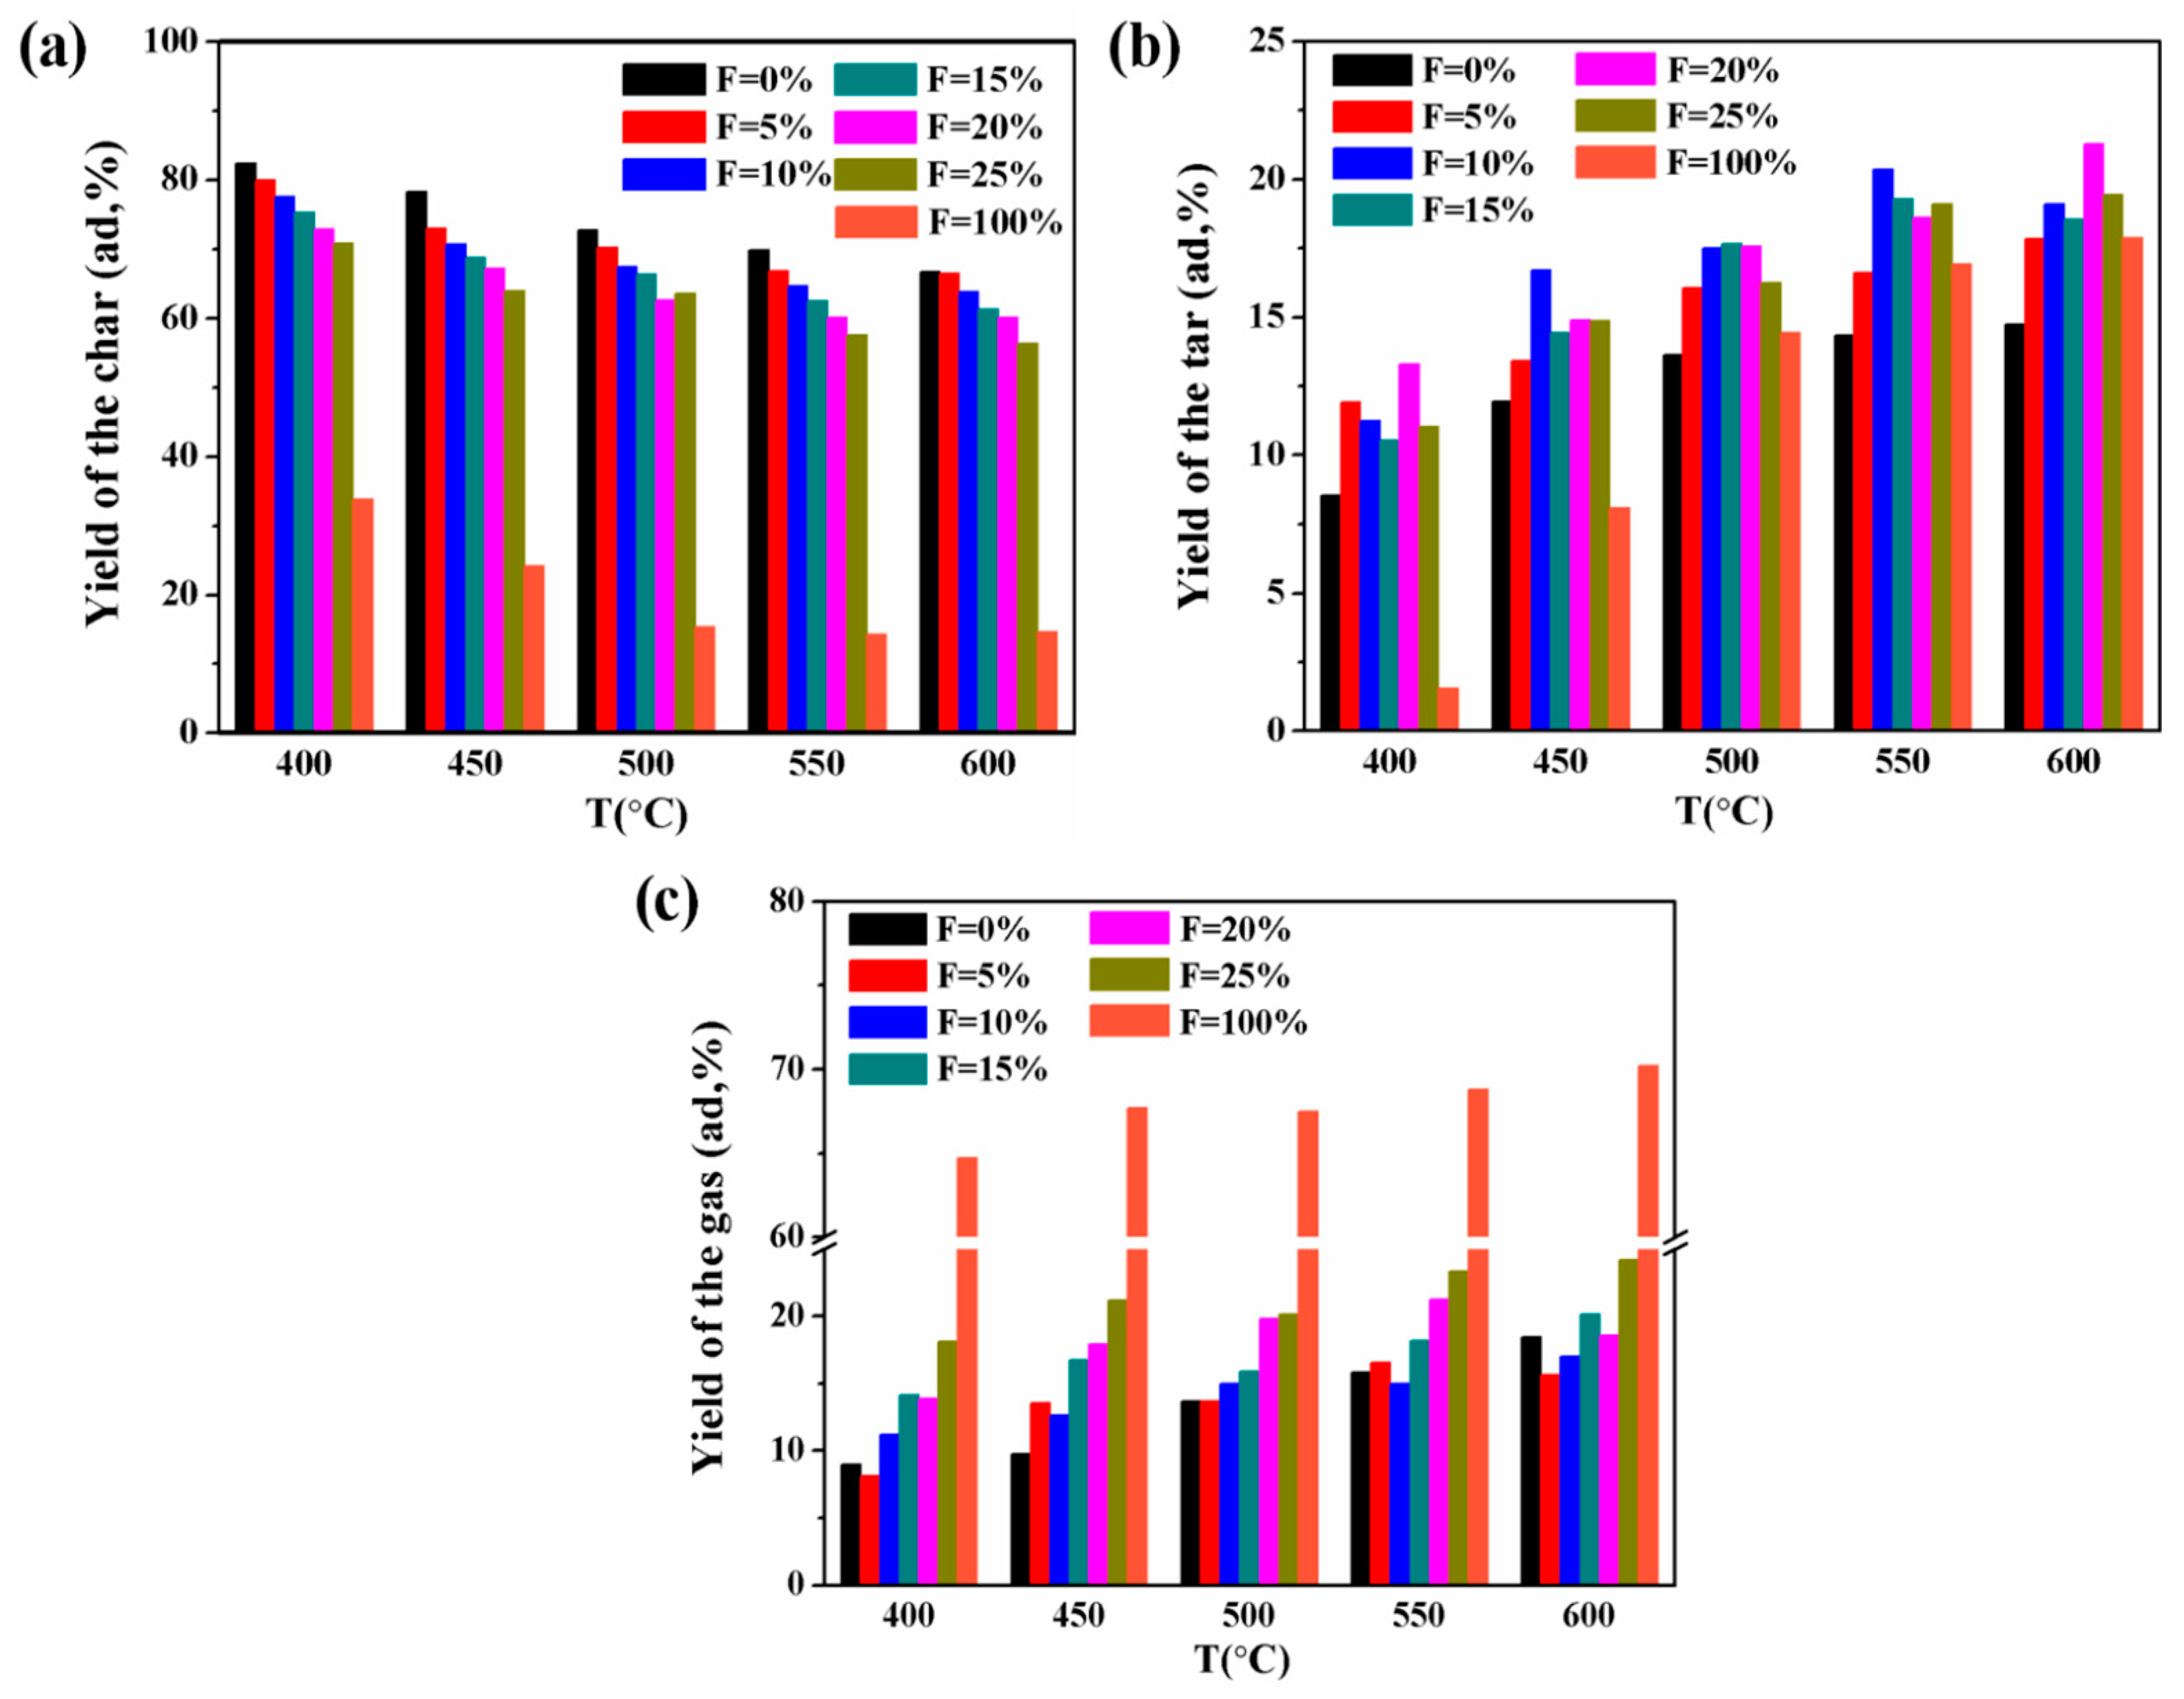
3.2. Yield Analyses of Pyrolysis Product

Pyrolysis was conducted by loading coal and PVC into the fixed-bed reactor. The main aim was to investigate the effects of the HLE coal and PVC co-pyrolysis on the yield of the pyrolysis products. Figure 3 shows the yields of the pyrolysis char, gas, and tar, respectively. Among the three co-pyrolysis products of coal and PVC, the yield of char was the highest, and the release amount of the gas increased with the increasing reaction temperature. At 600 °C, the tar yield was the highest at 20 wt% PVC additions, reaching 21.3%. As the reaction temperature increased, the sample began to depolymerize and decompose, and the fatty chain, alkane side chain, carbonyl and carboxyl group began to break, causing the tar and the small-molecule pyrolysis gas to precipitate. In addition, the reaction of removing HCl from PVC was initiated after 200 °C [24], and a large amount of HCl was formed. Thus, the yield of char was gradually reduced, and the yield of tar and pyrolysis gas yield increased with the increasing reaction temperature.
Table 4 shows the difference between the actual value and the theoretical value of the co-pyrolysis product yield at different terminal temperatures and PVC additions. As shown, the yield of the co-pyrolysis tar was significantly larger than the theoretical value, and the yield of gas was smaller than the theoretical value. For the tar, the biggest difference between the actual value and the theoretical value occurred at pyrolysis temperature of 600 °C. The results show that the addition of PVC had a significant effect on the tar yield and had an inhibitory effect on the release of gas. At 450 °C, the actual yield of char was much lower than the theoretical value, indicating that the dechlorination reaction of PVC may be completed at 450 °C, making the coke yield significantly lower. However, as the PVC continued to degrade and melt, causing coal pores to gather, this structure hindered the diffusion of coal volatiles. As the temperature increased, the pores were gradually released, and the pyrolysis gas was gradually increased.

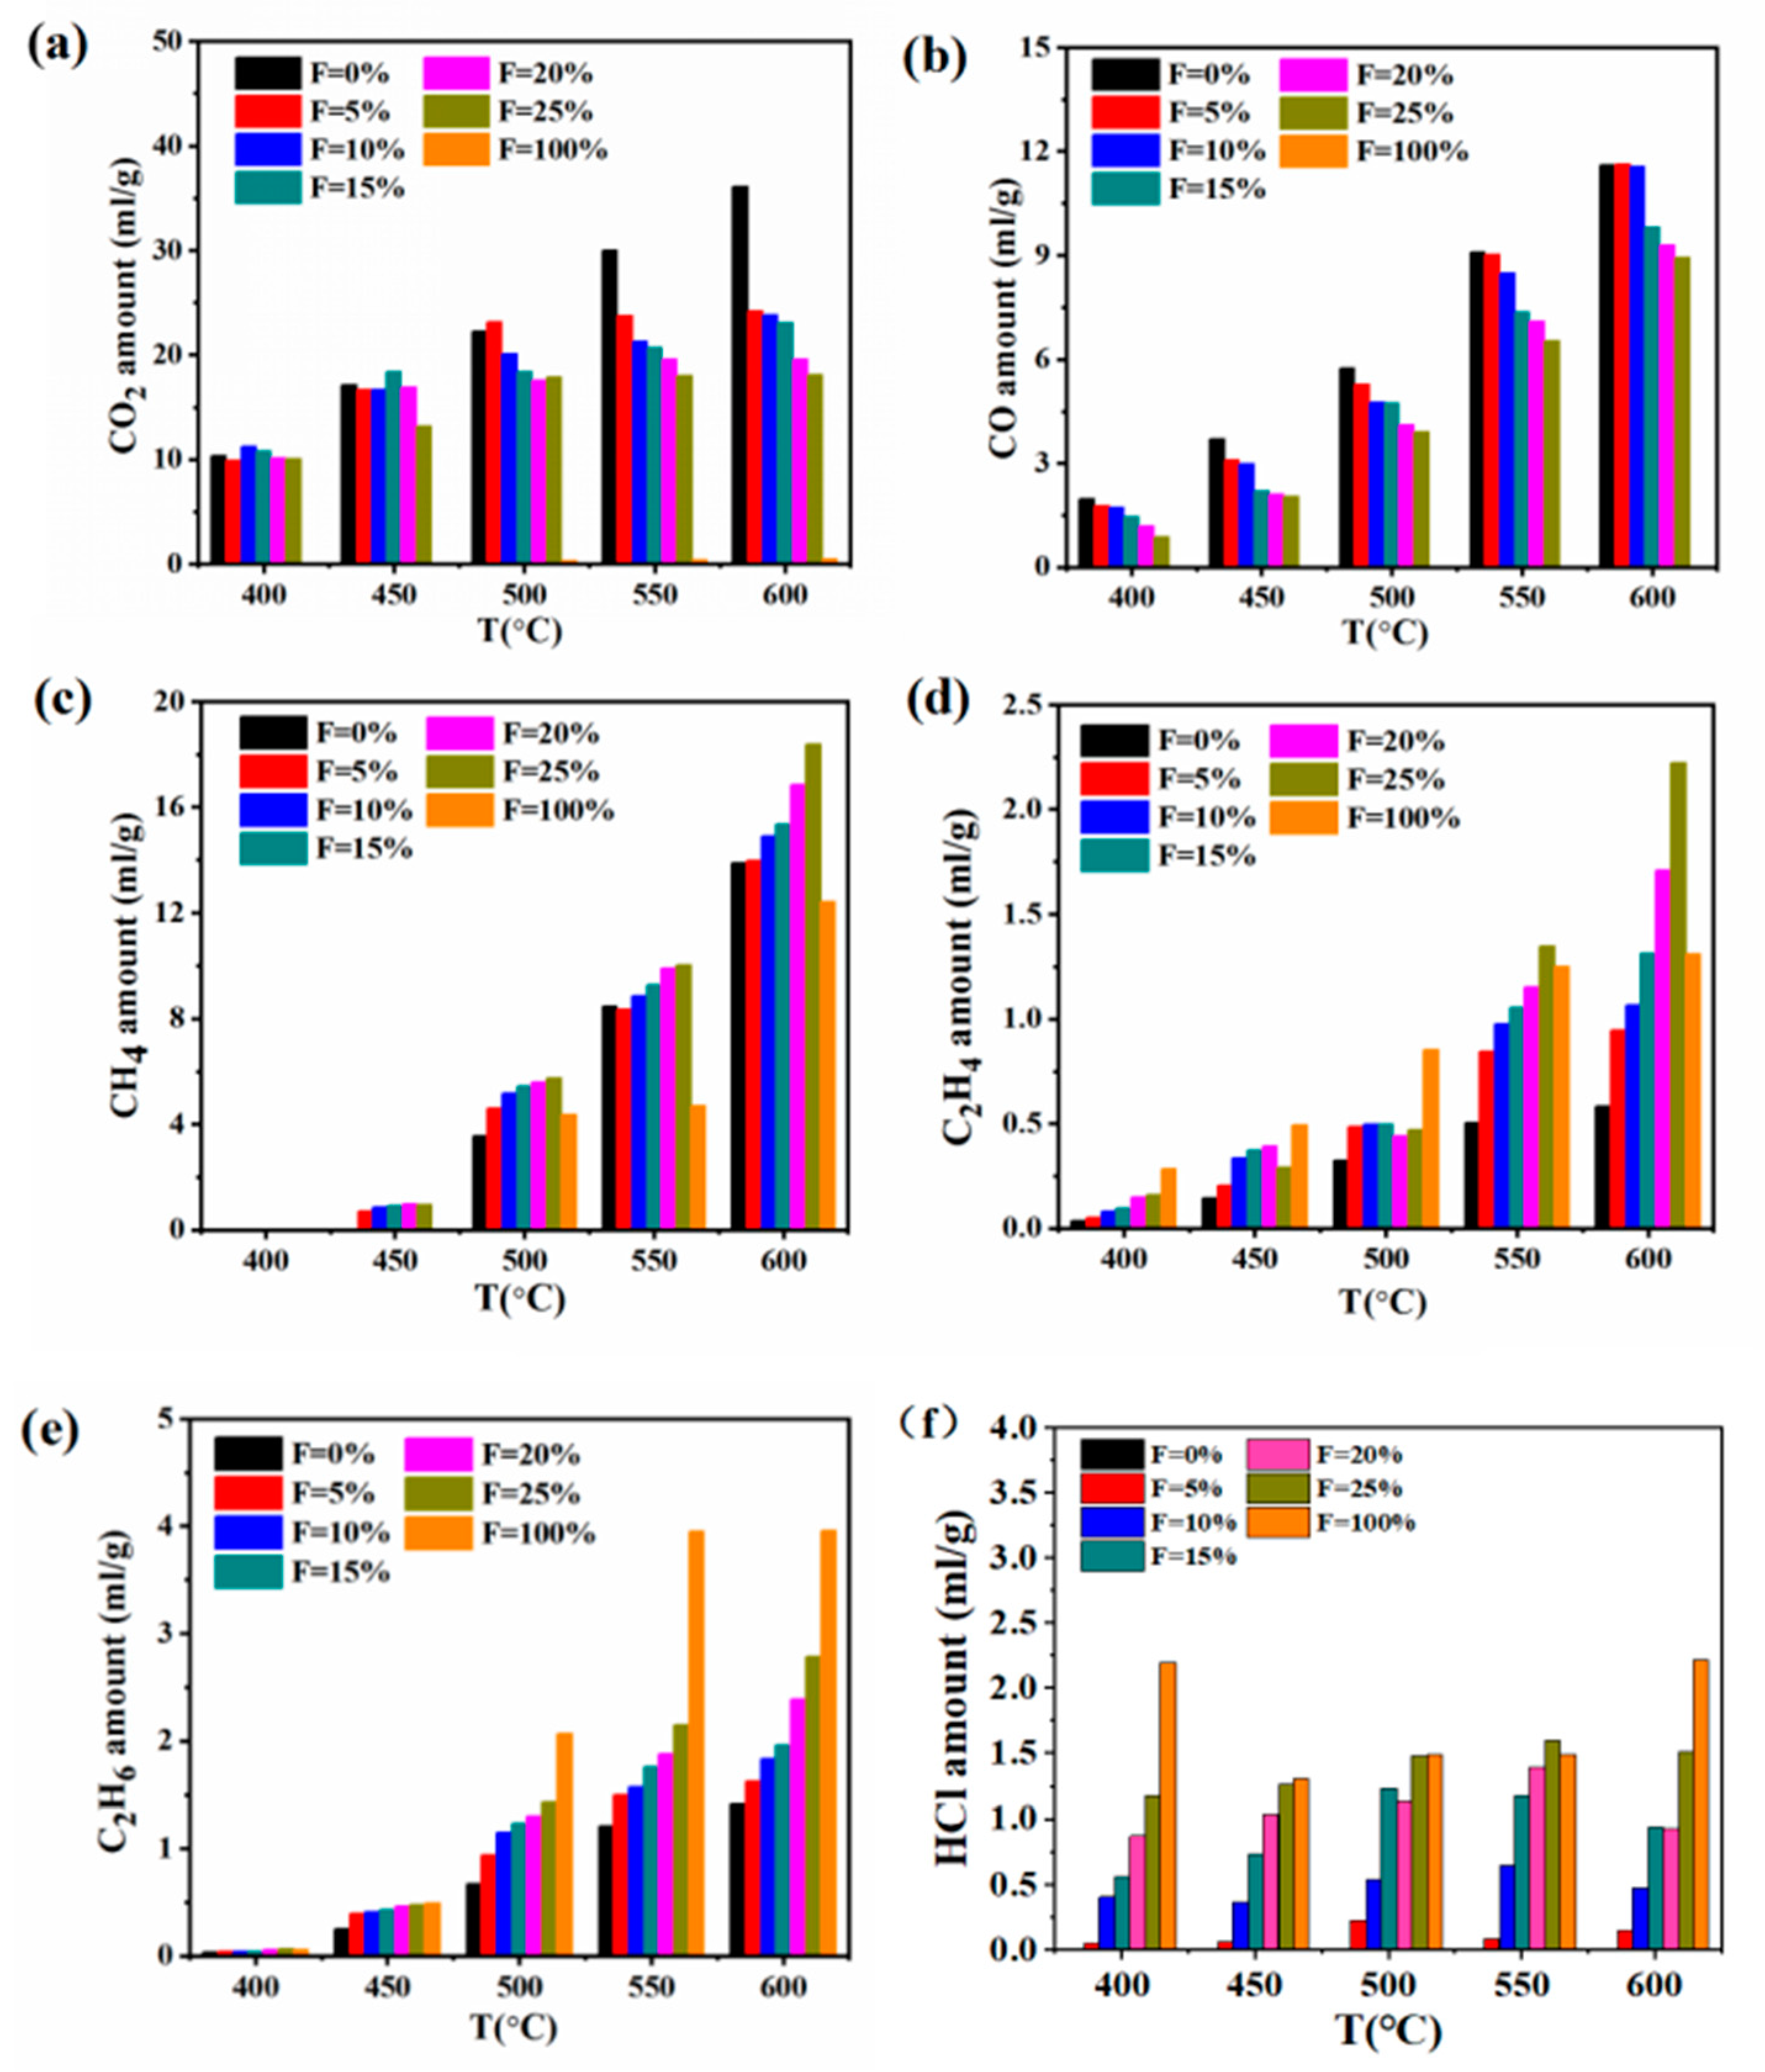
3.3. Gas Composition Analyses in Different PVC Additions

The effect of the PVC additions on the yield of the co-pyrolysis gas-phase component from 400 °C to 600 °C is shown in Figure 4. As shown, the results show that the addition of PVC could promote the release of CO2, CH4, C2H4, and C2H6 earlier in varying degrees with the increase of PVC additions. The additions of PVC could increase the release amount of CH4, C2H4 and C2H6 during co-pyrolysis. However, the release amount of CO2 and CO decreased when the PVC additions were increased. This may be because CO2 and CO are mainly derived from the decomposition of oxygenates: CO2 is mainly derived from the decomposition of carboxyl groups in coal, and CO is mainly derived from the decomposition of ether bonds and hydroxyl groups. However, since the oxygen content in PVC was extremely small, the yield of CO2 and CO gradually decreased. The release amount of CH4 increased significantly at 600 °C, with a maximum increase of 8.33 mL/g; that is, for each increase of 1 g of PVC, the amount of CH4 increased by 8.3 mL. The release rule of CH4 was different from the release of hydrocarbons. According to the results of the coal molecular structure, there were alkyl side chains on the aromatic ring in the coal molecule, and the cleavage of the alkyl side chain could produce CH4. However, the reaction temperature was higher. Therefore, CH4 was mainly produced by the breakage of the alkyl side chain on the aromatic ring [25,26]. The increase in C2H4 and C2H6 was also obvious after 500 °C. In addition, the reaction of releasing HCl from PVC was initiated, and a large amount of HCl was formed, such that the chain structures were unstable and the fracture reaction occurred during pyrolysis. The PVC had a high H/C ratio, which had an important effect on the hydrogen supply in the pyrolysis process [27,28,29].

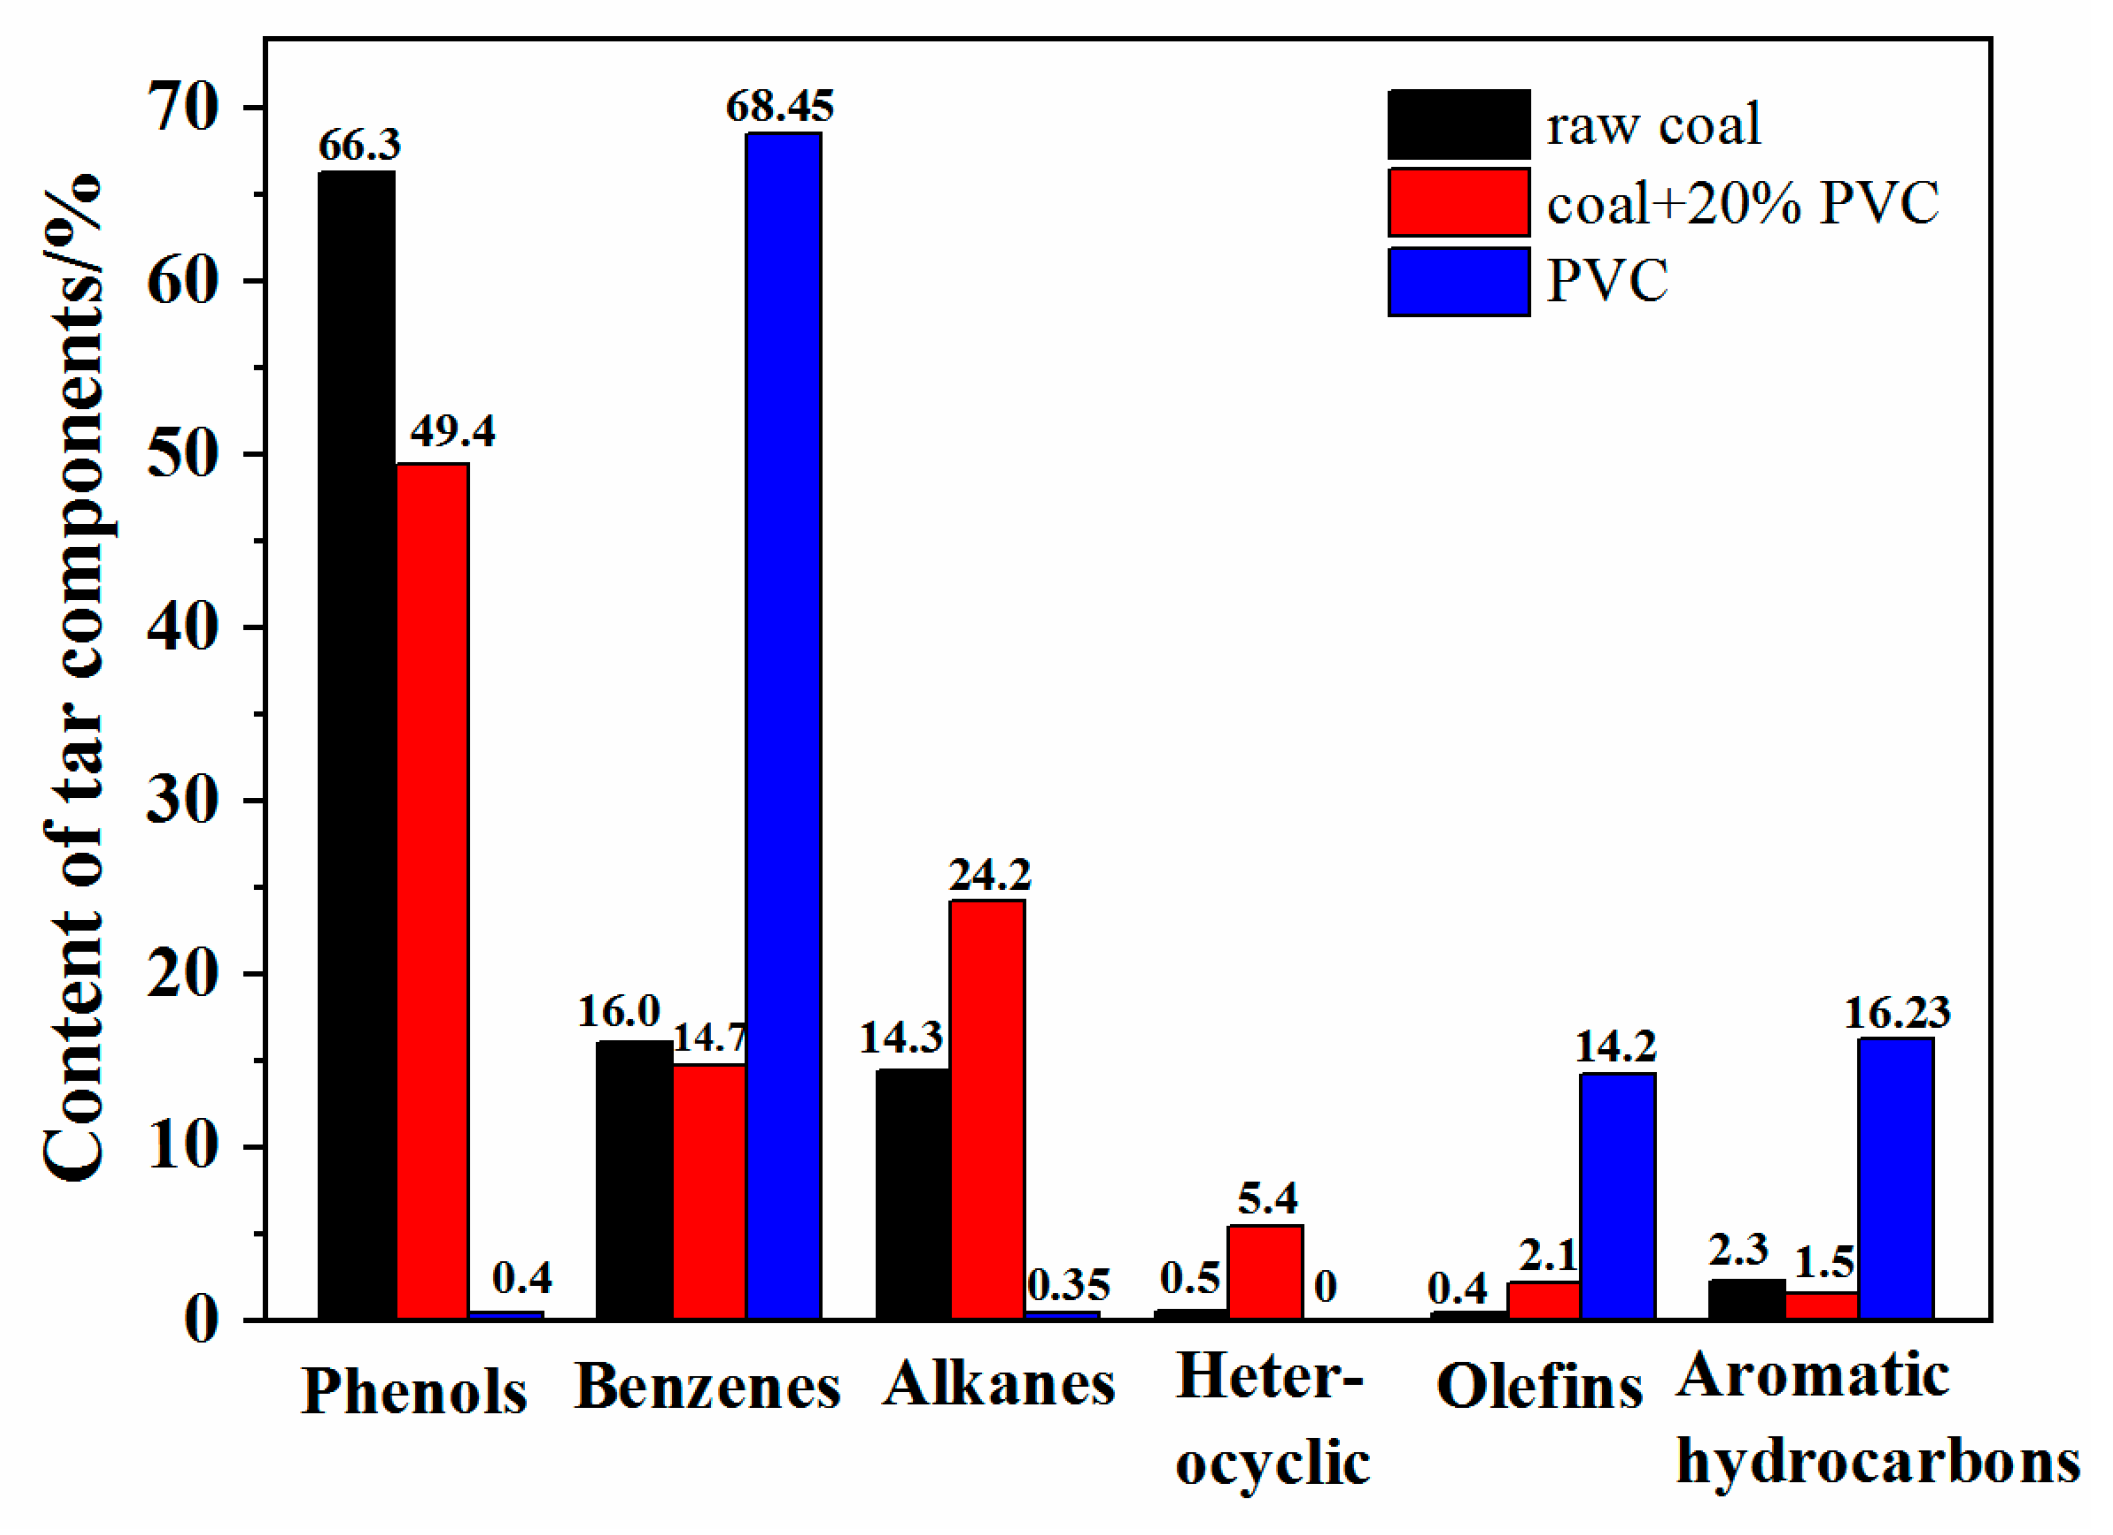
3.4. Tar Composition Analyses with Different PVC Additions

The tar component was classified into phenols, benzenes, alkanes, heterocyclic, olefins, and aromatic hydrocarbons. The product types are shown in Figure 5. It can be seen from Figure 3 and Table 3 that the maximum yield of tar was obtained when the PVC additions was 20 wt% at 600 °C. Therefore, the tar, which was produced at a terminal pyrolysis temperature of 600 °C, was analyzed using a GC-MS system. During coal pyrolysis, numerous free radicals were formed by the cleavage of bridge bonds, which existed in the coal structure [30]. At 600 °C, since there were enough free radicals in the co-pyrolysis process of coal and 20 wt% PVC, the tar yield was higher than it was under other co-pyrolysis conditions. Compared with the pyrolysis of raw coal, the content of tar components had changed during the co-pyrolysis of raw coal and PVC. The alkanes, olefins, and heterocyclic compounds increased by 9.9%, 1.7%, and 3.9%, respectively. The benzenes, phenols, and aromatic hydrocarbons decreased by 1.3%, 16.9%, and 0.8%, respectively. Therefore, the co-pyrolysis of coal and PVC increased the weight of pyrolysis tar at low temperatures and reduced the heavy component content of pyrolysis tar.

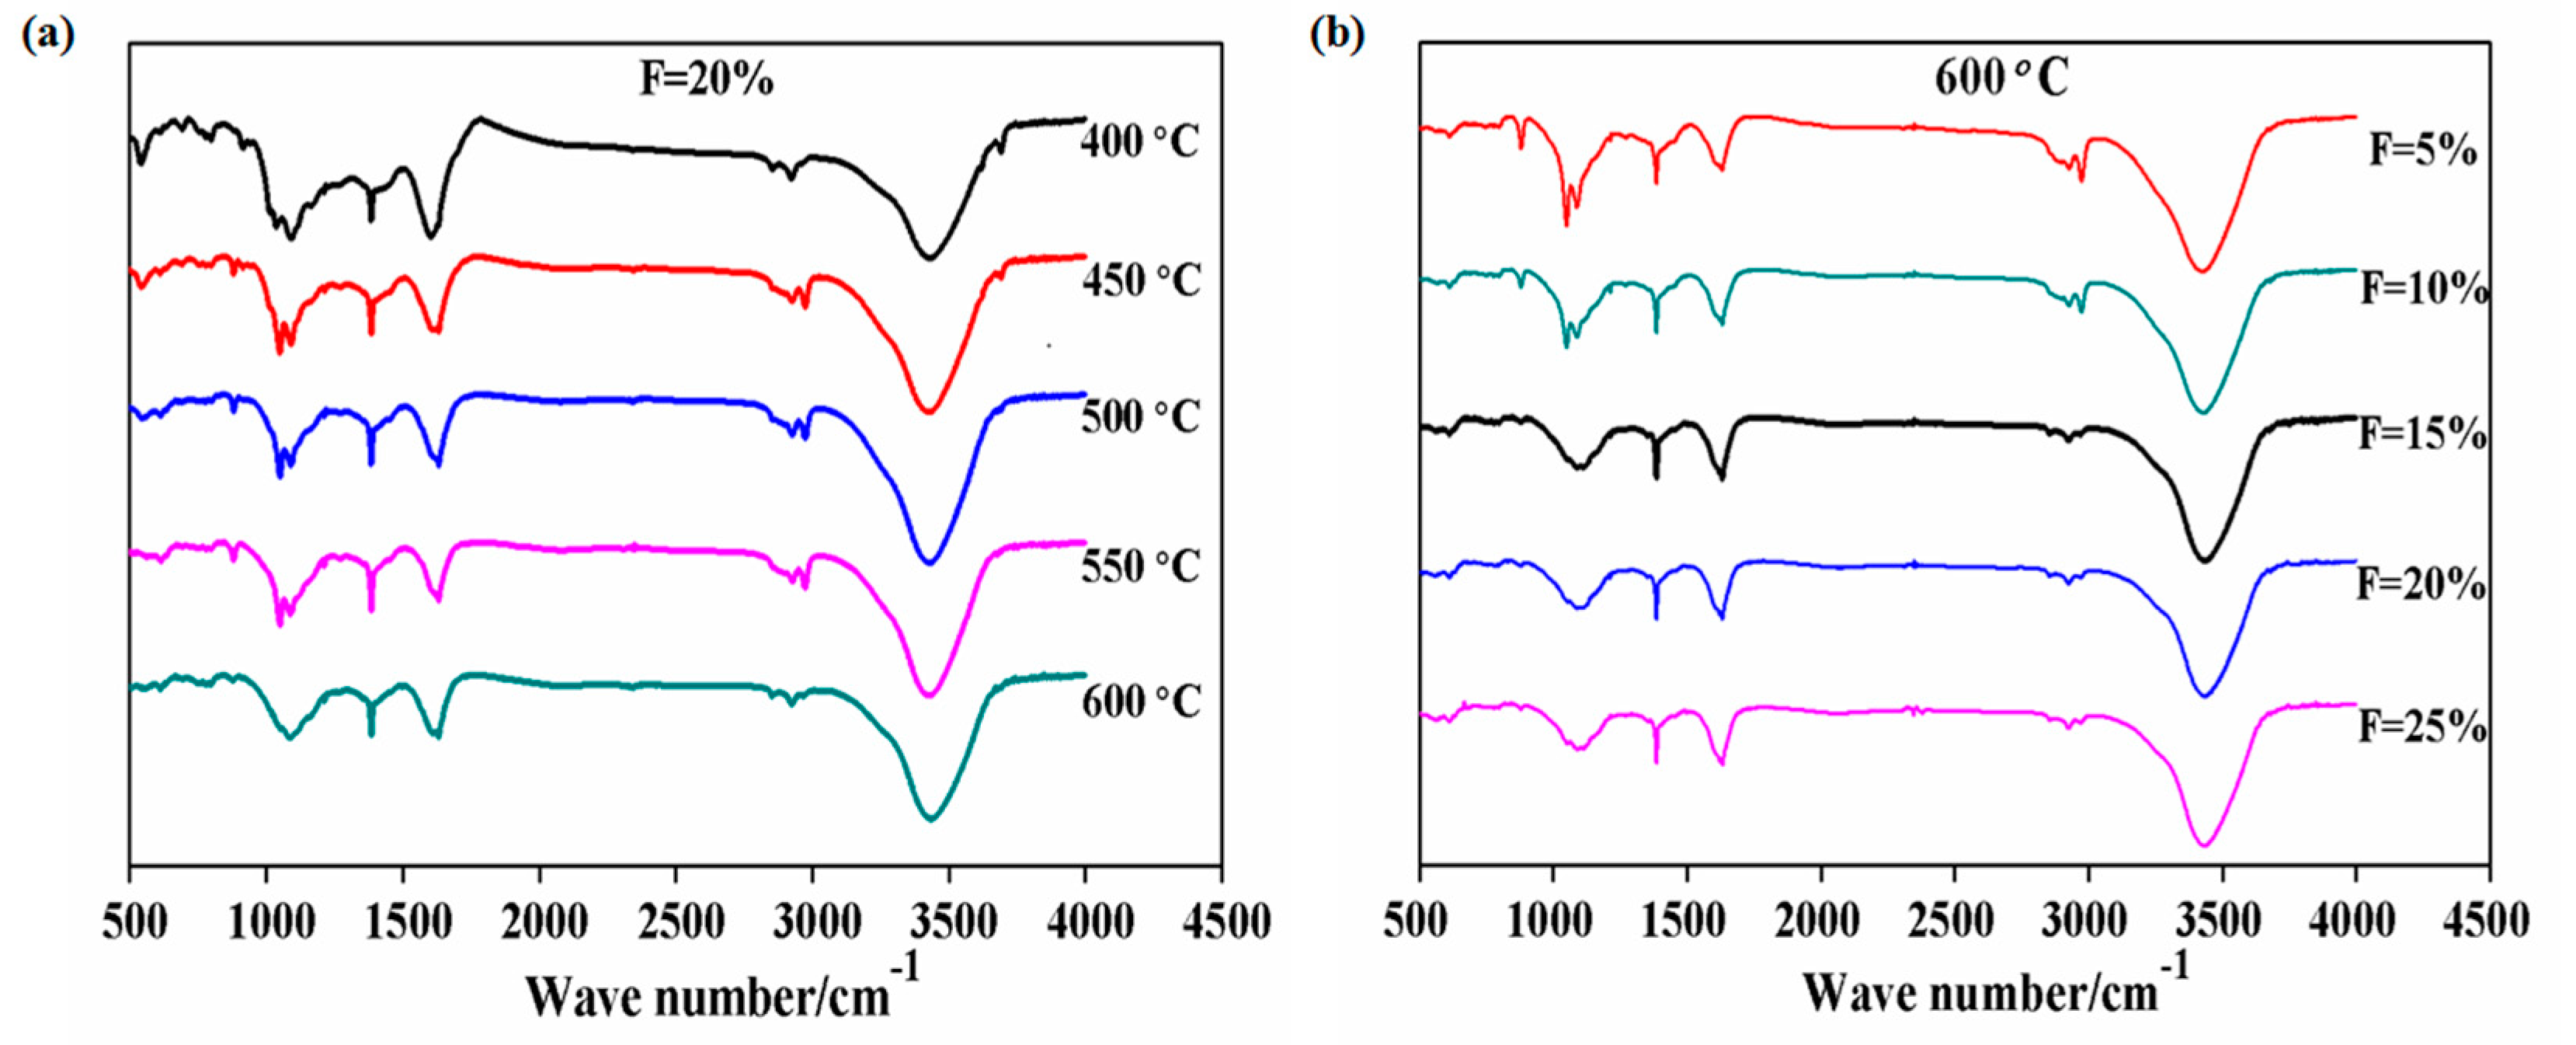
3.5. Effect of the PVC Additions on the Co-Pyrolysis Char

Figure 6 shows the FT-IR spectra of the co-pyrolysis product char at different terminal temperatures and PVC additions. As can be seen in Figure 6a, the PVC additions were 20 wt%, in the region of less than 800 cm−1, and the C-Cl functional group near 610 cm−1 and 690 cm−1 substantially disappeared after 500 °C. The absorption peaks of C-Cl functional groups at 610 cm−1 and 690 cm−1 are very weak and disappear after 500 °C, so chlorine mainly generates inorganic compounds. Other small peaks may represent the presence of ash in the coal and the partially substituted aromatic C-H structure. The absorption band of aliphatic hydrocarbons at 2800–3000 cm−1 gradually decreased with the increase of temperature. These oxygen-containing functional groups generated CO2 and CO during the cracking process. Therefore, the released amount of CO2 and CO increased with the increase of temperature. The hydroxylation peak on the surface of the substance near 1630 cm−1 did not change significantly, and the aromatic hydrocarbons gradually formed volatiles from the char. Figure 6b shows the char infrared spectrum of different PVC addition amounts at a terminal temperature of 600 °C. With the increase of PVC addition, the absorption peak of aromatic ether at 1036 cm−1 gradually disappeared. When PVC content was 15%, the absorption peak of aromatic ether disappeared at 1036 cm−1, and the absorption peak of aliphatic ether remained at 1092 cm−1. The C-H absorption band at 880 cm−1 gradually disappeared with the increase of PVC, which indicated it was bent in the plane to form free radicals and removed from the char. The absorption band of aliphatic hydrocarbons at 2800–3000 cm−1 gradually decreased with the increase of temperature, and the absorption peak at 1630 cm−1 also increased slightly. The aromatics at this point generated aromatic rings due to the vibration of the benzene-ring skeleton. The benzene was formed in the pyrolysis process of PVC. As the amount of added PVC increased, more aromatic rings were formed in the char.

3.6. Effect of Co-Pyrolysis on the Distribution of Chlorine

Compared with the content of chlorine in PVC, the content of chlorine in coal was extremely little, and because the effect on chlorine in the co-pyrolysis gas phase was slight, the addition amount of PVC was an important factor in affecting the chlorine content in the gas phase. The effects of different PVC additions on the chlorine content in the gas phase are shown in Figure 4f. After the pyrolysis temperature of PVC reached 450 °C, the chlorine content in the gas phase remained unchanged. With the increase of pyrolysis temperature, the dechlorination amount reached 91%, and the dechlorination reaction was completed. The dechlorination reaction of PVC was a free radical chain reaction with low initial activation energy and occurred at lower temperature conditions. The binding energy of the C-Cl bond in the PVC structure was lower than that of the C-C and C-H bonds, which indicated that the chlorine bond was broken first, thereby starting the thermal degradation of PVC. The content of chlorine in the gas phase during the co-pyrolysis process of coal and PVC was less than that of the chlorine released during the pyrolysis of PVC alone, and it increased first but then decreased with the increase of temperature. After the temperature reached 500 °C, the chlorine in the gas phase began to decrease. At 600 °C, the amount of PVC added was 20 wt%. The amount of chlorine reduction in the gas phase was the largest, which indicated that the addition of coal not only reduced the distribution of chlorine in the gas phase but also increased the dechlorination temperature of PVC.
In order to explore the effect of metal elements on the migration and transformation of chlorine in coal samples, as shown in Table 5, XRF technology was used to analyze the content of metal oxides and chlorine in char. With the increase of PVC addition, the content of some alkaline metal oxides, such as Al2O3, MgO, Na2O, K2O, and CaO in the coal, gradually decreased, and the content of the chlorine element increased significantly. The reduction of the alkaline metal compound may be related to the chlorine element, whereby the char was subjected to XRD analysis. Figure 7 shows the presence of metal chloride in the pyrolysis char after the addition of PVC. The metal compound reacted with the chlorine element released in the PVC and formed metal chloride, including CaCl2, FeCl3, FeCl2, NaCl, MgCl2, KCl, and AlCl3. In the co-pyrolysis reaction of coal and PVC, chlorine was fixed in the char, thereby reducing the distribution of chlorine in the gas phase.

4. Conclusions

  • The study of the co-pyrolysis products distribution characteristics showed that the addition of PVC had a significant increasing effect on the tar yield and an inhibitory effect on the release of gas by comparing the actual value of the pyrolysis product yield with the theoretical value. At 600 °C, the tar yield was the highest with 20 wt% PVC additions, reaching 21.3%. The gas-phase composition analysis showed that the release amount of CO2 and CO decreased and that the release amount of CH4, C2H4, and C2H6 increased significantly when PVC was added. In particular, the maximum increase of CH4 could reach 8.33 mL/g at 600 °C. The content of tar components changed greatly during the co-pyrolysis of raw coal and PVC. Compared with raw coal pyrolysis, the alkanes, olefins, and heterocyclic compounds increased by 6.9%, 1.7%, and 10.9%, respectively.
  • By analyzing the migration law of chlorine under different pyrolysis temperature and PVC additions, we identified that the content of chlorine in the gas phase increased first and then decreased with increasing pyrolysis temperature. At a terminal temperature of 600 °C, the chlorine in the gas phase began to decrease. At the same time, the chlorine in the PVC reacted with the metal oxide to form the metal chloride, such that the chlorine was fixed in the solid-phase product.

Author Contributions

Writing—original draft preparation, H.F.; editing, M.R. and C.F.; review, Y.J.; supervision, Y.B.; project administration, Q.M. All authors have read and agreed to the published version of the manuscript.

Funding

This research was funded by [the Natural Science Foundation of Ningxia] grant number [2021AAC03063], [the National Natural Science Foundation of China] grant number [21968024], and [Jiangsu Natural Science Foundation] grant number [BK20210621].

Conflicts of Interest

The authors declare no conflict of interest.

References

  1. Geyer, R.; Jambeck, J.R.; Law, K.L. Production, use, and fate of all plastics ever made. Sci. Adv. 2017, 3, e1700782. [Google Scholar] [CrossRef] [PubMed] [Green Version]
  2. Garcia, J.M.; Robertson, M.L. The future of plastics recycling. Science 2017, 358, 870–872. [Google Scholar] [CrossRef] [PubMed]
  3. Choi, J.; Kim, O.; Kwak, S.-Y. Suppression of Dioxin Emission in Co-Incineration of Poly(vinyl Chloride) with TiO2-Encapsulating Polystyrene. Environ. Sci. Technol. 2007, 41, 5833–5838. [Google Scholar] [CrossRef] [PubMed]
  4. Zhou, C.; Fang, W.; Xu, W.; Cao, A.; Wang, R. Characteristics and the recovery potential of plastic wastes obtained from landfill mining. J. Clean. Prod. 2014, 80, 80–86. [Google Scholar] [CrossRef]
  5. Park, K.C.; Tomiyasu, H. Gasification reaction of organic compounds catalyzed by RuO2 in supercritical water. Chem. Commun. 2003, 6, 694–695. [Google Scholar] [CrossRef]
  6. Yu, J.; Sun, L.; Ma, C.; Qiao, Y.; Yao, H. Thermal degradation of PVC: A review. Waste Manag. 2015, 48, 300–314. [Google Scholar] [CrossRef]
  7. Czégény, Z.; Jakab, E.; Bozi, J.; Blazsó, M. Pyrolysis of wood–PVC mixtures. Formation of chloromethane from lignocellulosic materials in the presence of PVC. J. Anal. Appl. Pyrolysis 2015, 113, 123–132. [Google Scholar] [CrossRef] [Green Version]
  8. Özsin, G.; Pütün, A.E. TGA/MS/FT-IR study for kinetic evaluation and evolved gas analysis of a biomass/PVC co-pyrolysis process. Energy Convers. Manag. 2019, 182, 143–153. [Google Scholar] [CrossRef]
  9. Chen, B.; Wei, X.-Y.; Zong, Z.-M.; Yang, Z.-S.; Qing, Y.; Liu, C. Difference in chemical composition of supercritical methanolysis products between two lignites. Appl. Energy 2011, 88, 4570–4576. [Google Scholar] [CrossRef]
  10. Jangam, S.V.; Karthikeyan, M.; Mujumdar, A.S. A Critical Assessment of Industrial Coal Drying Technologies: Role of Energy, Emissions, Risk and Sustainability. Dry. Technol. 2011, 29, 395–407. [Google Scholar] [CrossRef]
  11. Zhou, L.; Luo, T.; Huang, Q. Co-pyrolysis characteristics and kinetics of coal and plastic blends. Energy Convers. Manag. 2009, 50, 705–710. [Google Scholar] [CrossRef]
  12. Nabeel, A.; Alam Khan, T.; Sharma, D.K. Non-isothermal Kinetic Studies of Co-combustion and Co-cracking of Coal and Plastic Blends Using Thermogravimetric Analysis. Energy Sources Part A Recovery Util. Environ. Eff. 2009, 31, 722–732. [Google Scholar] [CrossRef]
  13. Hussain, Z.; Khan, K.M.; Basheer, N.; Hussain, K. Co-liquefaction of Makarwal coal and waste polystyrene by microwave–metal interaction pyrolysis in copper coil reactor. J. Anal. Appl. Pyrolysis 2010, 90, 53–55. [Google Scholar] [CrossRef]
  14. Cai, J.; Wang, Y.; Zhou, L.; Huang, Q. Thermogravimetric analysis and kinetics of coal/plastic blends during co-pyrolysis in nitrogen atmosphere. Fuel Process. Technol. 2008, 89, 21–27. [Google Scholar] [CrossRef]
  15. Sharma, S.; Ghoshal, A.K. Study of kinetics of co-pyrolysis of coal and waste LDPE blends under argon atmosphere. Fuel 2010, 89, 3943–3951. [Google Scholar] [CrossRef]
  16. Meng, H.; Wang, S.; Chen, L.; Wu, Z.; Zhao, J. Investigation on Synergistic Effects and Char Morphology during Co-pyrolysis of Poly(vinyl chloride) Blended with Different Rank Coals from Northern China. Energy Fuels 2015, 29, 6645–6655. [Google Scholar] [CrossRef]
  17. Ahmed, O.H.; Altarawneh, M. Catalytic de-chlorination of products from PVC degradation by magnetite (Fe3O4). Appl. Surf. Sci. 2019, 480, 792–801. [Google Scholar] [CrossRef]
  18. López, A.; de Marco, I.; Caballero, B.; Adrados, A.; Laresgoiti, M. Deactivation and regeneration of ZSM-5 zeolite in catalytic pyrolysis of plastic wastes. Waste Manag. 2011, 31, 1852–1858. [Google Scholar] [CrossRef]
  19. Kakuta, Y.; Hirano, K.; Sugano, M.; Mashimo, K. Study on chlorine removal from mixture of waste plastics. Waste Manag. 2008, 28, 615–621. [Google Scholar] [CrossRef]
  20. Khoshnoud, P.; Abu-Zahra, N. Kinetics of thermal decomposition of PVC/fly ash composites. Int. J. Polym. Anal. Charact. 2017, 23, 170–180. [Google Scholar] [CrossRef]
  21. Aguado, J.; Serrano, D.P.; Escola, J.M. Fuels from Waste Plastics by Thermal and Catalytic Processes: A Review. Ind. Eng. Chem. Res. 2008, 47, 7982–7992. [Google Scholar] [CrossRef]
  22. Jiménez, A.; Iannoni, A.; Torre, L.; Kenny, J.M. Kinetic Modeling of the Thermal Degradation of Stabilized PVC Plastisols. J. Therm. Anal. 2000, 61, 483–491. [Google Scholar] [CrossRef]
  23. Wang, Q.; Zhang, J.; Wang, G.; Wang, H.; Sun, M.M. Thermal and Kinetic Analysis of Coal with Different Waste Plastics (PVC) in Cocombustion. Energy Fuels 2018, 32, 2145–2155. [Google Scholar] [CrossRef]
  24. Poerschmann, J.; Weiner, B.; Woszidlo, S.; Koehler, R.; Kopinke, F.-D. Hydrothermal carbonization of poly(vinyl chloride). Chemosphere 2015, 119, 682–689. [Google Scholar] [CrossRef] [PubMed]
  25. Kawashima, H.; Yamashita, Y.; Saito, I. Studies on structural changes of coal density-separated components during pyrolysis by means of solid-state 13C NMR spectra. J. Anal. Appl. Pyrolysis 2000, 53, 35–50. [Google Scholar] [CrossRef]
  26. Liu, Y.; Hodek, W.; Van Heek, K.H. Characterization of tar, char and gas from pyrolysis of coal asphaltenes. Fuel 1998, 77, 1099–1105. [Google Scholar] [CrossRef]
  27. Kaminsky, W.; Kim, J.-S. Pyrolysis of mixed plastics into aromatics. J. Anal. Appl. Pyrolysis 1999, 51, 127–134. [Google Scholar] [CrossRef]
  28. Uddin, M.A.; Sakata, Y.; Shiraga, Y.; Muto, A.A.; Murata, K. Dechlorination of Chlorine Compounds in Poly(vinyl chloride) Mixed Plastics Derived Oil by Solid Sorbents. Ind. Eng. Chem. Res. 1999, 38, 1406–1410. [Google Scholar] [CrossRef]
  29. Saito, K.; Narita, H. Studies on the dechlorination and oil-production technology of waste plastics. J. Mater. Cycles Waste Manag. 2001, 3, 93–98. [Google Scholar]
  30. Solomon, P.; Fletcher, T.; Pugmire, R. Progress in coal pyrolysis. Fuel 1993, 72, 587–597. [Google Scholar] [CrossRef]
Figure 1. Schematic diagram of the experimental apparatus of the pyrolysis system. 1: nitrogen bottle; 2: tube furnace; 3: quartz tube; 4: condensing unit; 5: hydrogen–chloride absorption bottle; 6: gas flowmeter; 7: dryer; 8: gas bag.
Energies 15 03377 g001
Figure 2. TG and DTG curves of HLE pyrolysis with different PVC additions. (a) TG, (b) DTG.
Energies 15 03377 g002
Figure 3. The yield of the pyrolysis products (a) char, (b) tar, and (c) gas.
Energies 15 03377 g003
Figure 4. (a) CO2, (b) CO, (c) CH4, (d) C2H4, and (e) C2H6 release amount of pyrolysis with different PVC additions. (f) HCl release amount of pyrolysis with different PVC additions.
Energies 15 03377 g004
Figure 5. The content of pyrolysis tar components.
Energies 15 03377 g005
Figure 6. The FT-IR spectra of the co-pyrolysis product char. (a) different terminal temperatures, (b) different PVC additions.
Energies 15 03377 g006
Figure 7. XRD pattern of the char at 600 °C.
Energies 15 03377 g007
Table 1. Proximate and ultimate analyses of the coal sample and PVC.
SampleProximate Analysis wt% Ultimate Analysis wt%, daf
MadAadVdafFCadCHO *NSCl
Coal6.9316.2042.9933.8870.954.2723.590.790.290.11
PVC0.020.0599.460.4737.894.691.6255.8
Note: ad, air-dried basis; daf, dry and ash-free basis; —, not detected; *, by difference.
Table 2. Chemical composition of the coal and PVC ash.
Ash Chemical Composition (wt%)
Al2O3MgONa2OSiO2P2O5SO3K2OTiO2Fe2O3CaOClOthers
Coal6.947.0346.8017.101.423.490.730.816.907.300.540.94
PVC
Note: —, not detected.
Table 3. Petrographic analysis and vitrinite reflectivity of Hailar coal (HLE).
SamplePetrographic Analysis (vol%) Rmax
VitriniteInertiniteExiniteMinerals
Coal70.422.11.85.70.986
Table 4. Actual and theoretical difference in pyrolysis product yield at different temperatures and PVC additions.
ProductsT (°C)PVC Addition (wt, d)
5%10%15%20%25%
char400−0.06−0.030.160.100.54
450−2.54−2.19−1.35−0.27−0.83
5000.420.542.311.425.26
550−0.200.391.041.411.58
6002.271.381.451.981.85
tar4003.713.383.046.164.23
4501.645.113.073.733.88
5002.403.803.933.792.43
5502.153.264.573.764.10
6003.894.534.184.714.67
gas400−3.65−3.35−3.20−6.25−4.78
4500.89−2.86−1.72−3.46−3.06
500−2.82−4.33−5.24−5.21−6.69
550−2.95−4.14−5.61−5.17−5.68
600−5.21−5.91−5.63−6.69−6.52
Table 5. Content of chemical compounds and chlorine in the char.
SpeciesPVC Addition (wt, d)
0%5%10%15%20%25%
Al2O36.947.417.016.626.316.22
MgO7.035.655.425.045.555.28
Na2O46.8044.5040.7039.5039.1036.20
CeO20.200.100.120.110.130.11
La2O30.130.120.110.100.980.82
SiO217.1018.4018.3018.1018.0017.80
SO33.492.482.312.302.252.14
K2O0.730.720.700.690.670.67
TiO20.810.650.710.670.710.69
Fe2O36.907.817.697.067.737.14
MnO0.240.280.270.260.270.26
CaO7.306.666.686.286.166.00
Cl0.543.604.384.685.436.22
Publisher’s Note: MDPI stays neutral with regard to jurisdictional claims in published maps and institutional affiliations.

