
Experimental Investigation on Solar–Thermal Conversion and Migration Characteristics of Nanofluids


Abstract
:1. Introduction
2. Synthesis of Nanofluids
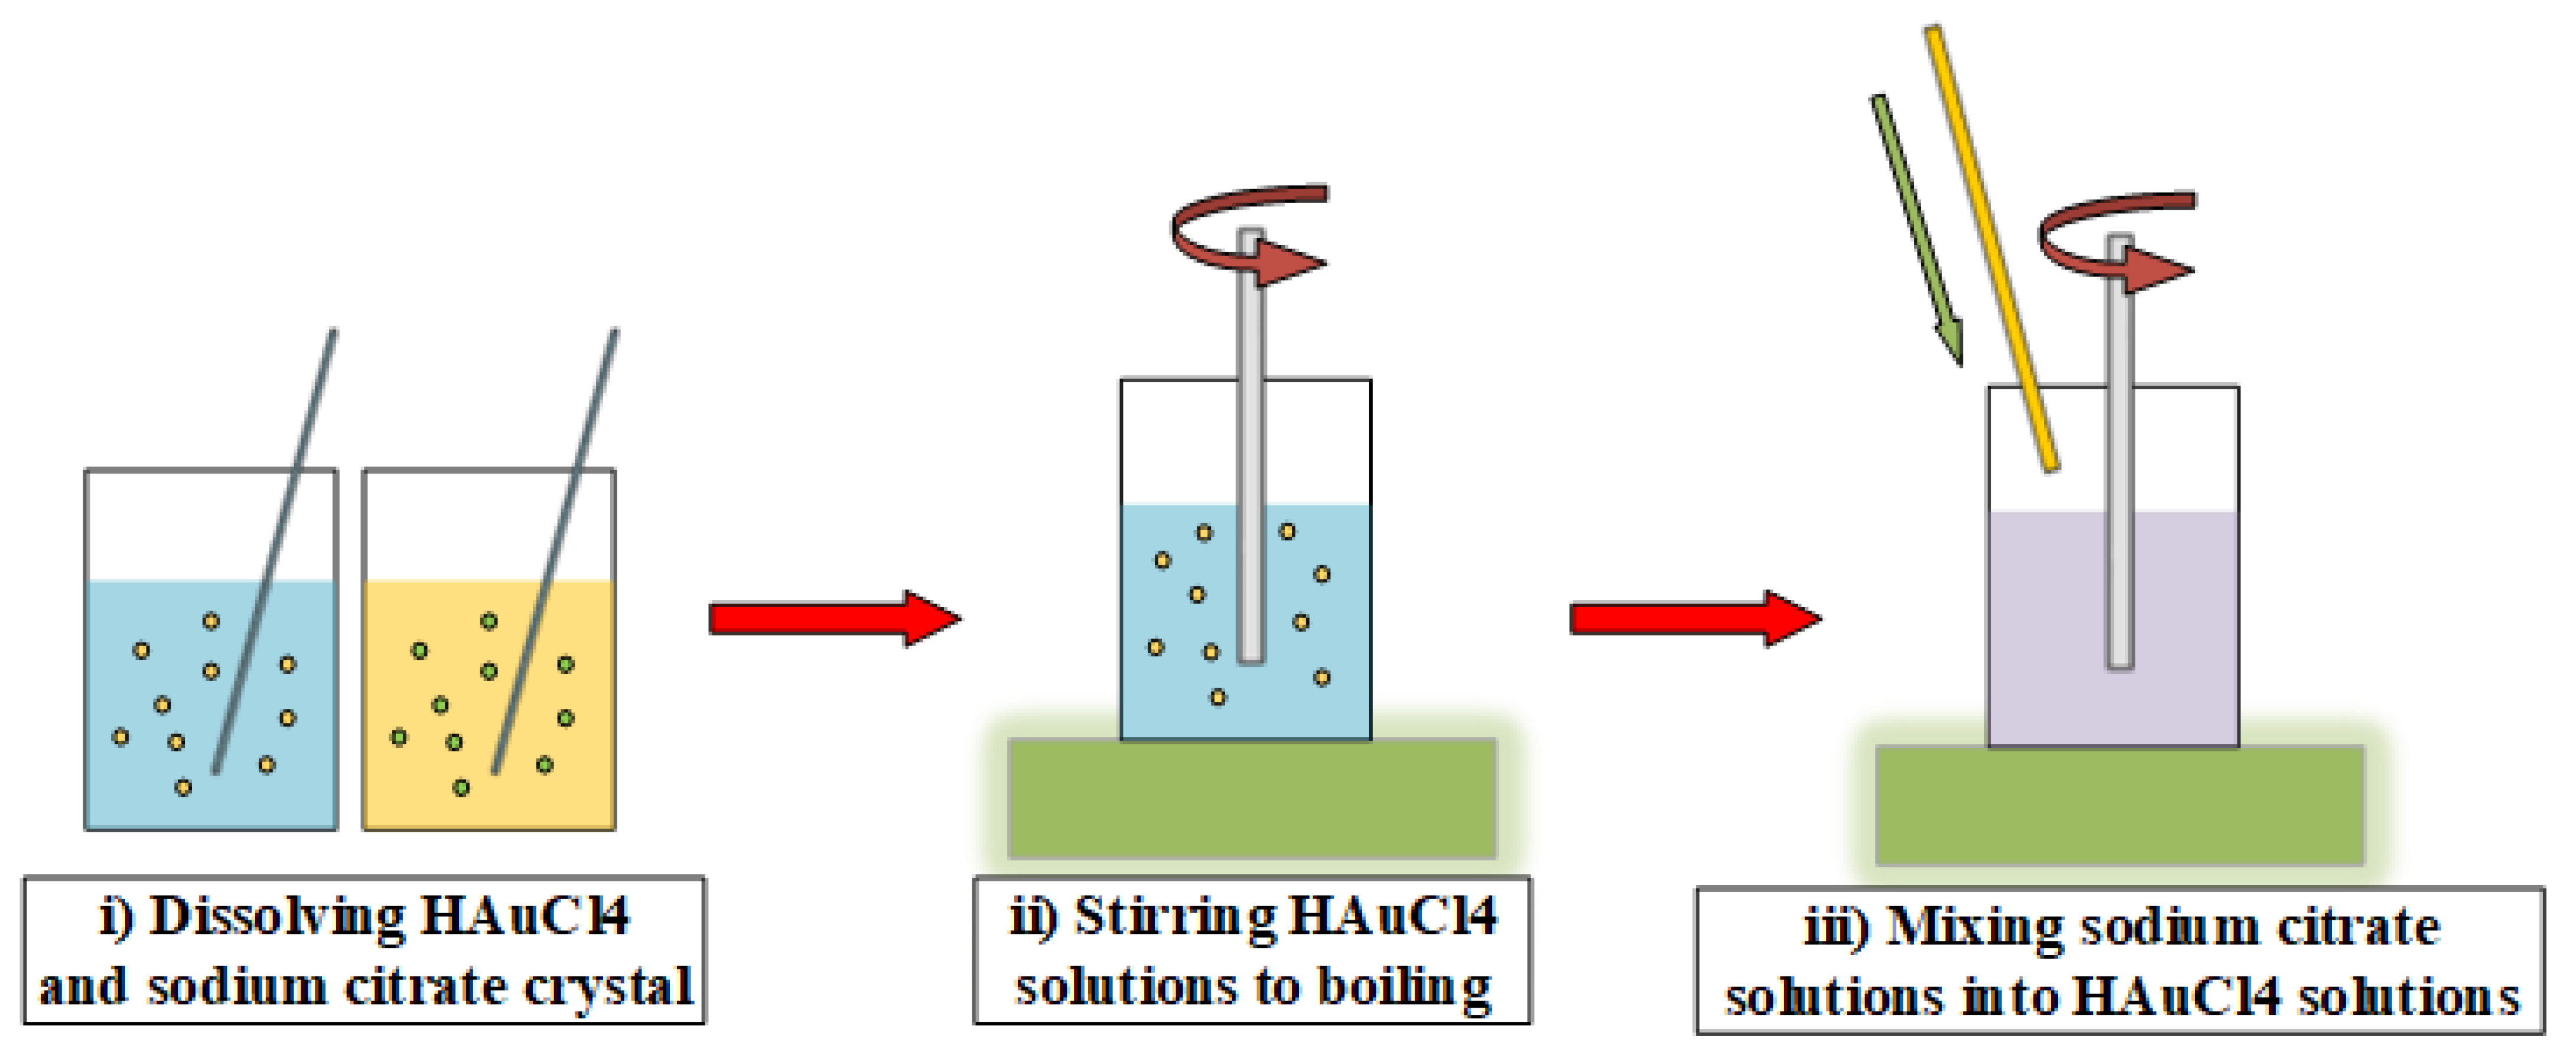
2.1. One-Step Method
2.2. Two-Step Method
3. Experimental Setup
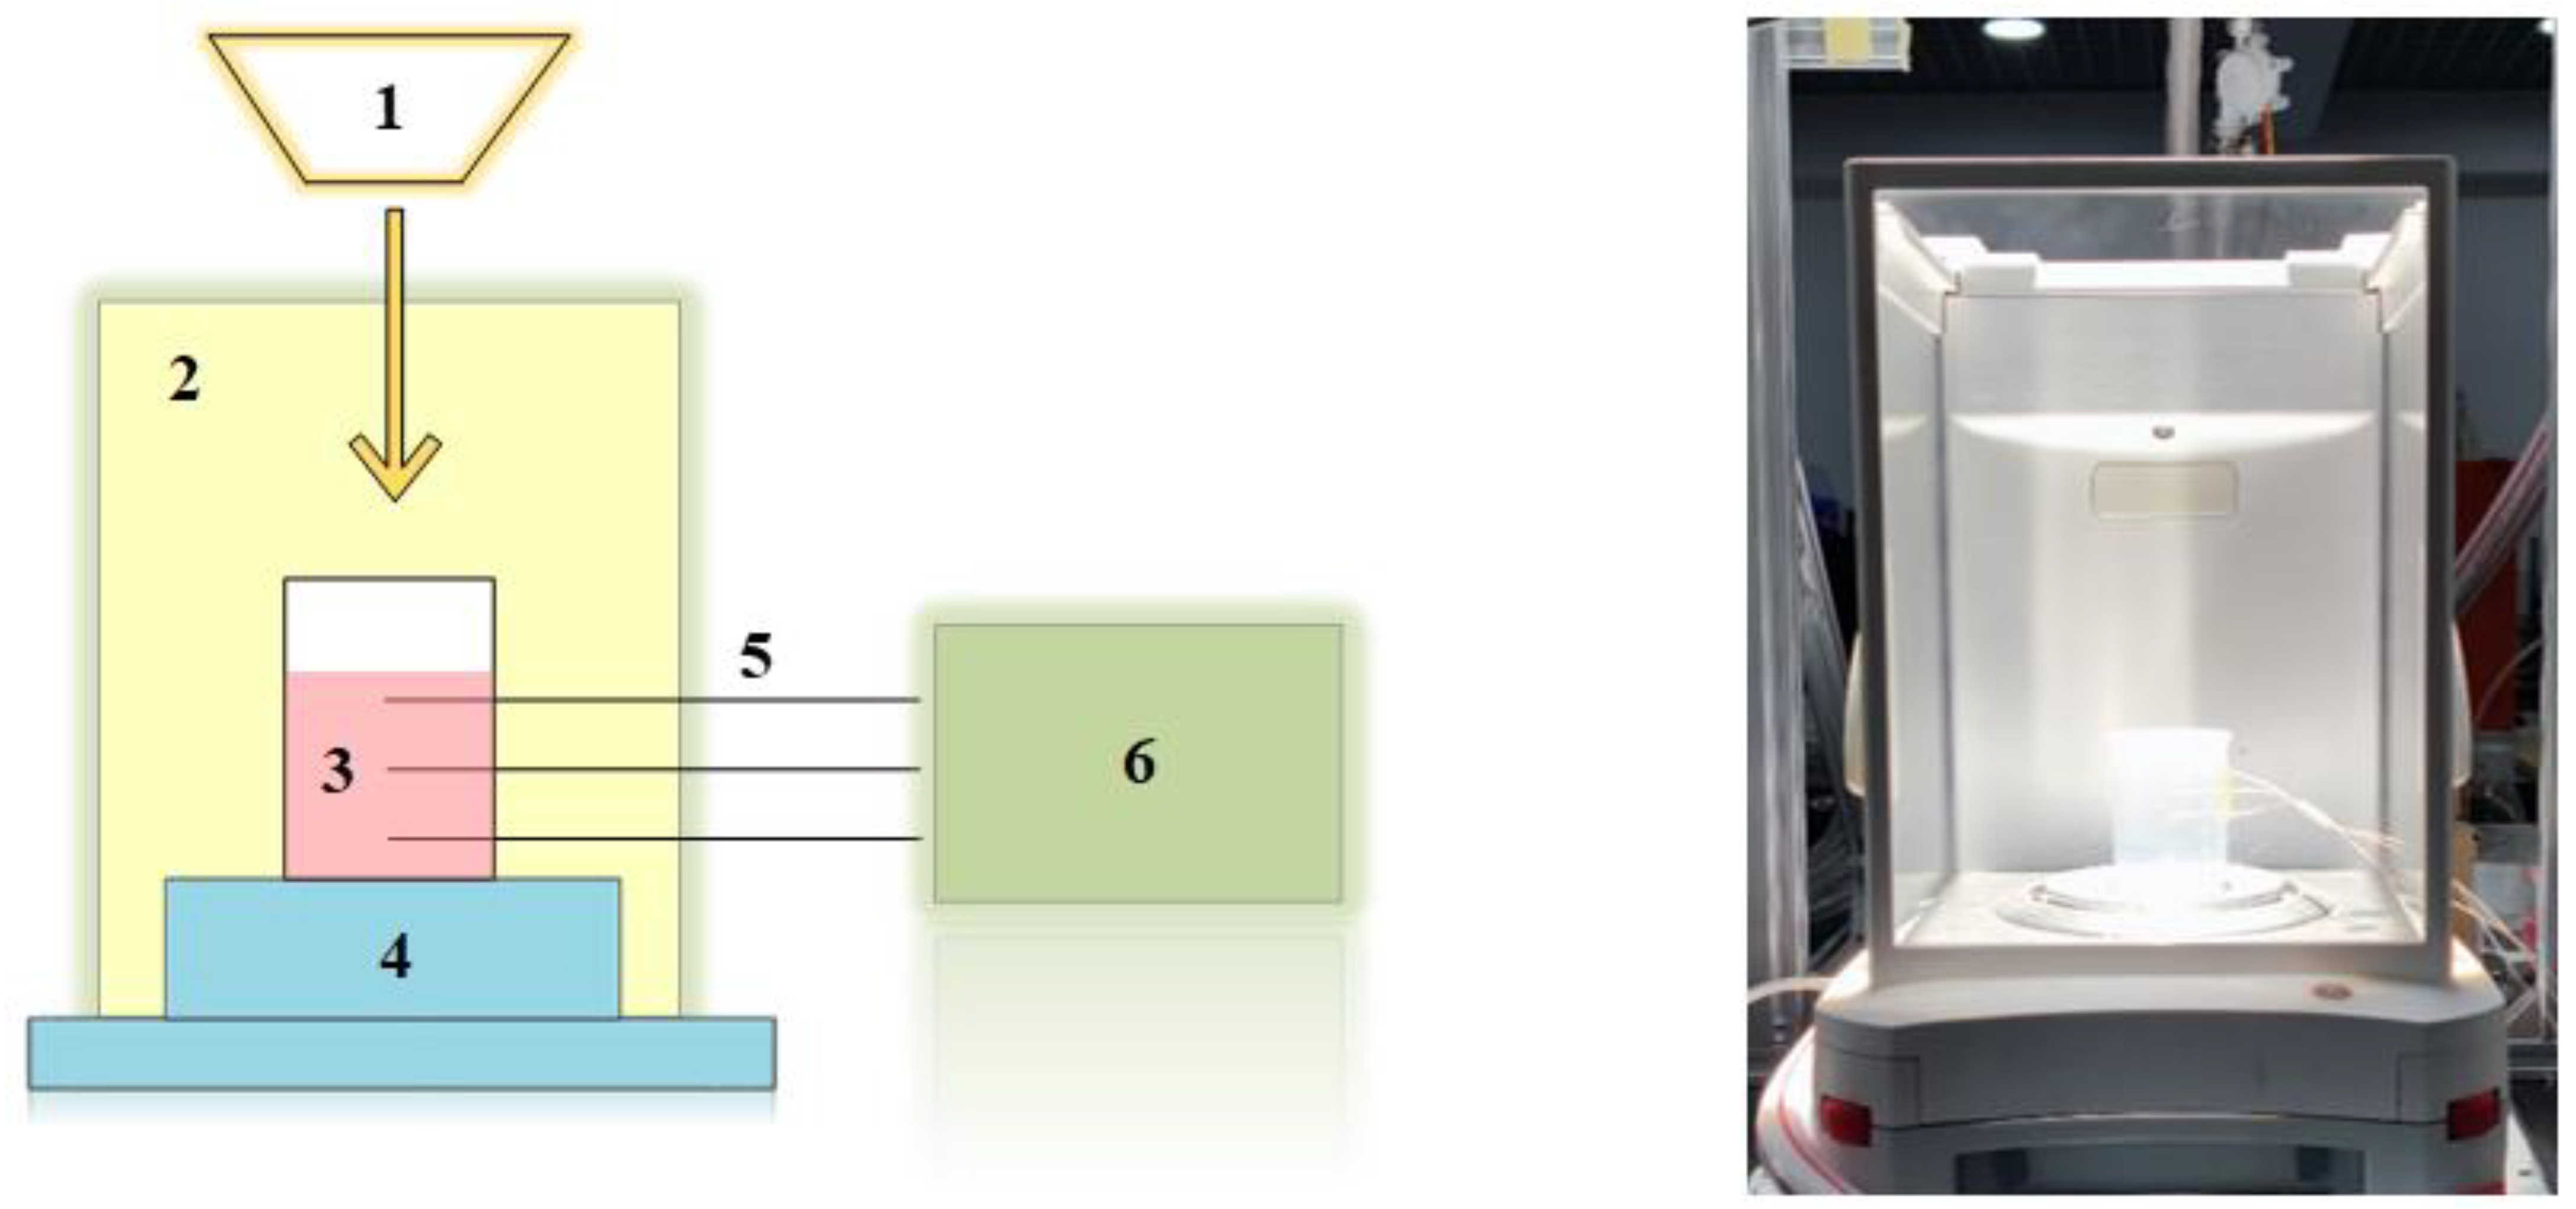
3.1. Experimental Setup for Solar–Thermal Conversion Characteristics of Nanoparticles
3.2. Experimental Setup for Migration Characteristics of Nanoparticles
4. Results and Discussion
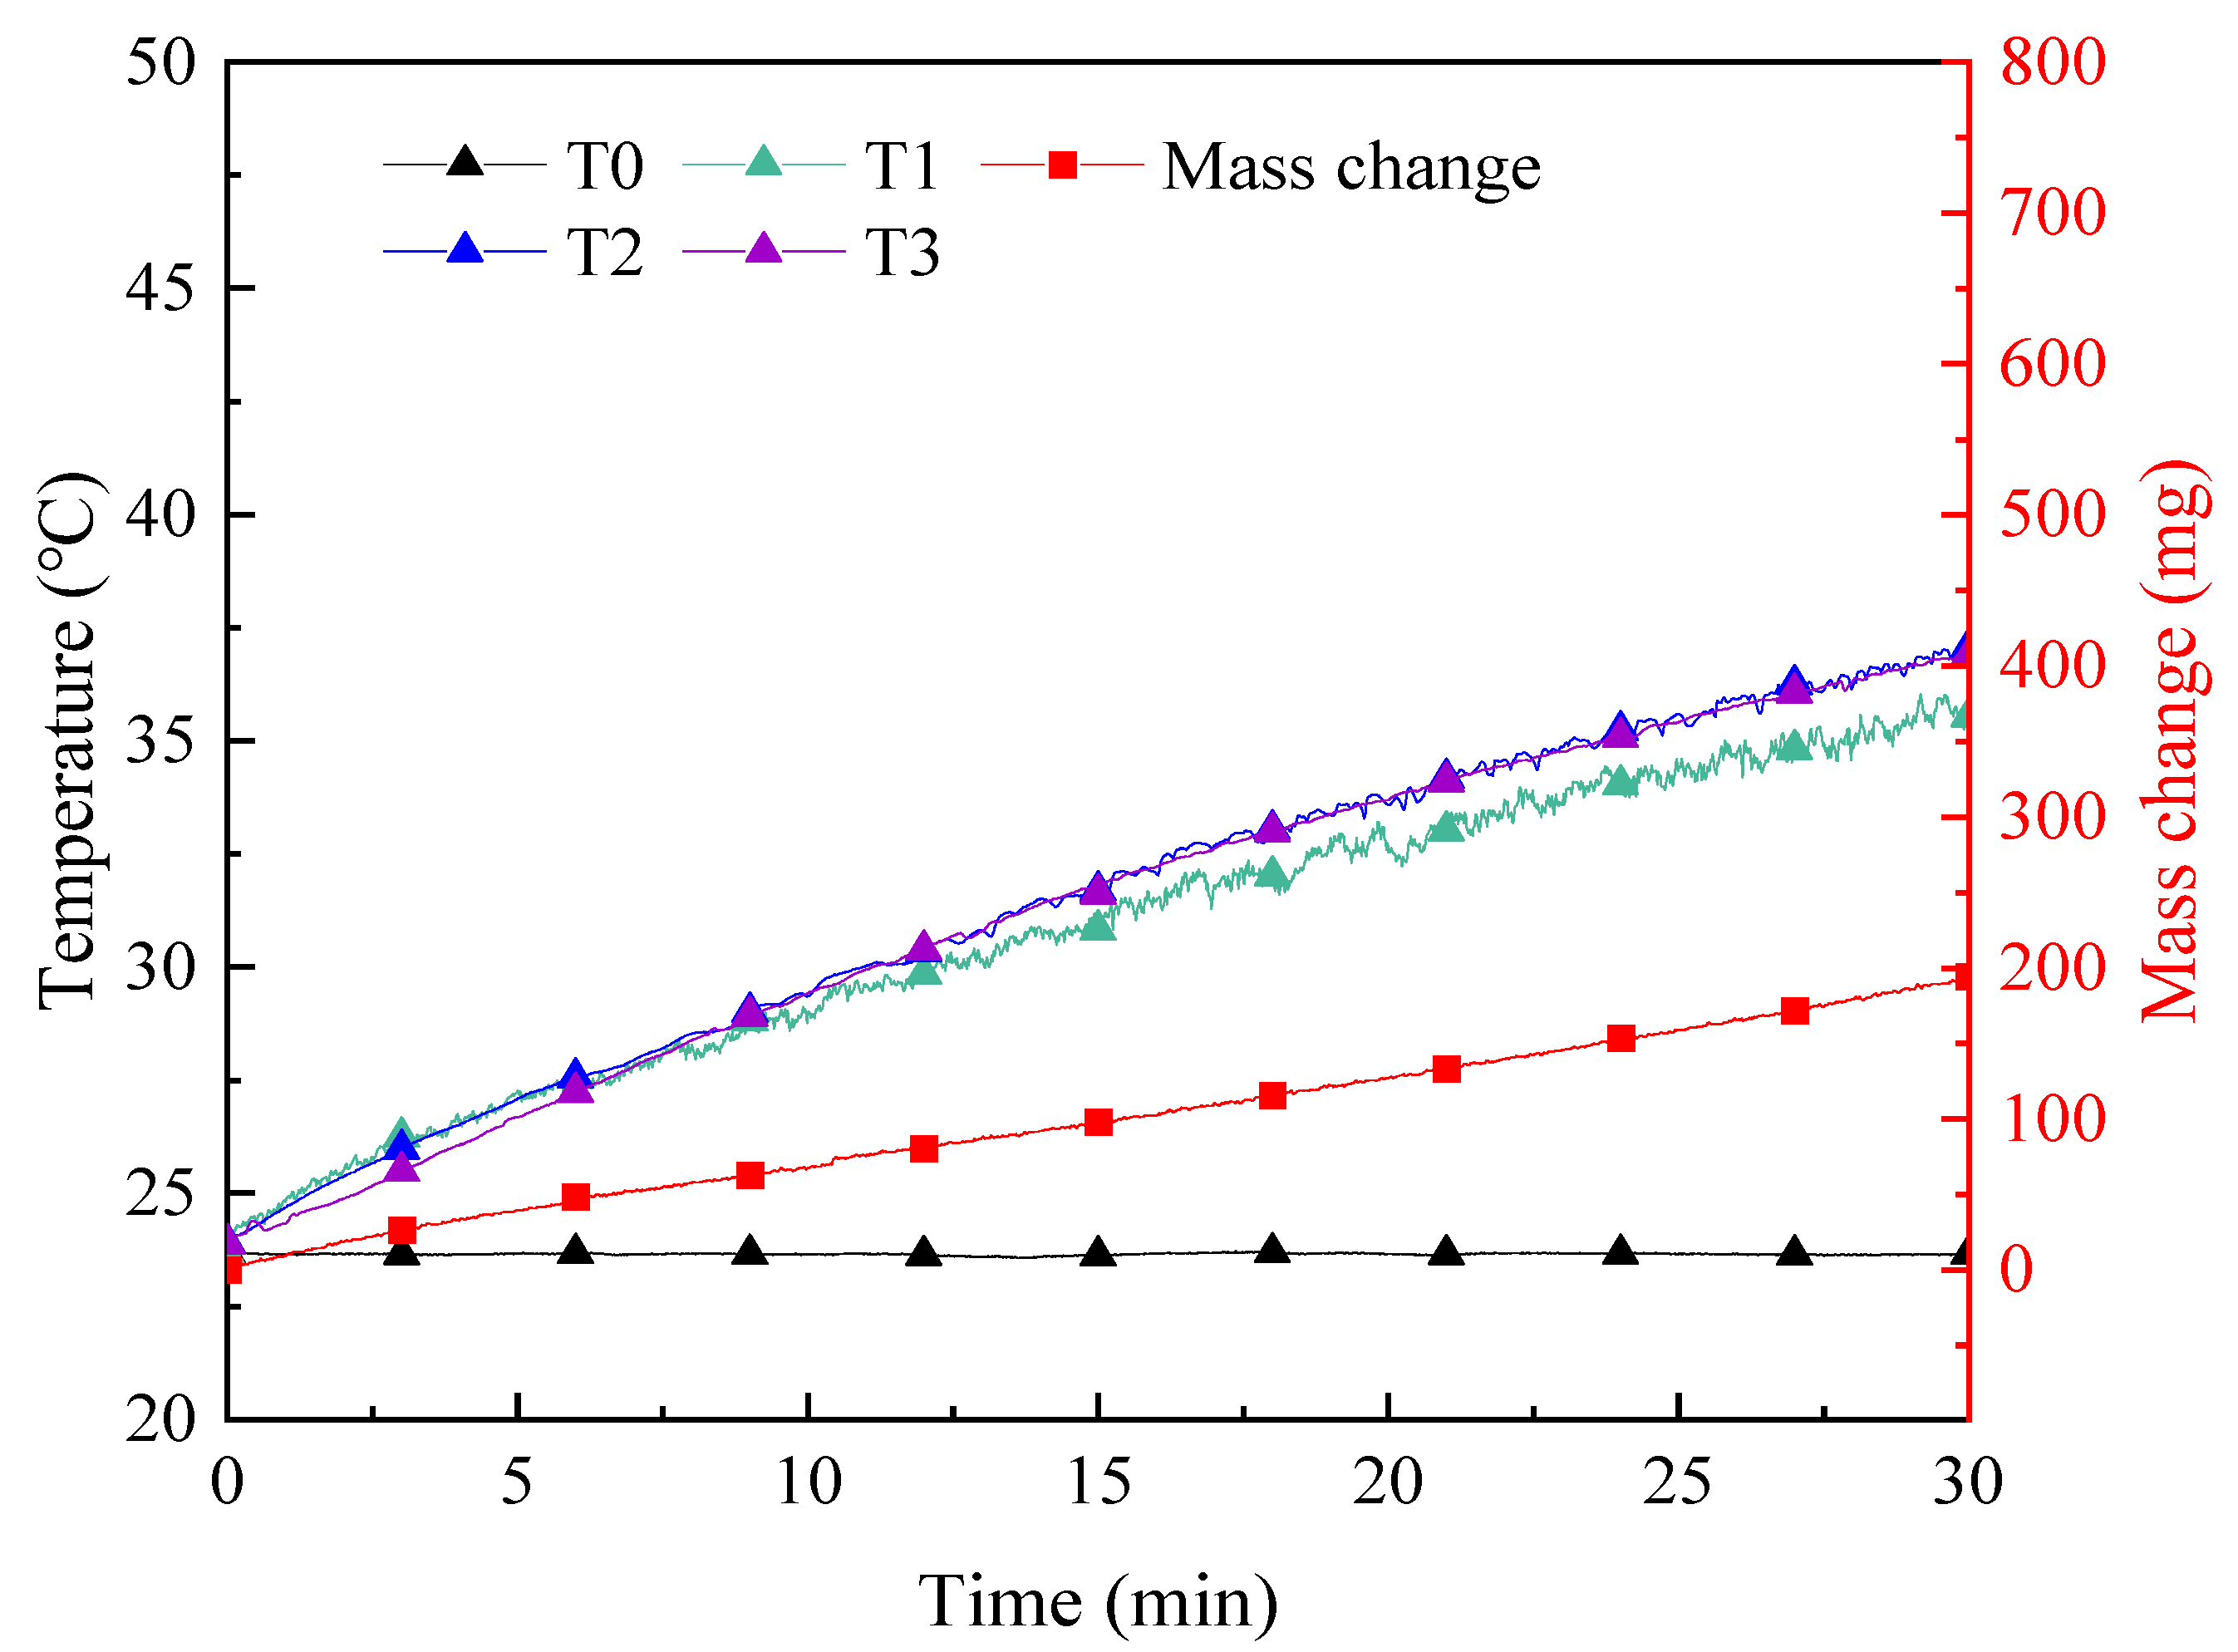
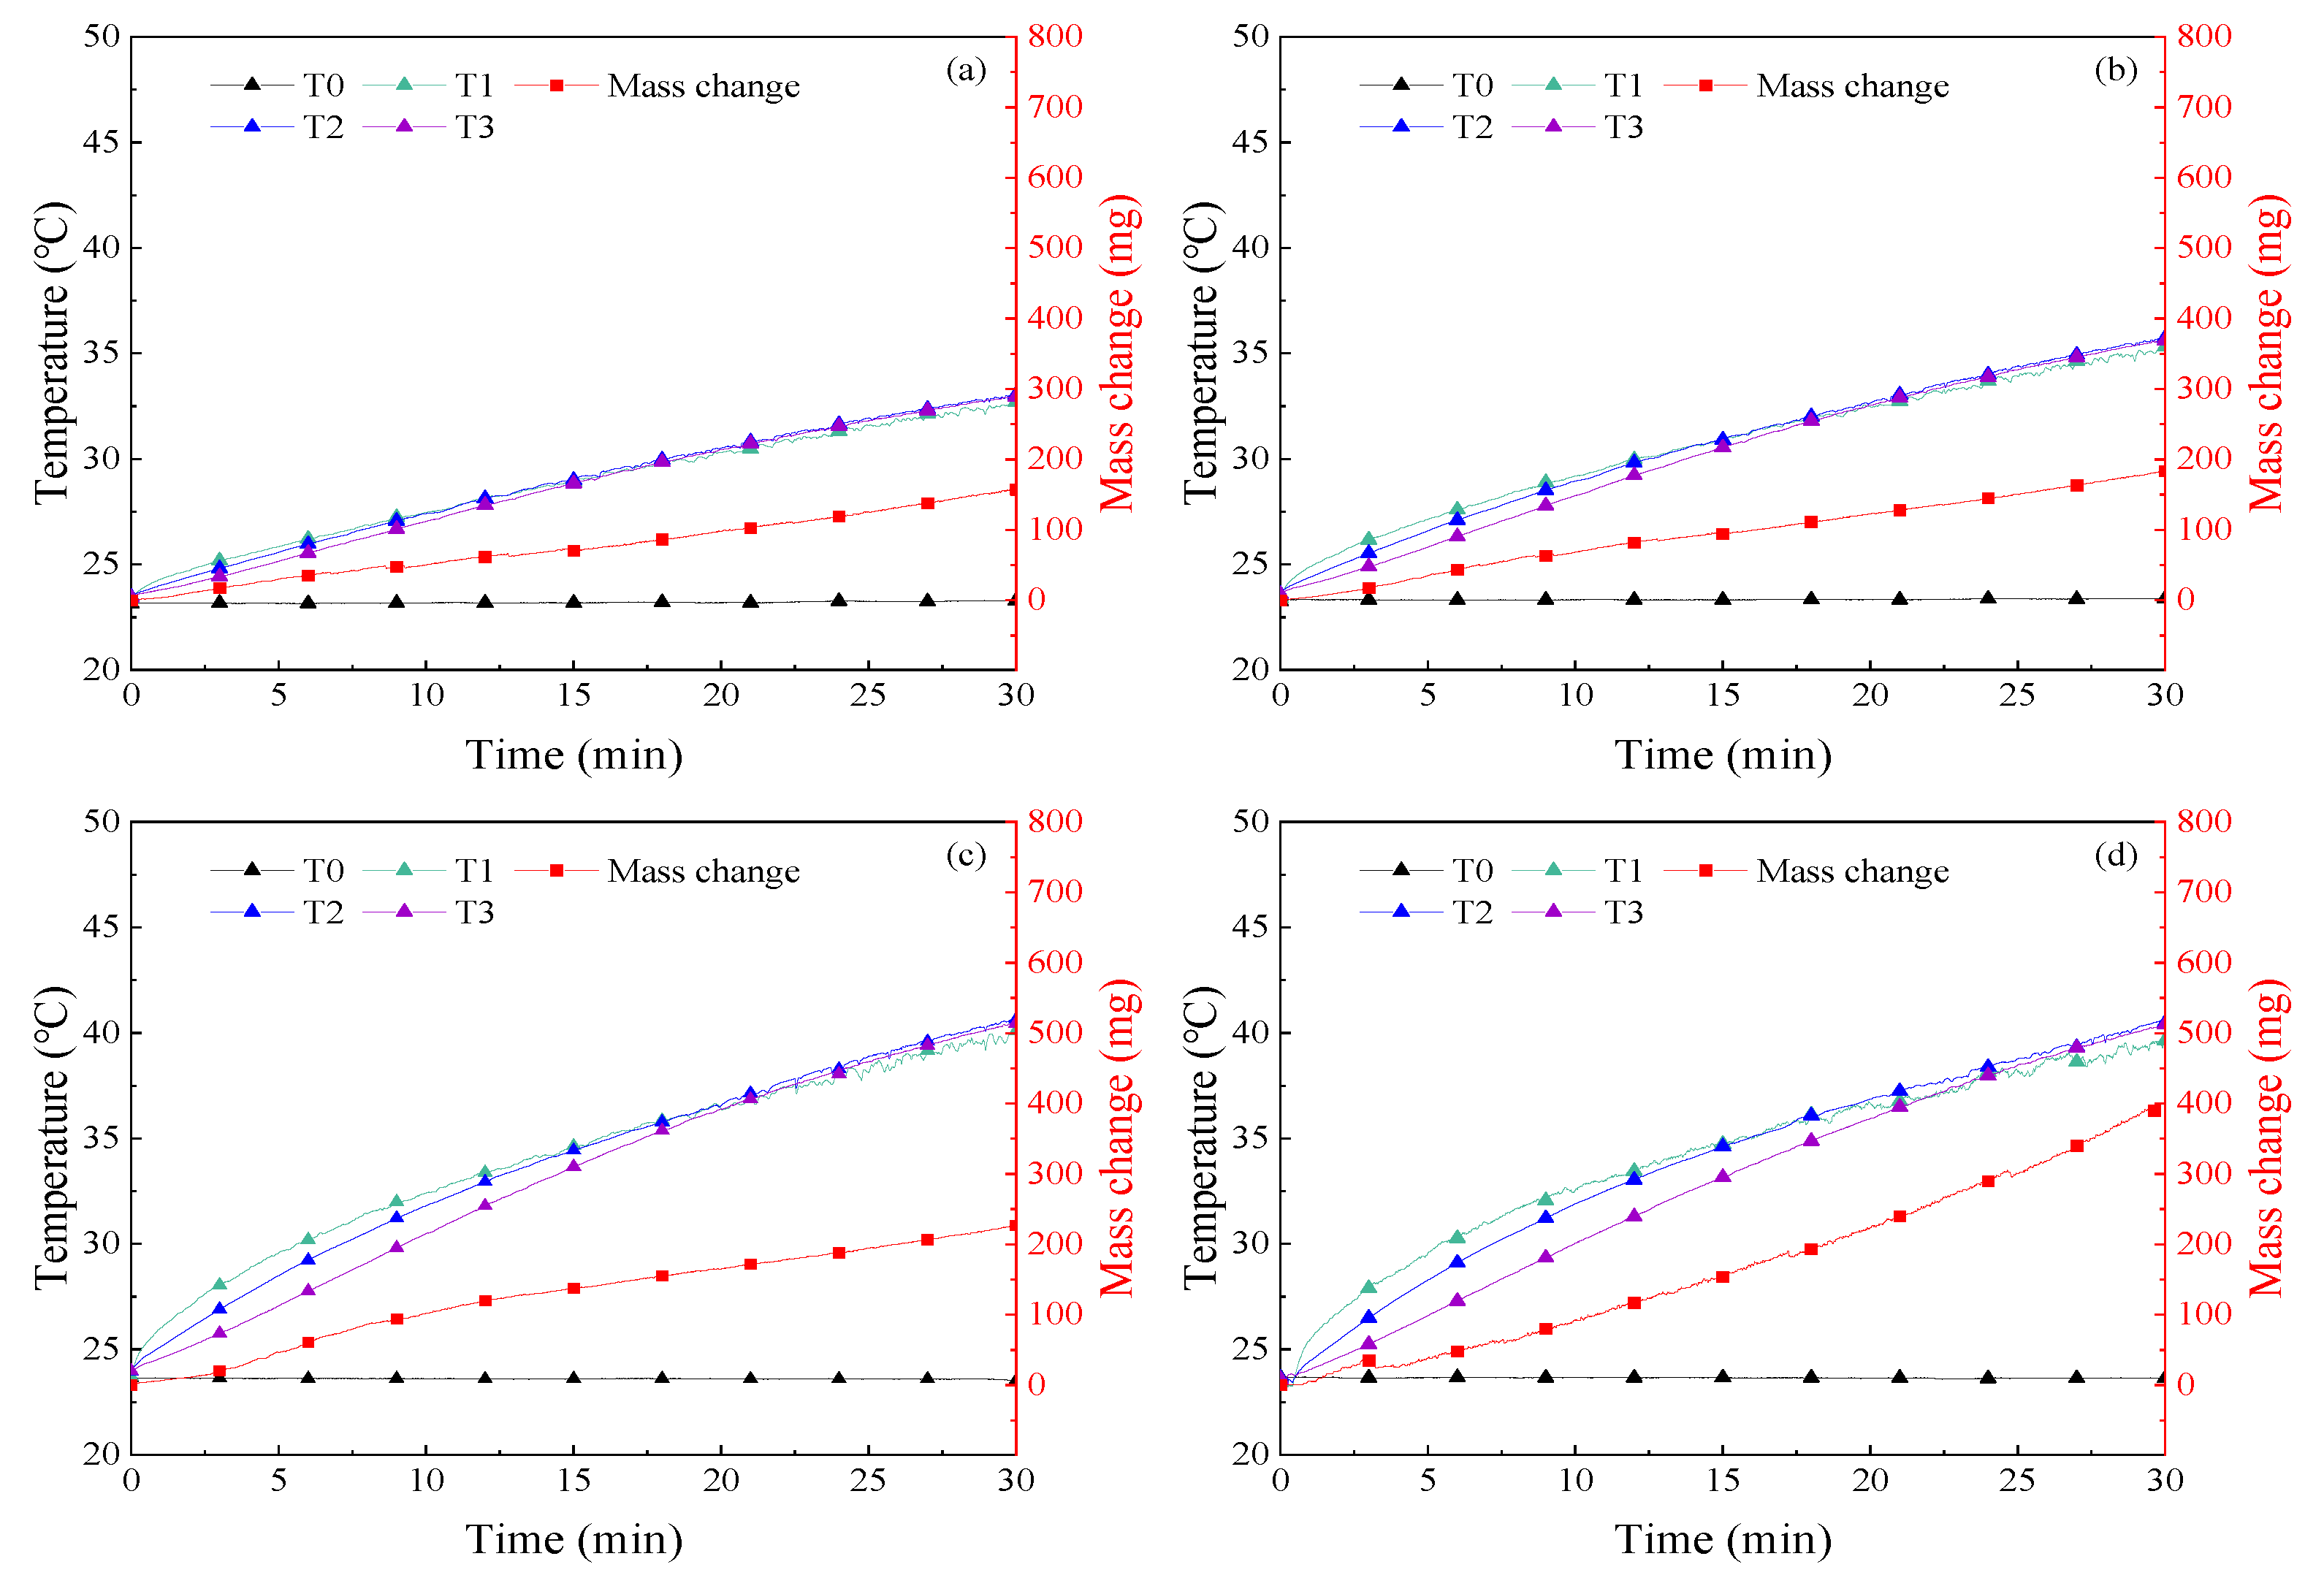
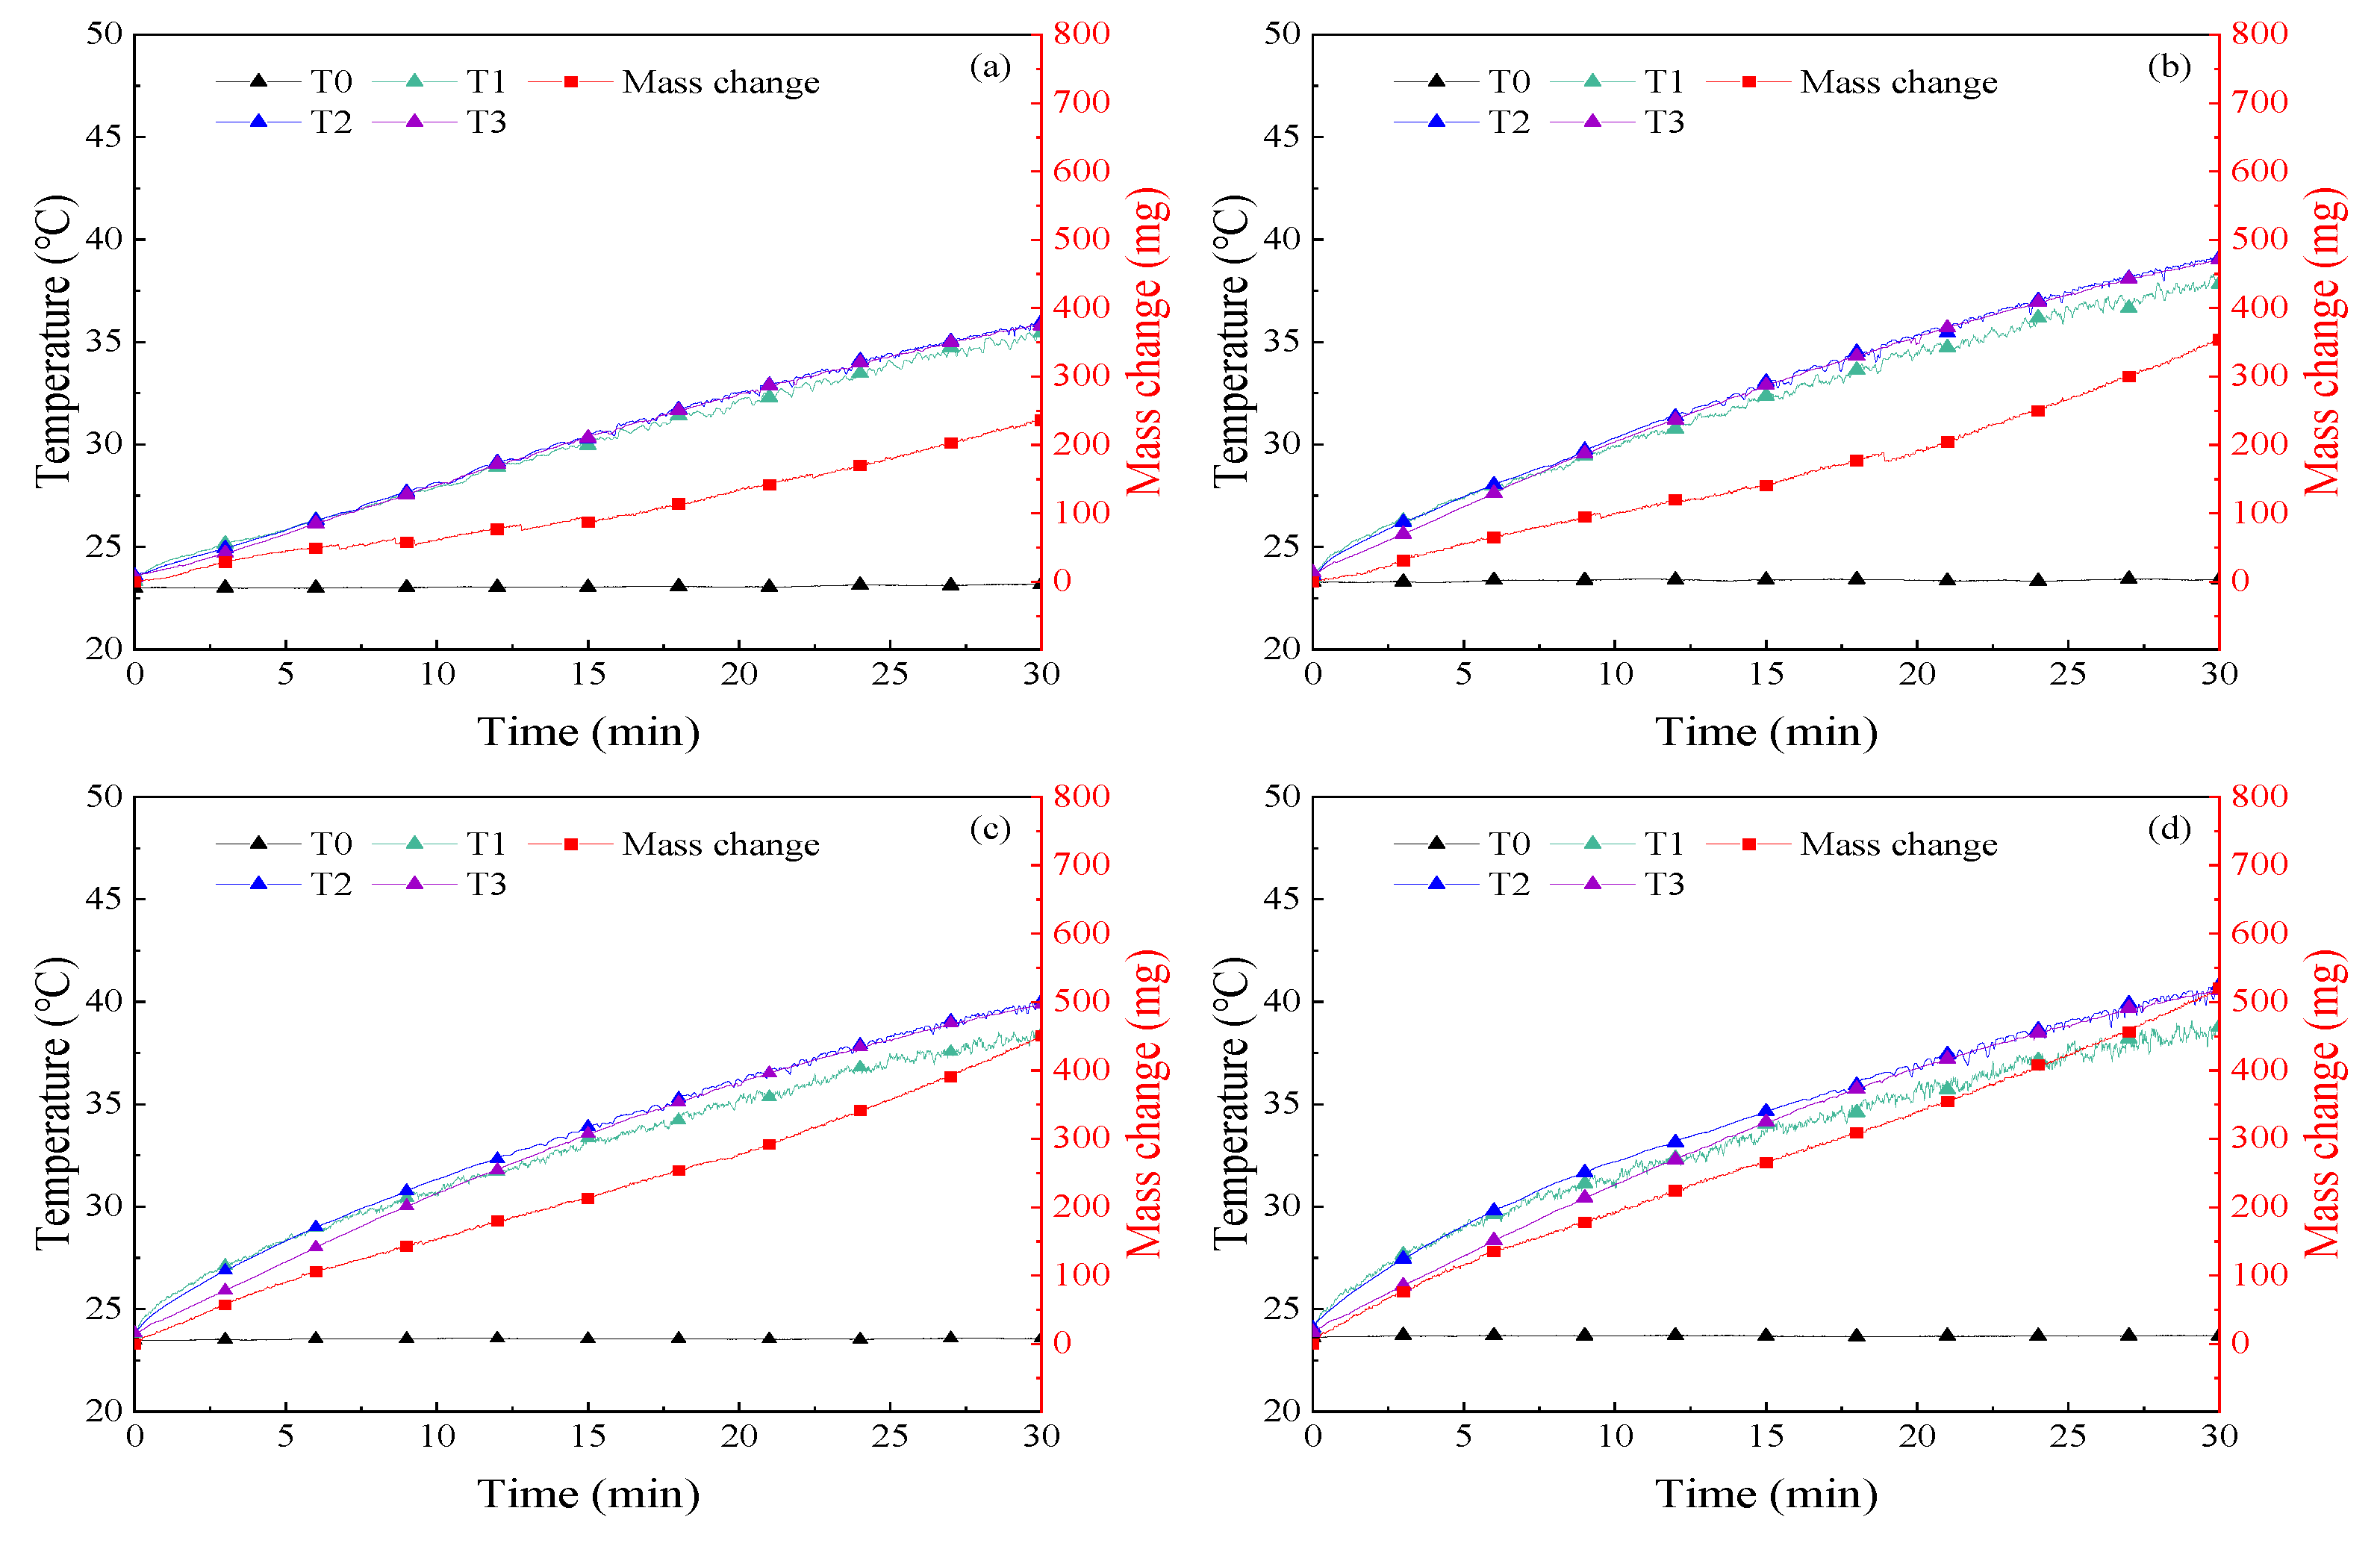
4.1. Solar–Thermal Conversion Characteristics
4.2. Uncertainty Analysis
4.3. Migration Characteristics with Vapor
5. Conclusions
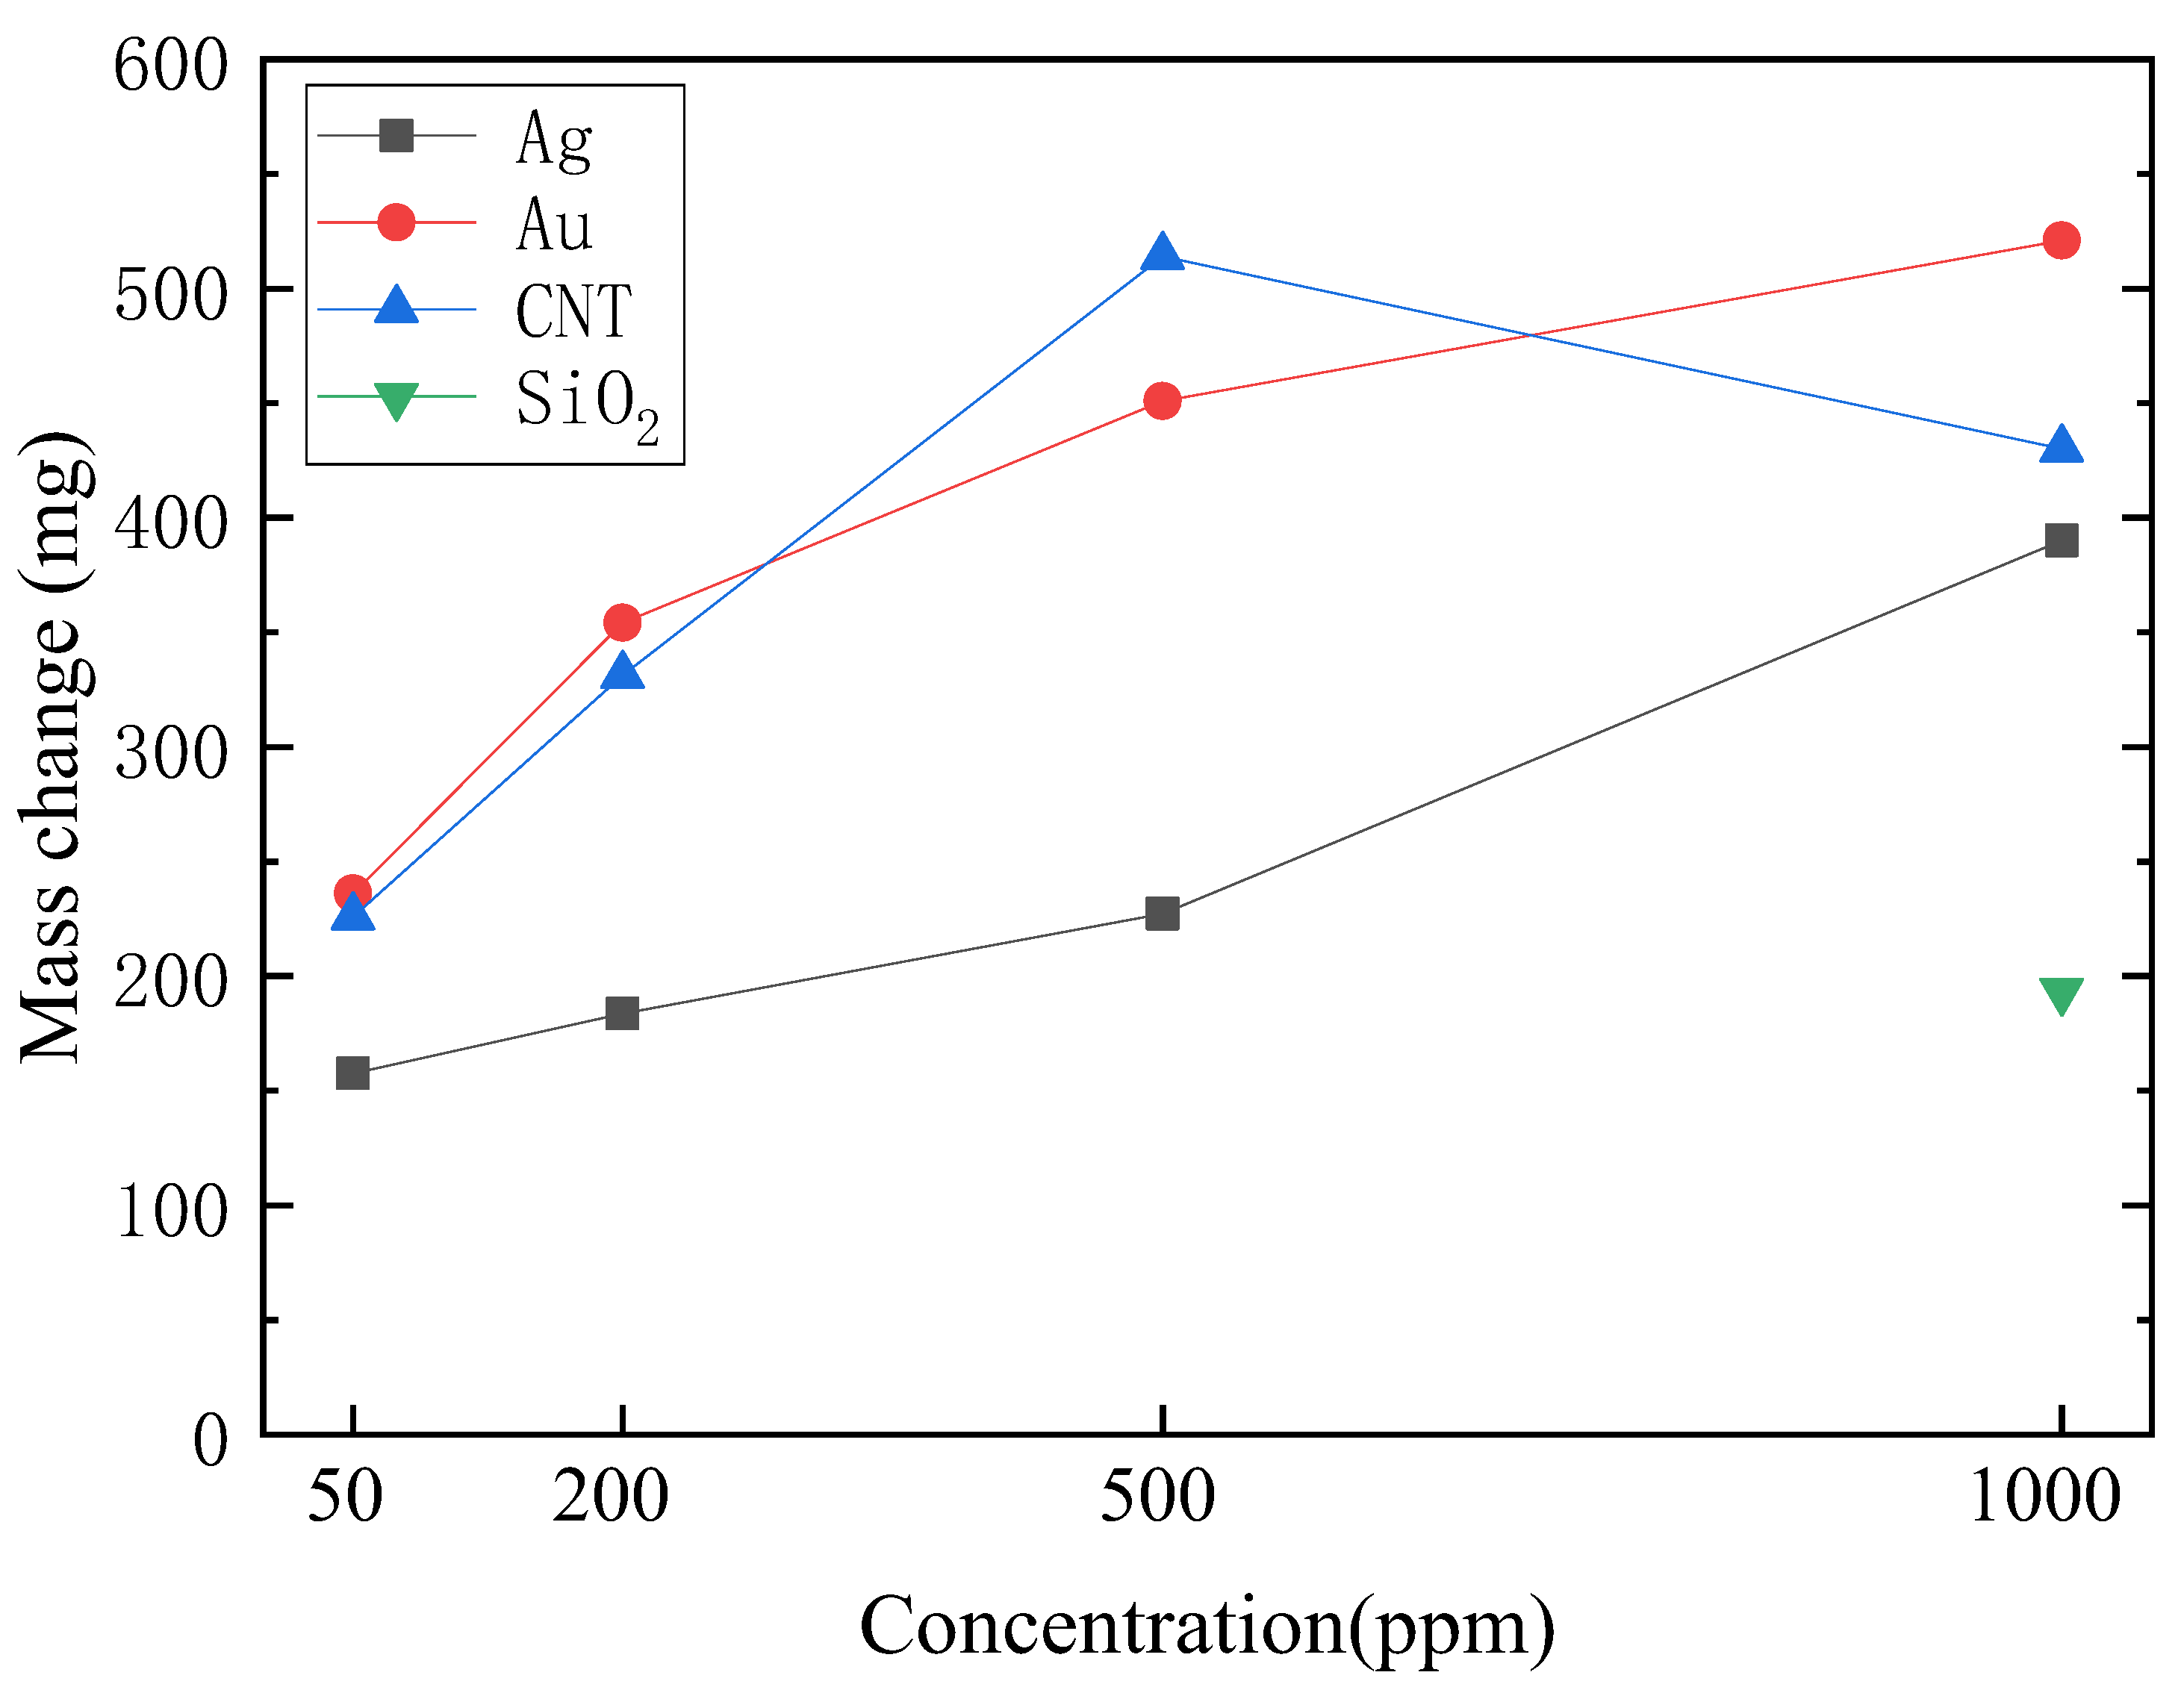
- (1)
- Under the sunlight of one sun by a sun simulator, the temperature of nanofluids changed faster with increasing concentration. Moreover, the water evaporation of the four kinds of nanofluids from high to low was MWCNT, Au, Ag, and SiO2 at the same concentration of 1000 ppm.
- (2)
- More sunlight is absorbed by the top of nanofluids with a high concentration and a dark color rather than the bottom of that, leading to the reduction of mass change and evaporation rate.
- (3)
- With generated vapor by boiling nanofluids, Ag nanoparticles would migrate out of the nanofluids. However, the concentration was lower than that of the original liquid, indicating that only part of the Ag nanoparticles migrated with vapor, and most of the nanoparticles remained in the nanofluids. In addition, more Ag nanoparticles migrated with vapor with the increased heating power.
Author Contributions
Funding
Data Availability Statement
Conflicts of Interest
References
- Bozorgan, N.; Shafahi, M. Performance evaluation of nanofluids in solar energy: A review of the recent literature. Micro Nano Syst. Lett. 2015, 3, 5. [Google Scholar] [CrossRef] [Green Version]
- Mourad, A.; Aissa, A.; Said, Z.; Younis, O.; Iqbal, M.; Alazzam, A. Recent advances on the applications of phase change materials for solar collectors, practical limitations, and challenges: A critical review. J. Energy Storage 2022, 49, 104186. [Google Scholar] [CrossRef]
- Ahmed, S.F.; Khalid, M.; Vaka, M.; Walvekar, R.; Numan, A.; Rasheed, A.K.; Mubarak, N.M. Recent progress in solar water heaters and solar collectors: A comprehensive review. Therm. Sci. Eng. Prog. 2021, 25, 100981. [Google Scholar] [CrossRef]
- Olfian, H.; Ajarostaghi, S.S.M.; Ebrahimnataj, M. Development on evacuated tube solar collectors: A review of the last decade results of using nanofluids. Sol. Energy 2020, 211, 265–282. [Google Scholar] [CrossRef]
- Jin, H.; Lin, G.; Bai, L.; Zeiny, A.; Wen, D. Steam generation in a nanoparticle-based solar receiver. Nano Energy 2016, 28, 397–406. [Google Scholar] [CrossRef] [Green Version]
- Alshukri, M.J.; Hussein, A.K.; Eidan, A.A.; Alsabery, A.I. A review on applications and techniques of improving the performance of heat pipe-solar collector systems. Sol. Energy 2022, 236, 417–433. [Google Scholar] [CrossRef]
- Murugan, M.; Saravanan, A.; Elumalai, P.; Kumar, P.; Saleel, C.A.; Samuel, O.D.; Setiyo, M.; Enweremadu, C.C.; Afzal, A. An overview on energy and exergy analysis of solar thermal collectors with passive performance enhancers. Alex. Eng. J. 2022, 61, 8123–8147. [Google Scholar] [CrossRef]
- Mund, C.; Rathore, S.K.; Sahoo, R.K. A review of solar air collectors about various modifications for performance enhancement. Sol. Energy 2021, 228, 140–167. [Google Scholar] [CrossRef]
- Alawi, O.A.; Kamar, H.M.; Mallah, A.; Mohammed, H.A.; Kazi, S.; Sidik, N.A.C.; Najafi, G. Nanofluids for flat plate solar collectors: Fundamentals and applications. J. Clean. Prod. 2020, 291, 125725. [Google Scholar] [CrossRef]
- Verma, S.K.; Gupta, N.K.; Rakshit, D. A comprehensive analysis on advances in application of solar collectors considering design, process and working fluid parameters for solar to thermal conversion. Sol. Energy 2020, 208, 1114–1150. [Google Scholar] [CrossRef]
- Pal, R.K.; Kumar, R. Investigations of thermo-hydrodynamics, structural stability, and thermal energy storage for direct steam generation in parabolic trough solar collector: A comprehensive review. J. Clean. Prod. 2021, 311, 127550. [Google Scholar] [CrossRef]
- Ituna-Yudonago, J.-F.; Galindo-Luna, Y.-R.; García-Valladares, O.; Brown, R.B.Y.; Shankar, R.; Ibarra-Bahena, J. Review of solar-thermal collectors powered autoclave for the sterilization of medical equipment. Alex. Eng. J. 2021, 60, 5401–5417. [Google Scholar] [CrossRef]
- Sharma, A.; Chauhan, R. Integrated and separate collector storage type low-temperature solar water heating systems with latent heat storage: A review. Sustain. Energy Technol. Assess. 2022, 51, 101935. [Google Scholar] [CrossRef]
- Bouich, A.; Marí-Guaita, J.; Bouich, A.; Pradas, I.G.; Marí, B. Towards Manufacture Stable Lead Perovskite APbI3 (A = Cs, MA, FA) Based Solar Cells with Low-Cost Techniques. In Proceedings of the 1st International Conference on Energy, Power and Environment, Gujrat, Pakistan, 11–12 November 2021. [Google Scholar]
- Kabir, E.; Kumar, P.; Kumar, S.; Adelodun, A.A.; Kim, K.-H. Solar energy: Potential and future prospects. Renew. Sustain. Energy Rev. 2018, 82, 894–900. [Google Scholar] [CrossRef]
- Marí-Guaita, J.; Bouich, A.; Marí, B. Shedding Light on Phase Stability and Surface Engineering of Formamidinium Lead Iodide (FaPbI3) Thin Films for Solar Cells. In Proceedings of the 1st International Conference on Energy, Power and Environment, Gujrat, Pakistan, 11–12 November 2021. [Google Scholar]
- Kumar, L.; Hasanuzzaman, M.; Rahim, N. Global advancement of solar thermal energy technologies for industrial process heat and its future prospects: A review. Energy Convers. Manag. 2019, 195, 885–908. [Google Scholar] [CrossRef]
- Choi, S.U.S.; Eastman, J.A. Enhancing Thermal Conductivity of Fluids With Nanoparticles. In Proceedings of the 1995 International Mechanical Engineering Congress and Exhibition, San Francisco, CA, USA, 12–17 November 1995; pp. 99–105. [Google Scholar]
- Kakaç, S.; Pramuanjaroenkij, A. Review of convective heat transfer enhancement with nanofluids. Int. J. Heat Mass Transf. 2009, 52, 3187–3196. [Google Scholar] [CrossRef]
- He, Y.; Jin, Y.; Chen, H.; Ding, Y.; Cang, D.; Lu, H. Heat transfer and flow behaviour of aqueous suspensions of TiO2 nanoparticles (nanofluids) flowing upward through a vertical pipe. Int. J. Heat Mass Transf. 2007, 50, 2272–2281. [Google Scholar] [CrossRef]
- Yu, W.; France, D.M.; Smith, D.S.; Singh, D.; Timofeeva, E.V.; Routbort, J.L. Heat transfer to a silicon carbide/water nanofluid. Int. J. Heat Mass Transf. 2009, 52, 3606–3612. [Google Scholar] [CrossRef]
- Younes, H.; Mao, M.; Murshed, S.S.; Lou, D.; Hong, H.; Peterson, G. Nanofluids: Key parameters to enhance thermal conductivity and its applications. Appl. Therm. Eng. 2022, 207, 118202. [Google Scholar] [CrossRef]
- Yousefi, T.; Shojaeizadeh, E.; Veysi, F.; Zinadini, S. An experimental investigation on the effect of pH variation of MWCNT–H2O nanofluid on the efficiency of a flat-plate solar collector. Sol. Energy 2011, 86, 771–779. [Google Scholar] [CrossRef]
- Lu, L.; Liu, Z.-H.; Xiao, H.-S. Thermal performance of an open thermosyphon using nanofluids for high-temperature evacuated tubular solar collectors: Part 1: Indoor experiment. Sol. Energy 2011, 85, 379–387. [Google Scholar] [CrossRef]
- Jin, H.; Lin, G.; Bai, L.; Amjad, M.; Filho, E.P.B.; Wen, D. Photothermal conversion efficiency of nanofluids: An experimental and numerical study. Sol. Energy 2016, 139, 278–289. [Google Scholar] [CrossRef] [Green Version]
- Jin, H.; Lin, G.; Zeiny, A.; Bai, L.; Wen, D. Nanoparticle-based solar vapor generation: An experimental and numerical study. Energy 2019, 178, 447–459. [Google Scholar] [CrossRef]
- Khullar, V.; Tyagi, H.; Hordy, N.; Otanicar, T.P.; Hewakuruppu, Y.; Modi, P.; Taylor, R.A. Harvesting solar thermal energy through nanofluid-based volumetric absorption systems. Int. J. Heat Mass Transf. 2014, 77, 377–384. [Google Scholar] [CrossRef]
- Huq, T.; Ong, H.C.; Chew, B.T.; Leong, K.Y.; Kazi, S.N. Review on aqueous graphene nanoplatelet Nanofluids: Preparation, Stability, thermophysical Properties, and applications in heat exchangers and solar thermal collectors. Appl. Therm. Eng. 2022, 210, 118342. [Google Scholar] [CrossRef]
- Xiong, Q.; Hajjar, A.; Alshuraiaan, B.; Izadi, M.; Altnji, S.; Shehzad, S.A. State-of-the-art review of nanofluids in solar collectors: A review based on the type of the dispersed nanoparticles. J. Clean. Prod. 2021, 310, 127528. [Google Scholar] [CrossRef]
- Kumar, S.; Chander, N.; Gupta, V.K.; Kukreja, R. Progress, challenges and future prospects of plasmonic nanofluid based direct absorption solar collectors—A state-of-the-art review. Sol. Energy 2021, 227, 365–425. [Google Scholar] [CrossRef]
- Taylor, R.A.; Phelan, P.E.; Adrian, R.J.; Gunawan, A.; Otanicar, T.P. Characterization of light-induced, volumetric steam generation in nanofluids. Int. J. Therm. Sci. 2012, 56, 1–11. [Google Scholar] [CrossRef]
- Otanicar, T.P.; Phelan, P.E.; Prasher, R.S.; Rosengarten, G.; Taylor, R.A. Nanofluid-based direct absorption solar collector. J. Renew. Sustain. Energy 2010, 2, 033102. [Google Scholar] [CrossRef] [Green Version]
- Zhang, H.; Chen, H.-J.; Du, X.; Wen, D. Photothermal conversion characteristics of gold nanoparticle dispersions. Sol. Energy 2014, 100, 141–147. [Google Scholar] [CrossRef]
- Chen, M.; He, Y.; Zhu, J.; Kim, D.R. Enhancement of photo-thermal conversion using gold nanofluids with different particle sizes. Energy Convers. Manag. 2016, 112, 21–30. [Google Scholar] [CrossRef]
- Oara, N.; Alexander, S.U.; Jared, D.; Surbhi, L.; Peter, N.; Naomi, J.H. Solar Vapor Generation Enabled by Nanoparticles. ACS Nano 2013, 7, 42–49. [Google Scholar]
- Ahmed, T.; Noman, M.; Manzoor, N.; Ali, S.; Rizwan, M.; Ijaz, M.; Allemailem, K.S.; BinShaya, A.S.; Alhumaydhi, F.A.; Li, B. Recent advances in nanoparticles associated ecological harms and their biodegradation: Global environmental safety from nano-invaders. J. Environ. Chem. Eng. 2021, 9, 106093. [Google Scholar] [CrossRef]
- Westerhoff, P.; Atkinson, A.; Fortner, J.; Wong, M.S.; Zimmerman, J.; Gardea-Torresdey, J.; Ranville, J.; Herckes, P. Low risk posed by engineered and incidental nanoparticles in drinking water. Nat. Nanotechnol. 2018, 13, 661–669. [Google Scholar] [CrossRef] [PubMed]
- Wan, J.; Wang, R.; Wang, R.; Ju, Q.; Wang, Y.; Xu, J. Comparative Physiological and Transcriptomic Analyses Reveal the Toxic Effects of ZnO Nanoparticles on Plant Growth. Environ. Sci. Technol. 2019, 53, 4235–4244. [Google Scholar] [CrossRef] [PubMed]
- Yan, A.; Chen, Z. Impacts of Silver Nanoparticles on Plants: A Focus on the Phytotoxicity and Underlying Mechanism. Int. J. Mol. Sci. 2019, 20, 1003. [Google Scholar] [CrossRef]
- Shabbir, S.; Kulyar, M.F.-E.; Bhutta, Z.A.; Boruah, P.; Asif, M. Toxicological Consequences of Titanium Dioxide Nanoparticles (TiO2NPs) and Their Jeopardy to Human Population. BioNanoScience 2021, 11, 621–632. [Google Scholar] [CrossRef]
- Liu, J.; Williams, P.C.; Goodson, B.M.; Geisler-Lee, J.; Fakharifar, M.; Gemeinhardt, M.E. TiO2 nanoparticles in irrigation water mitigate impacts of aged Ag nanoparticles on soil microorganisms, Arabidopsis thaliana plants, and Eisenia fetida earthworms. Environ. Res. 2019, 172, 202–215. [Google Scholar] [CrossRef]
- Zhang, H.; Wang, B.; Xiong, M.; Gao, C.; Ren, H.; Ma, L. Process intensification in gas-liquid mass transfer by nanofluids: Mechanism and current status. J. Mol. Liq. 2021, 346, 118268. [Google Scholar] [CrossRef]
- Jin, H.; Lin, G.; Guo, Y.; Bai, L.; Wen, D. Nanoparticles enabled pump-free direct absorption solar collectors. Renew. Energy 2019, 145, 2337–2344. [Google Scholar] [CrossRef]
- Jin, H.; Lin, G.; Zeiny, A.; Bai, L.; Cai, J.; Wen, D. Experimental study of transparent oscillating heat pipes filled with solar absorptive nanofluids. Int. J. Heat Mass Transf. 2019, 139, 789–801. [Google Scholar] [CrossRef]
- Chen, H.-J.; Wen, D. Ultrasonic-aided fabrication of gold nanofluids. Nanoscale Res. Lett. 2011, 6, 198. [Google Scholar] [CrossRef] [PubMed] [Green Version]
- Wen, D.; Ding, Y. Experimental investigation into convective heat transfer of nanofluids at the entrance region under laminar flow conditions. Int. J. Heat Mass Transf. 2004, 47, 5181–5188. [Google Scholar] [CrossRef]


| Concentration/ppm | 50 | 200 | 500 | 1000 | ||||
|---|---|---|---|---|---|---|---|---|
| Nanofluids | Au | Others | Au | Others | Au | Others | Au | Others |
| Uncertainty/% | 0.0155 | 0.025 | 0.01549 | 0.025 | 0.01549 | 0.025 | 0.01549 | 0.025 |
Publisher’s Note: MDPI stays neutral with regard to jurisdictional claims in published maps and institutional affiliations. |
© 2022 by the authors. Licensee MDPI, Basel, Switzerland. This article is an open access article distributed under the terms and conditions of the Creative Commons Attribution (CC BY) license (https://creativecommons.org/licenses/by/4.0/).
Share and Cite
Sun, H.; Lin, G.; Jin, H.; Zhou, Y.; Ma, K. Experimental Investigation on Solar–Thermal Conversion and Migration Characteristics of Nanofluids. Energies 2022, 15, 3282. https://doi.org/10.3390/en15093282
Sun H, Lin G, Jin H, Zhou Y, Ma K. Experimental Investigation on Solar–Thermal Conversion and Migration Characteristics of Nanofluids. Energies. 2022; 15(9):3282. https://doi.org/10.3390/en15093282
Chicago/Turabian StyleSun, Haoyang, Guiping Lin, Haichuan Jin, Ying Zhou, and Kuiyuan Ma. 2022. "Experimental Investigation on Solar–Thermal Conversion and Migration Characteristics of Nanofluids" Energies 15, no. 9: 3282. https://doi.org/10.3390/en15093282
APA StyleSun, H., Lin, G., Jin, H., Zhou, Y., & Ma, K. (2022). Experimental Investigation on Solar–Thermal Conversion and Migration Characteristics of Nanofluids. Energies, 15(9), 3282. https://doi.org/10.3390/en15093282