Article

A Feasibility Study of Developing eLCV Shared Architecture in Taiwan

1
Graduate Institute of Applied Science and Technology, National Taiwan University of Science and Technology, Taipei 106335, Taiwan
2
International Research Division, Chung-Hua Institution for Economic Research, Taipei 10672, Taiwan
*
Author to whom correspondence should be addressed.
Energies 2022, 15(9), 3283; https://doi.org/10.3390/en15093283
Submission received: 25 March 2022 / Revised: 22 April 2022 / Accepted: 28 April 2022 / Published: 30 April 2022
(This article belongs to the Special Issue Green Energy Economies)

Abstract

:
Vehicle electrification has become an important strategy adopted worldwide, including in Taiwan, as a means to achieving net zero emissions. Taiwan is capable of building a whole light commercial vehicle and has technological strength in producing critical EV parts. This study applies the Bass diffusion model to assess the feasibility of developing eLCV shared architecture in Taiwan and estimates that the annual replacement demand for eLCVs could reach 20,221 units. This exceeds the threshold number of 5000 units, which could motivate the automakers to develop eLCV shared architecture. The simulation result shows that achieving full market penetration would take at least 13 years and would be highly correlated with policy support, the vehicle selling price and the battery pack price. The B2B model is a suitable way of introducing eLCVs into the logistics fleets. In the initial promotion phase, policy support and complementary measures would be needed, e.g., public sectors’ purchases, financial incentives and constructing a user-friendly environment. The simulation results further indicate that Taiwan’s eLCV market has a high price elasticity, and in the future, a tendency for the battery pack price to decline may speed up the replacement process.

Graphical Abstract

1. Introduction

To mitigate the impact of climate change, in 2015, 196 Parties signed the Paris Agreement with a commitment to reduce carbon emissions and achieve zero net emissions by 2050. The Biden administration plans to invest $1.2 trillion in the climate transition strategy to boost the US economy, energy, transport and infrastructure toward a 100% renewable energy and net zero carbon economy [1]. The EU has also set a long-term strategic goal of becoming climate neutral by 2050 and has introduced a series of legislation [2]. According to the International Energy Agency (IEA) [3], the transport sector is the second largest source of global greenhouse gas emissions and generated 8034 million tons of emissions in 2018. Road transport is the main emitter of CO2, accounting for 74% of total transport emissions, which also include the scopes of aviation, shipping and railway, according to IEA member states’ statistics. The shift to zero-and-low-emission vehicles could effectively contribute to the carbon reduction of road transport [4,5]. Thus, to achieve their zero emission goal, many countries have already adopted related policies and measures. In its Net Zero by 2050—A Roadmap for the Global Energy Sector, the IEA points out that vehicle electrification has become one of the necessary means to carry out the goal of global net zero emissions [6]. Furthermore, according to Bloomberg New Energy Finance (BNEF), in 2020, the number of electrified vehicles exceeded 270 million units [7]. The range of application was extended from two-wheelers and light passenger cars to commercial vehicles.
Among countries and political entities, the EU, the US and China are more active in promoting the electrification of commercial fleets. For example, the EU has encouraged the public sector to adopt alternative fuel vehicles (AFVs) in accordance with the legislation of the “Clean Vehicle Directive” and has asked its member states to increase the proportion of zero- or low-emission vehicles, including light and heavy commercial vehicles and buses in their government procurement and leases. The EU has also established different criteria for its member states. Member states should specify the proportions of light and heavy vehicles they should acquire by 2025 and by 2030, in accordance with their respective capabilities [8]. Several European cities have introduced electric vehicles (EVs) into their sustainable transport project [9]. In the US, California’s Zero Emission Vehicle Action Plan requires that passenger and freight fleets for public facilities should be completely replaced by zero emission vehicles (ZEVs) during the period from 2035 to 2050 [10]. The US federal government has set Corporate Average Fuel Efficiency (CAFE) standards to raise the production of ZEVs [11]. In China, multilevel subsidies are provided according to a series of standards and indicators, such as vehicle energy technology, vehicle specifications and BEV ranges [12]. EV manufacturers are also required to meet the standards of after-sales service, warranty and inspection [13].
For the purpose of energy saving and carbon reduction and in response to the trend of vehicle electrification, the Taiwan government has placed EVs on its priority list and has outlined a pathway to the 2050 net zero carbon emissions of the transport vehicle sectors. However, because of the lack of charging infrastructure and insufficient policy support [14], the progress of electrification has been slow. The Institute of Transportation of the Ministry of Transportation and Communications (MOTC) estimated that, in 2019, light passenger vehicles, among all kinds of vehicles, would be the largest source of total transport emissions, accounting for 50% of emissions, and freight trucks would be the second, accounting for 30%. This highlights the necessity to electrify light passenger cars and freight trucks [15]. Furthermore, in the initial phase, the electrification of freight trucks is relatively easier. 85% of freight trucks are light commercial vehicles (LCVs), and their electrification could be stimulated by means of a Business-to-Business (B2B) commercial model, business tax exemption, purchase subsidy and statutory service life. These measures are helpful in forming economies of scale.
In Taiwan, the logistics fleets, mainly composed of four companies, account for the largest proportion of LCVs. The two leading companies are HCT Logistics and Kerry TJ Logistics. The trucks that they own respectively exceed 3400 units. The other two are Taiwan Pelican Express and President Transnet. Each of them owns more than 1000 logistics trucks [16,17]. In recent years, the overall commercial environment has been greatly affected by the trend of e-commerce and the COVID-19 pandemic. The logistics market is growing rapidly and the business is thriving. E-commerce retailers have started to build their own logistics fleets, which has resulted in an increasing market demand for LCVs. In terms of driving pattern and charging infrastructure, a logistics vehicle often accumulates a long driving distance with quite regular routes. Thus, the deployment of charging infrastructure for Electric Light Commercial Vehicles (eLCVs) is easier and simpler than for personal-use vehicles. Logistics companies are also able to build their own charging points in their warehousing or distribution facilities.
From the perspective of technical skills, Taiwan is capable of building a whole LCV, including a children’s minibus, wheelchair accessible vehicle and light truck above 2.5 tons. Taiwan also has technological strength in producing critical EV parts, such as battery packs, electric machines and electrical control systems. As a result of benefiting from these advantages, some Taiwan manufacturers have started to develop eLCVs. They have mainly adopted two approaches. One is technique-oriented. The enterprises within the EV supply chain are brought together to form an industry platform, thereby obtaining the government funding and committing to R&D activities [18]. The platform aims at maximizing the availability and sharing of eLCV parts. Only when the demand for eLCVs exceeds the threshold number of 5000 units will the automakers have the motivation to develop and produce a new car type. The other approach is to cooperate with the original automakers and integrate the Taiwan-made battery packs, electric machines and electric control systems [19].
Given the above-mentioned background, Taiwan fulfills the basic requirements for developing eLCVs. LCVs are likely to become the next potential market for vehicle electrification. Thus, this study aims to assess the feasibility of developing eLCV shared architecture in Taiwan. The study’s results could serve as policy recommendations in relation to zero emissions and encourage the transport sector to seize the market trend of eLCVs and work on the development of the EV industry. This section is the background and objectives of the study. Section 2 provides an overview of the development of eLCVs in Taiwan. Section 3 describes the methodology, and Section 4 includes the results of positive analysis. Finally, Section 5 is a summary of the conclusions and the research prospect.

2. The Development of eLCVs in Taiwan

2.1. Current Progress of eLCVs

eLCVs are suitable for the logistics industry, the traveling distance of which is short, or suitable for transport service with fixed routes and distances [20,21,22]. However, unlike light passenger vehicles, the main reason why commercial fleets adopt eLCVs is the total cost of ownership (TCO) [23], which includes the costs of purchasing and operating. Feng and Figliozzi consider that although the present cost of purchasing eLCVs is high, eLCVs will become cost-competitive with diesel cars as their prices go down by 10% to 30% in the future [24]. Driving routes, fixed schedules and predicable movement patterns all contribute to the effective management of mileages and charging intervals. The deployment of charging infrastructure could be concentrated in company parking lots or warehouses [25,26]. In this way, the range anxiety facing conventional passenger vehicles and the barriers to the promotion of charging infrastructure could be phased out [27]. From the perspective of cost, electricity is an alternative form of energy with more economic incentives [28].
In addition, in response to the increasing influx of e-commerce in urban areas, the overall environment is beneficial to the expansion of the LCV market and has resulted in the growing demand for eLCVs [4,29,30]. The outbreak of the COVID-19 pandemic is also encouraging this trend. Moreover, as the enterprises seek to reduce carbon emissions and air pollution, the promotion and adoption of eLCVs is gathering more momentum [23].
The trend of vehicle electrification heralds an increase in the number of EVs, propelling the emerging industry and the blue ocean market, that is, the circular niche market of battery packs [31]. Besides the revenue from the circular economy, the impacts caused by the fluctuations in the prices of battery pack material costs could be lessened. In Taiwan, some corporations have been engaged in the trade of recycling used automotive parts and exporting them to Southeast Asian countries. The surplus value of used gas and diesel vehicles is thus created through the process of recycling and exporting, and the related business opportunities could be further expanded by leveraging the trend toward vehicle electrification.

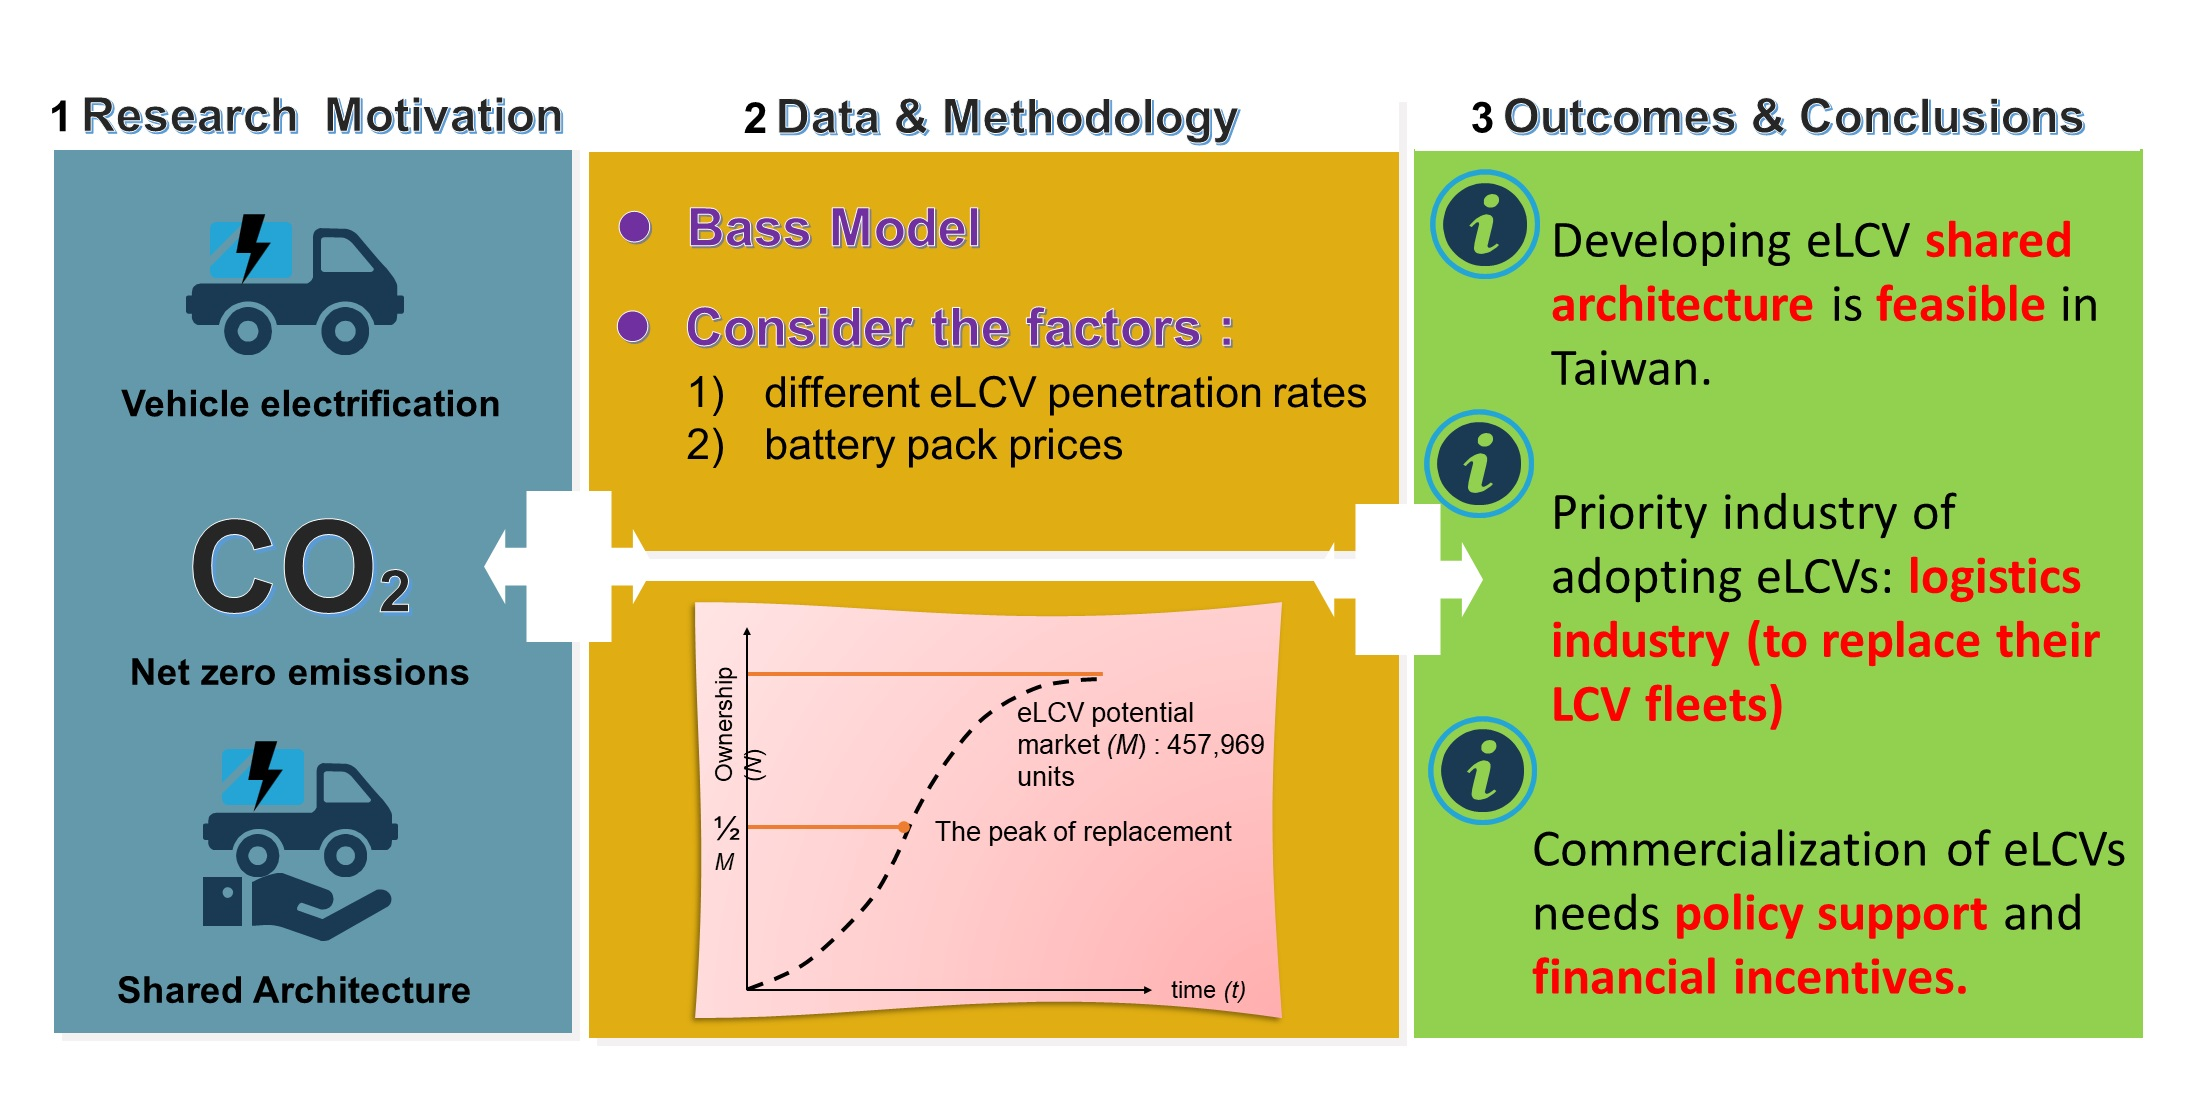
2.2. An Estimation of the Potential eLCV Market in Taiwan

In this study, eLCVs are defined as passenger cars, trucks or station wagons under 3.5 tons. They are divided into six categories, namely, children’s minibuses, rehabilitation microbuses, wheelchair accessible taxis, small wheelchair accessible passenger cars and leased cars, microbuses serving in remote areas (aka the Happiness Bus) and light trucks (between 2.5 and 3.5 tons).
According to the Education Administration of the Ministry of Education, by the end of 2020, there were 3943 children’s minibuses in Taiwan. It is estimated that, in the next decade, at least 300 units will be replaced annually due to the legal requirements and replacement subsidies. The statistics of the Social and Family Affairs Administration of the Ministry of Health and Welfare and the Directorate-General of Highways of the Ministry of Transportation and Communications show that there are 2147 rehabilitation microbuses, 1358 wheelchair accessible taxis and 966 vehicles for wheelchair users. The annual replacement number of the three categories of vehicles is estimated to be 545 units. According to the Directorate-General of Highways of the Ministry of Transportation and Communications, as of October 2020, there were 20 buses serving in remote areas. The number of light trucks between 2.5 and 3.5 tons reached 449,535 units. Light trucks belong to commercial vehicles, the service life of which is not restricted and regulated by any law, but the annual replacement number of light trucks still reaches 15,648 units due to the replacement subsidies granted by the Industrial Development Bureau of the Ministry of Economic Affairs since 2016. The statistics of the Ministry of Transportation also show that the number of registered light trucks has exhibited an upward trend. This study, in considering the practical situation of eLCV sales, includes the annual average number of newly-registered eLCVs during the last five years (2016 to 2020) in the annual replacement demand, which is around 3728 units. Thus, the annual replacement demand for light trucks of 2.5 to 35 tons is around 19,376 units.
Given the above-mentioned developments, the maximum potential for the eLCV market in Taiwan is 457,969 units, and the estimated number of units annually replaced could reach 20,221 units, mainly consisting of light trucks of 2.5 to 3.5 tons. (Table 1).

3. Model Description

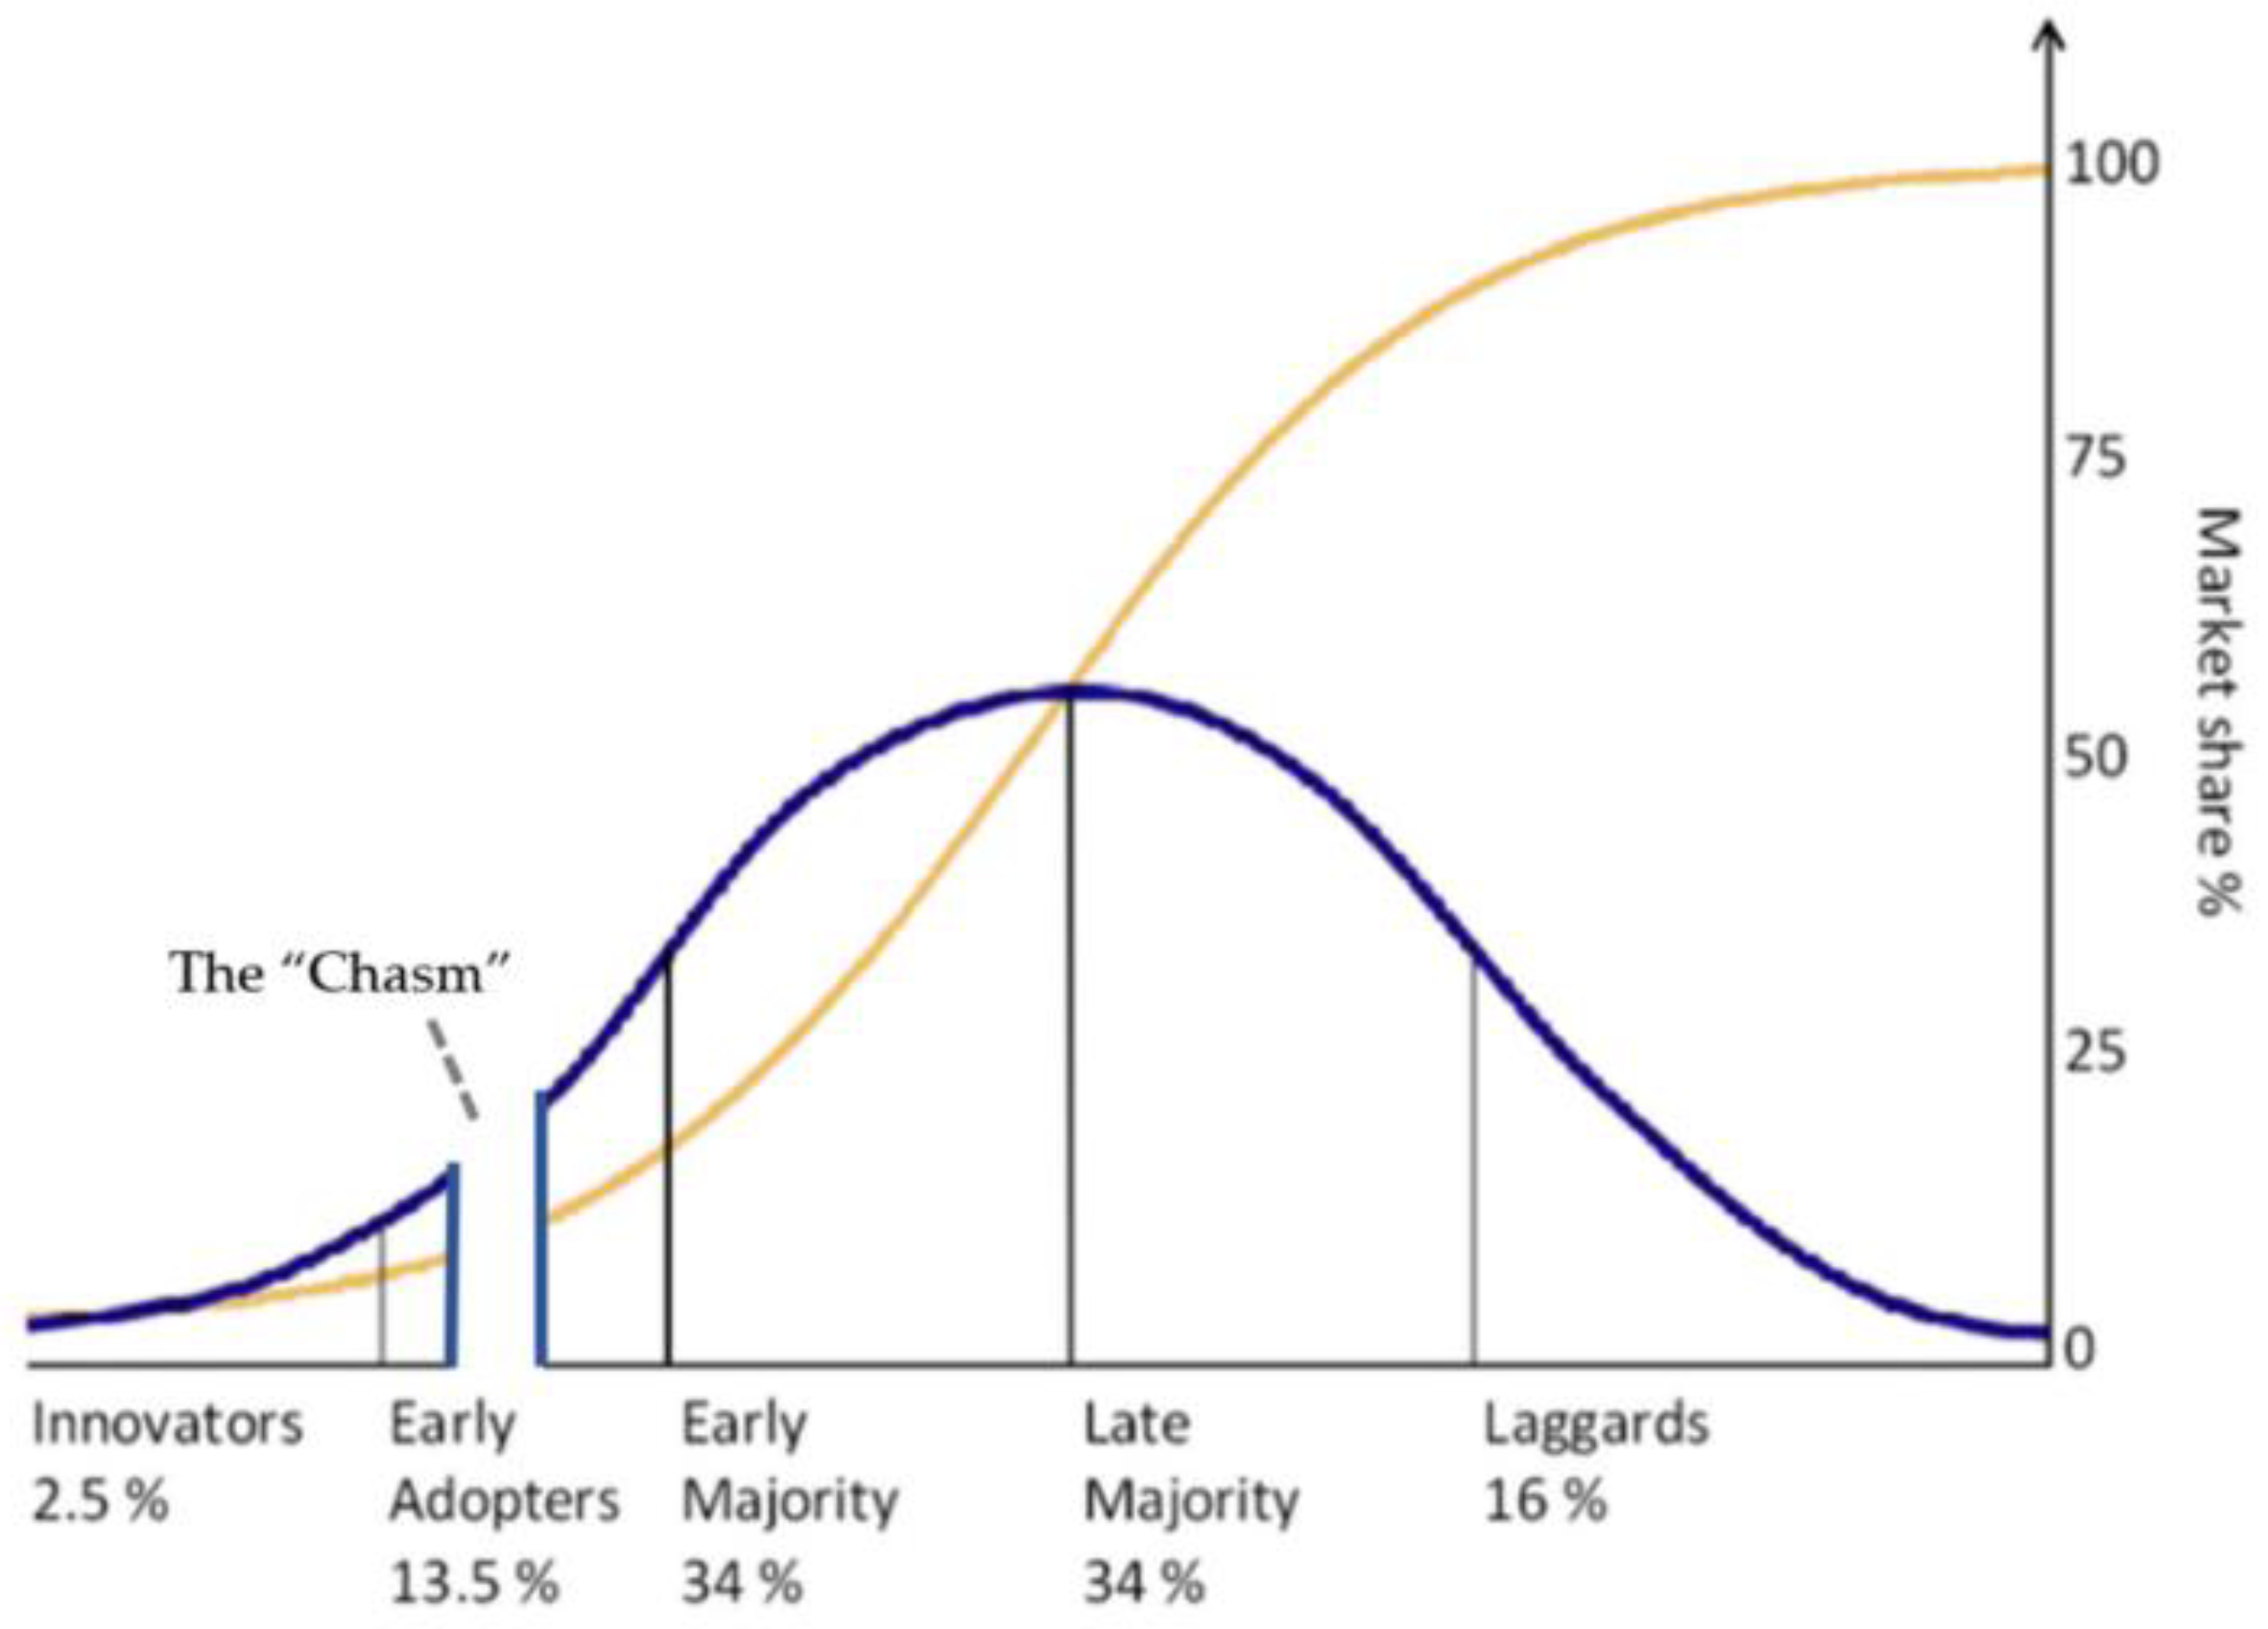
3.1. Diffusion Model

The diffusion model is one of the most commonly used assessment tools in the new product and service market. According to the Diffusion of Innovation Theory [32], after entering the market, a new product attracts customers that will adopt it, and its sales develop in accordance with the Technology Adoption Life Cycle, which is divided into five stages: Innovators, Early Adopters, Early Majority, Late Majority and Laggards. The proportions of the five stages are, respectively, 2.5%, 13.5%, 34%, 34% and 16%. New adoptions form a bell-shaped distribution and cumulative adoptions result in a diffusion curve (Figure 1) [32,33]. From its launch in the market to its late phase of reaching market saturation, the cumulative growth of this new product forms an S-sharped curve.
In terms of the distribution of product information and its diffusion patterns, the diffusion models can be divided into three types: external influence, internal influence and mixed influence (Table 2) [34,35]. The external influence model relies on the influence of external information and mass media. The sales of a new product are motivated through the advertisements. The main diffusion behavior is “innovation”, which means that some customers will take the lead to buy this new product. The driver of the internal influence model comes from the information exchanges among market participants, and the main type of diffusion behavior is “imitation”. Potential buyers are propelled to purchase by the existing adopters and their word of mouth. This accelerates the purchase and adoption of this new product, resulting in its diffusion. The new product is thus made more available and gradually substitutes the old technique and product. The mixed influence model has the features of the external and internal influence models, covering the behaviors of innovation and replacement. The commonly used model of mixed influence is the Bass diffusion model.
The EVs have the characteristics of durable goods and new energy technology and are suitable to be assessed by the mixed influence model. Soumia and Maaroufi (2019) apply the diffusion model to assess the development of the EV market in Morocco [37]. Ensslen, Will and Jochem (2019) compare the developments of the EV markets in Germany and France and analyze their differences by means of the diffusion model [38]. Ahmadi et al. (2015) investigate the EV diffusion in the market in Ontario, Canada and indicate that, in addition to the diffusion rate, the model could also take into account the socioeconomic features of vehicle users [39]. In its initial phase, the development of EVs is in need of investments and commitments from both the public and private sectors in R&D for motors, architecture and battery products as well as in the deployment of charging infrastructure. The market diffusion is highly affected by the government policy. Hagman et al. (2016) and Li, Jiao and Tang (2019) point out that government incentives accelerate the diffusion of the EV market [40,41]. The prices of EVs and the supporting infrastructure also affect its diffusion [41,42].

3.2. Parameters of the Diffusion Rate

The new product and service market includes emerging technology, such as durable goods and renewable energy [43,44]. The key parameter that affects the diffusion of a new product in the market is the diffusion rate. The parameters of the diffusion rate of the Bass diffusion model are p and q. P stands for the coefficient of innovation, affecting the number of users in the initial phase of promoting a new product, while q refers to the coefficient of imitation, which affects the rate of replacement. Massiani and Gohs (2015) collect the diffusion parameters of AFVs, including hybrid electric vehicles (HEV), battery electric vehicles (BEV) or vehicles fueled by ethanol and compressed natural gas (CNG) [45]. They find that the value of p is quite low, being only between 0.00365~3.6%, while the value of q lies between 10~145% and is usually higher than that of p. The interactions between customer markets will stimulate the diffusion rate of a new product and increase its ownership in the market.

4. Positive Analysis

4.1. Analytical Model

The Bass diffusion model is a suitable means to simulate the scenario in which a new product sells slowly in its initial phase, and, through the implementation of an electrification policy, its sales start to accelerate and its ownership starts to increase. This study uses the Bass diffusion model to assess the market for eLCV shared architecture in Taiwan. The formula for the Bass diffusion model is as shown in (1).
d N t d t = n t = p ( M N t ) + q N t ( M N t M ) = ( M N t ) × ( p + q × F t )
where the related notations (parameters) and their definitions are shown in Table 3.
Through the integration process, the formula is revised, as in (2), to estimate the optimized parameters. The following notations used are the same as the content in Table 3.
N t = M × 1 e ( p + q ) t 1 + q p e ( p + q ) t
At the present time in Taiwan, none of the eLCV models have entered the stage of mass production, and it is not clear when the electrification policy will come into effect. That is, there is no historical data available to estimate. Thus, it is necessary to simulate the data of new adoptions of AFVs for the future years by Scenario Analysis, which refers to the other studies to establish the assumptions [33,46]. In a study in Thailand, Saisirirat, Chollacoop, Tongroon, Laoonual and Pongthanaisawan (2013) assume that penetration would follow the Diffusion of Innovation Theory and that the share of EVs in new registered vehicles would gradually rise in the Thai market annually [46]. Brdulak, Chaberek and Jagodziński (2021) forecast the diffusion of EVs in the EU states by the Nonlinear Least Squares (NLS) Method, and the potential market scale would achieve about 70% to 100% of the potential market [33]. Additionally, BNEF forecasts that eLCVs would account for 10% in the sales of LCVs by 2025 [7]. In summary of the above-mentioned studies, by means of Scenario Analysis and the NLS Method, this study assesses the market development parameters and constructs five common assumptions. They are as follows:
Assumption 1.
At present, the launch time for the electrification policy for the LCVs in the six categories is not clear. It is assumed that the policy implementation starts in the year t.
Assumption 2.
The maximum size of the potential market in which LCVs are replaced by eLCVs is 457,969 units (Table 1). If the diffusion of electrification proceeds well, the eLCV ownership will reach the potential market ownership, i.e., the full penetration (F = 100%).
Assumption 3.
Transportation vehicles have a long period of service life. In this model, the number of newly-registered eLCVs is the sum of the number of current fossil fuel LCVs that are replaced by eLCVs and of the net increase in the number of registered eLCVs. It is also assumed that the performance of eLCVs is consistent with that of fossil fuel LCVs.
Assumption 4.
The LCVs in the sixth category are the priority subjects for adopting the eLCV shared architecture. The main demand for eLCVs comes from the replacement of fossil fuel LCVs and new purchases. The assumption is that the number of new purchases every year is 3728 units, and they are all eLCVs. The replacement with eLCVs accounts for 2% of the annual replacement of demand in t = 1 and rises each year to 4%, 6% and 8% during t = 2 to t = 4. The policy of electrification for LCVs in the sixth category is put into effect in t = 5. Furthermore, the rate of adoption of eLCVs since t = 5 will be adjusted in accordance with the extent of the policy’s implementation.
Assumption 5.
Each year, the LCVs in the first to fifth categories are all replaced with eLCVs when they reach the end of their service life.
The main demand for LCVs in the Taiwan market is from light trucks, and the government has not passed any law limiting or regulating their service life. The extent and frequency of replacing light trucks with eLCVs decides the wide-spread adoption rate of eLCVs. Thus, this model assumes that, after the shared architecture of eLCVs enters the stage of mass production, the replacement rate of the LCVs in the sixth category will be affected by the different intensities of government support. The intensities of promoting the rate of replacement of eLCVs are divided into four levels: 100%, 75%, 50% and 25%. In addition, because the global automakers have only made slow progress in developing eLCVs, in the initial phase of promotion, the eLCVs in the sixth category only account for 10% of annual sales [7]. Thus, the scenario in which the replacement rate is 10% is also simulated. There are five scenarios of full penetration in accordance with the intensities of promoting eLCVs. Another important factor that affects the eLCV market diffusion is battery packs, the price changes of which are deeply connected to the vehicle electrification market. Thus, the model that incorporates the price changes of battery packs is also established. In the scenarios in which the replacement rates are 100%, 50% and 10%, the factor of battery pack price is also taken into consideration.

4.2. Results of the Analysis

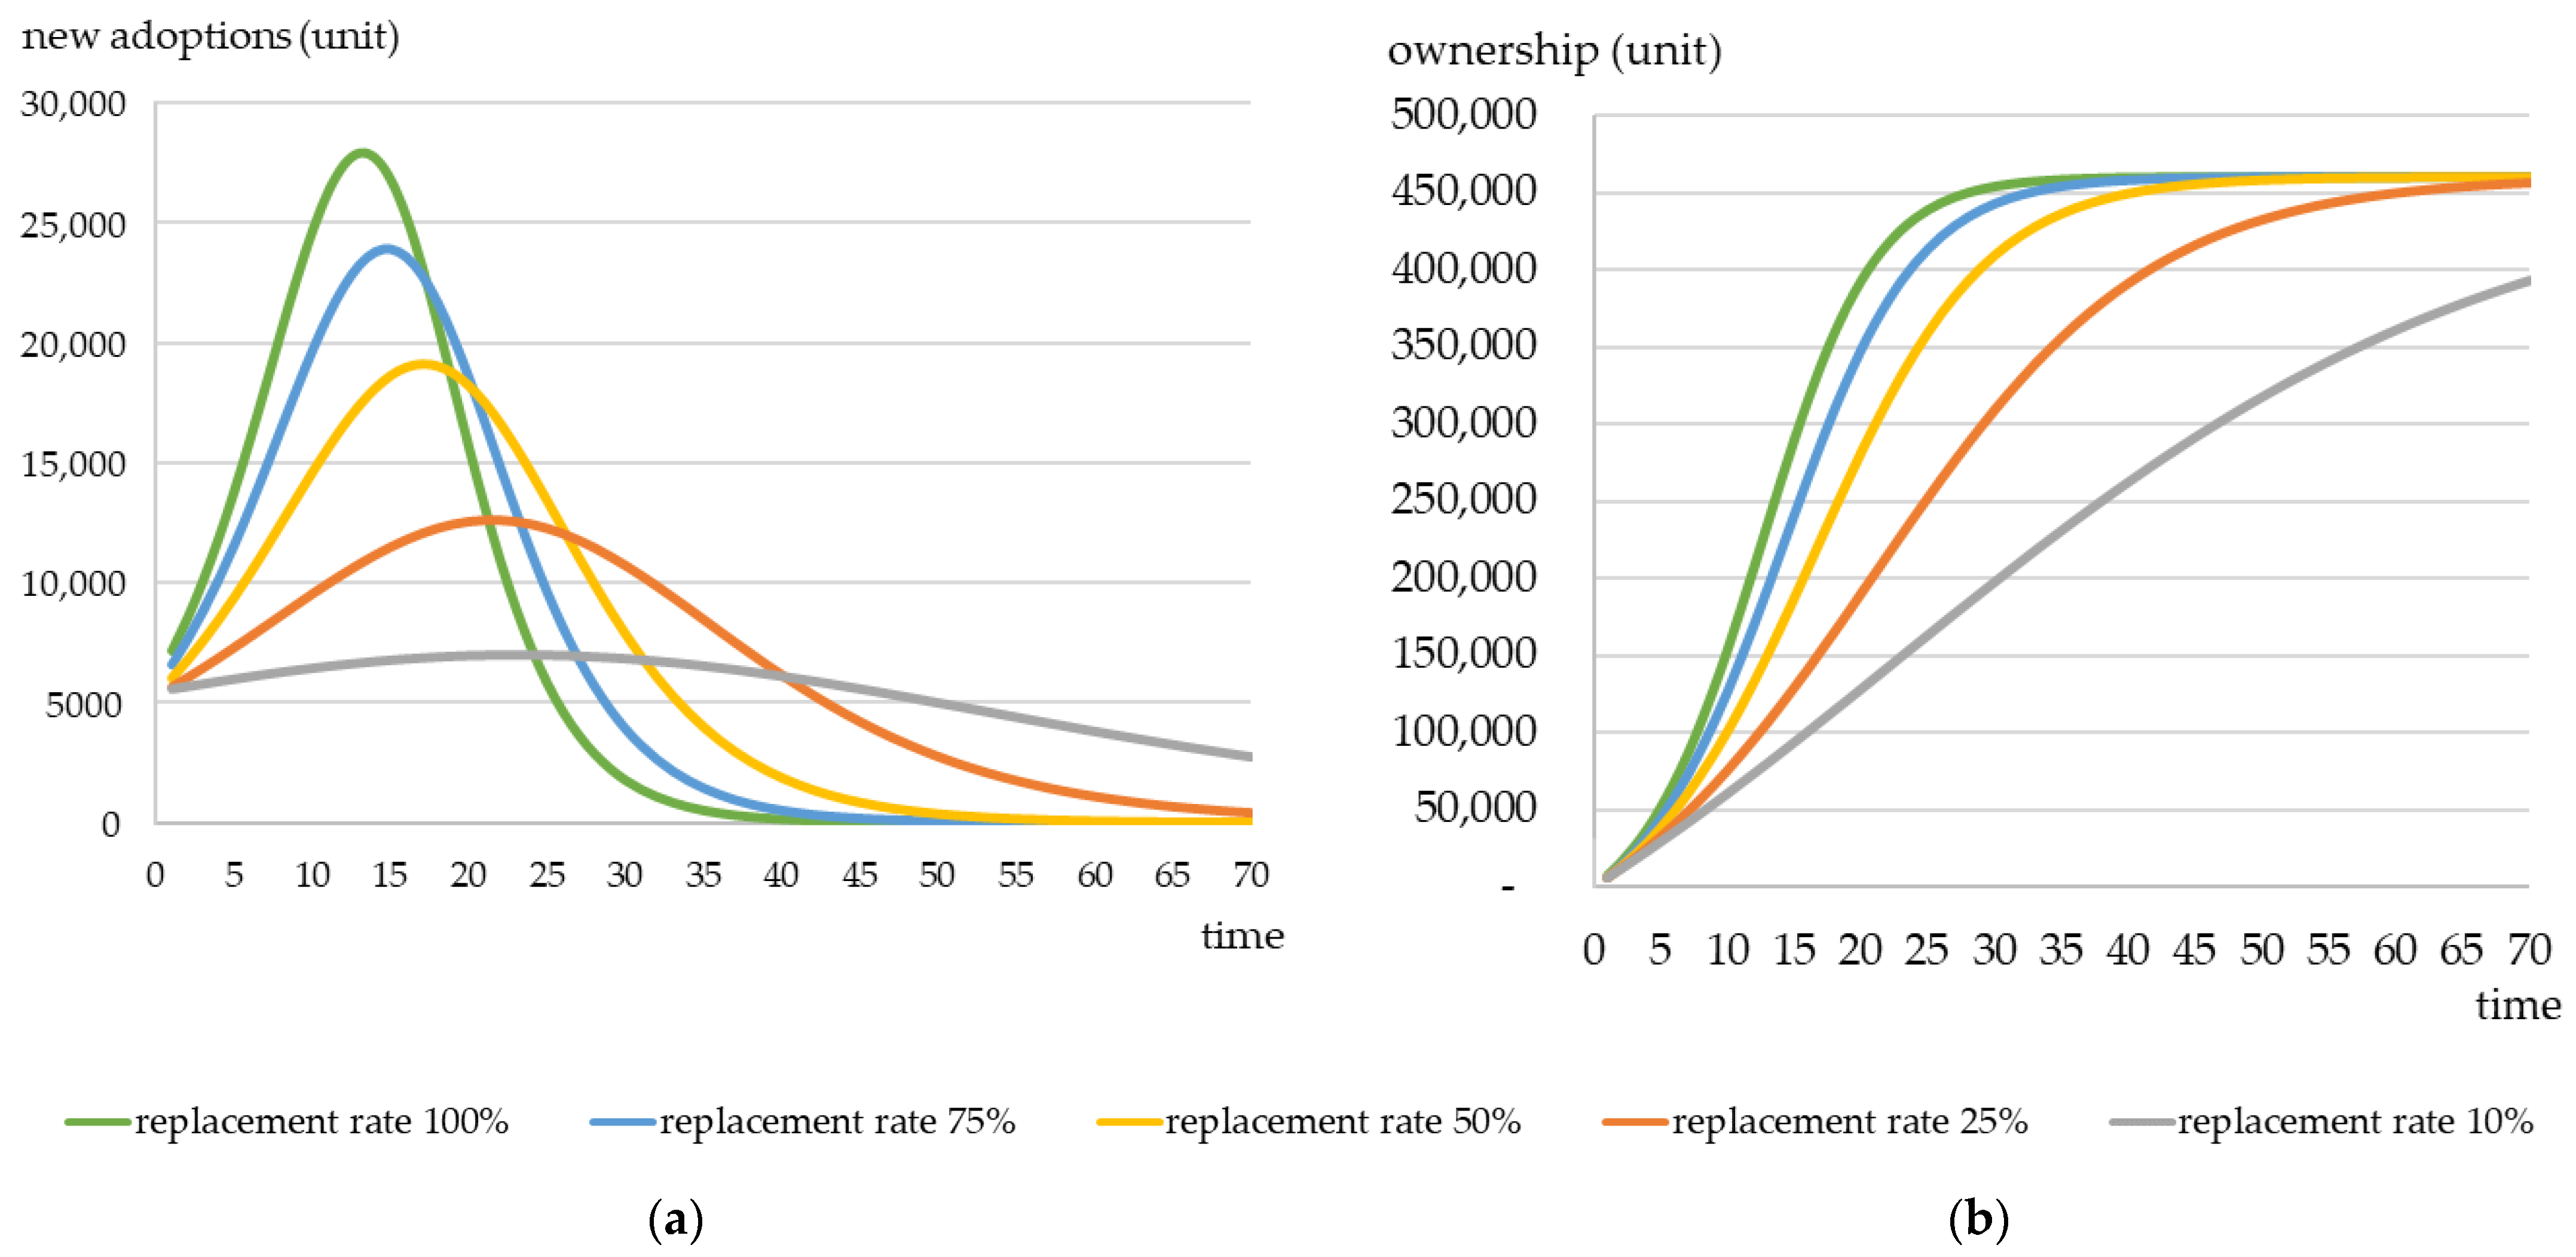
4.2.1. Simulation Results of Full Penetration in the Different Scenarios

In accordance with the replacement rates of 100%, 75%, 50%, 25% and 10%, five scenarios of full penetration are established with a high coefficient of determination R2, which denotes that there are good properties of fit to the simulated dataset. The methodology referring to Brdulak et al. (2021) causes this similar condition that the model could fit the observations well [33]. Additionally, the estimated value of the diffusion rates corresponds with those of past studies (Table 4) [45]. After the shared architecture enters the stage of mass production, the most optimistic scenario is where the replacement rate for light trucks is 100%. Regardless of whether the customers make new purchases or buy new eLCVs to replace their old cars, they all choose eLCVs. Thus, this scenario has a higher p, which is 1.56%, and a higher q, which is 21.07%. Its peak in terms of the new increase also comes the fastest. The most conservative scenario is where the replacement rate is 10%. Its p is 1.21% and its q is 3.21%, both being the lowest among all the simulation results. In this scenario, the peak of new increases is also reached the most slowly. The numbers of p and q for the other scenarios fall in between these two scenarios.
As a whole, with the higher replacement rate, the estimated parameters and the number of newly adopted eLCVs are also higher. The peak of replacement also arrives sooner. The time periods for the replacement peaks all fall between 13 and 23 years (Figure 2). In other words, to accelerate the replacement of eLCVs, the government has to adopt regulatory policy tools, including banning the sale of fossil fuel LCVs and implementing the Corporate Average Fuel Economy Standards (CAFE) and Vehicle Emission Standards [47]. On the other hand, compared with fossil fuel LCVs, eLCVs lack a competitive edge in the average TCO per mile and the purchase cost [48]. The acceptable selling price of eLCVs falls in the range of NTD 500,000 to 600,000. Without any subsidy, the selling price of eLCVs may be 2.5 times higher than that of LCVs. Thus, in the initial phase of promotion, the government will adopt economic measures to increase the cost of using fossil fuel LCVs, such as the imposition of carbon taxes. The government could also provide financial incentives to encourage customers to purchase eLCVs or to encourage automakers to produce eLCVs [41].
Given the above-mentioned issues, at present, it is not likely that the customers will be motivated by their own environmental awareness and then switch to eLCVs [49]. Effective and clear policy support is needed. For example, the public sector should take the lead in adopting eLCVs. The government should provide purchase subsidies and create a user-friendly environment. However, in practice, achieving the replacement rate of 100% demands abundant government resources. From the perspective of the government fiscal balance and legal authorization, it is difficult to achieve a 100% replacement rate. With the implementation of multiple complementary measures, the possible replacement rate is between 50% and 75%. That corresponds with the suggestion from Saisirirat et al. (2013) [46].

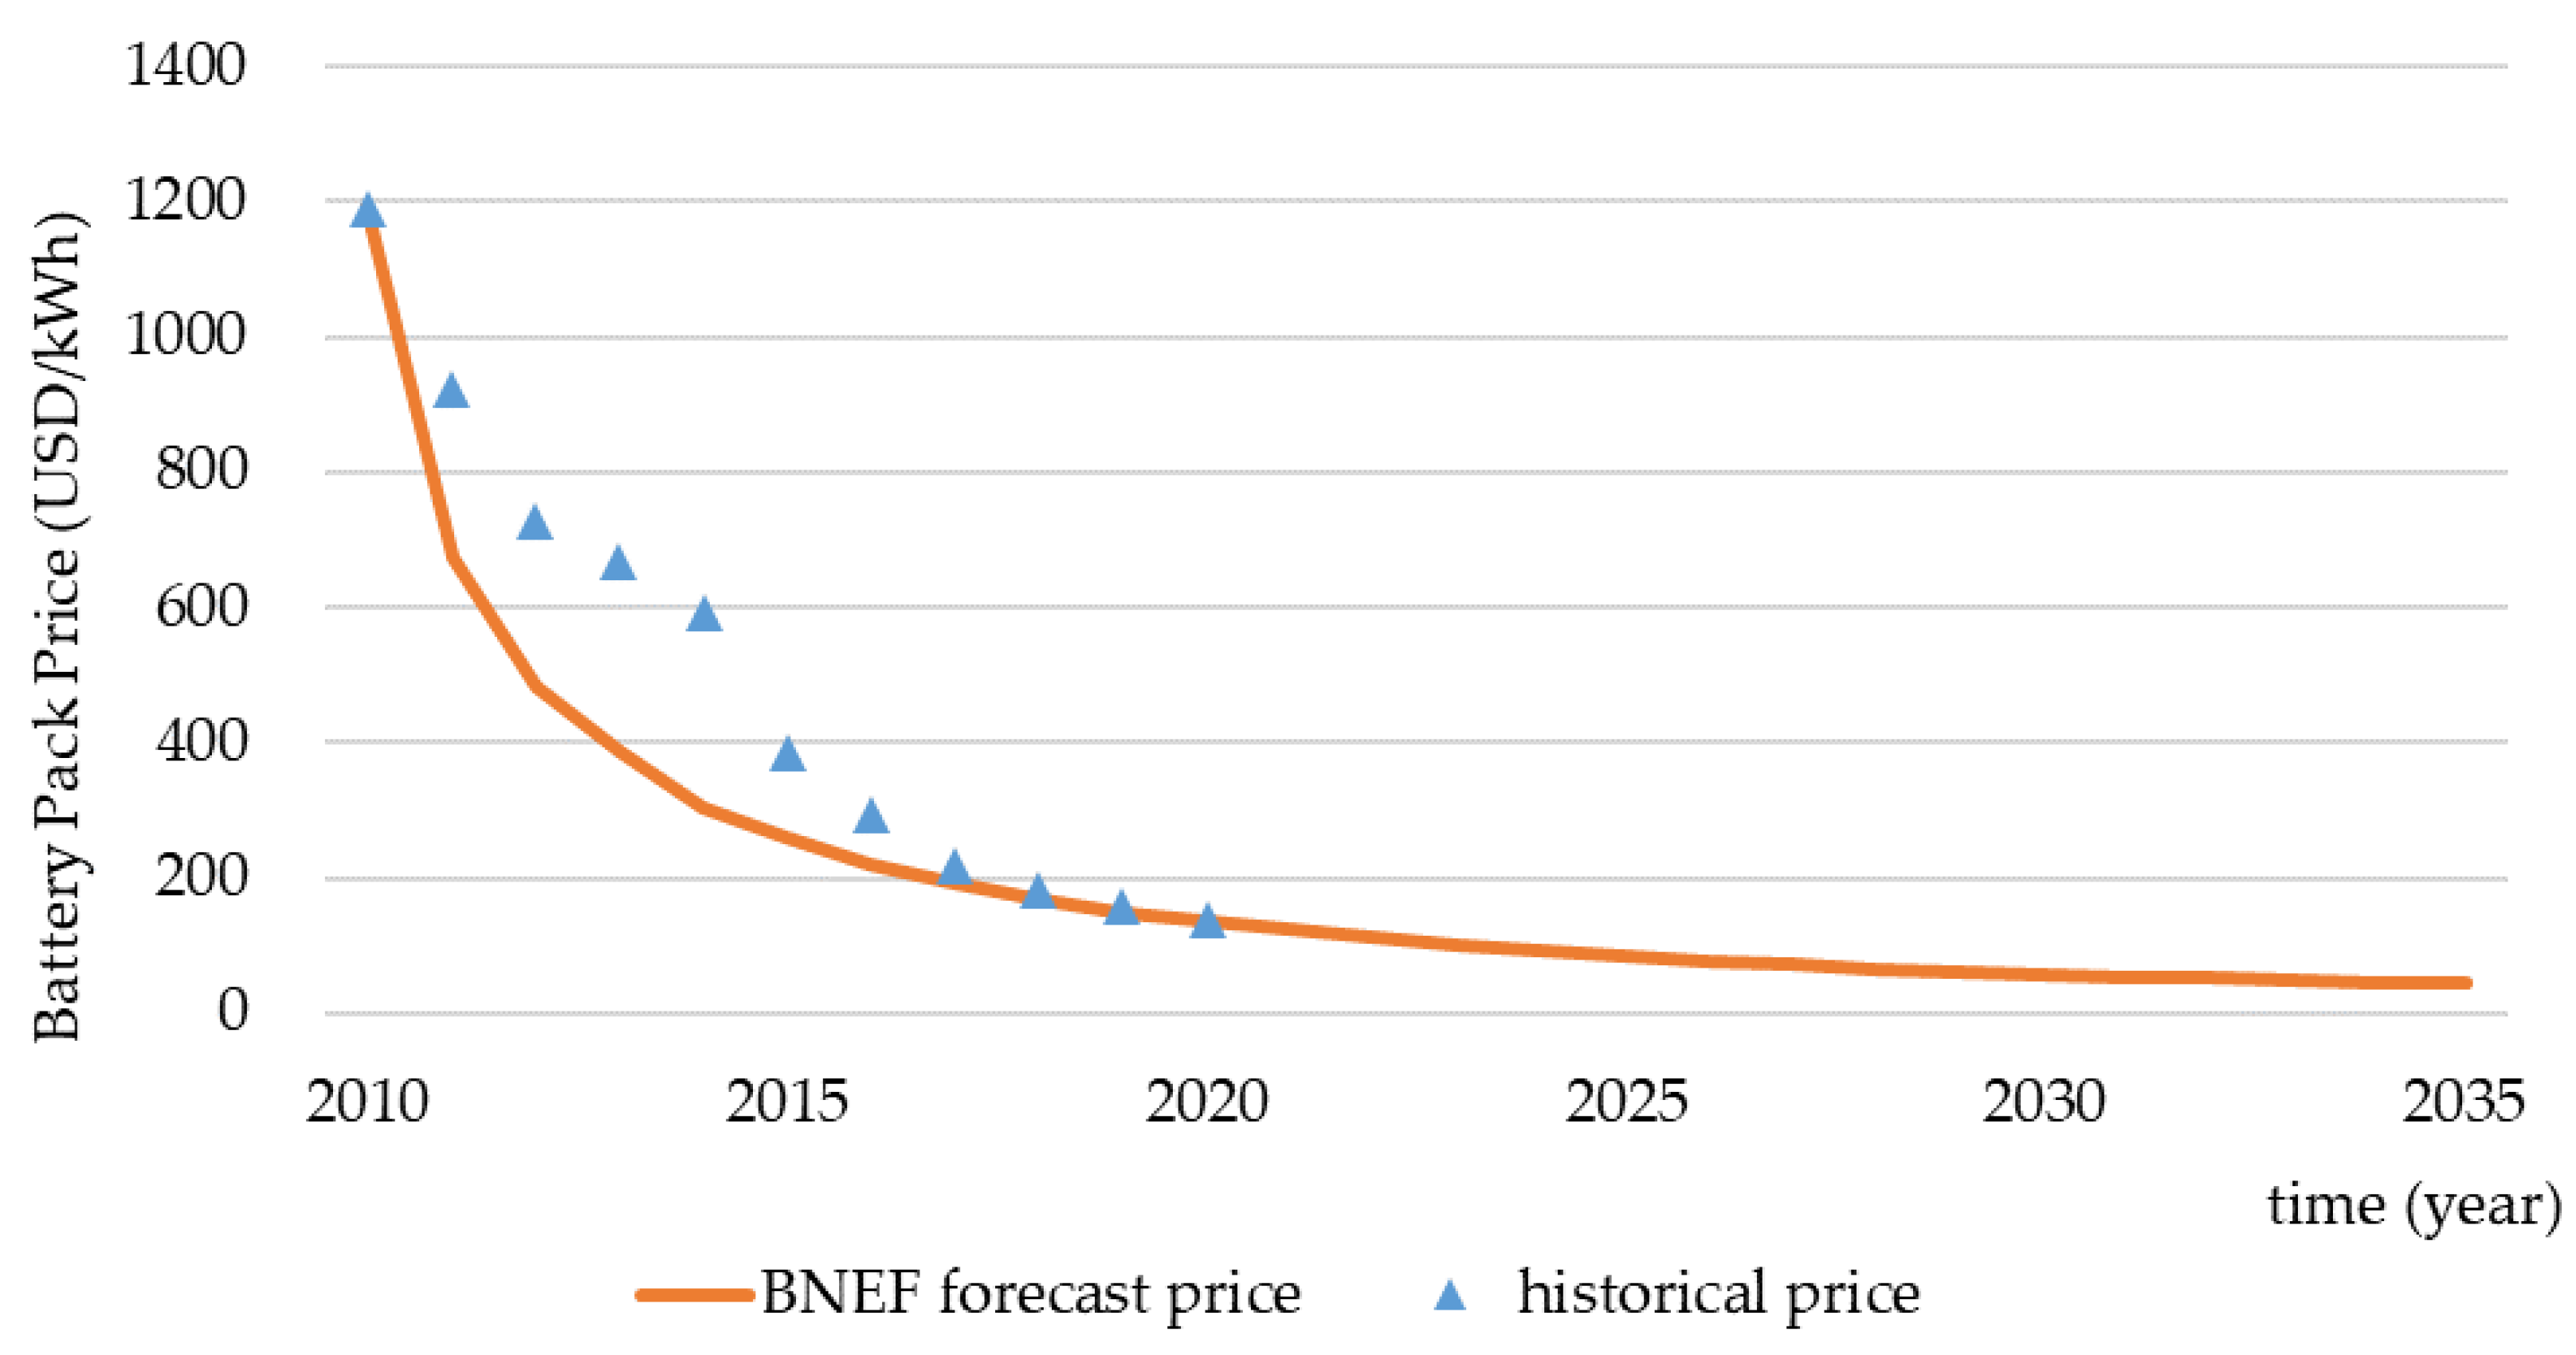
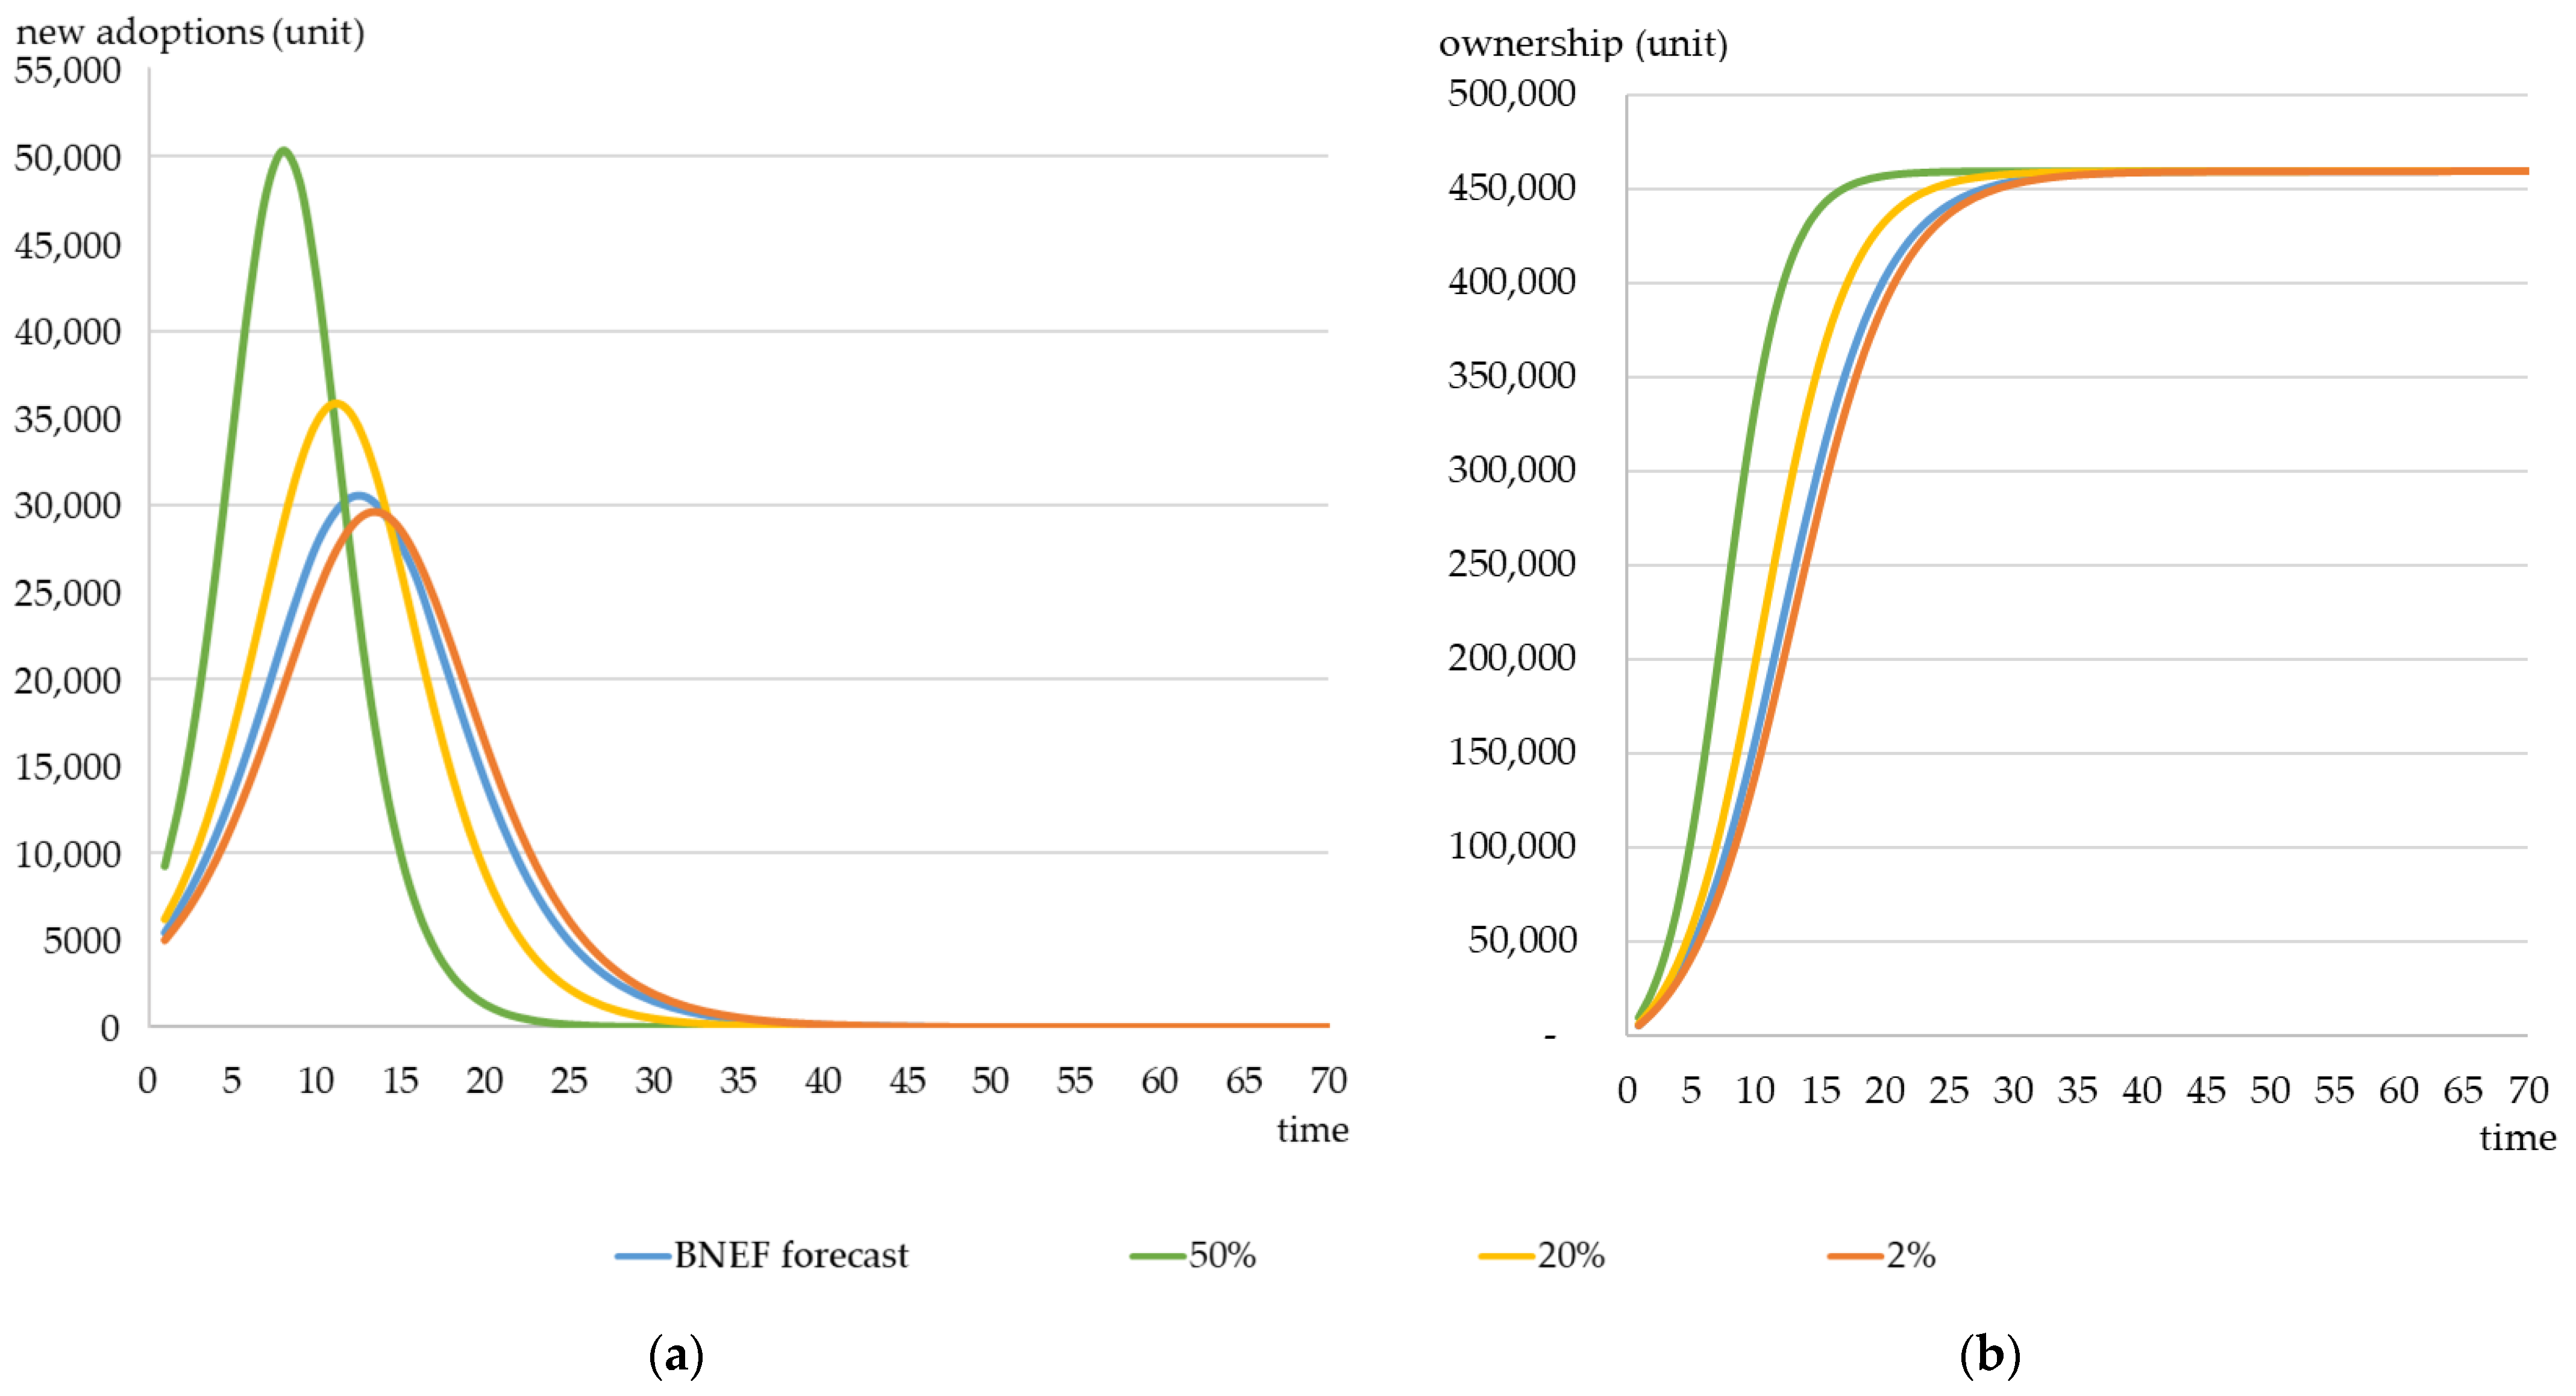
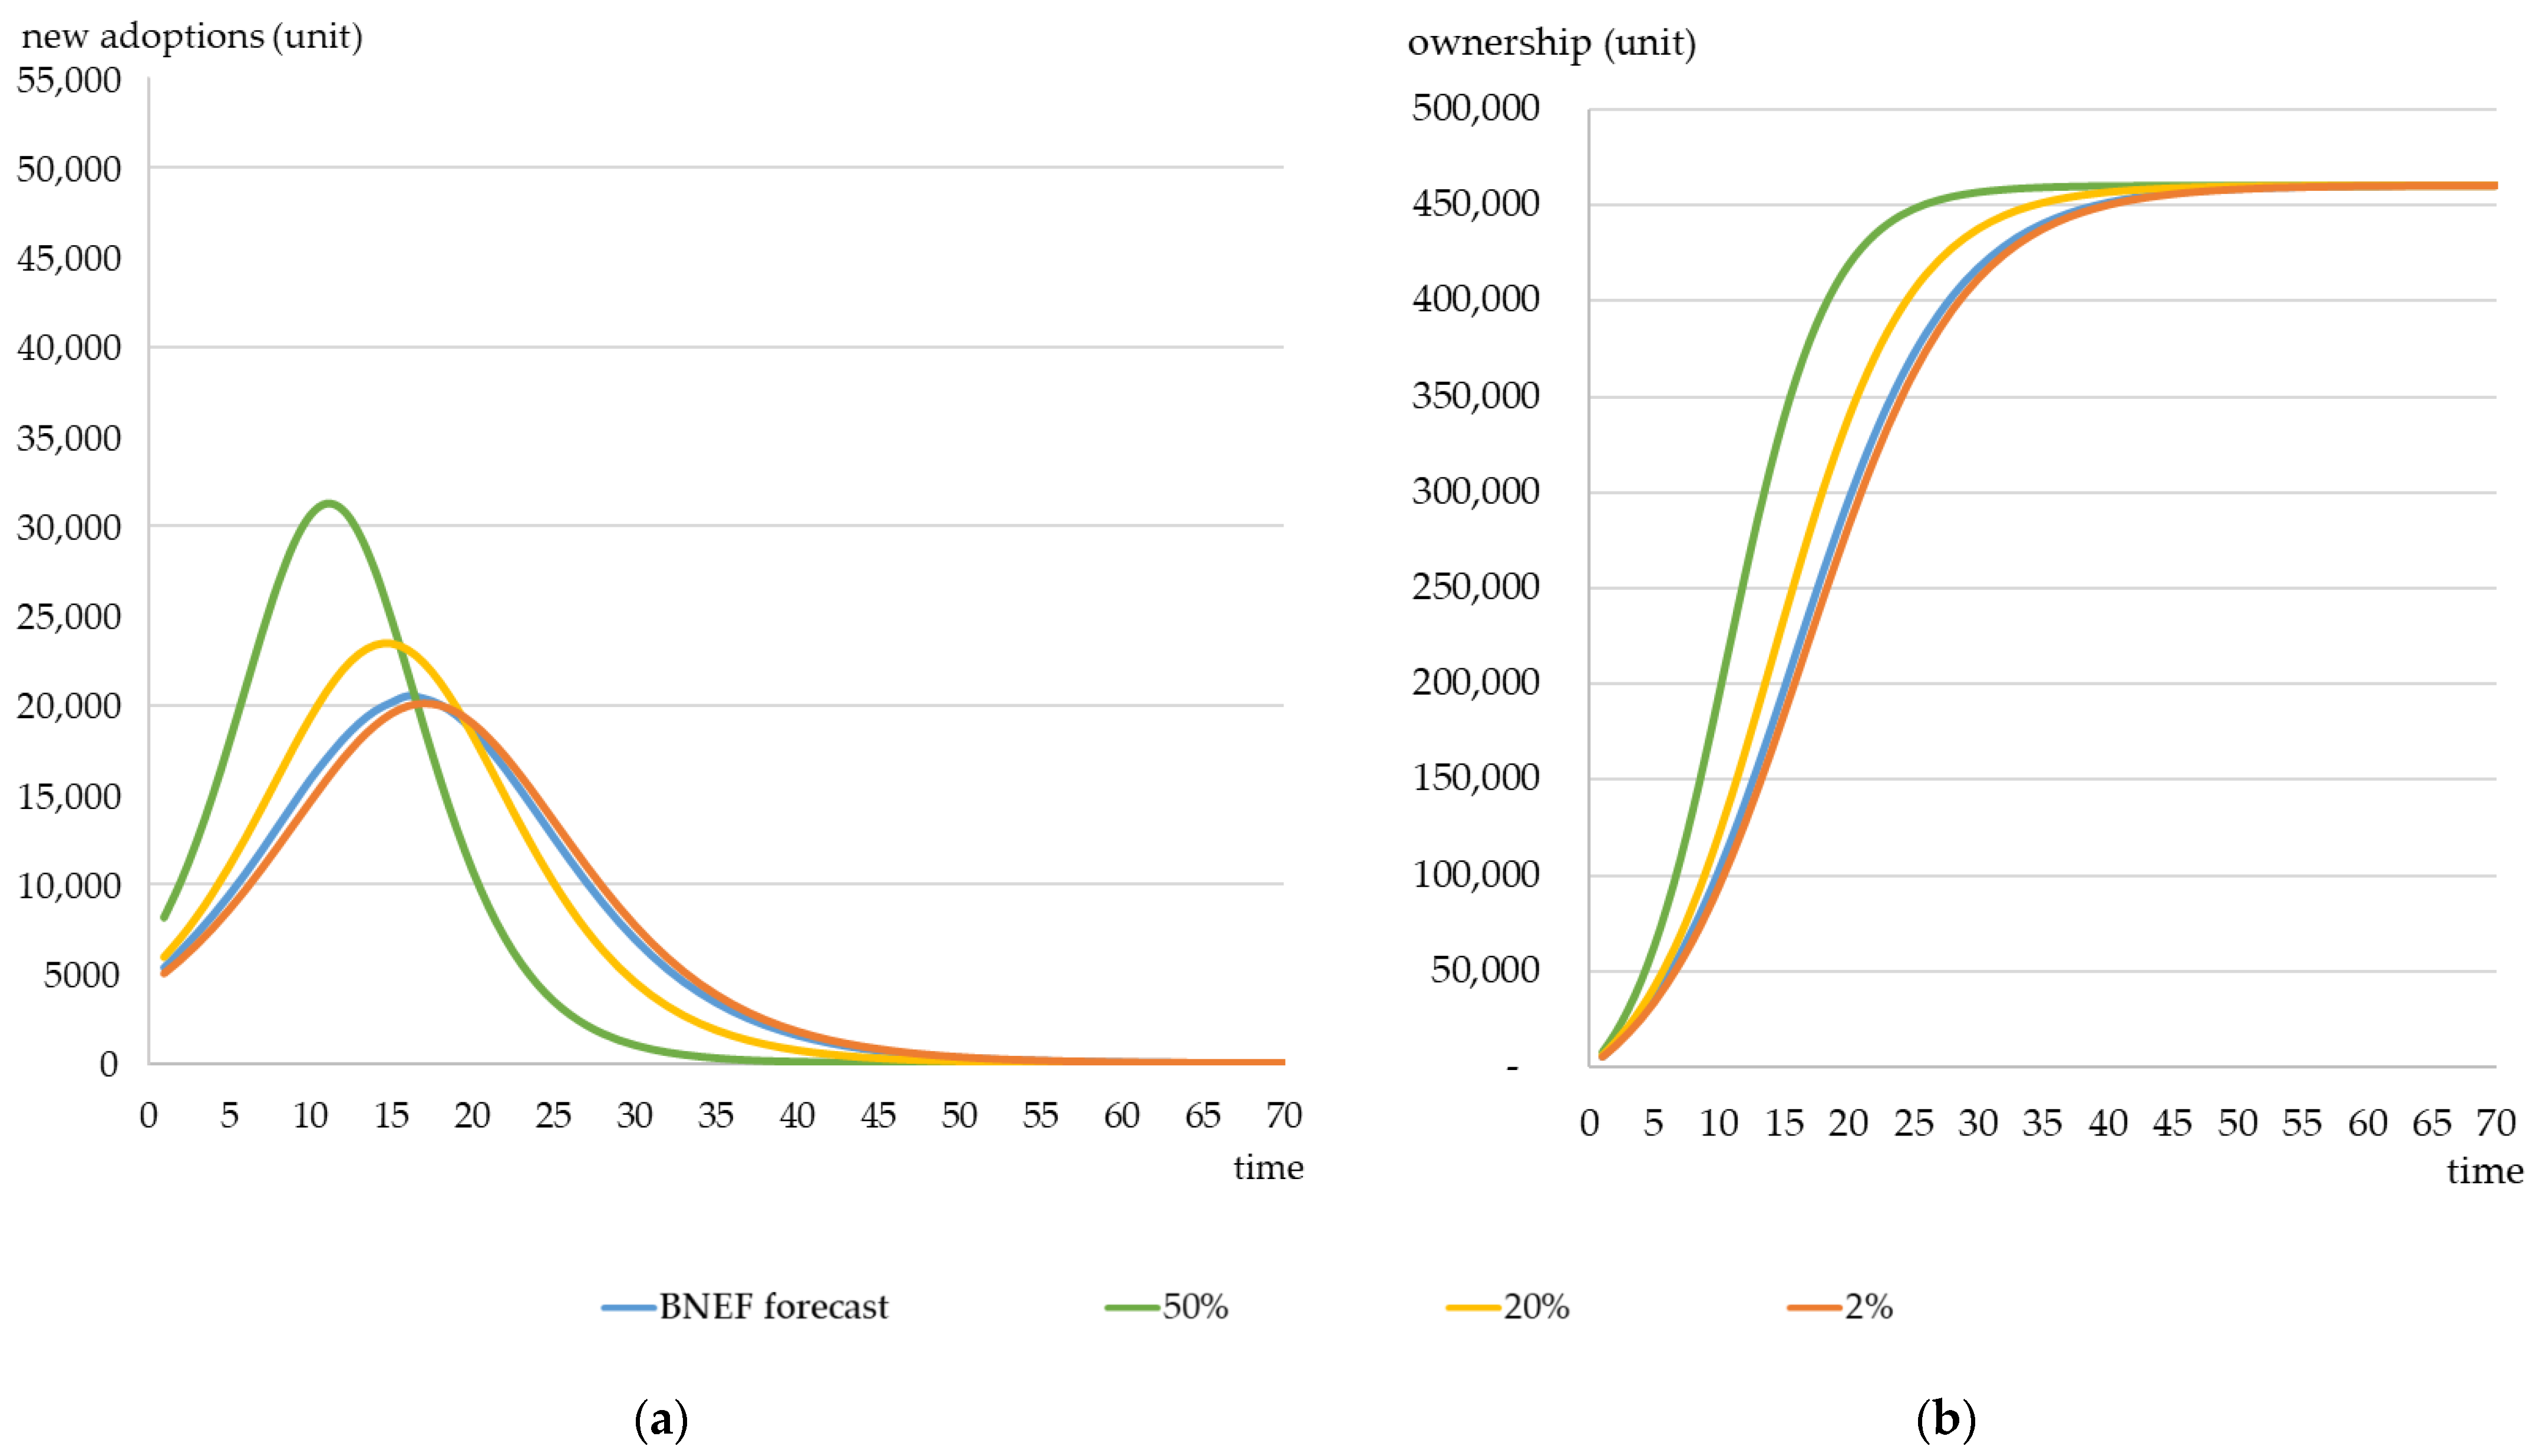
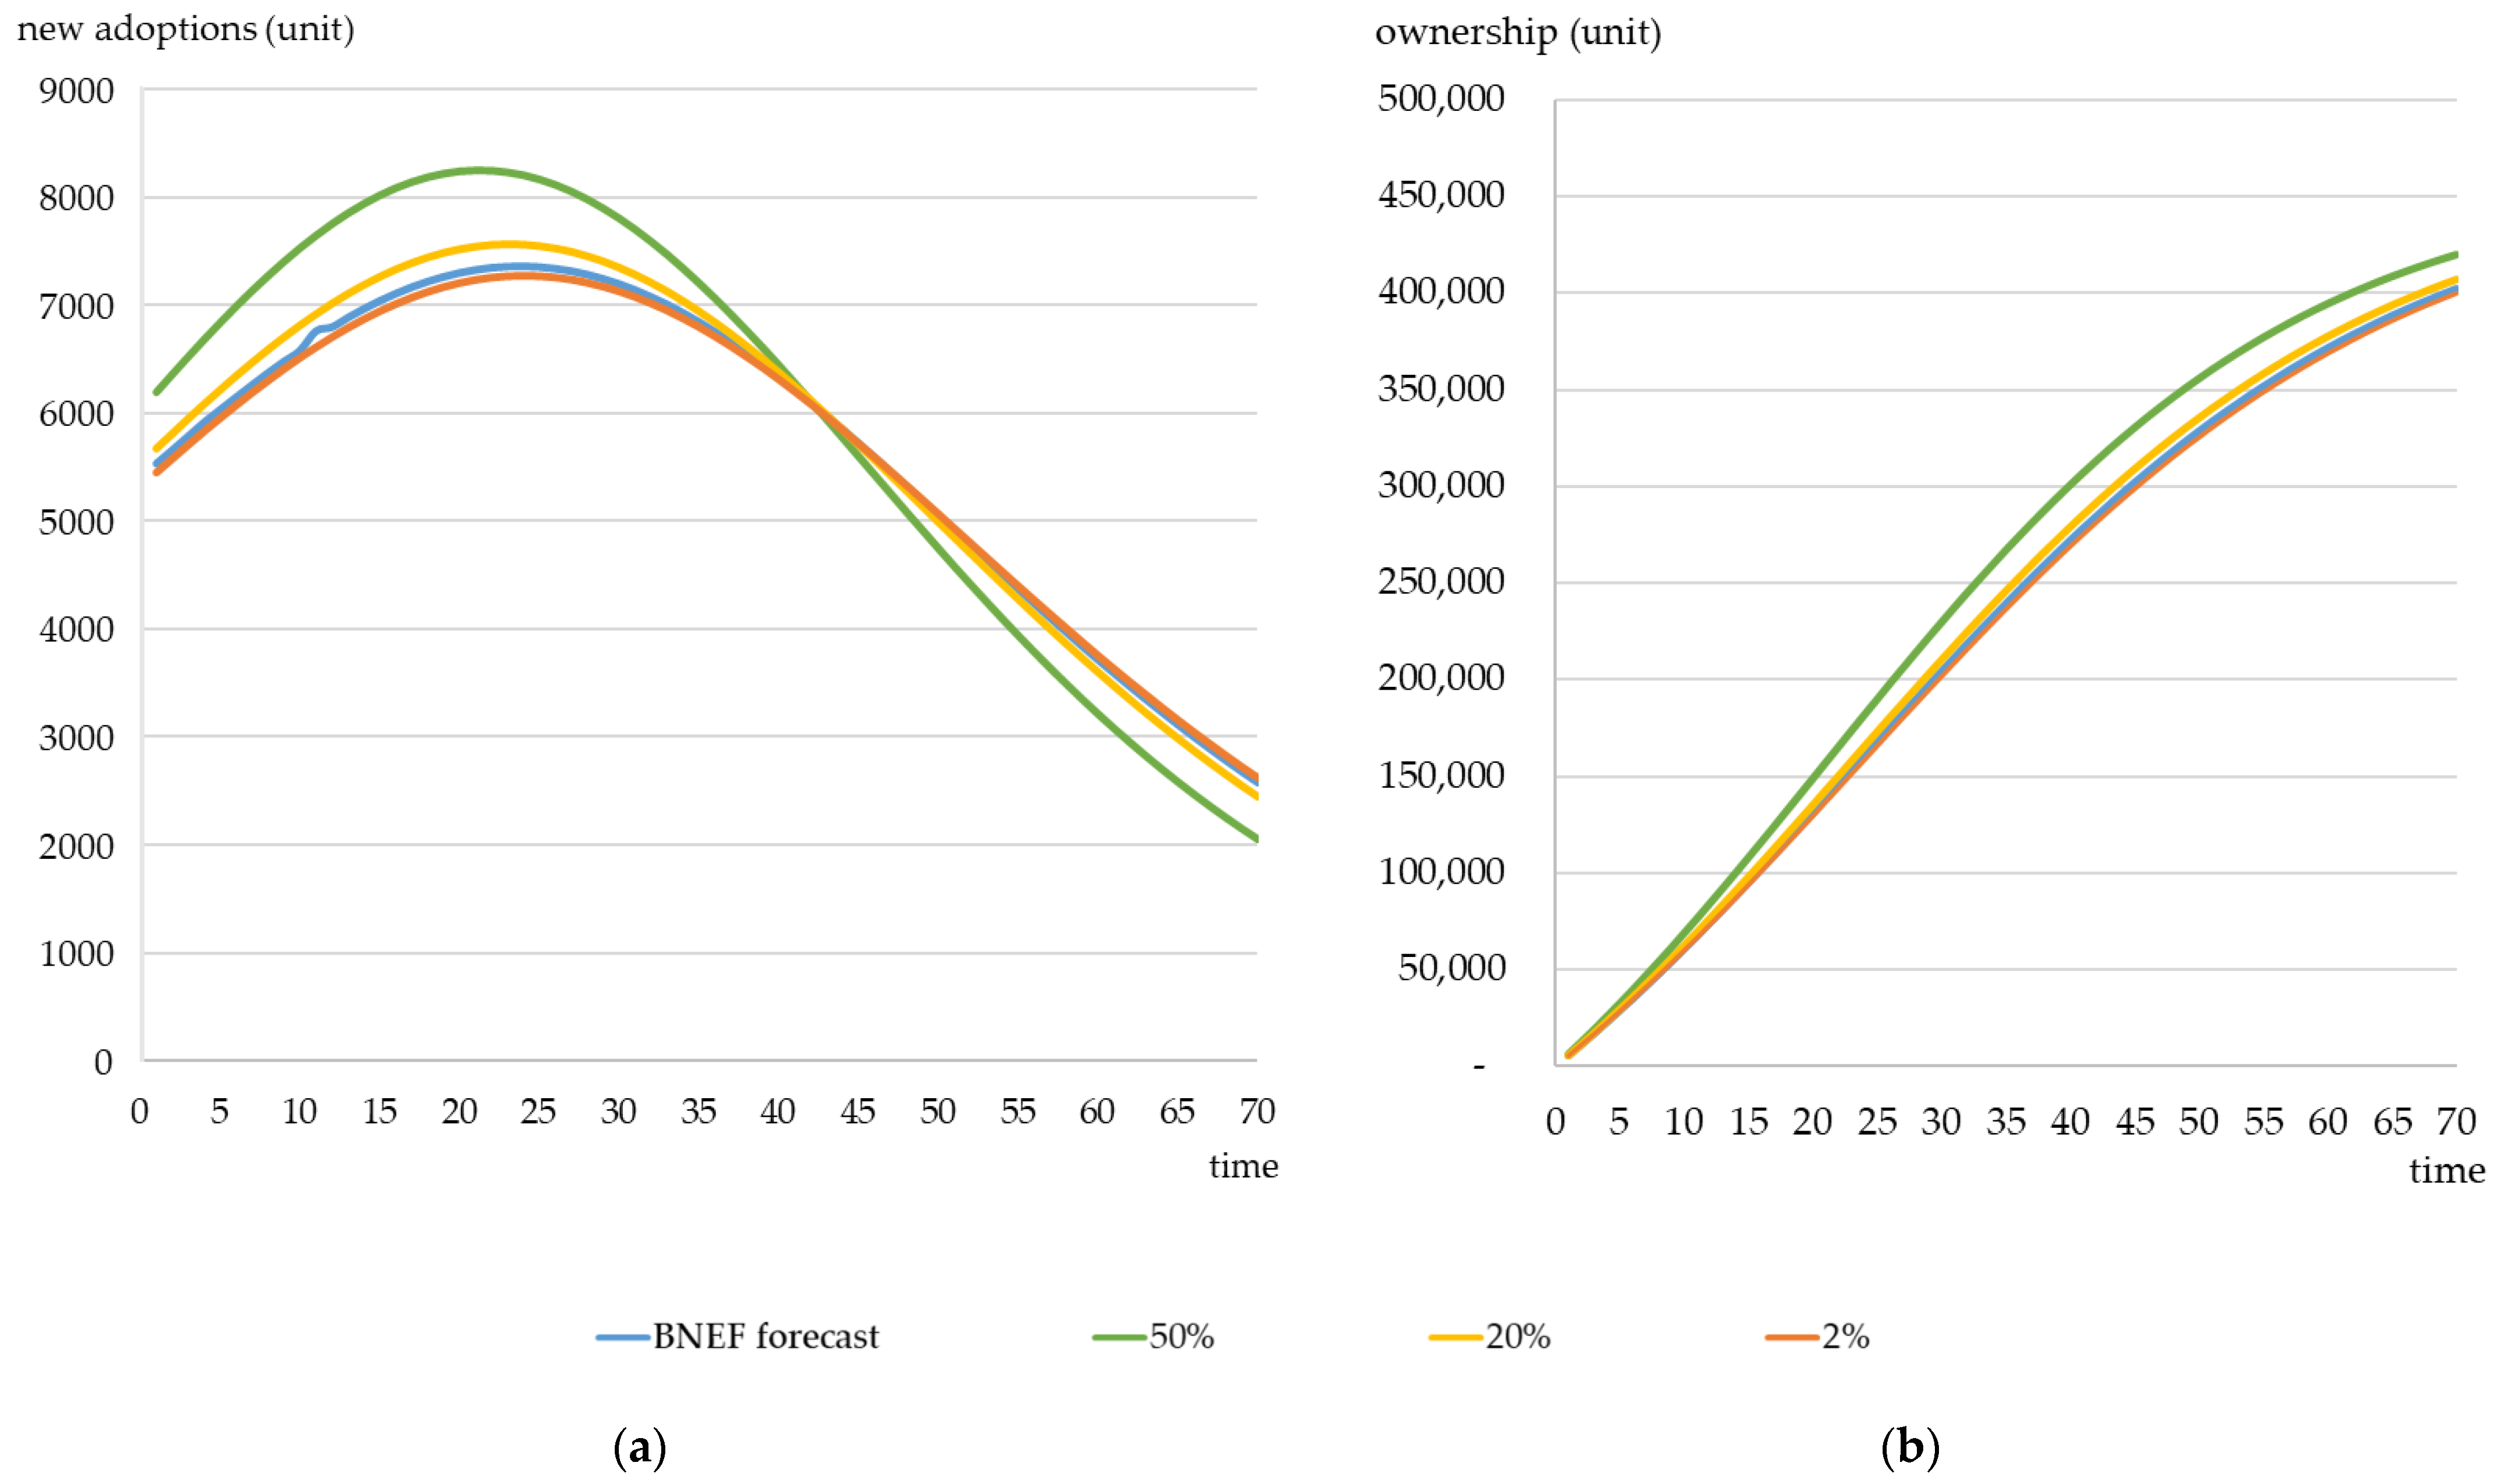
4.2.2. Simulation Results of Full Penetration in the Scenarios with Different Battery Pack Prices

The EV industry has become part of the global transport trend. The main cost of EVs comes from battery packs. Prohibitive battery pack costs and selling prices have been the main barriers to the promotion of EVs. However, with the involvement of global enterprises in the deployment of related supply chains, the cost of a battery pack is expected to fall, which in turn will lead to a reduction in the selling price. The overall development will boost the availability of EVs. According to BNEF, in 2020, the average price of a battery pack went down to $137 per kWh. It is estimated that the price will fall to $84 per kWh in 2025, to $57.7 in 2030 and to $45.1 in 2035. By 2035, the price drop will gradually narrow to 4% from 10%. The extent of the annual price drop will be lessened year by year (Figure 3) [7].
The price of a battery pack deeply affects the diffusion rate of eLCVs. Here, the factor of price is included into the Bass diffusion model and serves as a variable. The Bass diffusion model is expanded to become the Generalized Bass Model, as in (3):
N t = 1 e X ( t ) ( p + q ) 1 + e X ( t ) ( p + q ) ,   X ( t ) = t + β p ln [ P r ( t ) P r ( 0 ) ]
  • where the following notations used denote:
  • X(t) is the coefficient of the battery pack price,
  • Pr(t) is the unit price of the battery pack at time t.
  • βp is the price elasticity.
  • The definition of others refers to Table 3.
The tendency of the battery pack price to fall is very likely to accelerate the market penetration. This study assesses the parameters p, q and the price elasticity of a battery pack on the basis of the estimated price according to BNEF in the scenarios with 100%, 50% and 10% replacement rates. The battery pack industry is one of the emerging industries. Although the future price of a battery pack will tend to move downward, the overall market price still fluctuates with technological advances and raw materials, and the extent of the price drop is not clear. Under the condition of constant p, q and price elasticity, the scenarios in which different extents of price drops occur are established, i.e., the extents of the price drops are individually based on the BNEF estimates: constant 2%, 20% and 50% per year. As shown in Table 5 and Figure 4, Figure 5 and Figure 6, the simulation results indicate that the price elasticity in Taiwan’s eLCV market would probably be high and that the price changes will raise the number of new adoptions and are likely to cause the peak year of new adoptions to arrive sooner. The price changes will also stimulate the market sales and replacement rate. The simulation results in Table 5 also show that, affected by the price elasticity, the parameter p will be lower, and q will be higher compared to the scenario in which the price factor is not considered. A price drop could precipitate the penetration of eLCVs in the market, especially for the replacement of used vehicles with new ones. In a scenario with a higher replacement rate, the price sensitivity is also higher. Thus, in the scenario of a rapid price drop, the peak of the replacement will be higher.
Figure 4, Figure 5 and Figure 6, respectively, illustrate the scenarios for 100%, 50% and 10% replacement rates, the numbers of new adoptions and ownership, which are simulated in accordance with annual battery pack price drops of 50%, 20% and 2%, and the estimated trends provided by BNEF. In the scenario with a 100% replacement rate, the price elasticity is at its highest. It is −107.22%. Figure 4 also shows that the number of new adoptions is the variable most affected by the price change. In the scenarios in which the price drops by 50% and by 20%, the peak years of new adoptions arrive earlier than expected, and the numbers also increase, making prominent the importance of market sales and replacement promotion. In the scenario with a 50% replacement rate, the price elasticity of battery packs is −83.97% (Table 5). As shown in Figure 5, when the price drops by 50% and by 20%, the peak years of new adoptions arrive earlier than expected, but the numbers for the replacement peaks also increase. The extent of being affected by price changes is obviously less than that for the scenario of the 100% replacement rate. In the scenario for the 10% replacement rate, the price elasticity of battery packs is only −20.07% (Table 5). Figure 6 shows that, in this scenario, the extent of being affected by a price change is less than that in the scenarios for 100% and 50% replacement rates.
According to Safari (2018), due to the limitations of current manufacturing technology, without policy support, it is still difficult for EV parts, such as battery packs, to compete with conventional fossil fuel vehicles before 2040 [50]. In other words, the financial subsidies or tax credits provided by the government have a great influence on the cost of adopting eLCVs. Although the effects of price drops, as illustrated by the simulation results, are not equal to the effects brought about by government subsidies, the drop in the battery pack price still implies a direct reduction in the purchase cost of eLCVs. They do have similar effects. By comparing the three scenarios in Figure 4, Figure 5 and Figure 6, this study finds that the decrease in purchase cost does expedite the diffusion of eLCVs. However, according to the study by Li et al. (2019), which investigates the Chinese EV market, a policy which blindly grants subsidies may lack cost effectiveness [41]. The government subsidies should be complemented by other policy support to be beneficial to the penetration of eLCVs. For the Taiwan government, based on its past experience of promoting the replacement of HEVs, increasing the usage cost of fossil fuel vehicles may be more effective than granting subsidies to encourage the replacement of LCVs [51]. In addition, the subsidy recipients also affect the effectiveness of the policy implementation. Related studies by Li et al. (2019), Tian (2014) and Foggia (2021) show that the provision of subsidies to automakers or enterprise fleets is helpful to the promotion of eLCVs and to the R&D activities of the EV industry [41,52,53].

5. Conclusions

Vehicle electrification has become a well-recognized measure of reducing carbon emissions. From the perspective of technical skills, Taiwan is capable of building a whole LCV. The current ownership of LCVs is 457,969 units. The annual replacement demand for eLCVs is estimated to be 20,221 units. The production threshold for the automakers to develop this new type of car is 5000 units. This means that the maximum potential demand for eLCVs is sufficient to support the automakers to develop eLCV shared architecture in Taiwan. Thus, this study applies the Bass diffusion model to simulate the scenarios for different eLCV penetration rates and battery pack prices. The simulation results show that the peak years of replacement are found to lie between the 13th year and the 23rd year after the eLCV replacement policy is implemented. The penetration of eLCVs is highly related to the intensity of policy support. In addition, the result also indicates that Taiwan’s eLCV market has a high price elasticity, and in the future, a tendency for the battery pack price to decline may speed up the replacement process. This also implies that an expansion in government subsidies will provide practical help to further promote eLCVs.
This study’s results could serve as valuable policy suggestions as the government seeks to implement related policies. The penetration of eLCVs is not only related to the economic size but is also highly correlated with the factors of prices, market mechanisms and the sufficiency of charging infrastructure, which are of major concern to the customers. Considering the simulation results, the factors mentioned above and the governmental goal of stimulating electric vehicle electrification, the LCV fleets within the logistics industry are thought to be the priority subjects for the adoption of eLCVs. In addition, during the process of promoting vehicle electrification, there would be more innovative business being conducted, such as the demand for reused battery packs and used car exports. The automakers could also deepen and seize the business opportunities provided by vehicle electrification to maximize the commercial benefits.
Given the above-mentioned issues, this paper is one of only a few studies that apply the quantitative model as a tool to analyze the Taiwan eLCV market. In Taiwan, developing eLCV shared architecture is feasible but is still in need of policy support and incentives for customers. In this way, the enterprises and the private customers will be encouraged to adopt eLCVs through the market mechanisms. However, the Taiwan EV industry is still in the early stage of development, and related data are limited. Therefore, this study only focuses on promoting the electrification options of transport vehicles of current priority. Parameters such as electricity cost, intensity of carbon dioxide and TCO for electric vehicles will be the direction in the future studies as relevant information is more complete.

Author Contributions

Conceptualization, I.-H.W. and F.-M.W.; methodology, I.-H.W. and C.-H.C.; validation, I.-H.W.; formal analysis, I.-H.W. and C.-H.C.; investigation, I.-H.W.; data curation, I.-H.W. and C.-H.C.; writing—original draft preparation, I.-H.W.; writing—review and editing, I.-H.W.; project administration, I.-H.W. and F.-M.W.; supervision, F.-M.W.; funding acquisition, F.-M.W. and I.-H.W. All authors have read and agreed to the published version of the manuscript.

Funding

This research was funded by the Automotive Research & Testing Center (ARTC), grant number 110-C10-027.

Institutional Review Board Statement

Not applicable.

Informed Consent Statement

Not applicable.

Data Availability Statement

The data of LCVs ownership and new registered numbers are available in a publicly accessible repository that does not issue DOIs. Publicly available datasets were analyzed in this study. This data can be found on https://stat.thb.gov.tw/hb01/webMain.aspx?sys=100&funid=defjsp (access on 21 October 2021), https://data.gov.tw/dataset/96649 (access on 21 October 2021), https://www.sfaa.gov.tw/SFAA/Pages/List.aspx?nodeid=504 (access on 21 October 2021) and https://www.thb.gov.tw/catalog?node=c7805314-3a46-4f0a-8729-d3183f675371 (access on 21 October 2021). The battery pack price data are third party data. Restrictions apply to the availability of these data. The data were obtained from Bloomberg New Energy Finance and are available at https://www.bnef.com (accessed on 21 October 2021) with the permission of Bloomberg New Energy.

Acknowledgments

The authors would like to thank Shih-Fang Lo and Yung-Chen Shih, CIER, for writing advice and corrections to our study.

Conflicts of Interest

The authors declare no conflict of interest.

References

  1. White House FACT SHEET: President Biden Announces Support for the Bipartisan Infrastructure Framework. Available online: https://www.whitehouse.gov/briefing-room/statements-releases/2021/06/24/fact-sheet-president-biden-announces-support-for-the-bipartisan-infrastructure-framework/ (accessed on 26 August 2021).
  2. A Clean Planet for All: A European Strategic Long-Term Vision for a Prosperous, Modern, Competitive and Climate Neutral Economy COM/2018/773 Final. Brussels. Available online: https://eur-lex.europa.eu/legal-content/en/TXT/?uri=CELEX%3A52018DC0773 (accessed on 26 August 2021).
  3. International Energy Agency: CO2 Emissions from Fuel Combustion: Overview. Available online: https://www.iea.org/reports/co2-emissions-from-fuel-combustion-overview#data-service (accessed on 18 April 2021).
  4. Wolfram, P.; Lutsey, N. Electric Vehicles: Literature Review of Technology Costs and Carbon Emissions (Working Paper); International Council on Clean Transportation: Washington, DC, USA, 2016; Available online: https://theicct.org/publication/electric-vehicles-literature-review-of-technology-costs-and-carbon-emissions/ (accessed on 2 April 2021).
  5. Hall, D.; Lutsey, N. Emerging Best Practices for Electric Vehicle Charging Infrastructure; International Council on Clean Transportation: Washington, DC, USA, 2017; Available online: https://theicct.org/publication/emerging-best-practices-for-electric-vehicle-charging-infrastructure/ (accessed on 30 July 2021).
  6. International Energy Agency (IEA). Net Zero by 2050: A Roadmap for the Global Energy Sector; IEA: Paris, France, 2021. Available online: https://www.iea.org/reports/net-zero-by-2050 (accessed on 28 August 2021).
  7. Bloomberg New Energy Finance (BNEF). Electric Vehicle Outlook 2021; BNEF: New York, NY, USA, 2021; Available online: https://about.bnef.com/electric-vehicle-outlook/ (accessed on 21 October 2021).
  8. European Union. Directive (EU) 2019/1161 of the European Parliament and of the Council of 20 June 2019 amending Directive 2009/33/EC on the promotion of clean and energy-efficient road transport vehicles (Text with EEA relevance). PE/57/2019/REV/2 OJ L 2019, 188, 116–130. [Google Scholar]
  9. Foltyński, M. Electric fleets in urban logistics. Procedia Soc. Behav. Sci. 2014, 151, 48–59. [Google Scholar] [CrossRef] [Green Version]
  10. Baroody, L.; Eckerle, T.; Bevan, A. California’s Zero Emission Vehicle Action Plan. In Proceedings of the 33rd Electric Vehicle Symposium (EVS33), Portland, OR, USA, 14–17 June 2020; Zenodo: Geneva, Switzerland, 2020. [Google Scholar] [CrossRef]
  11. National Highway Traffic Safety Administration: Corporate Average Fuel Economy. Available online: https://www.nhtsa.gov/laws-regulations/corporate-average-fuel-economy (accessed on 26 August 2021).
  12. English.gov.cn (The State Council of the People’s Republic of China): Notice by the Ministry of Finance, the Ministry of Industry and Information Technology, the Ministry of Science and Technology, and the National Development and Reform Commission of Improving the Policies on Government Subsidies for Promotion and Application of New Energy Vehicles. Available online: http://www.gov.cn/zhengce/zhengceku/2020-04/23/content_5505502.htm (accessed on 16 August 2021).
  13. English.gov.cn (The State Council of the People’s Republic of China): Notice by the Ministry of Finance, the Ministry of Industry and Information Technology, the Ministry of Science and Technology, and the National Development and Reform Commission of Financial Dupport Policies for the Promotion of New Energy Vehicles in 2016–2020. Available online: http://www.gov.cn/xinwen/2015-04/29/content_2855040.htm (accessed on 7 August 2021).
  14. Department of Statistics, Ministry of Transportation and Communications (MOTC). Private Sedan Usage Survey; MOTC: Taipei, Taiwan, 2019. Available online: https://www.motc.gov.tw/uploaddowndoc?file=survey/202110281340320.pdf&filedisplay=109%E5%B9%B4%E8%87%AA%E7%94%A8%E5%B0%8F%E5%AE%A2%E8%BB%8A%E4%BD%BF%E7%94%A8%E7%8B%80%E6%B3%81%E8%AA%BF%E6%9F%A5%E5%A0%B1%E5%91%8A.pdf&flag=doc (accessed on 2 April 2021).
  15. Estimated CO2 Emissions from the Transportation Sector Over the Years (Institute of Transportation, Ministry of Transportation and Communications). Available online: https://data.gov.tw/dataset/8331 (accessed on 26 August 2021).
  16. [Industry Map Illustration] A Picture to Understand Taiwan’s “E-Commerce Logistics” Industry (MIRAI Business). Available online: https://www.mirai.com.tw/2021-taiwan-ec-logistics-industry-map-analysis/ (accessed on 2 April 2021).
  17. Liu, M.Y.; Chang, C.N.; Chang, T.Y. A Study on the Performance-Based Logistics Model for the Electric Small Truck in the Trucking Industry in Taiwan; Institute of Transportation; Ministry of Transportation and Communications (MOTC): Taipei, Taiwan, 2018. Available online: https://www.iot.gov.tw/cp-78-8143-8e957-1.html (accessed on 24 August 2021).
  18. Business Next: To Manufacture an EV within the Shortest Time Possible! MIH Has Cross-Field Alliances with 1500 Manufacturers to Muscle into Market in the EV Frenzy. Available online: https://www.bnext.com.tw/article/62633/mih-2021-ecosystem (accessed on 6 June 2021).
  19. Taipei Times: Formosa Automobile to Launch Own E-Truck in 2022. Available online: https://www.taipeitimes.com/News/biz/archives/2020/11/12/2003746750 (accessed on 7 April 2021).
  20. Christensen, L.; Klauenberg, J.; Kveiborg, O.; Rudolph, C. Suitability of commercial transport for a shift to electric mobility with Denmark and Germany as use cases. Res. Transp. Econ. 2017, 64, 48–60. [Google Scholar] [CrossRef] [Green Version]
  21. Figenbaum, E. Can battery electric light commercial vehicles work for craftsmen and service enterprises? Energy Policy 2018, 120, 58–72. [Google Scholar] [CrossRef]
  22. Klauenberg, J.; Rudolph, C.; Zajicek, J. Potential users of electric mobility in commercial transport—Identification and recommendations. Transp. Res. Procedia 2016, 16, 202–216. [Google Scholar] [CrossRef] [Green Version]
  23. Tsakalidis, A.; Krause, J.; Julea, A.; Peduzzi, E.; Pisoni, E.; Thiel, C. Electric light commercial vehicles: Are they the sleeping giant of electromobility? Transp. Res. Part D Transp. Environ. 2020, 86, 102421. [Google Scholar] [CrossRef]
  24. Feng, W.; Figliozzi, M. An economic and technological analysis of the key factors affecting the competitiveness of electric commercial vehicles: A case study from the USA market. Transp. Res. Part C Emerg. Technol. 2013, 26, 135–145. [Google Scholar] [CrossRef]
  25. Quak, H.; Nesterova, N.; Van Rooijen, T.; Dong, Y. Zero emission city logistics: Current practices in freight electromobility and feasibility in the near future. Transp. Res. Procedia 2016, 14, 1506–1515. [Google Scholar] [CrossRef] [Green Version]
  26. Frenzel, I. Who are the early adopters of electric vehicles in commercial transport—A description of their trip patterns. In Commercial Transport; Clausen, U., Friedrich, H., Thaller, C., Geiger, C., Eds.; Springer: New York, USA, 2015; pp. 115–128. [Google Scholar] [CrossRef]
  27. Tsakalidis, A.; Julea, A.; Thiel, C. The role of infrastructure for electric passenger car uptake in Europe. Energies 2019, 12, 4348. [Google Scholar] [CrossRef] [Green Version]
  28. Camilleri, P.; Dablanc, L. An assessment of present and future competitiveness of electric commercial vans. J. Earth Sci. Geotech. Eng. 2017, 7, 337–364. Available online: https://hal.archives-ouvertes.fr/hal-01539105 (accessed on 23 March 2021).
  29. Dablanc, L.; Morganti, E.; Arvidsson, N.; Woxenius, J.; Browne, M.; Saidi, N. The rise of on-demand ‘Instant Deliveries’ in European cities. Supply Chain. Forum Int. J. 2017, 18, 203–217. [Google Scholar] [CrossRef] [Green Version]
  30. Kaplan, S.; Gruber, J.; Reinthaler, M.; Klauenberg, J. Intentions to introduce electric vehicles in the commercial sector: A model based on the theory of planned behaviour. Res. Transp. Econ. 2016, 55, 12–19. [Google Scholar] [CrossRef]
  31. Niese, N.; Pieper, C.; Arora, A.; Xie, A. The Case for a Circular Economy in Electric Vehicle Batteries; Boston Consulting Group Analysis: Boston, MA, USA, 2020; Available online: https://www.bcg.com/publications/2020/case-for-circular-economy-in-electric-vehicle-batteries (accessed on 14 July 2021).
  32. Rogers, E.M. Diffusion of Innovations, 1st ed.; The Free Press of Glencoe: New York, NY, USA, 1962. [Google Scholar]
  33. Brdulak, A.; Chaberek, G.; Jagodziński, J. BASS Model Analysis in “Crossing the Chasm” in E-Cars Innovation Diffusion Scenarios. Energies 2021, 14, 3216. [Google Scholar] [CrossRef]
  34. Lekvall, P.; Wahlbin, C. A study of some assumptions underlying innovation diffusion functions. Swed. J. Econ. 1973, 75, 362–377. [Google Scholar] [CrossRef]
  35. Geroski, P.A. Models of technology diffusion. Res. Policy 2000, 29, 603–625. [Google Scholar] [CrossRef]
  36. Mahajan, V.; Peterson, R.A. Models for Innovation Diffusion, 1st ed.; Sage: Palm Springs, CA, USA, 1985. [Google Scholar]
  37. Soumia, A.; Maaroufi, M. Diffusion models for predicting electric vehicles market in Morocco. In Proceedings of the 2018 International Conference and Exposition on Electrical and Power Engineering (EPE), Iasi, Romania, 18–19 October 2018; Institute of Electrical and Electronics Engineers (IEEE): Piscataway, NJ, USA, 2018. [Google Scholar] [CrossRef]
  38. Ensslen, A.; Will, C.; Jochem, P. Simulating electric vehicle diffusion and charging activities in France and Germany. World Electr. Veh. J. 2019, 10, 73. [Google Scholar] [CrossRef] [Green Version]
  39. Ahmadi, L.; Croiset, E.; Elkamel, A.; Douglas, P.L.; Entchev, E.; Abdul-Wahab, S.A.; Yazdanpanah, P. Effect of socio-economic factors on EV/HEV/PHEV adoption rate in Ontario. Technol. Forecast. Soc. Change 2015, 98, 93–104. [Google Scholar] [CrossRef]
  40. Hagman, J.; Ritzén, S.; Stier, J.J.; Susilo, Y. Total cost of ownership and its potential implications for battery electric vehicle diffusion. Res. Transp. Bus. Manag. 2016, 18, 11–17. [Google Scholar] [CrossRef] [Green Version]
  41. Li, J.; Jiao, J.; Tang, Y. An evolutionary analysis on the effect of government policies on electric vehicle diffusion in complex network. Energy Policy 2019, 129, 1–12. [Google Scholar] [CrossRef]
  42. Li, Y.; Ma, G.; Li, L. Development of a generalization bass diffusion model for Chinese electric vehicles considering charging stations. In Proceedings of the 2017 5th International Conference on Enterprise Systems (ES), Beijing, China, 22–24 September 2017; Institute of Electrical and Electronics Engineers (IEEE): Piscataway, NJ, USA, 2017; pp. 148–156. [Google Scholar] [CrossRef]
  43. Bass, F.M. A new product growth model for consumer durables. Manag. Sci. 1969, 15, 215–227. [Google Scholar] [CrossRef]
  44. Rao, K.U.; Kishore, V.V.N. A review of technology diffusion models with special reference to renewable energy technologies. Renew. Sustain. Energy Rev. 2010, 14, 1070–1078. [Google Scholar] [CrossRef]
  45. Massiani, J.; Gohs, A. The choice of Bass model coefficients to forecast diffusion for innovative products: An empirical investigation for new automotive technologies. Res. Transp. Econ. 2015, 50, 17–28. [Google Scholar] [CrossRef] [Green Version]
  46. Saisirirat, P.; Chollacoop, N.; Tongroon, M.; Laoonual, Y.; Pongthanaisawan, J. Scenario Analysis of Electric Vehicle Technology Penetration in Thailand: Comparisons of Required Electricity with Power Development Plan and Projections of Fossil Fuel and Greenhouse Gas Reduction. Energy Procedia 2013, 34, 459–470. [Google Scholar] [CrossRef] [Green Version]
  47. Egbue, O.; Long, S.; Samaranayake, V.A. Mass deployment of sustainable transportation: Evaluation of factors that influence electric vehicle adoption. Clean Tech. Environ. Policy 2017, 19, 1927–1939. [Google Scholar] [CrossRef]
  48. Scorrano, M.; Danielis, R.; Giansoldati, M. Electric light commercial vehicles for a cleaner urban goods distribution. Are they cost competitive? Res. Transp. Econ. 2021, 85, 101022. [Google Scholar] [CrossRef]
  49. Zhang, X.; Xie, J.; Rao, R.; Liang, Y. Policy incentives for the adoption of electric vehicles across countries. Sustainability 2014, 6, 8056–8078. [Google Scholar] [CrossRef] [Green Version]
  50. Safari, M. Battery electric vehicles: Looking behind to move forward. Energy Policy 2018, 115, 54–65. [Google Scholar] [CrossRef]
  51. Hsu, C.I.; Li, H.C.; Lu, S.M. A dynamic marketing model for hybrid electric vehicles: A case study of Taiwan. Transp. Res. Part D 2013, 20, 21–29. [Google Scholar] [CrossRef]
  52. Tian, Y.; Govindan, K.; Zhu, Q. A system dynamics model based on evolutionary game theory for green supply chain management diffusion among Chinese manufacturers. J. Clean. Prod. 2014, 80, 96–105. [Google Scholar] [CrossRef]
  53. Foggia, G.D. Drivers and challenges of electric vehicles integration in corporate fleet: An empirical survey. Res. Transp. Bus. Manag. 2021, 41, 100627. [Google Scholar] [CrossRef]
Figure 1. The course of adoption of innovations in time for individual categories of adopters. Source: cited from Brdulak, Chaberek and Jagodziński (2021) [33].
Energies 15 03283 g001
Figure 2. (a) Description of what is contained in the first panel; (b) Market ownership in the scenarios with 100%, 75%, 50%, 25% and 10% replacement rates.
Energies 15 03283 g002
Figure 3. Forecasts of the on-board battery pack price. Source: Illustrated by the data from BNEF (2021), Electric Vehicle Outlook 2021 [7].
Energies 15 03283 g003
Figure 4. (a) In the scenario with a 100% replacement rate, the numbers of new adoptions, which are simulated in accordance with the BNEF estimation, involve annual drops of 50%, 20% and 2%; (b) In the scenario with a 100% replacement rate, the numbers for ownership, which are simulated in accordance with the BNEF estimation, involve annual drops of 50%, 20% and 2%.
Energies 15 03283 g004
Figure 5. (a) In the scenario with a 50% replacement rate, the numbers of new adoptions, which are simulated in accordance with the BNEF estimation, involve annual drops of 50%, 20% and 2%; (b) In the scenario with a 50% replacement rate, the numbers of new adoptions, which are simulated in accordance with the BNEF estimation, involve annual drops of 50%, 20% and 2%.
Energies 15 03283 g005
Figure 6. (a) In the scenario with a 10% replacement rate, the numbers of new adoptions, which are simulated in accordance with the BNEF estimation, involve annual drops of 50%, 20% and 2%; (b) In the scenario with a 10% replacement rate, the numbers of new adoptions, which are simulated in accordance with the BNEF estimation, involve annual drops of 50%, 20% and 2%.
Energies 15 03283 g006
Table 1. Potential demand for eLCVs in Taiwan.
CategoryPurposeLCVs’ OwnershipService LifeAnnual Replacement
Demand for eLCVs
1Children’s minibus3943 10 years300
2Rehabilitation microbus2147 8 years163
3Wheelchair accessible taxi1358 7 years41
4Small wheelchair accessible passenger car966 8 years341
5Microbus serving in remote areas
(aka Happiness Bus)
20 8~12 years0
6Light truck of 2.5 to 3.5 tons449,535 No19,376
Total number457,969 20,221
Quantity: unit.
Table 2. Category of Diffusion model [36].
CategoryDiffusion BehaviorFormulaParameters
ExternalInnovation d N t d t = β ( M N t ) β
InternalImitation d N t d t = β N t ( M N t ) β
MixedInnovation and imitation d N t d t = p ( M N t ) + q N t ( M N t ) p (Coefficient of innovation)
q (Coefficient of imitation)
Notes: t refers to time. Nt is the number of products owned. M is the number of products in the potential market.
Table 3. Definitions of terms for the Bass Diffusion Model and its parameters.
Terms & ParametersDefinitions
Ownership (N)The total number of registered eLCVs in the market
Number of new adoptions (n)The net increase in ownership, which indicates the net increase in registered eLCVs
Number of potential market adoptions (M)The total number of potential eLCVs in the market
Market penetration (F)The proportion of ownership in the potential market adoption, the value of which rises as the replacement number increases, and the maximum is 100% under full penetration
Parameter pThe parameter that influences the numbers of eLCVs adopted when introduced to the market. It indicates the consumers’ willingness to buy.
Parameter q The number of eLCVs adopted is influenced by the interaction among customers after their introduction to the market. The parameter denotes these influences.
Note: The term with the subscript t denotes that the notation is at time t.
Table 4. Simulation results of full penetration for the scenarios in which light trucks are replaced by eLCVs with rates of 100%, 75%, 50%, 25% and 10%.
Replacement Rate of LCVsParameterR2Peak of Replacement (t)The Highest Number of
New Adoptions (nt)
pq
100%1.56%21.07%0.99271327,926
75%1.43%17.83%0.99411523,913
50%1.31%13.89%0.99621719,139
25%1.23%8.31%0.99872112,572
10%1.21%3.21%0.9997237005
Table 5. Simulation results for the scenarios of different battery pack price tendencies.
Scenariopq Price   Elasticity   ( β p ) R2Replacement Peak (t)Highest Number of New Adoptions
Replacement Rate of LCVsBattery Pack Price Tendency
100%BNEF estimation0.95%23.28%−107.22%0.92681330,408
50% price drop-850,344
20% price drop-1135,844
2% price drop-1329,501
50%BNEF estimation1.00%15.13%−83.97%0.97321620,535
50% price drop-1131,226
20% price drop-1523,439
2% price drop-1720,096
10%BNEF estimation1.17%3.59%−20.07%0.9141247363
50% price drop-218253
20% price drop-237570
2% price drop-247275
Publisher’s Note: MDPI stays neutral with regard to jurisdictional claims in published maps and institutional affiliations.

