Article

Thermal Characteristic of Novel Insulation Materials Designed for Solar Simulator

Beijing Institute of Spacecraft Environment Engineering, Beijing 100094, China
*
Author to whom correspondence should be addressed.
Energies 2022, 15(13), 4831; https://doi.org/10.3390/en15134831
Submission received: 20 May 2022 / Revised: 25 June 2022 / Accepted: 26 June 2022 / Published: 1 July 2022
(This article belongs to the Special Issue Application of Nanotechnology in Solar Energy and Solar Radiation)

Abstract

:
The solar simulator is an important device for simulating solar irradiation in cold black and vacuum environments and has a wide range of application prospects. In this work, a method of thermal conductivity measurement by a double specimen protection thermal plate method under vacuum conditions was proposed, and the thermal conductivity of a new thermal insulation material under a cryogenic vacuum environment was studied. By designing a vacuum adjustment device and a multi-layer insulation structure with a low outgassing rate, it is possible to adjust the vacuum pressure from 10−4 Pa to atmospheric. A temperature control and thermal conductivity test can be realized from −160 °C to 280 °C by the joint temperature control of liquid nitrogen cooling and electric heating. Then, the measurement accuracy of the device was checked by the national standard sample, the thermal conductivity of the sample was measured under different vacuum and temperature conditions, the uncertainty analysis of the device was given, and, finally, the thermal conductivity of the new material was tested.

1. Introduction

Concentrating solar power (CSP) is considered to be the most potential technology for harnessing solar energy. In practical applications, the heliostat fields [1,2], parabolic dish collector [3,4,5], parabolic dish collector [6], and linear Fresnel reflector [7,8] are usually employed as concentrators to focus natural solar radiation on a small target area to generate a high heat flux. However, the solar irradiance under natural conditions is affected by weather conditions and changes periodically with time, which makes the reproducibility of the experimental study of the direct use of natural solar energy outdoors. This means that there is an urgent need to develop a solar simulator that is not affected by weather conditions and day–night cycles to provide stable solar irradiation with controllable power for experimental studies.
The solar simulator is an important technology for simulating cold and dark environments and vacuum environments, which can simulate the collimation and spatial uniformity of real solar irradiation. A typical solar simulator usually requires multiple high-power lamps to provide stable and controllable irradiation, most of which employ argon lamps [9], the metal halide lamp [10,11], and the xenon lamp [12] to achieve an extremely high peak flux. However, the pursuit of a high heat flux will inevitably affect the uniformity of the light spot, resulting in localized high-temperature hot spots in the solar receiver. Therefore, high-power solar simulators often require additional heating and cooling systems to control the operating temperature of precision equipment and increase the life of the simulator.
Faced with urgent needs in the field of space technology and cryogenic engineering, it is necessary to develop a solar simulator for space environment simulation. In the manufacturing of solar simulators in cold and dark environments, reliable material physical property data are the premise and guarantee for material application [13]. The equivalent thermal conductivity is a key parameter to characterize the thermal protection properties of materials, so it is especially important to develop a device that can be applied to test the equivalent thermal conductivity of materials under cryogenic and vacuum conditions.
In recent years, related scholars, domestic and abroad, have also carried out relevant work on the development of cryogenic thermal conductivity testing devices for materials. Xu Wen et al. [14] from the Chinese Academy of Sciences Physical and Chemical Technology Research developed a cryogenic thermal conductivity testing system for engineering materials. The system was designed with a high vacuum adiabatic thermostat for clamping the sample, and then the thermostat was placed in a liquid nitrogen dewar for cryogenic temperature control, and a solid thermal switch device was designed for increasing the cooling rate. They tested the thermal conductivity of red copper to check the reliability of the system and used the test system to study the cryogenic thermal conductivity of stainless steel, titanium alloy, and magnesium alloy. Wu Chang et al., from the Institute of Physical and Chemical Technology, Chinese Academy of Sciences [15], established a cryogenic thermal conductivity testing device for nonmetallic insulating materials based on the principle of the steady-state axial heat flow method with one-sided heating and high vacuum insulation to reduce heat leakage losses, and designed a controllable gas thermal switch to improve the cooling rate of the samples and then used the device to measure the thermal conductivity of polyurethane insulation materials in the temperature range from liquid nitrogen to room temperature. An error analysis was also performed. Dai Jianbiao et al. of the 16th Research Institute of China Electronics Technology Group Corporation [16] designed a cryogenic thermal conductivity testing system for insulation materials. The system uses a GM refrigerator as the cold source, and the system is designed based on the principle of the steady-state axial heat flow method, which can realize the thermal conductivity test from 4 K to 300 K.
In the development of the thermal conductivity measurement device for protective thermal plates, Li Manfeng and Ju Yonglin from the School of Mechanical and Power Engineering of Shanghai Jiao Tong University [17] built a protective thermal plate device for the thermal conductivity measurement of adiabatic materials in the liquid nitrogen temperature region, which can measure the thermal conductivity of materials in the range of 77~400 K, and by testing Teflon samples, it showed that the measurement uncertainty of the device is within ±4%. Zhang Tao and Zhu Chunling et al. of the Nanjing University of Aeronautics and Astronautics [18] built a thermal conductivity test platform based on the protective hot plate method test principle using a liquid nitrogen deep freezer as the core device for temperature control and measured the thermal conductivity of polyimide foam from −125 °C to 25 °C under an air atmosphere. A. Schindler et al. of NETZSCH, Germany [19] measured the thermal conductivity of a series of standard substances using the dual sample plate method, and the thermal conductivity was measured in the range of 0.013 W/(m·K) to 0.16 W/(m·K), and the testing temperature range was −160 °C to 700 °C, and the analysis showed that the accuracy of this equipment is better than ±1% at room temperature and better than ±5% at the limit temperature. Flynn and Zarr et al. of NIST [20] developed a protected hot plate device for measuring the steady-state transport properties of materials, with both cold and hot plates made of pure nickel, a temperature measurement range of 90 K to 900 K, and an adjustable pressure range of 0.01 Pa to 105 kPa, which can be used to test the plate specimens with diameters of 500 mm and a thickness of 13 mm~100 mm. However, most of the research work mainly focused on the cryogenic field, and the research on the thermal conductivity measurement of adiabatic materials under cryogenic and vacuum conditions is still insufficient.
In this work, a steady-state double specimen protective thermal plate apparatus was established for the thermal conductivity testing of adiabatic materials under low temperature and a vacuum, with a vacuum adjustment range of a 10−4 Pa magnitude to atmospheric pressure and a test temperature range of −160 °C~280 °C. The thermal characteristic of a new material proposed in this work was analyzed.

2. Testing Principle

In the double specimen protection hot plate device, the heat flow is transferred from the heating unit to the cooling unit on both sides through the specimens on both sides, respectively. When a one-dimensional, steady-state heat transfer field is formed inside the sample under test, the thermal conductivity of the sample can be calculated according to Fourier thermal conductivity law:
k = Q A 1 Δ T 1 / d 1 + Δ T 2 / d 2
where Q is the total heat transfer from the metering hot plate to the cold plate on both sides, which is equal to the heating power of the metering heating unit, Q = P = UI. d1 and d2 are the average thickness of the two samples. A is the metering area of the device. ∆T1 and ∆T2 are the temperature difference between the two sides of the upper and lower samples.

3. Device Design

The test system was designed to include four main parts: the thermal conductivity measurement bench, vacuum system, cooling and heating module, and data processing and acquisition module, as shown in Figure 1.

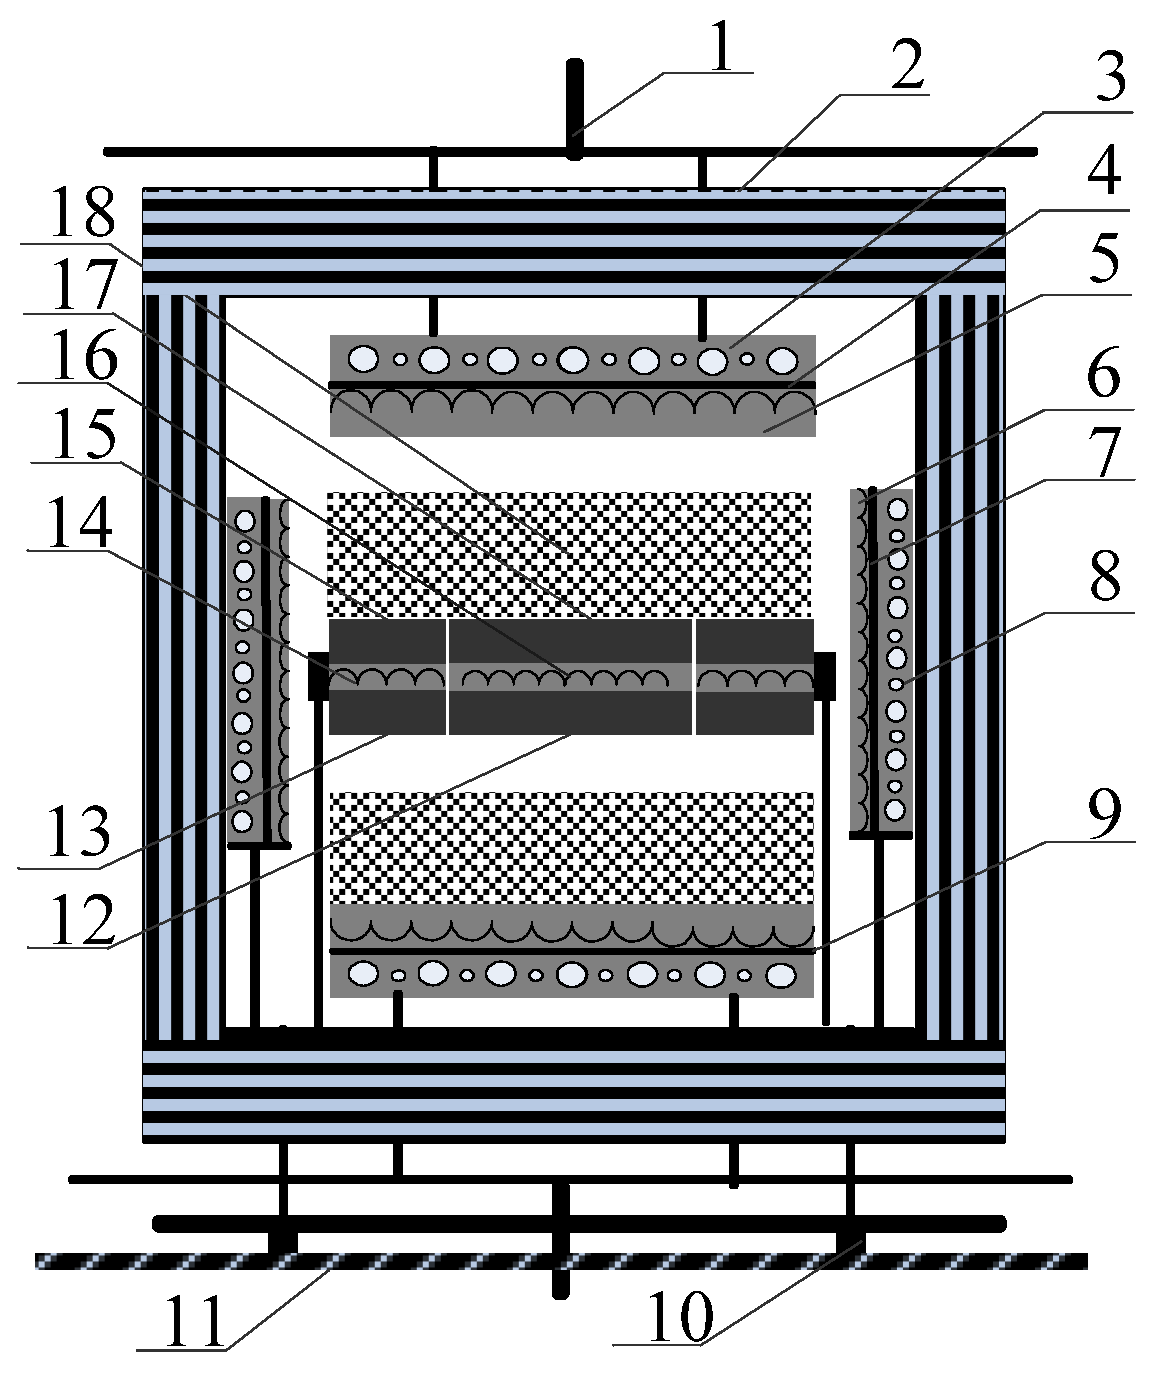
3.1. Thermal Conductivity Measurement Bench

The thermal conductivity measurement bench is built based on the national standard GB/T 10294-2008 and also conforms to the standards ISO-8302 and ASTM C177. The thermal conductivity measurement bench is installed inside the vacuum chamber connected to the external device through the circuit and flow path channels, the schematic diagram of which is shown in Figure 2. The hot plate assembly is fixed in the middle of the measurement stage, and the upper and lower cold plate assemblies are driven by the external device, which can apply a clamping force to the sample and measure the thickness automatically with a maximum clamping force of 10 kPa and a maximum sample thickness of 100 mm.
Both the hot plate assembly and cold plate assembly are processed by T2 red copper with black nickel plating on the surface. The hot plate assembly consists of a metering hot plate and a protective hot plate, which are connected by stainless steel pins, and the outer size of the hot plate is 300 mm × 300 mm with a spacer size of 1.1 mm. The metering hot plate is 150 mm × 150 mm, which provides a uniform hot surface temperature for sample testing and measures the heat transfer through the central area of the sample. An unbalanced thermopile consisting of 16 K-type thermocouples connected in a series between the protective and metering hot plates is installed to reduce the unbalanced heat loss by controlling the unbalanced thermoelectric potential, 0, to reduce the unbalanced heat loss to zero by controlling the unbalanced heat potential. Meanwhile, in the vertical direction, the heat plate assembly is subdivided into a heating plate located in the middle (with an embedded NiCr heating wire) and upper and lower temperature measurement plates (with built-in platinum resistance thermometers).
The cold plate assembly consists of a heating cold plate, a thermal resistance layer, and a shroud plate. The heating cold plate has a built-in heating wire and platinum resistor. The shroud plate is filled with a cooling medium, and the thermal resistance layer is used to form a buffer layer between the heating layer and the shroud plate to reduce the heating power and improve the temperature control stability. The secondary protective heat plate assembly provides thermal protection to the side of the sample to reduce heat loss at the sample edge. The multi-layer insulation structure is made of a low outgassing rate multi-layer mirrored stainless steel spacer PTFE gasket, which reduces the natural convection between the inside and outside through the multi-layer gap to improve the insulation effect under non-vacuum conditions, and can effectively shield the radiation heat transfer.

3.2. Vacuum System

The vacuum chamber is a square chamber with an effective design size of 1000 mm × 1000 mm × 1100 mm, and the total leakage rate is better than 2 × 10⁻⁹ Pa·m3/s. The main pumping pump is the CSCI FF250/2000 molecular pump with a pumping speed of 2000 L/s, and the pre-stage pump is the CSCI RVP-24 mechanical pump with a pumping speed of 24 L/s. The no-load ultimate vacuum of the system is better than 10−4 Pa. The vacuum adjustment uses a needle valve as the rough adjustment valve and Agilent Leak Valve as the fine adjustment valve.

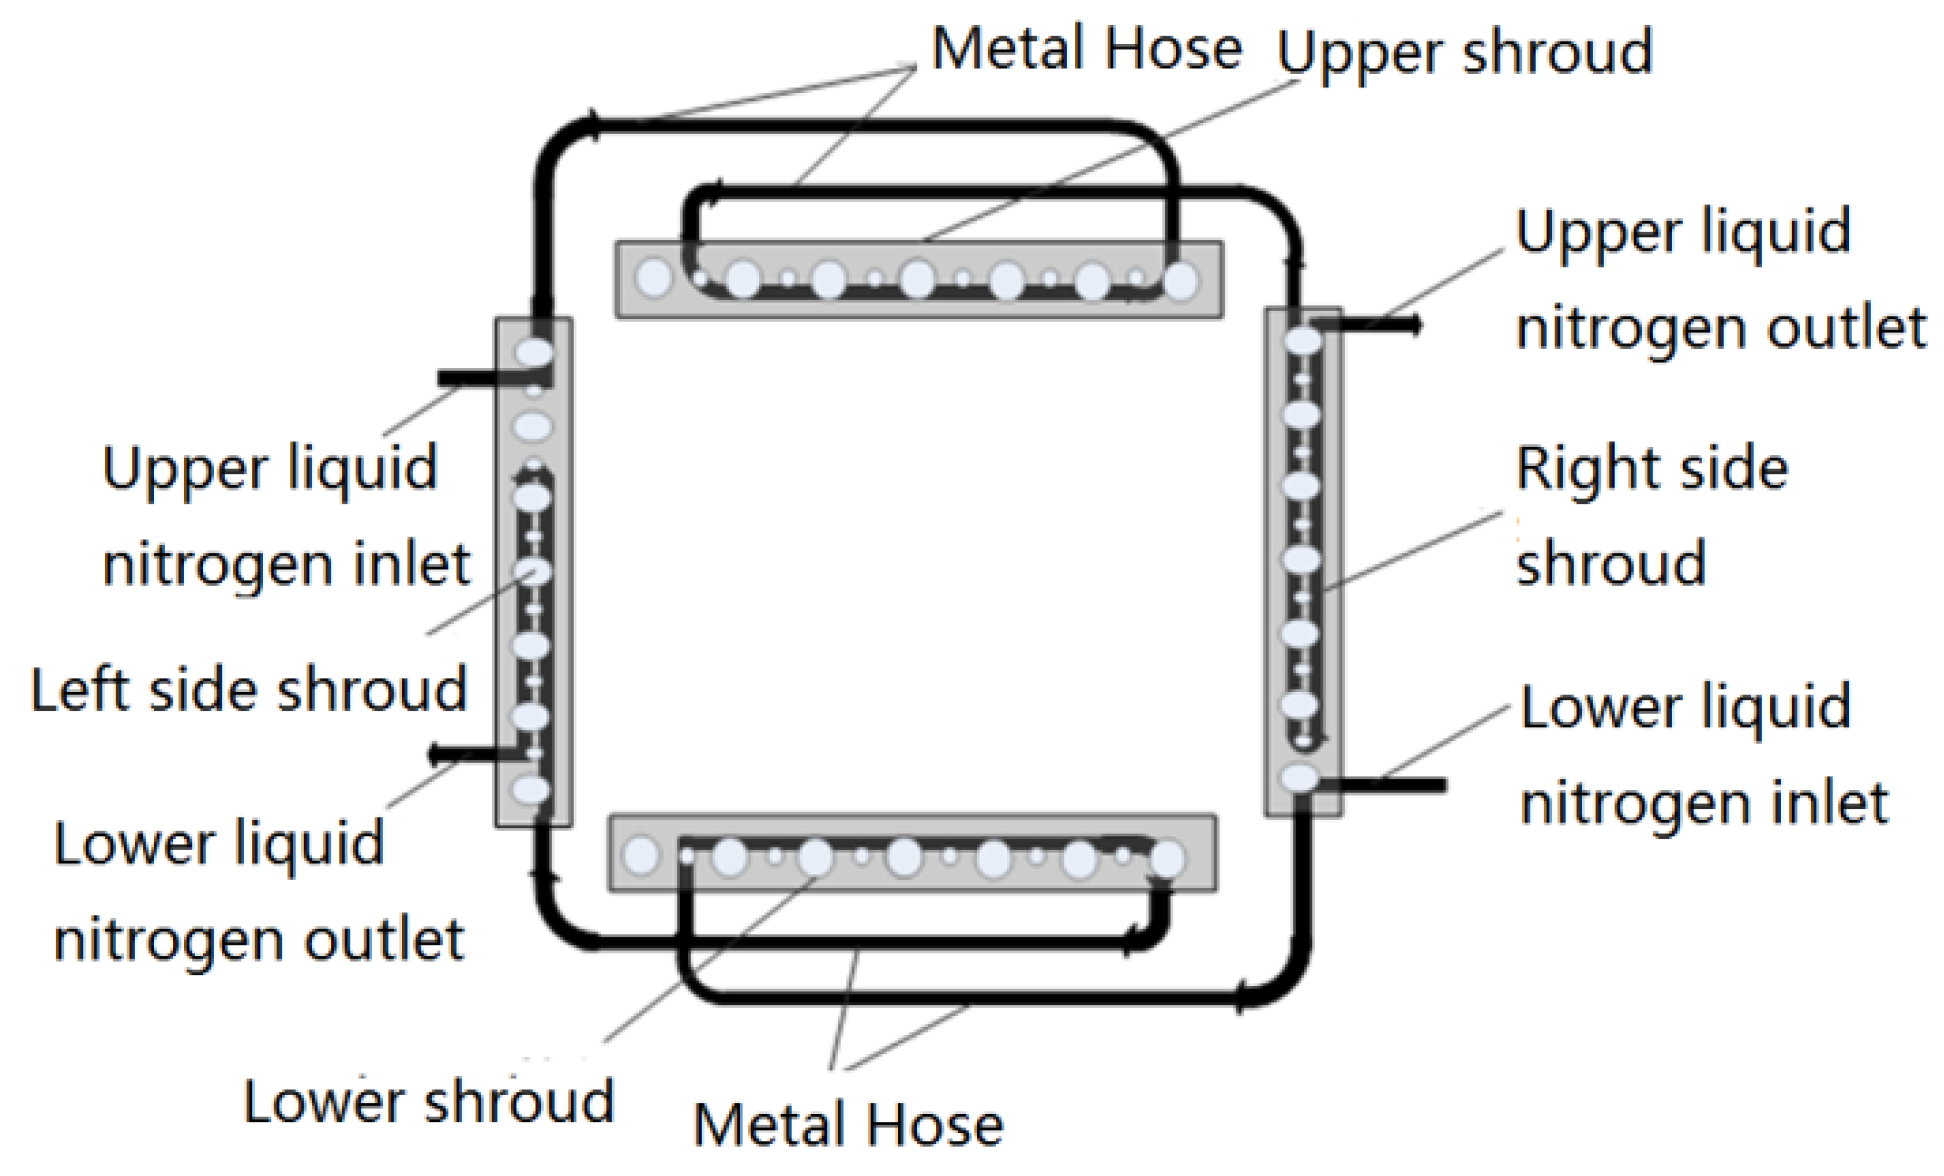
3.3. Cooling and Heating Module

The device adopts two modes of cooling: oil cooling near room temperature and liquid nitrogen cooling in the cryogenic zone. The cooling media is circulated or discharged into the shroud plate inside the vacuum chamber. The shroud plate is a cooling plate with dual flow paths, which can be used to circulate the oil media or liquid nitrogen, respectively. In the circulating medium flow path, the upper shroud, lower shroud, and side shroud are connected in a series in turn. In the liquid nitrogen flow path, the upper shroud and lower shroud are connected in parallel, and each of them is connected to independent liquid nitrogen; the layout of the liquid nitrogen pipeline is shown in Figure 3.
The device uses DC heating to further precisely control the temperature of each part of the system to achieve a stable thermal balance. The heating wire is made of a nickel-chromium alloy wire, and the incremental PID method is used to control the temperature of the metering hot plate, protective hot plate, upper cold plate, lower cold plate, and secondary protective hot plate.

3.4. Data Processing and Acquisition Module

The data processing and acquisition module controls and monitors the temperature and unbalanced thermal potential at various points in the system and measures the heating power of the hot plate. It also controls the start and stop of the upper and lower motors and is used to measure the clamping force and thickness of the upper and lower samples.

4. Measurement Results

4.1. Comparison of Standard Reference Sample

The thermal conductivity measurement bench was calibrated and tested for the validity of the test by using the reference panel of thermal insulation materials produced and certified by the Building Materials Industry Technical Supervision and Research Center as the reference sample, and the test results are shown in Table 1 below, which shows that the test error near room temperature is better than ±1%.

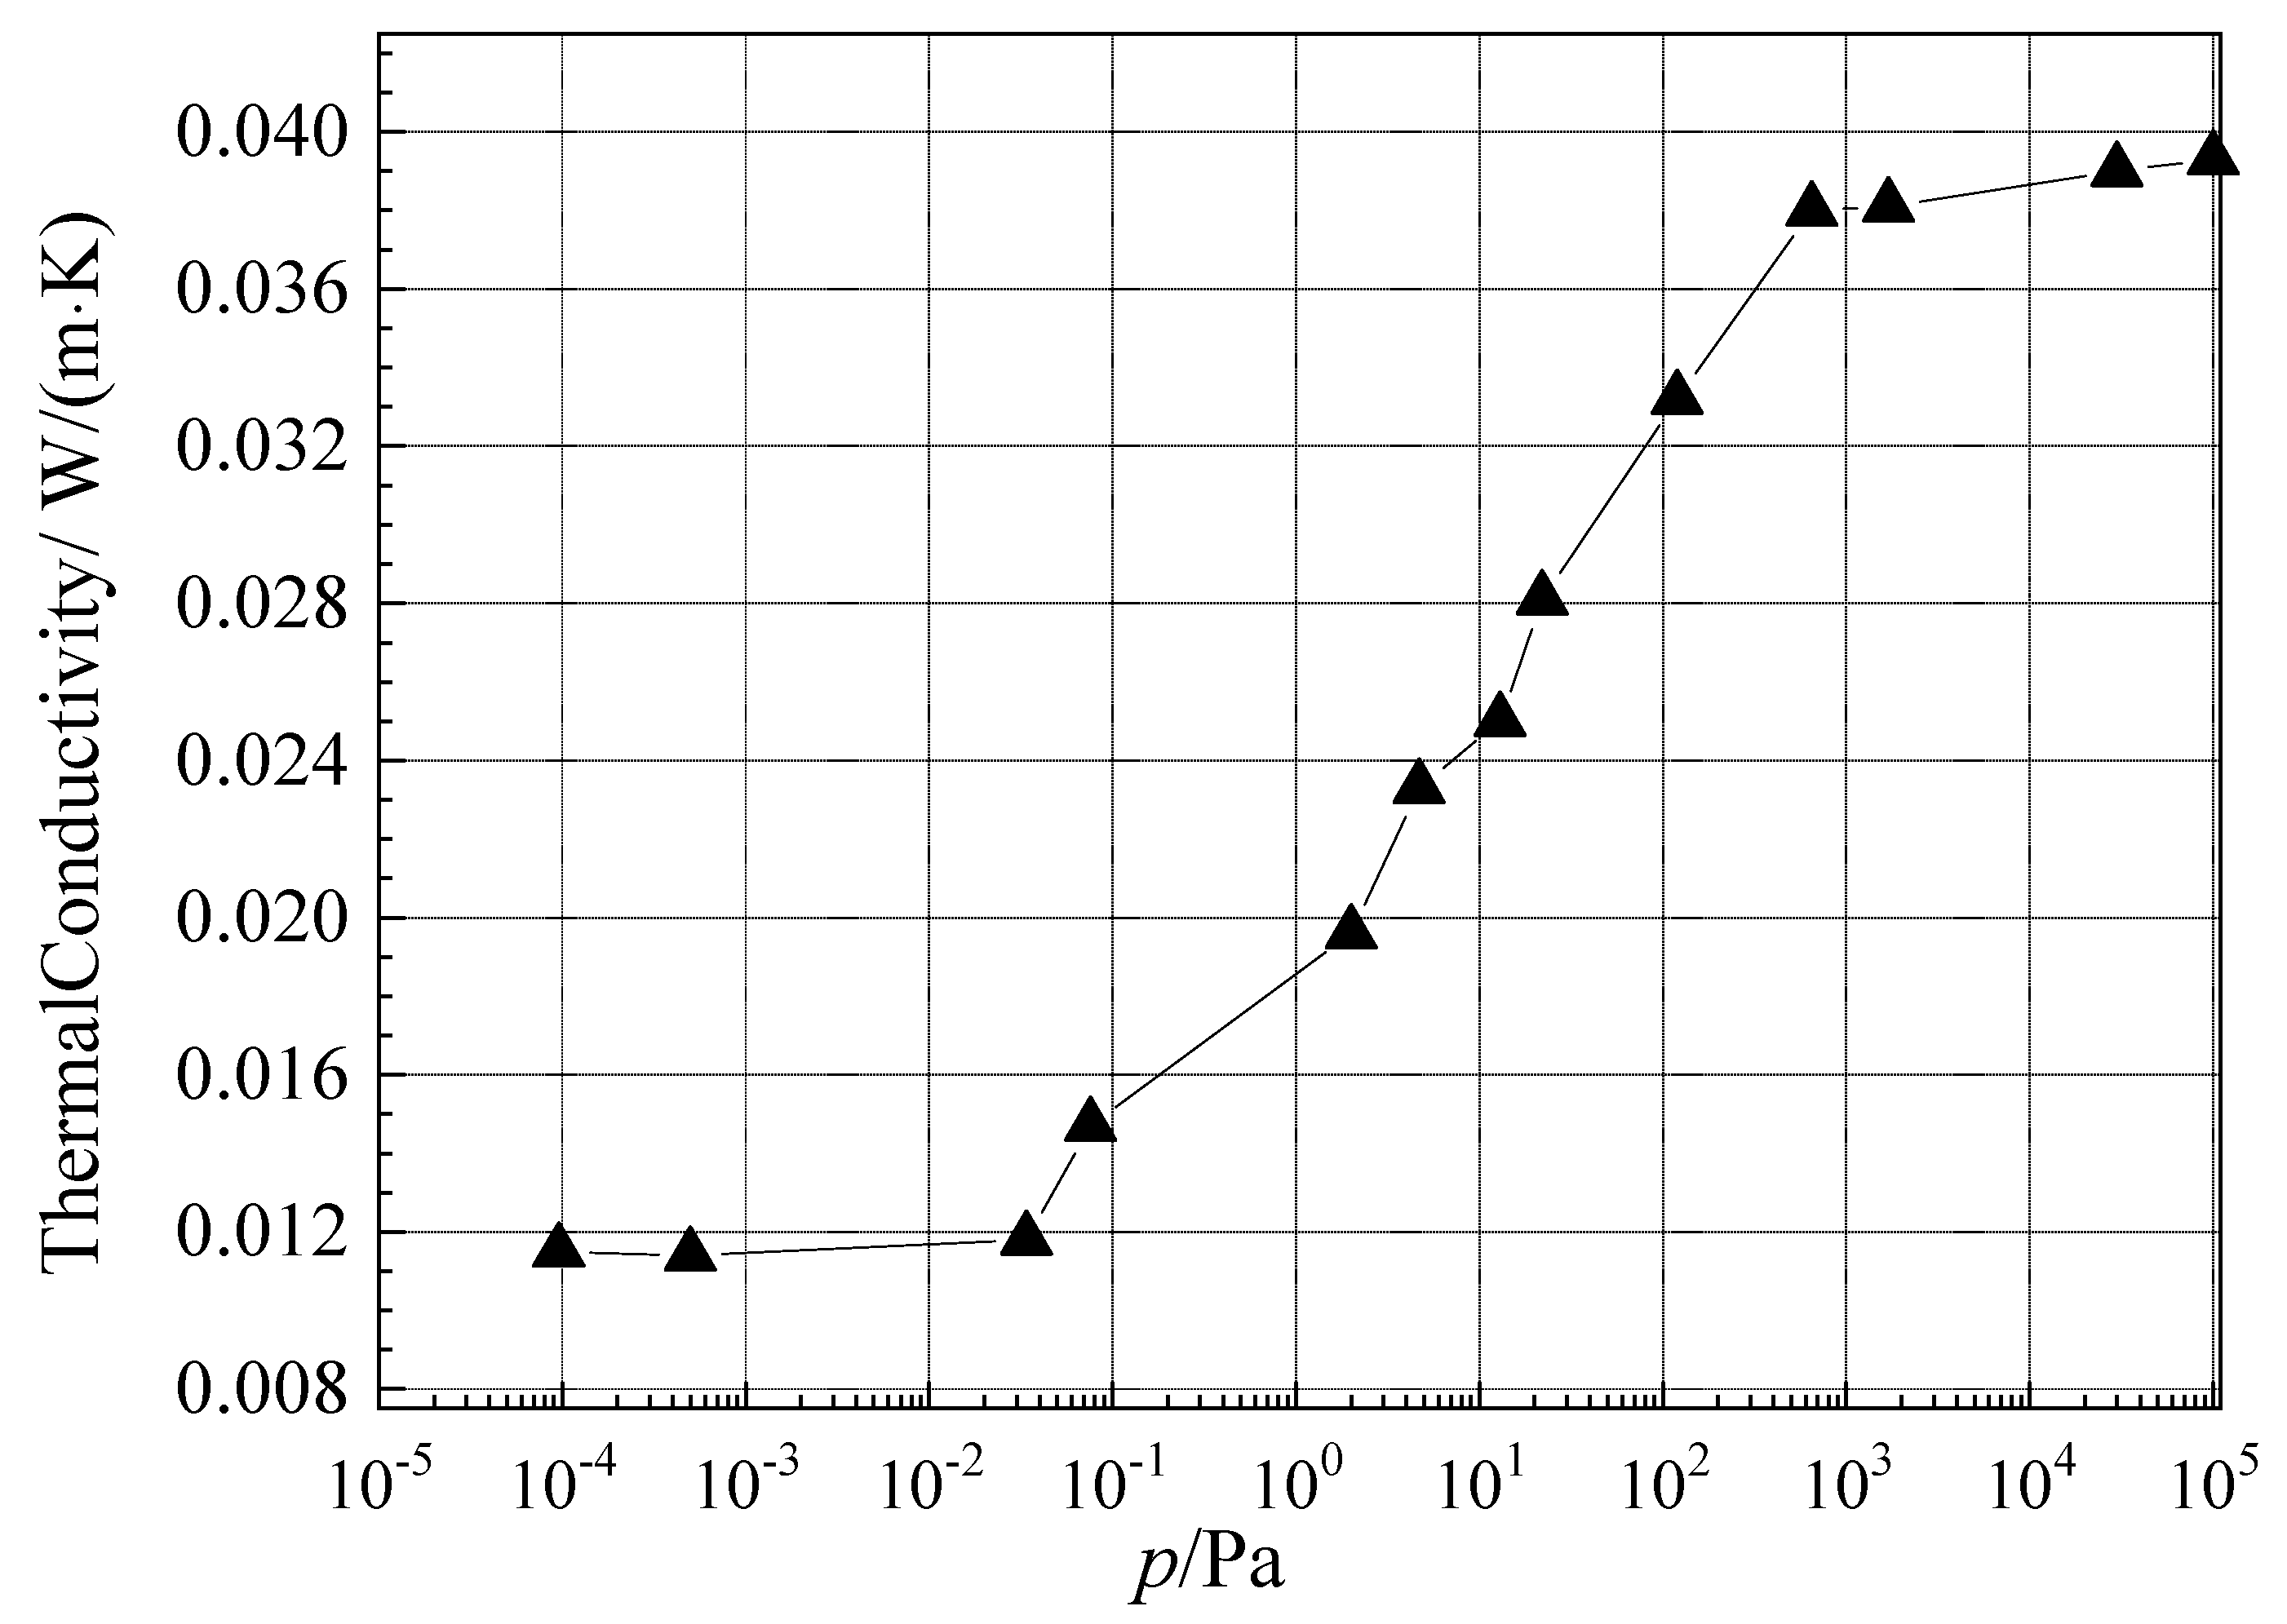
4.2. Measurement of Thermal Conductivity at Different Vacuum Levels and Temperatures

The thermal conductivity of the extruded sheet samples and aerogel felt samples were measured at different vacuum levels and different temperatures, and the results are shown in Figure 4, Figure 5 and Figure 6. Figure 4 shows the measurement results of the extruded sheet samples under different vacuum degrees at 50 °C. It can be seen that the thermal conductivity of the extruded sheet decreases with the decrease of the pressure, and the decrease of the thermal conductivity with the decrease of the pressure is very small after the pressure is less than about 0.03 Pa. This indicates that the gas inside the material is already very small after the pressure is less than 0.03 Pa, and the thermal conductivity is mainly influenced by the thermal conductivity of the solid phase substrate. After the pressure is greater than about 1000 Pa, the thermal conductivity increases with the pressure, which is also small, because the air thermal conductivity is also related to the pressure, and after it is greater than 1000 Pa, the air thermal conductivity inside the material tends to slow down with the increase of the pressure, which leads to the slow increase of the overall thermal conductivity.
The thermal conductivity measurements of the two materials from −160 °C to 280 °C are given in Figure 5 and Figure 6. It can be seen that the thermal conductivity of both the extruded sheets and the aerogel felt increase with the temperature, and the test range of the measurement device is also verified.

4.3. Uncertainty Analysis

4.3.1. Measurement Uncertainty under Ideal Conditions

Assuming that the one-dimensional, steady-state heat transfer condition is satisfied, the measurement uncertainty of thermal conductivity can be obtained by synthesizing the uncertainties of four parameters: the power, measurement area, sample thickness, and temperature difference, as shown in Equation (2) below:
( u ( λ ) ) 2 = λ P u P 2 + λ A u A 2 + λ d u d 2 + λ ( Δ T ) u Δ T 2
Considering that the thickness of the double sample is close to equal, the formula of thermal conductivity can be simplified to kQd/(2AT), when the above Equation (2) can be simplified to the following Equation (3):
u λ λ = u P P 2 + u A A 2 + u d d 2 + u Δ T Δ T 2

4.3.2. Uncertainty of the Power Measurement

The maximum measurable thermal resistance of the device is 4 m2K/W, the minimum power of the metering heat plate is pmin = 2AT/Rmax = 0.225 W, the uncertainty of the current acquisition is ±10 μA, the uncertainty of the voltage acquisition of the ADC module is ±1 μV, the resistance of the heating wire of the metering heat plate is 10 Ω, and the uncertainty of the power measurement is calculated as
u P = ( P I u I ) 2 + ( P U u U ) 2 = 6.74 × 10 5 W
u P / P = 6.74 × 10 5 / 0.0225 = 0.029 %

4.3.3. Uncertainty of the Measured Area

The uncertainty of the measurement area depends on the accuracy of the processing and assembly process, and the accuracy of the ε = 0.01 mm vernier caliper is used to control the processing accuracy, and the inclusion factor is taken as 3 . Satisfying this processing accuracy, the relative uncertainty component of the measured area is
u A 1 / A = A L u L / A = 2 ε / ( 3 L ) = 0.0077 %
From 20 °C to 280 °C, considering the effect of thermal expansion, the expansion coefficient of red copper is β = 20 × 10−6/°C. The relative uncertainty of the measurement area due to thermal expansion is
u A 2 A = A L u L / A = 2 β ( T h T 0 ) = 1.04 %
u A / A = 0.0076 % + 1.04 % = 1.05 %
In fact, the area inside the center line of the spacer is the measurement area, and when the temperature rises, the hot plate expands outward, and the anti-plate expands inward, and the area expansion around the center line of the spacer should be smaller than the expansion area of the hot plate, so the above formula overestimates the effect of thermal expansion.

4.3.4. Uncertainty of the Thickness Measurement

A magnetic grating scale displacement sensor with a measuring range of 100 mm is used to measure the material thickness. According to the results of metrological verification, the thickness measurement accuracy of the sensor is U = 0.04% (k = 2). Thus, the standard uncertainty of the sensor thickness measurement is
u d 1 = 100 × ± 0.04 % / 2 = ± 20 μ m
The relative uncertainty of the thickness measurement using the displacement transducer for a minimum sample thickness of 5 mm is
u d 1 / d = 0.02 / 5 = 0.4 %
The relative uncertainty of the thickness due to the thermal expansion of the sample from 20 °C to 280 °C is
u d 2 / d = 6 0 × 1 0 6 × ( 280 20 ) × d / d = 1.56 %
u d / d = 0.4 % + 1.56 % = 1.96 %

4.3.5. Uncertainty of the Temperature Difference Measurement

Three four-wire Class A platinum resistors were installed on both sides of the metering hot plate and in the center areas of the upper and lower cold plates, and the sample surface temperature was taken as the average of the measured point temperatures. The platinum resistors were calibrated for metrology at five temperature points: −196 °C, −80 °C, 0 °C, 100 °C, and 290 °C. The calibration results were: U = 0.2 °C (k = 2) between −80 °C and 290 °C. U = 0.06 °C (k = 2) at −196 °C, which means the standard measurement uncertainty of the surface temperature measurement is ±0.1 °C.
The uncertainty of the temperature difference measurement is, thus, 2 × 0.1 = 0.141 °C and at a typical temperature difference of 20 K:
u Δ T / Δ T = 0.141 / 20 = 0.705 %

4.3.6. Total Measurement Uncertainty under Ideal Conditions

According to Equation (3), the relative uncertainty of the measurement within the full range under ideal conditions can be obtained as
u λ / λ = 0.029 2 + 1.05 2 + 1.96 2 + 0.705 2 = 2.34 %

4.3.7. Total Uncertainty

Since the one-dimensional heat transfer condition is not fully satisfied, the measurement error caused by an unbalanced heat loss and edge heat loss can be obtained by consulting the appendix of GB/T 10294-2008, which increases with the thickness, and according to the design parameters of this device, this uncertainty is ±2% for the sample of a 100 mm thickness. Therefore, the maximum uncertainty of the device at the full range can be obtained as ±4.34%, which is better than ±5%.

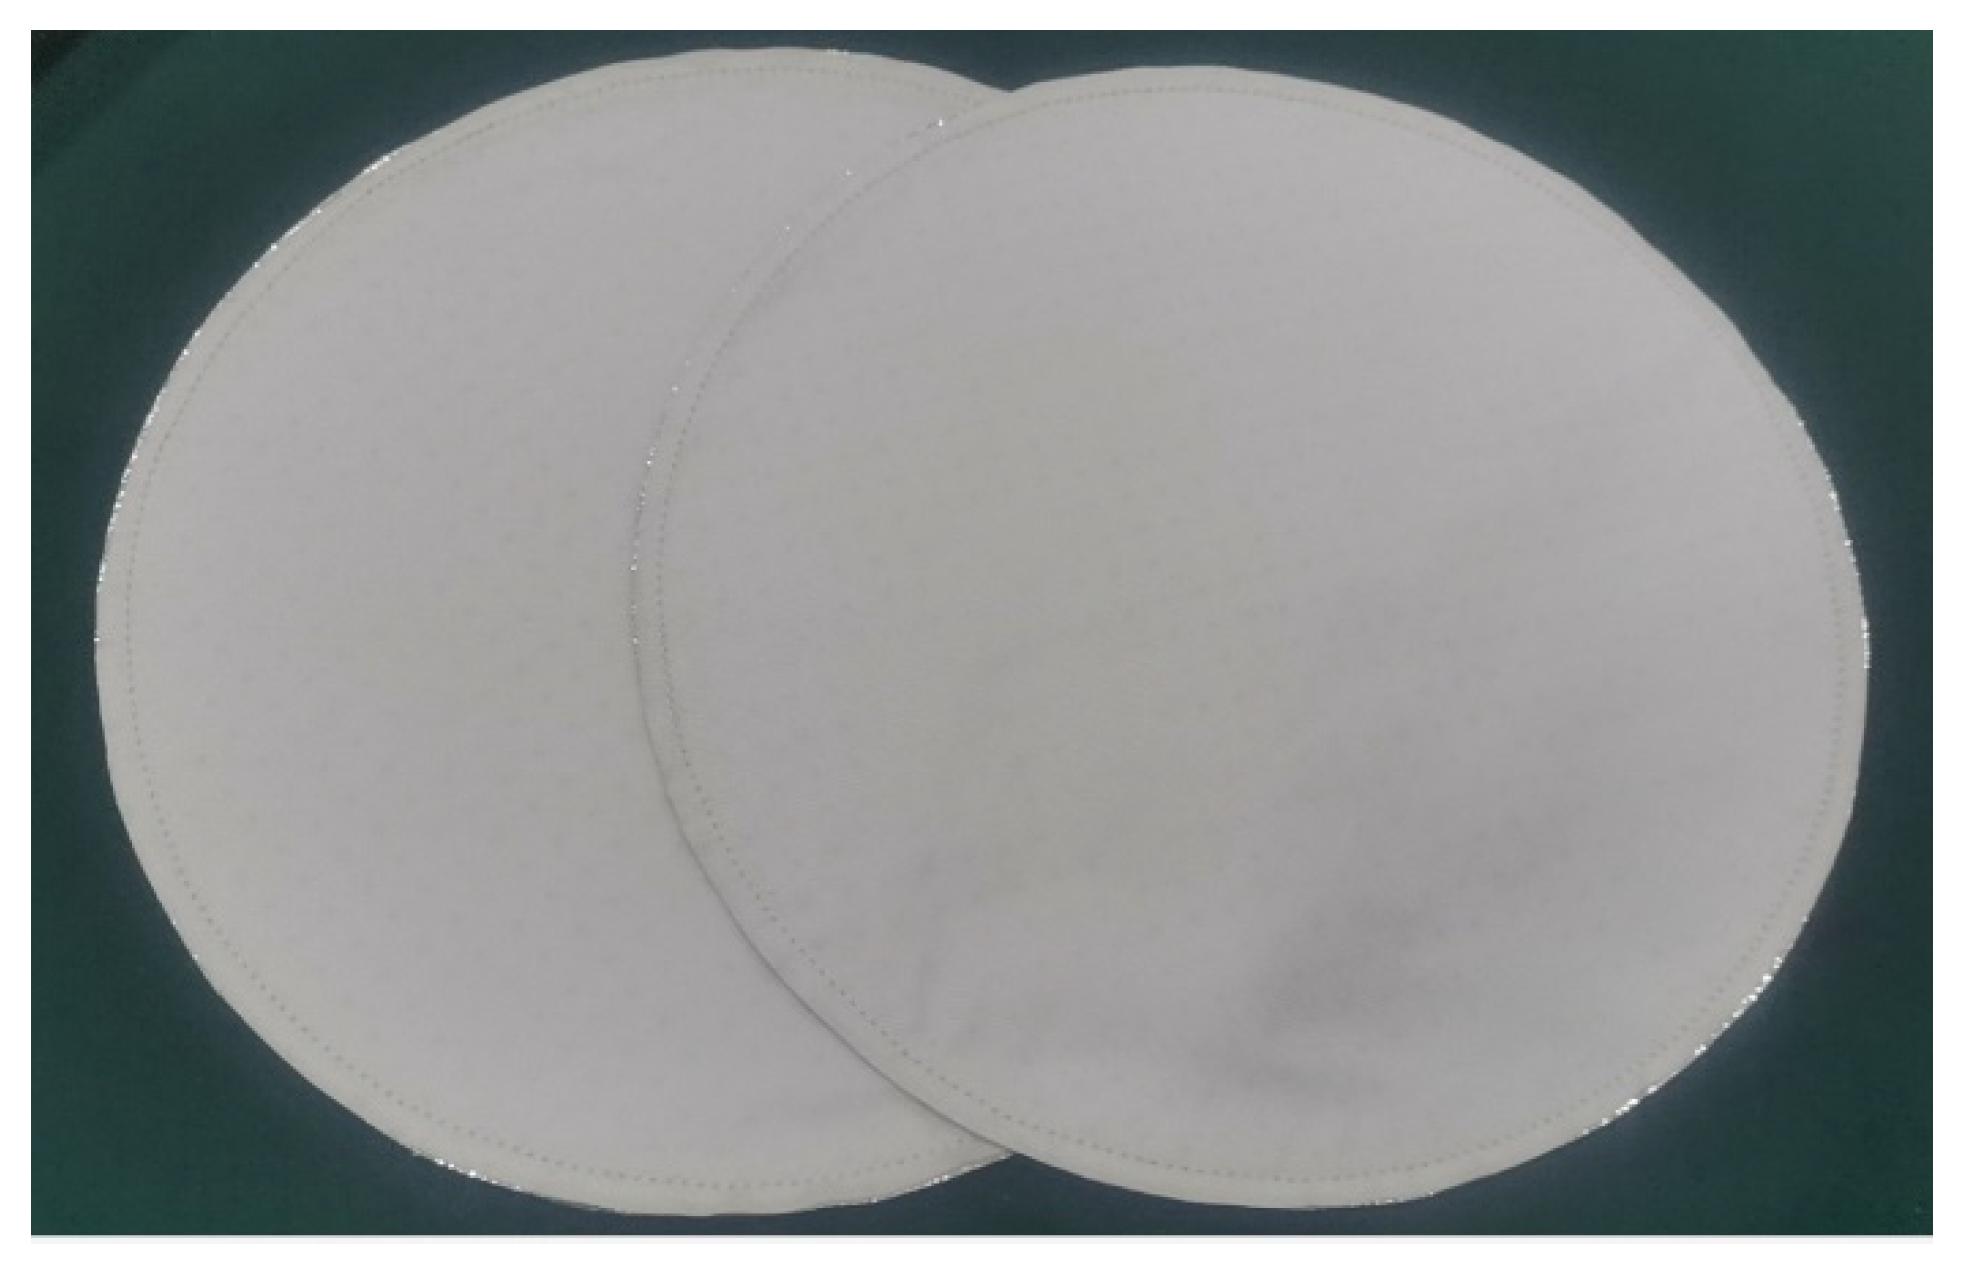
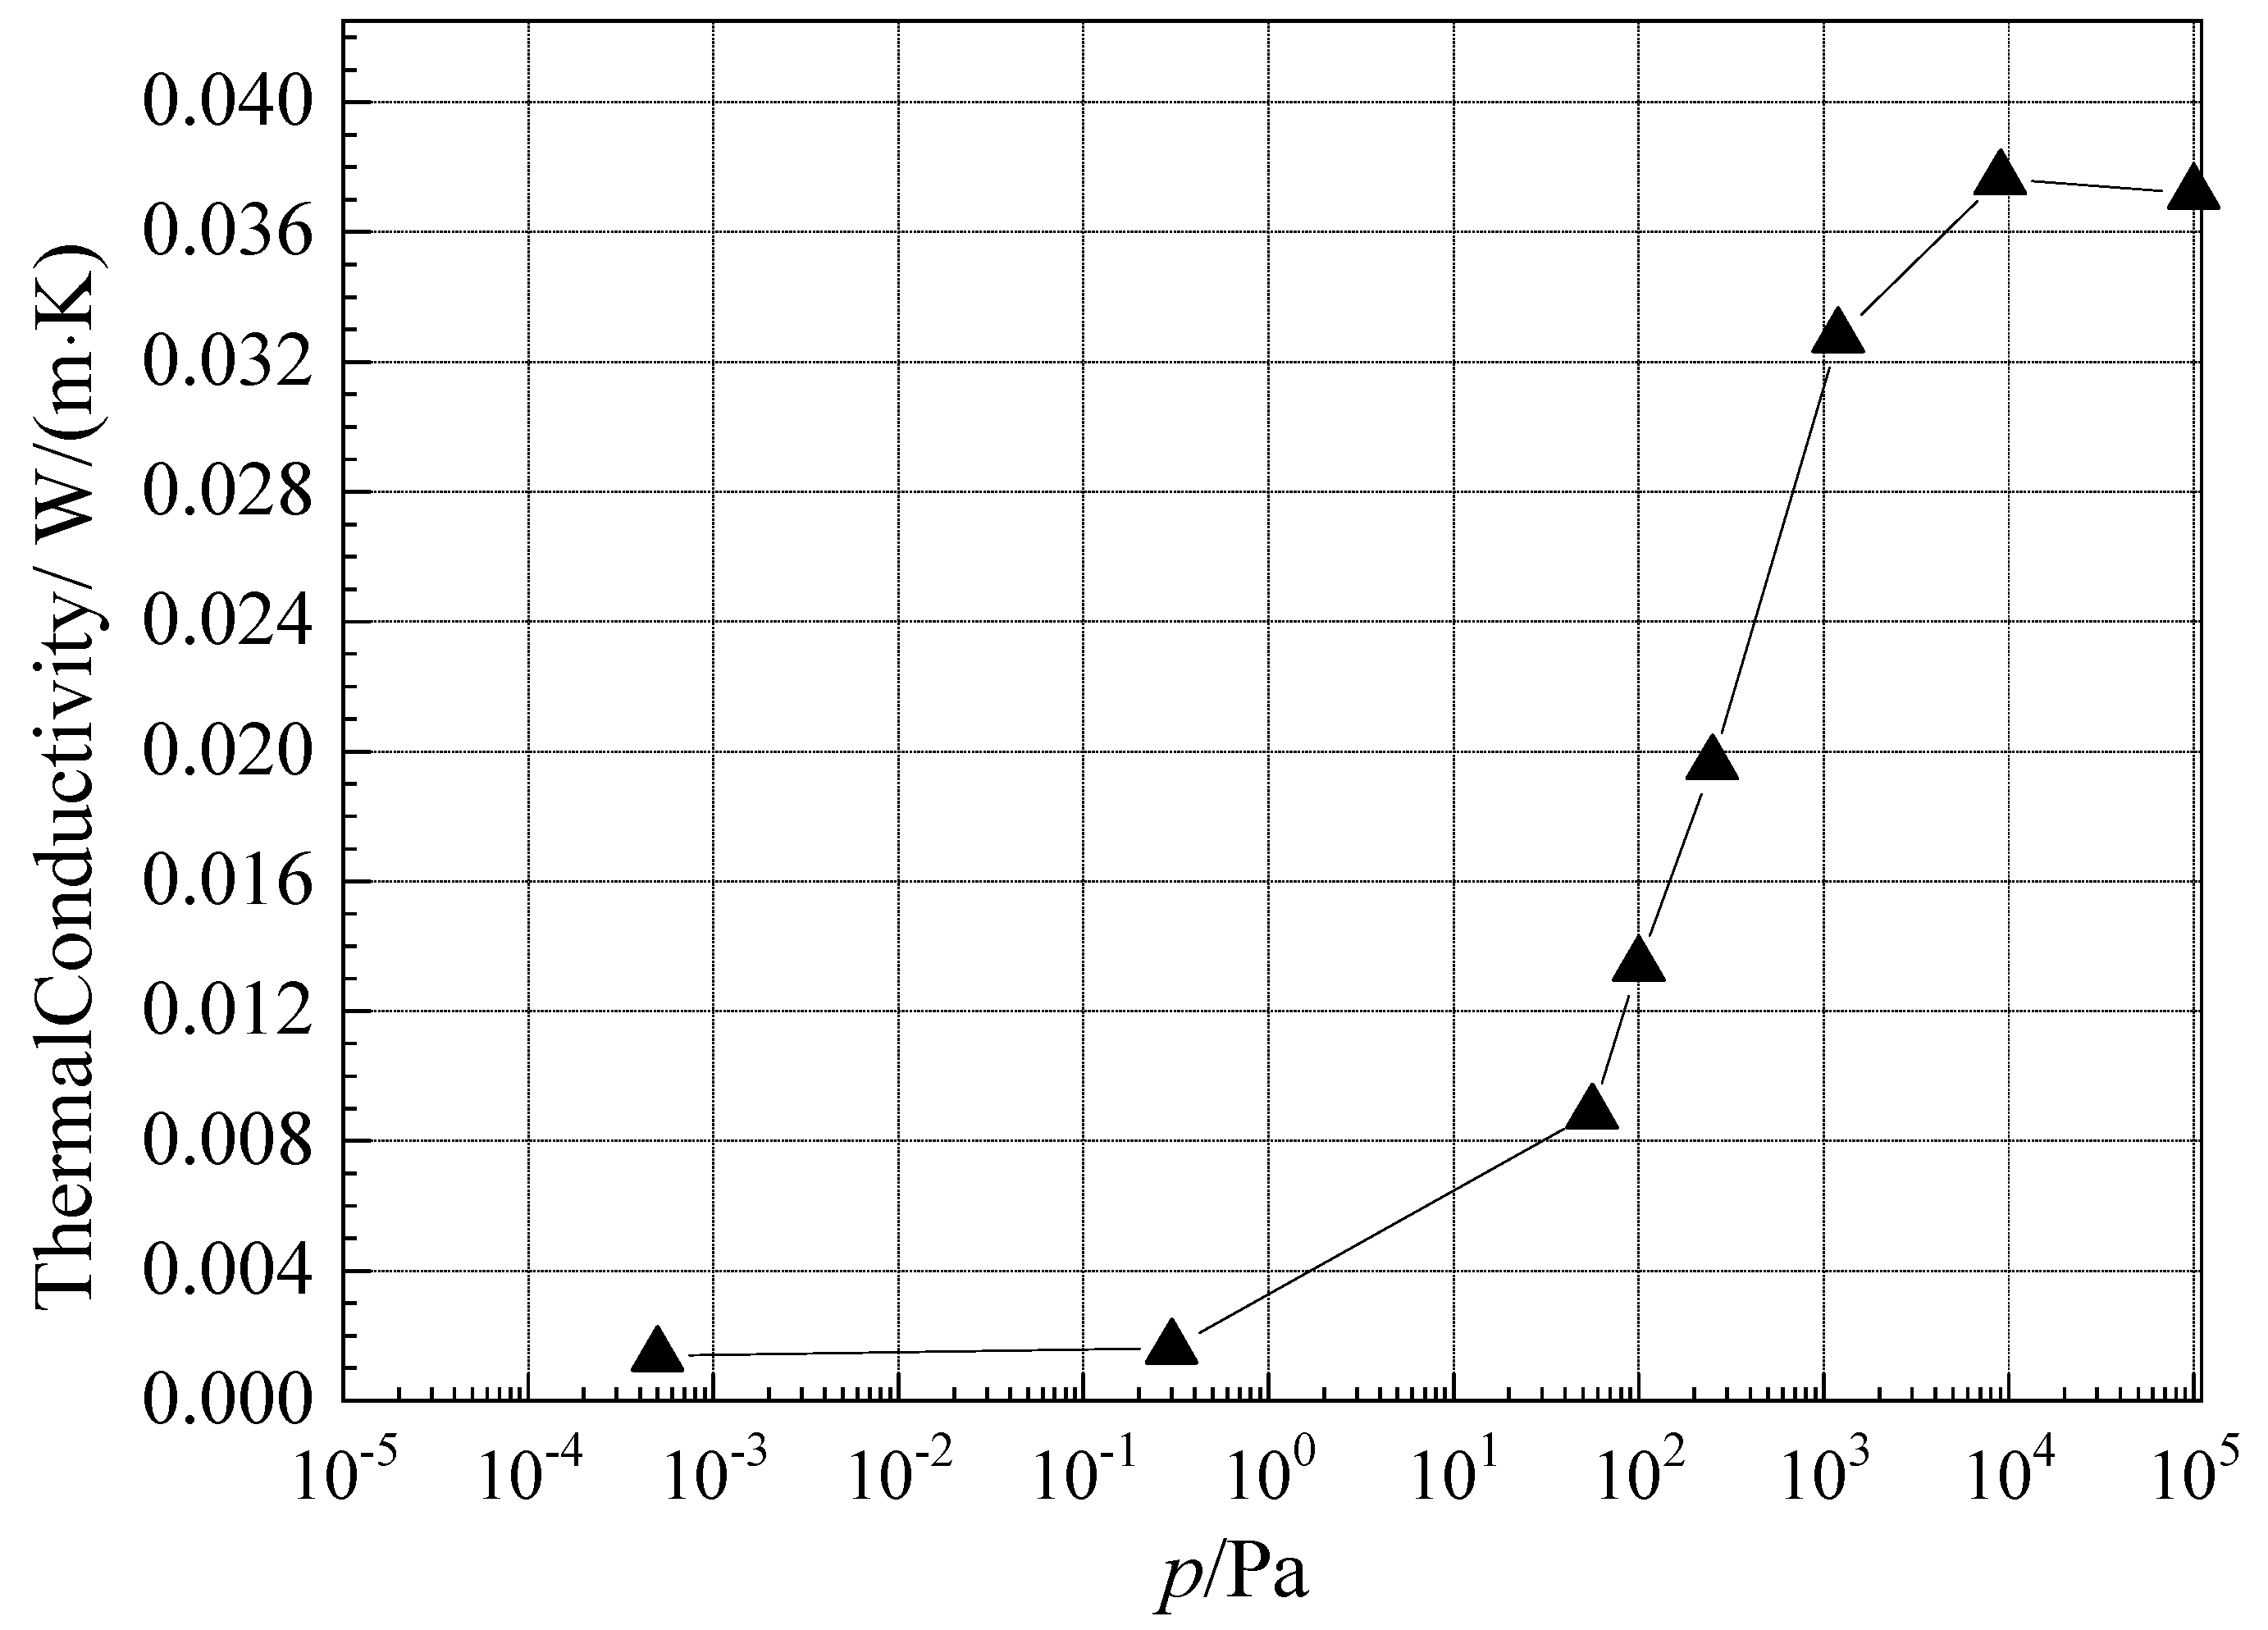
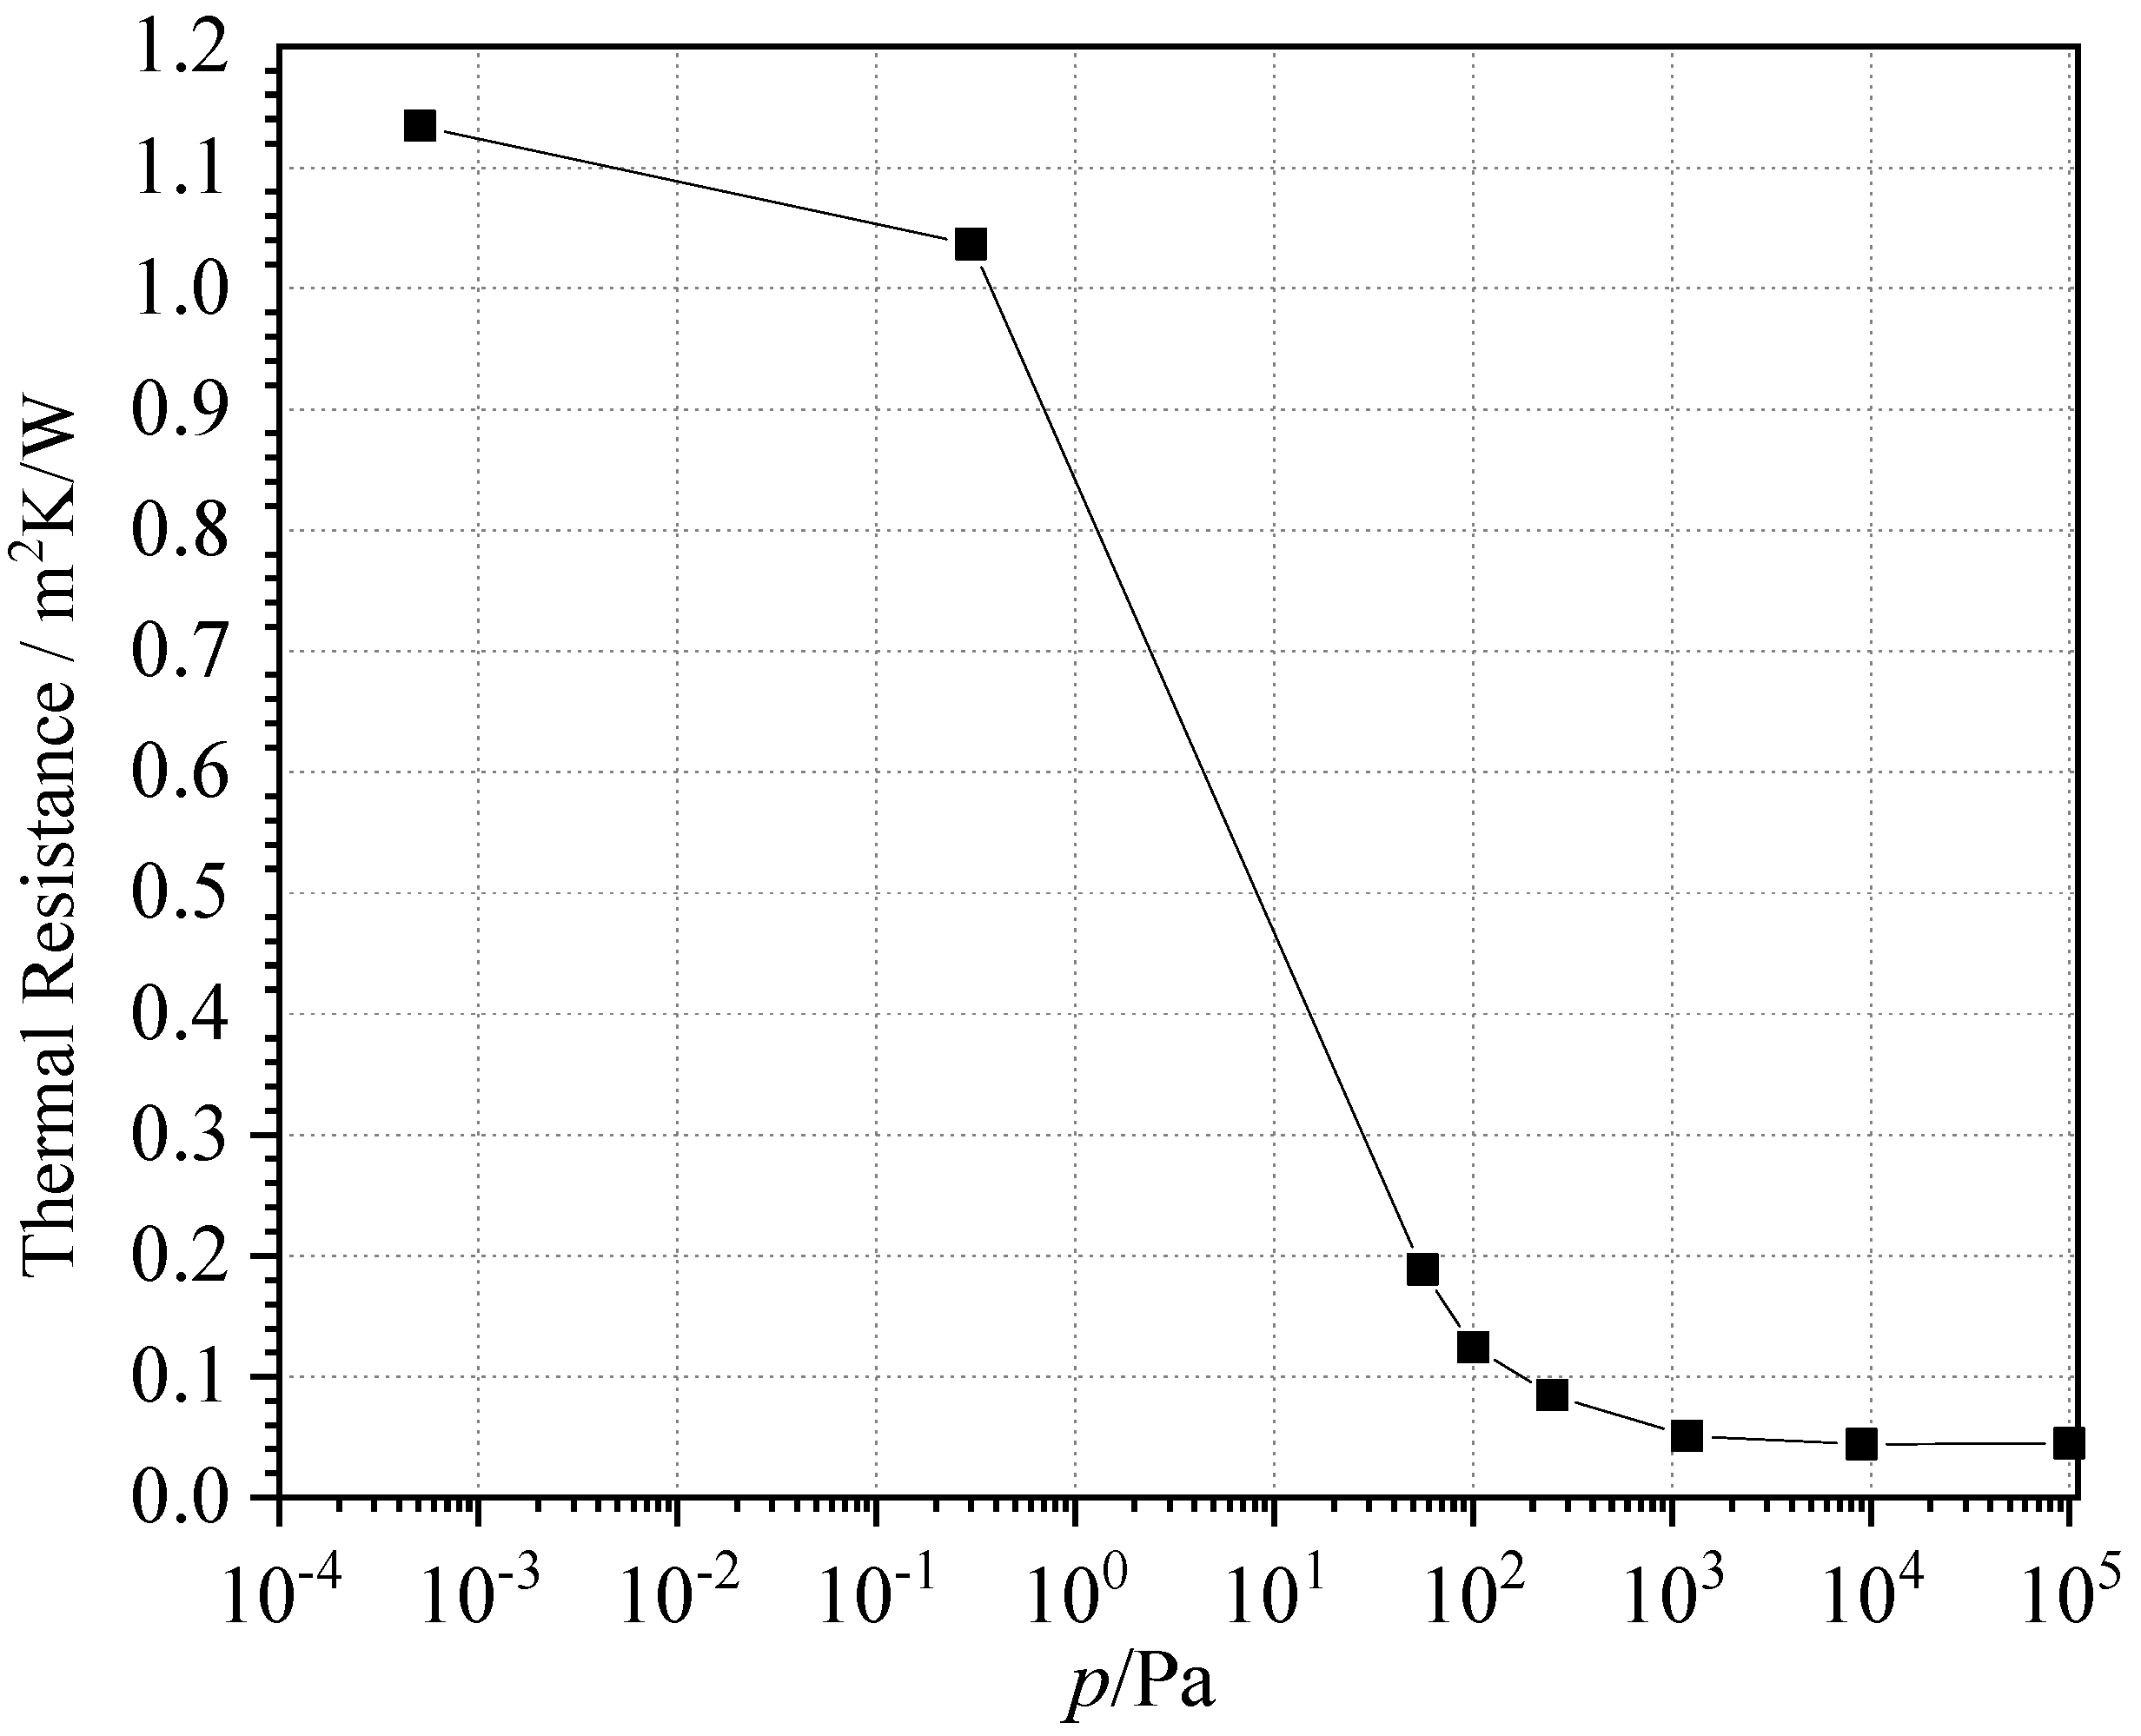
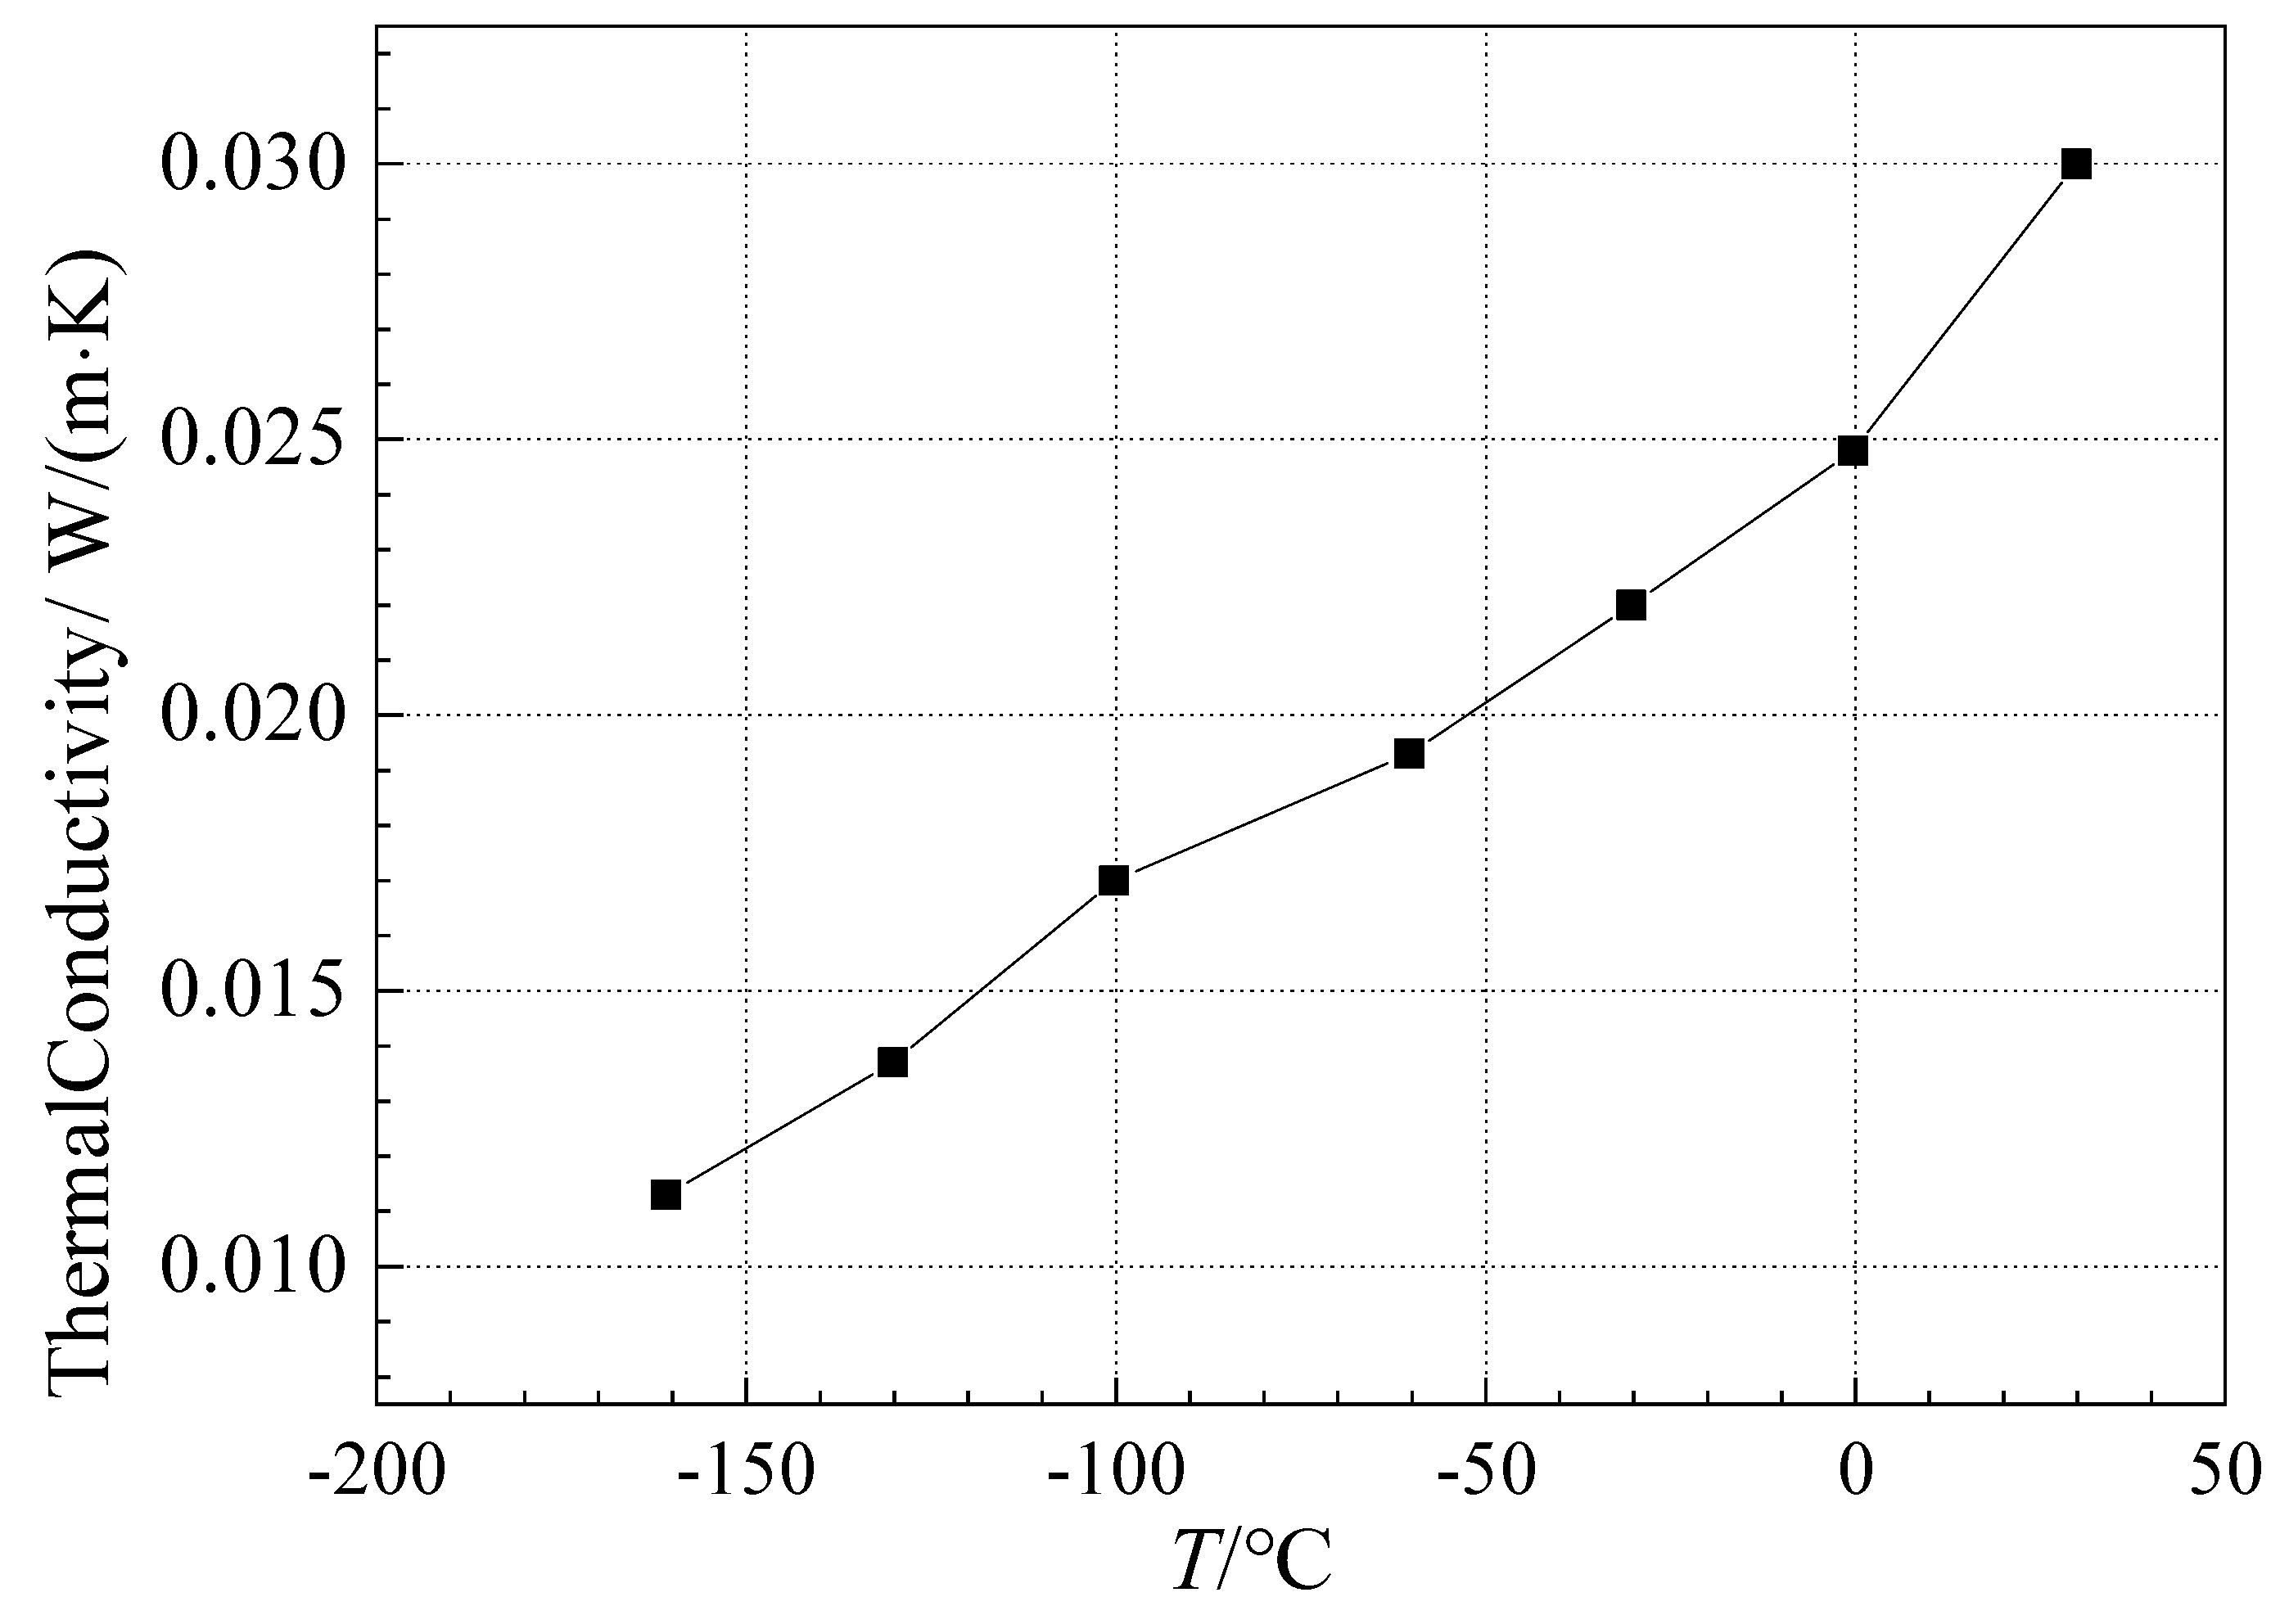
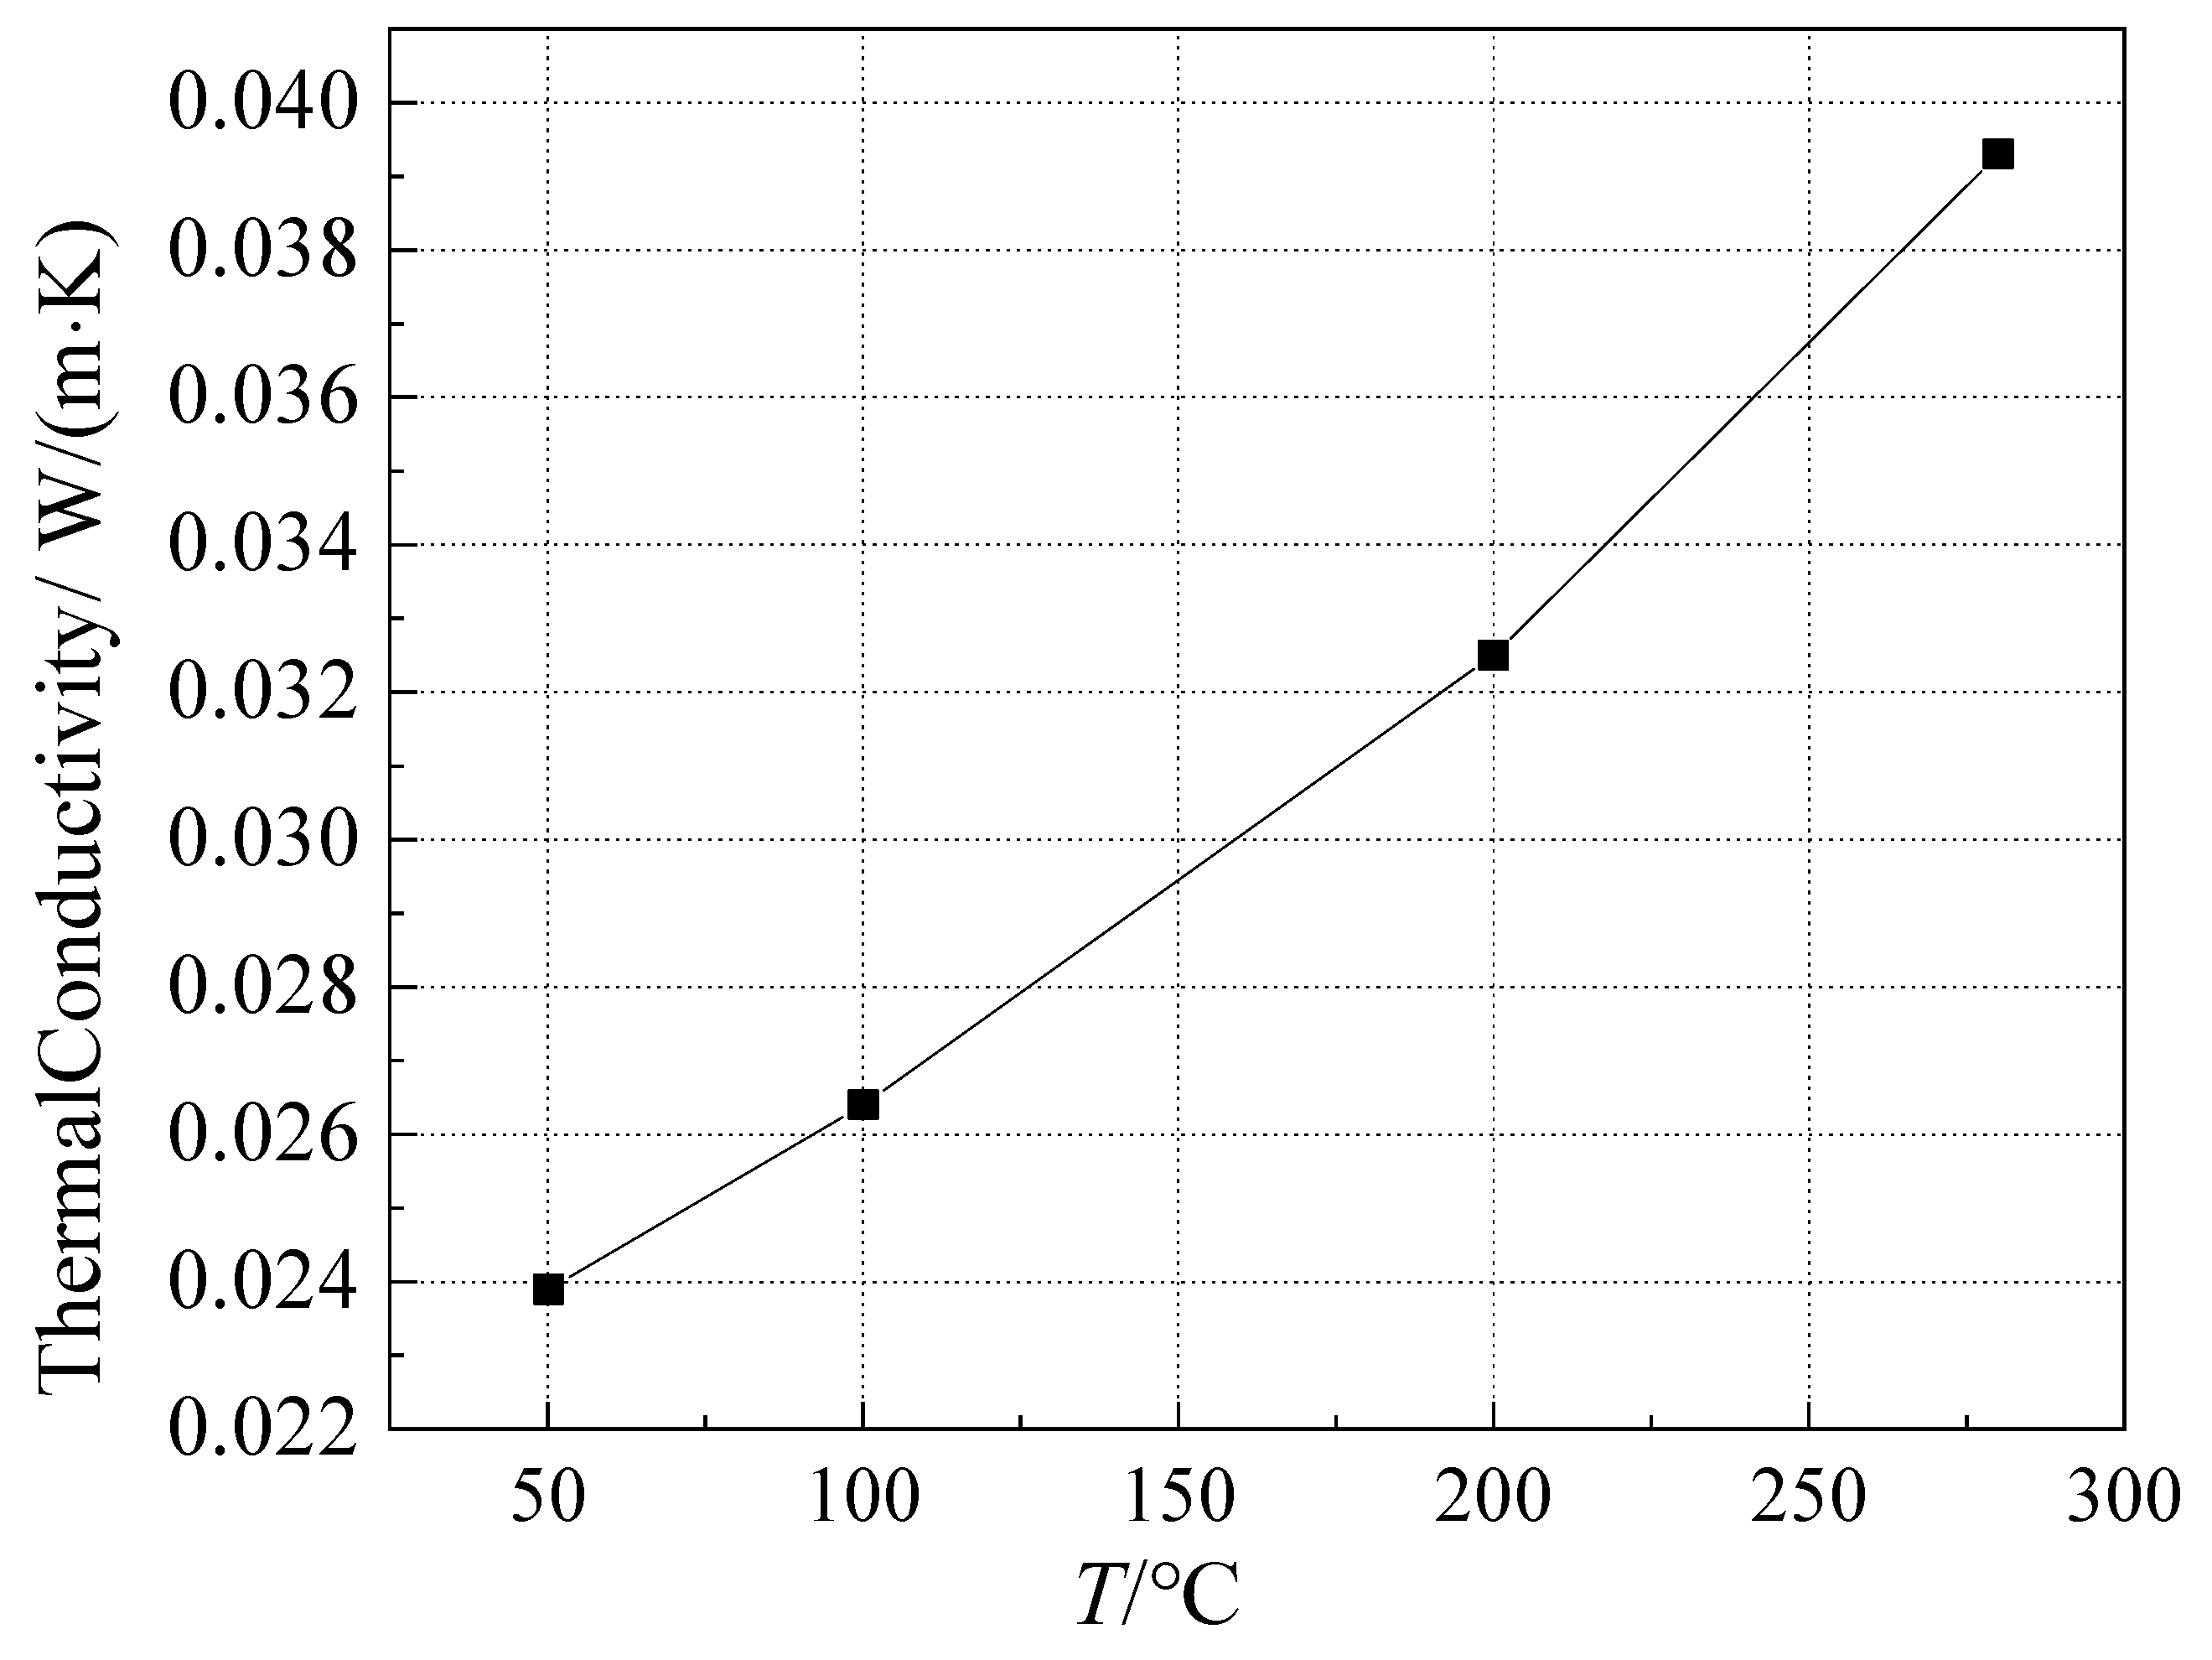
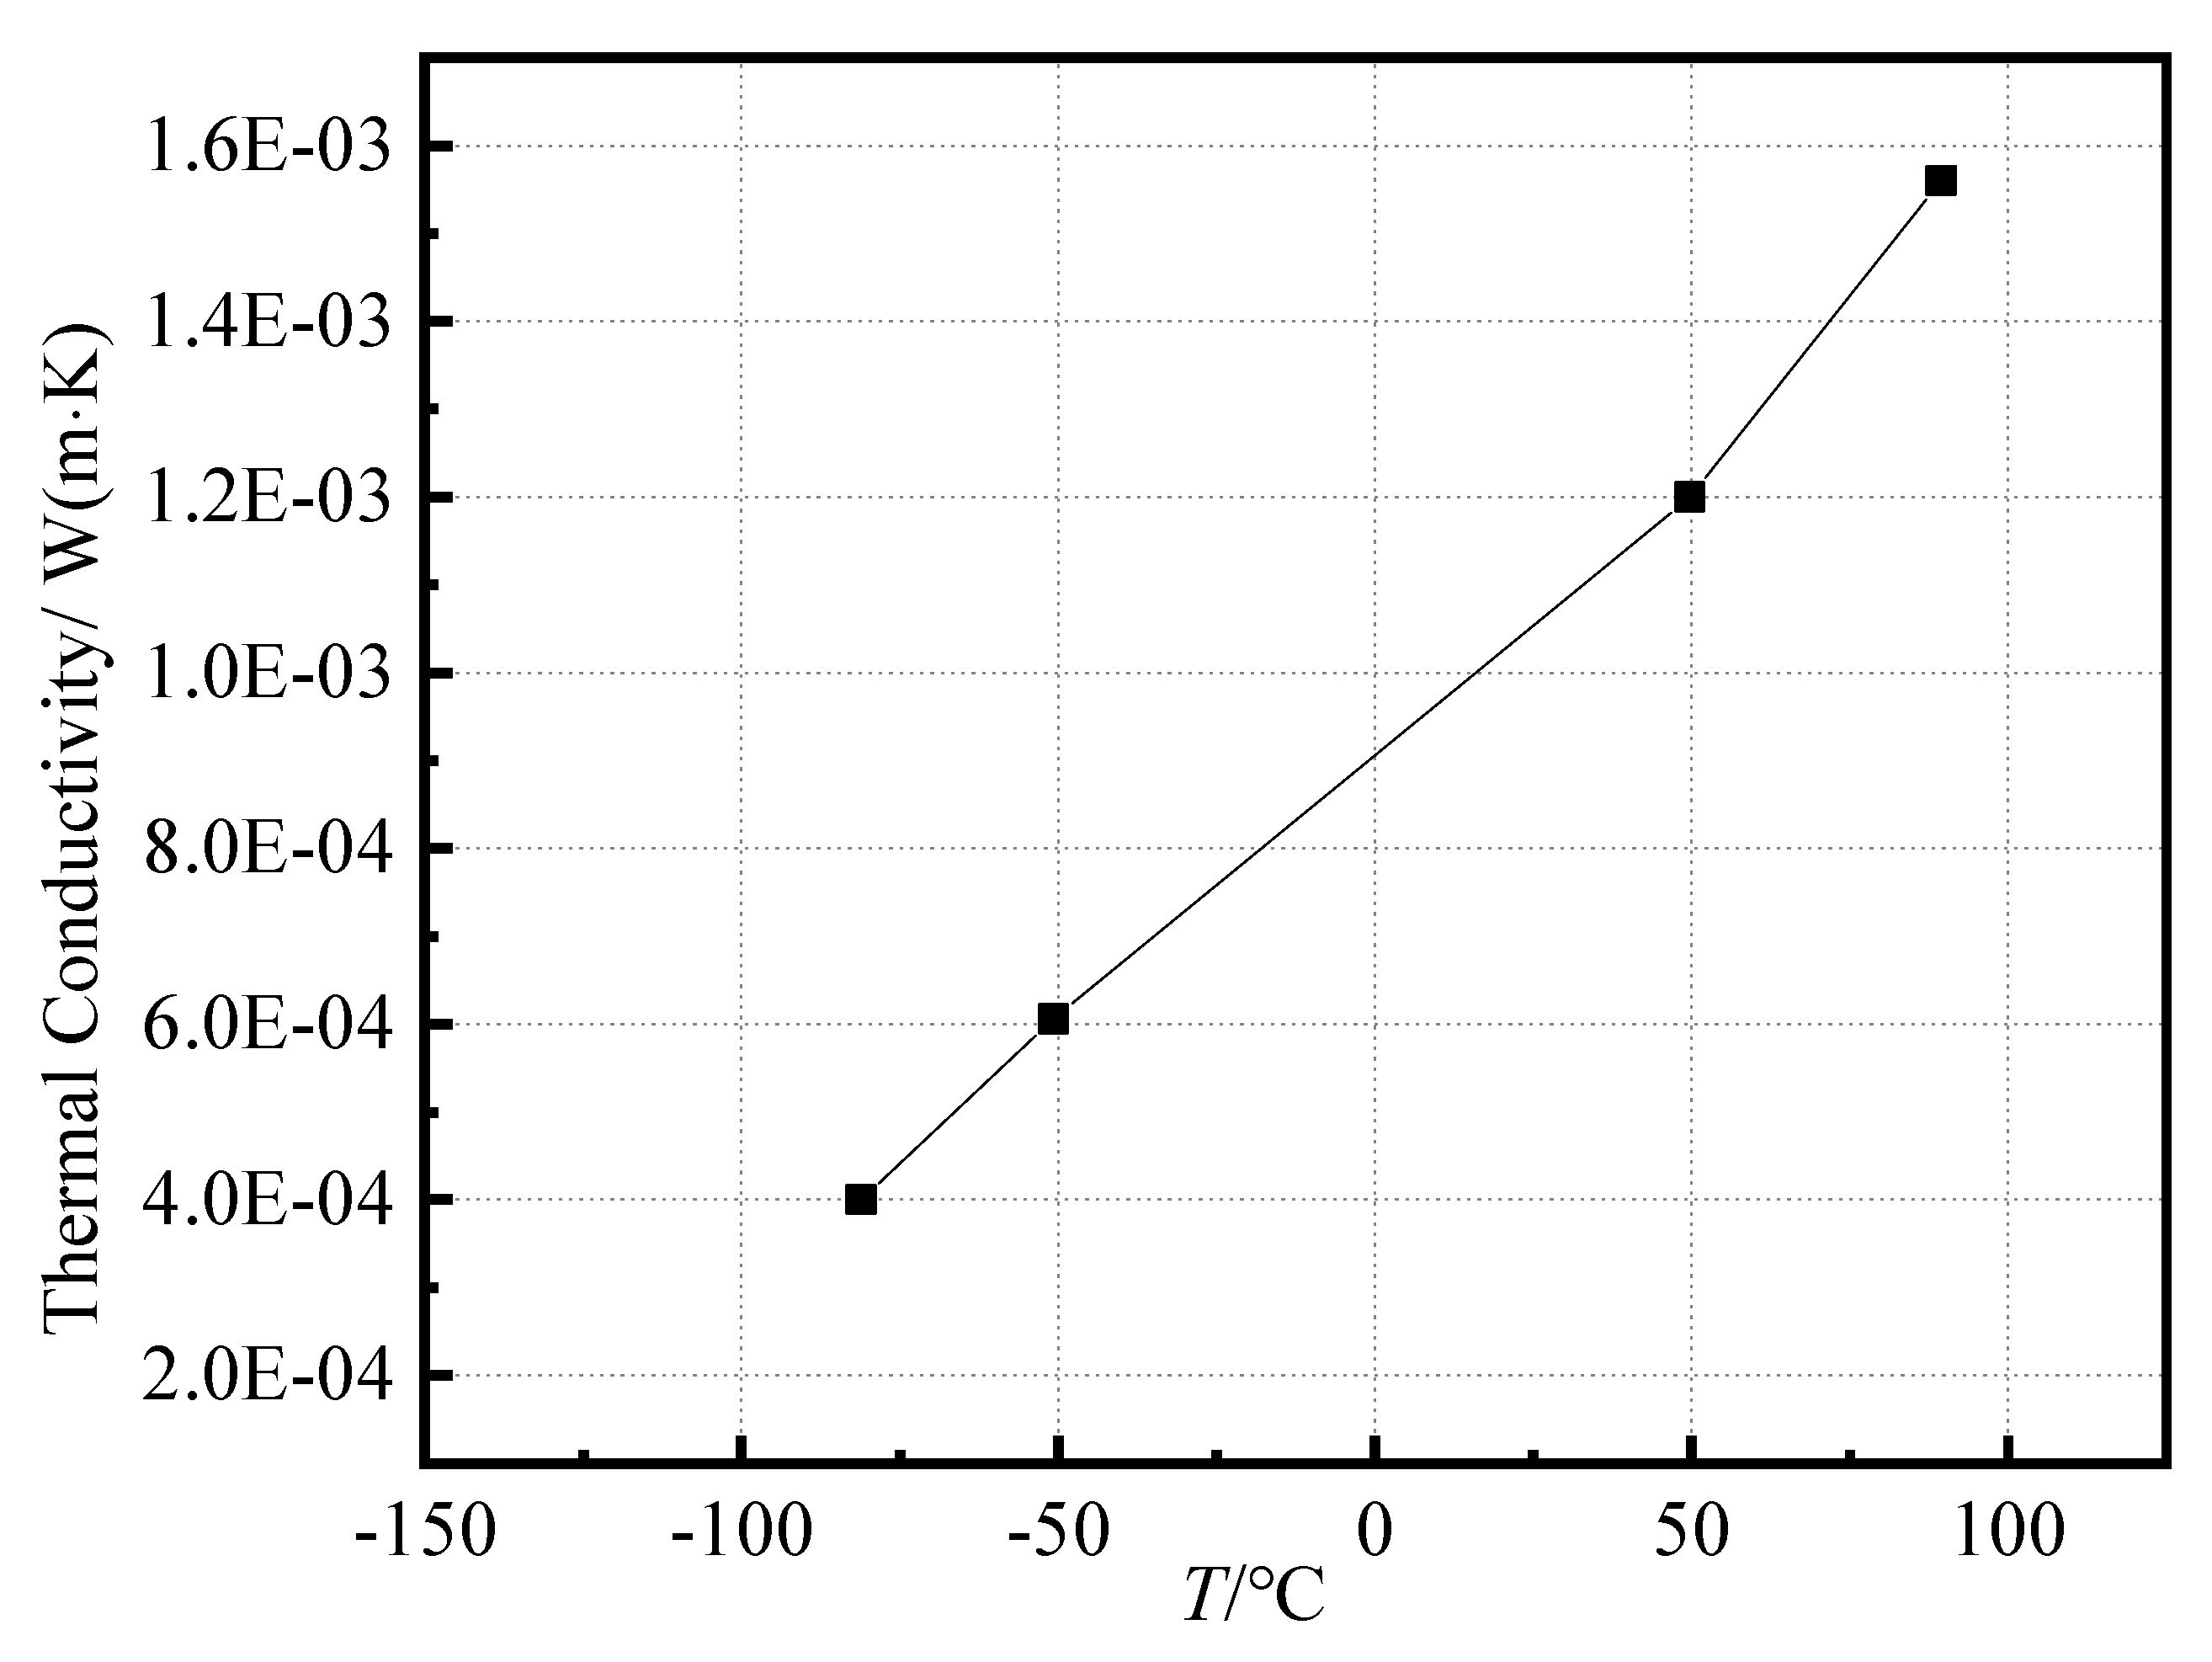
4.4. Thermal Conductivity Testing of the New Materials

The new thermal insulation material was tested for thermal resistance and thermal conductivity under different conditions using the measurement method validated in this paper. The material samples have a natural thickness of about 2~3 mm and a round shape of 300 mm in diameter with a soft nature, as shown in the Figure 7.
The thermal conductivity and thermal resistance of the new thermal insulation material under different vacuum degrees at 40 °C, and the test results, are shown in the Figure 8 and Figure 9. At this time, the sample was naturally put inside the test bench, and the clamping force was set to 1.63 kPa by the automatic pressurized thickness measurement device.
It can be seen that the thermal conductivity of the new thermal insulation material increases with the increase of the vacuum pressure, and it is not linear with the increase of the vacuum degree, and its thermal conductivity increases sharply when the vacuum degree is 1 Pa~10,000 Pa, while its thermal conductivity decreases slowly when the vacuum degree is below 1 Pa, and the change has been less obvious. At the ultimate vacuum of 5.1 × 10⁻⁴ Pa. Its thermal conductivity is about 1.38 mW/(m·K), and the average thermal resistance of the sample is about 1.134 m2K/W. The thermal resistance of the sample increases about 25 times from the atmospheric pressure to the order of 10−4 Pa.
Next, the thermal conductivity of the new insulation material was tested at different temperatures with a compression thickness of 2 mm and a vacuum of about a 0.001 Pa magnitude, and the results are shown in the Figure 10 and Figure 11. The thermal resistance of this new material sample under vacuum increases rapidly with the decrease in temperature, from 1.418 m2K/W at 89 °C to 3.979 m2K/W at −80 °C, which is about 3 times higher. The thermal conductivity of the material decreases rapidly with the decrease of temperature, from 1.418 mW/(m·K) at 89 °C to 0.40 mW/(m·K) at −80 °C. The measured value of the thermal conductivity of the new insulation material at −114°C is about 0.26 mW/(m·K), and the measured result of thermal resistance is about 7.842 m2K/W.

5. Conclusions

In this work, a method for measuring the equivalent thermal conductivity of insulation materials was proposed, which can be applied under vacuum conditions, and the thermal characteristic of novel insulation materials was analyzed. The following conclusions were obtained:
  • The design of a multi-layer insulation structure with vacuum regulation and a low outgassing rate was adopted to realize the pressure control of a 10−4 Pa magnitude~atmospheric pressure. Liquid nitrogen refrigeration and electric heating temperature control technology were adopted to realize the control of a −160 °C~280 °C test environment. The measurement of the thermal conductivity in a low- temperature vacuum environment was realized, and the error was better than ±1% when compared with the measurement results of the national standard sample reference plate.
  • We measured the thermal conductivity of extruded plastic panel samples, and aerogel felt samples under different vacuum degrees and different temperatures and performed an uncertainty analysis. The results showed that the relative uncertainty of the measurement of the device within the full range was better than ±5%.
  • The new thermal insulation materials were tested at different vacuum levels and different temperatures; the thermal resistance ranged from 0.04 m2K/W to 4 m2K/W, and the thermal conductivity ranged from 0.4 mW/(m·K) to 40 mW/(m·K). It has the potential to become an excellent insulation material for a solar simulator compared with the commonly used material, polytetrafluoroethylene, with a thermal conductivity of 270 mW/(m·K).

Author Contributions

Data curation, Y.Z.; Investigation, M.G.; Project administration, J.X.; Validation, J.G.; Writing—original draft, W.D. All authors have read and agreed to the published version of the manuscript.

Funding

This research received no external funding.

Data Availability Statement

Publicly available datasets were analyzed in this study.

Conflicts of Interest

The authors declare no conflict of interest.

References

  1. Qiu, Y.; He, Y.L.; Li, P.; Du, B.C. A comprehensive model for analysis of real-time optical performance of a solar power tower with a multi-tube cavity receiver. Appl. Energy 2017, 185, 589–603. [Google Scholar] [CrossRef] [Green Version]
  2. Wang, Q.L.; Yao, Y.; Hu, M.K.; Cao, J.Y.; Qiu, Y.; Yang, H.X. An air curtain surrounding the solar tower receiver for effective reduction of convective heat loss. Sustain. Cities Soc. 2021, 71, 103007. [Google Scholar] [CrossRef]
  3. Qiu, Y.; Zhang, Y.T.; Li, Q.; Xu, Y.C.; Wen, Z.X. A novel parabolic trough receiver enhanced by integrating a transparent aerogel and wing-like mirrors. Appl. Energy 2020, 279, 115810. [Google Scholar] [CrossRef]
  4. Li, Q.; Zhang, Y.T.; Wen, Z.X.; Qiu, Y. An evacuated receiver partially insulated by a solar transparent aerogel for parabolic trough collector. Energ. Convers. Manag. 2020, 214, 112911. [Google Scholar] [CrossRef]
  5. Liu, P.; Lv, J.Y.; Shan, F.; Liu, Z.C.; Liu, W. Effects of rib arrangements on the performance of a parabolic trough receiver with ribbed absorber tube. Appl. Therm. Eng. 2019, 156, 1–13. [Google Scholar] [CrossRef]
  6. Rao, Z.H.; Bao, S.T.; Liu, X.P.; Taylor, R.A.; Liao, S.M. Estimating allowable energy flux density for the supercritical carbon dioxide solar receiver: A service life approach. Appl. Therm. Eng. 2021, 182, 116024. [Google Scholar] [CrossRef]
  7. Qiu, Y.; He, Y.L.; Cheng, Z.D.; Wang, K. Study on optical and thermal performance of a linear Fresnel solar reflector using molten salt as HTF with MCRT and FVM methods. Appl. Energy 2015, 146, 162–173. [Google Scholar] [CrossRef]
  8. Qiu, Y.; Li, M.J.; Wang, K.; Liu, Z.B.; Xue, X.D. Aiming strategy optimization for uniform flux distribution in the receiver of a linear Fresnel solar reflector using a multi-objective genetic algorithm. Appl. Energy 2017, 205, 1394–1407. [Google Scholar] [CrossRef] [Green Version]
  9. Gallo, A.; Marzo, A.; Fuentealba, E.; Alonso, E. High flux solar simulators for concentrated solar thermal research: A review. Renew Sust. Energ. Rev. 2017, 77, 1385–1402. [Google Scholar] [CrossRef]
  10. Codd, D.S.; Carlson, A.; Rees, J.; Slocum, A.H. A low cost high flux solar simulator. Sol. Energy 2010, 84, 2202–2212. [Google Scholar] [CrossRef] [Green Version]
  11. Meng, Q.; Wang, Y.; Zhang, L. Irradiance characteristics and optimization design of a large-scale solar simulator. Sol. Energy 2011, 85, 1758–1767. [Google Scholar] [CrossRef]
  12. Dong, X.; Sun, Z.; Nathan, G.J.; Ashman, P.J.; Gu, D. Time-resolved spectra of solar simulators employing metal halide and xenon arc lamps. Sol. Energy 2015, 115, 613–620. [Google Scholar] [CrossRef]
  13. Xiao, F.; Liu, G.; Hu, C. Application of cryogenic technology in the aerospace field. Spacecr. Environ. Eng. 2002, 3, 11. [Google Scholar]
  14. Wen, X.; Huang, R.; Li, L. Cryogenic thermal conductivity testing system for solid materials. Cryog. Eng. 2008, 2, 5. [Google Scholar]
  15. Wu, H.; Gong, L.; Xu, X.; Li, L. Low temperature thermal conductivity testing device for non-metallic insulation materials. Cryog. Eng. 2009, 2, 28–31. [Google Scholar]
  16. Dai, J.; Fu, J.; Yu, H.; He, C.; Wu, Y. Design and experimental study of cryogenic thermal conductivity testing system for adiabatic materials. Low Temp. Supercond. 2016, 44, 5. [Google Scholar]
  17. Li, M.; Zhang, H.; Ju, Y. Design and development of double specimen protection hot plate device in liquid nitrogen temperature zone. J. Shanghai Jiaotong Univ. 2012, 46, 6. [Google Scholar]
  18. Tao, Z. Study on Thermal Conductivity Measurement of Insulation Materials by Low Temperature Protective Hot Plate Method. Ph.D. Thesis, Nanjing University of Aeronautics and Astronautics, Nanjing, China, 2015. [Google Scholar]
  19. Schindler, A.; Neumann, G.; Stobitzer, D.; Vidi, S. Accuracy of a guarded hot plate (GHP) in the temperature range between—160 °C and 700 °C. High Temp.—High Press. 2016, 45, 81–96. [Google Scholar]
  20. Zarr, R.R.; Flynn, D.R.; Hettenhouser, J.W.; Brandenburg, N.J.; Healy, W.M. Fabrication of a Guarded-Hot-Plate Apparatus for Use Over an Extended Temperature Range and in a Controlled Gas Atmosphere. Therm. Conduct. 2006, 28, 235. [Google Scholar]
Figure 1. Schematic diagram of vacuum cryogenic thermal conductivity testing system.
Energies 15 04831 g001
Figure 2. Schematic diagram of thermal conductivity test bench. 1. Loading structure; 2. Multi-layer insulation structure; 3. Upper shroud plate; 4. Upper heat resistance layer; 5. Upper heating cold plate; 6. Secondary protective heat plate; 7. Surrounding heat insulation layer; 8. Surrounding shroud; 9. Lower cold plate assembly; 10. Internal support; 11. Vacuum chamber bottom plate; 12. Lower metering temperature measurement plate; 13. Lower protective temperature measurement plate; 14. Protective heating plate; 15. Upper metering heating plate; 16. Heat plate; 17. Upper metering temperature measuring plate; 18.Test sample.
Energies 15 04831 g002
Figure 3. Liquid nitrogen line layout.
Energies 15 04831 g003
Figure 4. Thermal conductivity of extruded plastic panel samples under different vacuum levels.
Energies 15 04831 g004
Figure 5. Thermal conductivity of extruded plastic panel samples at −160 °C~30 °C.
Energies 15 04831 g005
Figure 6. Thermal conductivity of aerogel felt at 50 °C~280 °C under atmospheric pressure.
Energies 15 04831 g006
Figure 7. Sample of new insulation material.
Energies 15 04831 g007
Figure 8. Thermal conductivity of new insulation materials at different vacuum levels; temperature, 40 °C.
Energies 15 04831 g008
Figure 9. Thermal resistance of the new insulation material under different vacuum degrees; temperature, 40 °C.
Energies 15 04831 g009
Figure 10. Thermal conductivity of the new material (temperature difference of 30 K, compression thickness of 2 mm, and vacuum of about a 0.001 Pa magnitude).
Energies 15 04831 g010
Figure 11. Thermal resistance of the new material (temperature difference of 30 K, compression thickness of 2 mm, and vacuum of about a 0.001 Pa magnitude).
Energies 15 04831 g011
Table 1. Comparison of the measurement results of national standard sample reference plates.
Average Temperature
/°C
Standard Value
W/(m·K)
Measurement Results
W/(m·K)
Measurement Error
200.03230.0322−0.31%
250.03280.03290.30%
400.03450.03450.00%
500.03570.03580.28%
600.03700.03720.54%
700.03810.03810.00%
Publisher’s Note: MDPI stays neutral with regard to jurisdictional claims in published maps and institutional affiliations.

