Abstract
In this work, the optimal participation of heterogeneous, Renewable Energy Source (RES)-based Virtual Power Plant (VPP) in Day-Ahead Market (DAM) and Intra-Day Market (IDM) is studied. For this purpose, a detailed model of the RES-based VPP and of the market operation is needed. The VPP includes both dispatchable and non-dispatchable RESs and flexible demand assets. This paper presents an improved, linear solar thermal plant model to consider its non-linear efficiency curve. A novel demand model with two flexibility levels that are associated with the different market sessions is also proposed. The market operation allows for updates of energy offers and this is used by the VPP to submit DAM auctions and to participate subsequently in IDM to correct for deviations. Finally, the optimal participation of the VPP in energy markets is assessed under different weather conditions.
1. Introduction
Nowadays, Renewable Energy Source (RESs) have emerged as a crucial part of modern power systems due mainly to their decreasing costs of operation and minimal carbon footprint; however, most RES technologies depend on sources of a stochastic nature and are non-dispatchable. Stochastic RESs thus have an inherent disadvantage when participating in energy markets, as they are susceptible to economic penalties and/or losses if they do not supply the energy scheduled in the corresponding market session [1]. Additionally, some of these stochastic generating units have relatively small sizes as single offering units compared with large conventional, synchronous plants. Market barriers based on minimum size requirements might bar the entry of some of these stochastic units in some markets.
The aggregation of RESs as VPPs to provide a more controllable output is a promising solution to improve the competitiveness of stochastic RESs in energy markets. A VPP participating in electricity markets and comprising only wind and solar PV power plants was presented in [2]. The uncertainties related to wind and irradiation were dealt with using appropriate forecasts and integrating the VPP operation with the distribution network. In [3], a VPP consisting of only stochastic RESs was analyzed and an energy storage system was utilized in providing the flexibility required to reduce the impact of generation uncertainty. Furthermore, another storage medium that has been utilized for flexibility provision is pumped hydro storage plants. Different studies on VPP operation have utilized hydro storage in provision of flexibility [4,5]. To further expand on the work that has been performed on VPP modeling, Table 1 gives a selection of different aggregated components of VPP studied in the literature and the demand response/flexibility sources, which include conventional thermal power plants (such as nuclear and fossil-fueled generating units), loads and Battery Energy Storage System (BESSs), among others.

Table 1.
VPP components and units.
Table 1 reveals that BESSs and demands are common assets for demand response/flexibility provision. It is also observed that there are still less-studied technologies such as Solar Thermal Unit (STU) as a component of VPP. It follows that the different management proposals and methodologies that have been utilized in the literature for VPP operation can vary among the following choices:
- Inclusion of storage systems, especially BESSs to appropriately follow periods of excess generation and supplement during periods of under-production [11,12,17];
- Usage of phantom-storage systems such as a demand response that could respond to the stochasticity of the RESs [8,10,11];
- Studying the operational and economic feasibility of participating in market structures that allow updates of offers close to periods of power delivery [17,18].
The VPP modeled in this paper explicitly excludes Conventional Power Plant (CPPs) and BESSs, and it only considers the VPP’s RES units, both dispatchable and non-dispatchable, as well as flexible demands, for its optimal operation. The motivation for considering an RES-based VPP is to show to what extent such VPPs can optimally participate in energy markets. A successful participation allows further increasing RES-based generation portfolios of generation companies, without the need to rely on devices with relatively high investment and operating costs such as BESSs. In the following paragraphs, detailed notes on the contribution of this work are introduced.
While models of the most common stochastic RES technologies such as wind and solar PV generation participating in energy markets are well established, appropriate modeling of other emerging technologies, e.g., Solar Thermal Unit (STU) is still an open issue. For instance, two aspects need to be carefully considered when modeling STUs. These are the integration of molten-salt thermal storage with the STUs and non-linear conversion efficiencies from thermal to electrical energy. The latter depends on the level of thermal power injected into the plant’s power block. STUs with storage were modeled in [19,20] but conversion efficiency was chosen as an average value in both studies. Choosing a single average efficiency value might appear as a good compromise [21], but it does not correspond to the actual operation of the STU.
VPPs are also gradually including demands with flexibility provision capability in their portfolio [10]; however, the main challenge with demand-side response models is the absence of appropriate benefits for consumers that provide such demand response actions. Flexible and non-flexible loads with associated costs were presented in [22] but these benefits measures were not addressed. A price-based control for demand management was proposed in [23] while neglecting the parametrization of the comfort of end-users. In [24], the behavior of dispatchable loads on an aggregated scale was studied but the end-goal in that work was decreasing the power system operating costs as well as reducing the need for CPPs.
In this regard, the contribution of this paper is a detailed model of heterogeneous, RES-based VPPs participating in energy markets with the following proposals:
- A detailed STU model with storage capability. The model includes a linear formulation for the operation of STU that addresses conversion from thermal to electrical energy using a piece-wise linear efficiency function. It is noted that the thermal storage model proposed in this paper can be easily extended to other technologies (e.g., biomass CHP) without loss of generality.
- A demand model with two flexibility/response levels associated with different energy market trading sessions. In the first demand response level, the demand owner prepares different profiles with associated costs that the VPP manager can choose from in DAM. The second response level concerns IDM where tolerance around the DAM chosen profile is used in updating energy offers due to changes in forecasts of stochastic generating units or other causes;
- An operation model within a market structure that allows updates of energy offers. A network-constrained unit commitment model is used by the VPP to submit DAM auctions and then subsequently participate in IDM sessions to correct for deviations of its Non-Dispatchable Renewable Energy Source (ND-RES) forecasts.
To check the effectiveness of the model proposed in this paper, the case study that is presented and discussed considers that the VPP participates in the Spanish energy market [25]. Note however that the proposed model is general enough to be easily parametrized for any other market in which a sequence of DAM and IDMs is present. Moreover, the model allows the user to define any configuration of a RES-based VPP, by selecting the technologies and number/size of units of each technology that comprises the VPP. Note that, in this work, uncertainties are not modeled as performed, for instance, in robust optimization or stochastic programming approaches. Such approaches seek to find, for a given VPP configuration and a given market structure, the optimal bidding strategy that ensures feasibility under any condition considered. The main purpose of this paper is to provide the user with a model that can be used to compare the behavior of different VPP configurations to make the first decision for the optimal operation. This model can then be included within a robust optimization implementation to consider uncertainty, which is beyond the scope of this paper.
The remainder of the paper is organized as follows. Section 2 highlights the main features of the Spanish energy markets. The detailed model of the RES-based VPP proposed in this paper is formulated in Section 3. Section 4 presents the case study, which considers a VPP in a region of Southern Spain. Different weather conditions are accounted for to test the behavior of the VPP against highly or poorly favorable conditions. Section 5 discusses the simulation results obtained. Finally, Section 6 draws conclusions and outlines future work directions.
2. Overview of Spanish Energy Market Structure
The wholesale electricity spot market and technical management in Spain is organized by the market operator (OMIE) [26] and system operator (Red Eléctrica de España (REE)) [27], respectively. Two broad markets, the DAM and IDM, govern the day-to-day running of electricity provision and consumption with some additional arrangements associated with ensuring reliability and secure operation of the energy system [28].
The sequential operation of the electricity delivery is organized as shown in Figure 1. DAM offers and bids, which consist of prices and generation/consumption capacity, are submitted by generation and consumption units for the next operation day. The market operator receives these bids from all participants and by using a merit order framework, ranks all the generators’ production against the demand to determine the marginal price that will be paid to/received from market participants. The system operator then receives these ranked bids, performs congestion management analysis, and subsequently modifies the generator dispatch, if required.
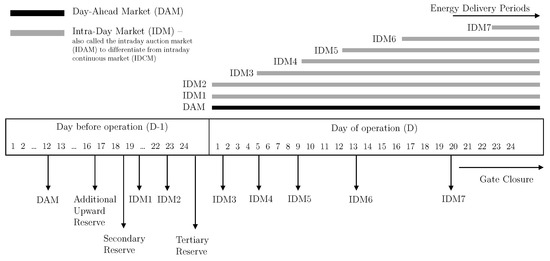
Figure 1.
Sequence of the Spanish electricity market.
After DAM clearance, IDMs are instantiated to adjust DAM cleared bids and correct infeasible schedules. These modifications or corrections can be due to unplanned shutdown of dispatchable sources of generation, changes in ND-RES outputs, demand changes, etc. IDM sessions are especially useful for balancing renewable generation bid deficits or surplus by giving market participants with RESs an avenue to update their availability when their submitted DAM bids are different from near real-time realizations. There are seven IDM sessions; the first and second cover 24 h of the operation day while the remaining five sessions cover a receding subset of the 24 h [28]. There also exists a continuous intraday market that allows trading at European level for re-adjusting energy imbalances in between IDM auction sessions.
A consortium of generation and demand assets (a VPP), participating in the Spanish energy market can thus capture the operational flexibility that the different energy market segments offer in order to maximize its revenue. This work, while currently tailored to the Spanish market, can be applied in other markets of similar characteristics (e.g., the Nordic countries, Austria, France) and proves the potential of RES-based VPPs.
3. VPP Modeling
This section formulates and discusses the VPP model proposed in this paper. The VPP comprises Dispatchable Renewable Energy Source (D-RES) (hydro), Non-Dispatchable Renewable Energy Source (ND-RESs) (wind power plant and solar PV), solar thermal generation with storage capability (a hybrid between D-RES and ND-RES) and flexible demands. These assets are distributed across the power network at different buses and connected to the main grid through one or more Points of Common Coupling (PCC). More information about the different components that comprise the VPP discussed in this paper, and its aggregated effect, also from the dynamic response point of view, can be found in [29]. The business model considered for the VPP is the maximization of its aggregated profit by optimally scheduling its generation and demand assets.
The formulation for each asset class is enumerated below. D-RES are modeled as conventional power plants [30] with linearized operation costs of the dispatchable assets. Network constraints are formulated by using DC power flow [31]. The objective function of the VPP, and constraints for the ND-RESs, flexible demand, STU, and energy balance at the PCCs are presented in the following subsections. Note that, in line with neglecting demand and RES-related uncertainties, hourly profiles of available demand and RES are inputs.
In the following subsections, the models have been described under the market participation frameworks. This separation between DAM and IDM is due to differences in prices and volumes of energy traded between the markets [28].
3.1. Day-Ahead Market (DAM) Formulation
For any participant in the wholesale pool market, the DAM is the entry point. Without participation in the DAM, there is no avenue to take part in other market segments/sessions.
3.1.1. Profit Maximization Objective
In DAM, the objective Function (1) is the maximization of the obtainable profit by the VPP assets calculated as the revenue from power trades minus the cost of operating D-RES and cost of selecting a particular load profile.
3.1.2. Power Trades
Equation (2) ensures that summation of traded power at all buses connected to the main grid is equivalent to the total power available for trading by VPP whereas (3) relaxes this available power at each time.
3.2. Intra-Day Market (IDM) Formulation
3.2.1. Objective
For the different IDM sessions, the VPP benefit (4) is calculated over changes in traded power between (i) DAM and the first IDM trading period and (ii) other subsequent IDM sessions. The cost of choosing a specific load profile is not included while computing the objective of IDM because this choice is previously made during DAM participation and must be accounted for only once.
3.2.2. Power Trades
For IDM sessions, the bounds on the traded power is modified such that the load profile that was chosen in the DAM is considered as formulated in (5). Note that the IDM offers/bids do not substitute those submitted in the DAM, but rather, they are adjustments of the DAM offers/bids as reflected in (6). In principle, there is no actual limit on the volume of energy trades during the IDM sessions; however, practical works related to the market model under study have shown that there is a limited liquidity [28]. The market operates such that it disincentivizes price speculation. The relatively low liquidity of the IDMs compared to that of the DAM implies an important risk of energy offers/bids not being accepted.
In (5) and (6), and are the solutions of the DAM and previous IDMs, respectively; is the optimal load profile for each demand, scaled by the profile’s upper bound of uncertainty, , (see (5)). Note that for the IDM formulations with time indexes, is used, where is the first delivery period of the current IDM session.
3.3. Other Constraints
Energy balance, network and ND-RES constraints are common to both DAM and IDM markets and are formulated below.
3.3.1. Energy Balance
Nodal analysis is utilized, implying that at each bus of the network, the sum of inflows and outflows must be equal. Equation (7) gives energy balance at the Point of Common Coupling (PCC) with the main grid while (8) is the balance for all other buses in the VPP network at every period. The difference between both equations is the presence of at the main grid representing scheduled power to be traded with other market participants. This power available for trading (buy or sell) is set as the interconnection capacity of the VPP in (9).
3.3.2. Non-Dispatchable Renewable Energy Sources
The ND-RESs modeled in (10) comprise mainly wind power and solar PV plants. The lower bound represents the asset technical minimum while the output is bounded above by the available stochastic source. Input parameters were chosen after careful analysis of realistic power plant data.
3.3.3. Network
Modeling the overall power system as a single bus to which all assets, comprising or not the VPP, are connected, is a common simplification that is valid in cases where, e.g., the VPP assets are widely spread over a meshed, well-connected network; however, in cases where all VPP assets are located within a relatively small part of the main grid, or where the grid is weak and prompt to, e.g., congestion, it is imperative to model the network constraints. In this regard, the well-known and widely used DC power flow formulation is considered, and the corresponding equations are collected in (11)–(14).
3.4. Solar Thermal Units
STUs are synchronous generating plants that rely on a stochastic renewable source (solar irradiation). Additionally, they usually include storage capability for as much as 8 h at full power capacity [32]. Moreover, conversion between the thermal and electrical power, which takes place in the Power Block (PB) of the STU, needs to be appropriately formulated. For these reasons, STUs cannot be accurately represented by parametrizing any of the sets of constraints above, and they require a specific set in the VPP model proposed in this paper. Specific contributions made to the STU model in this work are (18)–(20). It should be noted, however, that the storage of the STU cannot be charged from the grid but only from the solar field.
Equation (15) defines the upper and lower bounds of the active power (thermal) that can be generated by the solar field, , which is only limited by the available power extractable from solar irradiation. The charging and discharging power (thermal) of the STU storage device are bounded above and below in (16) and (17). The power (thermal), , sent to the PB, which converts the thermal into electrical power through a steam turbine is given in (18). It is the sum of the thermal power generated by the solar field, net thermal power of the STU storage, and a final factor containing coefficient takes startup losses into account. This power is then bounded in (19) by the maximum and minimum power output of the turbine. The commitment status of the PB that reflects its on/off status is modeled in a manner similar to dispatchable power plants.
The electrical power output of the STU is given by (20). Conversion between thermal and electrical power is nonlinear, and depends on the level of thermal power injected into the PB. The higher is, the more efficient the conversion. In this work, four linear segments have been defined, delimited by , and characterized by different conversion factors, . Figure 2 shows the PB efficiency for converting thermal power input into electric power using parameters for a 50 MW STU in Spain.
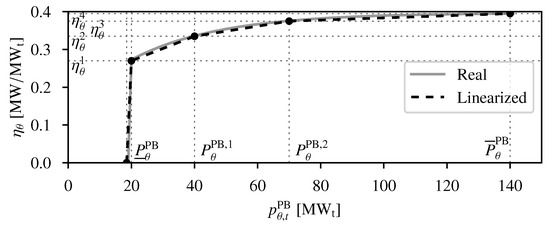
Figure 2.
Power block conversion efficiency.
Finally, equations that model the thermal energy stored in the STU storage device are (21)–(24) where is the thermal storage capacity and is the lower/upper bound multiplier of storage at the final period of the schedule. In (15)–(24), all power quantities are in thermal units (), except for the PB power output, , which is in electrical units (MW). For implementation purposes, the piece-wise linear function (20), is remodeled with SOS-2 constraints [33].
3.5. Flexible Demands
In this work, a novel participation of flexible demands in a VPP is presented. It comprises two levels of flexibility, which are linked with the DAM and IDM market sessions, as formulated below [34]. The assumptions considered while developing this model are based on feedback from Spanish distribution companies and retailers that are in constant interaction with customers.
3.5.1. DAM Formulation
At the first stage, such participation involves the selection of a specific load profile. With this aim, (25) and (26) ensure that for each demand d, only one load profile p out of all available profiles is selected. These profiles mirror the different available operational characteristics of the demand assets, e.g., for residential demand, a profile might feature dual peaks at 09:00 and 20:00 while another profile features a shift of the peaks to 07:00 and 21:00, respectively. These profiles are prepared by the demand owners/aggregators and subsequently communicated to the VPP manager. One of them could be the default profile, which the load owner will follow if no coordination exists. Other profiles that can offer flexibility but might lead to higher operating costs for the load owner can be presented and the VPP manager needs to compensate them in exchange for the offered flexibility if those profiles are selected.
3.5.2. IDM Formulation
The IDM sessions provide the second level of demand response for the VPP as presented in (28)–(31). Following the selection of load profile during DAM, the only changes allowed during IDMs include a small percentage around the previously chosen profile () as seen in (28). The bounds chosen do not necessarily have to be symmetric but are chosen carefully to reflect realistic practices. Equations (29) and (30) give the ramps of the demand profile as the operation horizon moves from one period to the next. Lastly, for many demand profiles, there usually is a total minimum consumption amount, which must always be satisfied. This constraint is ensured by (31). The constraint also certifies that energy values consumed in previous periods, , are accounted for during following IDM sessions.
4. Case Study
The case studies considered to validate the RES-based VPP model proposed in this paper is presented in this Section. The VPP topology considered is outlined, which resembles a subarea of the southern region of the Spanish grid. These case studies are implemented in GAMS with CPLEX on a computer with 32 GB memory, Intel i7. The run-time (reading of data, algorithm execution, and writing of results) is less than 5 s for all scenarios.
The VPP assets are dispersed across a 12-node network connected to the main grid through a PCC (bus 5) as shown in Figure 3. The capacities of D-RES, hydro (bus 6) is 111 MW. For ND-RESs, wind power plant (bus 4), solar PV (bus 8), and STU (bus 1) power block have rated capacities of 50 MW each. The thermal storage capacity associated with the STU is 1100 MWh. It is desired that, after an operation day, a predefined amount of such capacity is reserved for the first period of the next operation day such that it might be used to capture some benefits of early high prices before another charging period begins (see Equations (23) and (24)). Additionally, thermal storage can only be charged from the solar field and not from the main grid. The demands considered are industrial, airport, and residential loads (buses 3, 9, and 12) with minimum total consumption of 800, 580, and 600 MWh, respectively. Each demand has three profiles and the total consumption for each profile is the same.
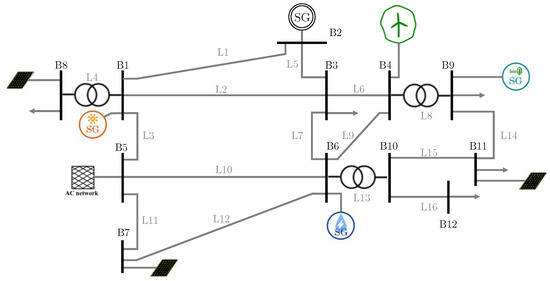
Figure 3.
A 12-node network for test cases.
An hourly timescale with total time horizon of 24 h is utilized during DAM, while a subset of the 24 h is used for each IDM session. The VPP has the possibility to supply its internal demand, partially or entirely, by buying energy from the main grid at the PCCs if needed. In this paper, the maximum amount of power that the VPP can buy in one hour is 110 MW. This limit represents the line capacity connecting the VPP network to the main grid’s PCC. Such a limit can be defined based on (i) the power-flow limit of the line or connecting transformer, and (ii) on the overall capacity of the VPP, i.e., a tighter limit of the exchange can be set if the VPP is small (see (3)) and vice versa if the VPP is large. Furthermore, computations for different seasons and days based on historical data were made. Historical data of actual measurements from different solar and wind farms in Spain were obtained from power generation companies.
For each market window, uncertain generation profiles were generated by creating random profiles around the actual (measured) production of a selection of days, ensuring that such profiles are always within confidence bounds defined based on the standard deviation obtained from the whole historical series. Updated forecasts for late IDM windows have tighter confidence bounds than the DAM and early IDM ones, i.e., the random values that are generated are close to the actual production because uncertainty reduces as the delivery period is closer to the forecast time. Figure 4 shows estimated wind power output and irradiation levels in Southern Spain for a clear, sunny day in March 2014 and a day with cloud covers in March 2018.
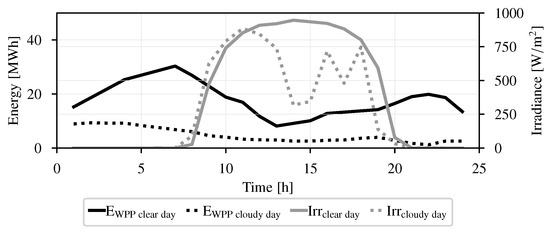
Figure 4.
Forecasts for STU, WPP, and PV generation on a clear and cloudy day.
For demands, different profiles of the three loads are shown in Figure 5. While fictitious, the base profile replicates the default consumption activities while other profiles are designed to perform peak shifting around it. During IDM, the demand owner allows a tolerance for demand movement over the selected profile at dam. The input demand profiles have been discretized due to market requirements where offers are submitted on an hourly basis. Continuous load profile curves can be prepared by the load owners while the VPP, using the appropriate timescale computes and submits the average.
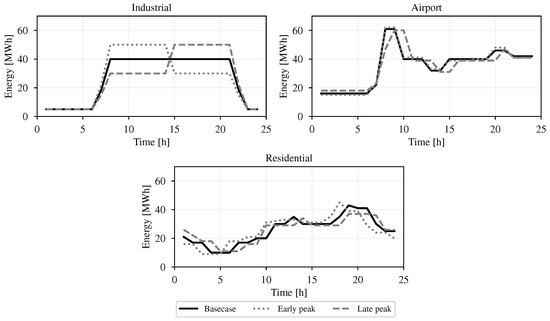
Figure 5.
Demand profiles.
In Figure 6, representative prices for DAM and all IDM sessions for both clear and cloudy days are shown. The prices were obtained from [26] and analyzed to obtain representative prices for the conditions simulated. The later IDM prices (3–7) do not cover the entire operation horizon due to the range of their operation period as revealed in Figure 1.
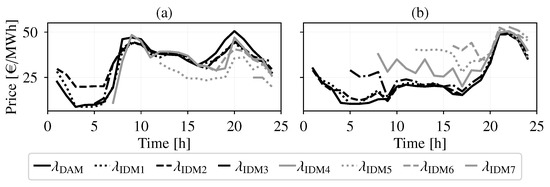
Figure 6.
DAM and IDM prices on (a) clear day, (b) cloudy day.
5. Results
To test the effectiveness of the model presented in this paper, two operation strategies were identified:
- Base-case where generation or consumption units act individually (No Coordination);
- Coordinated VPP operation as formulated in Section 3.
First, the benefits of the VPP strategic behavior over the base-case for the DAM and the first IDM session with a default load profile in both cases are outlined.
In the base-case, all the units participate separately in the market sessions without knowledge of other units, i.e., they are not a VPP. For instance, the WPP, only seeks to maximize its profit. The same reasoning applies to the STU, the demand units, etc. Then, their overall output (energy bids/offers as well as profits) is aggregated as “Base-case”/“No coordination”.
A profit comparison between the days and the two strategies above is shown in Figure 7. For the clear day, there is a and increase in the profits during dam and IDM, respectively, when the VPP model is compared to the case without coordination; however, these profits are more significant during the cloudy day where the VPP outperforms the base-case with and during dam and IDM, respectively.
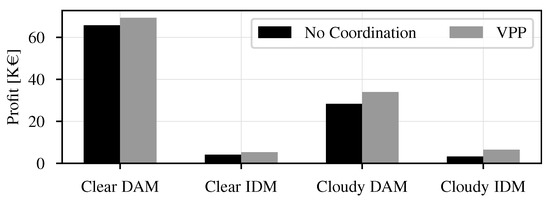
Figure 7.
VPP benefits on different strategies.
To fully comprehend the effectiveness of the presented VPP model, the following scenarios were analyzed in detail: firstly, a clear day with high wind power plant output and high irradiance level; secondly, a day with intermittent cloud covers in the afternoon and low wind power output. Each of these two broad categorizations will be further examined under (a) base-case with the default load profile (b) VPP with the default load profile, and (c) VPP with three load profiles at zero cost. Finally, an analysis to ascertain the behavior of non-zero cost demand profiles on a clear day is conducted.
5.1. Traded Power and Output of Assets on a Clear Day
Figure 8 shows traded energy on a clear day during DAM and all IDM sessions and Figure 9 depicts the expected behavior of the different assets at DAM. The effect of coordination is evident from the smoothing of the traded power curve from period 10–16 h in VPP compared with the base-case. The differences arise largely due to proper synchronization of the STU with its storage and the biomass plant response to the market price.
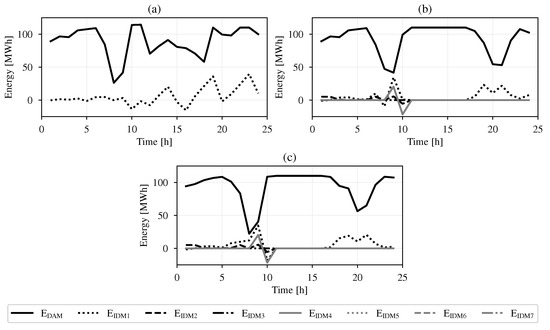
Figure 8.
Traded power on a clear day at DAM and IDM in: (a) No Coordination; (b) VPP with default load profile; (c) VPP with three load profiles at zero cost.
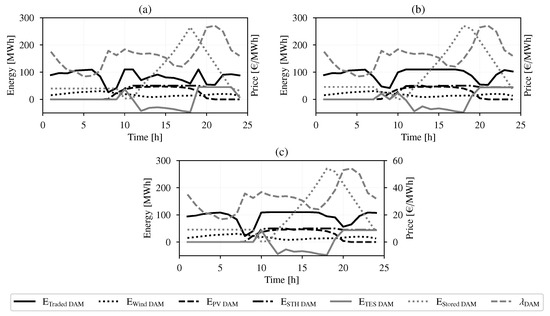
Figure 9.
Output of assets at DAM on a clear day: (a) No Coordination; (b) VPP with default load profile; (c) VPP with three load profiles at zero cost.
The low volume of energy traded in period 8–9 h coincides with very high demand and relatively low generation in the three cases. Moreover, in terms of benefits to the VPP, case (c) with three load profiles at zero cost has the highest profit because it leverages differences in the load shape and chooses the best profile to suit its objective. The residential late peak profile was selected in this instance while the early peak profiles were chosen both for the industrial and airport demand.
For IDM participation, updates to output forecasts of ND-RESs and prices (as seen in Figure 4 and Figure 6) are made before offers are again submitted to the market operator. The VPP manager (or owner of each asset in case of No Coordination) adjusts DAM auctions and in most cases, prioritizes the ND-RES over the D-RES units. Additionally, most updates are made in the earlier IDM sessions as evidenced in Figure 8 where there are no changes in offers made in IDM5–IDM7.
5.2. Traded Power and Output of Assets on a Cloudy Day
The VPP behaves differently on a day with intermittent cloud covers in the afternoon. There are more activities during IDM as the forecasts of ND-RES are in flux as shown in Figure 4. These uncertainties, however, are taken care of by the model as observed in Figure 10b,c where IDM bids reflect their expected behavior. With respect to demand, the early peak profiles were selected for both industrial and airport demands whereas the base-case was retained for the residential demand.
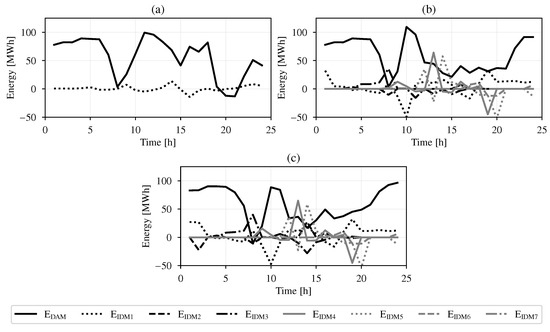
Figure 10.
Traded power on a cloudy day at DAM and IDM: (a) No Coordination; (b) VPP with default load profile; (c) VPP with three load profiles at zero cost.
The comparative advantage of the VPP over the base-case was the operation of the STU at the early hours. The STU charged the thermal storage instead of delivering energy from the solar field to PB at lower efficiency and thereafter delivered it at high PB efficiency while also capturing the high prices towards the end of the day as shown in Figure 11b,c. This is in contrast to STU model with average efficiency value where there is no incentive for choosing the operation region. Moreover, in terms of benefits to the VPP, STU model with linear piece-wise formulation of efficiency gave a increase on the vpp objective value over using an average value.
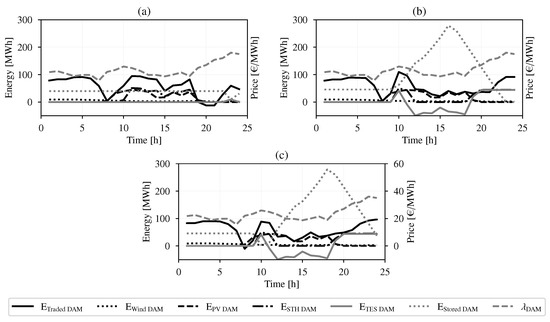
Figure 11.
Output of assets at DAM on a cloudy day: (a) No Coordination; (b) VPP with default load profile; (c) VPP with three load profiles at zero cost.
5.3. Effects of Non-Zero Cost on Demand Profile Choice
This section analyzes a solution to the benefits for demand owners. The default load profile has zero cost because the demand owner follows it irrespective of other events. The load owner then decides the price to be received for other profiles (i.e., price for offering flexibility). The VPP manager, then, studies the profitability of such price. The VPP thereafter decides whether to accept or refuse the demand owners’ offer(s) such that the VPP’s benefits are not eroded.
In Table 2, the optimal choices of demand profiles for profitable VPP operations are shown. The options marked optimal are obtained when for every profile (base-case, early, and late peak) is set to zero. Industrial and residential loads have the early peak and late peak as optimal profiles, respectively. In order to determine the costs before the selection of the base-case, for other demand profiles are increased gradually (and at the same time for all demands). It was observed that the VPP manager is only willing to pay up to €320/day to the industrial load owner. On the condition that the industrial load owner sets a price of €325/day, the VPP would have opted for the default load as the optimal instead. In this specific case, the industrial late peak and the residential early peak profiles are not profitable at all for the VPP and therefore marked ✘. In other circumstances with different price evolution and other demand profiles, the choices might be different.
Table 2.
Demand profile choice at non-zero costs.
In the case of the airport load, there are more options for both the airport demand owner and the VPP manager. The early peak profile is profitable for the VPP manager at a cost up until €500/day while the late peak profile is only profitable until €305/day. Figure 5 reveals that the different airport profiles have only subtle differences. We can infer that the load profiles have a benefit-inducing relationship with the evolution of the market price, hence the higher prices the VPP is willing to pay. Indeed, the profile peaks at the early hours (periods 8–10) correspond to lower electricity prices and thus account for the higher costs that the VPP is prepared to pay.
5.4. Distribution of Profits among Assets
In this final subsection, profit distribution among the coordinated VPP assets are investigated and compared with the base-case. As shown in Figure 7, there is a and increase in benefits for vpp over the base-case on a clear and cloudy day, respectively. For the ND-RESs, the only factor determining their output is the availability of the driving resource (wind for WPP and sunlight for solar PV). Thus, their outputs were the same for the base-case and VPP scenarios. For demands, although the overall consumption is the same for all profiles, the evolution of these profiles across the market/trading horizon is different. For the STU, results show substantially larger differences when it is part of a VPP compared to when acting alone in the base-case. Moreover, when the STU model with piece-wise linear efficiency was compared with average single value, the benefits of a more detailed model was observed. With different efficiency values across the STU output, there is more incentive for the STU to operate at higher capacity. Consequently, this leads to higher output at these operation periods and an overall increased benefit for the VPP.
For DAM participation and on a clear day, of the overall vpp profit over the base-case is attributed to the STU while the demands and D-RESs contributed the remainder of the profits. On a cloudy day, the VPP profits attributed to the STU was even more. In this case, of the total vpp profits. With single efficiency value model of the STU, this share dropped to of the total profits. The remainder was shared among the other assets in the vpp.
For IDM participation, the factors that play a bigger role in increasing VPP profits are updated prices, updated forecasts of ND-RESs generation, and demand response. Demand response activities by offering a finite percentage allowance on consumption during the IDM sessions contributed about a third of the VPP in this market. With sensitivity analysis, however, the share of the profits attributable to demands can be as high as as the flexibility allowance is increased. ND-RESs and the STU share the remainder of the VPP profits.
6. Conclusions
This paper presents a heterogeneous RES-based VPP that participates in DAM and IDM markets. Coupled with standard models of dispatchable resources, improved formulations of flexible demand and STU were introduced to describe the technical operation of the VPP units. A network constrained unit commitment model is thereafter utilized by the VPP to assess/simulate the optimal participation in energy markets in market activities. The case study applies the developed model to a VPP participating in the Spanish market; however, the model can be readily applied to any other market in which a sequence of DAM and IDMs is present.
In addition, the optimal participation of the VPP in the DAM and IDM were assessed under different weather conditions to analyze their impact and to to test the behavior of the VPP against highly or poorly favorable conditions. The following concluding remarks are drawn.
- The feasibility of RES-based VPP has been shown in this paper. From the purely economic perspective, BESSs can thus be excluded from RES-based VPPs when coupled with an appropriate operation model, thus avoiding the installation and operation costs of these devices. Additionally, this has to be accompanied with participation in markets that allow offer updates close to the energy delivery period;
- The VPP outperformed the case where the units are not coordinated by up to 20% during dam on cloudy days. This reveals one of the benefits of aggregation where the VPP, using the knowledge of every unit’s capability extends their operational flexibility. By doing so, the VPP’s overall profit is maximized;
- The profit distribution was shown to be impacted more by the STU in DAM participation. During IDM sessions, other units including the demand and ND-RESs play a bigger role by leveraging the flexibility provision of demands and updates of generation by the ND-RESs;
- The impact of the STU with its thermal storage was shown where the storage was charged at early periods while later discharging at higher capacity with higher efficiency. This led to higher profits of VPP over No Coordination in all conditions and especially during the cloudy days;
- The introduction of a more detailed STU model, while mirroring actual operation yielded an increased final objective value without leading to additional model complexity nor longer solver times;
- Flexible demands are advantageous in the provision of response/flexibility activities such as load shifting and deferring some energy volumes to other periods. Analysis of the results showed that VPPs incorporating flexible demand profiles with zero costs gave the most benefits compared to other configurations because the model selects the best profile that maximizes its profit;
- When the costs of demand profiles are non-zero, there are some thresholds that the VPP is willing to pay the demand owners until it becomes less profitable and they return to the default profile.
This work can be extended in several directions. These include co-optimizing the DAM planning with secondary reserve market bids. This could ensure that there is available tolerance during real-time operation. Application of the model to larger systems and considering AC power flow constraints will also be studied. In this work, the VPP has been formulated as a price taker. Modeling the VPP from the price maker perspective is an additional direction that warrants studying. Finally, modeling uncertainty in the power generation and price forecasts is another extension of this work, which is currently being investigated by the authors.
In this regard, it is noted that the main conclusions from this work will not be impacted hugely by applying stochastic or robust optimization to the base-case or VPP operation presented in this paper. The formulation of the operation of the different technologies will not be fundamentally changed by including parameter uncertainty. Of course, VPP outputs will vary from those shown in the paper, but not the qualitative conclusions. Those variations would arise from the different scenarios when applying for instance stochastic programming or from making the formulation robust to worst case scenarios when applying robust optimization.
Author Contributions
Conceptualization, O.O., Á.O. and L.S.; methodology, O.O., Á.O., P.S.-M.; software, O.O.; validation, Á.O., L.S., P.S.-M., E.L. and L.R.; data curation, O.O.; writing—original draft preparation, O.O. and Á.O.; writing—review and editing, Á.O., L.S., P.S.-M. and E.L.; supervision, Á.O. and L.S.; project administration, L.S.; funding acquisition, L.R. and L.S. All authors have read and agreed to the published version of the manuscript.
Funding
This work has received funding from the European Union’s Horizon 2020 research and innovation programme under grant agreement No 883985, from European Regional Development Fund (ERDF), Ministerio de Ciencia e Innovación—Agencia Estatal de Investigación, Project RTI2018-100965-A-I00, and from project MIG-20201002 funded by Centro para el Desarrollo Tecnológico Industrial (CDTI) and supported by Ministerio de Ciencia e Innovación.
Institutional Review Board Statement
Not applicable.
Informed Consent Statement
Not applicable.
Data Availability Statement
Not applicable.
Acknowledgments
The authors wish to thank Ione Lopez with Iberdrola, Spain, and the people with CIEMAT, Spain, especially Mario Biencinto and Loreto Valenzuela, that participated in the EU project POSYTYF, for the discussions on the modeling of solar thermal plants and flexible demands, and the provision of data used in the case study.
Conflicts of Interest
The authors declare no conflict of interest.
Nomenclature
The following abbreviations are used in this manuscript:
| DAM | Day-Ahead Market |
| IDM | Intra-Day Market |
| STU | Solar Thermal Unit |
| ESS | Energy Storage System |
| BESS | Battery Energy Storage System |
| RES | Renewable Energy Source |
| ND-RES | Non-Dispatchable Renewable Energy Source |
| D-RES | Dispatchable Renewable Energy Source |
| VPP | Virtual Power Plant |
| PV | photovoltaic |
| PHES | Pumped Hydro Energy Storage |
| DC-PF | DC Power Flow |
| PCC | Point of Common Coupling |
| CPP | Conventional Power Plant |
| Indexes and Sets | |
| Network Buses/Network buses Connected to Main Grid | |
| Dispatchable Renewable Energy Source (D-RES)/D-RES connected to bus b | |
| Demand/Demand connected to bus b | |
| Sending-/receiving-end bus of line ℓ | |
| Network lines/network lines connected to bus b | |
| IDM sessions | |
| Demand profiles for DAM auctions | |
| Non-Dispatchable Renewable Energy Source (ND-RES)/ND-RES connected | |
| to bus b | |
| Time periods | |
| Solar Thermal Unit (STU)/STU connected to bus b |
| Parameters | ||
| Shut-down/start-up cost of D-RESs | [] | |
| Variable production cost of D-RESs | [/MWh] | |
| Cost of load profile p of demand | [] | |
| Minimum energy consumption of demand d throughout the planning horizon | [MWh] | |
| Lower/upper bound of the energy stored in STU storage in time t | [MWh] | |
| STU output multiplier at startup | [−] | |
| Minimum/Maximum production capacity of STU | [MW] | |
| Lower/upper bound of discharging capacity of STU storage | [MW] | |
| Minimum/Maximum power production of D-RESs | [MW] | |
| Lower/upper bound of charging capacity of STU storage | [MW] | |
| Lower/upper bound of the power consumption of demand d in time t | [%] | |
| Minimum production of ND-RES in time t | [MW] | |
| Maximum hourly consumption of profile p of demand d | [MW] | |
| Available generation of STU in time t | [MW] | |
| Available generation of ND-RES in time t | [MW] | |
| Maximum power that can be traded with the main grid at bus b | [MW] | |
| Maximum power flow through line ℓ | [MW] |
| Down/up ramping limit of demand d | [MW/h] | |
| T | Last period of schedule | [−] |
| Reactance of network line ℓ | [pu] | |
| Lower/upper bound multiplier of STU storage at last period in schedule | [−] | |
| Duration of time periods | [h] | |
| Charging/discharging efficiency of STU storage | [%] | |
| Conversion between thermal and electrical power in the PB of STU in segment | [%] | |
| DAM price in time t | [/MWh] | |
| Price of IDM session k in time t | [/MWh] | |
| Variables | ||
| Energy stored in STU storage in time t | [MWh] | |
| Total power traded in the DAM in time t | [MW] | |
| Power flow through network of line ℓ in time t | [MW] | |
| Electrical power generation of STU in time t | [MW] | |
| Charging/discharging thermal power level of STU storage in time t | [MW] | |
| Thermal power delivered to the STU power block | [MW] | |
| Thermal power generated by the solar field | [MW] | |
| Power scheduled to be bought from/sold to the DAM and IDM markets at bus b in time t | [MW] | |
| Power generation of D-RESs in time t | [MW] | |
| Power consumption of demand in time t | [MW] | |
| Total power traded in IDM session k in time t | [MW] | |
| Power generation of ND-RES in time t | [MW] | |
| Binary variable to control STU PB operation | [] | |
| Binary variable to control STU storage charging | [] | |
| Binary variable to select demand profile | [] | |
| Binary variable to control startup of STU PB | [] | |
| Change in energy offers by D-RES c between market windows in time t | [MWh] | |
| Voltage angle at bus b in time t | [rad] |
References
- Pinson, P.; Mitridati, L.; Ordoudis, C.; Østergaard, J. Towards fully renewable energy systems: Experience and trends in Denmark. CSEE J. Power Energy Syst. 2017, 3, 26–35. [Google Scholar] [CrossRef]
- Koraki, D.; Strunz, K. Wind and solar power integration in electricity markets and distribution networks through service-centric virtual power plants. IEEE Trans. Power Syst. 2017, 33, 473–485. [Google Scholar] [CrossRef]
- Domínguez, R.; Conejo, A.; Carrión, M. Operation of a fully renewable electric energy system with CSP plants. Appl. Energy 2014, 119, 417–430. [Google Scholar] [CrossRef]
- Mousavi, M.; Rayati, M.; Ranjbar, A.M. Optimal operation of a virtual power plant in frequency constrained electricity market. IET Gener. Transm. Distrib. 2019, 13, 2015–2023. [Google Scholar] [CrossRef]
- Pandžić, H.; Kuzle, I.; Capuder, T. Virtual power plant mid-term dispatch optimization. Appl. Energy 2013, 101, 134–141. [Google Scholar] [CrossRef]
- PandŽić, H.; Morales, J.M.; Conejo, A.J.; Kuzle, I. Offering model for a virtual power plant based on stochastic programming. Appl. Energy 2013, 105, 282–292. [Google Scholar] [CrossRef]
- Giunpandzitoli, M.; Poli, D. Optimized thermal and electrical scheduling of a large scale virtual power plant in the presence of energy storages. IEEE Trans. Smart Grid 2013, 4, 942–955. [Google Scholar]
- Shabanzadeh, M.; Sheikh-El-Eslami, M.K.; Haghifam, M.R. A medium-term coalition-forming model of heterogeneous DERs for a commercial virtual power plant. Appl. Energy 2016, 169, 663–681. [Google Scholar] [CrossRef]
- Yang, D.; He, S.; Wang, M.; Pandžić, H. Bidding strategy for virtual power plant considering the large-scale integrations of electric vehicles. IEEE Trans. Ind. Appl. 2020, 56, 5890–5900. [Google Scholar] [CrossRef]
- Liu, Z.; Zheng, W.; Qi, F.; Wang, L.; Zou, B.; Wen, F.; Xue, Y. Optimal dispatch of a virtual power plant considering demand response and carbon trading. Energies 2018, 11, 1488. [Google Scholar] [CrossRef] [Green Version]
- Naval, N.; Sánchez, R.; Yusta, J.M. A virtual power plant optimal dispatch model with large and small-scale distributed renewable generation. Renew. Energy 2020, 151, 57–69. [Google Scholar] [CrossRef]
- Khalid, M.; AlMuhaini, M.; Aguilera, R.P.; Savkin, A.V. Method for planning a wind–solar–battery hybrid power plant with optimal generation-demand matching. IET Renew. Power Gener. 2018, 12, 1800–1806. [Google Scholar] [CrossRef] [Green Version]
- Ye, L.; Zhao, L.; Dong, S.; Chen, S. Dispatch in electric vehicles embedded Virtual Power Plant considering safety constraints. In Proceedings of the 2019 IEEE 3rd International Conference on Circuits, Systems and Devices (ICCSD), Chengdu, China, 23—25 August 2019; pp. 143–147. [Google Scholar]
- Alahyari, A.; Ehsan, M.; Mousavizadeh, M. A hybrid storage-wind Virtual Power Plant participation in the electricity markets: A self-scheduling optimization considering price, renewable generation, and electric vehicles uncertainties. J. Energy Storage 2019, 25, 100812. [Google Scholar] [CrossRef]
- Rahimiyan, M.; Baringo, L. Strategic bidding for a virtual power plant in the day-ahead and real-time markets: A price-taker robust optimization approach. IEEE Trans. Power Syst. 2016, 31, 2676–2687. [Google Scholar] [CrossRef]
- Vasirani, M.; Kota, R.; Cavalcante, R.L.; Ossowski, S.; Jennings, N.R. An agent-based approach to virtual power plants of wind power generators and electric vehicles. IEEE Trans. Smart Grid 2013, 4, 1314–1322. [Google Scholar] [CrossRef] [Green Version]
- Ding, H.; Hu, Z.; Song, Y. Rolling optimization of wind farm and energy storage system in electricity markets. IEEE Trans. Power Syst. 2014, 30, 2676–2684. [Google Scholar] [CrossRef]
- Dabbagh, S.R.; Sheikh-El-Eslami, M.K. Risk assessment of virtual power plants offering in energy and reserve markets. IEEE Trans. Power Syst. 2015, 31, 3572–3582. [Google Scholar] [CrossRef]
- Sioshansi, R.; Denholm, P. The value of concentrating solar power and thermal energy storage. IEEE Trans. Sustain. Energy 2010, 1, 173–183. [Google Scholar] [CrossRef] [Green Version]
- He, G.; Chen, Q.; Kang, C.; Xia, Q. Optimal offering strategy for CSPs in joint energy, reserve and regulation markets. IEEE Trans. Sustain. Energy 2016, 7, 1245–1254. [Google Scholar] [CrossRef]
- Rohani, S.; Fluri, T.; Dinter, F.; Nitz, P. Modelling and simulation of parabolic trough plants based on real operating data. Sol. Energy 2017, 158, 845–860. [Google Scholar] [CrossRef]
- De La Nieta, A.A.S.; Gibescu, M.; Wang, X.; Song, M.; Jensen, E.; Saleem, A.; Bremdal, B.; Ilieva, I. Local economic dispatch with local renewable generation and flexible load management. In Proceedings of the 2018 International Conference on Smart Energy Systems and Technologies (SEST), Seville, Spain, 10–12 September 2018; pp. 1–6. [Google Scholar]
- Herter, K. Residential implementation of critical-peak pricing of electricity. Energy Policy 2007, 35, 2121–2130. [Google Scholar] [CrossRef] [Green Version]
- Hungerford, Z.; Bruce, A.; MacGill, I. The value of flexible load in power systems with high renewable energy penetration. Energy 2019, 188, 115960. [Google Scholar] [CrossRef]
- Ciarreta, A.; Gutiérrez-Hita, C.; Nasirov, S. Renewable energy sources in the Spanish electricity market: Instruments and effects. Renew. Sustain. Energy Rev. 2011, 15, 2510–2519. [Google Scholar] [CrossRef]
- Operador del Mercado Ibérico de Energía. Available online: https://www.omie.es/en/ (accessed on 11 May 2021).
- Red Eléctrica de España (REE). Available online: https://www.ree.es/en/ (accessed on 11 May 2021).
- Chaves-Ávila, J.P.; Fernandes, C. The Spanish intraday market design: A successful solution to balance renewable generation? Renew. Energy 2015, 74, 422–432. [Google Scholar] [CrossRef]
- Marinescu, B.; Gomis-Bellmunt, O.; Dörfler, F.; Schulte, H.; Sigrist, L. Dynamic virtual power plant: A new concept for grid integration of renewable energy sources. arXiv 2021, arXiv:2108.00153. [Google Scholar]
- Baringo, L.; Rahimiyan, M. Virtual Power Plants and Electricity Markets, 1st ed.; Springer: Cham, Switzerland, 2020. [Google Scholar]
- Kargarian, A.; Mohammadi, J.; Guo, J.; Chakrabarti, S.; Barati, M.; Hug, G.; Kar, S.; Baldick, R. Toward distributed/decentralized DC optimal power flow implementation in future electric power systems. IEEE Trans. Smart Grid 2016, 9, 2574–2594. [Google Scholar] [CrossRef]
- García, I.L.; Álvarez, J.L.; Blanco, D. Performance model for parabolic trough STU with thermal storage: Comparison to operating plant data. Sol. Energy 2011, 85, 2443–2460. [Google Scholar] [CrossRef]
- Bisschop, J. AIMMS Optimization Modeling; Lulu. com: Haarlem, The Netherlands, 2006. [Google Scholar]
- Oladimeji, O.; Ortega, Á.; Sigrist, L.; Sanchez-Martin, P.; Lobato, E.; Rouco, L. Modeling demand flexibility of RES-based virtual power plants. arXiv 2021, arXiv:2112.03261. [Google Scholar]
Publisher’s Note: MDPI stays neutral with regard to jurisdictional claims in published maps and institutional affiliations. |
© 2022 by the authors. Licensee MDPI, Basel, Switzerland. This article is an open access article distributed under the terms and conditions of the Creative Commons Attribution (CC BY) license (https://creativecommons.org/licenses/by/4.0/).