
A Semantically Data-Driven Classification Framework for Energy Consumption in Buildings


Abstract
:1. Introduction
- thermal comfort,
- adequate light levels, and
- air quality,
- the amount of gas used by boilers,
- the amount of electricity used for lighting, and
- the amount of electricity used for mechanical ventilation systems.
- limitation of environmental impact,
- becoming more self-sufficient, and
- awakening the inhabitants’ awareness in terms of energy consumption.
- Is there a correlation between building data and energy performance rating?
- Based on the available data, is it possible to predict a rating for an unknown, not yet rated dwelling?
- In Section 2, the available standards, tools, and frameworks on the energy performance of buildings are reviewed comprehensively.
- Section 3 lays the groundwork for the research problem—if energy performance ratings are directly correlated to the energy consumption data and if the floor size and energy consumption values are enough to determine a dwellings’ energy performance rating. This follows the proposal of a data-driven kNN classification-based prediction tool for energy performance labels.
- In Section 4, an approach to semantic annotations for energy performance certification data with currently available ontologies is offered.
- In Section 5, results of proposed approach are presented emphasizing data analysis and prediction metrics.
- In Section 6, conclusions are made based on observations and future scope is provided for research community to follow.
2. Background and Related Work
2.1. Ontology and IoT
2.2. Frameworks
2.2.1. Smart Readiness Indicator
- saving capabilities (for instance—better control of room temperature settings),
- flexibility towards the energy grid,
- self-generation of energy,
- occupant’s comfort (thermal, acoustic, visual),
- convenience (e.g., less manual settings needed to be done by users),
- a healthy indoor climate,
- maintenance and fault detection, and
- user-friendly feedback to occupants.
2.2.2. Integration Framework for Smart Homes
- The Meter Data Ontology facilitates communication protocols for data exchange with the metering equipment.
- The Automation Ontology comprises general concepts such as Resident and Location, but also concepts in the automation and the energy domain, such as Device (with consumption per hour, power on-of status, peak power), and Configuration (of appliances).
- The Pricing Ontology facilitates the optimal tariff model for a specified time and energy load by providing a weighted criteria which can then be used by the reasoning engine for choosing the best tariff model.
2.2.3. Energy Consumption Awareness Framework
2.2.4. Energy Consumption Prediction Framework
2.3. Tools
2.3.1. Building Energy Simulation Software
2.3.2. Building Certification Software
2.3.3. Building Management Systems
- the amount of generated CO2,
- the number of trees needed to absorb the generated CO2,
- the amount of money spent, and
- comparison to other users of the game.
2.3.4. Energy Efficiency Testing Framework
2.3.5. Building Assessment Simulation Software
- How is the model created?
- What is the level of dynamism of the model?
- What is the complexity of the model?
- environmental: climate variability;
- quality of building materials and the quality of finishes; and
- occupancy dynamics: windows openings, the use of appliances, heating and cooling preferences or occupancy.
2.3.6. Collaboration on Energy Performance
2.4. Semantic Models
- Clauses that test for features of a single object and
- Clauses that test for topological relationships between pairs of objects.
- (1)
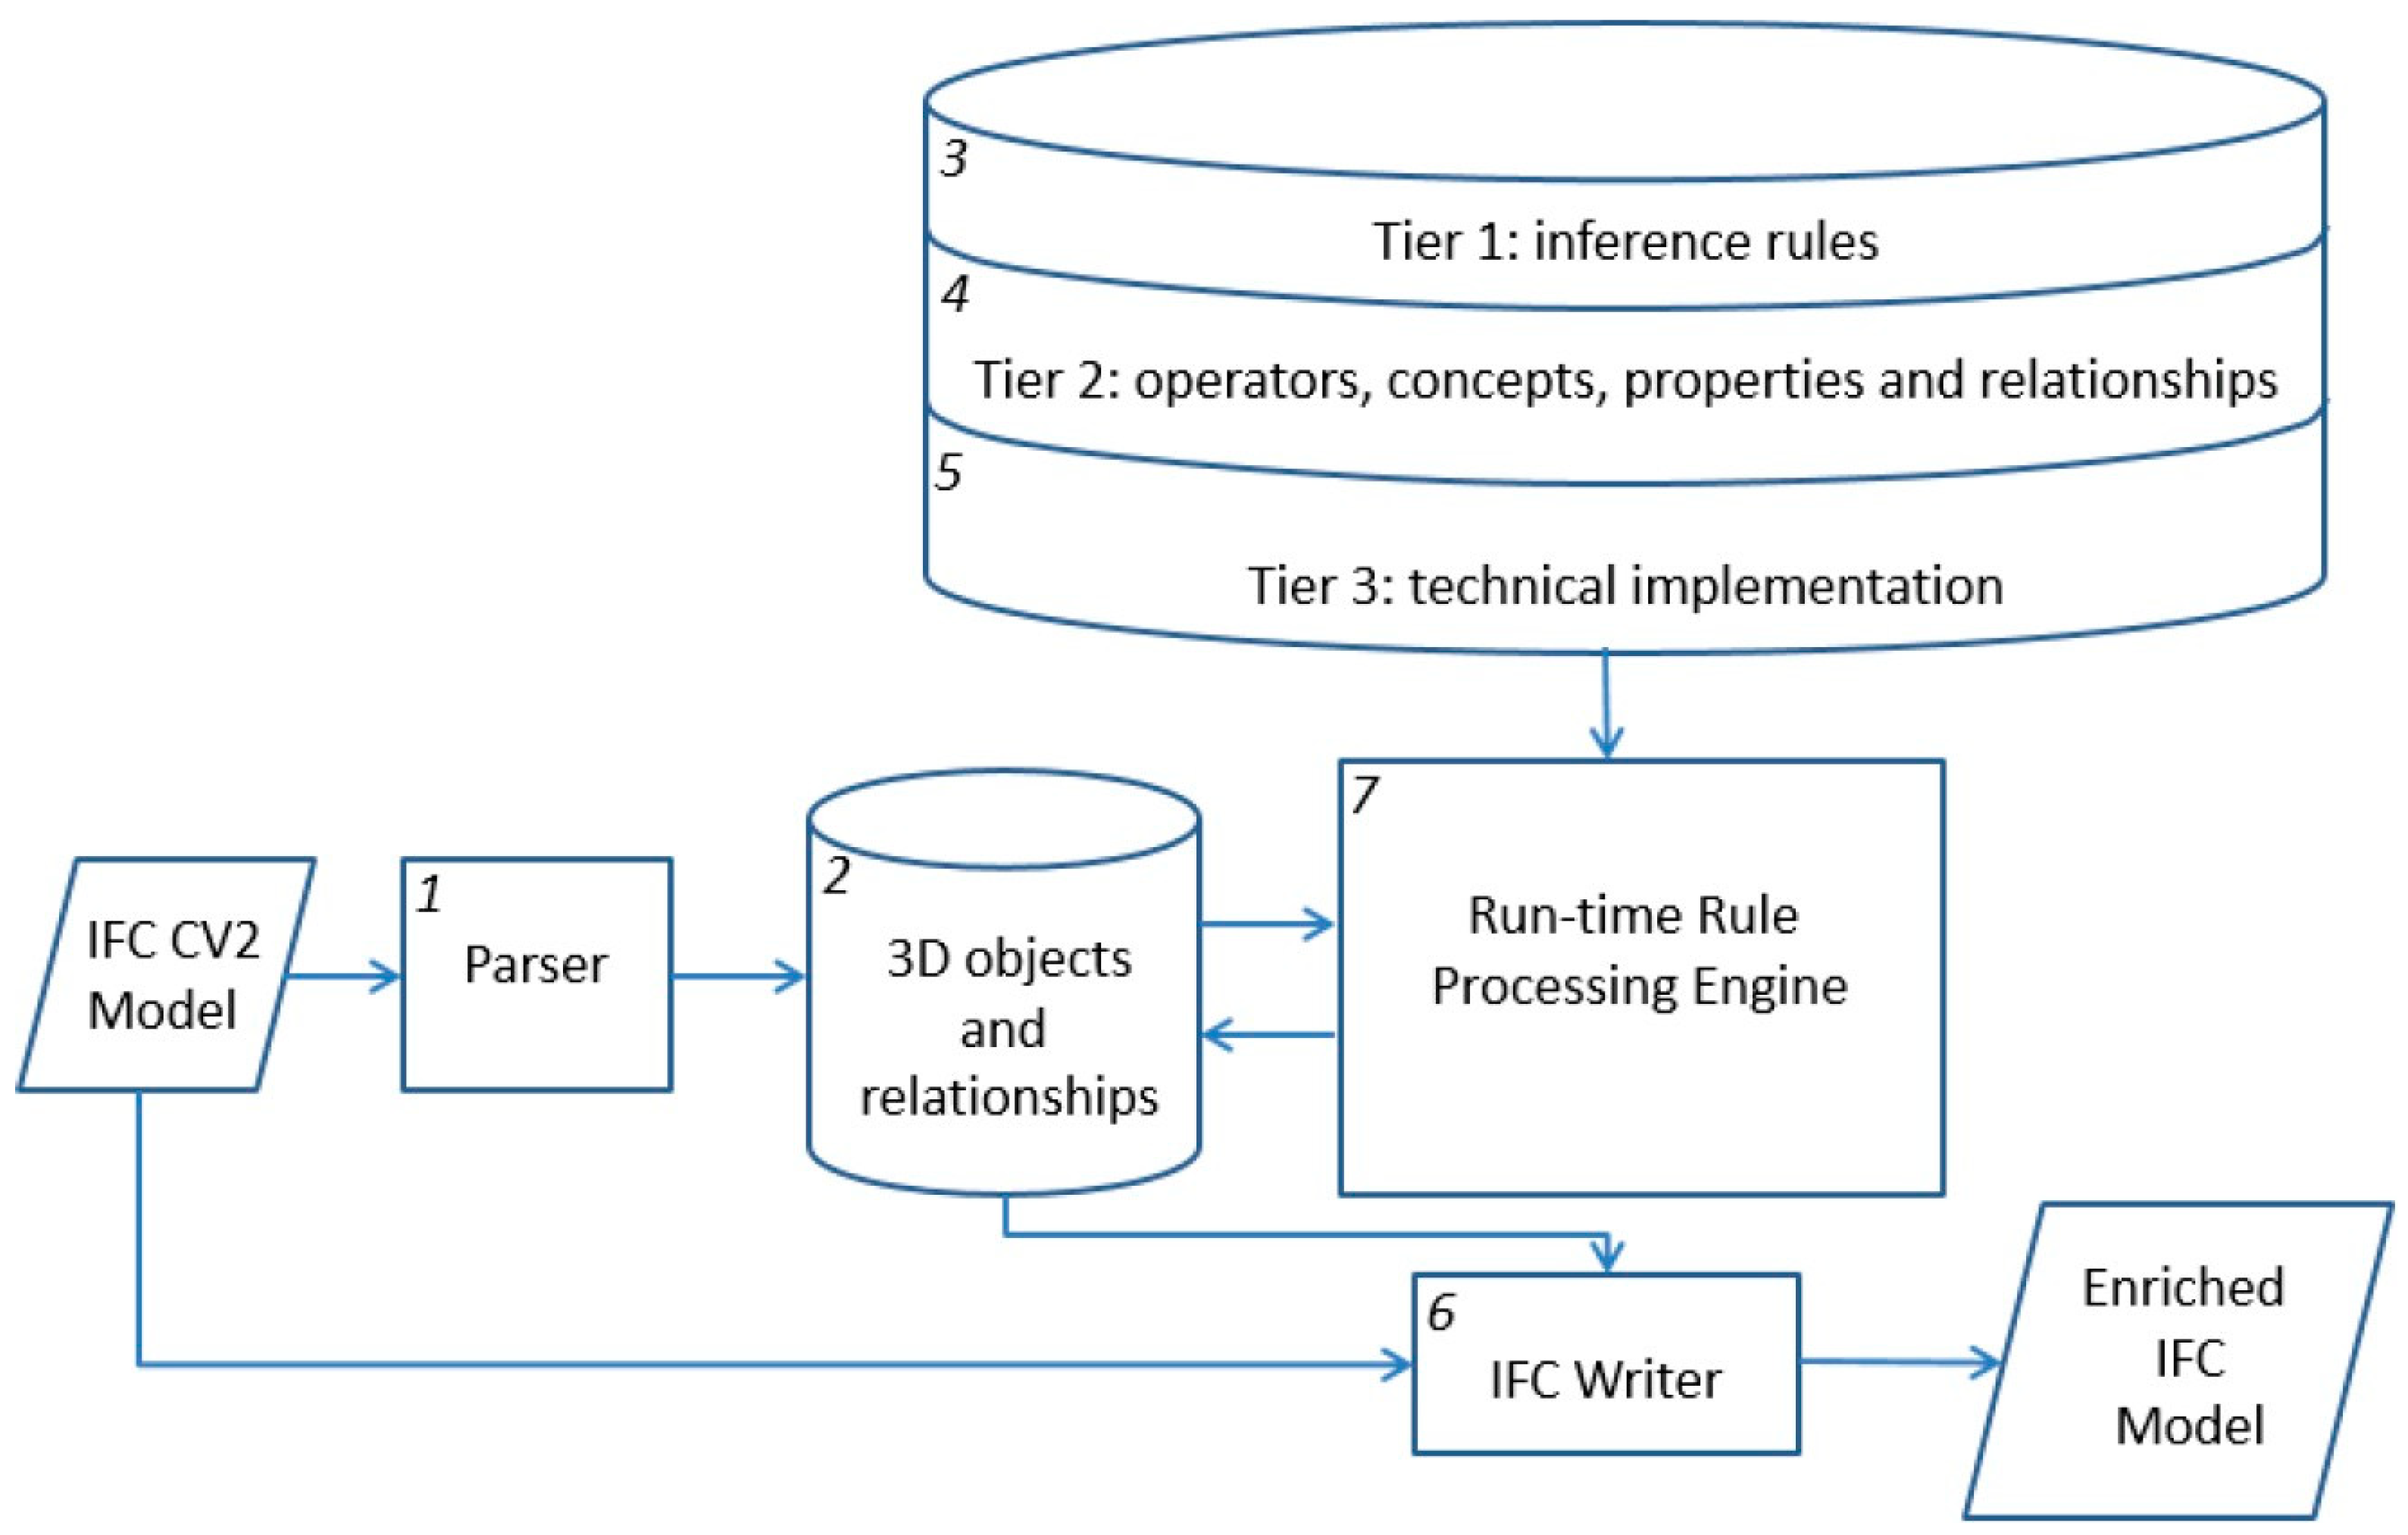
- a parser, which reads IFC model instance files exported from BIM tools.
- (2)
- an internal run-time database that stores parsed objects, relationships, and their attribute values.
- (3)
- inference rules, which are edited by domain expert users and kept in a file storage system.
3. Methodology
| t = (floor_area, energy_consumption) |
| d(t): t → c |
| r(t): d(t) → c.label |
- the elbow method;
- the Silhouette Coefficient;
- the Calinski-Harabasz score.
- a: mean intra-cluster distance
- b: mean nearest cluster distance.
3.1. The Prediction Algorithm
- Feature scaling, where the data point values are transformed to the same value range. For this purpose, the StandardScaler is used, which subtracts the mean and scales it to unit variance, meaning it divides all values by the standard deviation.
- Splitting the data into training data (80%) and testing data (20%).
3.2. Semantic Annotation
- the schema.org vocabulary, and
- the PXL open standard.
4. Implementation
The Data Import
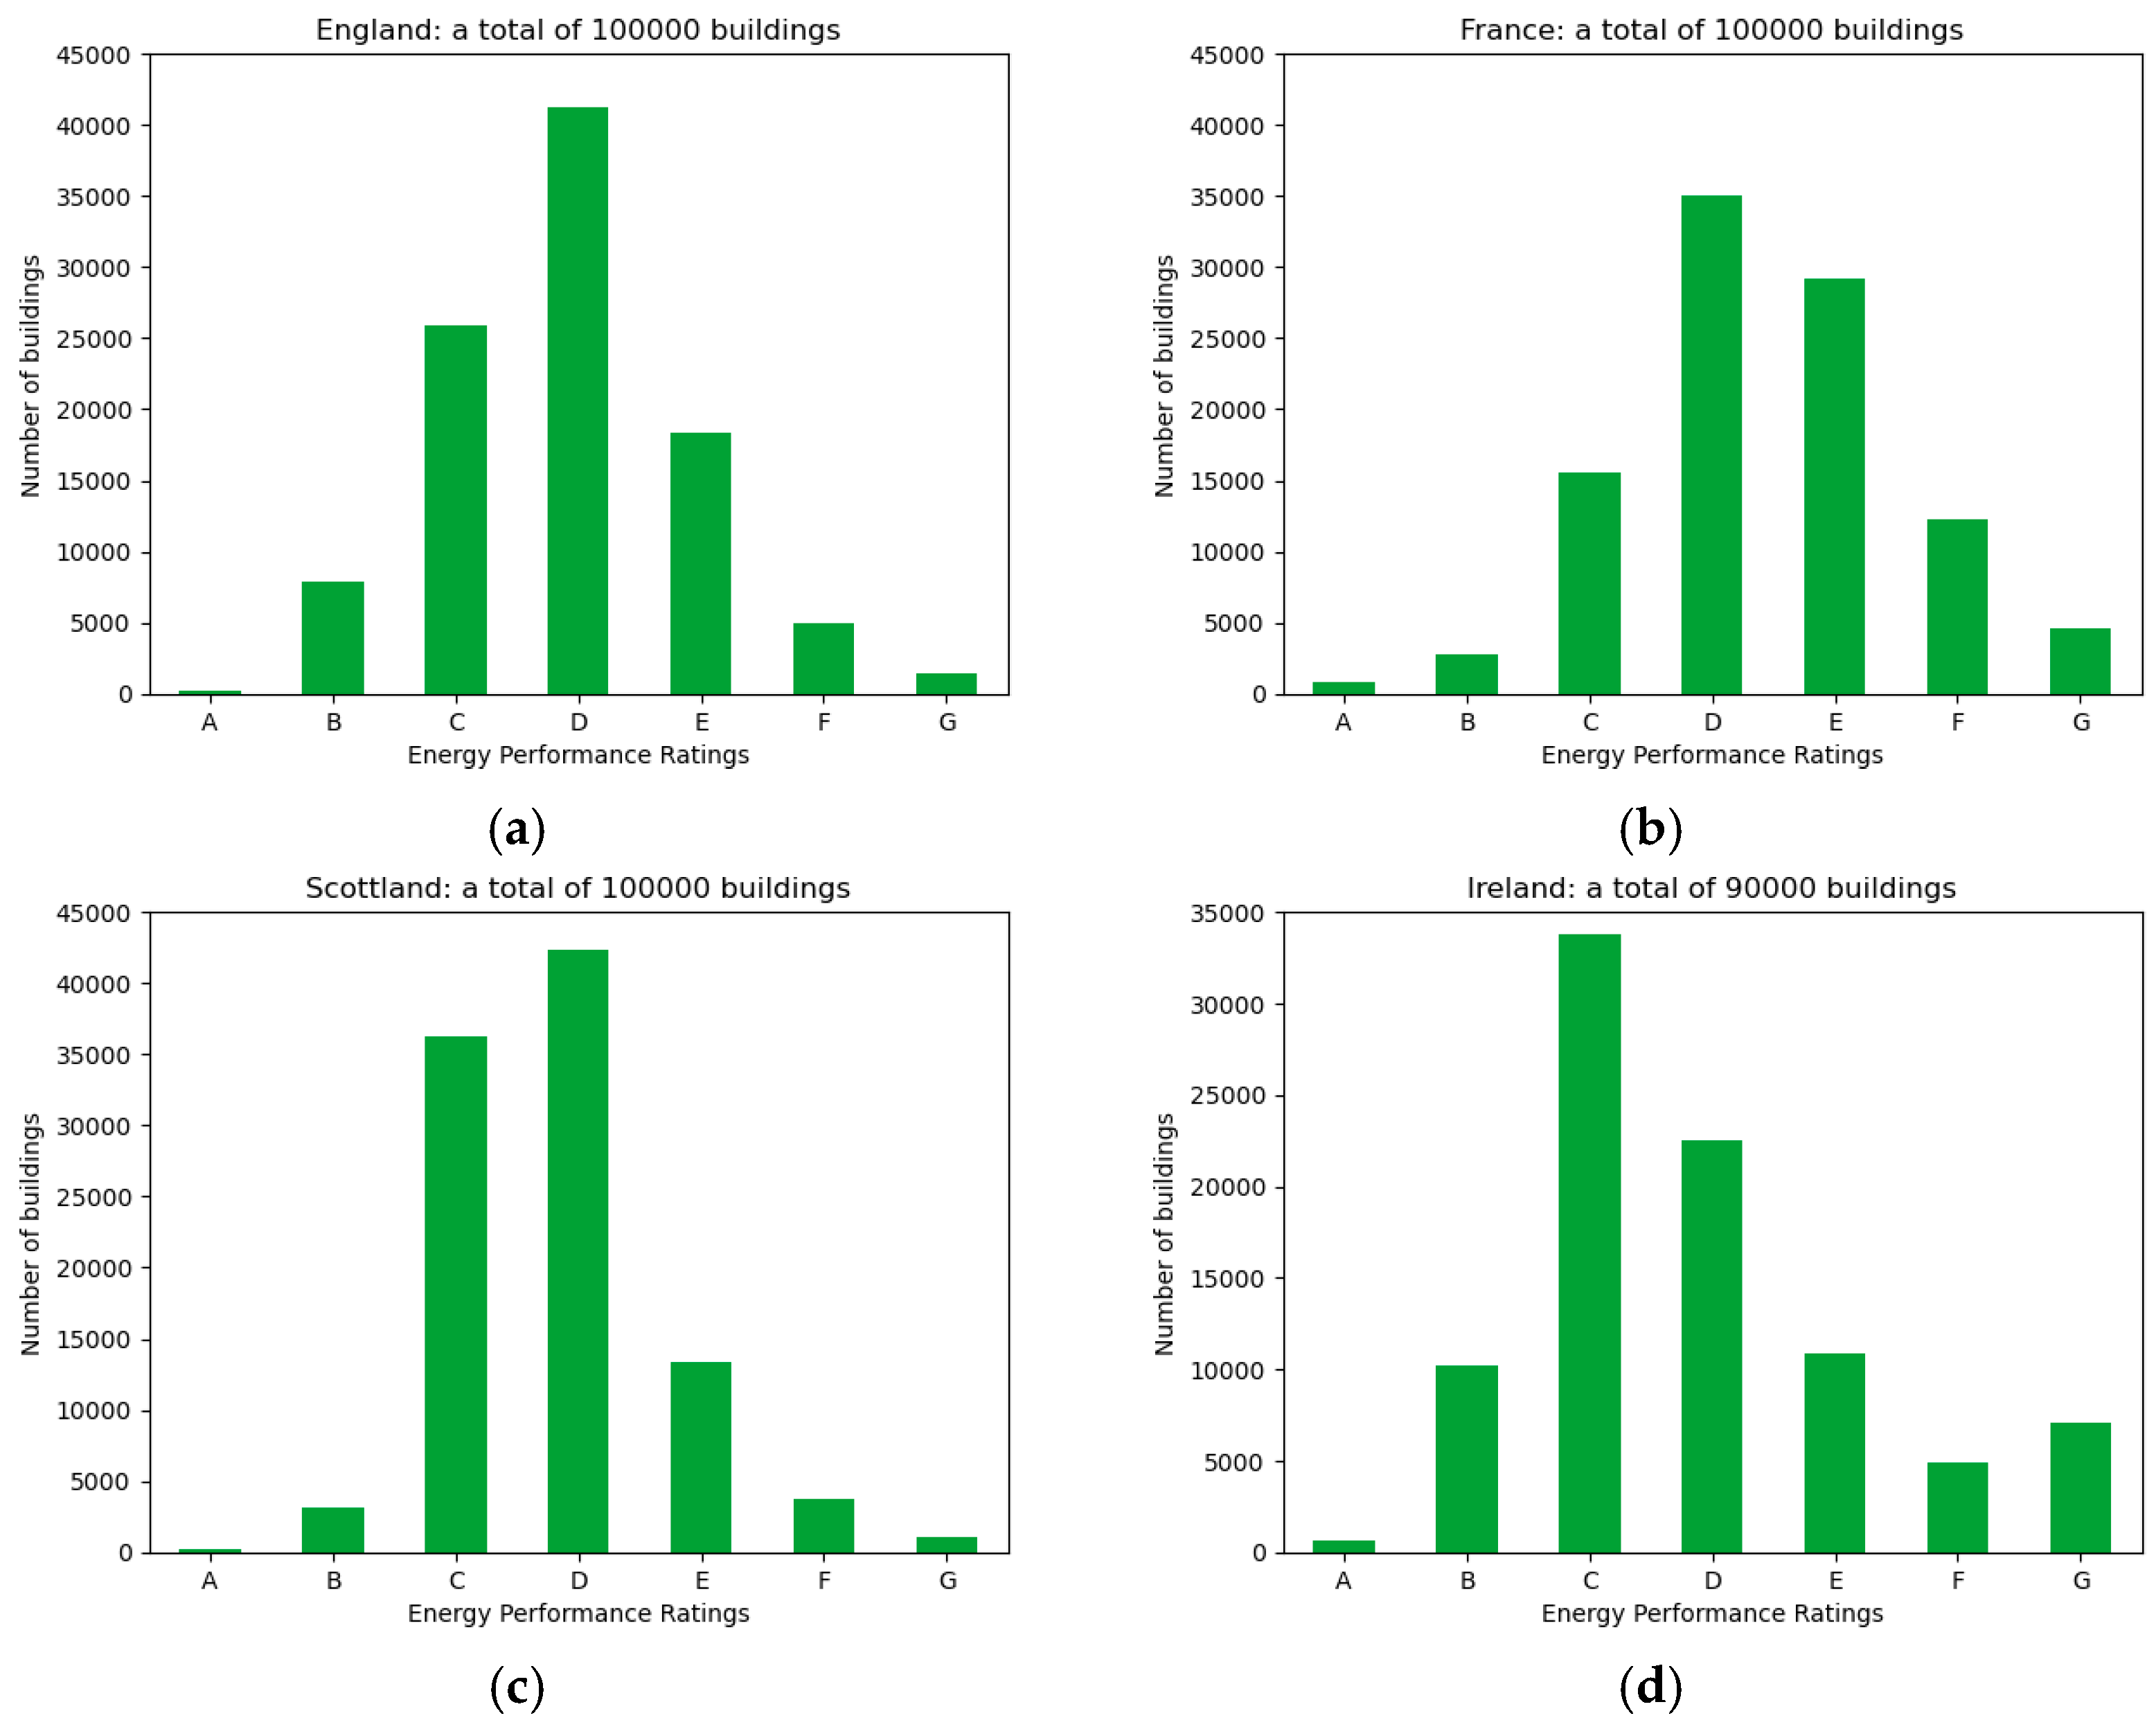
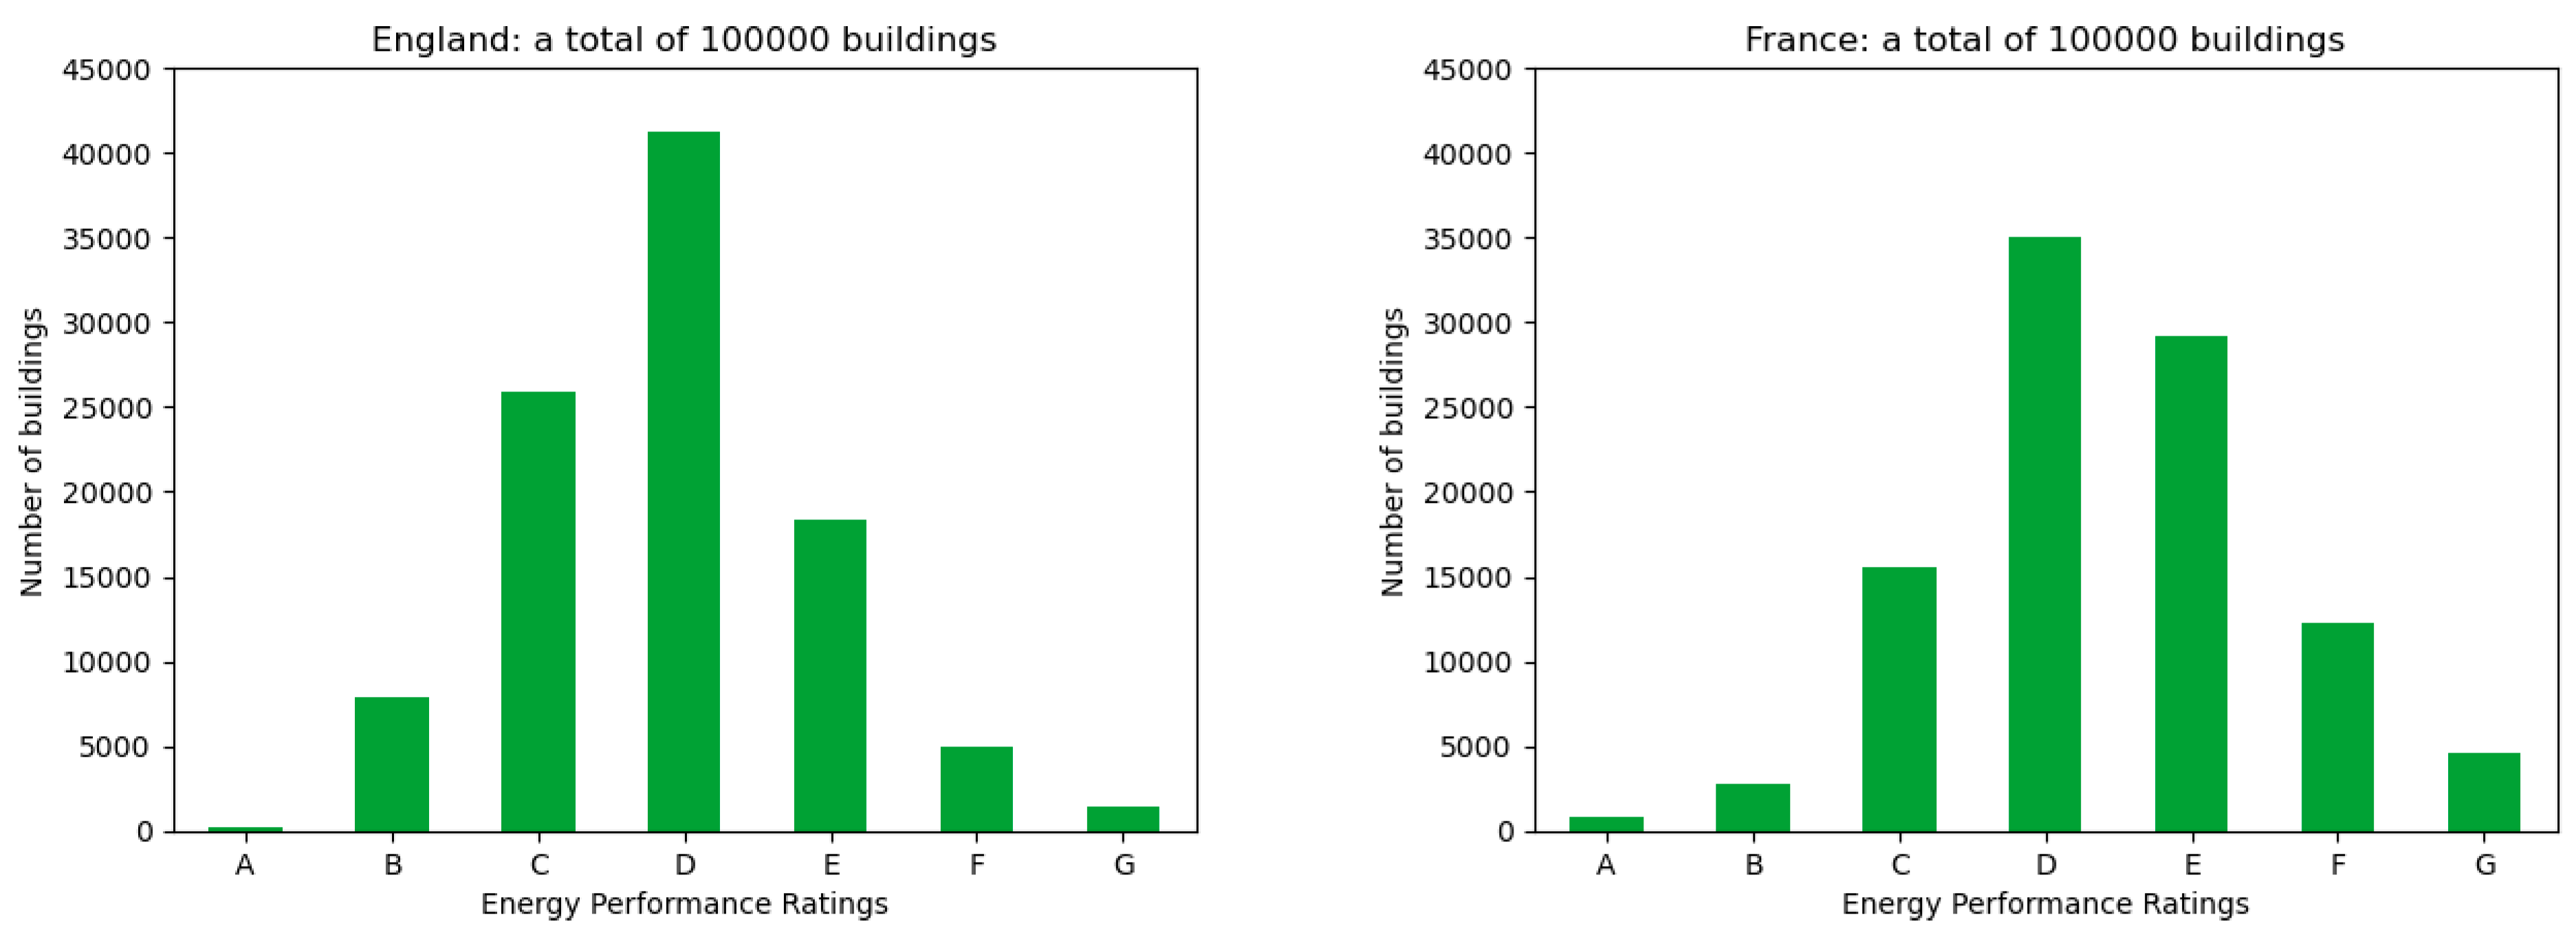
- England
- France
- Scotland
- Ireland
- Scotland: RdSAP
- Ireland: BER, Dwelling Energy Assessment Procedure (DEAP)
- England: 83
- France: 21
- Scotland: 49
- Ireland: 202
- The freely available storage on the MongoDB Cloud platform is finite (i.e., 512 MB); in the case of England, this resulted in fewer imported data entries (Table 1).
- The importer excluded dwellings with missing values for floor area, energy consumption, or EPC rating; this decreased the number of valid entries for France, Scotland, and Ireland.
- To achieve an evenly distributed dataset, sequentially every 3rd or every 10th valid entry (depending on the country) was imported (Table 2).
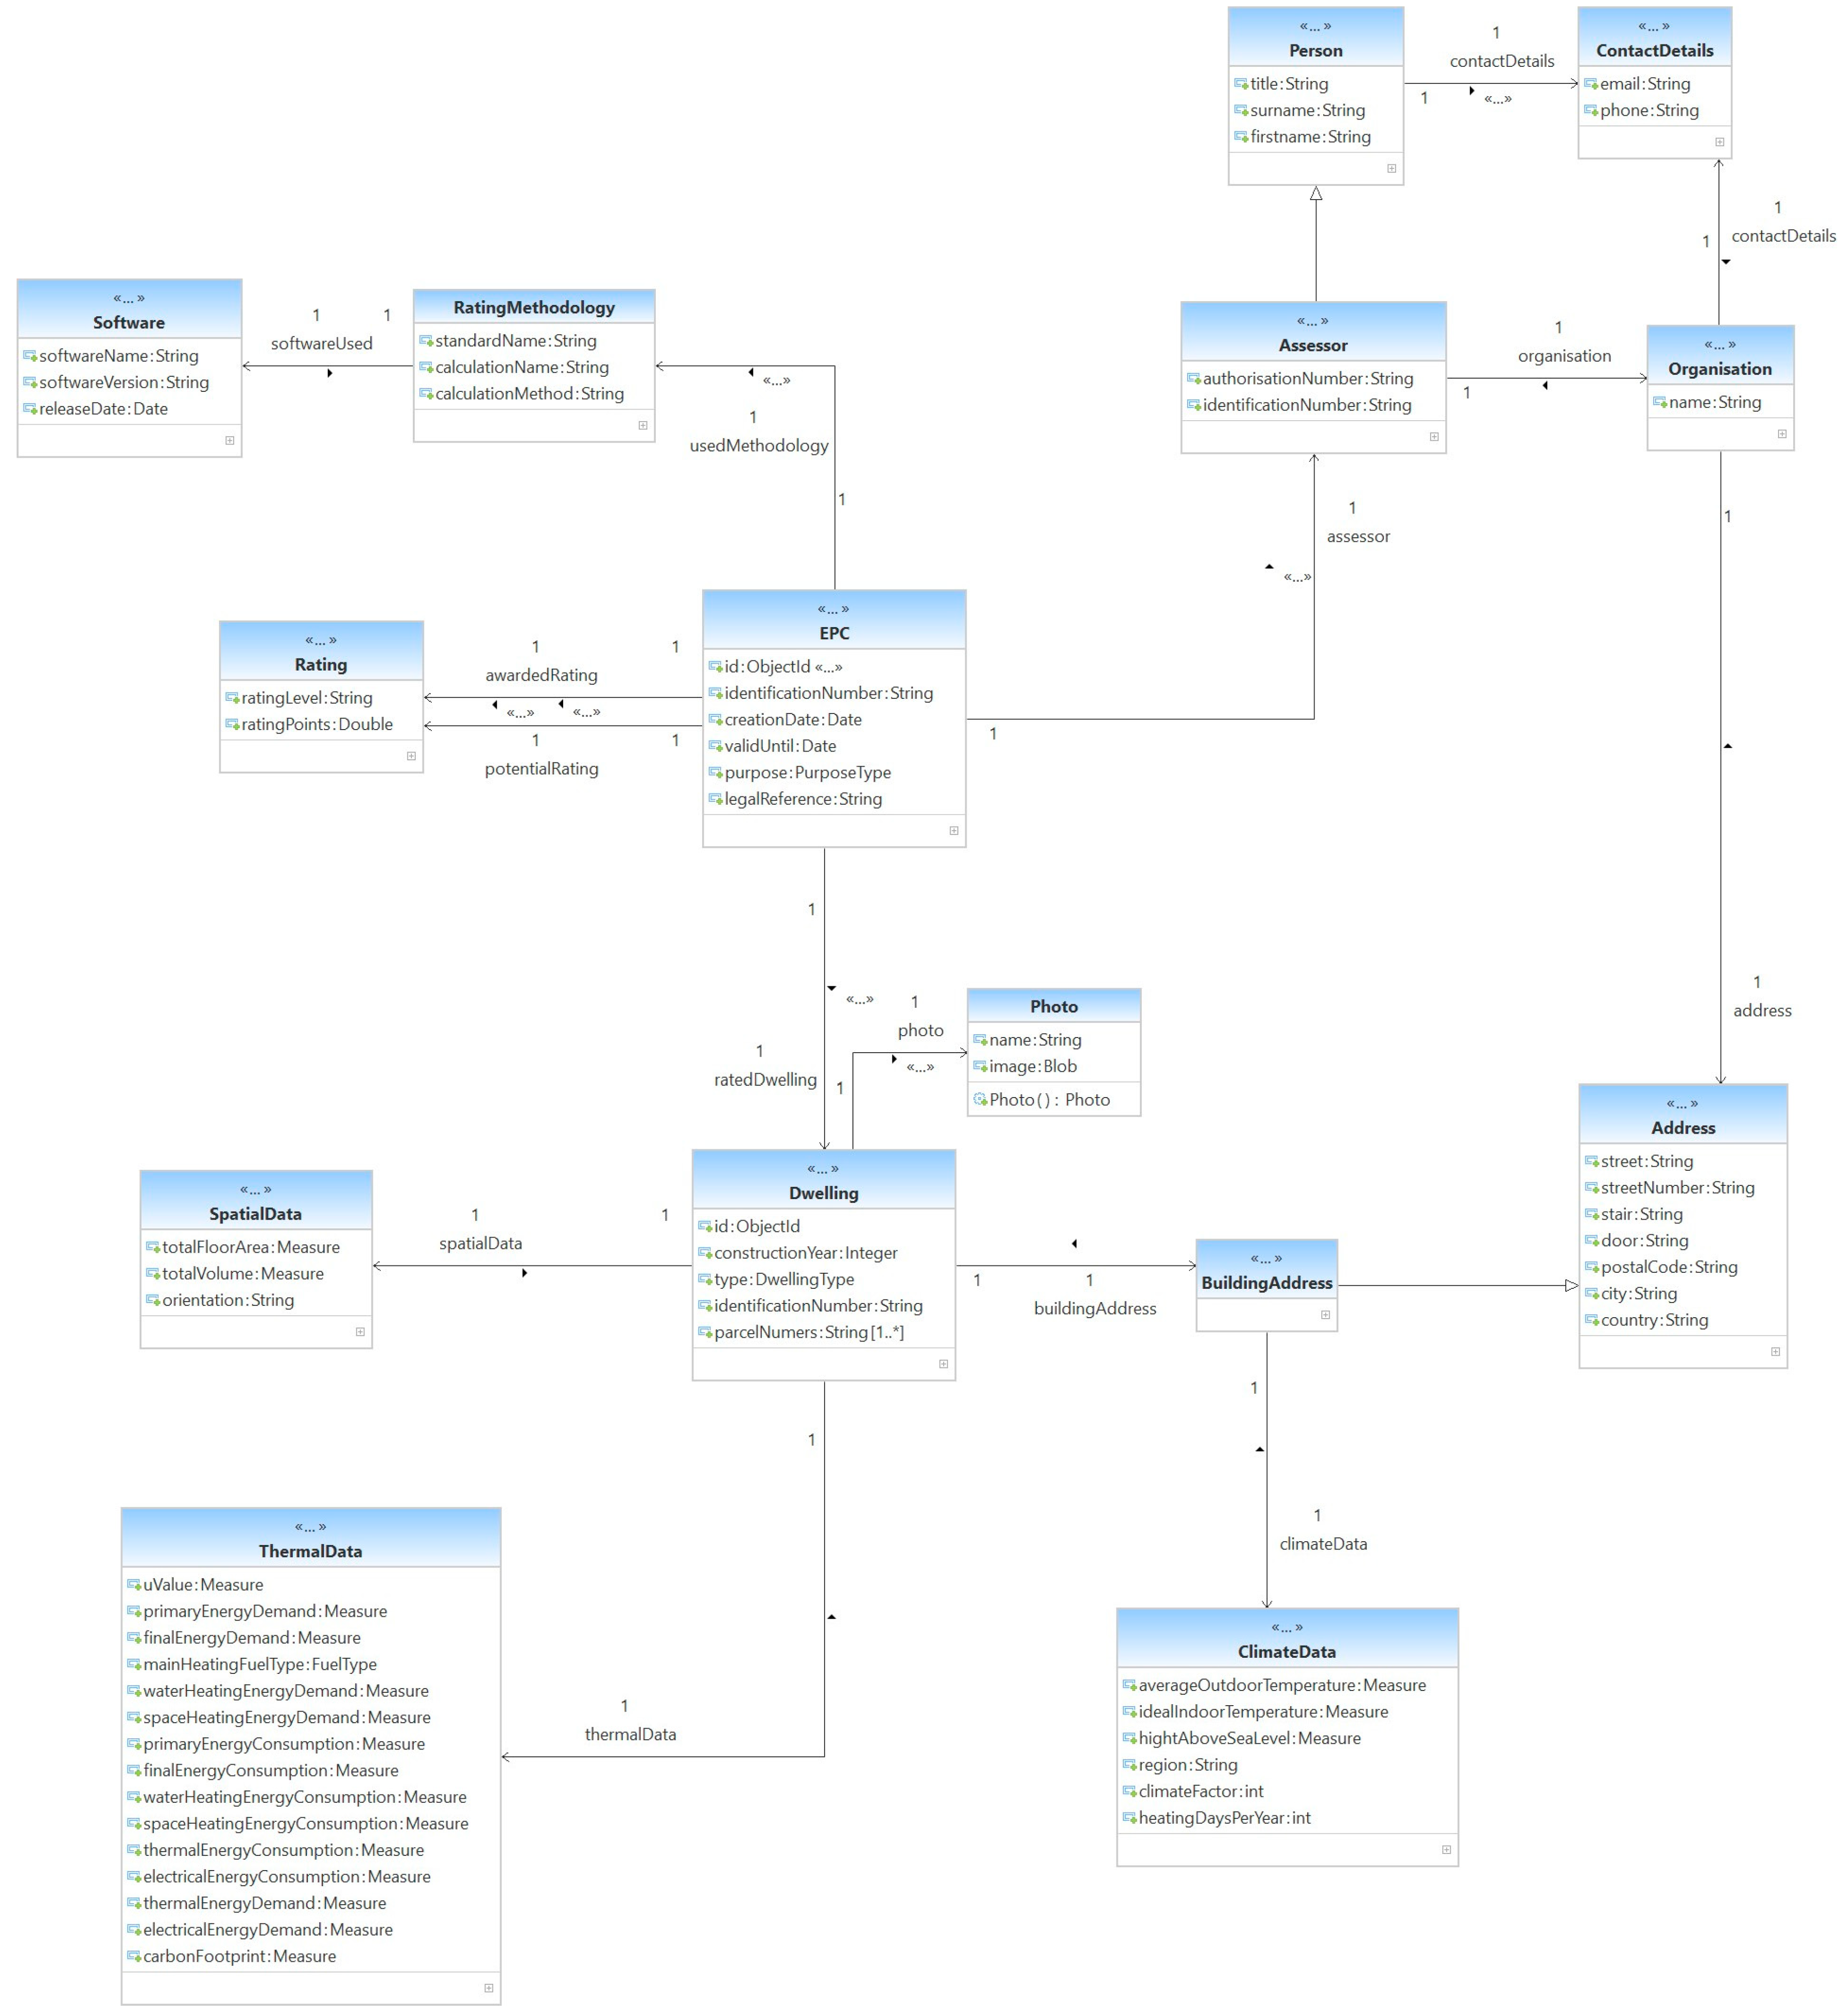
- Energy Performance Certificate—modelled as the top-level class i.e., EPC, contains information such as identification details and the certification’s validity. It is linked to all other subclasses that represent details about the dwelling, the issued rating level, or the issuing authority.
- Energy Performance Rating—modelled as three classes: Rating, Rating Methodology and Software. On some certificates (e.g., for Ireland), the rating comprises two values: the rating label and the corresponding rating points. Additionally, the details of the used rating methodology or software are available in the open data (for Ireland and Scotland). Our database contains rating labels for each dwelling since they are essential for this work.
- Issuing Authority—modelled as classes: Assessor, Organization, Person, and Contact Details. A certified assessor issues an energy performance certificate. The information about the assessor (identification, contact data, and affiliation) are mandatory on an energy performance certificate; however, this data is mostly closed data and is not available in our imported datasets.
- Dwelling—details about the rated dwelling such as identification, construction year, type (e.g., house, flat), address, photograph, etc. Some datasets (e.g., France) offer geographical and climate data; this is useful, e.g., for future use cases where solar energy can be of importance.
- Energy Consumption—modelled as class ThermalData. It comprises measured or predicted energy consumption data. Some open datasets offer measurements for general energy consumption, whereas other datasets offer differential data for water and space heating energy and even electrical energy. Additional details such as heating fuel type or carbon footprint can be used for future use cases.
- Floor Area—is part of the class SpatialData. For our purpose, the dwellings’ floor area is of importance; nevertheless, we also modelled data for volume space and geographical orientation since it can be useful for future use cases.
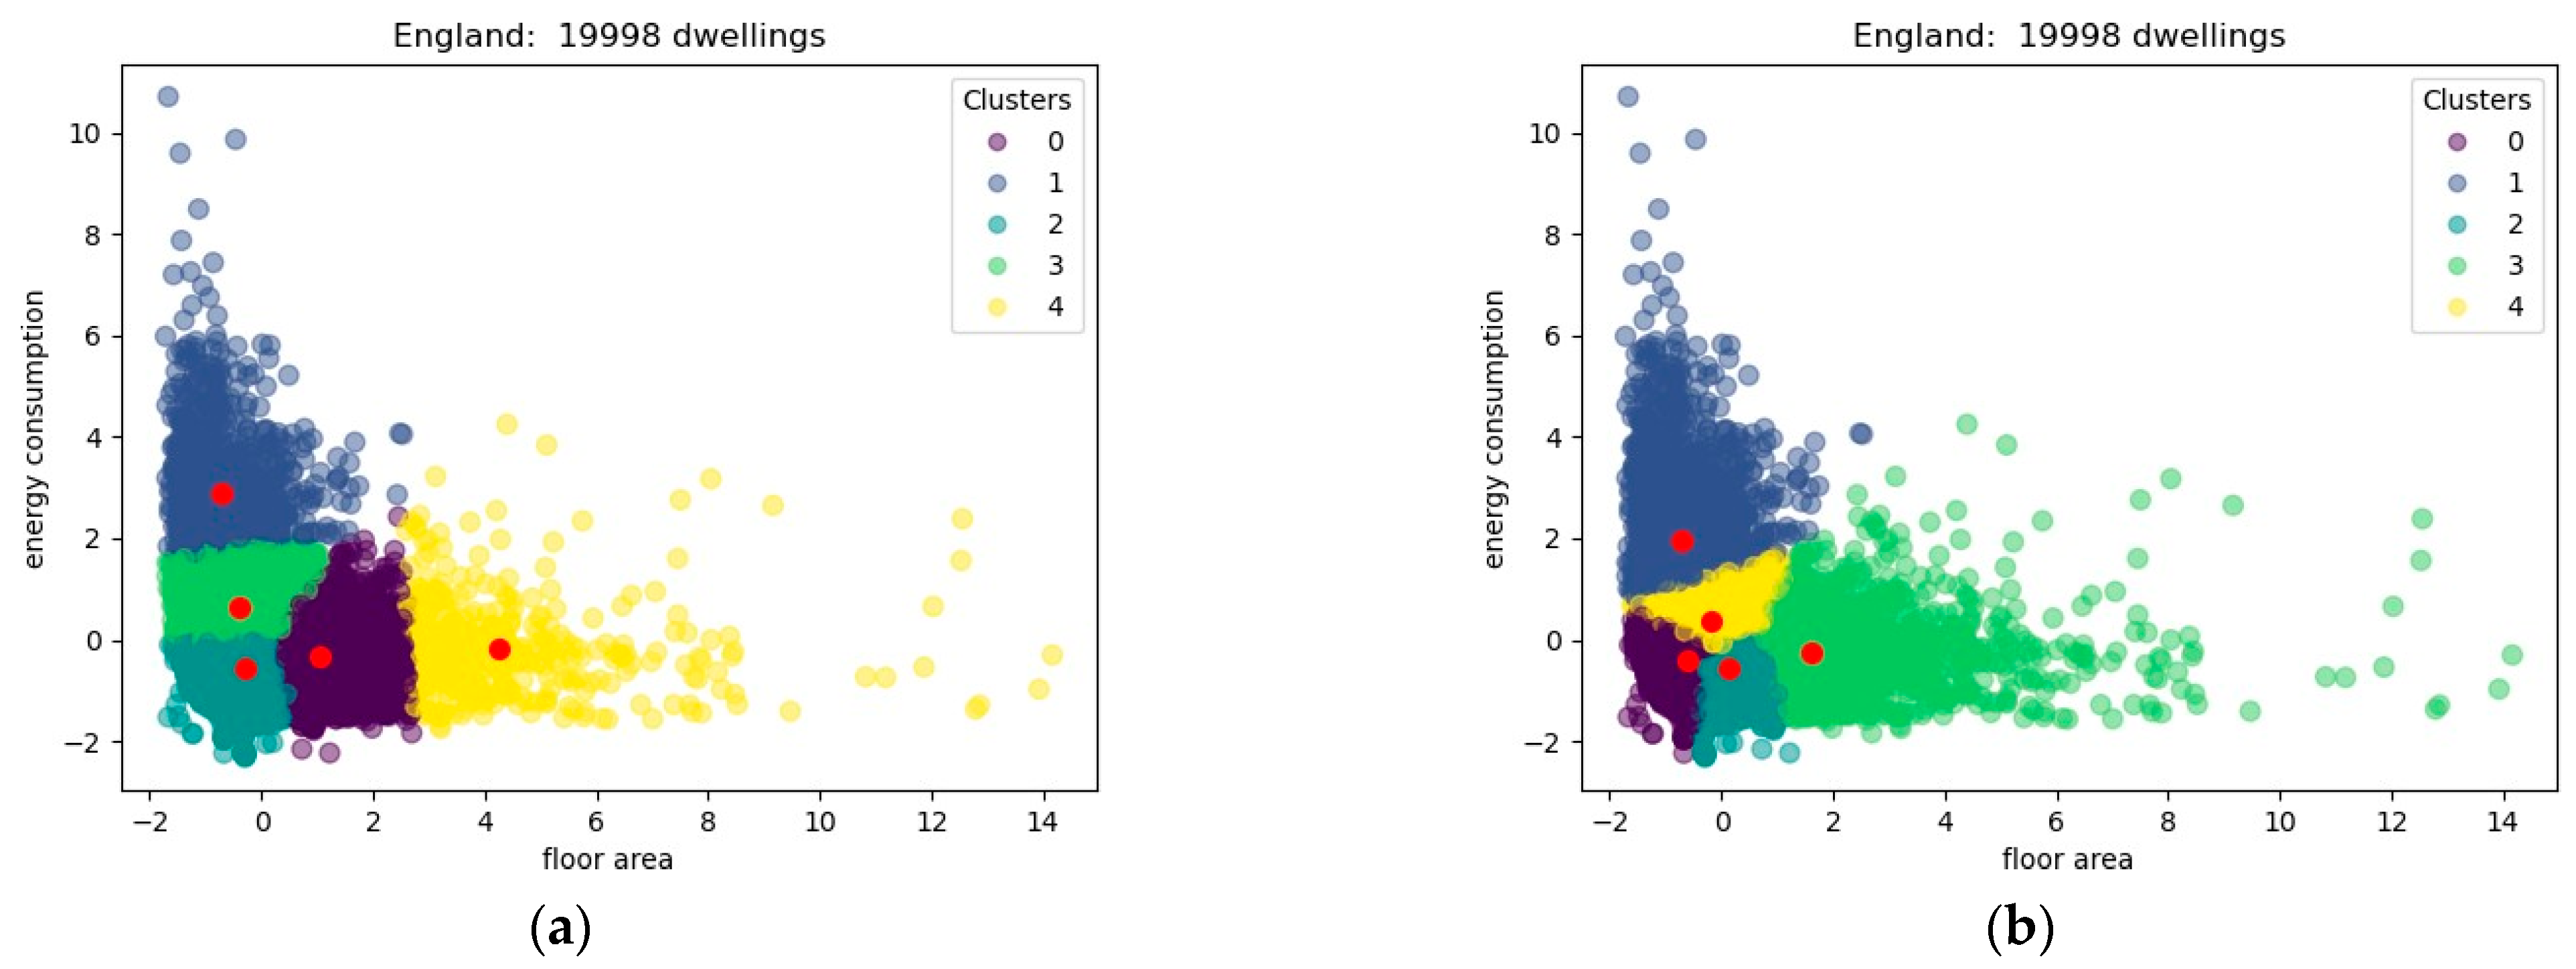
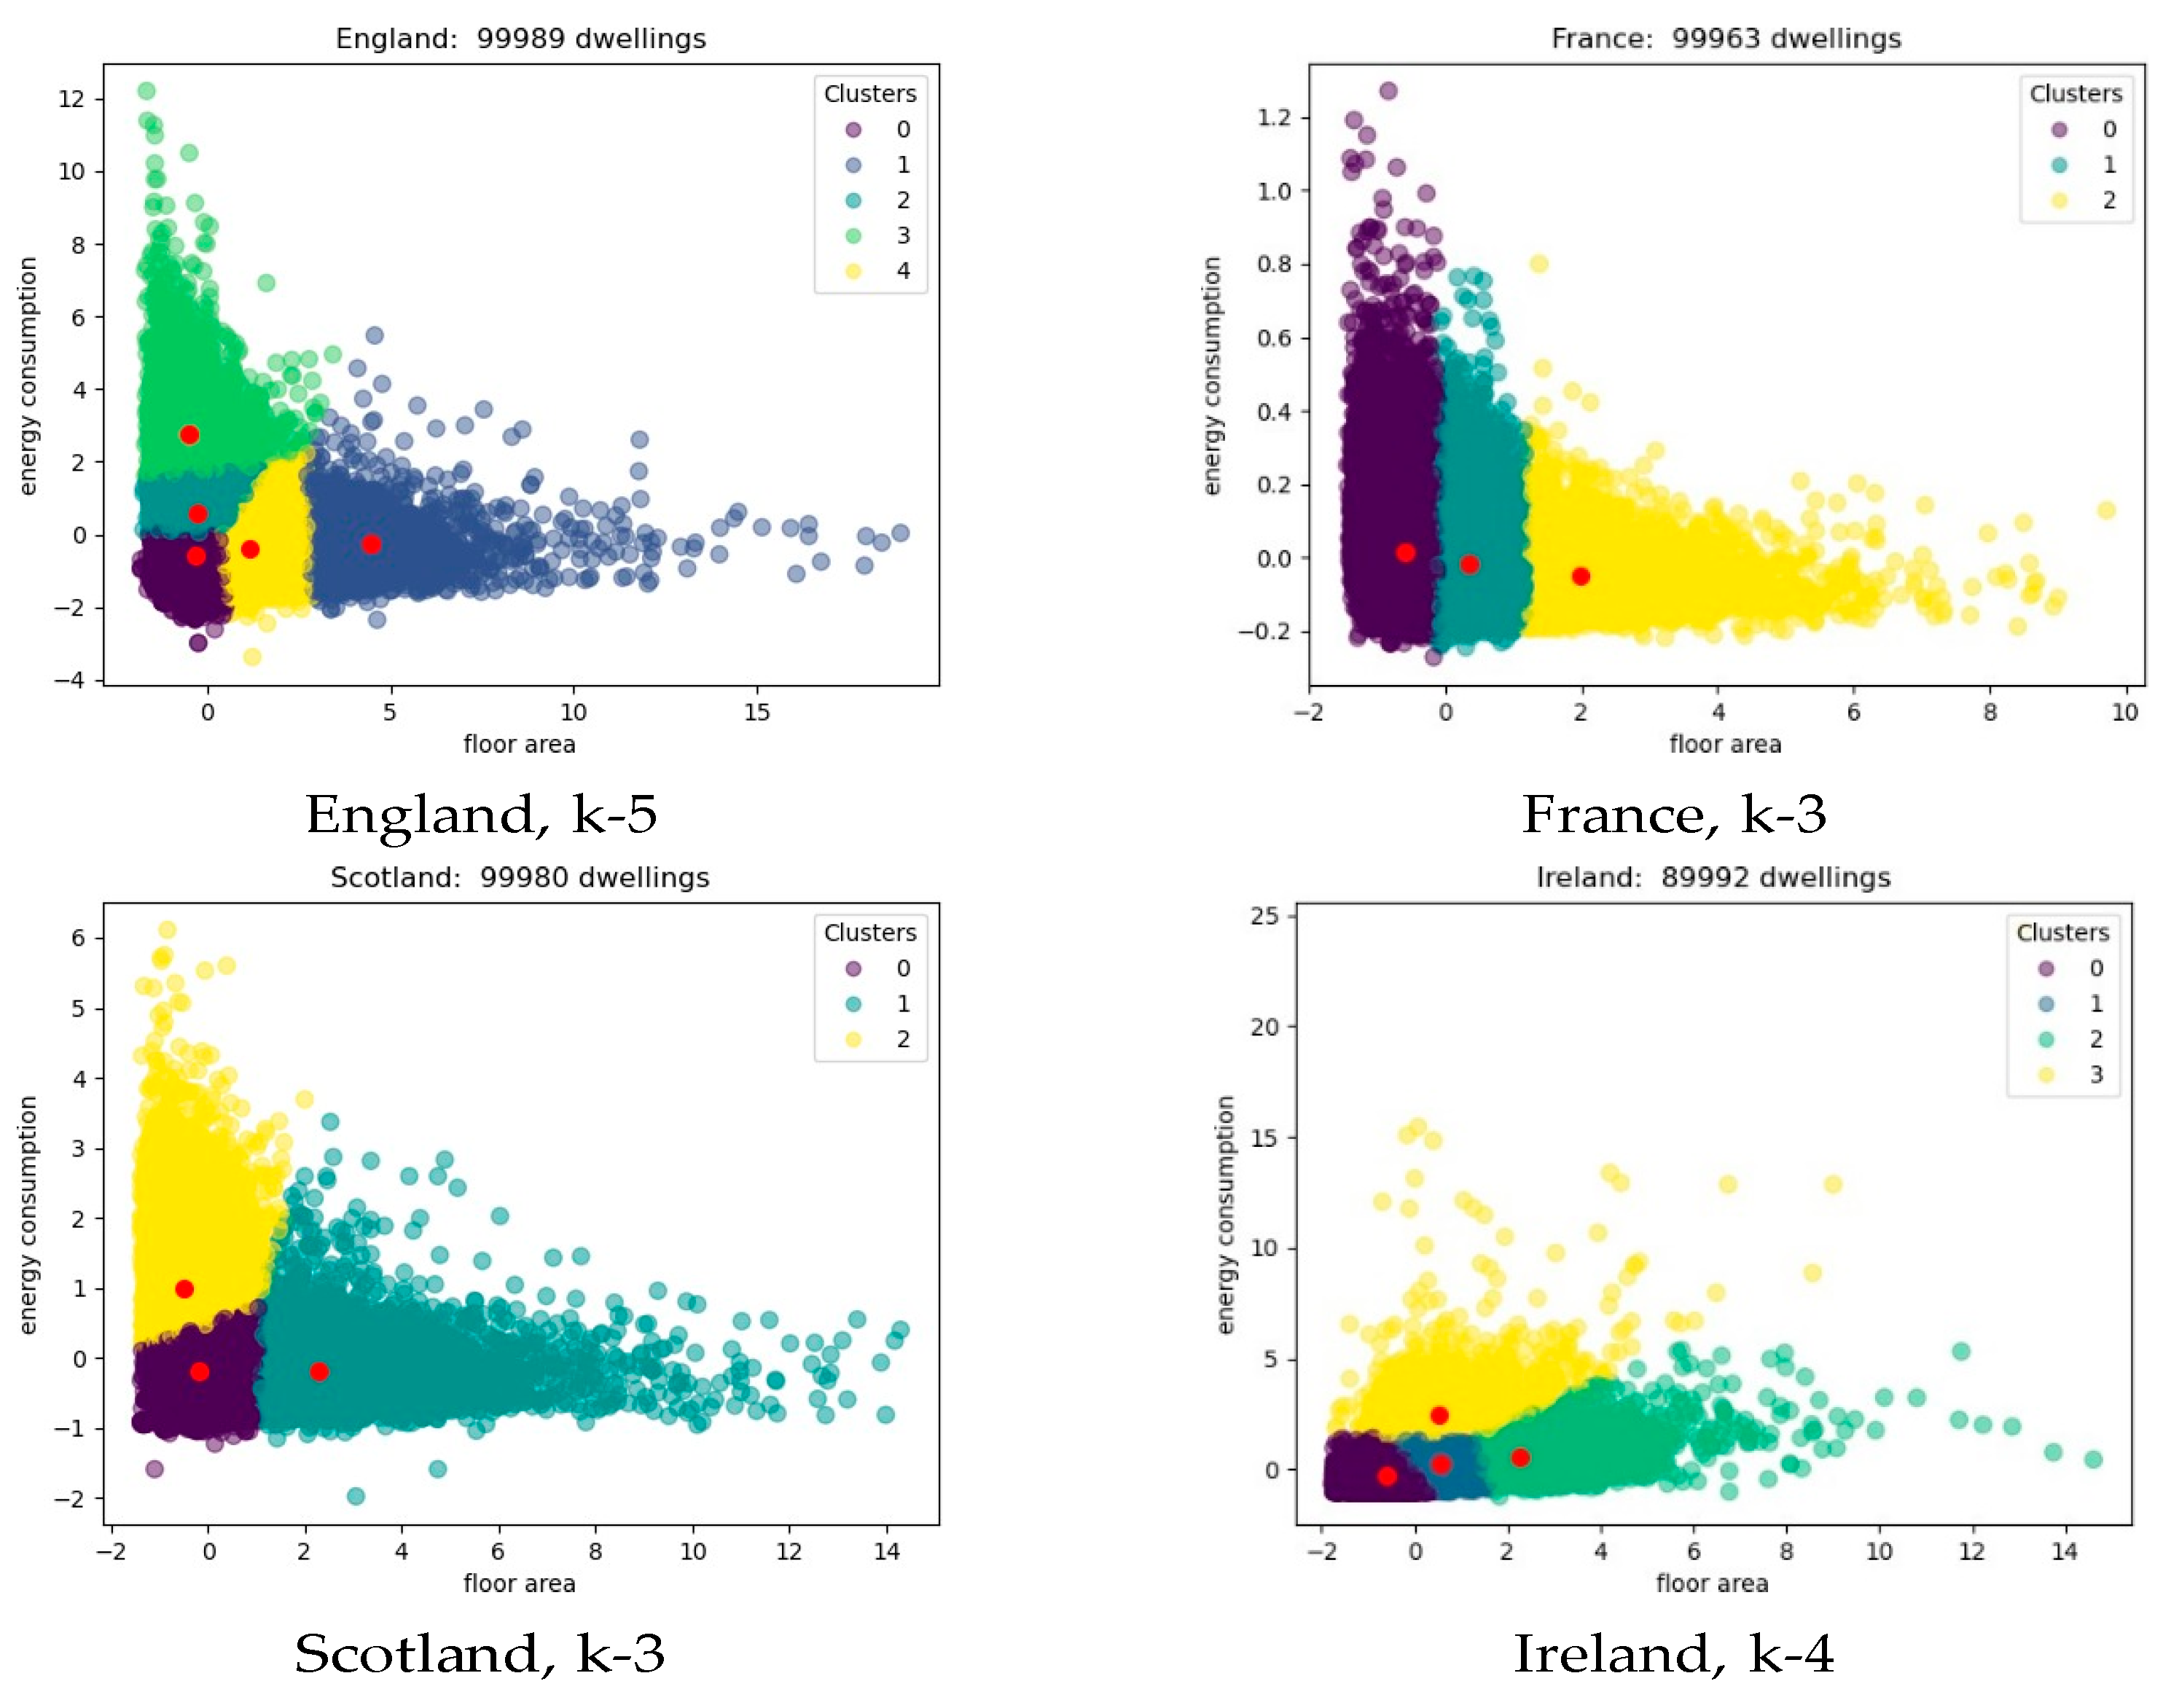
5. Results
- the rating distributions of the datasets,
- the similarity scores of k-means and k-medoids, and
- the accuracy of the prediction algorithm kNN.
- England, optimum k ∈ {3, 5};
- France, optimum k ∈ {3, 4};
- Scotland, optimum k ∈ {4, 5}; and
- Ireland, optimum k ∈ {3, 4}.
6. Conclusions and Future Work
- More state-of-art similarity metrics and clustering algorithms can be researched and incorporated based on suitability with regard to available data.
- Semantic models for energy performance certificates (EPC) can be further integrated with semantic tools, which can help in reconciliation and alignment with cross domain semantic models. These tools can then be used for applying reasoning on EPC data.
- A tool for automated annotation of EPC data based on a newly developed ontology can be implemented further.
Author Contributions
Funding
Institutional Review Board Statement
Informed Consent Statement
Data Availability Statement
Conflicts of Interest
References
- European Commission. Energy Efficiency Plan 2011. 2011. Available online: https://eurlex.europa.eu/LexUriServ/LexUriServ.do?uri=COM:2011:0109:FIN:EN:PDF (accessed on 28 May 2021).
- The European Parliament and the Council of the European Union. Directive (EU) 2018/844 of the European Parliament and of the Council of 30 May 2018 amending Directive 2010/31/EU on the Energy Performance of Buildings and Directive 2012/27/EU on Energy Efficiency. 2018. Available online: https://eur-lex.europa.eu/legal-content/EN/TXT/?uri=uriserv%3AOJ.L_.2018.156.01.0075.01.ENG (accessed on 15 April 2021).
- Fensel, A.; Tomic, S. SESAME: Semantic Smart Metering–Enablers for Energy Efficiency. In Proceedings of the Poster and Demonstration Track at the 2nd Future Internet Symposium (FIS 2009), Berlin, Germany, 1–3 September 2009. [Google Scholar]
- The European Parliament and the Council of the European Union. Directive 2012/27/EU of the European Parliament and of the Council of 25 October 2012 on Energy Efficiency, Amending Directives 2009/125/EC and 2010/30/EU and Repealing Directives 2004/8/EC and 2006/32/EC. 2012. Available online: https://eur-lex.europa.eu/legal-content/EN/TXT/?qid=1399375464230&uri=CELEX:32012L0027 (accessed on 15 April 2019).
- Lanner Electronics Inc. 5 Ways the Internet of Things Could Help Combat Climate Change. 2018. Available online: https://www.lanner-america.com/blog/5-ways-internet-things-help-combat-climate-change (accessed on 25 May 2019).
- City of Innsbruck. Active Innsbruck-City Projects. 2018. Available online: https://en.wikipedia.org/w/index.php?title=LaTeX&oldid=413720397 (accessed on 25 May 2019).
- The European Parliament and the Council of the European Union. Commission Delegated Regulation (EU) 2020/2155 of 14 October 2020 Supplementing Directive (EU) 2010/31/EU of the European Parliament and of the Council by Establishing an Optional Common European Union Scheme for Rating the Smart Readiness of Buildings. 2020. Available online: https://eur-lex.europa.eu/legal-content/EN/TXT/?uri=CELEX%3A32020R2155&qid=1619285483046 (accessed on 15 December 2020).
- Verbeke, S.; Waide, P.; Bettgenhäuser, K.; Uslar, M.; Bogaert, S. Support for Setting up a Smart Readiness Indicator or Buildings and Related Impact Assessment. August 2018. Available online: https://www.buildup.eu/sites/default/files/content/sri_1st_technical_study_-_executive_summary.pdf (accessed on 29 December 2020).
- Tomic, S.D.K.; Fensel, A.; Schwanzer, M.; Veljovic, M.; Stefanovic, M. Semantics for energy efficiency in smart home environments. In Applied Semantic Web Technologies; Auerbach Publications: Boca Raton, FL, USA, 2011; pp. 429–454. [Google Scholar]
- Fotopoulou, E.; Zafeiropoulos, A.; Terroso-Saenz, F.; Simsek, U.; Vidal, A.G.; Tsiolis, G.; Gouvas, P.; Liapis, P.; Fensel, A.; Skarmeta, A. Providing personalized energy management and awareness services for energy efficiency in smart buildings. Sensors 2017, 17, 2054. [Google Scholar] [CrossRef] [PubMed] [Green Version]
- Calinski-Harabasz Score Calculation (Scikitlearn Module). 2019. Available online: https://scikit-learn.org/stable/modules/generated/sklearn.metrics.calinski_ (accessed on 22 October 2019).
- Drools is a Business Rules Management System (BRMS). Available online: https://www.drools.org/ (accessed on 19 November 2019).
- Vidal, A.G.; Ramallo-Gonzalez, A.P.; Terroso-Saenz, F.; Skarmeta, A. Data driven modeling for energy consumption prediction in smart buildings. In Proceedings of the 2017 IEEE International Conference on Big Data (Big Data), Boston, MA, USA, 11–14 December 2017; pp. 4562–4569. [Google Scholar]
- Rudin, C. Stop explaining black box machine learning models for high stakes decisions and use interpretable models instead. Nat. Mach. Intell. 2019, 1, 206–215. [Google Scholar] [CrossRef] [Green Version]
- Innovate UK. Building Performance Evaluation Programme: Findings From Non-Domestic Projects-Getting the Best From. January 2016. Available online: https://www.ukri.org/wp-content/uploads/2021/12/IUK-061221-NonDomesticBuildingPerformanceFullReport2016.pdf (accessed on 13 August 2019).
- IPEEC’s Building Energy Efficiency Task group (BEET). Building Energy Rating Schemes, Assessing Issues and Impacts. 2014. Available online: https://www.buildingrating.org/sites/default/files/1402403078IPEEC_BuildingEnergyRatingSchemesFinal_February2014_pdf.pdf (accessed on 12 October 2019).
- Fabi, V.; Andersen, R.; Corgnati, S.; Olesen, B.; Filippi, M. Description of Occupant Behaviour in Building Energy Simulation: State-of-Art and Concepts for Their Improvement. Building Simulation 2011, At Sydney, Australia, 11 2011. Building Information Modeling—Die neue Dimension der Planung. Available online: https://www.knauf.at/qr/bim.html (accessed on 18 November 2019).
- Transient System Simulation Tool (Features and Demonstration). Available online: http://trnsys.com (accessed on 25 May 2019).
- Ramallo-Gonzalez, A.; Blight, T.; Coley, D. Robust low energy design that accounts for occupant behavior. In Proceedings of the 1st International Conference on Building Sustainability Assessment, Porto, Portugal, 23–25 May 2012. [Google Scholar]
- de Vilde, P.; Jones, R.V.; Fuertes, A. The Gap between Simulated and Measured Energy Performance: A Case Study across Six Identical New-Build Flats in the UK. 2015. Available online: https://pearl.plymouth.ac.uk/handle/10026.1/4320 (accessed on 9 October 2019).
- Imam, S.; Coley, D.; Valker, I. The building performance gap: Are modellers literate? Build. Serv. Eng. Res. Technol. 2017, 38, 014362441668464. [Google Scholar] [CrossRef] [Green Version]
- Thermal Energy System Specialists. Trnsys 18, a Transient System Simulation Program. 2018. Available online: https://sel.me.wisc.edu/trnsys/features/trnsys18_0_updates.pdf (accessed on 12 October 2019).
- IEA. Energy Performance Certification of Buildings, a Policy Tool to Improve Energy Efficiency. 2010. Available online: https://www.iea.org/reports/policy-pathway-energy-performance-certification-of-buildings (accessed on 31 May 2019).
- Schwanzer, M.; Fensel, A. Energy consumption information services for smart home inhabitants. In Proceedings of the Future Internet—FIS 2010—Third Future Internet Symposium, Berlin, Germany, 20–22 September 2010; pp. 78–87. [Google Scholar]
- Mogles, N.; Valker, I.; Ramallo-Gonzalez, A.P.; Lee, J.; Natarajan, S.; Padget, J.; Gabe-Thomas, E.; Lovett, T.; Ren, G.; Hyniewska, S.; et al. How smart do smart meters need to be? Build. Env. 2017, 125, 439–450. [Google Scholar] [CrossRef]
- Marzinger, T.; Osterreicher, D. Supporting the Smart Readiness Indicator: A Methodology to Integrate A Quantitative Assessment of the Load Shifting Potential of Smart Buildings. Energies 2019, 12, 1955. [Google Scholar] [CrossRef] [Green Version]
- Neymark, J.; Roberts, D. Deep in Data: Empirical Data Based Software Accuracy Testing Using the Building America Field Data Repository. 2013. Available online: https://www.nrel.gov/docs/fy13osti/58893.pdf (accessed on 22 October 2019).
- Home Performance Coalition. HPXML Specifications. 2019. Available online: https://www.hpxmlonline.com/specifications/ (accessed on 22 October 2019).
- Ramallo-Gonzalez, A. Modelling Sirnulation and Optimisation of Low-Energy Building. Ph.D. Thesis, University of Exeter, Stocker, UK, April 2013. [Google Scholar]
- Belsky, M.; Sacks, R.; Brilakis, I. Semantic Enrichment for Building Information Modeling. Computer-Aided Civil and Infrastructure Engineering 2016, 31, 261274. [Google Scholar] [CrossRef]
- Sacks, R.; Ma, L.; Yosef, R.; Borrmann, A.; Daum, S.; Kattel, U. Semantic Enrichment for Building Information Modeling: Procedure for Compiling Inference Rules and Operators for Complex Geometry. 2017. Available online: https://eprints.hud.ac.uk/id/eprint/32807/1/Ling.Ma.pdf (accessed on 11 November 2019).
- Patroumpas, K.; Giannopoulos, G.; Athanasiou, S. Towards geospatial semantic data management: Strengths, weaknesses, and challenges ahead. In Proceedings of the 22nd ACM SIGSPATIAL International Conference on Advances in Geographic Information Systems, Dallas/Fort Worth, TX, USA, 4–7 November 2014; pp. 301–310. [Google Scholar]
- The Association for Environment Conscious Building (AECB). 2016. Available online: https://www.aecb.net/about/about-the-aecb/aecb-history (accessed on 9 July 2019).
- Spatio-Temporal Query Language for Verifying and Analyzing 4D Building Information Models. Available online: https://www.cms.bgu.tum.de/en/research/17-research-projects/121-spatio-temporal-query-language-for-verifying-and-analyzing-4d-building-information-models (accessed on 15 November 2019).
- Cohn, A.G.; Hazarika, S.M. Qualitative spatial representation and reasoning: An overview. Fundam. Inform. 2001, 46, 1–29. [Google Scholar]


| Country | Imported Entries | Original Entries | Storage (Actual/Total) |
|---|---|---|---|
| England | 759,460 | 7,000,000+ (in 163 files) | 512/512 MB |
| France | 368,127 | 3,584,241 (in 36 files) | 214/512 MB |
| Scotland | 300,871 | 872,442 (in 18 files) | 217/512 MB |
| Ireland | 268,208 | 902,255 (in 1 file) | 241/512 MB |
| Country | Import Distribution | |
|---|---|---|
| England | every | 10th entry |
| France | every | 10th entry |
| Scotland | every | 3rd entry |
| Ireland | every | 3rd entry |
| Domain | Data Structure/UML Classes |
|---|---|
| Energy Performance Certificate | EPC |
| Energy Performance Rating | Rating, RatingMethodology, Software |
| Issuing Authority | Assessor, Person, ContactDetails, Organisation |
| Dwelling | Dwelling, BuildingAddress, ClimateData, Photo |
| Energy Consumption | ThermalData |
| Floor Area | SpatialData |
| Property | Database Field Name | Type | Measuring Unit |
|---|---|---|---|
| Country | Country | String | N/A |
| Floor Area | totalFloorArea | Long | m2 |
| Energy Consumption | primaryEnergyDemand (Scotland) finalEnergyConsumption (France) finalEnergyDemand (England) finalEnergyDemand (Ireland) | Long | kWh/m2/year (Scotland) kWh/year (France) kWh/m2/year (England) kWh/year (Ireland) |
| Rating | ratingLevel | String | N/A |
| Actual Value | Scaled Value | |
|---|---|---|
| Floor area | 73 | −0.269161 |
| Energy consumption | 428 | 1.026007 |
| Rating Label | Precision | Recall | FI-Score | Support |
|---|---|---|---|---|
| A | 0.80 | 0.29 | 0.42 | 42 |
| B | 0.73 | 0.73 | 0.73 | 1538 |
| C | 0.67 | 0.69 | 0.68 | 5229 |
| D | 0.68 | 0.76 | 0.72 | 8261 |
| E | 0.63 | 0.58 | 0.61 | 3688 |
| F | 0.38 | 0.17 | 0.24 | 969 |
| G | 0.32 | 0.06 | 0.10 | 273 |
| Accuracy | 0.67 | |||
| Predicted Classes | ||||||||
|---|---|---|---|---|---|---|---|---|
| A | B | C | D | E | F | G | ||
| actual classes | A | 12 | 19 | 4 | 7 | 0 | 0 | 0 |
| B | 3 | 1121 | 393 | 20 | 0 | 1 | 0 | |
| C | 0 | 390 | 3629 | 1187 | 21 | 1 | 0 | |
| D | 0 | 15 | 1273 | 6282 | 655 | 36 | 0 | |
| E | 0 | 0 | 51 | 1291 | 2146 | 188 | 12 | |
| F | 0 | 1 | 30 | 256 | 494 | 165 | 24 | |
| G | 0 | 0 | 16 | 138 | 64 | 38 | 17 | |
| Country | Imported Entries | Entries Used for Prediction |
|---|---|---|
| England | 759,460 | 100,000 |
| France | 368,127 | 100,000 |
| Scotland | 300,871 | 100,000 |
| Ireland | 268,208 | 90,000 |
| EPC Properties | Schema.org Properties |
|---|---|
| EPC | Thing.CreativeVork or Thing.Review |
| EPC.identificationNumber | Thing.Property.identifier |
| EPC.creationDate | Thing.CreativeWork.dateCreated Thing.additionalProperty |
| EPC.awardedRating | Thing.Intangible.Rating.AggregateRating Thing.IntangibleRating |
| EPC.potentialRating | Thing.Intangible.Rating.AggregateRating Thing.Intangible.Rating |
| EPC.purpose | Thing.potentialAction |
| EPC.ratedDwelling EPC.ratedDwelling.type.HOUSE EPC.ratedDwelling.identificationNumber EPC.ratedDwelling.buildingAddress EPC.ratedDwelling.spatialData.totalFloorArea EPC.ratedDwelling.finalEnergyDemand EPC.ratedDwelling.mainHeatingFuelType EPC.ratedDwelling.carbonFootprint | Thing.Property.about Thing.Place.Accomodation.House Thing.Property.identifier ContactPoint.PostalAddress Thing.Property.floorSize Thing.additionalProperty Thing.additionalProperty Thing.additionalProperty |
| EPC Properties | HPXML Properties |
|---|---|
| EPC | GreenBuildingVerification |
| identificationNumber creationDate Assessor | GreenBuildingVerification.SystemIdentifier GreenBuildingVerification.Year GreenBuildingVerification.Assessor |
| EPC.ratedDwelling | Building |
| identificationNumber type buildingAddress spatialData.orientation spatialData.totalFloorArea thermalData.finalEnergyDemand thermalData.mainHeatingFuelType | Building.BuildingID BuildingConstruction.ResidentialFacilityType Building.Site.Address Building.Site.OrientationOfFrontOfHome BuildingConstruction.NetFloorArea BuildingDetails.ModeledUsage.AnnualConsumption BuildingDetails.ModeledUsage.EnergyType |
| EPC.awardedRating.ratingLevel | GreenBuildingVerification.Rating |
| k | Silhouette | CH Score | k | Silhouette | CH Score |
|---|---|---|---|---|---|
| 3 | 0.45 | 53,382.05 | 3 | 0.58 | 116,054.94 |
| 4 | 0.34 | 51,612.25 | 4 | 0.57 | 139,134.83 |
| 5 | 0.36 | 54,010.00 | 5 | 0.51 | 174,678.36 |
| 6 | 0.31 | 52,076.15 | 6 | 0.49 | 206,350.63 |
| 7 | 0.31 | 52,177.72 | 7 | 0.49 | 235,340.24 |
| 8 | 0.31 | 51,580.49 | 8 | 0.48 | 269,832.81 |
| a. Cluster Fitness England | b. Cluster Fitness France | ||||
| k | Silhouette | CH Score | k | Silhouette | CH Score |
| 3 | 0.62 | 79,998.00 | 3 | 0.57 | 66,935.38 |
| 4 | 0.46 | 82,373.95 | 4 | 0.48 | 64,643.67 |
| 5 | 0.47 | 95,541.71 | 5 | 0.48 | 61,104.66 |
| 6 | 0.39 | 101,310.40 | 6 | 0.48 | 60,011.44 |
| 7 | 0.35 | 103,399.89 | 7 | 0.41 | 62,973.35 |
| 8 | 0.35 | 106,897.49 | 8 | 0.40 | 63,865.31 |
| c. Cluster Fitness Scotland | d. Cluster Fitness Ireland | ||||
| Rating Label | Precision | Recall | FI-Score | Support |
|---|---|---|---|---|
| A | 0.80 | 0.29 | 0.42 | 42 |
| B | 0.73 | 0.73 | 0.73 | 1538 |
| C | 0.67 | 0.69 | 0.68 | 5229 |
| D | 0.68 | 0.76 | 0.72 | 8261 |
| E | 0.63 | 0.58 | 0.61 | 3688 |
| F | 0.38 | 0.17 | 0.24 | 969 |
| G | 0.32 | 0.06 | 0.10 | 273 |
| Accuracy | 0.67 | |||
| a. The effectiveness metrics for England | ||||
| Rating Label | Precision | Recall | FI-score | Support |
| A | 0.94 | 0.46 | 0.61 | 127 |
| B | 0.96 | 0.67 | 0.79 | 558 |
| C | 0.94 | 0.97 | 0.96 | 3073 |
| D | 0.95 | 0.99 | 0.97 | 7030 |
| E | 0.96 | 0.99 | 0.97 | 5780 |
| F | 0.97 | 0.95 | 0.96 | 2464 |
| G | 1.00 | 0.72 | 0.84 | 968 |
| Accuracy | 0.96 | |||
| b. The effectiveness metrics for France | ||||
| Rating Label | Precision | Recall | FI-score | Support |
| A | 0.50 | 0.11 | 0.18 | 37 |
| B | 0.71 | 0.47 | 0.57 | 616 |
| C | 0.85 | 0.86 | 0.86 | 7339 |
| D | 0.75 | 0.86 | 0.80 | 8442 |
| E | 0.66 | 0.54 | 0.59 | 2641 |
| F | 0.38 | 0.14 | 0.20 | 744 |
| G | 0.32 | 0.08 | 0.12 | 181 |
| Accuracy | 0.77 | |||
| c. The effectiveness metrics for Scotland | ||||
| Rating Label | Precision | Recall | FI-score | Support |
| A | 0.60 | 0.19 | 0.29 | 135 |
| B | 0.45 | 0.29 | 0.36 | 2072 |
| C | 0.54 | 0.78 | 0.64 | 6667 |
| D | 0.54 | 0.53 | 0.53 | 4523 |
| E | 0.45 | 0.30 | 0.36 | 2133 |
| F | 0.43 | 0.20 | 0.27 | 1011 |
| G | 0.51 | 0.23 | 0.31 | 1459 |
| Accuracy | 0.52 | |||
| d. The effectiveness metrics for Ireland | ||||
Publisher’s Note: MDPI stays neutral with regard to jurisdictional claims in published maps and institutional affiliations. |
© 2022 by the authors. Licensee MDPI, Basel, Switzerland. This article is an open access article distributed under the terms and conditions of the Creative Commons Attribution (CC BY) license (https://creativecommons.org/licenses/by/4.0/).
Share and Cite
Popa, A.; Ramallo González, A.P.; Jaglan, G.; Fensel, A. A Semantically Data-Driven Classification Framework for Energy Consumption in Buildings. Energies 2022, 15, 3155. https://doi.org/10.3390/en15093155
Popa A, Ramallo González AP, Jaglan G, Fensel A. A Semantically Data-Driven Classification Framework for Energy Consumption in Buildings. Energies. 2022; 15(9):3155. https://doi.org/10.3390/en15093155
Chicago/Turabian StylePopa, Angela, Alfonso P. Ramallo González, Gaurav Jaglan, and Anna Fensel. 2022. "A Semantically Data-Driven Classification Framework for Energy Consumption in Buildings" Energies 15, no. 9: 3155. https://doi.org/10.3390/en15093155
APA StylePopa, A., Ramallo González, A. P., Jaglan, G., & Fensel, A. (2022). A Semantically Data-Driven Classification Framework for Energy Consumption in Buildings. Energies, 15(9), 3155. https://doi.org/10.3390/en15093155