
Trends in Research on Energy Efficiency in Appliances and Correlations with Energy Policies


Abstract
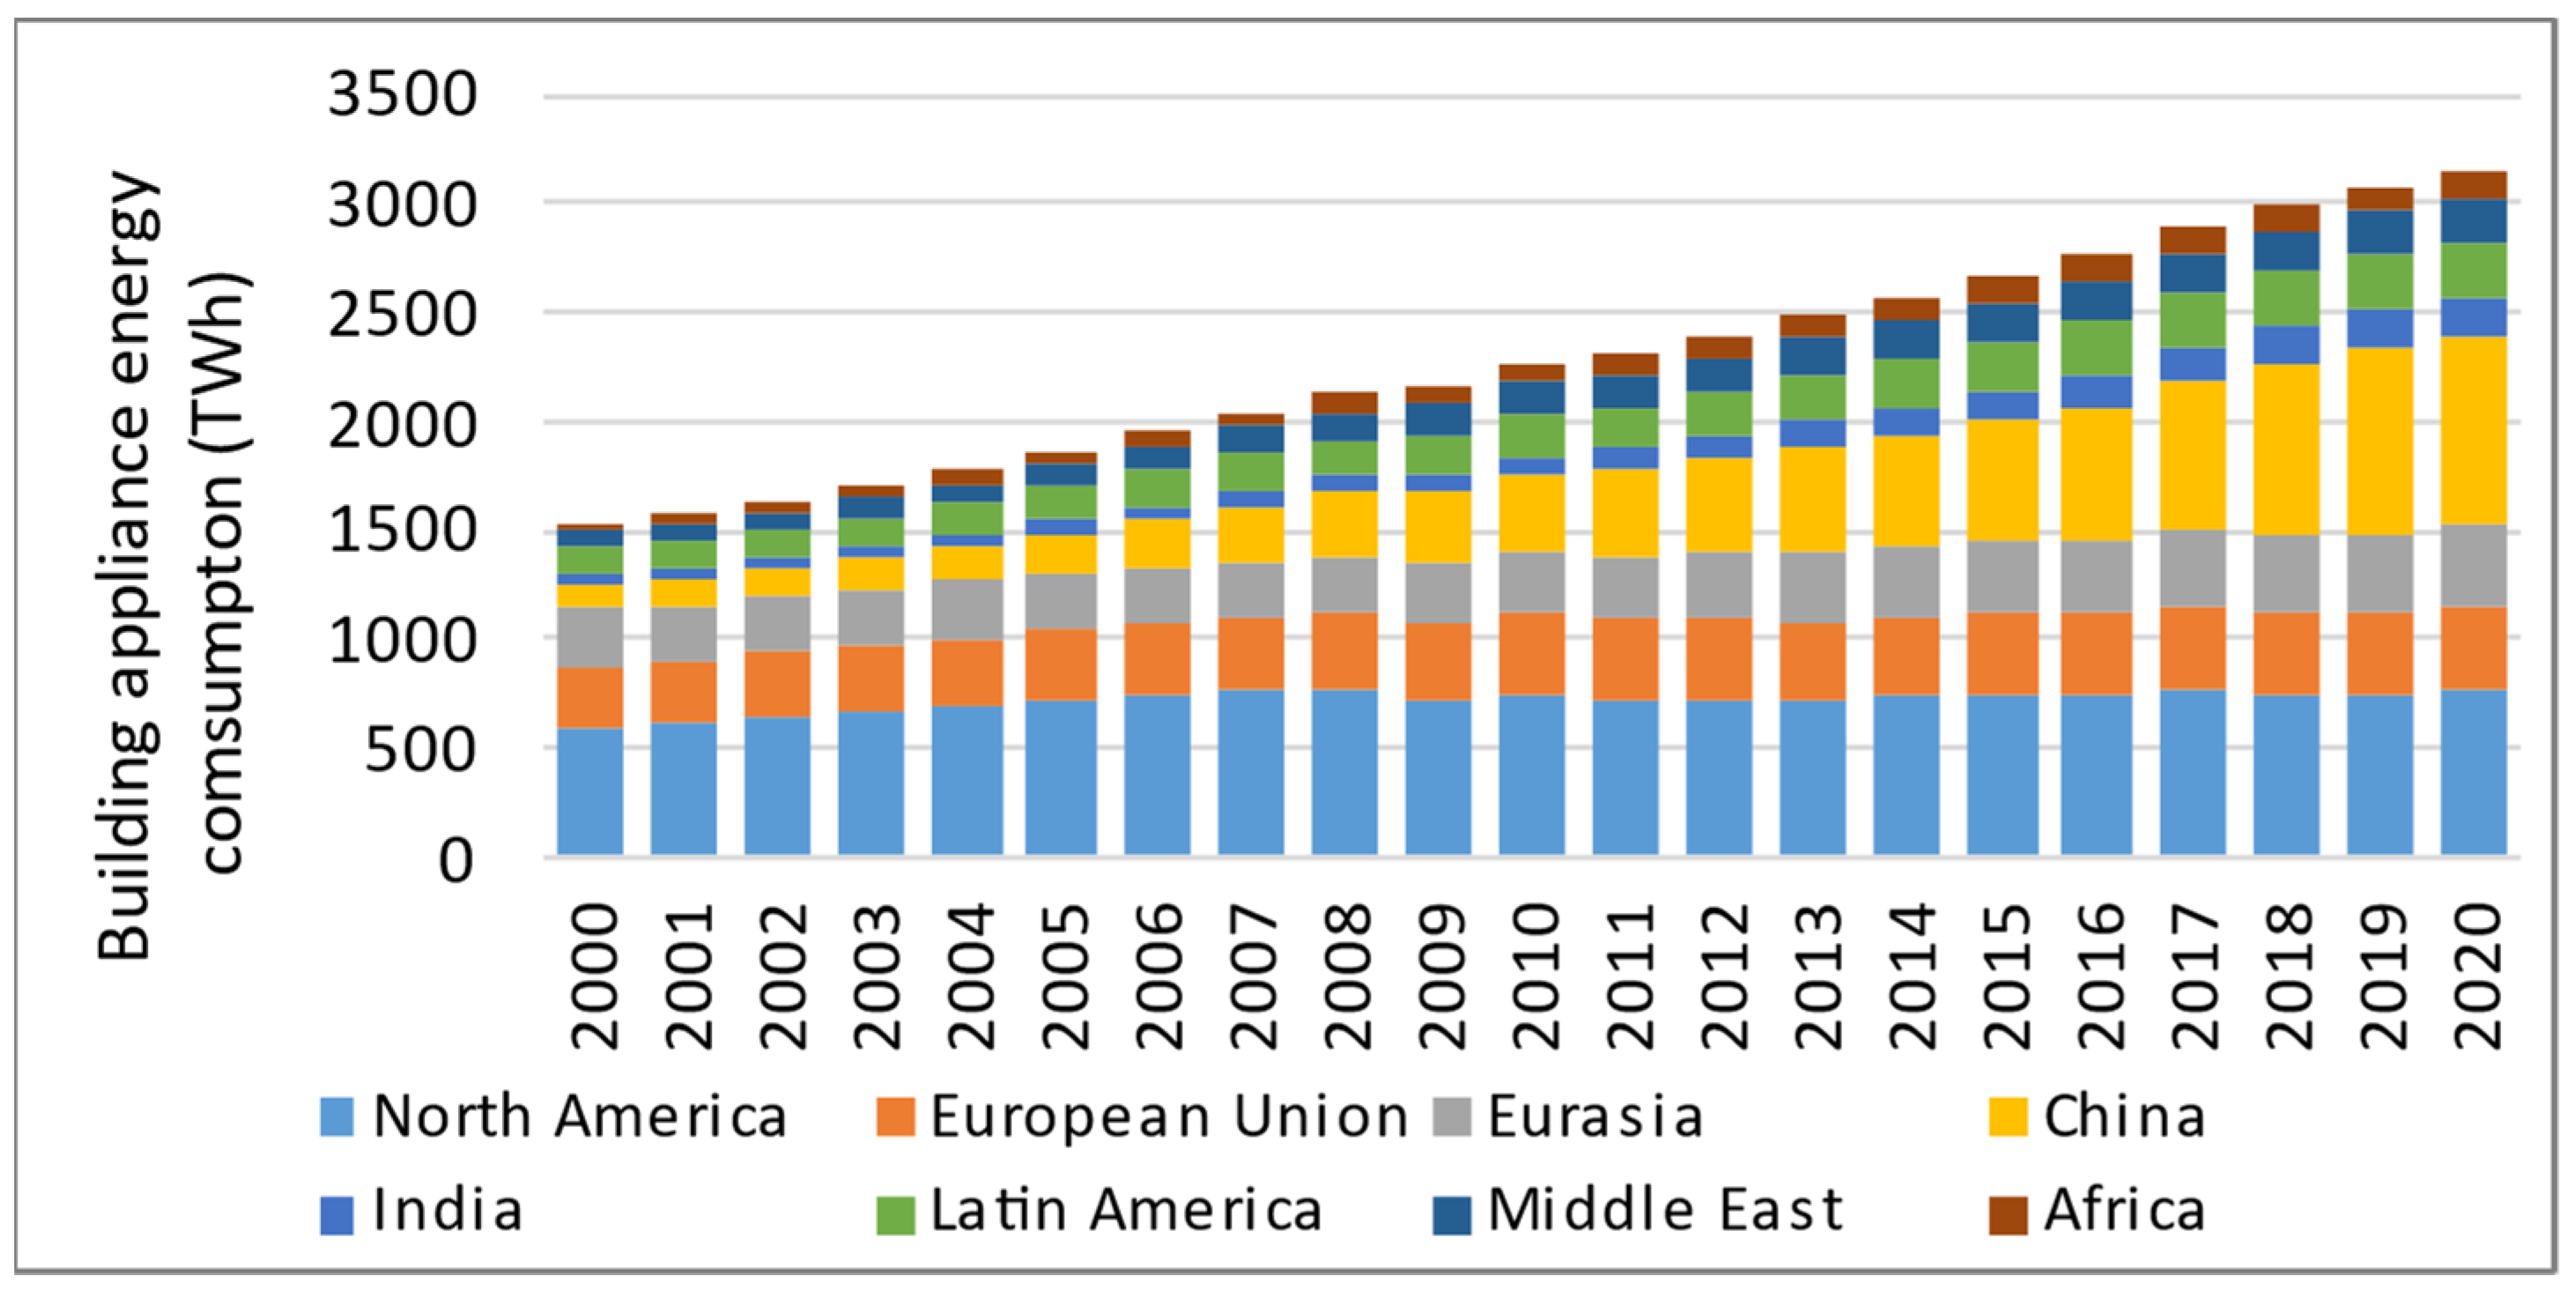
:1. Introduction
2. Materials and Methods
3. Results
3.1. Global Bibliometric Analysis
3.2. Analysis of Keywords
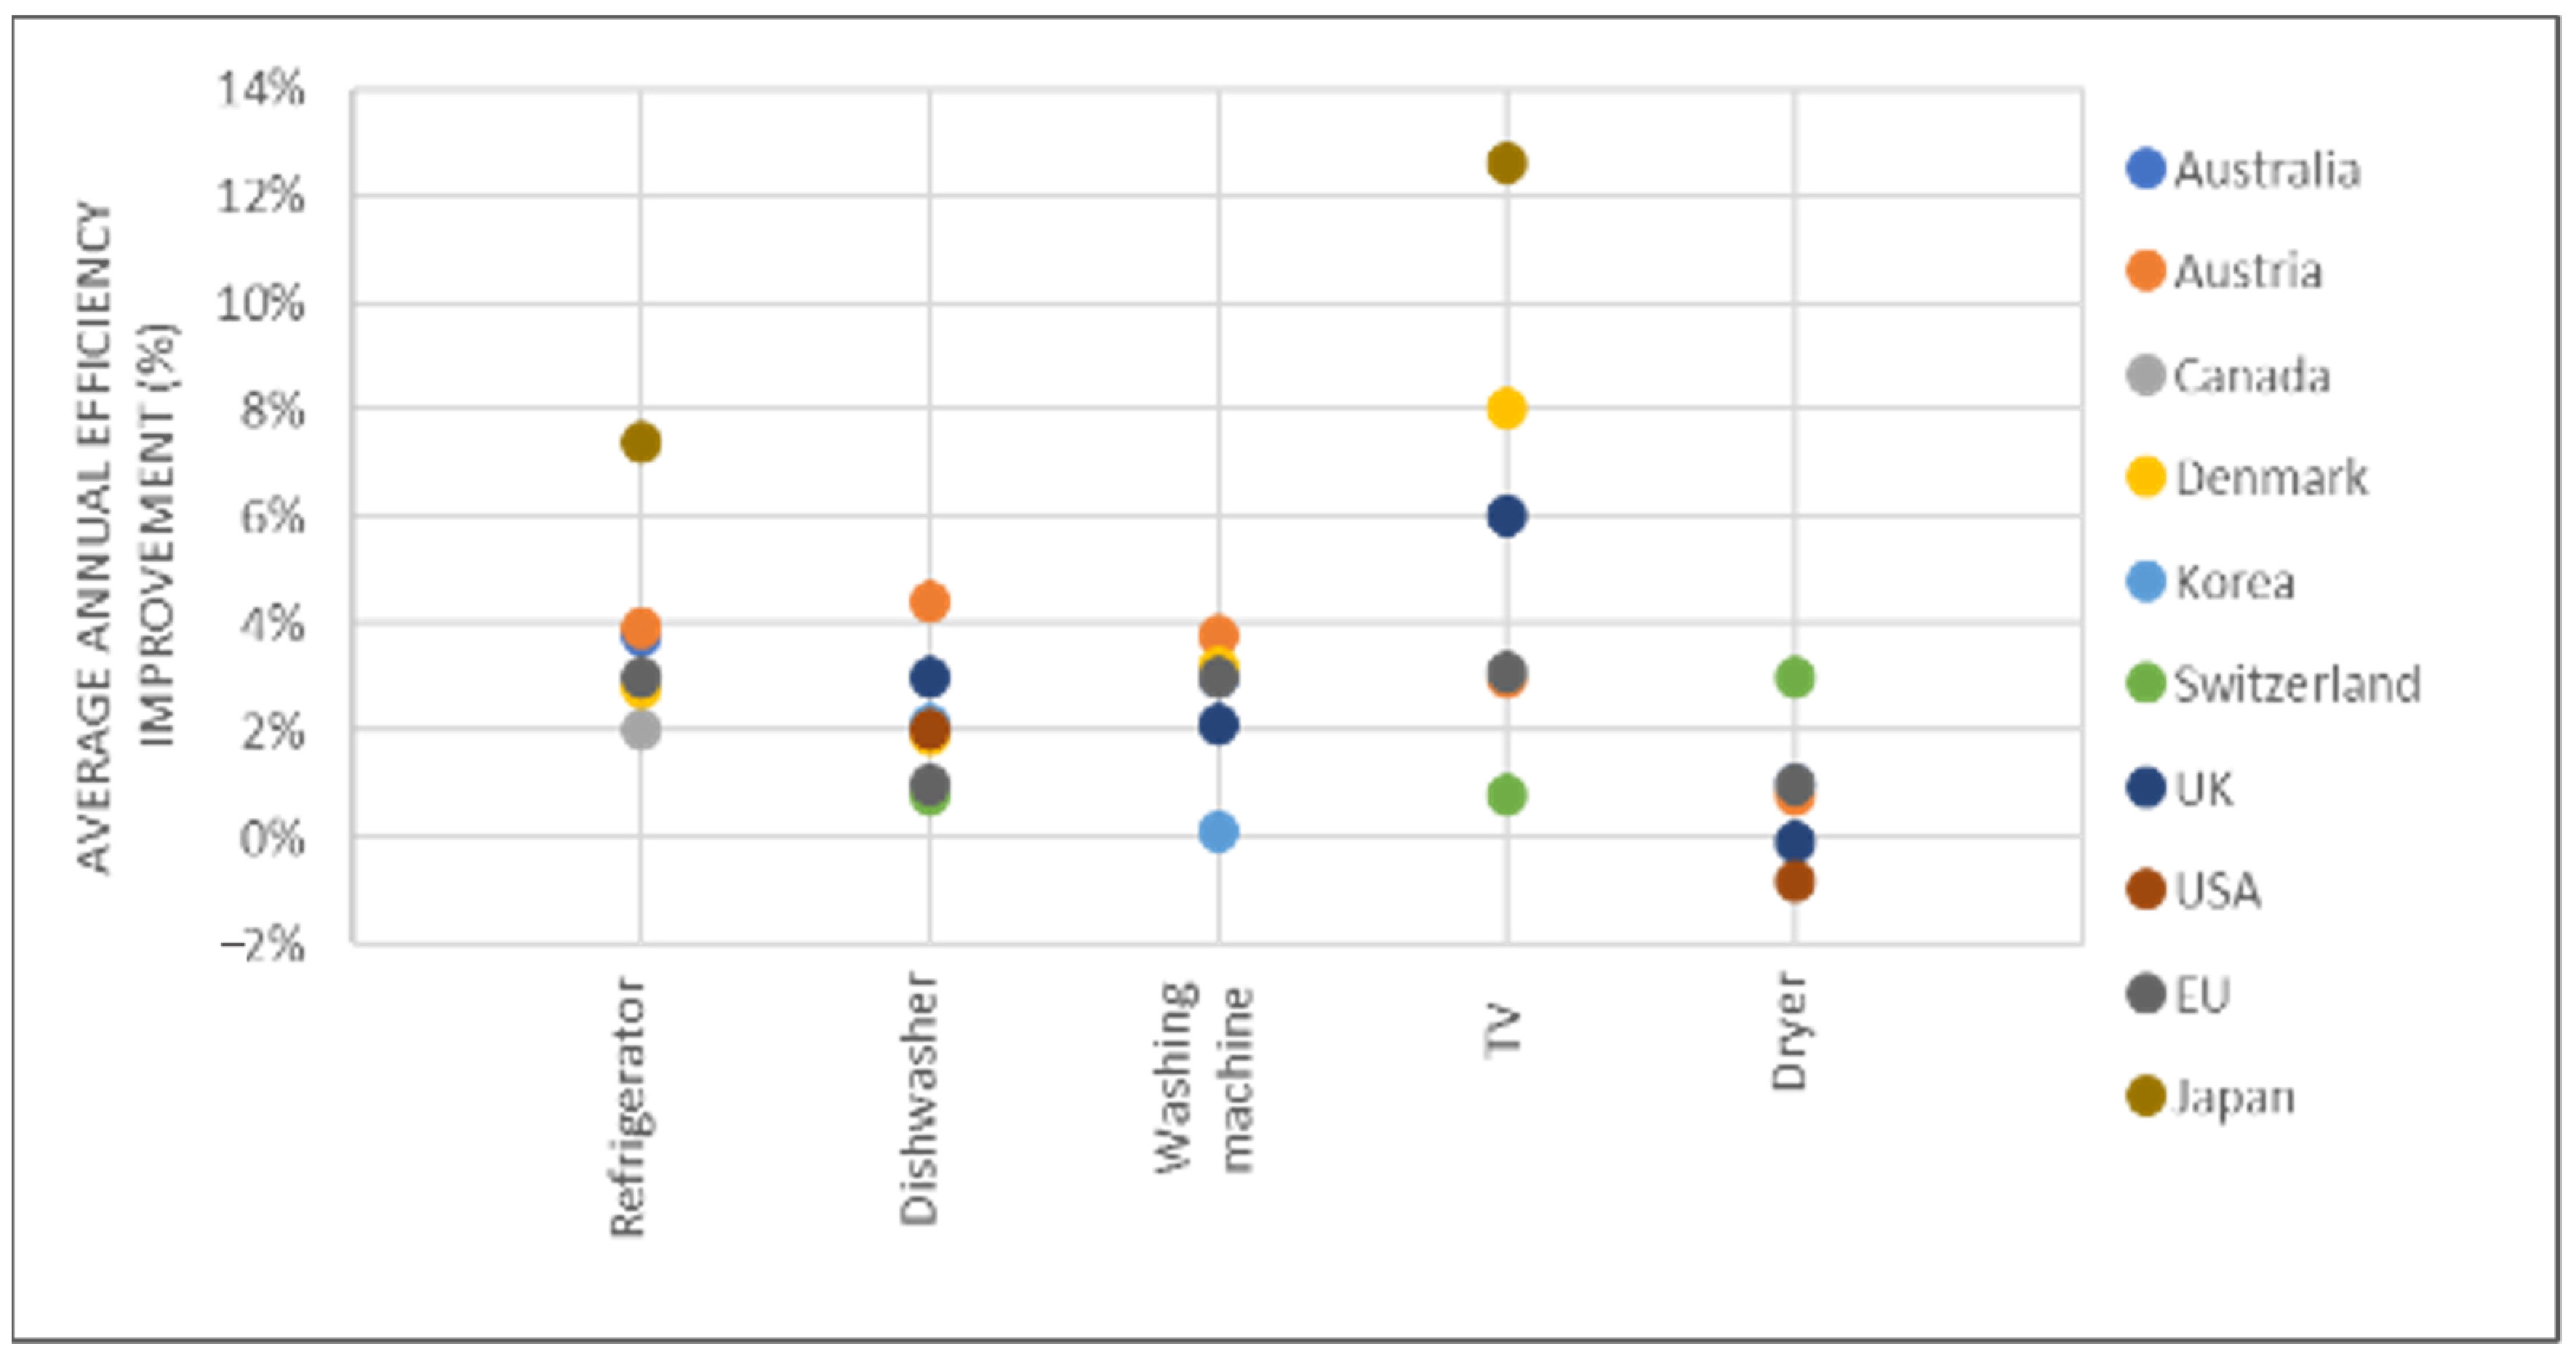
4. Discussion and Conclusions
Author Contributions
Funding
Institutional Review Board Statement
Informed Consent Statement
Data Availability Statement
Acknowledgments
Conflicts of Interest
References
- Elavarasan, R.M.; Pugazhendhi, R.; Irfan, M.; Mihet-Popa, L.; Khan, I.A.; Campana, P.E. State-of-the-art sustainable approaches for deeper decarbonization in Europe–An endowment to climate neutral vision. Renew. Sustain. Energy Rev. 2022, 159, 112204. [Google Scholar] [CrossRef]
- IEA. Global Status Report for Buildings and Construction 2019; IEA: Paris, France, 2019. [Google Scholar]
- IEA. International Energy Agency Appliances and Equipment; IEA: Paris, France, 2021. [Google Scholar]
- Lucon, O.; Ürge-Vorsatz, D.; Zain Ahmed, A.; Akbari, H.; Bertoldi, P.; Cabeza, L.F.; Eyre, N.; Gadgil, A.; Harvey, L.D.D.; Jiang, Y.; et al. Buildings. In Climate Change 2014: Mitigation of Climate Change; Contribution of Working Group III to the Fifth Assessment Report of the Intergovernmental Panel on Climate Change; Cambridge University Press: New York, NY, USA, 2014. [Google Scholar]
- OECD. Achievements of Energy Efficiency Appliance and Equipment Standards and Labelling Programmes; OECD: Paris, France, 2021; ISBN 9789264719361. [Google Scholar]
- International Energy Agency. Available online: www.iea.org (accessed on 20 February 2022).
- Cabeza, L.F.; Ürge-Vorsatz, D.; Ürge, D.; Palacios, A.; Barreneche, C. Household appliances penetration and ownership trends in residential buildings. Renew. Sustain. Energy Rev. 2018, 98, 1–8. [Google Scholar] [CrossRef]
- Martín-Martín, A.; Orduna-Malea, E.; Thelwall, M.; Delgado López-Cózar, E. Google Scholar, Web of Science, and Scopus: A systematic comparison of citations in 252 subject categories. J. Informetr. 2018, 12, 1160–1177. [Google Scholar] [CrossRef] [Green Version]
- Van Eck, N.J.; Waltman, L. Software survey: VOSviewer, a computer program for bibliometric mapping. Scientometrics 2010, 84, 523–538. [Google Scholar] [CrossRef] [Green Version]
- IEA—International Energy Agency. IEA Regions. Available online: https://www.iea.org/countries (accessed on 24 February 2022).
- UN—United Nations. 2019 Revision of World Population Prospects; UN: New York, NY, USA, 2020. [Google Scholar]
- Putra, G.D.; Pratama, A.R.; Lazovik, A.; Aiello, M. Comparison of energy consumption in Wi-Fi and bluetooth communication in a Smart Building. In Proceedings of the 2017 IEEE 7th Annual Computing and Communication Workshop and Conference (CCWC), Las Vegas, NV, USA, 9–11 January 2017; pp. 1–6. [Google Scholar] [CrossRef]
- Sarrafzadeh Javadi, F.; Saidur, R. Thermodynamic and Energy Efficiency Analysis of a Domestic Refrigerator Using Al2O3 Nano-Refrigerant. Sustainability 2021, 13, 5659. [Google Scholar] [CrossRef]
- Kelényi, I.; Nurminen, J.K. Bursty content sharing mechanism for energy-limited mobile devices. In Proceedings of the 4th ACM Workshop on Performance Monitoring and Measurement of Heterogeneous Wireless and Wired Networks—PM2HW2N ’09, Tenerife, Spain, 26 October 2009; ACM Press: New York, NY, USA, 2009; pp. 216–223. [Google Scholar]
- Ou, Z.; Dong, S.; Dong, J.; Nurminen, J.K.; Ylä-Jääski, A.; Wang, R. Characterize energy impact of concurrent network-intensive applications on mobile platforms. In Proceedings of the 8th ACM International Workshop on Mobility in the Evolving Internet Architecture—MobiArch ’13, 4 October 2013; Miami, FL, USA; ACM Press: New York, NY, USA, 2013; p. 23. [Google Scholar]
- Ajina, A.; Sakthidharan, G.R.; Miskin, K.M. Study of Energy Efficient, Power Aware Routing Algorithm and Their Applications. In Proceedings of the 2010 Second International Conference on Machine Learning and Computing, Bangalore, India, 9–11 February 2010; pp. 288–291. [Google Scholar] [CrossRef]
- Xiang, S.; Tang, J.; Zhang, W. Energy-efficient collaborative sensing with mobile phones. In Proceedings of the 2012 Proceedings IEEE INFOCOM, Orlando, FL, USA, 25–30 March 2012; pp. 1916–1924. [Google Scholar] [CrossRef]
- Liu, X.; Yang, Q.; Luo, J.; Ding, B.; Zhang, S. An energy-aware offloading framework for edge-augmented mobile RFID systems. IEEE Internet Things J. 2019, 6, 3994–4004. [Google Scholar] [CrossRef]
- Arshad, R.; Zahoor, S.; Shah, M.A.; Wahid, A.; Yu, H. Green IoT: An investigation on energy saving practices for 2020 and beyond. IEEE Access 2017, 5, 15667–15681. [Google Scholar] [CrossRef]
- Iezzi, B.; Ankireddy, K.; Twiddy, J.; Losego, M.D.; Jur, J.S. Printed, metallic thermoelectric generators integrated with pipe insulation for powering wireless sensors. Appl. Energy 2017, 208, 758–765. [Google Scholar] [CrossRef]
- Das, R.B.; Bozdog, N.V.; Bal, H. Cowbird: A Flexible Cloud-Based Framework for Combining Smartphone Sensors and IoT. In Proceedings of the 2017 5th IEEE International Conference on Mobile Cloud Computing, Services, and Engineering (MobileCloud), San Francisco, CA, USA, 6–8 April 2017; pp. 1–8. [Google Scholar] [CrossRef]
- Wang, Y.; Moore, D.; Lennon, T.; Cooke, G.M. Fire Resistance of Steel-Framed Multi-Storey Buildings. In Advances in Steel Structures (ICASS ’96), Proceedings of the International Conference on Advances in Steel Structures, Hong Kong, China, 11–14 December 1996; Chan, S.L., Teng, J.G.B.T.-A., Eds.; Elsevier: Oxford, UK, 1996; pp. 287–293. ISBN 978-0-08-042830-7. [Google Scholar]
- Hausherr, C.; Petersen, S.; Hüls, W.; Albers, J. Primary energy efficiency potentials of district heat driven refrigeration systems. Energy Rep. 2021, 7, 79–87. [Google Scholar] [CrossRef]
- Zhang, Q.; Fu, L.; Li, L.; Di, H. The Energy Efficiency and Economic Feasibility Analysis of the Distributed Absorption Cooling Combined with District Heating System. In Proceedings of the ASME 2009 3rd International Conference on Energy Sustainability, San Francisco, CA, USA, 19–23 July 2009; Volume 2, pp. 49–55. [Google Scholar]
- Petersen, S.; Hausherr, C.; Hüls, W.; Paitazoglou, R.; Albers, J. Efficient absorption cooling for low district heating return temperatures. Energy Rep. 2021, 7, 88–96. [Google Scholar] [CrossRef]
- Pieper, H.; Kirs, T.; Krupenski, I.; Ledvanov, A.; Lepiksaar, K.; Volkova, A. Efficient use of heat from CHP distributed by district heating system in district cooling networks. Energy Rep. 2021, 7, 47–54. [Google Scholar] [CrossRef]
- Morales-Fuentes, A.; Ramírez-Hernández, H.G.; Méndez-Díaz, S.; Martínez-Martínez, S.; Sánchez-Cruz, F.A.; Silva-Romero, J.C.; García-Lara, H.D. Experimental study on the operating characteristics of a display refrigerator phasing out R134a to R1234yf. Int. J. Refrig. 2021, 130, 317–329. [Google Scholar] [CrossRef]
- Kasinathan, D.; Kumaresan, V. Study on the effect of inclusion of thermal energy storage unit in the energy performance of a household refrigerator. Heat Mass Transf. 2021, 57, 1753–1761. [Google Scholar] [CrossRef]
- Cui, Y.; Qiao, J.; Song, B.; Wang, X.; Yang, Z.; Li, H.; Dai, W. Experimental study of a free piston Stirling cooler with wound wire mesh regenerator. Energy 2021, 234, 121287. [Google Scholar] [CrossRef]
- Ward, D.O.; Clark, C.D.; Jensen, K.L.; Yen, S.T.; Russell, C.S. Factors influencing willingness-to-pay for the ENERGY STAR® label. Energy Policy 2011, 39, 1450–1458. [Google Scholar] [CrossRef]
- Buonomano, A.; Calise, F.; Palombo, A.; Vicidomini, M. Energy and economic analysis of geothermal–solar trigeneration systems: A case study for a hotel building in Ischia. Appl. Energy 2015, 138, 224–241. [Google Scholar] [CrossRef]
- Gao, C.; Wolff, S.; Wang, S. Eco-friendly additive manufacturing of metals: Energy efficiency and life cycle analysis. J. Manuf. Syst. 2021, 60, 459–472. [Google Scholar] [CrossRef]
- Giudice, F.; Barbagallo, R.; Fargione, G. A Design for Additive Manufacturing approach based on process energy efficiency: Electron beam melted components. J. Clean. Prod. 2021, 290, 125185. [Google Scholar] [CrossRef]
- Nguyen, N.D.; Ashraf, I.; Kim, W. Compact model for 3d printer energy estimation and practical energy-saving strategy. Electronics 2021, 10, 483. [Google Scholar] [CrossRef]
- Faure, C.; Guetlein, M.-C.; Schleich, J. Effects of rescaling the EU energy label on household preferences for top-rated appliances. Energy Policy 2021, 156, 112439. [Google Scholar] [CrossRef]
- Skourtos, M.; Damigos, D.; Tourkolias, C.; Kontogianni, A. Efficient energy labelling: The impact of information content and style on product choice. Energy Effic. 2021, 14, 58. [Google Scholar] [CrossRef]
- Mahlia, T.M.I.; Masjuki, H.H.; Saidur, R.; Amalina, M.A. Cost-benefit analysis of implementing minimum energy efficiency standards for household refrigerator-freezers in Malaysia. Energy Policy 2004, 32, 1819–1824. [Google Scholar] [CrossRef]
- Shen, J.; Saijo, T. Does an energy efficiency label alter consumers’ purchasing decisions? A latent class approach based on a stated choice experiment in Shanghai. J. Environ. Manag. 2009, 90, 3561–3573. [Google Scholar] [CrossRef]
- Energy Efficient End-use Equipment International Energy Agency. Achievements of Appliance Energy Efficiency Standards and Labelling Programs; A Global Assessment in 2016; IEA: Paris, France, 2016. [Google Scholar]
- Department of Energy US, Appliance and Equipment Energy Efficiency Standards. Available online: https://www.iea.org/policies/317-appliance-and-equipment-energy-efficiency-standards?region=NorthAmerica§or=Buildings&technology=Appliances&topic=Energy%20Efficiency&type=Codes%20and%20standards (accessed on 27 February 2022).
- Government of Canada, Energy Efficiency Regulations. Available online: https://www.nrcan.gc.ca/energy-efficiency/energy-efficiency-regulations/6845 (accessed on 27 February 2022).
- Energy Star. Available online: https://www.energystar.gov/ (accessed on 2 March 2022).
- United States. Appliance and Equipment Standards Program. Available online: https://www.energy.gov/eere/buildings/appliance-and-equipment-standards-program (accessed on 20 February 2022).
- France Existing Buildings Programmes. Available online: https://www.iea.org/policies/847-existing-buildings-programmes?page=22®ion=Europe§or=Buildings&topic=Energy%20Efficiency (accessed on 27 February 2022).
- IEA. Spain Labelling and Information on Energy Consumption of Domestic Use Equipment; IEA: Paris, France, 1994. [Google Scholar]
- IEA—International Energy Agency. IEA Policies Database. Available online: https://www.iea.org/policies?qs=ger&technology=Appliances®ion=MiddleEast (accessed on 2 March 2022).


| Appliance Type | Total (EJ) | Drivers | ||
|---|---|---|---|---|
| Activity (EJ) | Structure (EJ) | Efficiency (EJ) | ||
| Appliances | +4.6 | +3.5 | +1.6 | −0.5 |
| Refrigerator | +0.2 | +0.7 | +0.1 | −0.6 |
| Freezer | 0.0 | +0.1 | 0.0 | −0.1 |
| Dishwasher | +0.1 | +0.1 | 0.0 | 0.0 |
| Washing machine | +0.1 | +0.2 | 0.0 | −0.1 |
| Clothes dryer | +0.1 | 0.1 | 0.0 | −0.1 |
| Television | −0.4 | +0.6 | +0.4 | −1.4 |
| Plug loads | +3.6 | +1.7 | +2.1 | 0.0 |
| White Goods | Brown Goods | Small Appliances | |
|---|---|---|---|
| Refrigerator | Television | Microwave oven | |
| Freezer | Video recorder | Coffee maker | |
| Fridge-freezer | Laptop | Vacuum cleaner | |
| Washing machine | Wet appliances | Desktop | Electric mixer/Hand blender |
| Clothes dryer | Phone | Rice cooker | |
| Dryer machine | Record player | Kitchen robot | |
| Dishwasher | DVD | Hairdryer | |
| Oven | Media center | Electric toothbrush | |
| Cooker | Media player | Towel drying rack/Towel dryer | |
| Gas hob/Gas cooker | Printer | Toaster | |
| Electric hob/Electric cooker | 3D-printer/3D printing | Electric fan | |
| Kitchen smoke extractor | Console/Games machine | Ceiling fan | |
| Tablet | Portable fan | ||
| Consumer electronic | |||
| Author | Institution | Country | Number Documents Search | Number Doc Total | h-Index Total |
|---|---|---|---|---|---|
| R. Saidur | Sunway University | Malaysia | 12 | 577 | 95 |
| J.K. Nurminen | VTT Technical Research Centre of Finland | Finland | 11 | 127 | 25 |
| H.H. Masjuki | University of Malaya | Malaysia | 10 | 510 | 97 |
| R.K. Radermacher | A. James Clark School of Engineering | United States | 10 | 359 | 48 |
| U. Sharma | Indian Institute of Technology Delhi | India | 9 | 65 | 10 |
| T.M.I. Mahlia | University of Technology Sydney | Australia | 8 | 361 | 67 |
| I. Kelényi | Budapest University of Technology and Economics | Hungary | 8 | 25 | 9 |
| B. Singh | Indian Institute of Technology Delhi | India | 7 | 2168 | 72 |
| Z. Wei | Tongji University | China | 7 | 49 | 11 |
| Y. Amano | 6 | 135 | 14 |
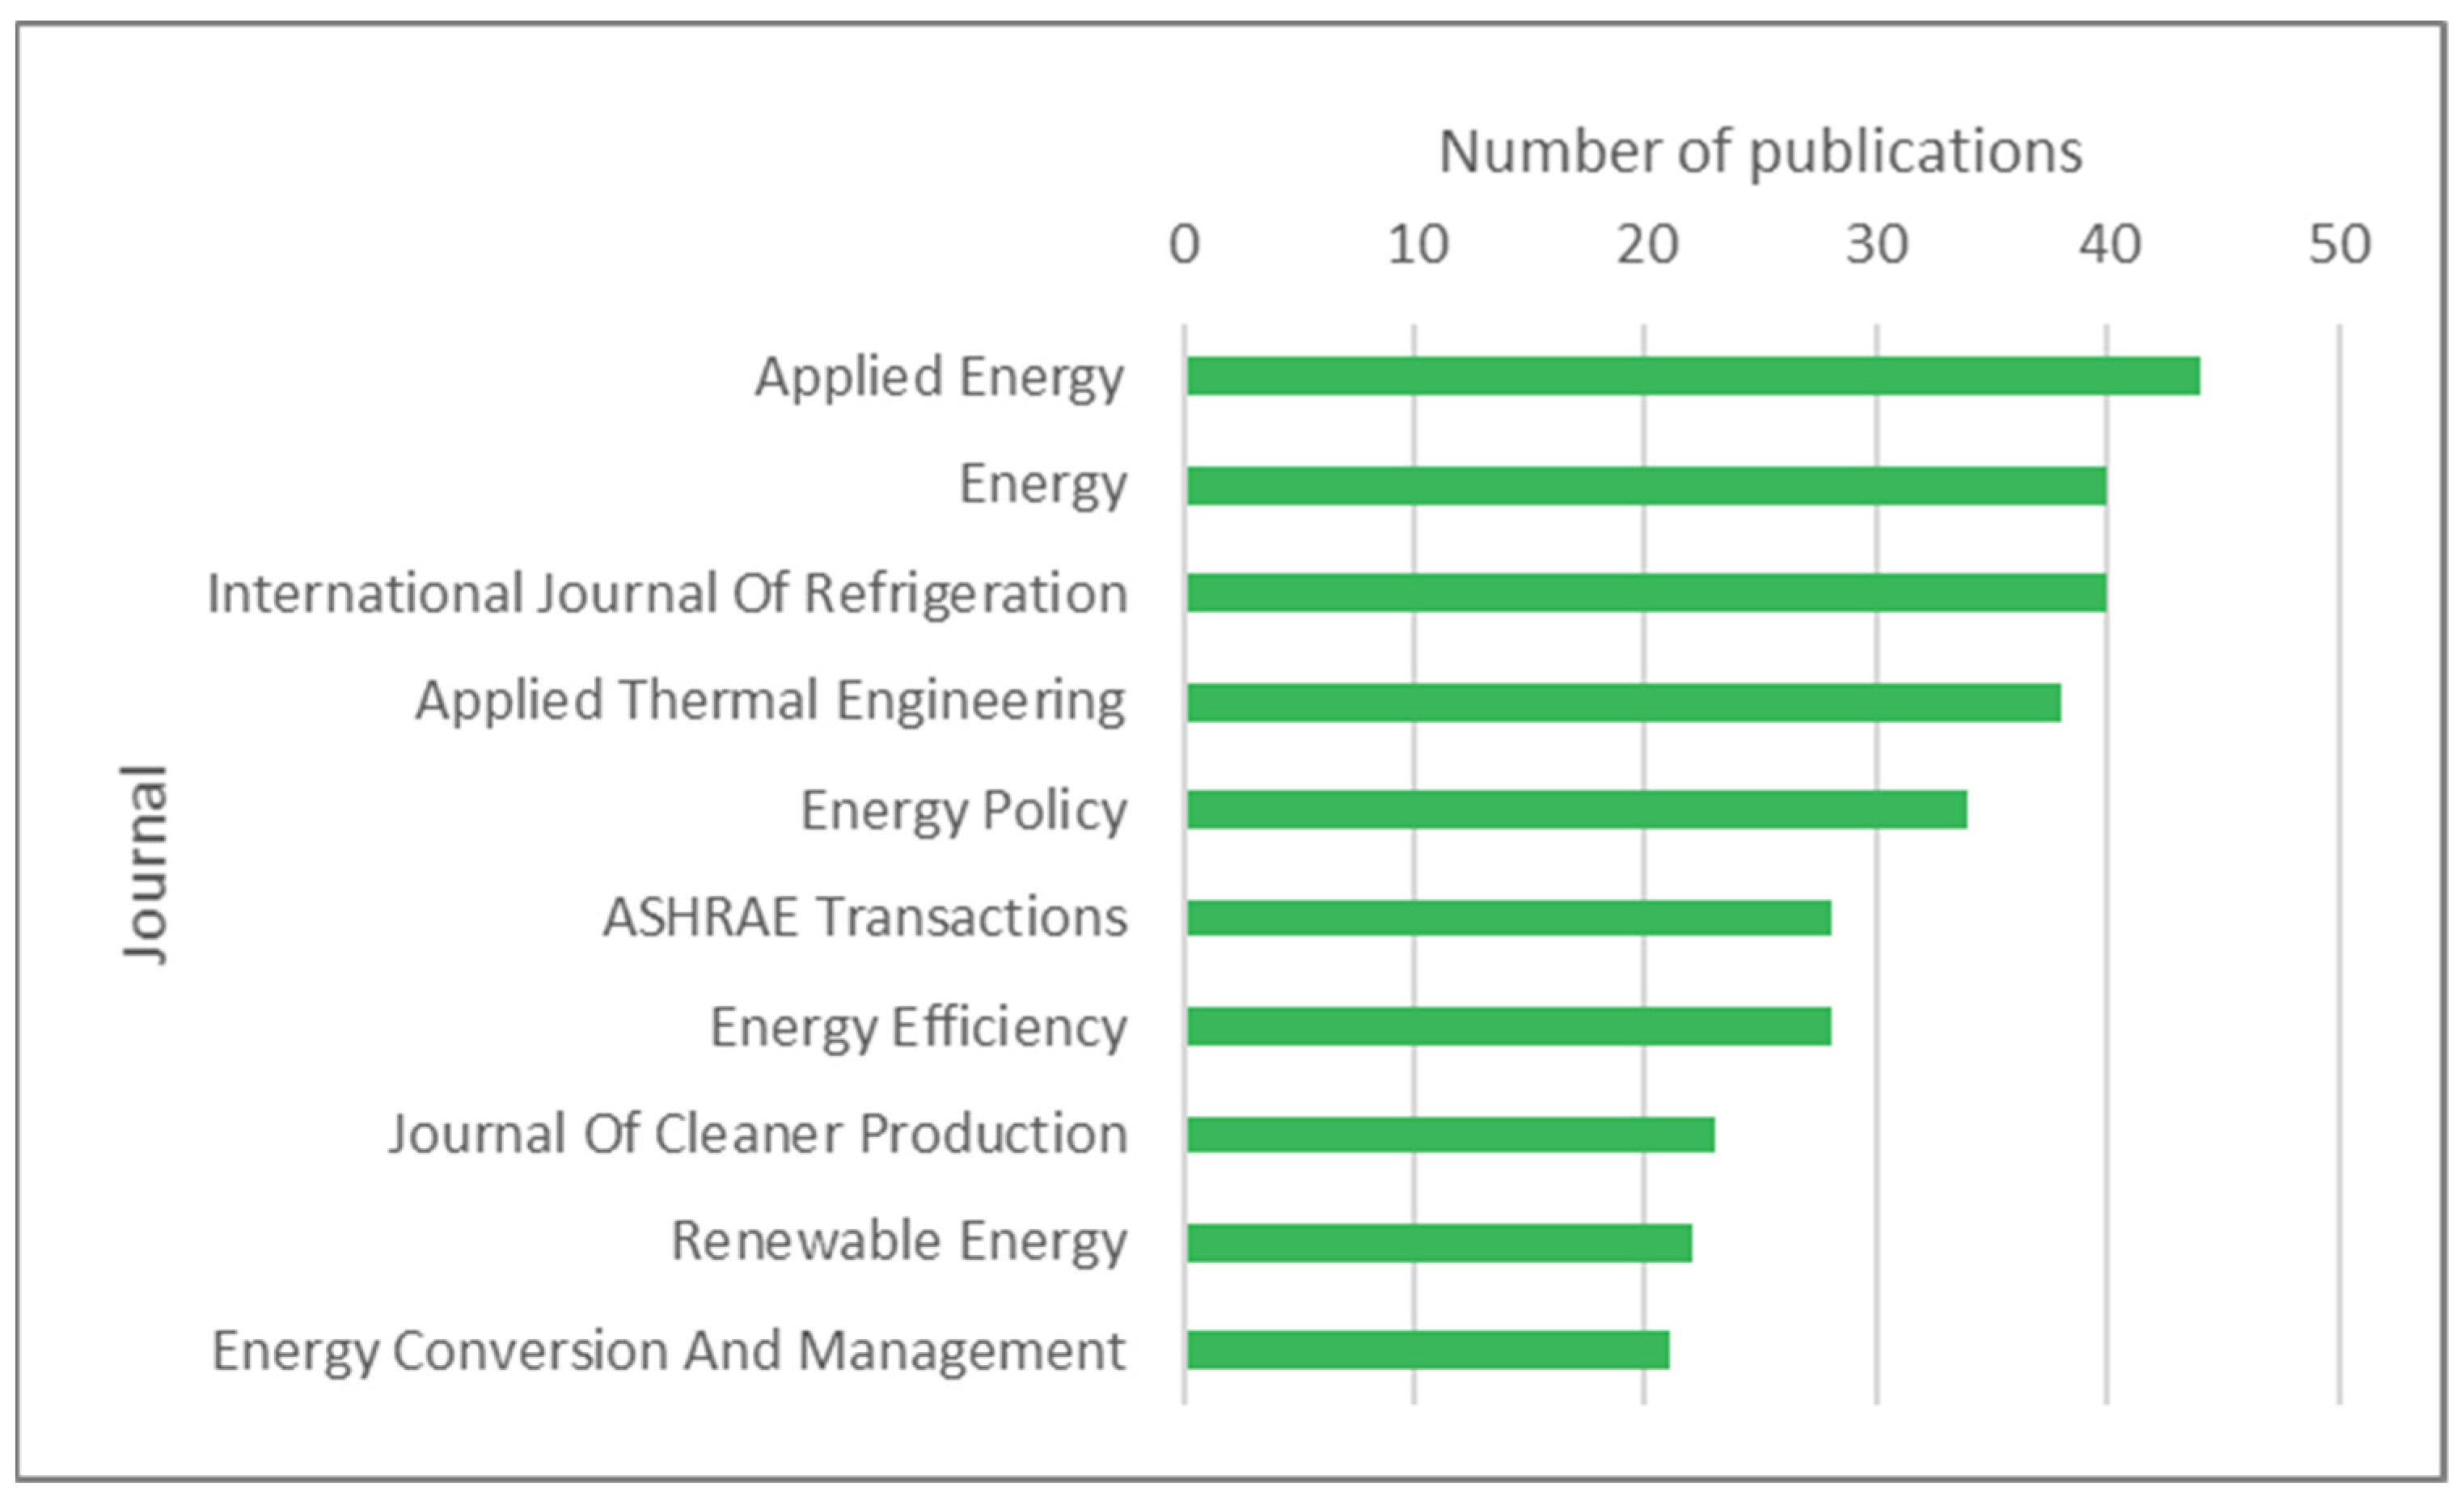
| Journal | Number Documents Search | Total h-Index (2022) | Category | Open Access |
|---|---|---|---|---|
| Applied Energy | 51 | 9.746 | Q1 | No |
| Energy | 39 | 7.147 | Q1 | No |
| International Journal of Refrigeration | 21 | 3.629 | Q1 | No |
| Applied Thermal Engineering | 38 | 5.295 | Q1 | No |
| Energy Policy | 95 | 6.142 | Q1 | No |
| ASHRAE Transactions | 23 | --- | --- | No |
| Energy Efficiency | 51 | 2.574 | Q2 | No |
| Journal of Cleaner Production | 24 | 9.297 | Q1 | No |
| Renewable Energy | 22 | 8.001 | Q1 | No |
| Energy conversion and management | 21 | 9.709 | Q1 | No |
Publisher’s Note: MDPI stays neutral with regard to jurisdictional claims in published maps and institutional affiliations. |
© 2022 by the authors. Licensee MDPI, Basel, Switzerland. This article is an open access article distributed under the terms and conditions of the Creative Commons Attribution (CC BY) license (https://creativecommons.org/licenses/by/4.0/).
Share and Cite
Vérez, D.; Borri, E.; Cabeza, L.F. Trends in Research on Energy Efficiency in Appliances and Correlations with Energy Policies. Energies 2022, 15, 3047. https://doi.org/10.3390/en15093047
Vérez D, Borri E, Cabeza LF. Trends in Research on Energy Efficiency in Appliances and Correlations with Energy Policies. Energies. 2022; 15(9):3047. https://doi.org/10.3390/en15093047
Chicago/Turabian StyleVérez, David, Emiliano Borri, and Luisa F. Cabeza. 2022. "Trends in Research on Energy Efficiency in Appliances and Correlations with Energy Policies" Energies 15, no. 9: 3047. https://doi.org/10.3390/en15093047
APA StyleVérez, D., Borri, E., & Cabeza, L. F. (2022). Trends in Research on Energy Efficiency in Appliances and Correlations with Energy Policies. Energies, 15(9), 3047. https://doi.org/10.3390/en15093047