Article

Sieving and Covering of Wood Chips Improves Storability

1
Department of Forest Biomaterials and Technology, Swedish University of Agricultural Science, Forest Biomaterials and Technology, SE-901-83 Umeå, Sweden
2
Natural Resources Institute Finland (Luke), Yliopistokatu 6B, 80100 Joensuu, Finland
3
The Forestry Research Institute of Sweden, Uppsala Science Park, SE-751-83 Uppsala, Sweden
*
Author to whom correspondence should be addressed.
Energies 2022, 15(8), 2953; https://doi.org/10.3390/en15082953
Submission received: 25 March 2022 / Revised: 11 April 2022 / Accepted: 14 April 2022 / Published: 18 April 2022

Abstract

:
Minimising dry matter losses during storage of comminuted forest fuels is desirable from both an economic and a sustainability perspective. This study examined fuel quality and amount of recovered energy during the storage of forest wood chips stored at full industrial scale at three locations, and the effect of sieving and covering piles with a water-resistant, vapour-permeable fabric. Sieving wood chips before storage, that is, reducing the number of fines smaller than 8 mm, reduced the cumulative dry matter losses to <2%, while cumulative dry matter losses after storage for 4–6 months using current practices, that is, unsieved and uncovered, reached 10.6%. The combined effect of storage management led to a value loss of 11.5%, while both covering and sieving led to lower losses, with the combination of sieving and covering giving a 1.3% value increase, and thus, increased storability.

1. Introduction

The use of forest residues and forest industry byproducts for heat and power generation has substantially contributed to the developing transition to a fossil fuel-free society in Sweden and Finland. Storage of solid biofuels intended for heat and power is an essential step within the supply chain to secure the supply of fuels, as there is an irregular seasonal demand for energy [1]. Both logistic and economic considerations influence storage methods and location within the supply chain. On the one hand, transport and comminution affect supply chain costs [2,3], but the uneven demand leads to inefficient equipment utilisation. On the other hand, more efficient equipment use increases storage capacity requirements for comminuted fuels.
In general, forest residues (LR) dry during storage [4,5,6], leading to lower moisture content (M), and increased net calorific value (Q). This is valid also for compacted residues [7,8]. Drying of stacked residues can be improved if the stacks are covered [4,9,10]. Storage of comminuted LR is associated with increased risks for extensive dry matter loss (DML) due to the degradation of biomass and spontaneous ignition caused by biological and chemical processes leading to self-heating [11]. DML of around 1–4% per month has been reported for comminuted LR of coniferous species [12,13,14] in Sweden and Finland. Similar DML rates were found in our earlier large-scale trials of coniferous fuel chips [15,16,17]. Their DML is similar to the result for coniferous wood chips stored in Germany [18], but not for poplar chips [19,20]. Poplar also has high rates of dry matter loss in Italian studies [21,22,23]. Dry matter losses seem to be generally higher for the storage of deciduous wood chips [24,25,26]. Initial fuel properties, such as M, readily available nutrients, particle size distribution and chip size and storage conditions such as pile properties (pile height, pile shape and degree of compaction) all affect the biological activity in storage piles [12]. The biomass, M, directly affects the conditions for biological degradation during storage [27], so methods that accelerate the natural drying process are highly desirable. The activity within piles that leads to dry matter losses can be reduced by using a semi-permeable cover that protects the fuel against rewetting and, at the same time, allows for heat transfer and water vapour dissipation to the atmosphere [14,16,28]. The degradation process can also be reduced by increasing the target chip size in the chippers; sieving off fine particles results in significantly lower DML [21,29,30].
The objective of this study was to evaluate sieving and covering as methods to increase the storability of wood fuel chips, regarding fuel quality, DML, and energy content, during full-scale long-term storage under industrial conditions.

2. Materials and Methods

2.1. Material and Storage Locations

Storage trials were carried out at three terminals (blocks) in Sweden: Norrsundet (60°56′ N; 17°9′ E) (block 1), Älvsbyn (65°40′ N; 20°58′ E) (block 2) and Mora (60°58′ N; 14°31′ E) (block 3). The trial was carried out from September 2019 to February 2020 in block 1, from May 2020 to August 2020 in block 2 and from May 2020 to August 2020 in block 3. Wood chips, produced from stored LR from cuttings of predominantly Norway spruce (Picea abies (L.) H. Karst), were used at all blocks. In block 1 and block 3, comminution was coordinated with the construction of storage piles; in block 2, residues were comminuted before the field trial and thus were pre-stored. The main size fraction of the stored chips was in the range 3.15 mm to 45 mm and the distribution of fines (<3.15 mm) varied (Figure 1).
The chips were produced with a chipper and then screened into different qualities using Backers star screens (Backers, Twist, Germany) in block 1 and block 3 and a Maskin Mekano Lv 302 T3 vibrating screen (Maskin Mekano, Jönköping, Sweden) in block 2. Fines were separated using sieving decks that separated 8 mm grain size in block 3 and 8 mm and 10 mm in block 1. In block 2, a 15 × 15 mm mesh size screen was used. The sieving operation took place on the same days as the establishment of the storage trials; sieving performance is described in [31]. The sieving operation reduced the variations in chip size distribution, and significant differences between study sites could only be found for the fines. Chip size distributions were analysed with a generalised linear model (GLIMMIX) in SAS using a logit link function on chip size proportions (S) using the factors’ Site’ and ‘Chip size class’ (Equation (1)). The use of the logit link is necessary since it transforms the primary range of proportions (S) from the interval [0,1] into the interval [−∞, ∞], assuming normal distribution. The test criteria are the interaction of ‘Chip size class’ with ‘Site location’ (Site Location × Chip size class) and so, if the effect of ‘Chip size class’ is found to be independent of the interactive factor ‘Site location’, it can be assumed that site does not affect chip size distribution [32].
Logit S = Study site + Chip size_class + Study site × Chip size_class + ε.

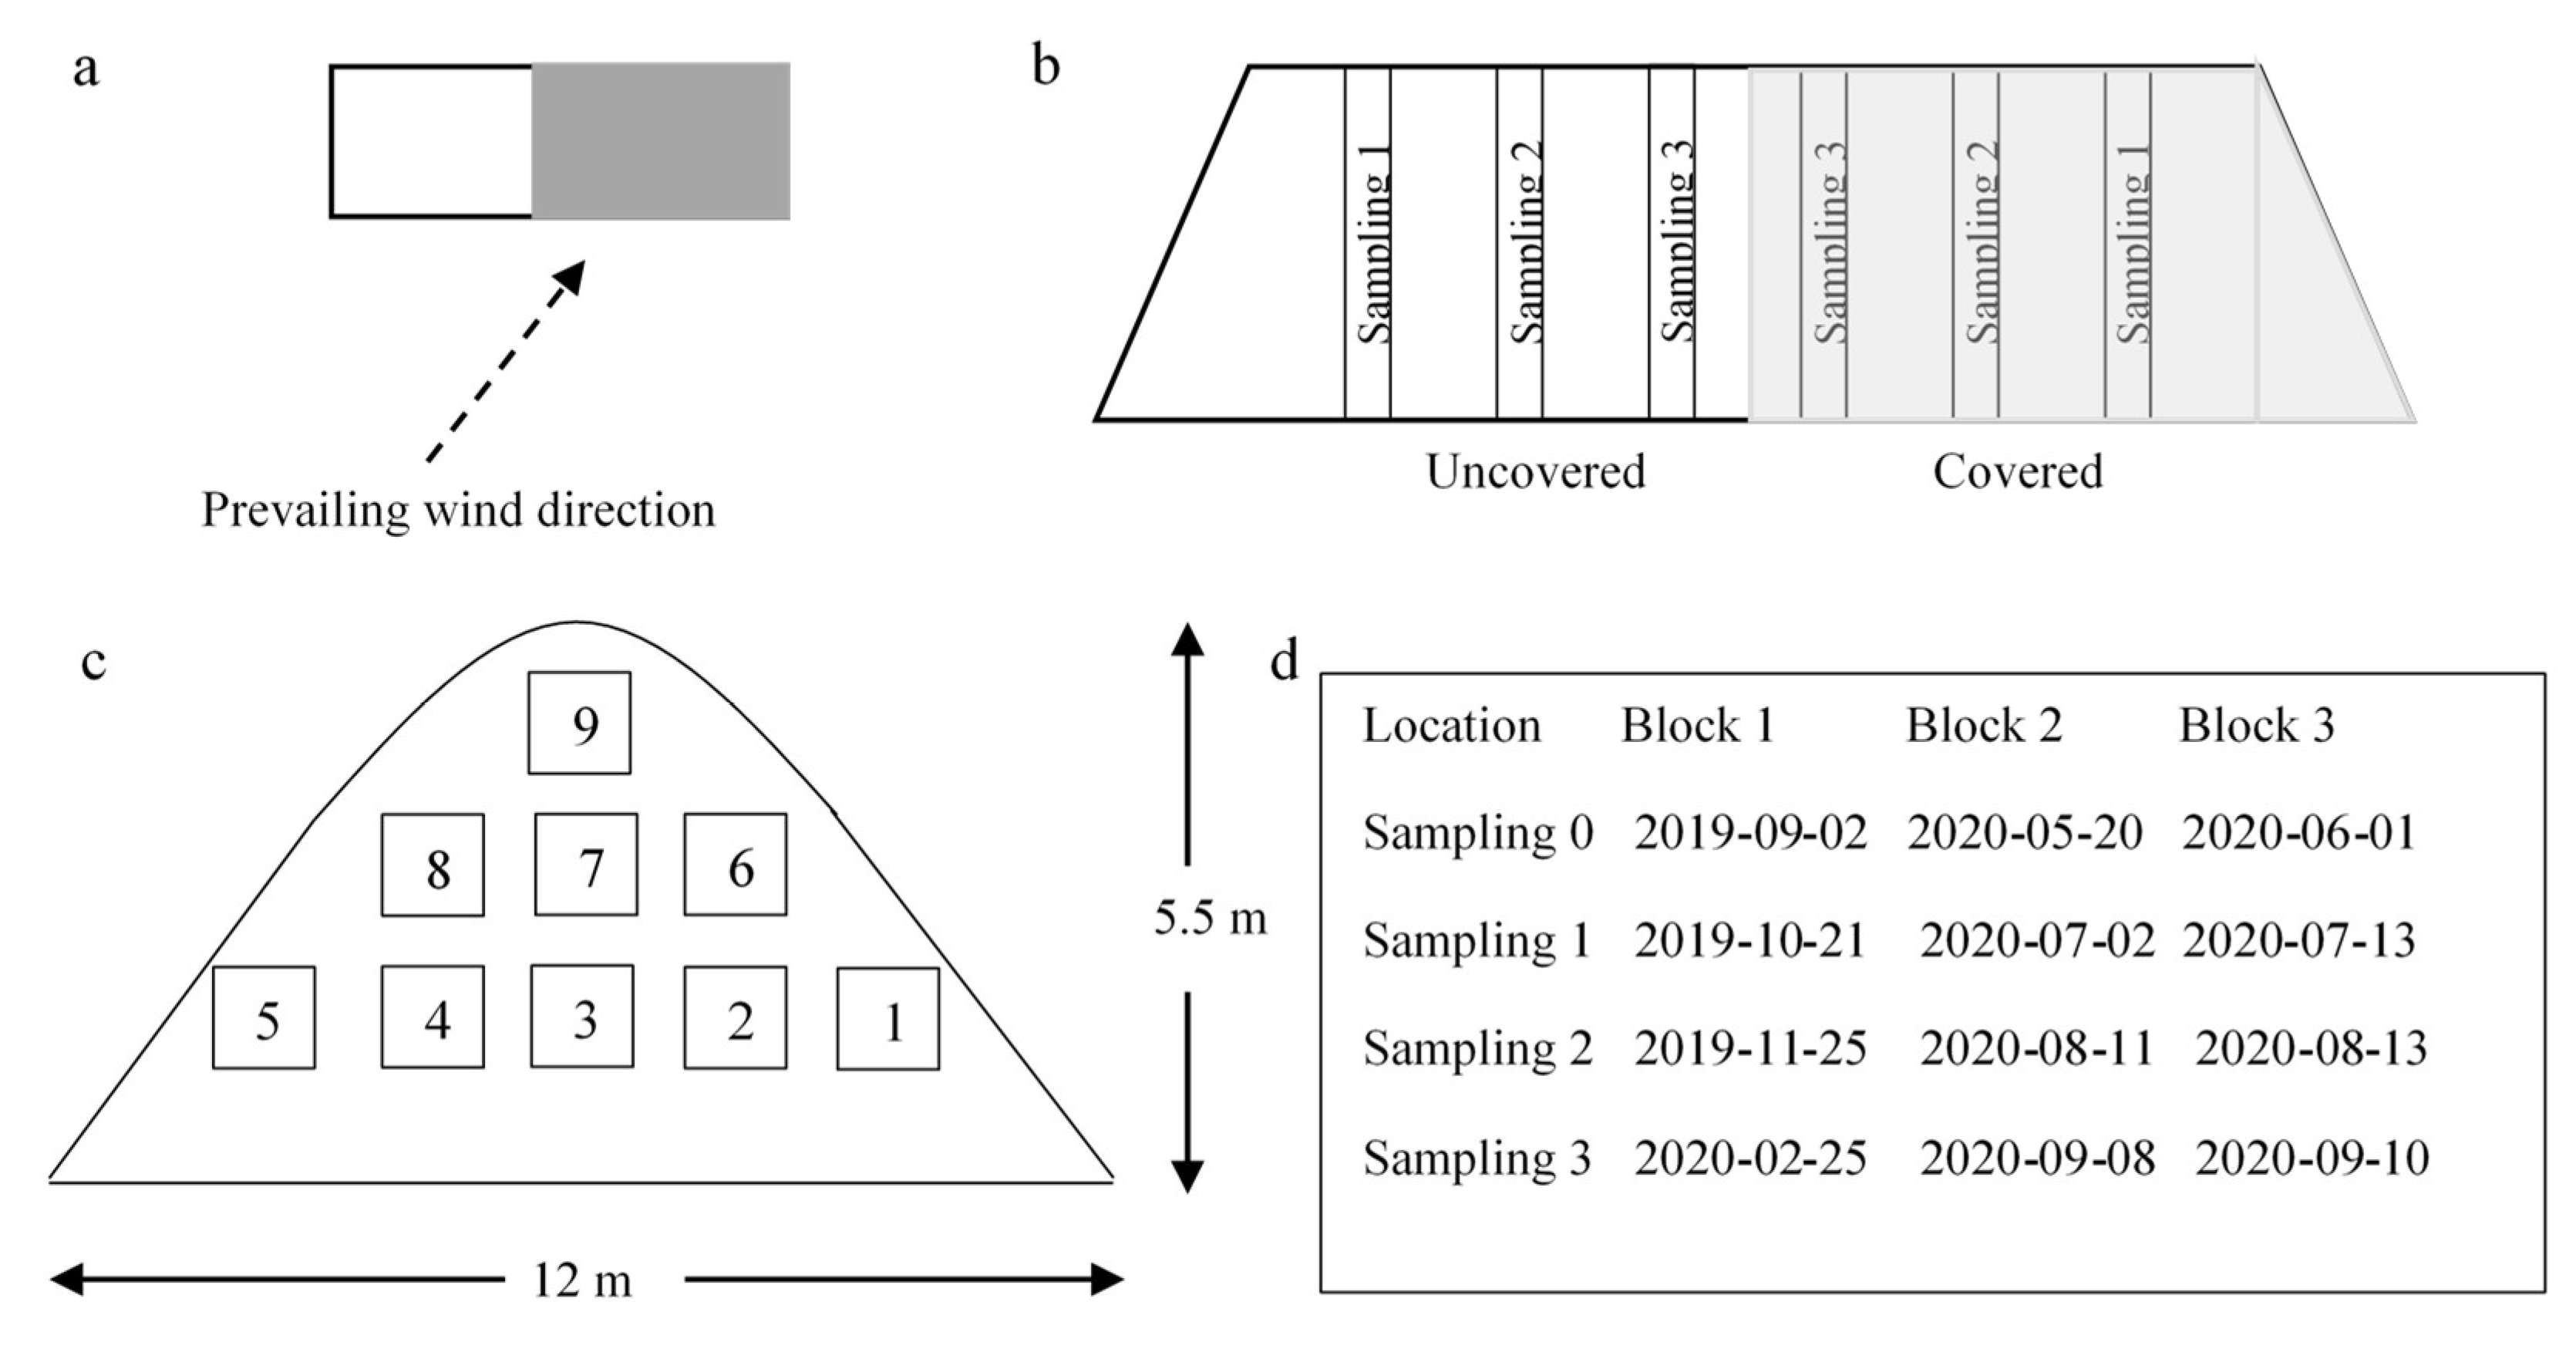
2.2. Field Trial Structure and Sampling

The experimental setup consisted of three blocks (locations) and four treatments: unsieved/sieved and uncovered/covered. Two separate triangular-shaped piles were constructed with wheel loaders at each block on paved surfaces, one with sieved chips and one with unsieved. The pile height (5.5 m) and base (12.0 m) were identical at each location, but the length varied. The total volume of each pile (Table 1) was calculated with photogrammetry (Agrifoft Metashape, Agisoft LCC, St. Petersburg, Russia) from pictures taken with a drone (DJI Mavic 2 pro). The estimated pile volumes were confirmed by reference measurement of objects with known volumes to a precision better than 99.9% and an accuracy of 0.1 m3.
The piles were oriented with their longest side perpendicular to the prevailing wind direction, which also maximised sun exposure of the piles over the storage period (Figure 2a). During the experiment, one half of each pile (shown in grey in Figure 2b) was covered with a semi-permeable material, Toptex®, with a specific weight of 200 g m−2, while the other half was left uncovered as a control (Figure 2b). Each half was divided into three vertical sectors (Figure 2b) containing sample points (Figure 2c). During the construction of the stacks, a general sample (10 L) was collected at each sampling point. Half of this sampled material was saved for further analysis of the initial characteristics of wood chips, while the other half was placed into net bags (2.8 mm mesh size), weighed (0.0 g accuracy), and then returned to the stacks. All samples were evenly distributed between the sampling points, with an approximate distance of 1.5 m between sampling bags, as shown in Figure 2c. Each zone within the piles contained nine samples. The temperature within piles in sectors, labelled Sampling 3 (Figure 2b), was monitored using TinyTags (TGP-4500, intab, Stenkullen, Sweden) with a sampling rate of 1 h at 3.0 m and 4.5 m height, at sampling points 7 and 9 respectively (Figure 2c.).
Initial and changed fuel characteristics, based on M (% w.b), gross calorific value (MJkg−1, d.b), net calorific value (MJkg−1 w.b, Q) and particle size distribution, were determined using standard procedures (Table 2). At the same time, DML expressed as mass loss (%) on a dry weight basis was calculated from the net bag samples. During resampling, samples from exposed sections (Figure 2b) were collected as shown in Figure 2d, and the section was immediately restored.
The determined M, Q and DML were used to calculate available energy, expressed as recovered energy (Er). The Er was calculated as:
E r = ( 1 0.01   D M L ) ( 1 0.01   M )     Q
where Er is recovered energy per initial mass, DML is defined as the relative proportion of initial mass, M is moisture content on a wet weight basis and Q is net calorific value on a wet basis. Thus, the effect of storage on Er can be calculated as the difference between Er after storage divided by Er before storage.

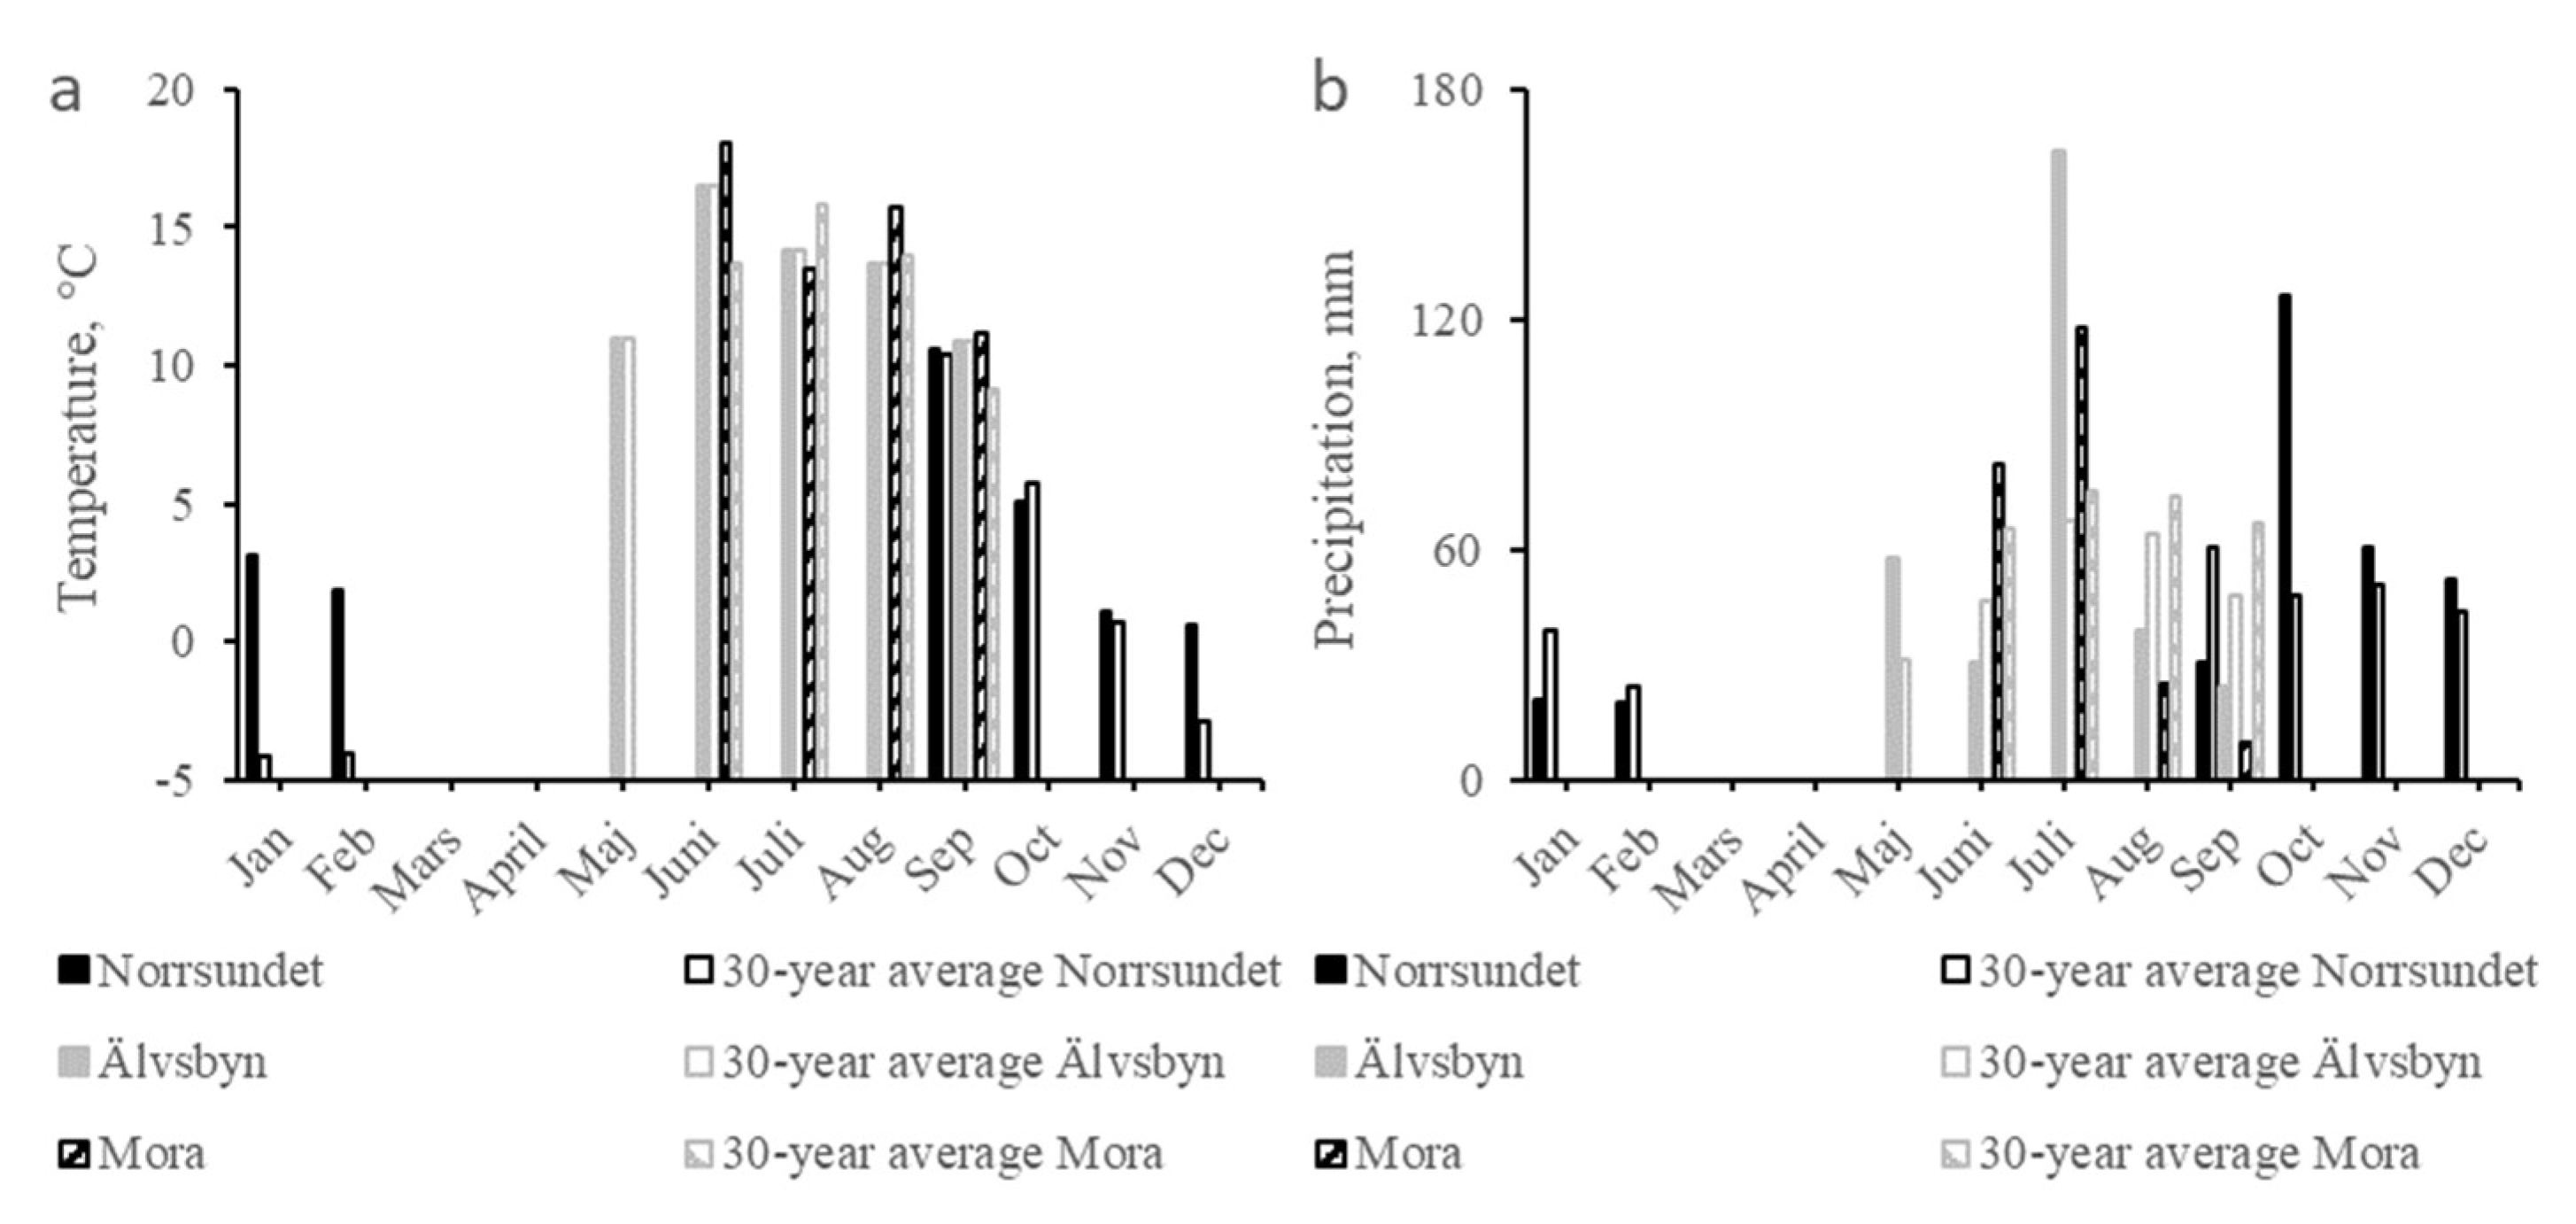
2.3. Meteorological Data for the Storage Sites

Throughout the storage period, meteorological data, including measurements of temperature and precipitation, and historical data (30-year averages) for local weather conditions were obtained from the nearby Swedish Meteorological and Hydrological Institute (SMHI) weather stations at Gävle (60°42′ N; 17°9′ E), Älvsbyn (65°40′ N; 21°3′ E) and Mora (60°57′ N; 14°30′ E).
In general, differences between the monitored average monthly ambient temperature and the 30 year average value obtained from SMHI were small, except during December to February in block 1, where the ambient temperature was 5–7 °C higher than the average (Figure 3a). The cumulative precipitation during the storage trials was 310 mm, 315 mm and 235 mm in blocks 1–3, respectively, which corresponds to a difference of 16%, 22% and −17% compared to the average amount of precipitation (Figure 3b). Higher than average levels of precipitation occurred during July (between samplings 1–3) in block 2 (+141%) and block 3 (+56%), and in October for block 1 between samplings 1 and 2 (+163%) (Figure 3b).

2.4. Statistical Analysis

The experiment was designed as a randomised factorial experiment. Analysis of variance (ANOVA) was carried out using a general linear model (GLM) followed by Tukey’s highly significant difference (HSD) test. The dependent variables (M, Q, DML and recovered energy) were analysed for each factor: block, sieved/unsieved, covered/uncovered and storage duration. All analyses were carried out using STATISTICA v.10 (StatSoft, Hamburg, Germany), and differences between factors and interactions were considered significant at p ≤ 0.05.

3. Results

3.1. Temperature Development within Piles

The average temperature within all piles increased from ambient to above 40 °C within the first seven days of storage. After that, the storage conditions for the different treatments led to significant differences in temperature development (Figure 4). In general, the average temperature in sieved piles did not exceed 40 °C after 14 days of storage, while the average temperature was significantly higher in unsieved piles. These differences persisted over the whole storage period. There was also a clear difference in temperature between uncovered and covered material, except for sieved chips stored in block 3. In addition, the temperature at 4.5 m increased linked to precipitation when stored following the reference method.
After 30 days of storage, the cumulative sum of the daily average temperature (Tsum) in the uncovered reference piles reached 1868 °C in block 1 and 1718 °C in block 3. During the same period, the Tsum in sieved and covered wood chips reached 411 °C in block 1 and 930 °C in block 3. At the end of the storage trial, the Tsum in chip piles, stored following the reference method, reached 10,162 °C in block 1 and 5698 °C in block 3, while during the same period, the Tsum in sieved and covered material reached 829 °C in block 1 and 2155 °C in block 3. Notably, the temperature at 3.0 m and 4.5 m heights was periodically below 0 °C in the sieved and covered material stored at the terminal in block 1.

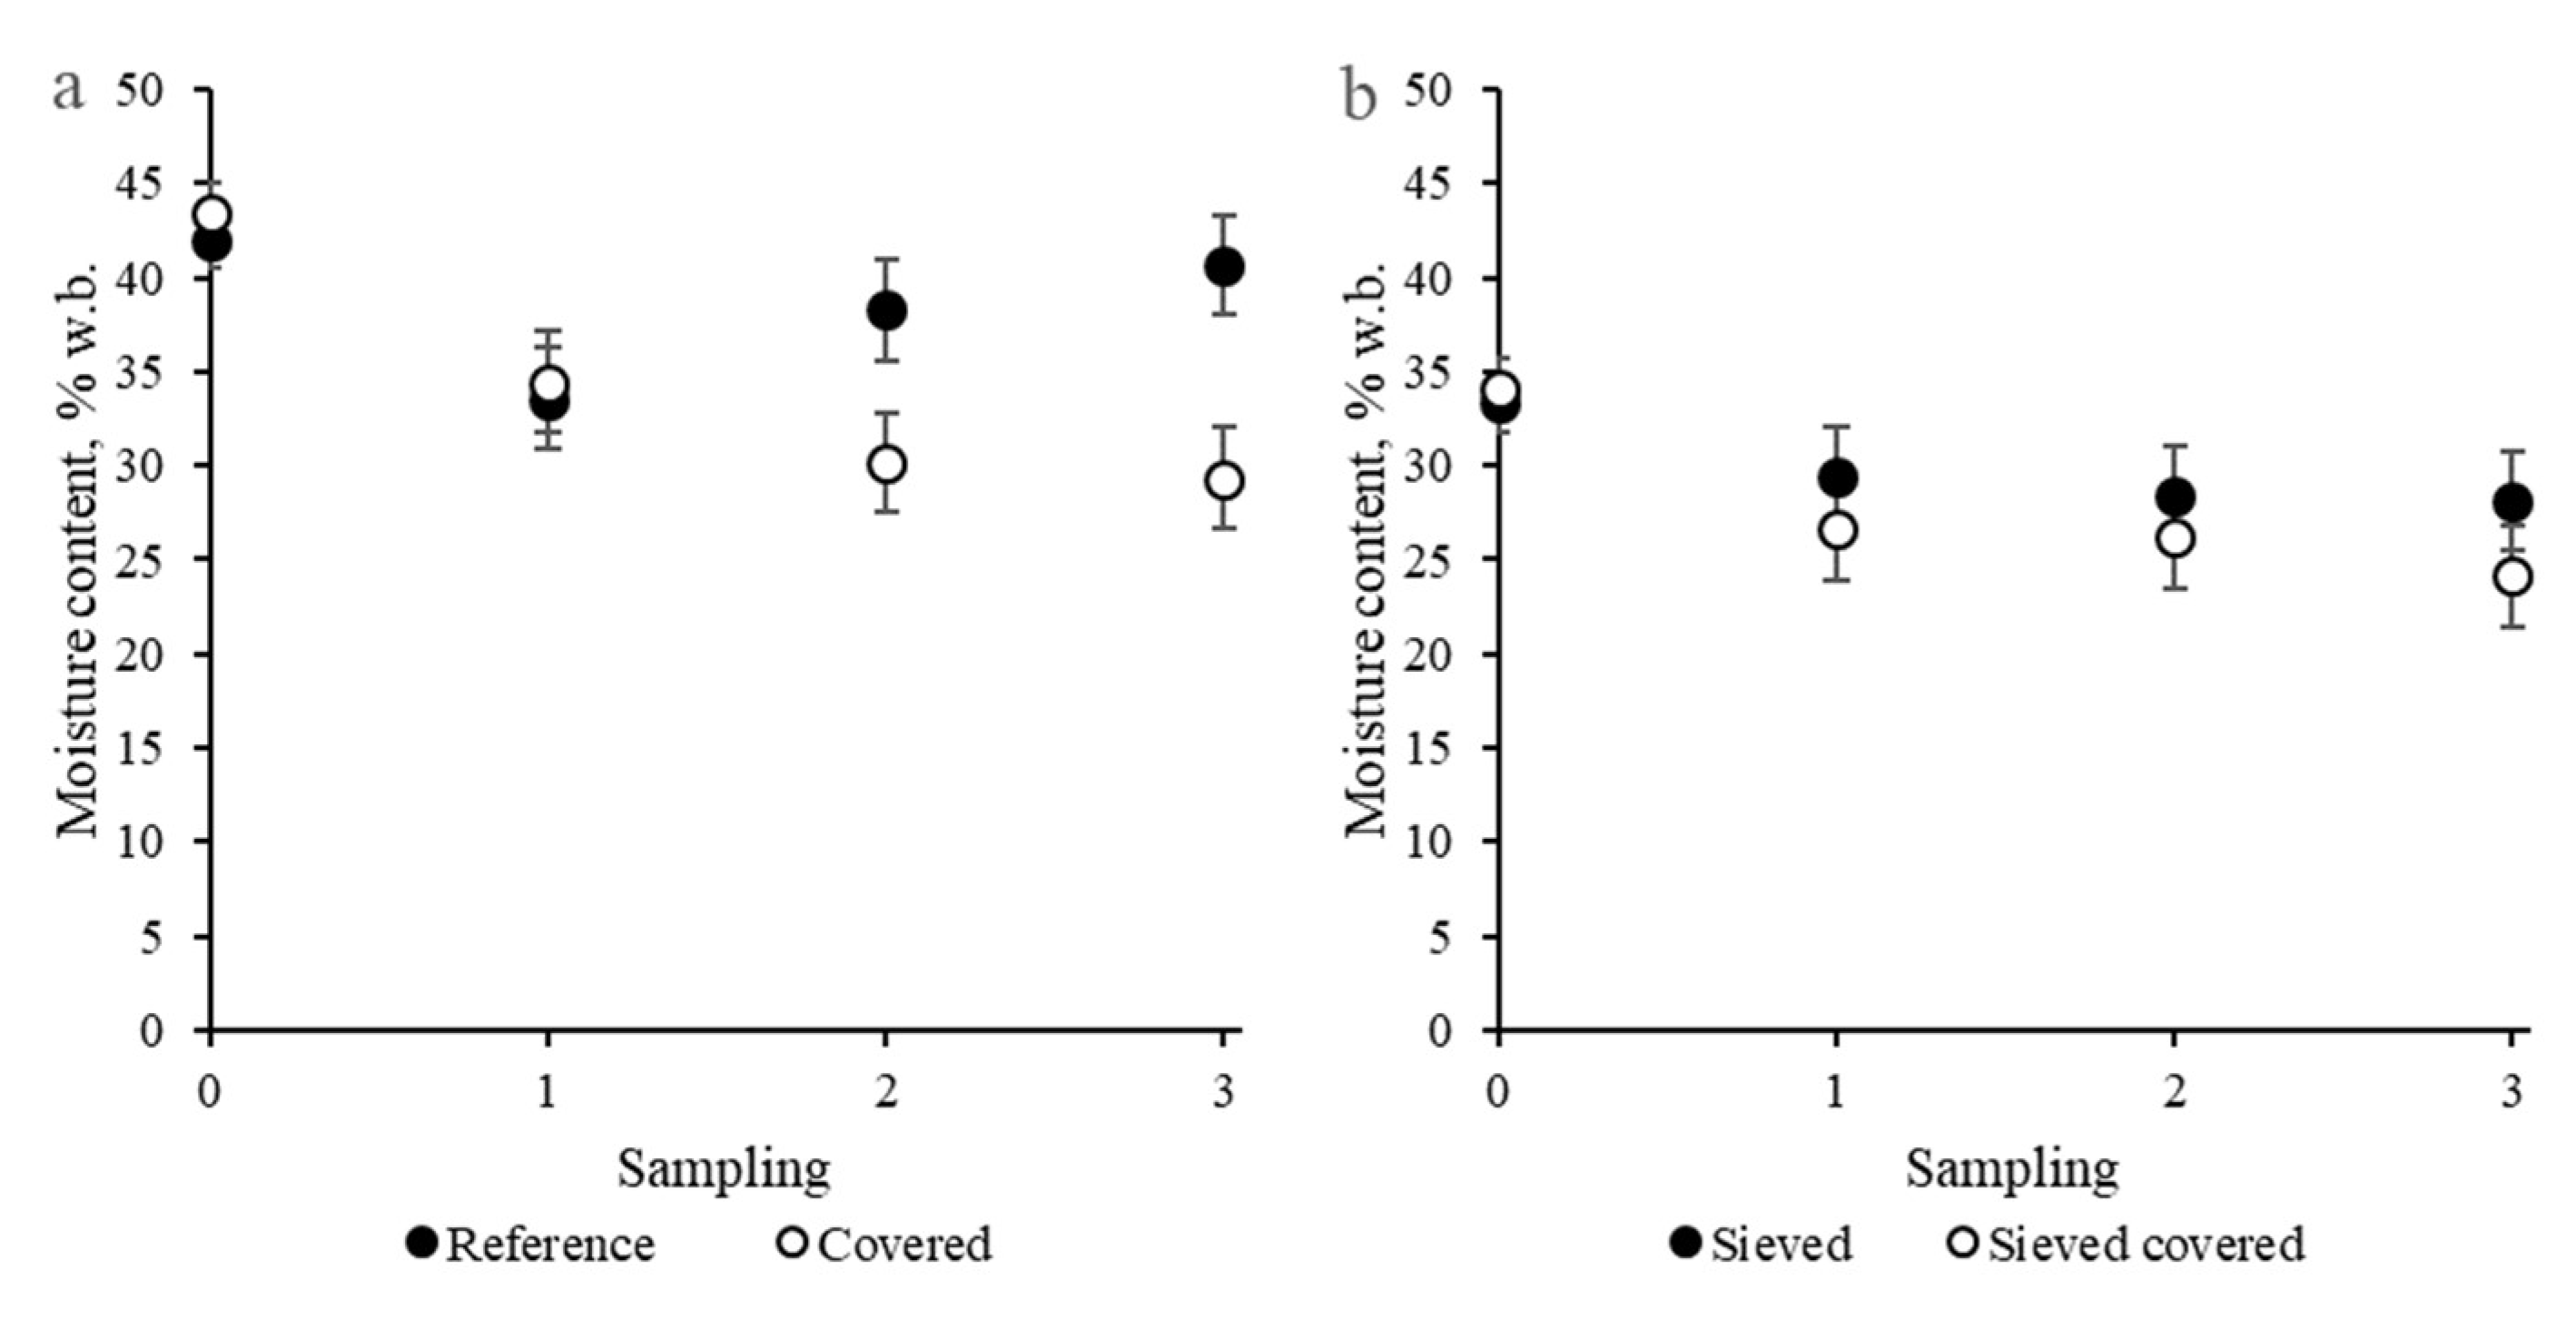
3.2. Moisture Content (M)

Sieving of the produced chips entailed homogenisation and reduced the initial M from 44.73% ± 5.54 (SD) to 33.42% ± 3.64 (SD), and from 44.05% ± 9.56 (SD) to 26.59% ± 3.91 (SD) in block 1 and block 2, respectively. However, sieving of the pre-stored chips in block 2, where the initial M of unsieved chips was 39.25% ± 2.74 (SD), did not affect the initial M of 40.22 ± 3.17 (SD) in sieved chips. The effect of blocks showed a significant (p < 0.01) effect on the difference (D) between initial M and M after storage (Table 3). The average M decreased in all treatments during the first 42–49 days of storage, except in block 1, where uncovered piles were rewetted by precipitation and reached 58.9% at sampling point 9. The uncovered chips showed lower D than covered, irrespective of whether they had been sieved or not. With an additional cover, the unsieved showed greater D than the sieved.
At resampling event 2, after 73–84 days of storage, there was an 8% difference in average M between unsieved and sieved piles. The M in uncovered reference piles increased during the rainy period in July (Figure 2b), while the M in covered piles decreased (Figure 5). Additional storage neither increased the average M in unsieved piles nor decreased the average M in sieved piles within the treatment.

3.3. Dry Matter Loss (DML)

There was a significant (p < 0.01) block effect on DML and, in general, the DML of pre-stored chips was higher in block 2 compared to the other locations. However, all blocks showed the same significant (p < 0.01) pattern between treatments. Storage of sieved wood chips in uncovered piles for 42–47 days resulted in an average DML of 1.22% ± 0.51 SD when stored in uncovered piles, while the average DML in piles stored according to the reference method was 5.37% ± 1.19 SD (Table 4). Further storage increased the difference between the uncovered treatments which, at the end of the storage trial, resulted in a cumulative DML of 1.47% ± 0.80 SD and 10.63% ± 1.99 SD for sieved and unsieved chips, respectively. In general, the additional use of a cover led to lower DML during storage, but the effect of covering on DML was only significant (p < 0.01) for unsieved chips.

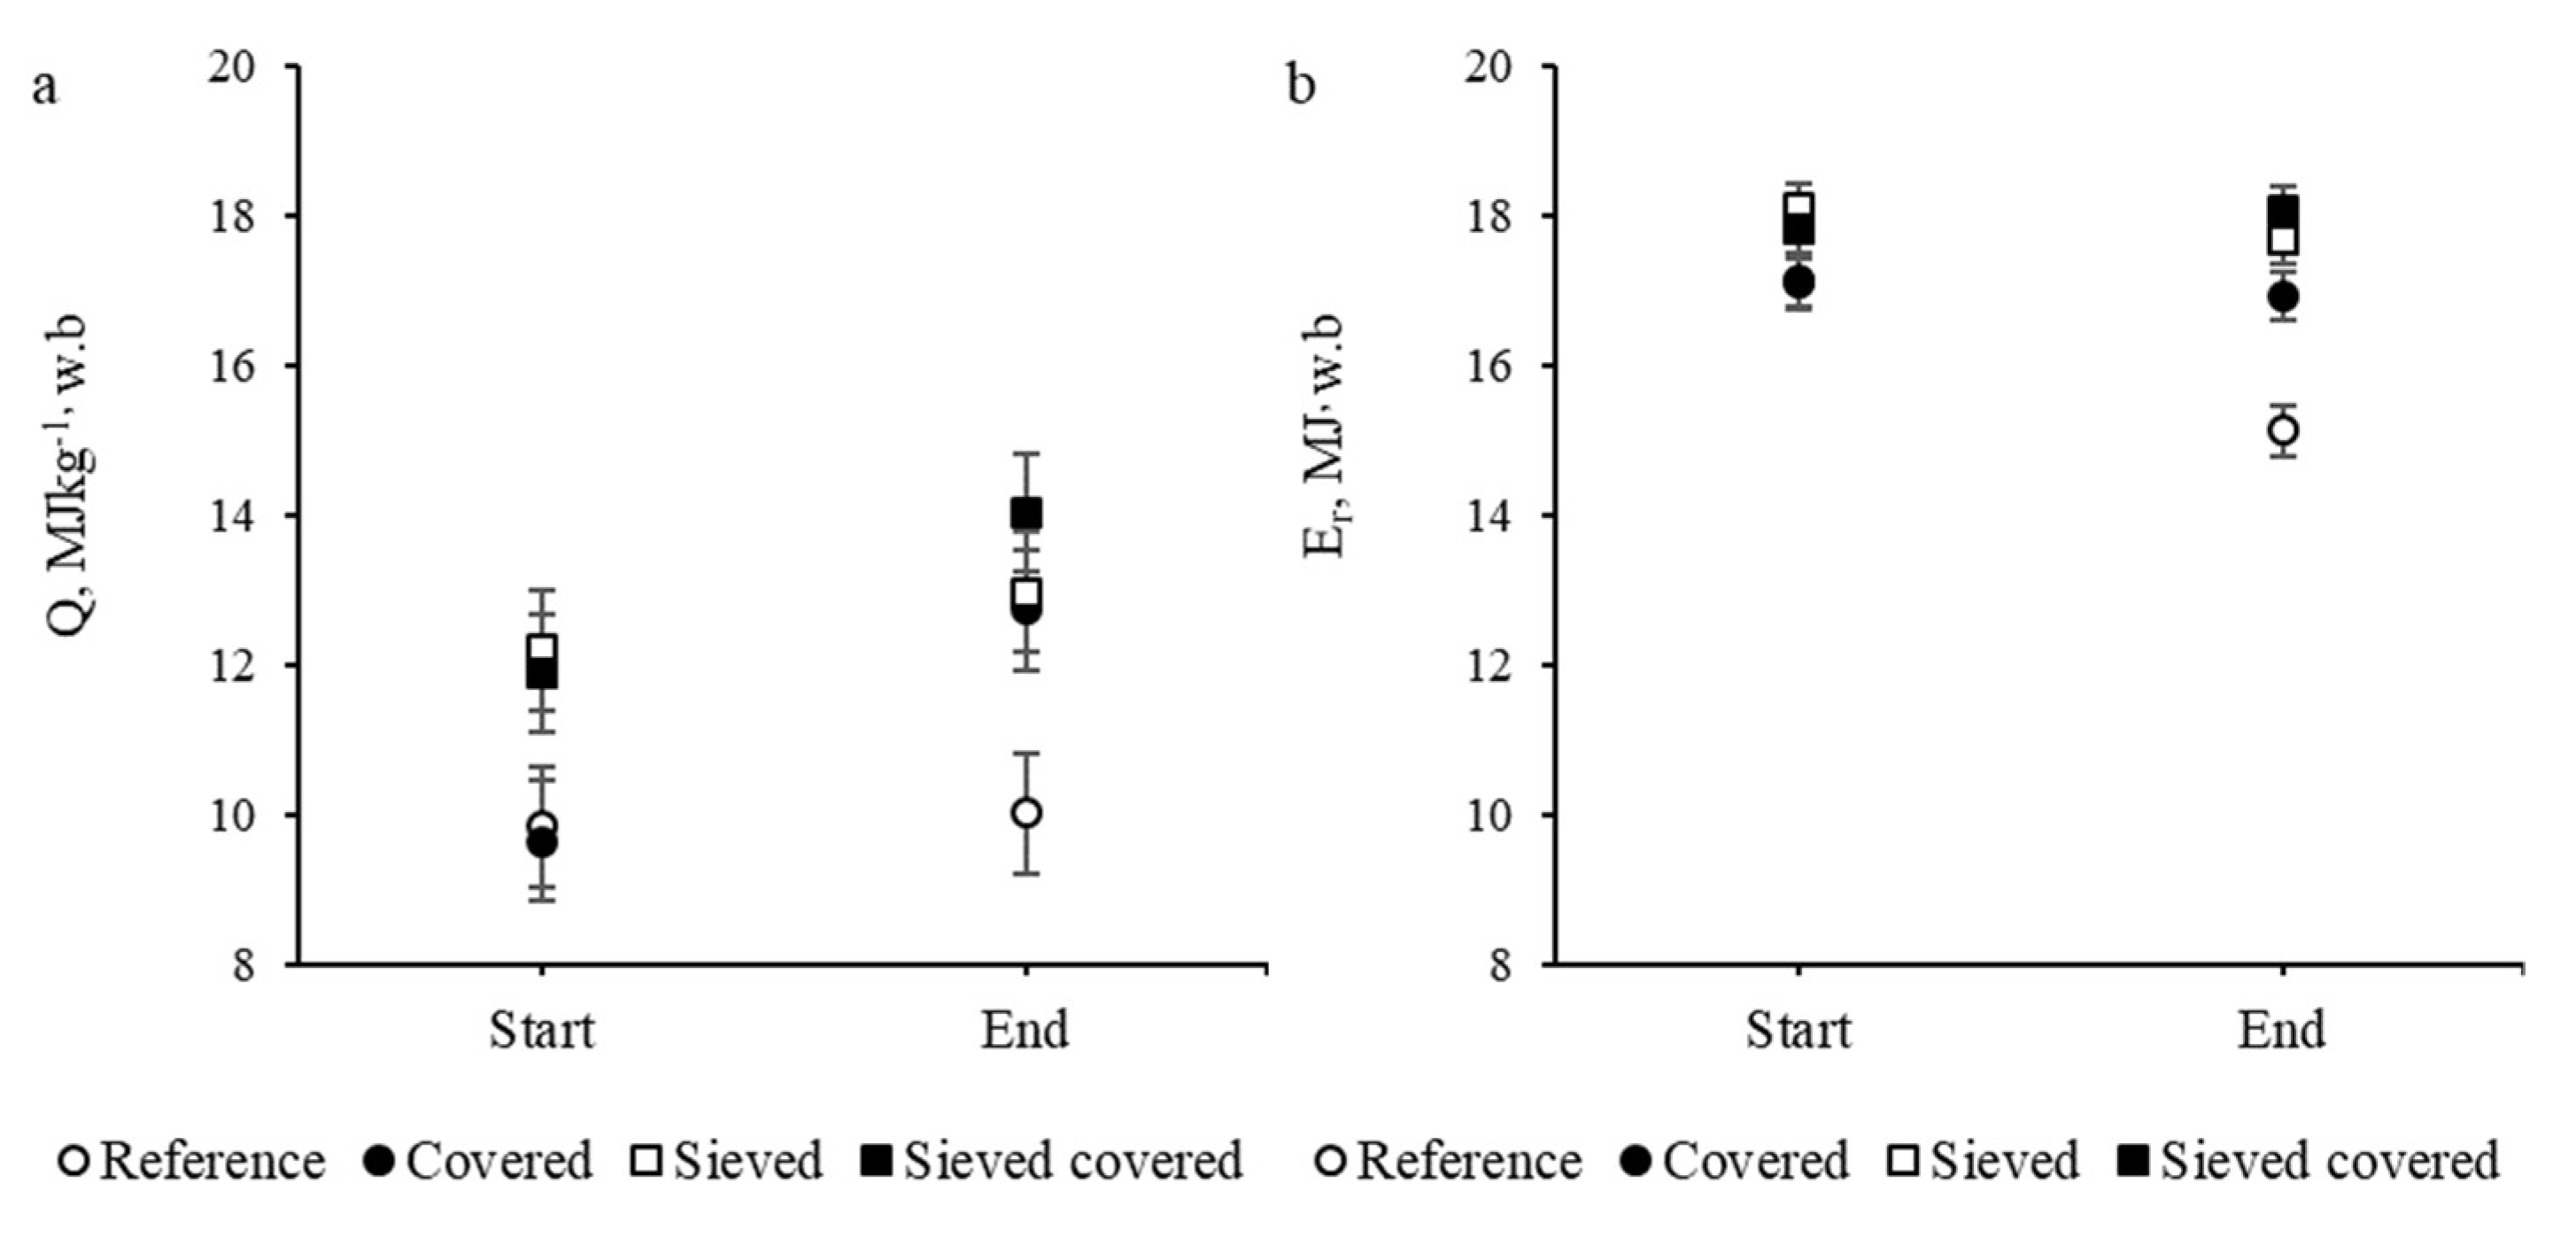
3.4. Net Calorific Value (Q) and Recovered Energy per Initial Mass (Er)

The initial average net calorific value (Q), expressed on a wet weight basis of unsieved chips, was 9.73 MJ kg−1 ± 1.79 SD with sieving significantly (p < 0.01) increasing the initial average Q to 12.03 MJ kg−1 ± 1.49 SD (Figure 5). In general, the average Q increased, but the increase was only significant (p < 0.01) in covered piles where it increased to 12.73 MJ kg−1 ± 1.17 SD (23.6%) and 14.03 MJ kg−1 ± 0.67 (16.6%) in unsieved and sieved piles, respectively (Figure 6).
The total effect of alternative storage methods on the average amount of accessible energy for initial mass showed that the initial accessible energy (Er) of unsieved chips was 17.10 MJ kg−1, initial dry weight ± 0.80 SD and 17.95 MJ kg−1 initial dry weight ± 0.77 in sieved chips (Figure 6). The Er in chips stored following the reference method decreased significantly (p < 0.01) while the average Er in sieved and covered piles did not.
Assuming an average energy price at the industry gate of 19.08 € MWh−1, which corresponds to the average cost in Sweden in 2020 [31], the chips’ initial value corresponded to 90.63 € per dry ton for unsieved chips and 95.14 € for sieved. After storage, the value of chips stored according to the reference method decreased to 80.21 € (by 11.5%) and the value of uncovered sieved chips decreased to 92.95 € (by 2.3%). The use of an additional covering reduced the value of the unsieved chips to 89.53 €, a 1.2% loss, but increased the value to 96.41 €, by 1.34%, when sieved.

4. Discussion

The present study confirms the positive effects of permeable covers found in earlier studies on chip storage [15,17,22]. Sieving the chips prior to storage further reduced dry matter and energy losses in the studied fraction.
This study investigated the storage of chips in full-scale commercial operations. Storage piles were created using existing industrial practices. The piles had similar shapes, heights and base sizes at all three locations/blocks to enhance comparability, ensuring identical initial conditions. The overall comparison refers to storage treatment and its effect on fuel quality, assessable energy content and value. According to the desired objectives, the design included one observation per treatment combination and block, which was a prerequisite to replicate the commercial storage conditions in full-scale piles. The total volume of stored material amounted to 5.974 m3, which required a storage area of a minimum of 15.000 m2, including the fire protection zones. Due to limited storage space at industry fuel yards, a trial with, for example, three replicates at each location would be desirable from a statistical point of view but was too expensive and impractical to carry out within the budget of this project. An option could have been to split the design into two sub-studies. However, the chosen design included three blocks, entailing local variations in precipitation and ambient temperature and providing biomass from different origins, comminution using different types of equipment and, thus, biomass with different compositions and fuel quality. Despite the design, significant and clear differences between treatment combinations could be demonstrated. Overall, this means the general comparison between treatments becomes more valid and robust and easier to generalise.
Comminution was carried out in connection with the trial in block 1 and block 3, while chips had been pre-stored in block 2. This may explain why sieving did not affect the initial M in block 2, since the pre-stored chips were homogenised before the storage trial. Biomass is hygroscopic and easily affected by precipitation. Thus, precipitation affects the result, which explains why the uncovered material, especially at the piles’ surface, was rewetted when there was precipitation. In addition, fines have a higher surface-area-to-volume ratio and are more easily rewetted than larger fractions. The initial freshness of biomass affects biological activity as an effect of the amount of easily degradable sugars. However, microbes are already established and the degradation is ongoing in pre-stored biomass; thus, it is initially faster.
The temperature development reflects the combined effect of the activity within piles. Most of these are linked to biological and chemical degradation, which leads to DML. Heat transfer dynamics are affected by the airflow within piles, which is a function of many parameters, notably particle size and particle shape [36]; the permeability in unsieved chip piles is low. This, combined with a high surface-area-to-volume ratio, makes the material easily rewetted, and more readily available sugars create optimal degradation conditions. The temperature development illustrated higher activity within unsieved piles, and the obtained DML confirmed the results. Sieving increases permeability and reduces the number of fines, making the biomass less prone to decomposition. The use of an additional cover prevented rewetting but when combined with sieving, only added extra value for unsieved chips in these trials.
Sieving improves fuel quality, homogenises the fuel, increases its initial value and increases storability. However, it introduces an extra cost and creates a side stream of less-valuable fine fraction (rejection) for which there must be a provision. The price for the sieving operations studied in conjunction with the current storage trial was just under € 2 per MWh or about 10% of the value of the chips [31], but there is potential to reduce this through better work organisation and the use of stationary equipment. More concerning is that in four out of five trials, 21 to 27% of the residue chips were separated as fines, and in block 1, an extremely high 46% were fines. Kons et al., (2015) [37] reported corresponding values of 15% ± 3 SD–19% ± 5 SD for comminuted fresh and stored LR chips, respectively. This rejected fraction can be used as a fuel in some boilers. Other alternative uses, such as briquette production, pyrolysis and as an additive to biogas production and other biomass services, are also conceivable. Storage of fines is not recommended due to high M, A and nutrient content. An advantage is that M was reduced in the accepted fraction compared to the unsieved chips in two of the three trials, which in itself increases the economic value of that fraction by 5% per dry ton.
Increased storability of the sieved and covered chips implies reduced storage risks, leading to new options for improvements within the supply chain. Assuming the use of reject fines as fuel, this improved storability may only cover sieving costs. Combining increased storability with reduced risks associated with storage, such as a lower risk of self-ignition, and enabling a higher utilisation of chippers and chip trucks in the supply chain would both improve the supply chain system and reduce costs. However, as both the sieving and covering of the chips comes at a price, it might not be economically feasible to do both. The demand for the value of the fines probably will be the deciding factor between treatments.

5. Conclusions

Sieving improves fuel quality and storability, reducing losses and the risk of self-ignition. Sieving has to be carried out just after comminution to obtain the maximum benefit. Our study did not show that combined sieving and covering yielded any significant reduction of DML, but the effect of treatment was significant for M. However, the combination of sieving and additional covering resulted in an average of 29.7% lower DML compared to sieving, and increasing the number of replicates would much likely result in a significant difference at p levels < 5%. The effect reduces over time, which indicates that covering is more justified for short storage times. However, these indicative findings call for performing replicates. The value added by sieving may not prove sufficient motivation alone, without combining increased storability, reduced risks and supply chain improvements that come from enabling a higher utilisation rate of chippers and chip trucks.

Author Contributions

E.A. conducted the main part of the planning of the study and wrote the application together with L.E. and D.B., E.A., D.B., L.E. and J.R. contributed to collection of samples at the field trials. E.A. and L.E. performed the statistical analysis and were the initiators of the manuscript. The manuscript was written by E.A. and L.E. with input from D.B. and J.R. All authors have read and agreed to the published version of the manuscript.

Funding

This research was funded by The Swedish Energy Agency, grant number 45935-1″ and Stockholm Exergi AB, Älvsbyns Energi AB and SCA AB.

Conflicts of Interest

The authors declare no conflict of interest.

References

  1. Olsson, O.; Eriksson, A.; Sjöström, J.; Anerud, E. Keep that fire burning: Fuel supply risk management strategies of Swedish district heating plants and implications for energy security. Biomass Bioenergy 2016, 90, 70–77. [Google Scholar] [CrossRef]
  2. Windisch, J.; Väätäinen, K.; Anttila, P.; Nivala, M.; Laitila, J.; Asikainen, A.; Sikanen, L. Discrete-event simulation of an information-based raw material allocation process for increasing the efficiency of an energy wood supply chain. Appl. Energy 2015, 149, 315–325. [Google Scholar] [CrossRef]
  3. Väätäinen, K.; Prinz, R.; Malinen, J.; Laitila, J.; Sikanen, L. Alternative operation models for using a feed-in terminal as a part of the forest chip supply system for a CHP plant. GCB Bioenergy 2017, 9, 1657–1673. [Google Scholar] [CrossRef] [Green Version]
  4. Jirjis, R. Storage and drying of wood fuel. Biomass Bioenergy 1995, 9, 181–190. [Google Scholar] [CrossRef]
  5. Nurmi, J. The storage of logging residue for fuel. Biomass Bioenergy 1999, 17, 41–47. [Google Scholar] [CrossRef]
  6. Nurmi, J.; Hillebrand, K. The fuel quality of Norway spruce logging residues in relation to storage logistics. For. Res. Bull. 2001, 203, 42–46. [Google Scholar]
  7. Nordfjell, T.; Liss, J.-E. Compressing and Drying of Bunched Trees from a Commercial Thinning. Scand. J. For. Res. 2000, 15, 284–290. [Google Scholar] [CrossRef]
  8. Pettersson, M.; Nordfjell, T. Fuel quality changes during seasonal storage of compacted logging residues and young trees. Biomass Bioenergy 2007, 31, 782–792. [Google Scholar] [CrossRef]
  9. Filbakk, T.; Høibø, O.; Nurmi, J. Modelling natural drying efficiency in covered and uncovered piles of whole broadleaf trees for energy use. Biomass Bioenergy 2011, 35, 454–463. [Google Scholar] [CrossRef]
  10. Eliasson, L.; Anerud, E.; Grönlund, Ö.; von Hofsten, H. Managing moisture content during storage of logging residues at landings–Effects of coverage strategies. Renew. Energy 2020, 145, 2510–2515. [Google Scholar] [CrossRef]
  11. Krigstin, S.; Wetzel, S. A review of mechanisms responsible for changes to stored woody biomass fuels. Fuel 2016, 175, 75–86. [Google Scholar] [CrossRef]
  12. Thörnqvist, T. Drying and storage of forest residues for energy production. Biomass 1985, 7, 125–134. [Google Scholar] [CrossRef]
  13. BNilsson, B.; Blom, Å.; Thörnqvist, T. The influence of two different handling methods on the moisture content and composition of logging residues. Biomass Bioenergy 2013, 52, 34–42. [Google Scholar] [CrossRef]
  14. Wästerlund, I.; Nilsson, P.; Gref, R. Influence of storage on properties of wood chip material. J. For. Sci. 2017, 63, 182–191. [Google Scholar]
  15. Anerud, E.; Jirjis, R.; Larsson, G.; Eliasson, L. Fuel quality of stored wood chips—Influence of semi-permeable covering material. Appl. Energy 2018, 231, 628–634. [Google Scholar] [CrossRef]
  16. Anerud, E.; Bergström, D.; Routa, J.; Eliasson, L. Fuel quality and dry matter losses of stored wood chips—Influence of cover material. Biomass Bioenergy 2021, 150, 106109. [Google Scholar] [CrossRef]
  17. Anerud, E.; Eriksson, A. Evaluation of an improved design for large-scale storage of wood chip and bark. Biomass-Bioenergy 2021, 154, 106255. [Google Scholar] [CrossRef]
  18. Hofmann, N.; Mendel, T.; Schulmeyer, F.; Kuptz, D.; Borchert, H.; Hartmann, H. Drying effects and dry matter losses during seasonal storage of spruce wood chips under practical conditions. Biomass Bioenergy 2018, 111, 196–205. [Google Scholar] [CrossRef]
  19. Lenz, H.; Idler, C.; Hartung, E.; Pecenka, R. Open-air storage of fine and coarse wood chips of poplar from short rotation coppice in covered piles. Biomass Bioenergy 2015, 83, 269–277. [Google Scholar] [CrossRef]
  20. Lenz, H.; Pecenka, R.; Idler, C.; Dumfort, S.; Whittaker, C.; Ammon, C.; Hartung, E. Continuous weighing of a pile of poplar wood chips—A comparison of methods to determine the dry matter losses during storage. Biomass Bioenergy 2017, 96, 119–129. [Google Scholar] [CrossRef]
  21. Barontini, M.; Scarfone, A.; Spinelli, R.; Gallucci, F.; Santangelo, E.; Acampora, A.; Jirjis, R.; Civitarese, V.; Pari, L. Storage dynamics and fuel quality of poplar chips. Biomass Bioenergy 2014, 62, 17–25. [Google Scholar] [CrossRef]
  22. Pari, L.; Brambilla, M.; Bisaglia, C.; Del Giudice, A.; Croce, S.; Salerno, M.; Gallucci, F. Poplar wood chip storage: Effect of particle size and breathable covering on drying dynamics and biofuel quality. Biomass Bioenergy 2015, 81, 282–287. [Google Scholar] [CrossRef]
  23. Manzone, M.; Balsari, P. Poplar woodchip storage in small and medium piles with different forms, densities and volumes. Biomass Bioenergy 2016, 87, 162–168. [Google Scholar] [CrossRef] [Green Version]
  24. Afzal, M.; Bedane, A.; Sokhansanj, S.; Mahmood, W. Storage of comminuted and uncomminuted forest biomass and its effect on fuel quality. BioResources 2009, 5, 55–69. [Google Scholar]
  25. Manzone, M.; Balsari, P.; Spinelli, R. Small-scale storage techniques for fuel chips from short rotation forestry. Fuel 2013, 109, 687–692. [Google Scholar] [CrossRef]
  26. Pecenka, R.; Lenz, H.; Idler, C.; Daries, W.; Ehlert, D. Development of bio-physical properties during storage of poplar chips from 15 ha test fields. Biomass Bioenergy 2014, 65, 13–19. [Google Scholar] [CrossRef]
  27. Hofmann, N.; Borchert, H. Influence of fuel quality and storage conditions on oxygen consumption in two different wood chip assortments—Determination of the storage-stable moisture content. Fuel 2021, 309, 122196. [Google Scholar] [CrossRef]
  28. Wetzel, S.; Volpe, S.; Damianopoulos, J.; Krigstin, S. Can Biomass Quality Be Preserved through Tarping Comminuted Roadside Biomass Piles? Forests 2017, 8, 305. [Google Scholar] [CrossRef] [Green Version]
  29. Anerud, E.; Larsson, G.; Eliasson, L. Storage of Wood Chips: Effect of Chip Size on Storage Properties. Croat. J. For. Eng.: J. Theory Appl. For. Eng. 2020, 41, 1–11. [Google Scholar] [CrossRef]
  30. Baadsgaard-Jensen, J. Storage and Energy Economy of Ehunk and Chip Piles, Research Report-Exploitation of Marginal Forest Resources for Fuel. 1998. Available online: https://www.osti.gov/etdeweb/biblio/7840176 (accessed on 24 March 2022).
  31. Eliasson, L.; Anerud, E.; Eriksson, A.; von Hofsten, H. Productivity and costs of sieving logging residue chips. Int. J. For. Eng. 2021, 33, 80–86. [Google Scholar] [CrossRef]
  32. Eliasson, L.; von Hofsten, H.; Johannesson, T.; Spinelli, R.; Thierfelder, T. Effects of sieve size on chipper productivity, fuel consumption and chip size distribution for open drum chippers. Croat. J. For. Eng. J. Theory Appl. For. Eng. 2015, 36, 11–17. [Google Scholar]
  33. SS-EN 15149-1:2010; Anon, Solid Biofuels–Determination of Particle Size Distribution–Part 1: Oscillating Screen Method Using Sieve Apertures of 1 mm and Above. Swedish Standard Institute: Stockholm, Sweden, 2010.
  34. SS-EN 14774; Anon, Solid biofuels–Determination of Moisture Content–Oven Dry Method–Part 1: Total Moisture–Reference Method. Swedish Standards Institute: Stockholm, Sweden, 2009.
  35. SS-EN 14918; Anon, Solid Biofuels–Determination of Calorific Value. Swedish Standards Institute: Stockholm, Sweden, 2010.
  36. Kuptz, D.; Hartmann, H. Prediction of air pressure resistance during the ventilation of wood chips as a function of multiple physical fuel parameters. Biomass Bioenergy 2021, 145, 105948. [Google Scholar] [CrossRef]
  37. Kons, K.; Bergström, D.; Di Fulvio, F. Effects of sieve size and assortment on wood fuel quality during chipping operations. Int. J. For. Eng. 2015, 26, 114–123. [Google Scholar] [CrossRef]
Figure 1. Particle size distribution for unsieved and sieved woodchips from the three study sites. Coloured bars beneath different Roman letters indicate a significant difference in the material as delivered between study sites. Different Greek letters centred in the patterned bars indicate a significant difference in the sieved material between study sites. Block 1 is represented by red and cross-hatched bars, block 2 by orange and dotted bars and block 3 by blue and diagonally striped bars.
Energies 15 02953 g001
Figure 2. (a): Orientation of stacks, showing the prevailing wind direction, (b): sampling sections and order of resampling and (c): cross-section of the experimental stacks, showing sampling points. TinyTags ® temperature sensors were placed at sampling points 7 and 9, (d): sampling time.
Energies 15 02953 g002
Figure 3. (a): Monthly ambient temperature during the storage trials and 30-year average ambient temperature obtained from SMHI, and (b): monthly cumulative precipitation during the storage trials and 30-year average precipitation obtained from SMHI.
Energies 15 02953 g003
Figure 4. The average temperature during storage of wood chips in block 1 (a) and block 3 (b).
Energies 15 02953 g004
Figure 5. Mean moisture content (%, w.b.) and 95% level of confidence intervals of unsieved (a) and sieved (b) wood chips during storage.
Energies 15 02953 g005
Figure 6. Average values and 95% CI of the net calorific value (Q), expressed on a wet weight basis (a) and recovered energy (Er) per 1 kg dry initial mass expressed on a wet weight basis (b) for unsieved and sieved wood chips during storage.
Energies 15 02953 g006
Table 1. Initial volume (m3) of wood chip piles.
Location/BlockUnsieved Wood ChipsSieved Wood Chips
Block 1618781
Block 29751100
Block 311851315
Table 2. Standards used for sampling, sample preparation, classification and determination of fuel characteristics.
StandardReference
Particle size distribution SS-EN 15149-1: 2010[33]
Moisture content (M) expressed on a wet weight basisSS-EN 14774: 2009[34]
Gross and net calorific value, expressed on a dry weight and wet weight basis respectivelySS-EN 14918: 2010[35]
Table 3. ANOVA table for the difference in Moisture content (w.b) during storage of wood chips.
EffectDfSum Sq (SS)Mean Sq (MS)F-valuep-Value
Intercept116,33116,3313690.000
Block21857928210.000
Sieved126422642600.000
Covered123723750.021
Block *Sieved272936480.000
Block *Covered265832970.001
Sieved*Covered125025060.018
Block *Sieved*Covered2331700.687
Error28812,74044
Table 4. Average cumulative dry matter loss, as %, during storage. Different letters within rows indicate significant differences between storage duration, and different Greek letters in columns indicate significant differences between treatments.
TreatmentSampling 1 (42–49 Days)Sampling 2 (73–84 Days)Sampling 3 (101–176 Days)
Uncovered5.37aα6.52bα10.63cα
Covered3.64aβ4.84bβ5.88cβ
Sieved uncovered1.22aγ1.40aγ1.47aγ
Sieved covered0.75aγ0.97aγ1.18aγ
Publisher’s Note: MDPI stays neutral with regard to jurisdictional claims in published maps and institutional affiliations.

