Article

Performance of an Innovative Bio-Based Wood Chip Storage Pile Cover—Can It Replace Plastic Tarps?

1
Production Systems, Natural Resources Institute Finland (Luke), Yliopistokatu 6 B, 80100 Joensuu, Finland
2
Department of Forest Biomaterials and Technology, Swedish University of Agricultural Sciences, Skogsmarksgränd, 90183 Umeå, Sweden
*
Author to whom correspondence should be addressed.
Energies 2022, 15(5), 1680; https://doi.org/10.3390/en15051680
Submission received: 25 January 2022 / Revised: 14 February 2022 / Accepted: 22 February 2022 / Published: 24 February 2022

Abstract

:
There is currently great general interest in reducing the use of fossil-based materials. Fossil-based tarps are still widely used as cover for wood chip storage piles, causing additional waste or requiring further waste treatment in the supply chain. This study aimed to investigate the performance of an innovative bio-based wood chip pile cover compared to conventional treatments (plastic-covered and uncovered) in eastern Finnish conditions. The experiment evaluated the drying process during the storage of stemwood chips during 5.9 months of storage. It included the developments of temperature, moisture content, heating value, energy content, basic density, particle size distribution, and the dry matter losses of a total of six piles. As a result, the forest stemwood chips dried by 11%, with dry-matter losses of 4.3%, when covered with the bio-pile cover. Using the plastic covering, the forest stemwood chips dried by 22%, with dry matter losses of 2.9%. At the end of the experiment, the energy content in plastic-covered piles was 6.1% higher than uncovered piles and 3.1% higher than bio-pile-covered piles. While differences in the key drying performance parameters can be observed, the differences between uncovered piles and those covered with plastic tarps, as well as between the bio-based and the uncovered piles, were not statistically significant. We conclude that the bio-based cover, under the studied conditions, do not render better storage conditions than in current practices. However, our study indicates possible fossil-substitutional benefits by using a bio-based cover, which calls for further R&D work in this matter.

1. Introduction

The European Union (EU) is currently initiating various efforts in several sectors of the economy to shift from fossil-based energy sources to renewable energy alternatives. This especially concerns the energy sector. In Finland, renewable energy accounted for 40% of total energy consumption in 2020, and the share of wood fuels in the consumption of renewable energy was 71%, making wood fuels the most important source of energy, with a share of 28% of total energy consumption [1]. The high utilisation of wood fuel in energy production has also highlighted the importance of wood fuel storage as part of the supply chain [2]. Wood chip storage can, thus, serve as a crucial buffer because there is a seasonal variation of supply and demand. It can also ensure the security of supply (see [3]).
The shift from fossil-based sources to green alternatives can also be observed in the EU’s efforts concerning the challenges posed by plastics in the establishment of a European Strategy for Plastics in a Circular Economy [4]. The strategy includes a list of recommended measures to national authorities and industry, in which the industry is encouraged to take concrete steps to improve dialogue and cooperation across the value chain, particularly in material and product design aspects, among other measures [4]. The need to reduce the use of fossil-based materials and waste in the processes is also of interest in the handling of wood fuels, where fossil-based tarps are still widely used as pile cover for wood chip storage. Whereas fossil-based plastic materials cause additional waste or require further treatment in the form of the separation or shredding of such material before combustion, environmentally friendly alternatives may be handled without other treatment.
For several years, the seasonal storage of woody biomass for bioenergy has been an issue in which the natural drying of uncomminuted materials has been the focus [5,6,7,8,9]. Instead of drying the raw materials, the drying step can also be performed after the comminution phase by drying produced chips [10]. Research has studied the natural drying of comminuted wood chips in outdoor storage piles [11]. Nevertheless, alternatives to natural drying include artificial drying, which was the subject of a recent study; however, depending on the specific operating conditions, the artificial drying of forest chips was of minimal financial attractiveness for heat entrepreneurs in a Finnish case study [12].
A key issue is managing moisture content during storage to avoid degradation leading to economic losses, and the self-heating of piles which may lead to fire outbreaks and safety risks [13]. Efforts have, therefore, been made to accurately develop prediction models to estimate moisture content during storage [14,15]. A way of further controlling the moisture content of chips in the piles is to use cover materials during storage. The authors of [16] showed the importance of an appropriate covering strategy, in which a cover only on the top of piles may avoid their rewetting. The effect of pile covering has been studied for various types of comminuted raw materials such as pine or spruce bark [17,18,19], spruce logging residues [16,20], mixed species logging residues [21], poplar woodchips [22,23,24,25], and predominantly spruce roundwood chips [20,26].
Promising cover materials for chip piles stored outdoors as an alternative to plastic covers have been investigated in the past to a limited extent, but they have included semi-permeable materials [19,21,26]. A more recent innovation from Finland presented a cover solution designed for wood chip piles based on an ecological material mixture that was combustible with the stored biomass without any need for separation work [27].
Overall, this study sought to investigate the performance of an innovative bio-based wood chip pile cover (abbreviation used: bio-pile cover) compared to alternative solutions in Finnish conditions. The experiment included the evaluation of the drying process during the storage of stemwood chips, including the moisture content and heating value development, and the dry matter losses as a consequence of microbial activities. Furthermore, the potential to avoid self-heating piles and the operational feasibility of replacing the current practices (uncovered or plastic cover) were investigated. Consequently, two main research questions were formulated:
Can differences in the storage performance between uncovered and covered wood chip piles be observed?
Does the performance of an innovative bio-based wood chip pile cover compare to the storage performance of current pile cover practices using plastic covers?

2. Materials and Methods

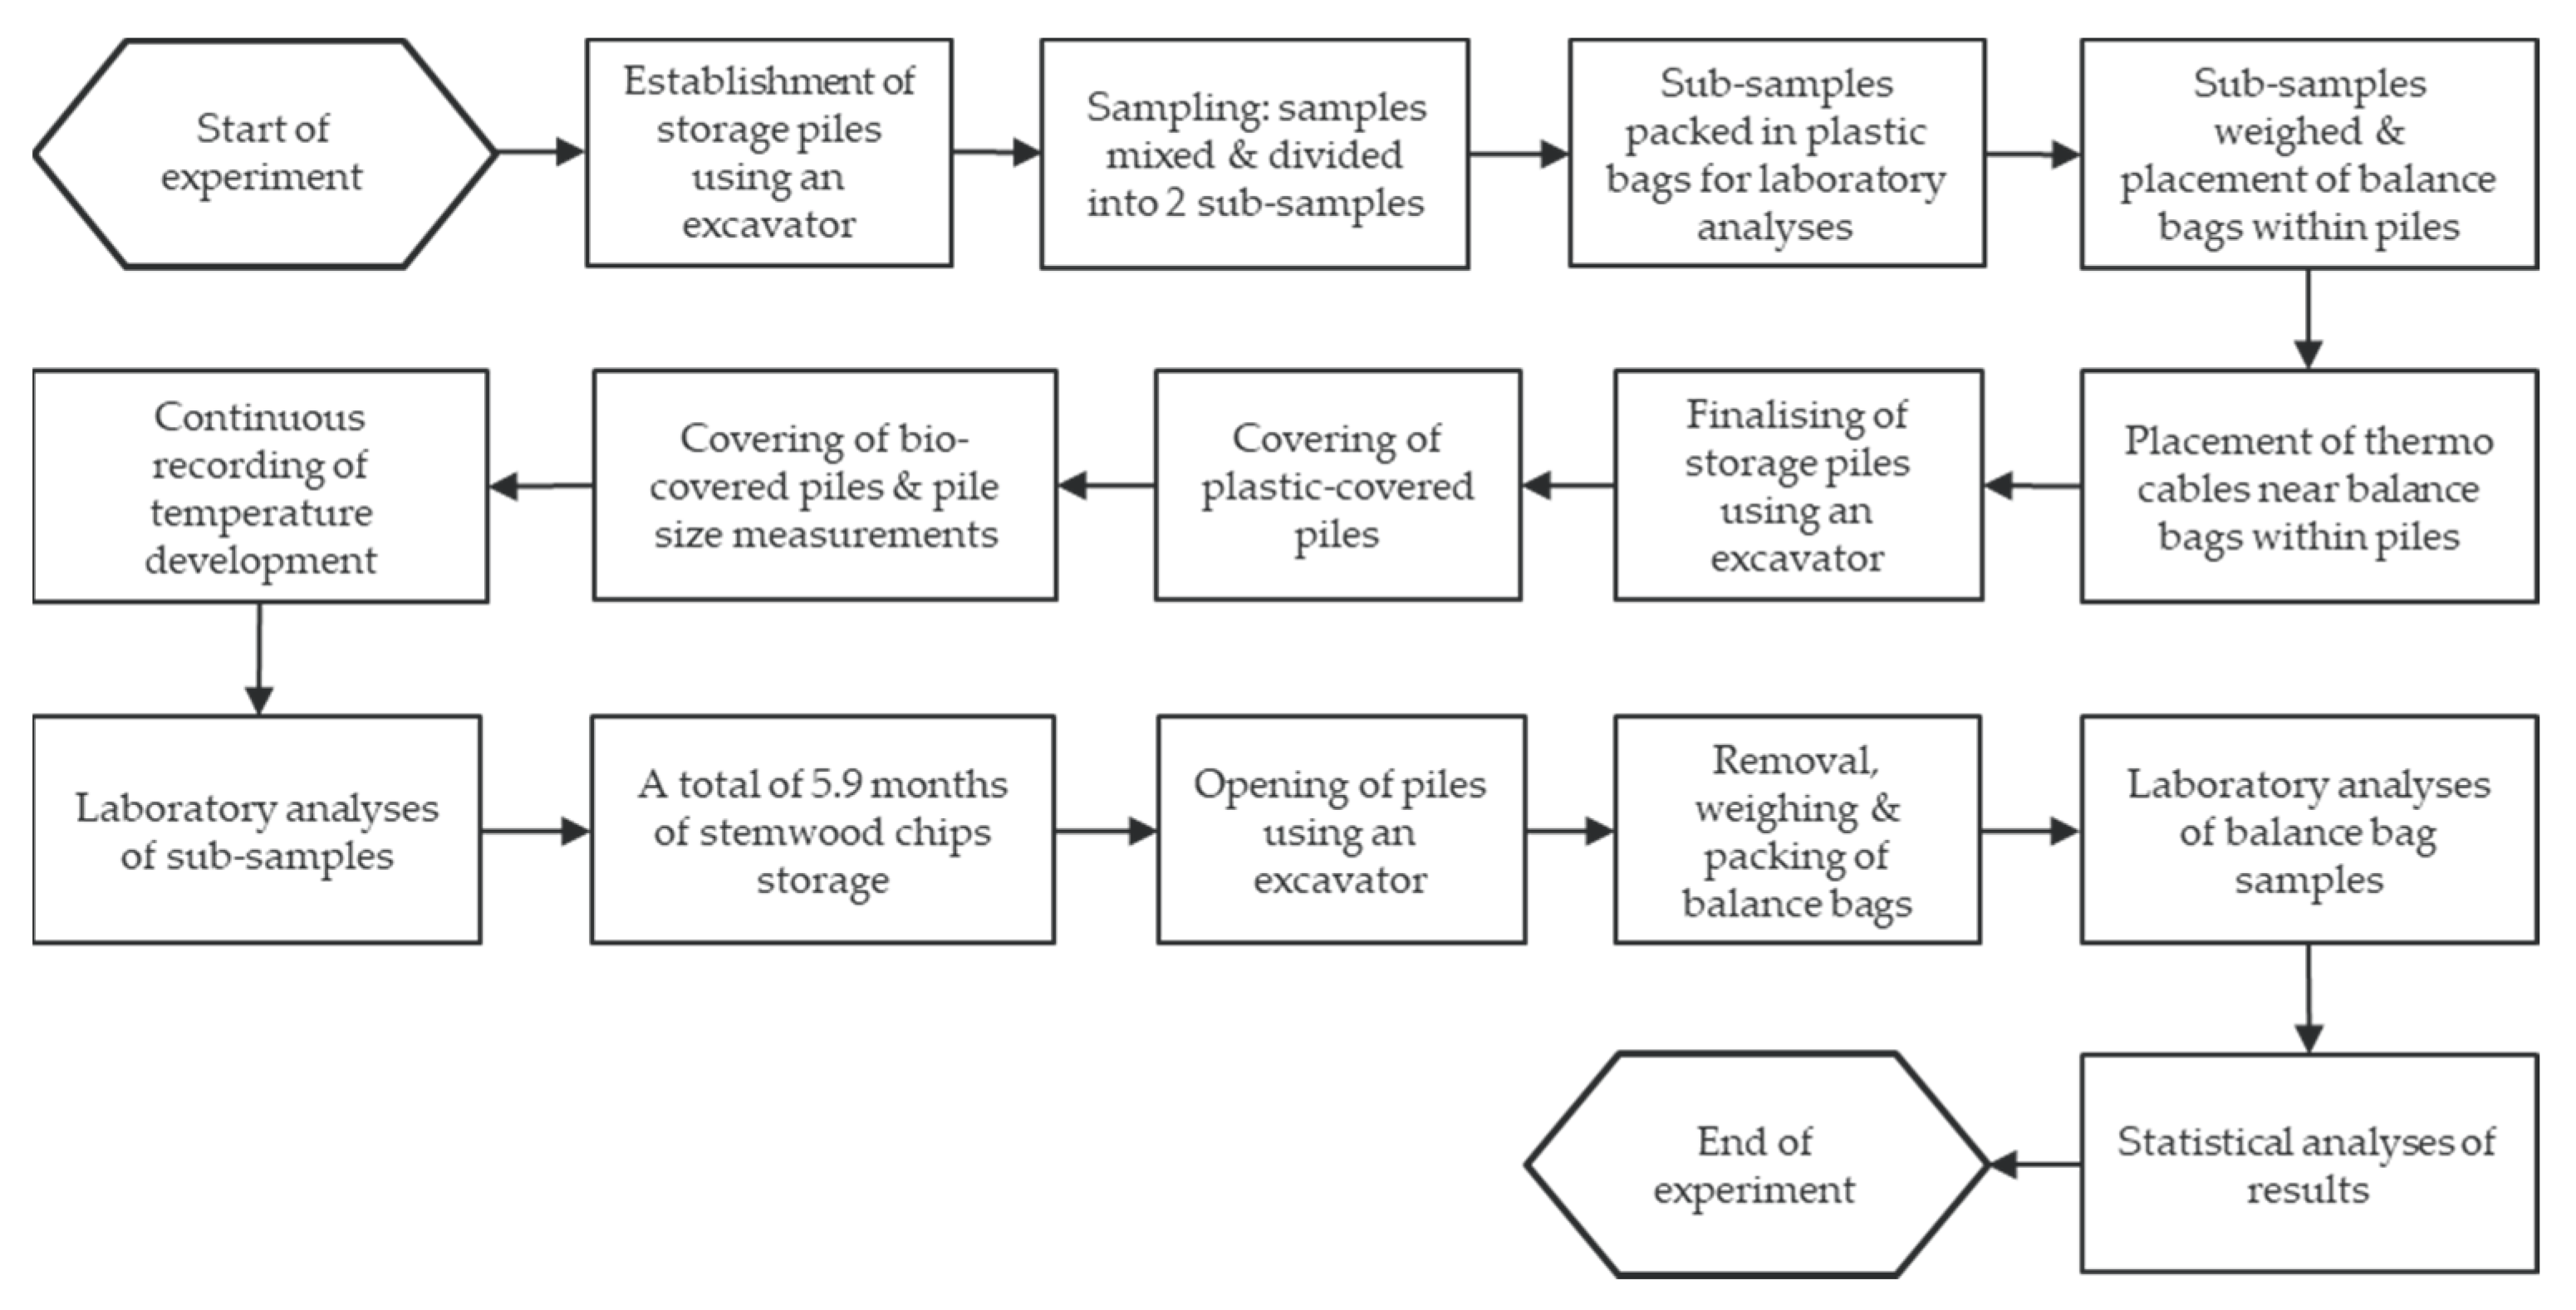
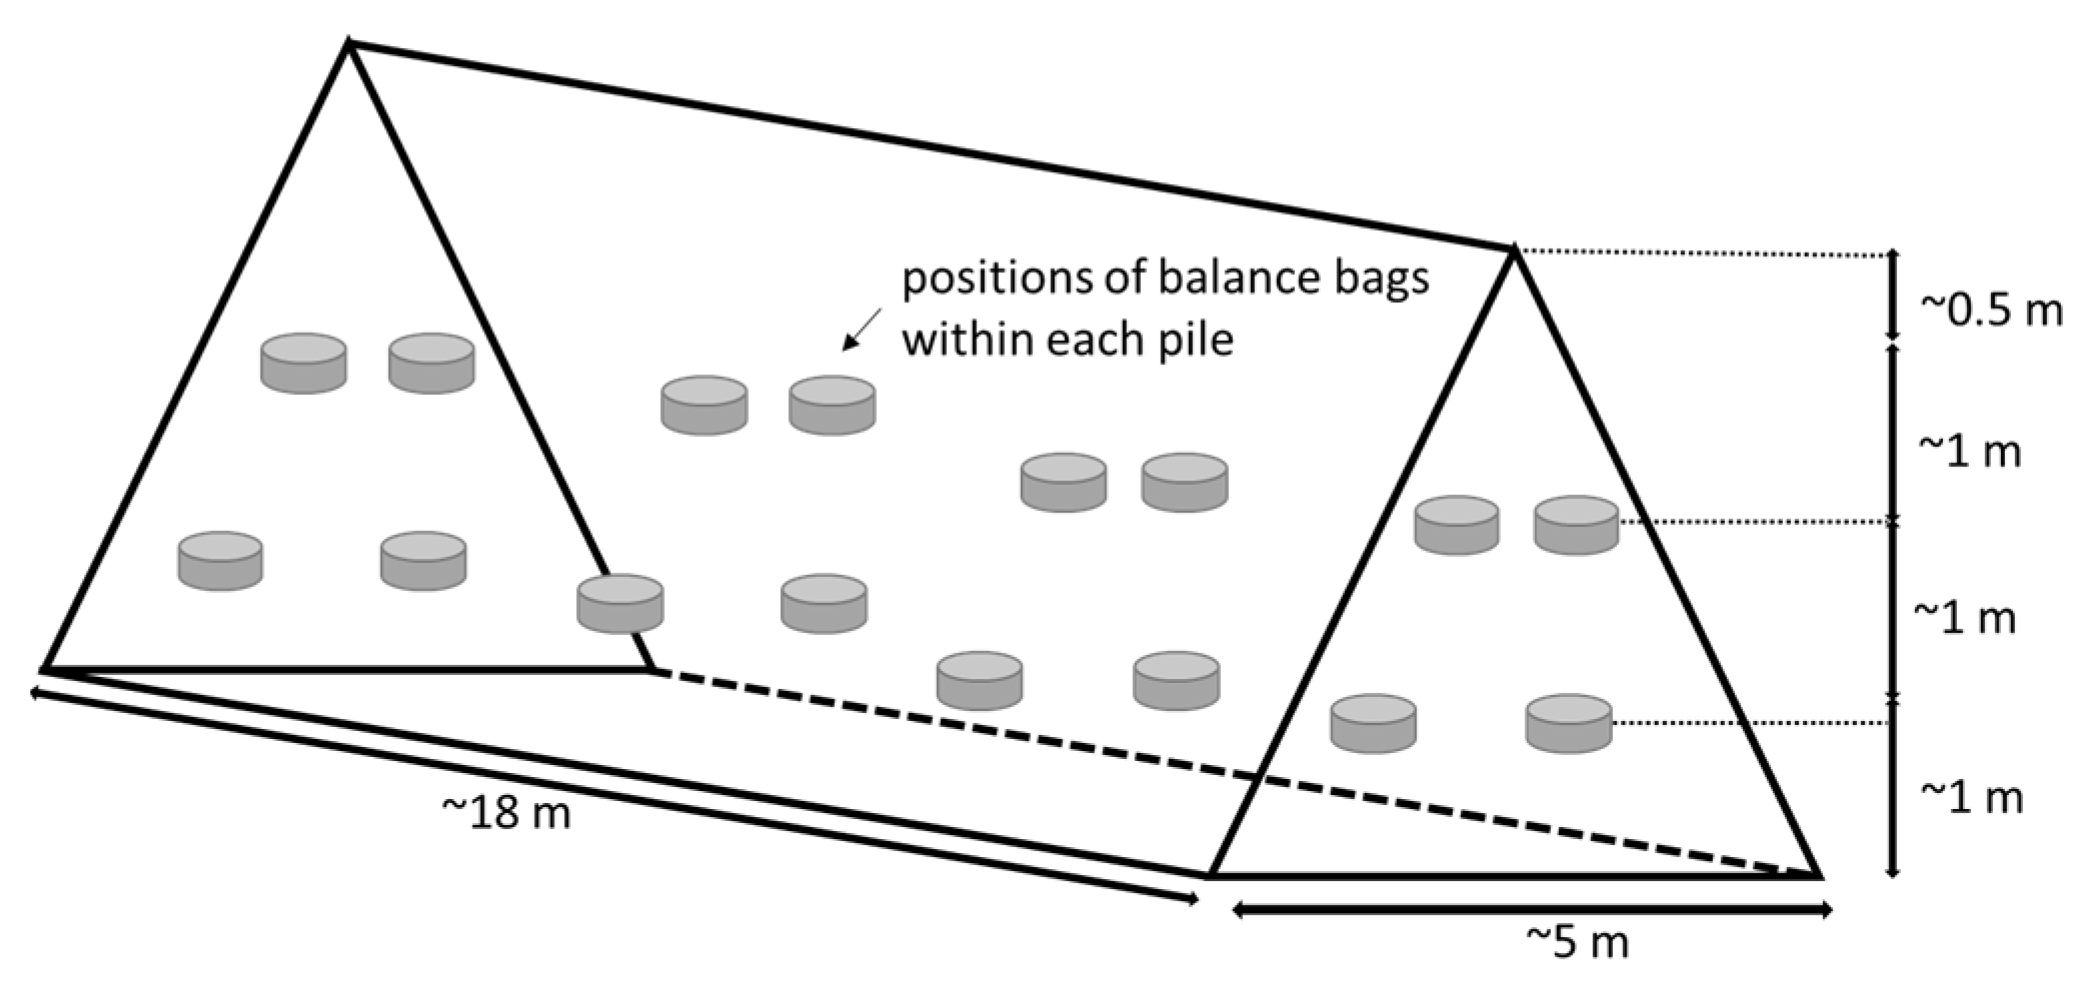
2.1. Experimental Design

The storage experiment was established in Kuopio (62°52′ N, 27°40′ E), Eastern Finland, at the storage site of Kuopion Energia’s heating plant in Kuopio. The experiment was carried out between 17 August 2020 and 9 February 2021. The accumulated precipitation for the follow-up periods was 384 mm, and the mean air temperature was 4.7 °C in the experiment area.
Livetech Suoja® is an innovative product developed to protect biofuel piles from rain and meltwaters without the use of plastic. The product consists of a mixture of water, pulp fibre, and a binding agent sprayed over a pile from a tank truck or tank trailer to form a 0.5–2.0-centimetre layer (Figure 1).
Six piles of stemwood chips were established at Kuopio Energia’s premises (Figure 2). Two piles were uncovered, two were covered with plastic, and two were covered with the Livetech Suoja® method (abbreviation used: bio-pile cover).
The material originated from a mix of imported stemwood chips predominantly of Norway spruce (Picea abies (L.) H. Karst) and Scots pine (Pinus sylvestris), the pre-storage time was unknown. The material was delivered by truck directly from the fuel suppliers and unloaded at the paved terminal premises. Following the order of arrivals, chips were piled with a wheel loader and an excavator to the designated pile size; thus, an unspecified degree of homogenisation of the material within each pile occurred. The piles had an average size of 18.0 × 5.0 × 3.5 m (length, width, height). The volumes of the piles were measured using an unmanned DJI Phantom 4 RTK SDK aerial vehicle (UAV). By applying the DroneDeploy software, the storage pile volumes ranged between 177 and 214 m3 (Table 1). The plastic cover (Raniplast 112 g m−2, 120 µm) was applied.
The experiment followed the chronological steps as presented in the flowchart of the study (Figure 3). Sampling was done with balance bags in the experiment, a commonly used method that involves placing net bags filled with the studied feedstock material within the storage piles [11].
The samples were individually mixed to homogeneity and divided into two sub-samples. The first sub-sample was packed in a plastic bag and set aside to measure pre-storage wet-basis moisture content, ash content, and basic density. The other sub-sample was packed in a polyester balance bag (size 50 × 70 cm) with a 1 mm oval mesh. The chips for the balance bags were intensively homogenised to ensure the same starting conditions for all samples within one pile to minimise variance between samples per pile. In constructing the experiment, the balance bags were arranged grid-wise within the piles. In each pile, 16 balance bags were placed at two height levels; the first level with eight bags was approximately 0.9 m from the ground, and the second was at a height of about 2 m with eight bags (Figure 4). In total, 96 bags were placed in the Kuopio experiment.
In addition, the in-pile temperature was recorded with a sampling frequency of 3 h using thermo cables. Thirteen thermo cables were placed in each of the uncovered piles and eight cables in each of the covered piles at different height levels. In total, 58 cables were placed within the piles.

2.2. Analyses Methods

The sampling procedure and sampling preparation followed the standard methods valid at the time of the experiments. The moisture content was analysed according to the SFS-EN 14774-2 standard [28]. The ash content was determined according to the SFS-EN 14775 standard [29]. The standard SCAN-CM 43:95 [30] was applied to determine the basic density of the chip samples. The gross calorific value was determined according to the SFS-EN ISO 18125:2017 standard [31] with a Parr 6200 Oxygen Bomb Calorimeter (Parr Instrument Co., Moline, IL, USA).
The study piles’ energy content was calculated based on the measured moisture content at the beginning and end of the experiment. The net calorific value and energy content of chips as received were calculated according to the following equations [32]:
q p , n e t , a r = q p , n e t , d ( 100 M a r 100 ) 0.02443 M a r ,
where qp,net,ar = net calorific value as received, MJ kg−1; qp,net,d = net calorific value on a dry basis, MJ kg−1; Mar = moisture content as received, %; and 0.02443 = the correction factor of the enthalpy of vaporisation at 25 °C; and
E a r = 1 3600 q p , n e t , a r B D a r ,
where Ear = Energy content as received, MWh m−3; qp,net,ar = net calorific value as received, MJ kg−1; and BDar =Density as received, kg m−3.
The amount of dry matter in the chips was calculated based on the weight of the sample and its analysed moisture content. The amount of dry matter was calculated with the formulas:
D M W b = T W b ( ( M C b   100 )   T W b )                
D M W e = T W e ( ( M C e   100 )   T W e )          
D M W l = D M W b   D M W e ,                                
where DMWb = weight of dry matter at the beginning of the experiment; DMWe = weight of dry matter at the end of the experiment; DMWl = the dry matter loss during the experiment; TWb = total weight at the beginning of the experiment; TWe = total weight at the end of the experiment; MCb = moisture content at the beginning of the experiment, %; and MCe = moisture content at the end of the experiment, %.
The moisture content, basic densities, and net calorific values of dry matter measured in the samples from the balance bags at the beginning and end of the experiment were used in the calculations of energy content and dry-matter losses (DML).
Statistical analyses were performed in IMB SPSS Statistics 27 with a significance level of α < 0.05 applied in all analyses. Data normality was tested applying the Shapiro–Wilk test, and homoscedasticity was tested applying Levene’s test. The statistical tests applied on the moisture content data showed non-normality and heteroscedasticity; consequently, the performed statistical analyses applied the non-parametric Friedman test. For the analyses of all other parameters the non-parametric Kruskal–Wallis test was applied, a consequence that the data showed non-normality and homoscedasticity (heating value, DML, basic density) or because of the overall limited number of samples (energy content).

3. Results

3.1. Temperature Development in Piles

The temperature development in the piles was investigated using the data of the temperature sensors at two height levels within the piles, presenting the temperature development over the storage time (Figure 5). The lowest temperature at the beginning was in the bio-pile-covered pile K2-BIOCOV, but the other piles were also set to the same level at the end of the trial, with the exception of the plastic-covered K1-PLAST pile. The temperature difference compared to the outside temperature started to increase towards the end of the trial, and the variation between pile temperatures decreased simultaneously. The temperature within piles did not reach sub-zero temperatures, despite lengthy frozen periods outside.

3.2. Moisture Content Development in Piles

The average initial moisture content of all stemwood chip piles was 35.8% (sd 3.4) (varying between 27.8 and 43.8%), and at the end of the experiment (Table 2), it had decreased by 10.25% to 32.18% (sd 8.6) (this varied between 22.4 and 57.8%). The difference was statistically significant (p = 0.001). In the uncovered piles (K3-NOCOV, K4-NOCOV), the average initial moisture content was 34.05% (sd 2.6), and at the end, 35.1% (sd 11) (varying between 23.9 and 57.8%). In the piles covered with the plastic cover (K1-PLAST, K5-PLAST), the moisture content was 35.8% (sd 3.7) at the beginning and 28% (sd 3.3) at the end of the experiment (varying between 22.4 and 35.3%). The difference between the uncovered and covered piles was not statistically significant (p = 0.289). The difference between the uncovered and plastic-covered piles at the end of the experiment was not statistically significant (p = 0.157). In the piles covered with the bio-pile cover (K2-BIOCOV, K6-BIOCOV), the moisture content at the beginning was 37.7% (sd 2.8) and 33.5% (sd 8.1) (varying between 24.6 and 57.5%) at the end of storage. The difference between the uncovered and bio-pile-covered piles was not statistically significant (p = 0.157). Chips dried by 22% during the experiment in plastic-covered piles and 11% in bio-pile-covered piles.
The lowest moisture content at the end of the experiment occurred in the piles covered with a plastic cover. The sample bags placed in the middle of the piles had an average moisture content 9% lower at the end of the experiment than the samples in the heap heads (Figure 4). The differences were not statistically significant (p = 0.564). The moisture content in the first level was 12% lower than in the second level. The difference was statistically significant (p = 0.021).

3.3. Heating Value and Energy Content

The heating value in the stemwood piles was 19.82 (sd 0.3) MJ kg−1, varying between 19.2 and 20.9 MJ kg−1 at the beginning of the experiment. At the end of the experiment, the heating value was 19.43 (sd 0.4) MJ kg−1, ranging between 18.7 and 20.7 MJ kg−1 (Table 2).
The energy content of the piles decreased during storage by an average of 5.0% (Table 3). The difference in the energy content at the beginning and end of treatments was statistically significant (p = 0.001). The difference at the end of the experiment between uncovered and covered piles was 4.4%, and the difference was not statistically significant (p = 0.072). At the end of the experiment, the energy content in the plastic-covered piles was 6.1% more than in the uncovered piles; the difference was statistically significant (p = 0.018). The energy content in the plastic-covered piles was 3.1% more than in the bio-pile-covered piles; the difference was not statistically significant (p = 0.206).

3.4. Dry Matter Losses (DML) during Storage

The average DML during the experiment across all piles totalled 3.74% at a range between 2.46 and 5.15%, and an average monthly DML of 0.63%, ranging from 0.42 to 0.87% (Table 4). The DML in uncovered piles was 4.24% and, in the covered piles, was 3.57%. The difference between the uncovered and covered piles was not statistically significant (p = 0.089). DML in the plastic-covered piles was, on average, 2.87%, and DML was 4.3% in the bio-pile-covered piles. The difference between the uncovered and plastic-covered piles was statistically significant (p = 0.037) and not significant between the uncovered and bio-pile-covered piles (p = 0.355).

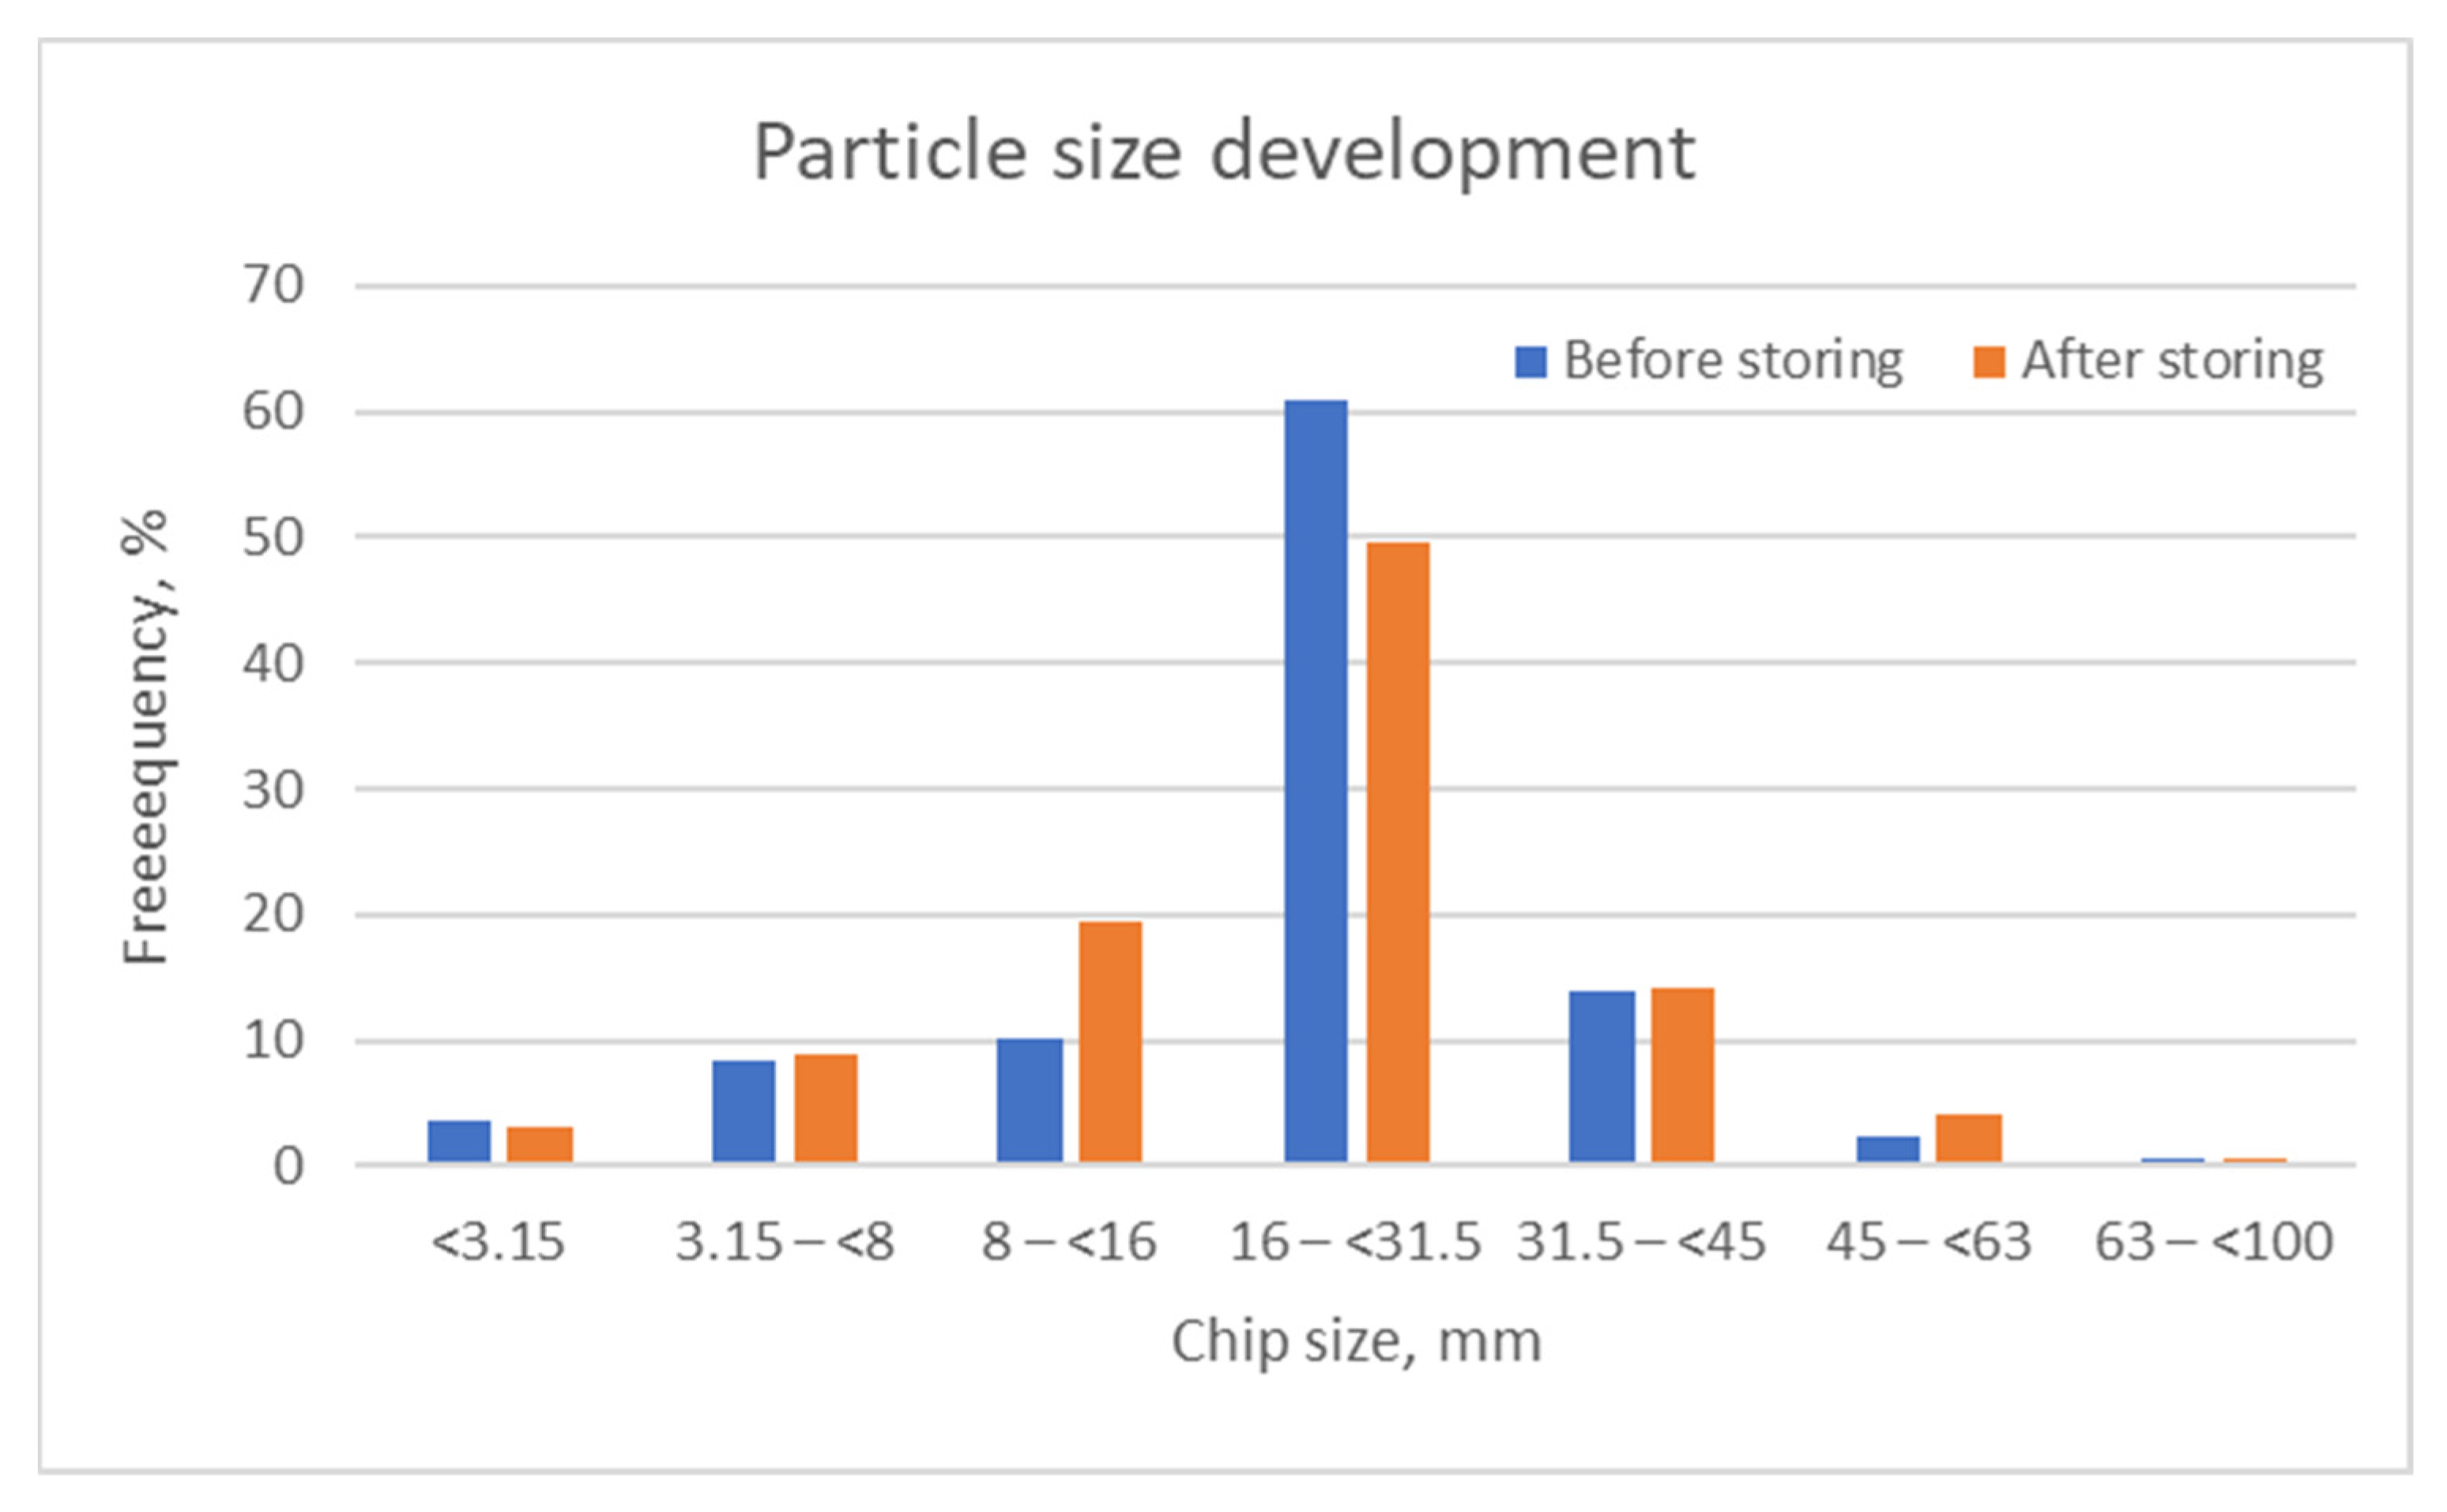
3.5. Basic Density and Results of Particle Size Analyses

At the beginning of the experiment, the basic density of the stemwood chips was 439.6 (sd 22.8) kg m−3 (varying between 399.1 and 490.7 kg m−3) (Table 2). During a storage period of 5.9 months, the density decreased by almost 4% to 423.7 (sd 23.0) kg m−3 (varying between 374.3 and 478.7 kg m−3). The difference was statistically significant (p = 0.001). The difference in basic density between the covered and uncovered piles was 3.6% after the storage period, and the difference was not statistically significant (p = 0.089). The difference in basic density between the uncovered piles and the plastic-covered piles at the end of the experiment was 3.0%, and the difference was statistically significant (p = 0.025). The difference between the uncovered piles and the piles with a bio-pile cover was 0.9%, and the difference was not statistically significant (p = 0.483).
The particle size analyses from the stemwood chip piles resulted in particle size class P31 [32], both before and after the storage period (Figure 6). The amounts of fines were less than 5% (F05) in the experiment, during the storage, the amounts of fines increased.

4. Discussion

The applied study methodology was comparable to the procedures presented by previous studies on comparable material [20,26]. The results showed a general low level of measured average temperatures within the piles followed during storage. Results are similar to previous studies on wood chips storage where measured temperatures within the piles also remained below 40 °C [20,26]. This may be explained by the high quality of the stored stemwood chips, indicated by the parameters presented in this experiment’s results, e.g., moisture content and particle size distribution. This explanation is in line with findings by the authors of [33], who stated DML were lower for drier material and material containing lower amounts of needles and fine particles in studies with logging residue material. Research presented in [20] stated DML during seasonal storage of spruce woodchips was up to 11.1%, with mean monthly DML of 0.7–2.2%. For chips produced from Norway spruce stemwood, the authors of [26] presented monthly DML of 0.4% in a pile covered with a semi-permeable sheet and 1.1% in uncovered piles. Consequently, the presented monthly DML of 0.63% for stemwood chip storage in this study can be considered low, though within the range of previous studies. Results showed that the energy content of the piles decreased during storage by an average of 5.0%, a decrease that is in line with the range of usable energy content loss presented for the storage of energy roundwood chip piles during wintertime [20].
The piles were constructed according to the order of material arrivals; the degree of homogenisation of the stemwood material within each pile remained unspecified, despite the practical efforts to achieve a homogenisation of the material. This circumstance may affect the gained results despite that the chips for the balance bags were intensively homogenised for all samples since the processes that occur within sample bags are highly dependent on processes that occur in surrounding environment. Moisture content decreased during storage to 32%, which is a similar level and decrease in moisture content as that presented in the literature, with lower values achieved by covered energy roundwood chip piles [20]. As was expected from the pile geometry, the sample bags placed in the middle of the piles had an average moisture content lower at the end of the experiment than the samples taken from the top of the piles; and the moisture content in the first level was significantly lower than in the second level. This result is in line with the literature, where layer formation regarding moisture content during wood chip storage was reported [20,23]. The result showed the inhomogeneity of the moisture content distribution within piles, with the outer zones of the piles exposed to local meteorological conditions.
In addition to the moisture content samples taken during the trials, the end-using facility (CHP plant) using the materials took samples of chips delivered to the plant for combustion according to their own sampling methodology. The samples received at the plant showed higher moisture content at the plant reception than the samples taken at the end of the storage phase; the average received moisture content was 44.3% for stemwood chips. The differences between samples from piles and truckloads may be explained by the occurrence of snow and cranks in material deliveries on the truckloads, because the piles were delivered in the midwinter when the snow depth in Kuopio was 46 cm; however, the uncertainties associated with the sampling methodology applied by the end-using facility also need to be noted. Nevertheless, this effect also shows the importance of sufficient moisture content samples during the winter, as recently demonstrated in northern Sweden by Berg and Bergström [34].
The method for covering the piles differs mainly between the cover materials. To conduct an indicative comparison of operating efficiency to determine the practicability of the alternative solutions, a time study using video recording was performed applying the continuous timing method [35]. The time study included recording the actual pile covering at the Kuopio site using plastic and the Livetech Suoja® material; the production and preparation work for these materials were excluded from the time study. Therefore, the time study exposed the differences between the alternative cover materials in the applied covering methods. The covering of piles using plastic covers required a wheel loader equipped with a specifically designed metal frame as a holder for the plastic roll. Several workers pulled the plastic cover manually over the piles, followed by an excavator covering the bottom edges of the cover with additional chips. The bio-pile cover could be sprayed by a single operator using a specially designed truck. However, the comparison of both methodologies needed to take the size of piles and the space limitations and pile access at the experiment site into account, which precluded an exact direct comparison of both alternatives and did not allow a detailed analysis of working elements. Therefore, both methodologies consumed nearly the same amount of total time in this experimental set-up when the covering process alone was considered.
When considering a comparison of operating efficiency to determine the practicability of the innovative solution with the existing alternatives, one needs to consider the space constraints for both tested methods at the experiment site, which limits the comparability of the conducted time study. The studied methods would probably benefit from even larger piles with good accessibility around the piles for the optimal usability of the applied machinery. An evaluation of the commercial feasibility of such systems for contractors and recommendations of a possible broader commercial potential therefore remains open for future study.
The results highlighted the benefits of pile covering compared to the uncovered storage of wood chips, which is in line with previous studies; see [11,21,36]. The experiments showed that the covering using plastic tarps resulted in improvements of key drying parameters (DML) compared to uncovered piles. The bio-based cover material offers a general potential alternative cover material, but significant differences with uncovered piles could not be identified. However, it needs to be noted that, in general, the results were sensitive to the number of analysed samples. In this study, several balance bags were damaged during the extraction at the end of the experiments and needed to be removed from further analyses. Further development potential remains and should consider the type of raw material for the specific coverage options. One might also consider the covering of other woody biomass such as logging residues, uncomminuted stems, delimbed logs, or pulpwood with this bio-based covering material to retain the moisture content within the raw material, ideas that may be worth future investigation.
The timing of the experiment, and especially the respective (weather) conditions (e.g., outside temperatures, wind, and precipitation), may have affected the success of the bio-based covering. However, it remains speculative whether the timing of covering operations had an effect during the present study. Success may also be linked to the bio-based binding material. The overall cover layer thickness used within the bio-based covering is applied to ensure immediate binding effects, particularly at the beginning of the cover set-up, while retaining a reasonable cost. Future studies should consider these aspects. It may also be of interest for future studies to conduct a lifecycle analysis of the entire process, including the production process, showing the ecological footprint of selected woodchip pile cover alternatives.
Even though significant differences were not identified based on a scientific perspective (α < 0.05), reported differences may have practical impacts from an industrial implementation perspective, e.g., when a significance level of α < 0.10 was considered. This may be the case for the difference in the energy content at the end of the experiment between uncovered and covered piles (p = 0.072) or differences in DML between the uncovered and covered piles (p = 0.089).

5. Conclusions

This study’s results reveal that the bio-pile cover performed as intended as a wood chip pile cover. Nevertheless, the performance of plastic tarps used as cover for wood chips outperformed the bio-pile cover. While differences in the key drying performance parameters can be found, the differences between uncovered piles and those covered with plastic tarps, as well as between the bio-based and the uncovered piles, were not significant. From a scientific perspective, we conclude that the bio-based cover in the studied conditions does not render better storage conditions than those in current practices. However, our study indicates possible fossil-substitutional benefits by using biobased covers, which calls for further R&D work in this matter.

Author Contributions

Conceptualisation, R.P., and J.R.; methodology, J.R., E.A., D.B., and L.S.; formal analysis, J.R.; data curation, R.P., J.R., and L.S.; writing—original draft preparation, R.P., and J.R.; writing—review and editing, R.P., J.R., E.A., D.B., and L.S.; visualisation, R.P., and J.R.; supervision, L.S.; project administration, R.P., and J.R.; funding acquisition, R.P., J.R., and D.B. All authors have read and agreed to the published version of the manuscript.

Funding

The authors gratefully acknowledge financial support from the “Innovative ecological pile cover for biomass chip storage” project co-funded by the IEA Bioenergy Task 43 (Sustainable biomass supply integration for bioenergy within the broader bioeconomy) and the Haiku project (Self-heating in drying and quality management of wood chip piles—Haiku), funded by Business Finland EAKR [A75553]. Furthermore, co-funding from the Academy of Finland’s Flagship Programme project UNITE—Forest-Human-Machine Interplay—Building Resilience, Redefining Value Networks and Enabling Meaningful Experiences [grant number 337,655] and the project Bio4EmiCon—Bioenergy supply chain solutions and climate policy actions for emission control—funded by the Natural Resources Institute Finland (Luke) are gratefully acknowledged.

Institutional Review Board Statement

Not applicable.

Informed Consent Statement

Not applicable.

Data Availability Statement

Not applicable.

Acknowledgments

The authors are grateful to all the companies, entrepreneurs, and operators involved for their support with the study. We would especially like to thank Kuopion Energia Oy, Livetech Oy, Stora Enso Oyj, and Energiapalvelu Väisänen Oy for their support. The authors also wish to acknowledge Acolad Finland Oy for its language review. We also thank Matti Savinainen, Timo Muhonen, and the laboratory staff of the Natural Resources Institute Finland (Luke) for their technical assistance.

Conflicts of Interest

The authors declare no conflict of interest. The funders had no role in the study’s design; in the collection, analyses, or interpretation of data; in the writing of the manuscript; or in the decision to publish the results.

References

  1. Official Statistics of Finland (OSF). Energy Consumption 2020 (Preliminary); Natural Resources Institute Finland: Helsinki, Finland, 2021; Available online: https://stat.luke.fi/en/energy-consumption-2020-preliminary_en (accessed on 6 September 2021).
  2. Väätäinen, K.; Anttila, P.; Eliasson, L.; Enström, J.; Laitila, J.; Prinz, R.; Routa, J. Roundwood and Biomass Logistics in Finland and Sweden. Croat. J. For. Eng. 2021, 42, 39–61. [Google Scholar] [CrossRef]
  3. Väätäinen, K.; Prinz, R.; Malinen, J.; Laitila, J.; Sikanen, L. Alternative operation models for using a feed-in terminal as a part of the forest chip supply system for a CHP plant. GCB Bioenergy 2017, 9, 1657–1673. [Google Scholar] [CrossRef] [Green Version]
  4. Communication from the Commission to the European Parliament, the Council, the European Economic and Social Committee and the Committee of the Regions. A European Strategy for Plastics in a Circular Economy. Brussels. 16 January 2018, p. 17. Available online: https://eur-lex.europa.eu/legal-content/EN/TXT/?qid=1516265440535&uri=COM:2018:28:FIN (accessed on 16 August 2021).
  5. Röser, D.; Mola-Yudego, B.; Sikanen, L.; Prinz, R.; Gritten, D.; Emer, B.; Väätäinen, K.; Erkkilä, A. Natural drying treatments during seasonal storage of wood for bioenergy in different European locations. Biomass Bioenergy 2011, 35, 4238–4247. [Google Scholar] [CrossRef]
  6. Pettersson, M.; Nordfjell, T. Fuel quality changes during seasonal storage of compacted logging residues and young trees. Biomass Bioenergy 2007, 31, 782–792. [Google Scholar] [CrossRef]
  7. Erber, G.; Kanzian, C.; Stampfer, K. Modelling natural drying of European beech (Fagus sylvatica L.) logs for energy based on meteorological data. Scand. J. For. Res. 2016, 31, 294–301. [Google Scholar] [CrossRef]
  8. Filbakk, T.; Høibø, O.; Nurmi, J. Modelling natural drying efficiency in covered and uncovered piles of whole broadleaf trees for energy use. Biomass Bioenergy 2011, 35, 454–463. [Google Scholar] [CrossRef]
  9. Filbakk, T.; Høibø, O.A.; Dibdiakova, J.; Nurmi, J. Modelling moisture content and dry matter loss during storage of logging residues for energy. Scand. J. For. Res. 2011, 26, 267–277. [Google Scholar] [CrossRef]
  10. Jirjis, R. Storage and drying of wood fuel. Biomass Bioenergy 1995, 9, 181–190. [Google Scholar] [CrossRef]
  11. Anerud, E.; Krigstin, S.; Routa, J.; Brännström, H.; Arshadi, M.; Helmeste, C.; Bergström, D.; Egnell, G. Dry Matter Losses during Biomass Storage—Measures to Minimize Feedstock Degradation; IEA Bioenergy, 2019; p. 45. Available online: https://www.ieabioenergy.com/wp-content/uploads/2020/01/EIA-Dry-Matter-Loss_Final.pdf (accessed on 19 August 2021).
  12. Ahtikoski, A.; Routa, J.; Repola, J.; Laitila, J. The financial viability of artificial drying of forest chips, a case study from Northern Finland. J. Clean. Prod. 2019, 212, 1454–1461. [Google Scholar] [CrossRef]
  13. Krigstin, S.; Helmeste, C.; Wetzel, S.; Volpé, S. Managing self-heating & quality changes in forest residue wood waste piles. Biomass Bioenergy 2020, 141, 105659. [Google Scholar] [CrossRef]
  14. Routa, J.; Kolström, M.; Ruotsalainen, J.; Sikanen, L. Forecasting moisture changes of energy wood as a part of logistic management. Mezzinatne 2012, 25, 33–35. [Google Scholar]
  15. Routa, J.; Kolström, M.; Ruotsalainen, J.; Sikanen, L. Validation of prediction models for estimating the moisture content of logging residues during storage. Biomass Bioenergy 2016, 94, 85–93. [Google Scholar] [CrossRef]
  16. Eliasson, L.; Anerud, E.; Grönlund, Ö.; von Hofsten, H. Managing moisture content during storage of logging residues at landings—Effects of coverage strategies. Renew. Energy 2020, 145, 2510–2515. [Google Scholar] [CrossRef]
  17. Routa, J.; Brännström, H.; Laitila, J. Effects of storage on dry matter, energy content and amount of extractives in Norway spruce bark. Biomass Bioenergy 2020, 143, 105821. [Google Scholar] [CrossRef]
  18. Routa, J.; Brännström, H.; Hellström, J.; Laitila, J. Influence of storage on the physical and chemical properties of Scots pine bark. BioEnergy Res. 2021, 14, 575–587. [Google Scholar] [CrossRef]
  19. Anerud, E.; Routa, J.; Bergström, D.; Eliasson, L. Fuel quality of stored spruce bark—Influence of semi-permeable covering material. Fuel 2020, 279, 118467. [Google Scholar] [CrossRef]
  20. Hofmann, N.; Mendel, T.; Schulmeyer, F.; Kuptz, D.; Borchert, H.; Hartmann, H. Drying effects and dry matter losses during seasonal storage of spruce wood chips under practical conditions. Biomass Bioenergy 2018, 111, 196–205. [Google Scholar] [CrossRef]
  21. Anerud, E.; Jirjis, R.; Larsson, G.; Eliasson, L. Fuel quality of stored wood chips—Influence of semi-permeable covering material. Appl. Energy 2018, 231, 628–634. [Google Scholar] [CrossRef]
  22. Barontini, M.; Scarfone, A.; Spinelli, R.; Gallucci, F.; Santangelo, E.; Acampora, A.; Jirjis, R.; Civitarese, V.; Pari, L. Storage dynamics and fuel quality of poplar chips. Biomass Bioenergy 2014, 62, 17–25. [Google Scholar] [CrossRef]
  23. Lenz, H.; Idler, C.; Hartung, E.; Pecenka, R. Open-air storage offine and coarse wood chips of poplar from short rotation coppice in covered piles. Biomass Bioenergy 2015, 83, 269–277. [Google Scholar] [CrossRef]
  24. Pari, L.; Brambilla, M.; Bisaglia, C.; Del Giudice, A.; Croce, S.; Salerno, M.; Gallucci, F. Poplar wood chip storage: Effect of particle size and breathable covering on drying dynamics and biofuel quality. Biomass Bioenergy 2015, 81, 282–287. [Google Scholar] [CrossRef]
  25. Jirjis, R.; Pari, L.; Sissot, F. Storage of Poplar Wood Chips in Northern Italy. In Proceedings of the World Bioenergy Conference and Exhibition on Biomass for Energy, Jönköping, Sweden, 27–29 May 2008; pp. 107–111. [Google Scholar]
  26. Anerud, E.; Bergström, D.; Routa, J.; Eliasson, L. Fuel quality and dry matter losses of stored wood chips—Influence of cover material. Biomass Bioenergy 2021, 150, 106109. [Google Scholar] [CrossRef]
  27. Livetech. Livetech Suoja®. 2021. Available online: https://livetech.fi/en/ (accessed on 27 May 2021).
  28. SFS-EN 14774-2; Solid Biofuels. Determination of Moisture Content. Oven Dry Method. Part 2: Total Moisture. Simplified Method. Finnish Standards Association: Helsinki, Finland, 2010.
  29. SFS-EN 14775; Solid Biofuels. Determination of Ash Content. Finnish Standards Association: Helsinki, Finland, 2010.
  30. SCAN-CM 43:95; Wood Chips for Pulp Production. Basic Density. Scandinavian Pulp, Paper and Board Testing Committee: Stockholm, Sweden, 1995.
  31. SFS-EN ISO 18125:2017; Solid Biofuels. Determination of Caloric Value. Finnish Standards Association: Helsinki, Finland, 2017.
  32. Alakangas, E.; Impola, R. Quality Guidelines for Wood Fuels in Finland; VTT-M-04712-15; The Bioenergy Association of Finland, Finnish Energy, Finnish Forest Industries Federation: Helsinki, Finland; VTT Technical Research Centre of Finland: Espoo, Finland, 2015; p. 60. [Google Scholar]
  33. Thörnqvist, T. Drying and storage of forest residues for energy production. Biomass 1985, 7, 125–134. [Google Scholar] [CrossRef]
  34. Berg, S.; Bergström, D. Quality variation in comminuted forest fuels delivered during the winter in north Sweden. Int. J. For. Eng. 2021, 32, 11–18. [Google Scholar] [CrossRef]
  35. Harstela, P. Work studies in forestry. Silva Carelica 1991, 18, 41. [Google Scholar]
  36. Wästerlund, I.; Nilsson, P.; Gref, R. Influence of storage on properties of wood chip material. J. For. Sci. 2017, 63, 182–191. [Google Scholar] [CrossRef] [Green Version]
Figure 1. Cover of two experimental piles with the innovative Livetech Suoja® material using a specially designed truck at the experimental site. Source: Luke/Robert Prinz.
Energies 15 01680 g001
Figure 2. Established experiment, with stemwood chip piles at Kuopion Energia’s paved terminal premises. The experiment included two uncovered piles, two covered with plastic, and two covered with Livetech Suoja® material (bio-pile cover). Source: Luke/Robert Prinz.
Energies 15 01680 g002
Figure 3. Flowchart of the experiment indicating the chronological steps of the study.
Energies 15 01680 g003
Figure 4. Schematic sketch of a pile in the experiment, indicating the approximate positions of balance bags within the chip piles.
Energies 15 01680 g004
Figure 5. Temperature development in the experiment within piles during the storage of chips for the different cover alternatives of plastic (PLAST), uncovered (NOCOV) and the bio-pile cover (BIOCOV), along with the outside temperature (Temp_OUT) and the cumulative precipitation (Precip_CUM) on the secondary axis.
Energies 15 01680 g005
Figure 6. Particle size distribution in stemwood chip piles during the experiment before and after the storage period.
Energies 15 01680 g006
Table 1. Details of the piles with different cover alternatives (uncovered, plastic cover, bio-pile cover).
Pile NoApproximate Pile Size (Length, Width, Height), mVolume, m3Cover
K1-PLAST18.0 × 5.0 × 3.5214plastic
K2-BIOCOV18.0 × 5.0 × 3.5181bio-pile cover
K3-NOCOV18.0 × 5.0 × 3.5187uncovered
K4-NOCOV18.0 × 5.0 × 3.5197uncovered
K5-PLAST18.0 × 5.0 × 3.5213plastic
K6-BIOCOV18.0 × 5.0 × 3.5177bio-pile cover
Table 2. Developments of moisture content, ash content, basic density, and heating values of the studied piles in the Kuopio (K) experiment in average values and standard deviations.
Pile No.Moisture Content at the BeginningMoisture Content at the EndBasic Density at the BeginningBasic Density at the EndHeating Value at the BeginningHeating Value at the End
%%kg m−3kg m−3MJ kg−1MJ kg−1
K1-PLAST35.35 ± 2.928.14 ± 3.6441.9 ± 24.6430.61 ± 20.219.72 ± 0.319.79 ± 0.3
K2-BIOCOV37.05 ± 2.930.74 ± 4429.0 ± 11.5413.41 ± 16.120.14 ± 0.419.83 ± 0.5
K3-NOCOV34.32 ± 2.336.71 ± 12.5437.4 ± 26.8418.77 ± 28.919.57 ± 0.119.32 ± 0.3
K4-NOCOV33.77 ± 2.833.48 ± 9.3436.9 ± 20.3418.02 ± 16.519.62 ± 0.219.12 ± 0.2
K5-PLAST36.31 ± 4.427.86 ± 3.1441.3 ± 21.0430.60 ± 23.619.81 ± 0.319.16 ± 0.1
K6-BIOCOV38.35 ± 2.636.16 ± 10.2451.1 ± 26.7430.65 ± 26.120.09 ± 0.219.25 ± 0.2
Average (K)35.86 ± 3.3932.18 ± 8.58439.60 ± 22.83423.68 ± 23.019.82 ± 0.3419.43 ± 0.41
Table 3. Energy content (MWh m−3) of the piles with different cover alternatives in the Kuopio (K) experiment in average values and standard deviations.
Pile NoMWh m−3, FreshMWh m−3, after StorageDifference, %
K1-PLAST2.27 ± 0.112.26 ± 0.080.71
K2-BIOCOV2.24 ± 0.052.15 ± 0.074.04
K3-NOCOV2.23 ± 0.142.09 ± 0.226.24
K4-NOCOV2.23 ± 0.102.08 ± 0.116.68
K5-PLAST2.26 ± 0.162.17 ± 0.144.38
K6-BIOCOV2.33 ± 0.112.14 ± 0.207.96
Average (K)2.26 ± 0.122.15 ± 0.155.01
Table 4. Dry matter loss during the Kuopio experiment (K) for the stemwood chip piles with different cover alternatives in average values and standard deviations.
Pile No.Dry Matter Loss During 5.9 Months of Storage, %Dry Matter Loss per Month, %
K1-PLAST3.33 ± 2.60.57 ± 0.5
K2-BIOCOV3.37 ± 3.10.57 ± 0.5
K3-NOCOV4.62 ± 2.40.78 ± 0.4
K4-NOCOV3.89 ± 2.70.66 ± 0.5
K5-PLAST2.46 ± 1.30.42 ± 0.2
K6-BIOCOV5.15 ± 5.10.87 ± 0.9
Average (K)3.74 ± 3.20.63 ± 0.5
Publisher’s Note: MDPI stays neutral with regard to jurisdictional claims in published maps and institutional affiliations.

