Review

Recent Advances in Small-Scale Carbon Capture Systems for Micro-Combined Heat and Power Applications

1
CanmetENERGY Research Centre, Natural Resources Canada, 1 Haanel Drive, Ottawa, ON K1A 1M1, Canada
2
Department of Energy, Politecnico di Milano, Via La Masa, 34-20156 Milan, Italy
*
Author to whom correspondence should be addressed.
Energies 2022, 15(8), 2938; https://doi.org/10.3390/en15082938
Submission received: 25 February 2022 / Revised: 25 March 2022 / Accepted: 13 April 2022 / Published: 16 April 2022
(This article belongs to the Special Issue CO2 Capture and Renewable Energy)

Abstract

:
To restrict global warming and relieve climate change, the world economy requires to decarbonize and reduce carbon dioxide (CO2) emissions to net-zero by mid-century. Carbon capture and storage (CCS), and carbon capture and utilization (CCU), by which CO2 emissions are captured from sources such as fossil power generation and combustion processes, and further either reused or stored, are recognized worldwide as key technologies for global warming mitigation. This paper provides a review of the latest published literature on small-scale carbon capture (CC) systems as applied in micro combined heat and power cogeneration systems for use in buildings. Previous studies have investigated a variety of small- or micro-scale combined heat and power configurations defined by their prime mover for CC integration. These include the micro gas turbine, the hybrid micro gas turbine and solid-state fuel cell system, and the biomass-fired organic Rankine cycle, all of which have been coupled with a post-combustion, amine-based absorption plant. After these configurations are defined, their performance is discussed. Considerations for optimizing the overall system parameters are identified using the same sources. The paper considers optimization of modifications to the micro gas turbine cycles with exhaust gas recirculation, humidification, and more advanced energy integration for optimal use of waste heat. Related investigations are based largely on numerical studies, with some preliminary experimental work undertaken on the Turbec T100 micro gas turbine. A brief survey is presented of some additional topics, including storage and utilization options, commercially available CC technologies, and direct atmospheric capture. Based on the available literature, it was found that carbon capture for small-scale systems introduces a large energy penalty due to the low concentration of CO2 in exhaust gases. Further development is required to decrease the energy loss from CC for economic feasibility on a small scale. For the micro gas turbine, exhaust gas recirculation, selective gas recirculation, and humidification were shown to improve overall system economic performance and efficiency. However, the highest global efficiencies were achieved by leveraging turbine exhaust waste heat to reduce the thermal energy requirement for solvent regeneration in the CC plant during low- or zero-heating loads. It was shown that although humidification cycles improved micro gas turbine cycle efficiencies, this may not be the best option to improve global efficiency if turbine waste heat is properly leveraged based on heating demands. The biomass-organic Rankine cycle and hybrid micro gas turbine, and solid-state fuel cell systems with CC, are in early developmental stages and require more research to assess their feasibility. However, the hybrid micro gas turbine and solid-state fuel cell energy system with CC was shown numerically to reach high global efficiency (51.4% LHV). It was also shown that the biomass-fired organic Rankine cycle system could result in negative emissions when coupled with a CC plant. In terms of costs, it was found that utilization through enhanced oil recovery was a promising strategy to offset the cost of carbon capture. Direct atmospheric capture was determined to be less economically feasible than capture from concentrated point sources; however, it has the benefit of negative carbon emissions.

1. Introduction

The International Energy Agency (IEA) has set a goal of carbon neutrality by 2100 for climate change mitigation. Additionally, the Paris Agreement has set a global initiative to reduce global warming to much less than 2 °C and to further engage efforts to reduce it to 1.5 °C [1,2,3]. Despite the increasing use of renewable energy sources, their growth is still insufficient to switch from fossil fuel consumption by the end of the century. Further, the current trend will limit the rise in global temperature to 2.7 °C by 2100, which is not sufficient to meet the 2 °C reduction target. Carbon capture, utilization, and storage (CCUS) is a proposed solution to achieve carbon neutrality during the transition from fossil fuels to fully renewable energy generation. Carbon capture (CC) is an attractive option as it aims to achieve carbon neutrality, while simultaneously generating waste carbon dioxide (CO2) that can be converted into products and sold for profit. Further, decentralized energy generation has been widely investigated as a possible developmental path for achieving carbon neutrality. Distributed power generation in the form of small, decentralized systems can support decrease in emissions and protection of grid capacity, while also offering options for renewable energy [4,5,6,7,8].
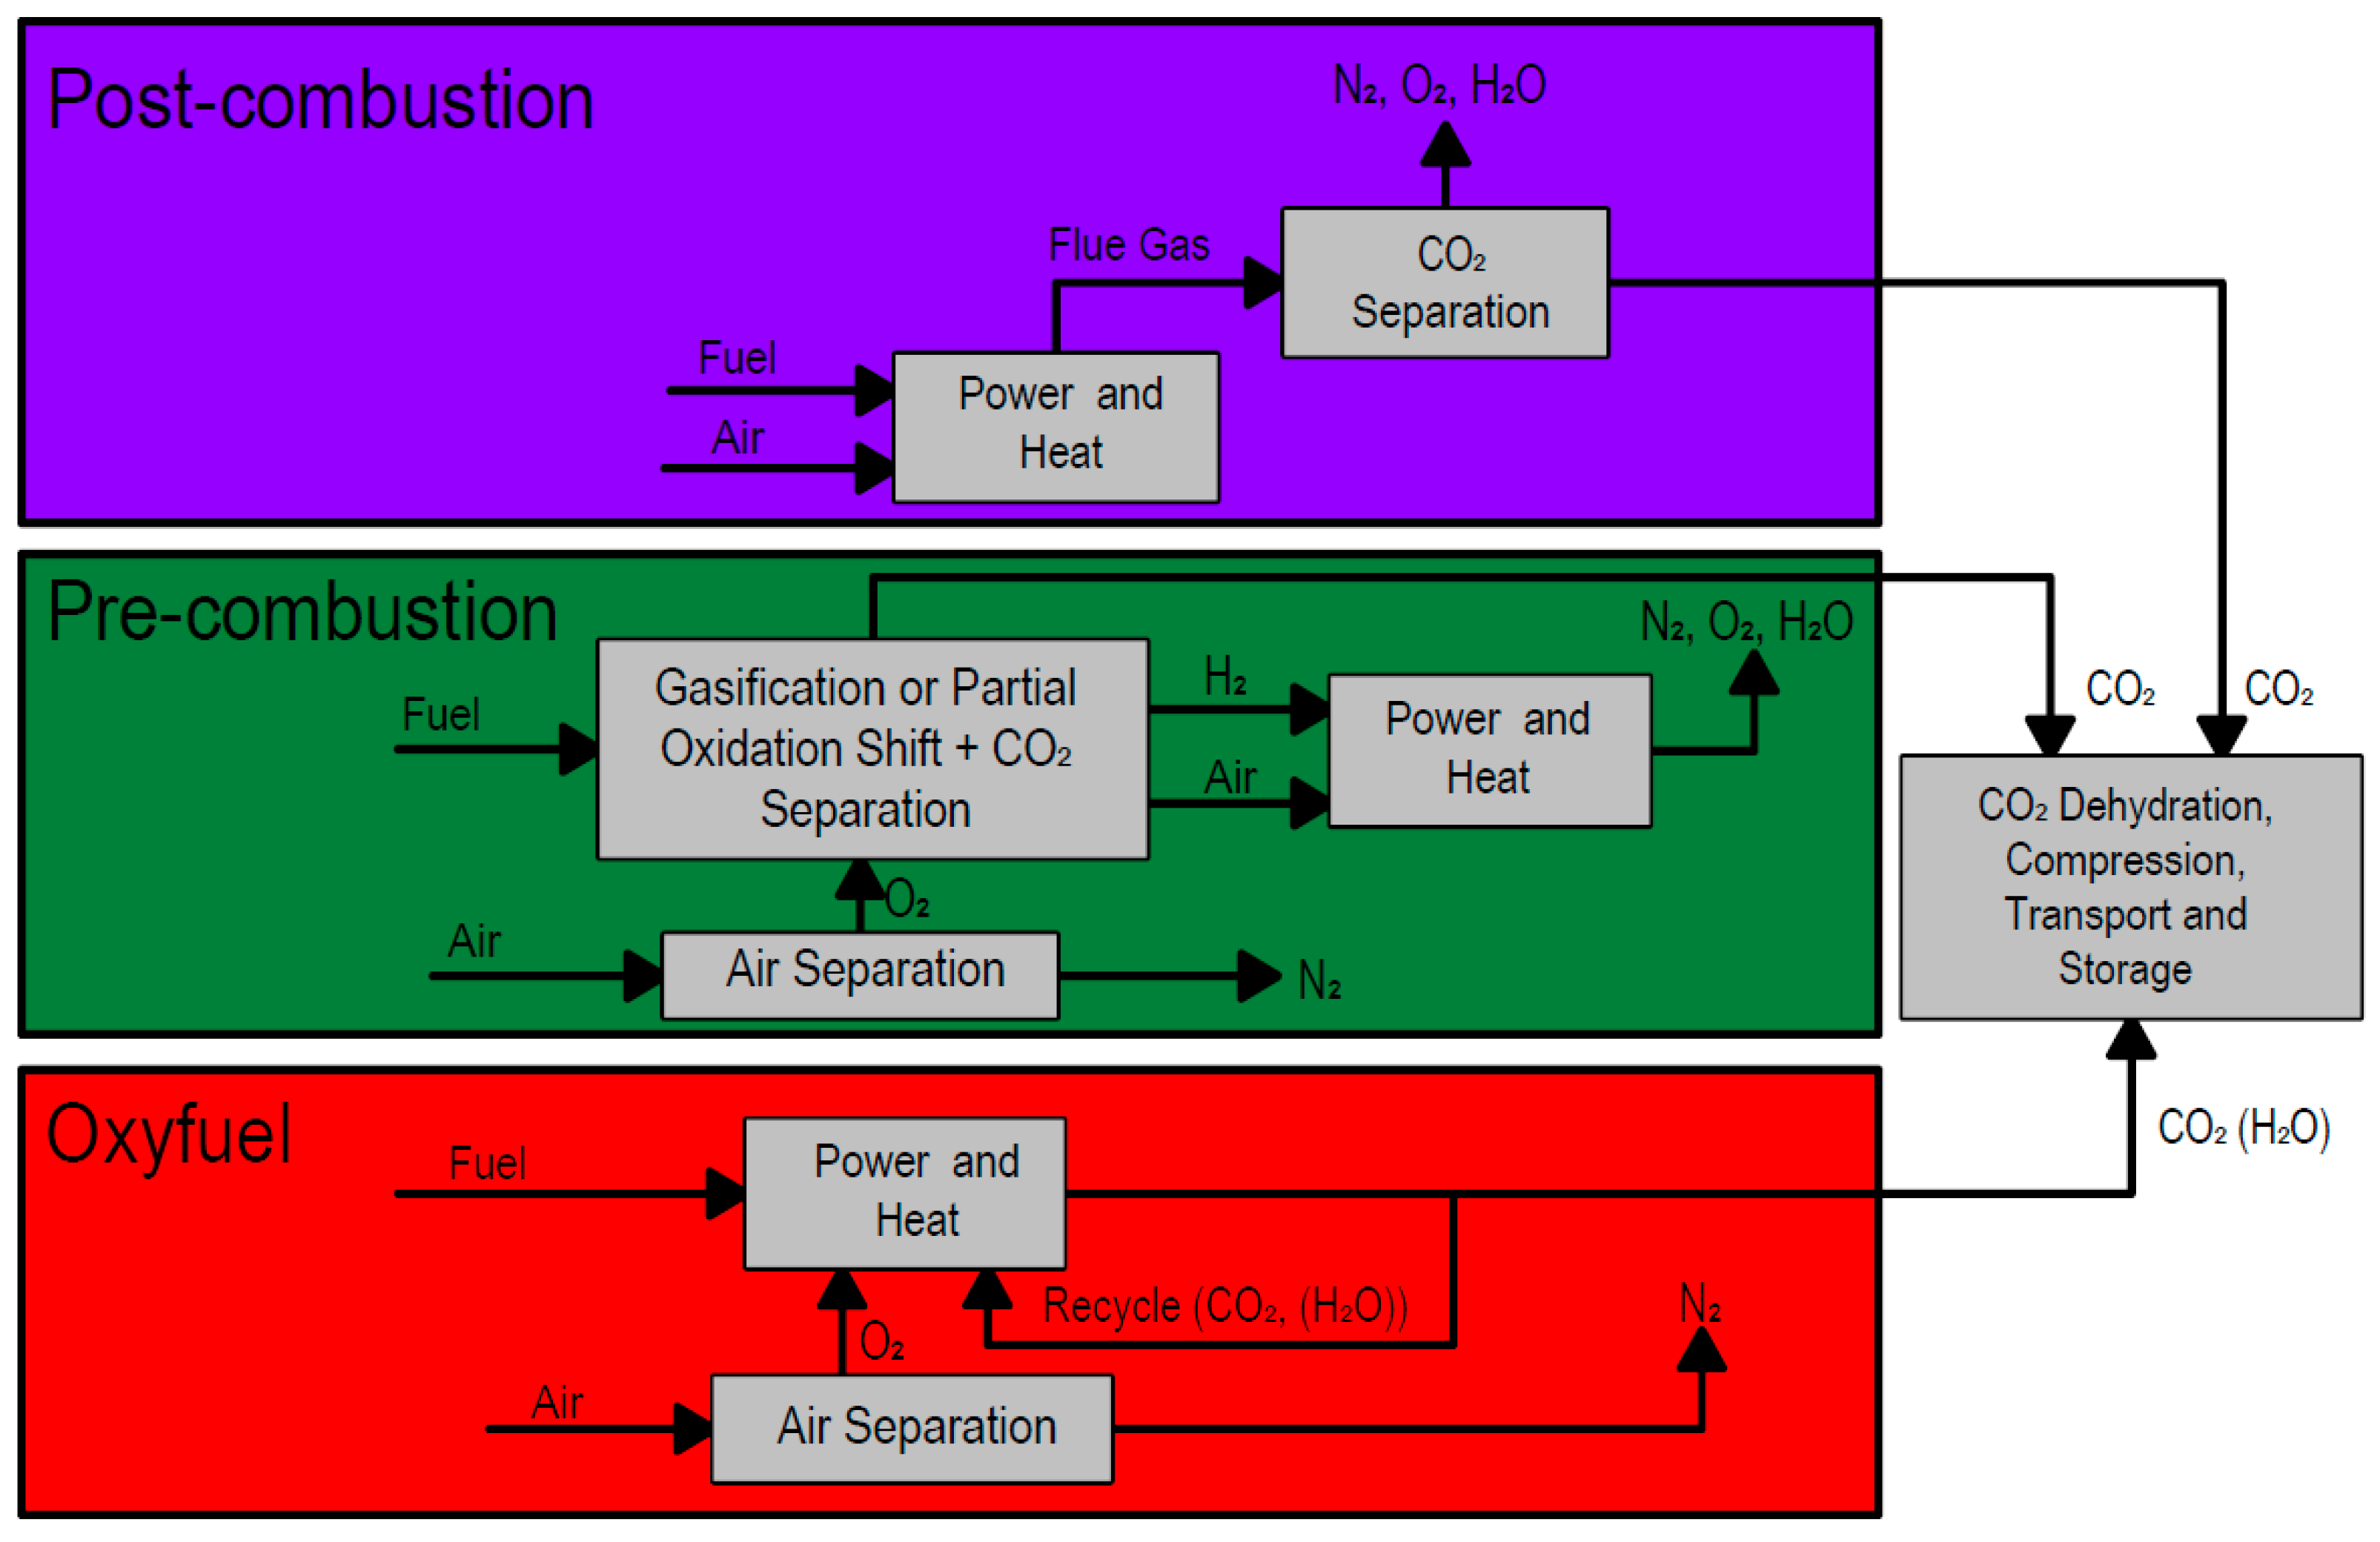
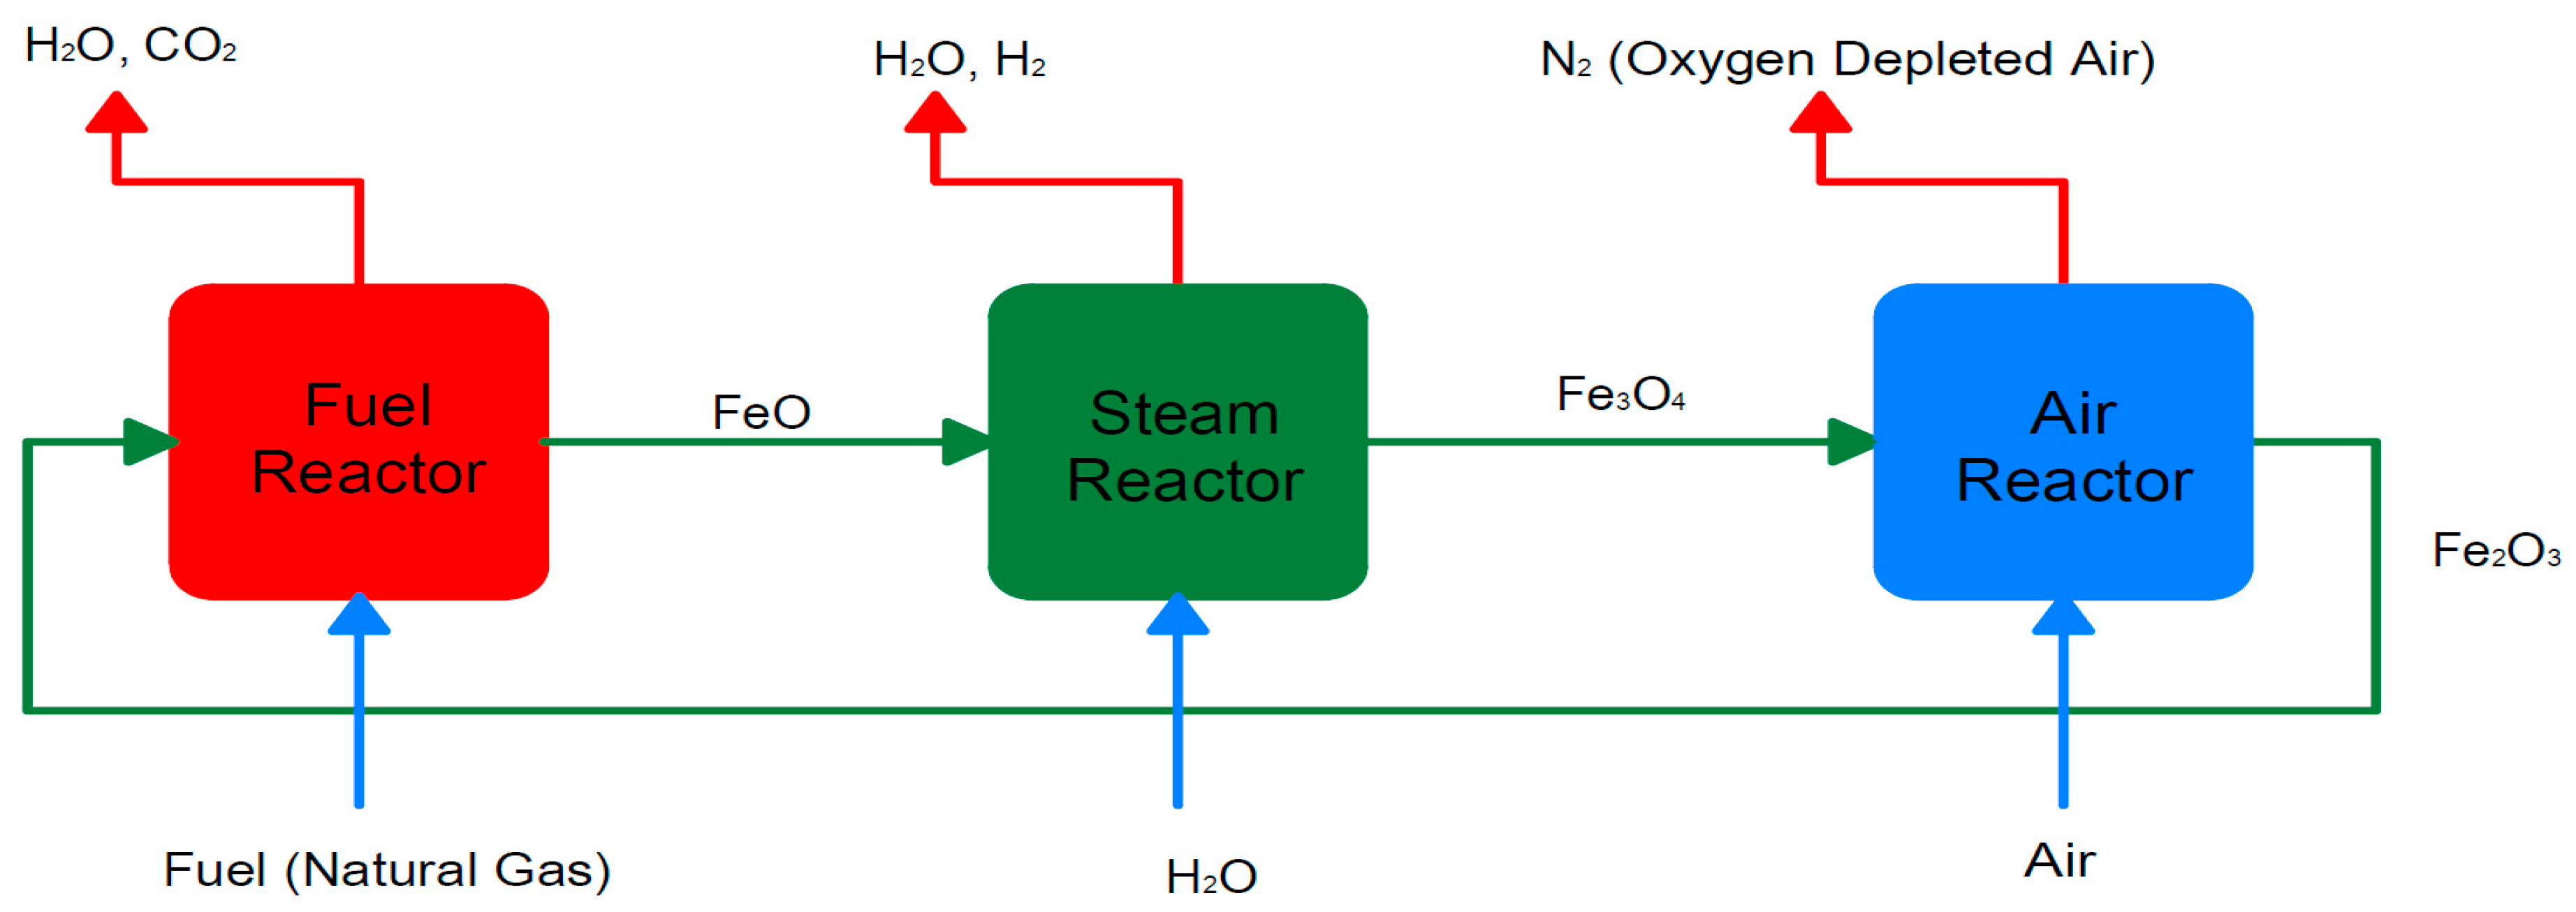
The available options for CC are grouped into either post-combustion, pre-combustion, or oxy-fuel combustion [9,10,11,12,13,14,15]. The basic processes are summarized in Figure 1.
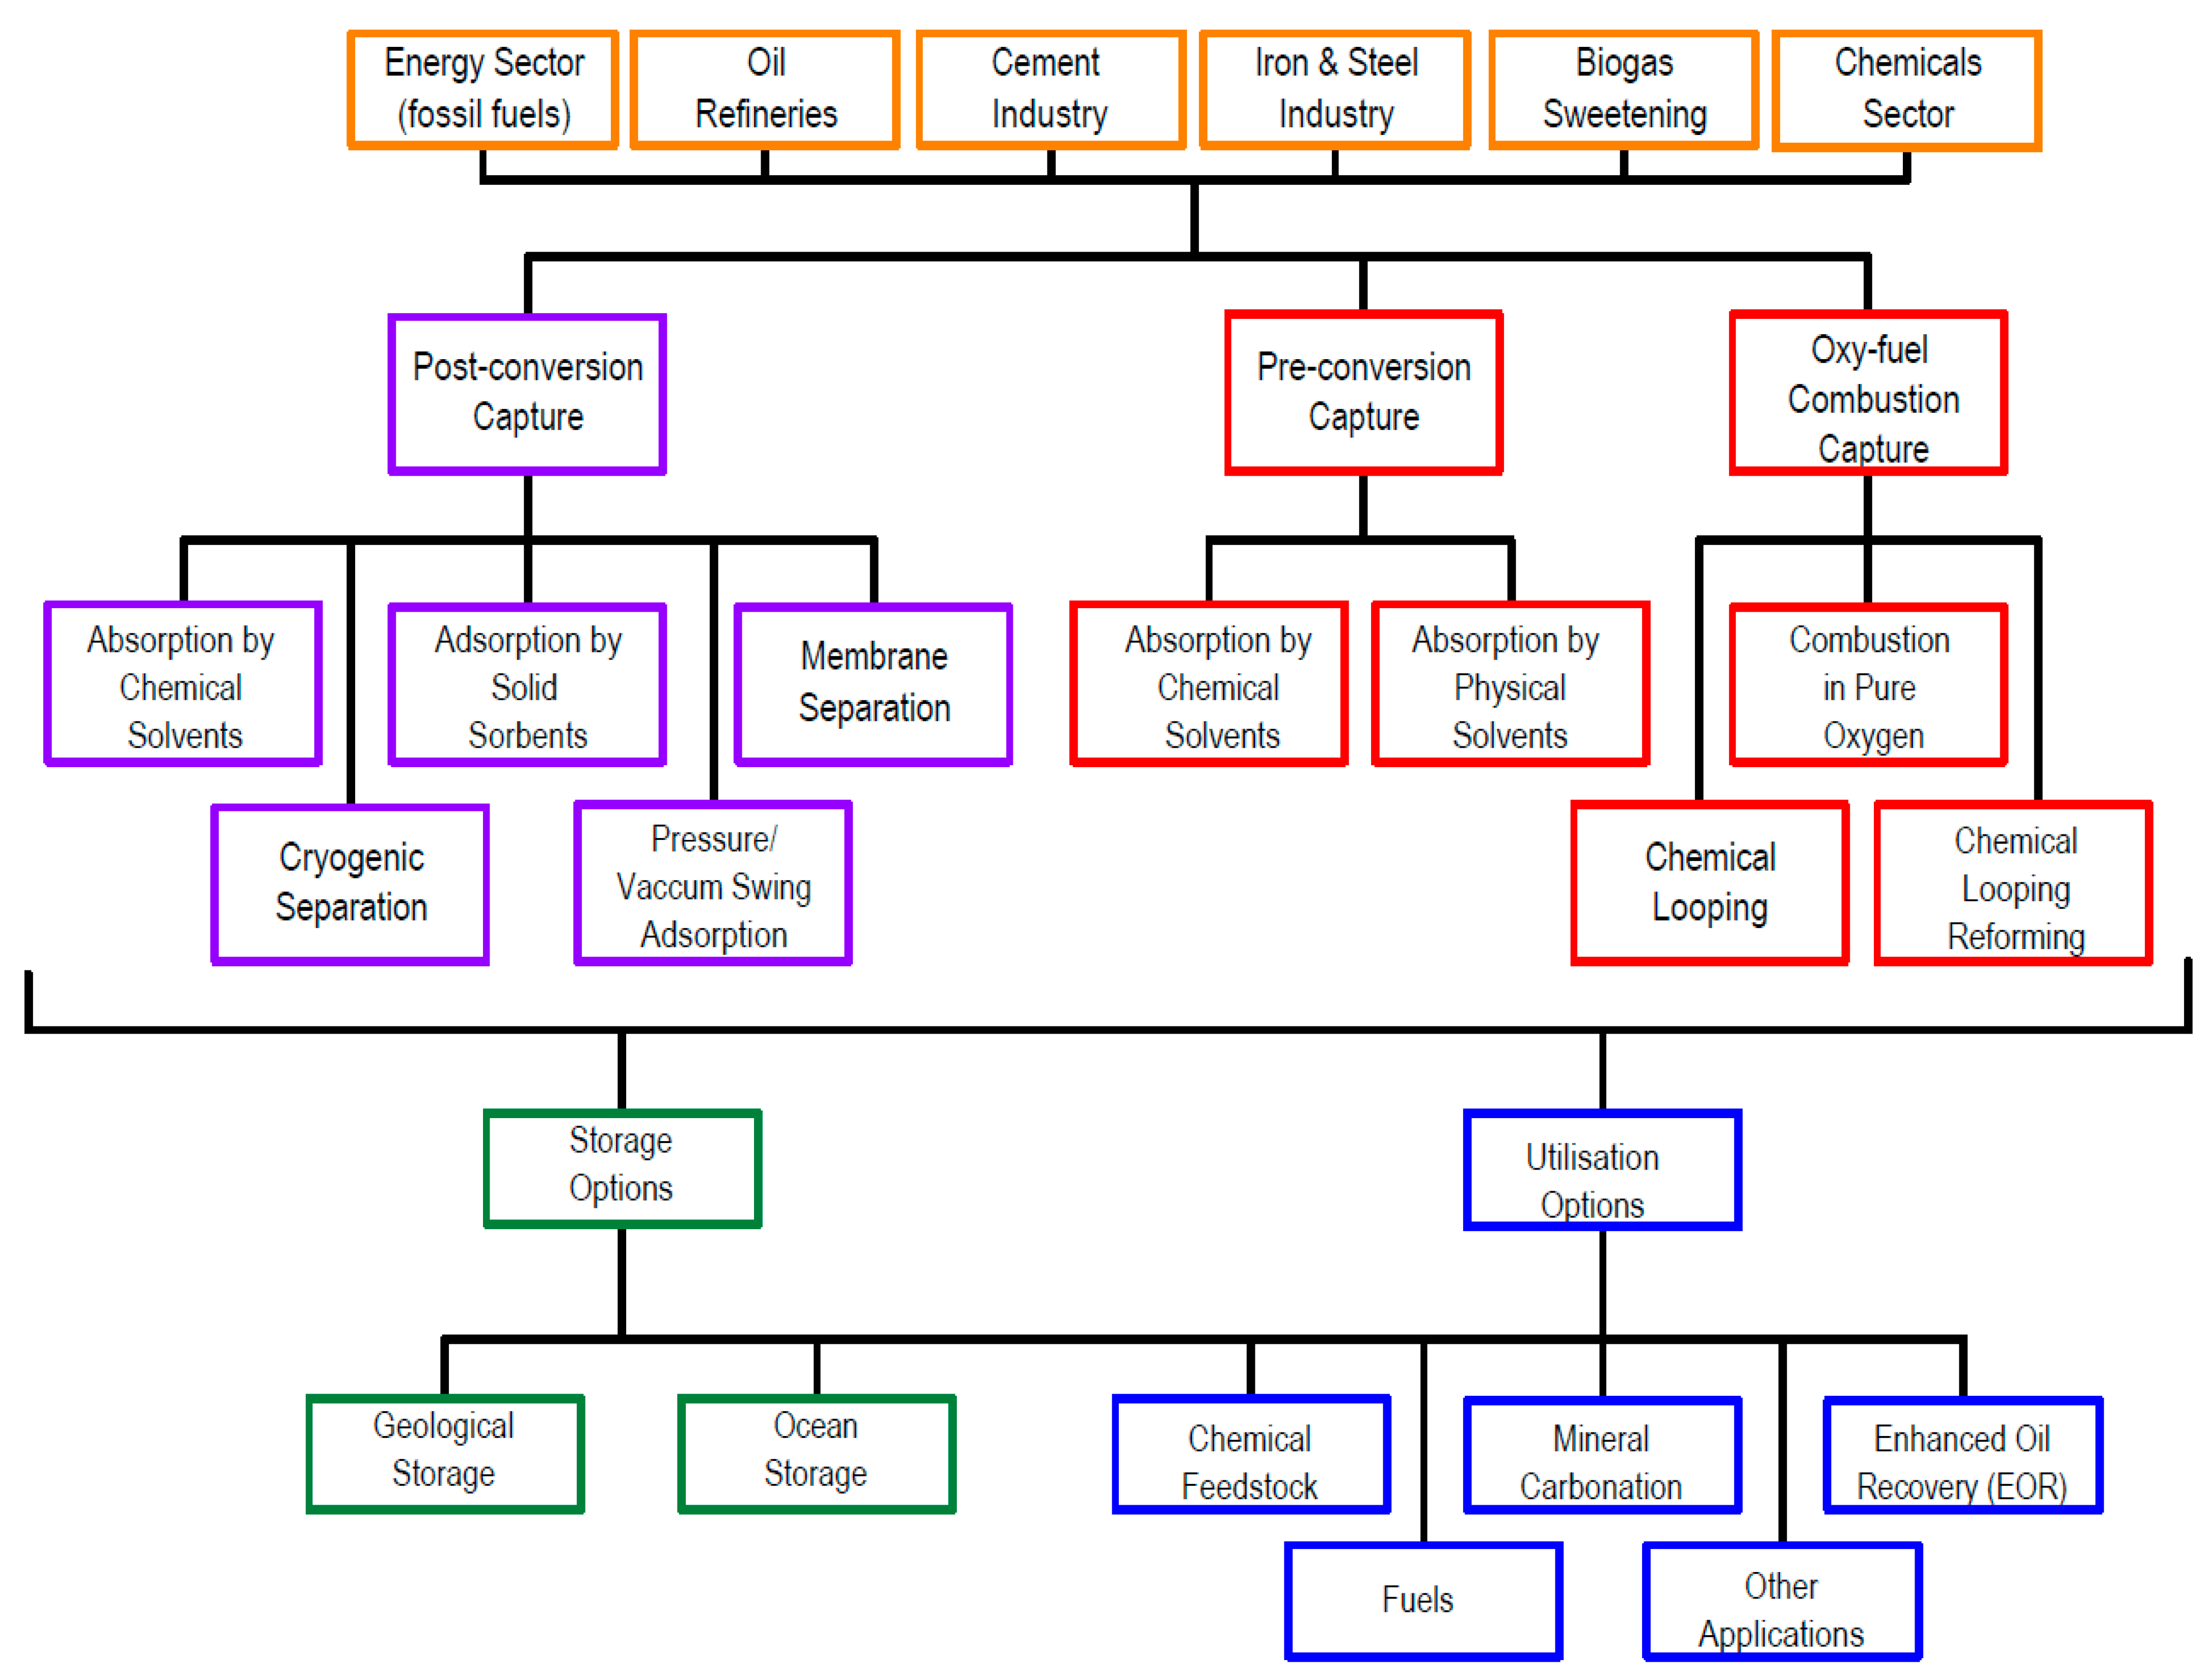
The capture methods that fall within each classification, as well as storage and utilization options, are summarized in Figure 2. Among the methods shown, absorption by mono-ethanolamine (MEA) for post-combustion capture is the most developed. Because of the high thermal energy requirement for solvent regeneration, this process is well suited to combined heat and power (CHP) applications, which supply recoverable heat [10]. Post-combustion absorption plants with an MEA-based solvent is the more commonly utilized method for small-scale carbon capture [16].
There exist numerous reviews and studies on large-scale carbon dioxide capture, utilization and storage [16,17,18,19,20,21,22,23], carbon capture and storage (CCS) [24,25,26,27], demonstration and deployment of CCS systems [28,29,30,31,32,33], cost of CCS [34,35], CCS applied in industry [36,37,38], CC [39,40], integration of CC in power generation plants [41,42] and in community scale energy systems [43,44], CC in pre-combustion, post-combustion and oxy-combustion in thermal power plants [45], CC post-combustion by chemical-looping [46], chemical absorption [46,47,48,49,50,51] or physical adsorption [52,53,54], membrane-based CC [55,56,57], and, finally, CC and separation technologies for end-of-pipe applications [58]. Although there is a myriad of dedicated research studies on large-scale CCUS-CCS or CC systems, available literature reviews on small-scale CCS for building applications are very limited.
Therefore, this review will focus on the current technological developments in carbon capture for decentralized, small-scale CHP generation applications. This is to provide a thorough review of the current technologies in development, and the associated results and challenges, as identified in the literature. For this purpose, the review is structured in the following manner: First the relevant system configurations studied in the literature are presented, and the associated studies introduced (Section 2). Subsequent performance and optimization sections (Section 3 and Section 4) then provide detail of the results, challenges, and optimal design parameters from the studies considered. A brief overview for current avenues of storage and utilization is presented, followed by an overview of commercially available small-scale and large-scale technologies (Section 5). Further, general costs of CC systems are briefly reported (Section 6). The next section provides a concise overview of current developments in direct air capture (DAC) technology. Following carbon capture and compression, the next step in the process chain is either storage or utilization (Section 7), while conclusions are drawn in the last section (Section 8).

2. Process and Configurations

This section provides an overview of the micro combined heat and power (micro-CHP) system configurations studied in the literature for CC applications. Each subsection is defined by the prime mover of the energy conversion system. The CC unit must be designed based on exhaust gas CO2 concentrations and volumetric flow rate and is, therefore, dependent upon the prime mover. The relevant literature associated with each energy system is presented, and the following performance section details results and challenges identified from the same literature.

2.1. Micro-Gas Turbine

The micro gas turbine (mGT) is a suitable technology for small-scale heat and power generation, given the push towards decentralized heat and power production. For decentralized, small-scale generation to be favorable, the solutions must be both carbon free and efficient. Within this framework, mGTs are an attractive solution as they provide high flexibility, as well as a global efficiency of 80% (electrical efficiency of 30% and thermal efficiency of 50%) [59,60,61,62,63,64]. The range of electrical power output from a typical mGT is between 50–500 kW, which is suitable for small-scale use in multi-family residential, commercial, and institutional applications. The available literature focusses on the Turbec T100 mGT [65], with a nominal power output of 100 kW, as it is well-known and can be considered representative of the current state of the art. The typical CC method uses an absorber-stripper system where the absorbent is a 30 wt% aqueous monoethanolamide (MEA) solution [47,49].
The Turbec T100 is a typical recuperative Brayton cycle mGT [65,66,67]. Figure 3 shows the schematic of a Turbec T100 mGT with exhaust gas recirculation (EGR) and coupled CC unit. Giorgetti et al. [67] analyzed this system to provide a baseline study on the effects of CC on the mGT cycle. These findings are presented in the performance section of this paper. This models the mGT Turbec T100 at Vrije Universiteit Brussel (VUB) and the Pilot-scale Advanced Capture Technology (PACT) facility at the UK Carbon Capture and Storage Research Centre. Of the literature examined, all studies used this general configuration, although some modified the system to include additional processes and cycles to improve overall performance, as will be discussed.
The general process of the cycle investigated by De Paepe et al. [68] can be described as follows: The air is compressed in a variable speed radial compressor (1) and passed through a recuperator (2) where it is preheated by the exhaust gas arriving from the turbine. The preheated air then enters the combustion chamber, where burning natural gas heats it to a nominal outlet temperature of 950 °C (3). The combustion gas mixture expands across the turbine (4), which delivers the power to drive the compressor and converts the excess power to electricity through a variable speed generator (5). The heat remaining in the gas after the recuperator is recovered through a gas-water heat exchanger (6), which can be used to heat water for combined heat and power systems. The exhaust gases are then split into two streams, one of which is recirculated to the compressor, and the other goes to the CC plant. Exhaust gas recirculation is one of the known emission control technologies for reducing NOx emissions by recirculating a part of the exhaust gas, while reducing fuel consumption and pumping loss. The EGR ratio is defined by the ratio of intake CO2 concentration to exhaust CO2 concentration.
The EGR stream passes through a cooler (7) to maintain high compression efficiency (to be discussed in a later section), and the condensed water is separated (8). The gas is next distributed over a blower (9) to provide a driving pressure increase, followed by a filter (10), which leads to the compressor inlet. A certain ratio of exhaust gases is also directed to the CC plant. The CC plant has two columns, one absorber and one stripper, as shown in Figure 3. A blower (11) provides the required pressure to drive the flue gas in the bottom of the absorber (13). The lean solvent is fed into the top. The interaction of the gas and liquid phases in the absorber drives the CO2 to the liquid phase, as a result of the concentration gradient at the liquid/gas interface. The rich solvent is then pumped through the heat exchanged (15), where it is heated to a higher temperature by the lean-solvent from the stripper bottom. It then enters the stripper column, where the solvent is regenerated through heat provided by pressurized hot water (16). The vapor at the top of the desorber enters the condenser, in which the water is removed, and nearly pure CO2 is obtained. The regenerated solvent is pumped back through the rich-lean heat exchanger, and cooled further by an air-cooled plate cooler (18). Wash columns are also mounted at the top of the stripper and absorber columns to eliminate entrained droplets of solvent transported by the flue gas by means of demineralized water. Wash columns have a low energy effect on the CC plant and are neglected in the numerical analysis performed by Giorgetti et al. [66,67].
Table 1 presents the key design conditions of the mGT and CC plant.
This configuration, with the PACT amine capture plant combined with a Turbec T100 mGT is considered in studies conducted by Akram et al. [69], Majoumerd et al. [70] and Ali et al. [71,72]. Their individual findings are detailed in the following performance section of the paper.
Due to the low CO2 concentration (~1.5 vol%) and high volumetric flowrate of exhaust gases that enter the CC plant, in addition to the substantial residual O2 amount due to CC plant integration, several cycle modifications have been proposed. One such modification is selective EGR (S-EGR), as opposed to the traditional EGR cycle, as shown in Figure 4. Bellas et al. [73] examined the influences of the S-EGR cycle on the mGT cycle for CC applications. The S-EGR system is similar to the traditional EGR cycle; however, the separated flue gases are passed through a selective membrane system that uses an air sweep stream that blends with the CO2 passing over the membrane. The CO2 and air are recirculated to the compressor inlet, while the CO2 exhausted gases are released to the atmosphere. The parallel and series configurations investigated by Bellas et al. [73] are shown in Figure 4. The parallel configuration was also investigated by Darabkhani et al. [74].
Several studies are available in the literature that examine the effect of humidification on mGT cycle performance investigated, for instance, by De Paepe et. al. [75,76] and by Best et al. [77]. De Paepe et al. [75] investigated several advanced humidification cycles as applied to mGT. Their results indicated that the REVAP cycle shown in Figure 5 could be considered optimal in terms of waste heat recovery and electrical efficiency. In the REVAP cycle, part of the air/liquid water mixture from injection is employed for compressor aftercooling.
However, the most common humidification cycle studied in the literature is the micro humidified air turbine (mHAT) cycle. Giorgetti et al. [66] assessed the performance of the mHAT cycle through modification of the standard mGT-EGR cycle through the addition of a saturation tower, as illustrated in Figure 6. This cycle can be considered typical throughout the examined literature. The general cycle process is modified as follows: After passing through the compressor the air is humidified at the saturation tower (11). In this configuration, the gas-water heat exchanger (6) is used to heat up the water for the saturation tower, and is no longer, or only partly, used for cogeneration purposes. To balance the water humidification, feedwater enters the circuit (12). A variable pressure pump is also added to drive the circulation of water (13).
Majoumerd et al. [70] assessed the performance of a typical mGT and mHAT coupled with an advanced post-combustion CO2 capture unit. The SOA chemical absorption unit also implements monoethanolamine (30 wt% MEA) as a chemical solvent. The capture plant configuration is similar to that studied by Giorgetti et al. [66], but the additional cooler for the lean solvent is removed.
Giorgetti et al. [78,79] investigated the performance of an mHAT system coupled with an amine-based absorption plant with energy integration between the two plants, which is not considered in other studies available in the literature. The energy integration between the CC plant and mGT system is presented in Figure 7. Waste heat from the exhaust gases is utilized based on the heat demand, which is represented by activation of blocks A, B, C, or D, as discussed in detail in Section 4.1.4.

2.2. Hybrid Fuel Cell Systems

Fuel cells such as those in small-scale applications [80,81] or in micro-scale applications [82,83], have high efficiency, as electricity is generated through an electrochemical reaction as opposed to a series of energy conversions. In the literature, hybrid fuel cell systems on a small-scale are scarce, while hybrid systems with large-scale gas turbines are more readily available, such as hybrid solid oxide fuel cells directly coupled to a gas turbine [84,85], or indirectly coupled to a gas turbine [86] in power plants, and hybrid solid oxide fuel cell-gas turbine cycles using alternative fuels [87].
Roohani Isfahani and Sedaghat [88] developed a novel system with a unique combination of a solid-state fuel cell, micro gas turbine, and CC unit to use natural gas energy in a more effective approach. The fuel cell power output considered was between 950 and 1360 kW, making the system applicable to decentralized energy generation with application to multi-use commercial buildings, as opposed to single-family dwellings and small businesses. The system comprises three reactors for splitting hydrogen and carbon dioxide from natural gas through the three-reactor chemical looping hydrogen generation (TRCL). Several other studies are available that focus on hybrid power plants of solid oxide fuel cell (SOFC), and micro-GTs operating at baseload [89,90] or part-load [91], applying various operating strategies [92,93] or using alternative fuels [94] for micro-CHP applications. However, Roohani Isfahani and Sedaghat [88] extended the above systems to integrate with a CC plant and TRCL system, which is pertinent to the topic of this review. The hybrid power plant is made up of a reformer, three-reactor chemical looping for hydrogen production, a fuel cell, micro-GT, an internal heat exchanger, and the CO2 capture loop. Natural gas is broken down into carbon dioxide and hydrogen constituents in the reformer, which is then passed into the TRCL reactors. The TRCL comprises of three reactors: fuel, steam and air reactors. In the first stage, fuel is injected into the fuel reactor (FR). In this reactor, hematite (Fe2O3), which contains a significant amount of elemental oxygen, is mainly reduced to FeO (Wüstite, a mineral form of iron (II) oxide) at 950 °C at the upper riser, and 890 °C at the bubbling bed. The fuel is converted into CO2 and H2O. In this stage, the CO2 is ready to be absorbed as a product. In the second reactor (steam reactor or SR) FeO (Wüstite) reacts exothermically with steam and creates magnetite (Fe3O4) and hydrogen at 950 °C. In the air reactor (AR), entered magnetite (Fe3O4) reacts exothermically with pure air, to produce hematite (Fe2O3) and oxygen-depleted air as products. The overall reaction changes methane (CH4) into hydrogen and CO2. CH4 is also converted to H2 and CO2. Therefore, CO2 is integrally separated from fuel. The TRCL reactors are operated at a pressure of 3 bar.
Steam from the heat recovery steam generator reacts with fuel in the reformer. The H2 from the steam reactor is then fed into the anode of the fuel cell, and O2 depleted air from the air reactor goes to the cathode to start electricity production. The fuel reactor exhaust CO2 is fed to the CO2 capture loop. Unreacted hydrogen from the SOFC is fed into the combustor and burned to produce sufficient hot gas to run the micro gas turbine. This latter produces energy that runs the adjacent compressor to compress the inlet air to the air reactor. The turbine exhaust gases are also used to preheat the incoming natural gas. In the CO2 capture loop, the incoming CO2 from the fuel reactor of the TRCL is cooled in the CO2 heat recovery steam generator (CO2 HRSG). The CO2 undergoes several compression and cooling processes to reach the pressure required in the pipeline. Figure 8 presents the overall system schematic, and Figure 9 depicts a detailed schematic of the TRCL.

2.3. Biomass-Fired Organic Rankine Cycle

The organic Rankine cycle (ORC) system is an attractive technology for cogeneration applications in the 200–1500 kW range, mainly used in waste heat recovery [95,96,97], at small-scale for industrial or commercial buildings [98,99], in small-scale and micro-scale biomass fueled CHP systems [100], or at micro-scale for residential applications [101]. However, few applications with small-scale ORCs with integrated CCS are commercially available. Zhu et al. [102] designed a biomass-fired ORC for small-scale CHP systems, coupled with an MEA-based CC unit, for which they performed an extensive thermo-economic simulation study. The system implements biomass combustion as the primary energy source and the ORC as secondary. The electric power output for the considered system ranges from 100–500 kW and is therefore applicable for small-scale applications, such as residential and commercial buildings, office building blocks, etc. The system schematic is provided in Figure 10. The process is defined in the following manner: The biomass fuel is combusted in the biomass boiler and heat is transferred to the pressurized hot water during process 9–8. The heat is then absorbed in the evaporator (4–1) by the organic working fluid, which then passes over the expander to produce power (1–2). The working fluid then enters the condenser where it is cooled by the cooling water (2–3). The cooling water absorbs the waste heat (10–11) to generate domestic hot water or discharges the heat in the cooling towers (17–18). From the biomass boiler, the flue gases preheat the combustion air entering the boiler (7–16), and then enter the MEA chemical absorption unit. Section 3.3 details the results and challenges encountered by Zhu et al. [102] as they relate to the system performance.

3. Performance

This section details the specific results and challenges pertaining to the performance of each configuration from the selected studies introduced in Section 2. It is divided into subsections based on the prime mover in the energy conversion system.

3.1. Micro Gas Turbine

Micro gas turbines offer the lowest CO2 emissions per produced kW, making them an attractive option for small-scale CHP energy generation systems. However, the carbon dioxide emissions must be captured in order to achieve carbon neutral energy production. Challenges encountered when integrating carbon capture technology into mGT energy conversion cycles result most notably from the low CO2 concentration and high volumetric flow rate of exhaust gases (~1.5 vol%), plus the significant remaining O2 concentration that leads to solvent degradation. These factors have a negative impact on the size, energy use and economic performance of the downstream CC plant, while also resulting in solvent degeneration if an amine-based CC plant is utilized. In order to minimize these effects, namely the cost of the energy penalty, technologies such as auxiliary firing, exhaust gas recirculation (EGR), selective exhaust gas recirculation (S-EGR), humidified cycles, and oxy-fired gas turbines cycles have been proposed. Supplementary firing and oxy-fired GT cycles have not been explored on the small-scale in the literature; therefore, the following subsections detail the overall impact of the CC plant, followed by the impact of EGR, S-EGR, and humidification on cycle performance.

3.1.1. Impact of Carbon Capture

As previously described, integration of a CC plant with an mGT results in a high energy penalty. Giorgetti et al. [67] assessed the effect of a CC plant on the global performance of the mGT through numerical simulations in Aspen Plus. Their results indicated that the cycle performance was greatly impacted by the thermal energy demand for the stripping process (reboiler duty), reducing the total electric efficiency by about 6.2 absolute percentage points. Table 2 presents the electrical efficiency of the entire plant compared to that of the traditional mGT for various part loads up to nominal load (100 kW). Further, the impact of varying the electric power output of the mGT is examined in terms of reboiler duty and global efficiency. Table 3 shows that the reboiler duty had a positive near-linear function with the power yield. While the results showed an increase in reboiler duty with increasing load output, the specific reboiler duty remained relatively constant, with a lower range of 4.25 MJ/kgCO2 at 75 kW and an upper range of 4.38 MJ/kgCO2 at nominal load. It is important to mention that the simulations implemented an optimized CC plant, with a liquid/gas (L/G) ratio of 1.2, as well as an EGR ratio of 0.61 and 90% CO2 removal rate.
It is also important to point out the influence of ambient air temperature on electrical efficiency. As ambient air temperature rises, the air density reduces, causing a lower mass flow of air within the engine and reduced power production. Consequently, a higher heat input is required to increase the air and fuel mass flow to generate the nominal power output, resulting in efficiency decrease. The ambient air temperature also affects the oxygen concentration at the combustor inlet; however, these effects are marginal and are not of concern [70].

3.1.2. Exhaust Gas Recirculation

Exhaust gas recirculation (EGR) is a proposed technology to decrease the cost of the energy penalty from CC resulting from the low CO2 content of exhaust gases. It is worth noting that post-combustion CC is more efficient for large-scale GTs where CO2 concentrations are higher (~3.8 to 4.4 mol%) than for mGTs (~1.6 to 1.8 mol%) [71] Exhaust gas recirculation supplies three main benefits—it increases the exhaust gas CO2 concentration for a reduced carbon capture energy penalty, it reduces harmful NOx emissions, and it decreases the volumetric flow rate to the CC plant by recirculating a fraction of the exhaust gases back to the compressor inlet [68]. Akram et al. [69] experimentally determined that, per unit percentage rise in CO2 concentration, the specific reboiler duty decreased by around 7.1%, and numerically predicted a 6.6% reduction.
However, EGR also introduces some challenges. The combustion stability diminishes and unburned emissions increase as the O2 concentration at the combustor inlet is decreased; electrical efficiency is decreased through auxiliary energy losses to the fan that drives the recirculated gas, and the compressor inlet temperature is increased, resulting in a slight decrease in thermodynamic performance [103]. Giorgetti et al. [66,103] found that the EGR blower consumed 4.5 kW of power at nominal operation conditions accounting for 4.5% of the electrical power output. Removing this from the efficiency calculation resulted in nearly identical efficiency relative to the traditional mGT cycle. The remaining difference was small due to the change in the inlet mixture temperature with EGR.
Majoumerd et al. [76] found that with 40% EGR the CO2 content of the exhaust gas could be increased from 2 mol% to 3.4 mol%, through simulations with a validated thermodynamic model. This represents a 67% increase relative to the reference mGT cycle. Similarly, through simulations using Aspen Hysys and IPSEpro, Ali et al. [71,72] established that the CO2 concentration in the exhaust gas of the mGT with 55% EGR was 2.2 times greater than the traditional mGT cycle, where baseline CO2 content in the exhaust was 1.46 mol%. This increase resulted in a 40% reduction in specific reboiler duty, demonstrating the advantages of EGR for CC applications, owing to the reduction in cost from smaller absorption/stripping columns and the reboiler.
Majoumerd et al. [70] determined that while the CO2 concentration in flue gases was increased with EGR, the global efficiency was decreased from 23.0% without EGR to 22.5% with EGR. Ali et al. [71,72] came to the same conclusion, that electrical efficiency of the mGT cycle is decreased by EGR. Their results showed a decrease in mGT electrical efficiency from 32.1% to 29% at a 55% EGR ratio, when the effects of the CC plant were not considered. As discussed, this can be attributed to the blower power required for recirculation and the changes in the fluid thermodynamic properties that effect compressor and turbine operation. However, the global efficiency reduction due to EGR is small, and the literature appears unanimous in the conclusion that EGR is desirable due to the cost decrease for CO2 capture.
Best et al. [104] experimentally assessed the effects of EGR on mGTs through CO2 injection in a Turbec T100. Their results showed that, at low power outputs (50 kW) with 125 kg/s CO2 augmentation, CO emissions increased by 109% and unburnt CH4 emissions by 338%. However, they concluded that emissions were not significantly impacted at higher load factors. Further, due to the lower combustion temperatures, NOx emissions showed a decreasing trend with CO2 enhancement.

3.1.3. Selective Exhaust Gas Recirculation

As discussed, EGR increases the CO2 concentrations of exhaust gases while decreasing the volumetric flow rate to the CC plant by recirculating a portion of the exhaust back to the compressor inlet. This has been demonstrated to reduce the energy penalties of carbon capture, as well as to decrease the capital cost of the system as a result of the reduced system size. However, increasing the fraction of flue gas to be recirculated decreases the oxygen concentration at the combustor inlet, resulting in flame instabilities and decreased combustion efficiency, and high CO and unburned hydrocarbon (UHC) emissions. Therefore, the EGR ratio is limited by an optimal O2 concentration of 16 vol% at the combustor inlet. As presented in Section 2.1 of this review, S-EGR is a proposed cycle modification to increase CO2 content of exhaust gases to a higher degree than achievable with EGR, without compromising O2 concentrations at the combustor inlet required for combustion stability.
Darabkhani et al. [74] studied the performance of a parallel S-EGR configuration through both simulation and experimental testing. The focus of the study was on the performance of a commercially available, polydimethylsiloxane organic polymer membrane (purchased from PermSelect Ltd., Ann Arbor, MI, USA), as investigated both experimentally and through simulation. Through process simulations, it was found that CO2 concentrations could be achieved of up to 14.9% with 60% EGR, with a 90% CO2 removal rate from the membranes.
Challenges encountered with S-EGR are flame instability and combustion efficiency leading to increased CO and UHC emissions due to the higher CO2 content achieved in the flue gases. Bellas et al. [73] performed experimental studies on the Turbec T100 mGT with the goal of investigating the effects of CO2 enrichment on the performance of an mGT. To emulate the effects of S-EGR, CO2 was injected into the compressor inlet. Injection rates of 0 to 300 kg/h CO2 (1.7 to 8.4 vol% at 100 kW and 1.4 to 10.1 vol% at 60 kW) were considered, and the effects on gas turbine performance were assessed. This represents a nearly six-fold increase in CO2 concentration, which is typical of S-EGR. It was found that high levels of CO2 injection modified the specific heat capacity and density of the oxidizer, decreasing the engine speed and system temperatures. The CO and UHC emissions increased greatly at part loads, whereas at nominal load they experienced little change with increased injection rates. This is an effect of incomplete combustion caused by poor fuel and air mixing, inadequate flame stability, and lesser combustion temperatures. At the highest injection rates (300 kg/h of CO2), the NOx emissions were lower than at the baseline (no injection). This is a result of lower combustion temperatures at increased CO2 content.
The influence of different S-EGR injection rates on flue gas emissions across the 60–100 kW operating envelope are shown in Table 4.

3.1.4. Humidification

As discussed in Section 3.1.2, EGR enhances the efficiency of the CC plant, but decreases the electrical efficiency of the mGT cycle resulting in a marginal decrease in global efficiency. Humidification is a proposed method for improving mGT cycle efficiency. In general, the overall economic performance of the mGT powered mCHP system can be improved through improving the electric efficiency of the mGT at the time of low heat demand.
Studies are available that assess the impact of humidification on the global efficiency of the mGT and coupled CC plant, as well as studies that examine the impact on individual mGT component performance. Both aspects are reviewed in the following discussion.
Giorgetti et al. [66] found that humidification of the traditional mGT cycle can completely offset the efficiency losses introduced by the EGR energy penalty. Table 5 provides the simulation results from the standard mGT with EGR and the mHAT with EGR, both integrated with an amine plant and operating at 100 kW with 16% O2 in the combustor inlet. Of note is that the EGR ratio is maximized based on the limit introduced by the minimum 16 vol% oxygen content at the combustor inlet, which is discussed further in Section 4.1 of this review. The findings show that water injection decreases the oxygen concentration of the mixture. Hence, the maximum EGR ratio to maintain 16 vol% oxygen at the combustor inlet is lower for mHAT than the traditional mGT cycle, resulting in a larger diameter absorber column and increased cost. The authors also found that humidification significantly improved global cycle efficiency, increasing it from 21.3% with the traditional mGT to 23.9% with mHAT [66].
Similar results were presented by Majoumerd et al. [70] through simulations using a validated thermodynamic model. The results showed significantly increased performance for the mHAT cycle compared to the traditional mGT, with 25.8% cycle efficiency compared to 23.0% and 22.5% efficiency for the baseline mGT and mGT-EGR cycles, respectively. Of note is that the cycle efficiency includes the effects of the coupled CC plant.
Carerro et al. [105] experimentally studied the effects of water injection with a saturation tower on the mGT cycle. They found that, overall, the electrical efficiency of the humidified cycle increased up to 4.2 absolute percentage points, similar to that found numerically.
Therefore, it can be concluded that global cycle efficiency is improved through humidification, and entirely compensates for energy losses from EGR. It is important to mention that this result is independent of energy integration between the CC unit and mGT/mHAT, in which waste heat is leveraged to decrease the thermal energy requirement of the stripper. This is discussed further in the optimization section of this review, in which Giorgetti et al. [66] assess a mGT/mHAT coupled with a CC unit with energy integration between the systems.

3.2. Hybrid Fuel Cell Systems

Roohani Isfahani and Sedaghat [88] evaluated the performance of the hybrid system of a solid-state fuel cell and micro gas turbine with a coupled carbon capture plant, as introduced in Section 2.2. A major benefit of this system is the 100% capture ratio achieved by compressing CO2 to the liquid state, compared to the 90% CO2 capture common in the micro gas turbine power generation systems. The influence of plant pressure and SOFC temperature on the system effectiveness and performance has been investigated in detail. The system efficiency can be maximized by increasing the SOFC temperature and operating pressure, although the effect of working temperature clearly has less influence than that of the pressure. It was found that at an SOFC temperature of 1000 °C, an SOFC pressure of 17.5 bar, and a fuel utilization factor of 0.8, the global efficiency reached 48.3% natural gas LHV (lower heating value). It is also important to note that SOFC operating temperatures may not exceed 1000 °C, and that while increasing pressure increases efficiency, it simultaneously increases capital cost, which must be taken into consideration. Moreover, the effect of the utilization factor and plant pressure on power plant efficiency and fuel cell power output has been assessed. The utilization factor may be expressed as the ratio of consumed fuel in fuel cell stacks and the total quantity of fuel introduced to any type of fuel cell and has a typical range of 0.75–0.9. If it is increased, the power output of the fuel cell is increased while the generated power of the gas turbine is decreased. However, given that fuel cells are more efficient than gas turbines, more fuel is utilized in a more effective manner. Therefore, increasing the utilization factor increases the overall efficiency. Further, the maximum net efficiency was found to be 51.4% LHV at an exhaust pressure of 2.5 bar, temperature of 1000 °C, plant pressure of 22.5 bar, fuel utilization factor of 0.9, and CO2 expanded exhaust pressure of 2.8 bar.

3.3. Organic Rankine Cycle

The biomass-fired organic Rankine cycle is a suitable technology for distributed CHP. Although the ORC is an established technology for cogeneration across the range of 200–1500 kW, few are commercially available on the small- and micro-scale, where the electrical output ranges from 100 to 500 kW. Zhu et al. [102] investigated the ORC-based biomass fueled micro-CHP system with integrated MEA-based CC to assess the thermodynamic and economic performance of eleven working fluids. From the perspective of the feasibility for distributed energy generation below 500 kW, the net power outputs ranged from 175.49 kW for isobutene to 413.82 kW for cyclopentane. Of all the working fluids considered, it was found that cyclopentane had the best thermodynamic performance with a power efficiency of 13.70% and exergy efficiency of 16.21%. This was followed by R141b, R113, R123 and pentane. It is important to note that the reported values in the thermodynamic analysis did not include CO2 capture. However, from the economic assessment, HFE7000 had the largest net present value (NPV) of 2052.42 × 104 USD and the highest profit ratio of investment (PRI) of 5.45, followed by R1233zd-I, isobutane, isopentane and R113. The results of the economic analysis performed by the authors [102] is detailed in Section 6 of this review. This takes into account the thermo-economic aspect of the system with and without CC and draws associated conclusions. In general, the authors deduced that the biomass-fired ORC system for micro-CHP with optimized parameters is economically significant and sustainable, and allows for negative CO2 emissions when integrated with CC.

4. Design Optimization

This section will focus on design optimization of the configurations presented in Section 2 and detailed in Section 3. A myriad of studies are available pertaining to the micro gas turbine in the context of small-scale CC, as well as the optimization of various system parameters and design considerations for optimal system performance. However, studies on the hybrid solid state fuel cell and ORC cycles with CC, in a small-scale context, are limited and therefore not included in this section of the review.

4.1. Micro Gas Turbine

Numerous studies are available that assess mGT cycle modifications for design optimization, such as EGR, S-EGR, and humidification, and their impact on individual mGT components in the context of integration with a CC plant. The following section focuses on studies that seek to optimize both the coupled CC plant and the modifications to the mGT cycle for CC applications. In the final subsection, a new plant layout for improved energy integration will be investigated to maximize global efficiency.

4.1.1. Exhaust Gas Recirculation

As mentioned previously, the EGR ratio is limited by the oxygen concentration at the combustor inlet. Some researchers have experimentally studied the effects of the oxygen content of the oxidizer on flame stability. Their results showed that UHC and CO emissions showed large increases below 16 vol%, and flame stability was compromised below 14 vol%; there was stable combustion with 16–18 vol% oxygen in the oxidizer. Therefore, optimization of the EGR ratio must be performed with consideration of the oxygen content at the combustor inlet.
Majoumerd et al. [70] utilized an experimentally validated thermodynamic model to assess the effect of EGR on flue gas component concentrations. They found that at 40% EGR, the concentration of oxygen in the oxidizer decreased to 18.7 mol%.
Ali et al. [71] performed numerical simulations to maximize the EGR ratio; the results are presented in Table 6. They determined that the EGR ratio must be kept equal to or below 0.55 to maintain 16 vol% O2 concentration at the combustor inlet. This follows from CO2 enrichment of 1.6 mol% to 3.7 mol% in the flue gases.

4.1.2. Humidification

De Paepe et al. [75] assessed the performance of several advanced humidification cycles through numerical simulations to determine the impact on turbine electrical efficiency, emissions, flue gas mixture concentrations, and overall thermodynamic performance. The following advanced humidification cycles were assessed: compressor inlet air cooling, water atomizing inlet air cooling (WAC), regenerative evaporation (REVAP), steam injected gas turbine (STIG) cycle, mHAT, and mHAT+. Based on the assessment, it was determined that the REVAP cycle was the most efficient solution following from its ability to recover additional waste heat from the evaporation heat from the condensing water in the stack. Applying the REVAP cycle to the traditional dry mGT cycle resulted in an efficiency of 37.1% at nominal load, an increase of 4.3 percentage points. Although the REVAP cycle was optimal in terms of efficiency, the cycle layout is far more complicated compared to the standard direct preheated water injection, and the efficiency augmentation is quite insufficient. It is of note that the efficiency of the standard mHAT cycle at nominal loading is 36.1%.

4.1.3. Carbon Capture Plant

As discussed in Section 2.1, a standard aqueous solution of monoethanolamine (with 30 wt% MEA) is the chemical solvent used in every study considered. The regeneration temperature would be set at 120 degrees to avoid thermal degradation of the MEA solvent and corrosive effects [70].
Agbonghae et al. [106] performed simulations using a validated model of the Turbec T100 mGT integrated with an amine-based (MEA) chemical absorption plant in Aspen Plus. The optimum liquid/gas (L/G) ratios and the lean CO2 loading for 90% capture is reported in Table 7 for flue gases of 3 to 8 mol% CO2 content. Optimum L/G ratios result in relatively similar specific reboiler duty values, as seen in Table 7. However, the variations in the L/G ratio effects the optimal height for the absorber and stripper columns and must be considered for capital costs and operating costs.

4.1.4. Energy Integration

When operating in full CHP mode, such that the waste heat is used for water heating purposes, mGT efficiency is around 80% [61,62,63,68]. However, when the thermal demand is zero and the waste heat is not used for external heating, mGT efficiency is decreased to purely electrical efficiency. Therefore, the economic feasibility of the mGT integrated with carbon capture is severely diminished. The aforementioned studies all address diverse characteristics of the EGR cycle and humidification of mGTs, with a focus on individual component performance, without consideration of the most effective use of waste heat. To fill this gap, Giorgetti et al. [78,79] investigated the energy integration and strategy optimization of an mGT/mHAT in combined heat and power mode, when coupled with a CC unit. This addressed cycle optimization for waste heat recovery based on varying thermal demands. The system schematic is shown in Section 2.1, Figure 7.
When operating in full CHP mode, the Turbec T100 has an electrical efficiency of 29.4% at 100 kW, and a thermal efficiency of 49.5%, providing 166 kW of thermal power. This results in a total efficiency of 79%. The total efficiency is slightly decreased, by 1.3 absolute percentage points, when EGR is applied. When the capture plant is added, the global efficiency is reduced to 59.2%. The results are summarized in Table 8.
When the thermal demand is zero, the overall efficiency is decreased to the electric efficiency. The waste heat can be used either for mGT humidification to increase electrical efficiency or can be employed to reduce the thermal demand of the stripper reboiler to reduce the energy penalty. Several plant layouts based on Figure 7 in Section 2.1 are examined, and the electrical efficiency noted. These are summarized in Table 9. The solution with the lowest energy penalty (2.6% absolute percentage points compared to the reference case) is the mHAT with EGR, heat recovery, and CC unit. This achieves an electrical efficiency of 26.8%.
Moreover, Giorgetti et al. [79] extended the previous study to include part thermal loading. As determined in the study investigated in [78], dry operation of the turbine where the entire thermal output (165 kW) is used for external heating purposes provides the highest overall efficiency, identified in this study as 59.6% (case (a) in Table 10). When the thermal demand decreases from full CHP mode, a threshold exists where the reboiler duty for the stripping process is completely satisfied by waste heat from the mGT cycle (case (b) in Table 10). After CC heat recovery, the exhaust gas has remaining thermal power of 90 kW for cogeneration purposes, resulting in a total system efficiency of 54.7%. In the third case investigated, the mHAT is applied and waste heat is used partially for humidification purposes, and part for CC energy recovery (case (c) in Table 10). However, the external boiler is still required to satisfy the thermal demands of the stripping process. The authors concluded that the overall electrical efficiency when using the energy integration methods was higher for dry operation than humidified operation, due to energy degradation of the flue gases. This result is different than that found in previous studies performing component-wise optimization. Table 10 compares the efficiencies of different plant layouts.

5. Overview of Available CCUS Technologies

Several storage options are being considered for carbon capture applications, with varying levels of development. Injecting CO2 into geologic formations could be considered as it is a mature technology already in use in the oil and gas industry. The main concern associated with geological storage is leakage of the concentrated CO2 stream and associated environmental damage. However, annual leakage rates in the literature range from 0.00001% to 1%. The three main types of geological formation for carbon storage are depleted oil and gas reserves, deep saline reservoirs, and unmineable coal seams [10,11]. The captured CO2 can also be sold for profit, which is one avenue to be explored in the interest of offsetting the high costs of CCS. Examples of utilization are direct utilization, enhanced oil recovery (EOR), carbonation, and conversion into chemicals and fuels. Direct uses include the food and drink industry, such as for drink carbonation, the decaffeination process, etc. CO2 can also be used directly for pharmaceutical applications. Direct utilization is only possible for sources with high purity CO2 waste streams, such as ammonia production. EOR is the process of using CO2 to extract crude oil from an oil field or natural gas from unmineable coal deposits. As applied to natural gas, this process is still under development and not yet commercially available. However, EOR for crude oil extraction has been used for many years already in both Canada and the USA. For EOR, CO2 is injected into otherwise unrecoverable oil reserves for increased oil extraction. Most of the CO2 is pumped back to the surface and recycled, although some is released into the atmosphere. Under certain conditions, the CO2 injected for EOR could remain underground as in geological storage. As mentioned, captured CO2 can also be transformed into fuels and useful chemicals, or used as feedstock for fuel production. Unfortunately, using CO2 for feedstock results in a highly energy intensive process. Further, fuels and chemicals have a short lifespan, and are quickly released back into the atmosphere. Therefore, the benefits of capture are undermined [28,35,42].
For perspective, the following section will provide a brief overview of the large-scale CC projects currently in operation. CCS technology functioning at large-scale has existed since the 1970s. Government subsidized projects to aid develop and commercialize CC plants have been principally concentrated on electricity generation. The major part of CO2 injection from CC is in EOR in the USA that offers extra revenue to partially offset capture costs. In Canada, there are three capture plants in operation and two in construction as of 2019. The Boundary Dam Carbon Capture and Storage facility in Saskatchewan has been in operation since 2014 with a capture capacity of one million tons of CO2 on an annual basis [24,101]. The post-combustion capture facility is coupled to a fossil-fueled electricity generating plant, to which CO2 is largely transported by pipeline and used for EOR at the Weyburn Oil Unit. The remaining CO2 is transported, also via pipeline, to the nearby Aquistore project for geological storage [22]. The Petra Nova plant in Texas is another commercial large-scale fossil-fueled power plant integrated with CCS technology, with annual CO2 capture of one million tons. Both plants sell captured CO2 for EOR, which partially offsets the cost introduced by CCS [107,108,109].
The micro cogeneration systems with integrated CC discussed thus far are purely in the development stage and are not yet commercially available. For instance, Clean O2 Carbon Capture has developed the first commercial unit for decentralized CC applications [110]. The product provides direct capture to by-product utilization with minimal processing. The process is described as follows: A portion of the flue gases, having a CO2 concentration of 40,000 ppm or greater, pass through the reaction chamber where caustic soda reacts with the carbon dioxide to create soda ash and water. The flue gases then pass through the reaction chamber into the heat exchanger where waste heat is recovered by heating the municipal water supply for domestic hot water. The caustic soda must be replenished weekly. The Clean O2 Carbon Capture unit is currently installed in concentrated residential, commercial, and single residential applications. Depending on the use, either a residential or commercial unit may be installed. For concentrated residential applications, a commercial pilot is installed at Garrison Woods and Marda Loop in Calgary. For commercial use, a commercial unit is installed at Westjet airlines in Calgary. Both are projected to produce 6.5 tonnes of by-product, the equivalent of 3 metric tonnes of captured CO2 per year. In terms of single residential use, a residential pilot is installed in Calgary and projected to produce 630 kg of by-product, the equivalent of 320 kg of captured CO2 per year. The cost per tonne of CO2 captured is approximately $14.94. However, by selling the soda ash by-product, the cost of capture is actually negative. The advantages of using the Clean O2 Carbon Capture unit are notable, comprising savings of up to 20% on energy charges per annum, and, reflecting ecological concerns, inhibition of GHG emissions into the atmosphere [110].

6. Cost Analysis

This section presents a brief overview of the cost of carbon capture at large scale, as the literature on the small-scale is scarce. This will be to provide a general sense of the costs of CC, which can provide context for evaluating potential costs at a small scale. Further, an economic evaluation of the impact of CC on the biomass-fired ORC cycle for mCHP applications is presented.
For large scale power generation plants, CC costs are typically defined based on the separation and compression costs at a single facility independent of the costs of transport, storage, or further conversion steps [111,112,113,114,115]. Rubin et al. [35] presented an updated CCS cost estimate and compared it to the CCS costs reported in the 2005 Intergovernmental Panel on Climate Change (IPCC) Special Report on Carbon Dioxide Capture and Storage (SRCCS) [15]. This analysis was based on natural gas combined cycle plants with MEA-based post-combustion CC. The previous research details only separation and compression costs based on the addition of the capture plant only, without consideration of transport and storage. The Robin et al. [35] study included the costs of transport and storage to provide an estimate of CCS costs.
All planned large-scale transport of CO2 continues with pipelines. However, according to Pieri et al. [111], the use of trucks is likely to be more economical for short distance and small-scale CO2 transport than branch pipelines. Pipelines are advantageous as they can handle large flowrates but impose an economic challenge in the case of low flowrates. For small quantities, truck tankers and railroad tankers are favorable, and provide lower capital costs. Nonetheless, large scale trunk pipelines would need to be constructed for both large and small-scale capture [111]. The current costs of CO2 pipeline transport taken from the SRCCS [15], IPCC [15], ZEP [112], and USDOE [113], are summarized in Table 11 and Table 12 for onshore and offshore pipelines, respectively [35]. The values for SRCCS are reported in 2002 USD/tCO2/250 km and the values for all other studies are in 2013 USD/tCO2/250 km. These results are derived for “normal” terrain; however, given that the cost is highly dependent upon the given terrain, actual costs may be much higher. The costs were adjusted to a common basis of 2013 USD/tCO2/250 km using the Chemical Engineering Plant Cost Index (CEPCI) escalation factors. From 2002 to 2013 the CEPCI rose more than the US general inflation index, CPI (44% vs. 29%, respectively), showing “real” cost escalation during that time. The Power Capital Cost Index (PCCI, an index particular to the capital cost of non-nuclear power plants) increased further, at 64%. As the study of Rubin et al. [35] involved the cost of power plants with and without CCS, they applied the PCCI to escalate the capital cost of power plants from 2002 to 2013 dollars. To adjust transport and storage costs, they utilized the CEPCI, as these services are usually supplied to power plants by distinct companies largely from the oil and gas industry.
Rubin et al. [35] also investigated the cost of storage through a survey of the available literature on the topic. They focused only on storage through injection into geologic formations as this technology is well established and has been practiced for many years in different contexts. However, in the context of storage, more research must be done, and several uncertainties remain. For example, it is unknown how future regulations may impact costs in terms of monitoring and liability, as well as the impact of public acceptance on project economics. As discussed, several types of geologic storage reservoirs are available, with varying costs depending on the reservoir type. Based on this, the various studies examined by Rubin et al. [35] provide cost ranges. In the SRCCS, the cost of geologic storage was reported to range from 0.5 to 8.0 2002 USD/tCO2, with an added monitoring cost of 0.1–0.3 2002 USD/tCO2. The typical ranges of onshore storage costs evaluated on a standard basis are reported in Table 13 from four different studies.
Table 14 displays the levelized cost ranges for amine-based post-combustion capture integrated with a natural gas combined cycle (NGCC) plant based on the literature, as reviewed and reported by Rubin et al. [35]. From the analysis, it is clear that the total cost of CCS can be decreased considerably if CO2 is sold for EOR as well as geologic storage. However, it is worth pointing out that due to the volatility of oil prices, the value of the EOR credits is quite uncertain.
Carbon capture is the most costly phase of a CCUS supply chain, due to high capture cost from sources, which are diluted in CO2. This is especially true at a small-scale, as CO2 content in flue gases are significantly lower than those from large scale energy generation. The values of the cost of CO2 captured and the cost of CO2 avoided reported by Rubin et al. [35] would be much lower than those for small-scale generation due to the diluted CO2. For this application, the greatest challenge to be overcome is making MEA-based post combustion economically feasible through lowering of the high energy requirement for regeneration, solvent degradation and loss, and corrosion issues.
For an ORC-based micro-CHP system, at optimal conditions using R245fa as a working fluid, Zhu et al. [102] performed a thermo-economic analysis to assess the cost effects of CO2 capture integration, with the results summarized in Table 15. It was found that the total investment (INVtot) increases from 31.48 to 82.9 × 10⁴ USD and the annual operation and maintenance costs (CO&M) increase from 39.26 to 62.36 × 10⁴ USD. Further the net annual income (NAI) and net present value (NPV) decrease, while the dynamic payback period (DPP), net power index (NPI), and levelized energy cost (LEC) increase, according to Table 15. This leads to the conclusion that the economic performance is decreased with MEA-based CC. It is important to mention that the biomass fuel cost represents a substantial portion of the annual operation and maintenance costs, followed by the cost of input heat for MEA absorbent regeneration.
Following the previous study by Zhu et al. [102], a comparison of the equipment cost ratio for a biomass-fired ORC-CHP system with and without CO2 capture investment, showed the following differences: evaporator (19.65%), condenser (18.14%), expander (16.04%), and biomass boiler (15.79%). Further, the cooling water loop, which consists of the cooling water pump (7.33%) and cooling tower (4.26%), accounted for 11.59% of the total system investment. When the CO2 capture system was integrated, it accounted for 62.03% of the total investment. Further, the comparison of the combined ratio for biomass-fired ORC-CHP system annual operation and maintenance costs (CO&M) were also provided without and with CO2 capture, showing that biomass-fuel (CAbf) accounted for 58.07% of the annual operation and maintenance costs. This was followed by the thermal heat expenditures for MEA solvent regeneration in the stripper (27.84%), which resulted from the significant energy penalty.

7. Other Applications of CCS

With the goal of net zero emissions, negative emissions technology (NET) is required for the purpose of recapturing greenhouse gases emitted in the past. Direct air capture is the process of removing CO2 from the air and generating a concentrated stream of carbon dioxide for sequestration or utilization [116,117,118,119]. If the carbon dioxide is stored, DAC contributes to the group of negative emission technologies. A challenge that must be addressed during the development of DAC systems is the large energy input that is required to remove and concentrate CO2 to a pure stream (>90%) from air (390 ppm). The thermodynamic minimum energy required is 250 kWh per ton of CO2, which is significantly higher than that for concentrated sources, such as flue gases from power plants. The current cost per ton of CO2 is estimated to be $200–$1000, whereas the cost estimate for concentrated point sources is within the range of $40–$60 [108].
Several DAC technologies are currently in developmental stages; however, there is no agreement on the processes of CO2 separation from air. Several processes are under development as reported in the literature—these include solid sorbent adsorption, vacuum swing adsorption, and calcium (carbonate-bicarbonate) looping absorption cycles [120,121,122,123,124,125,126].
Due to the highly dilute concentration of CO2 in ambient air, the energy input is far greater than that for point source CCUS. However, net negative global emissions are necessary to accomplish the current climate change prevention goals [4,108].
An interesting application for DAC is a ventilation approach for buildings using CO2 capture. Kim et al. [120,121] proposed a CO2 adsorption capture device and its use as a ventilation strategy in buildings in 2015, and further examined the system moisture performance in 2020. The goal was to provide a more efficient means of indoor air recirculation. Through numerical calculations, they found that during the tropical summer and central European winter seasons, 30–60% of air ventilation energy for cooling and heating can be saved when compared to the traditional air ventilation system and can save building energy at peak energy load times.
Baus and Nehr [126] proposed a coupling of HVAC-systems with DAC-technology to separate CO2 in the exhaust air of buildings and recirculate the CO2-depleted air back into the building. Based on a theoretical method, the possibilities and drawbacks of the recommended HVAC/DAC-coupling in recirculation mode were evaluated. They concluded that the system can decrease the energy demand of buildings while also enabling access to unutilized CO2-resources transported in the building. In addition, the system presents the possibility of enhancing indoor air quality. However, the authors pointed out that an adequate DAC unit for operation in indoor air is not yet commercially available.

8. Conclusions

This paper has reviewed the latest advances related to small-scale carbon capture systems and their application, focusing mainly on micro-combined heat and power cogeneration systems for use in buildings. As can be seen, the use of CC on small-scale distributed combined heat and power sources has the potential to reduce carbon emissions and achieve the carbon neutral goal. This review discussed in detail some of the main concerns and proposed several key findings that can aid in assessing the feasibility of CC when applied to the small-scale.
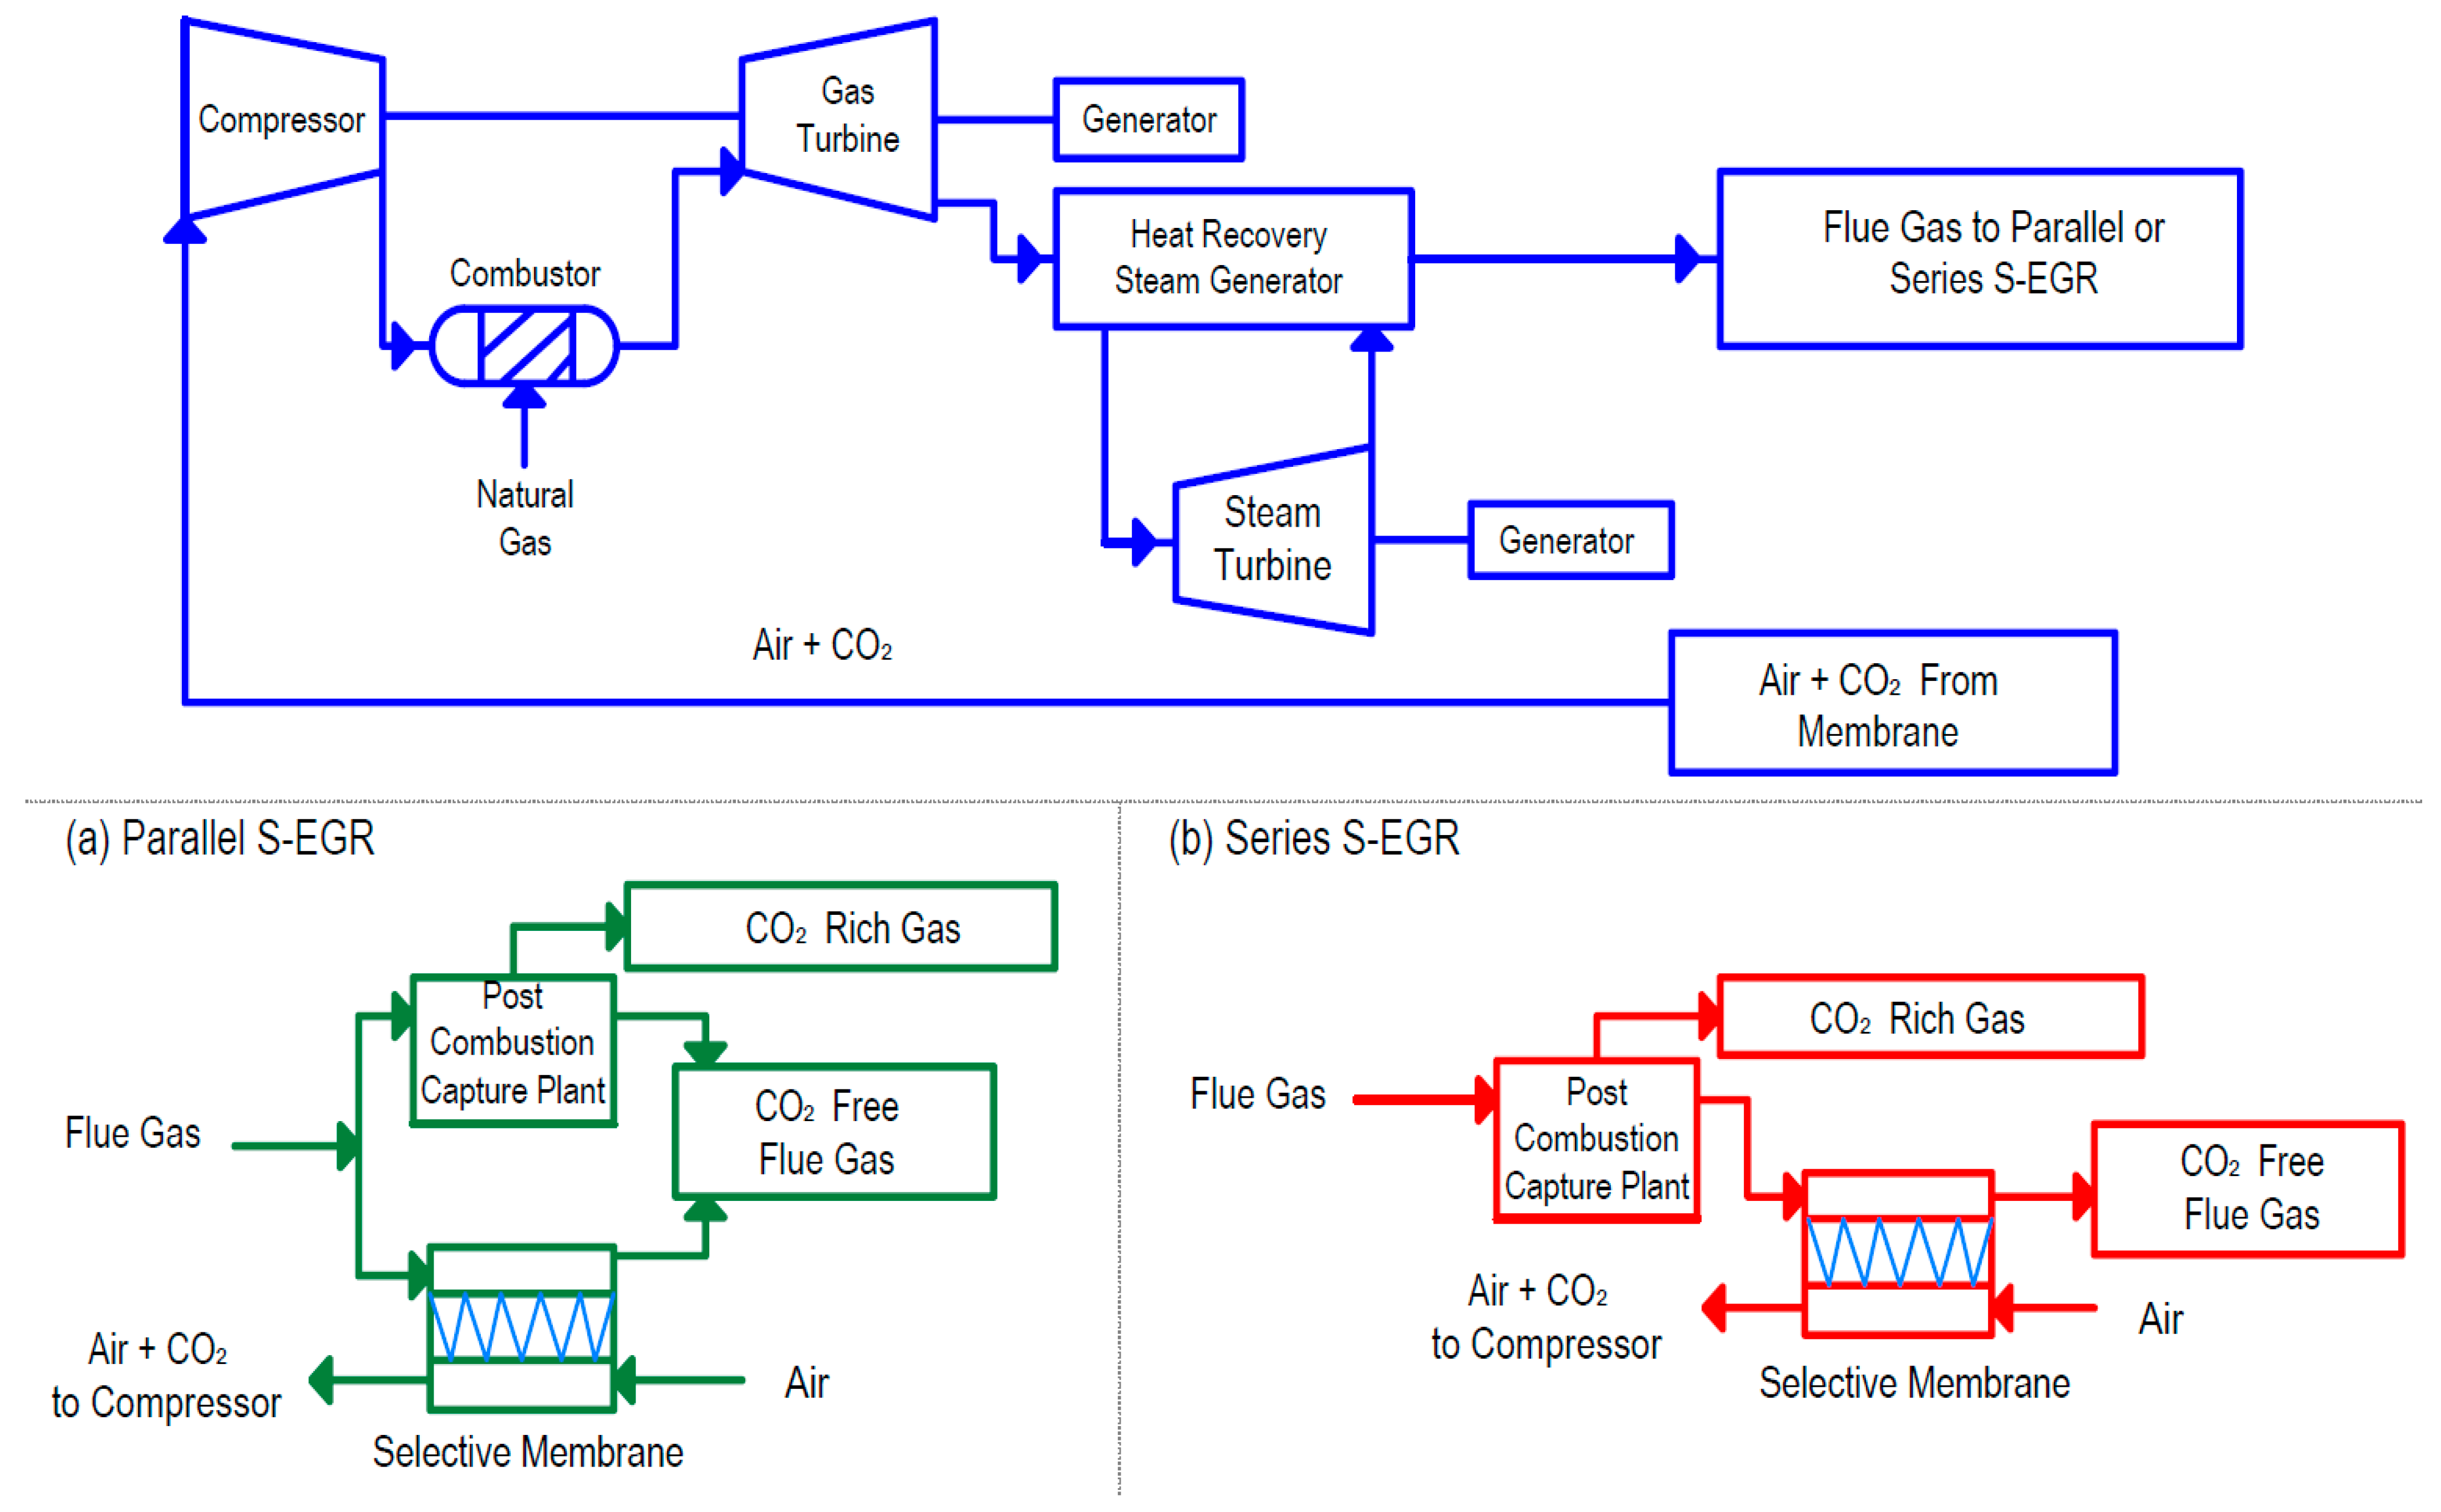
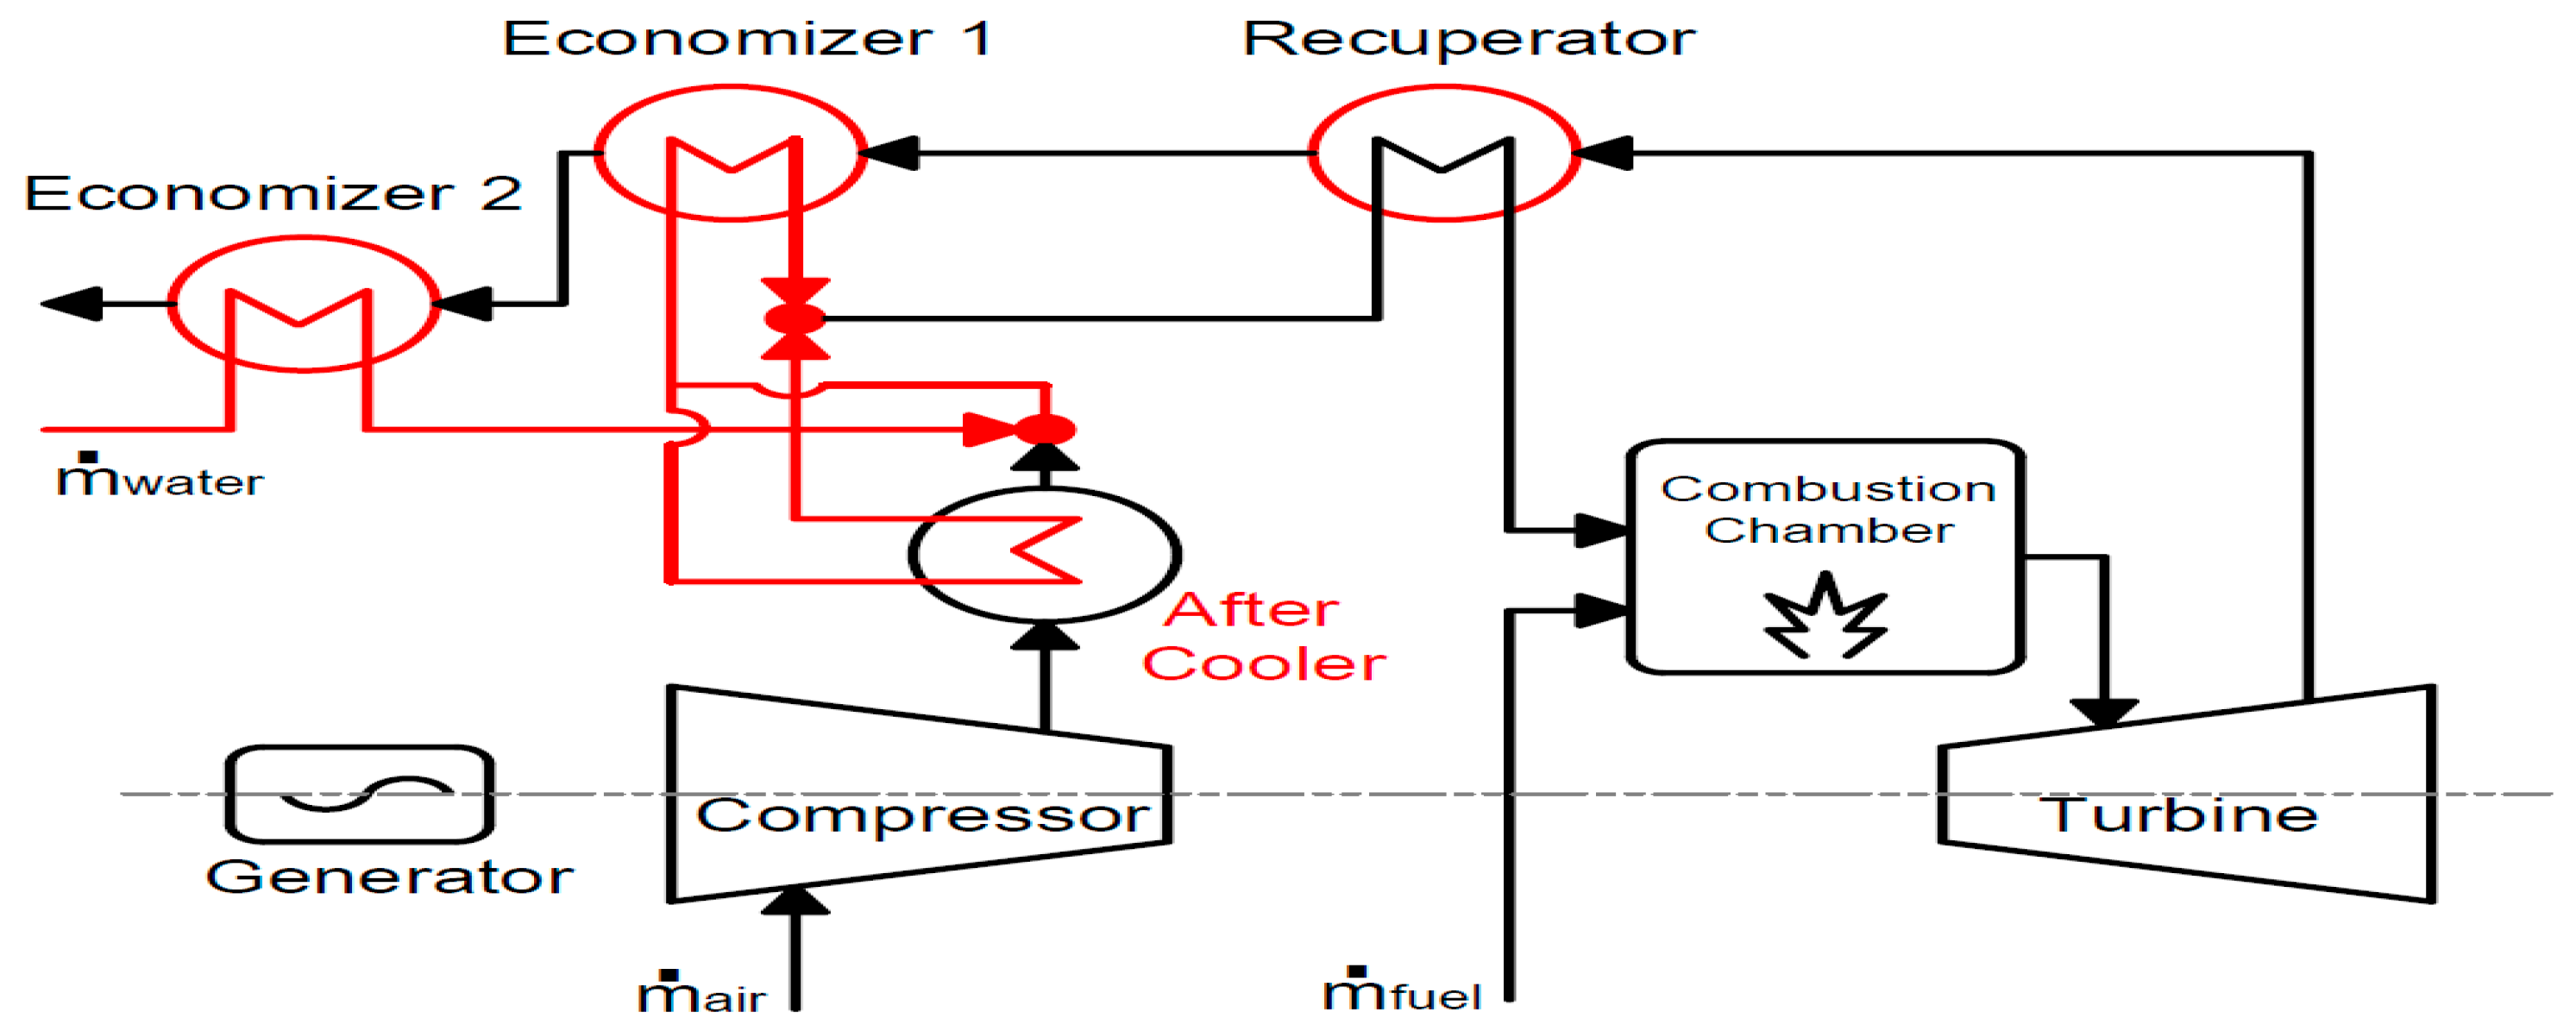
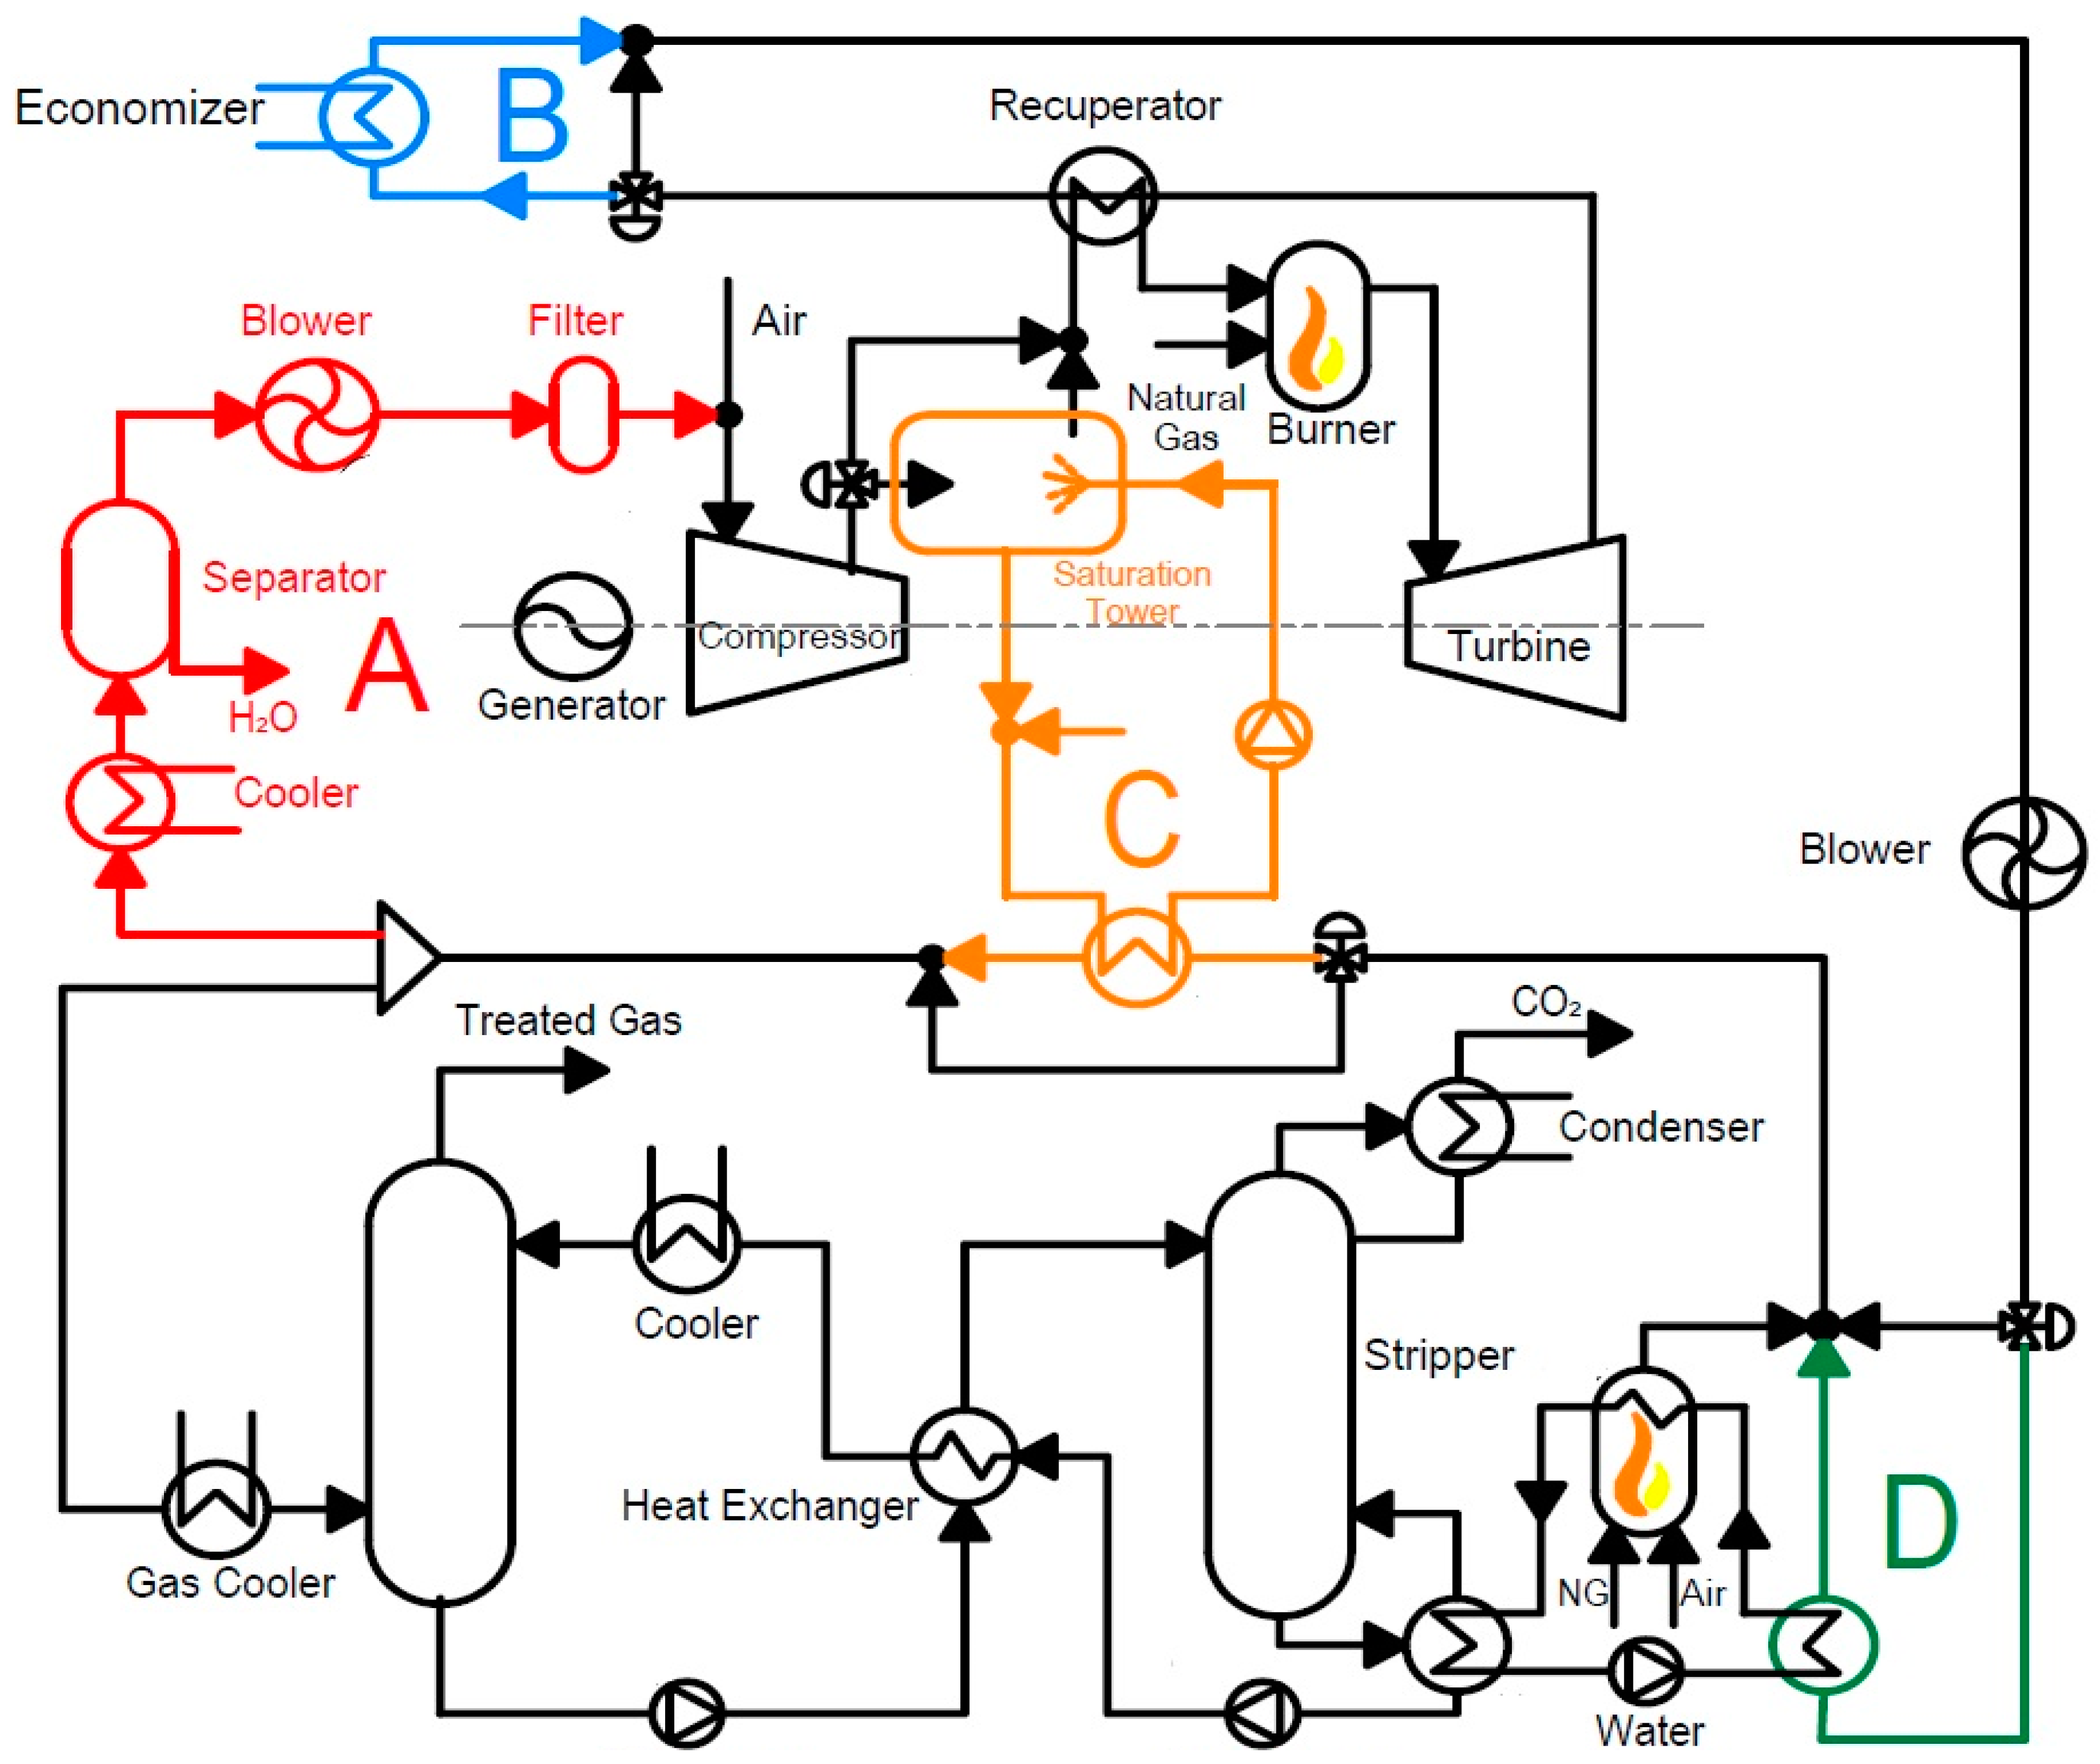
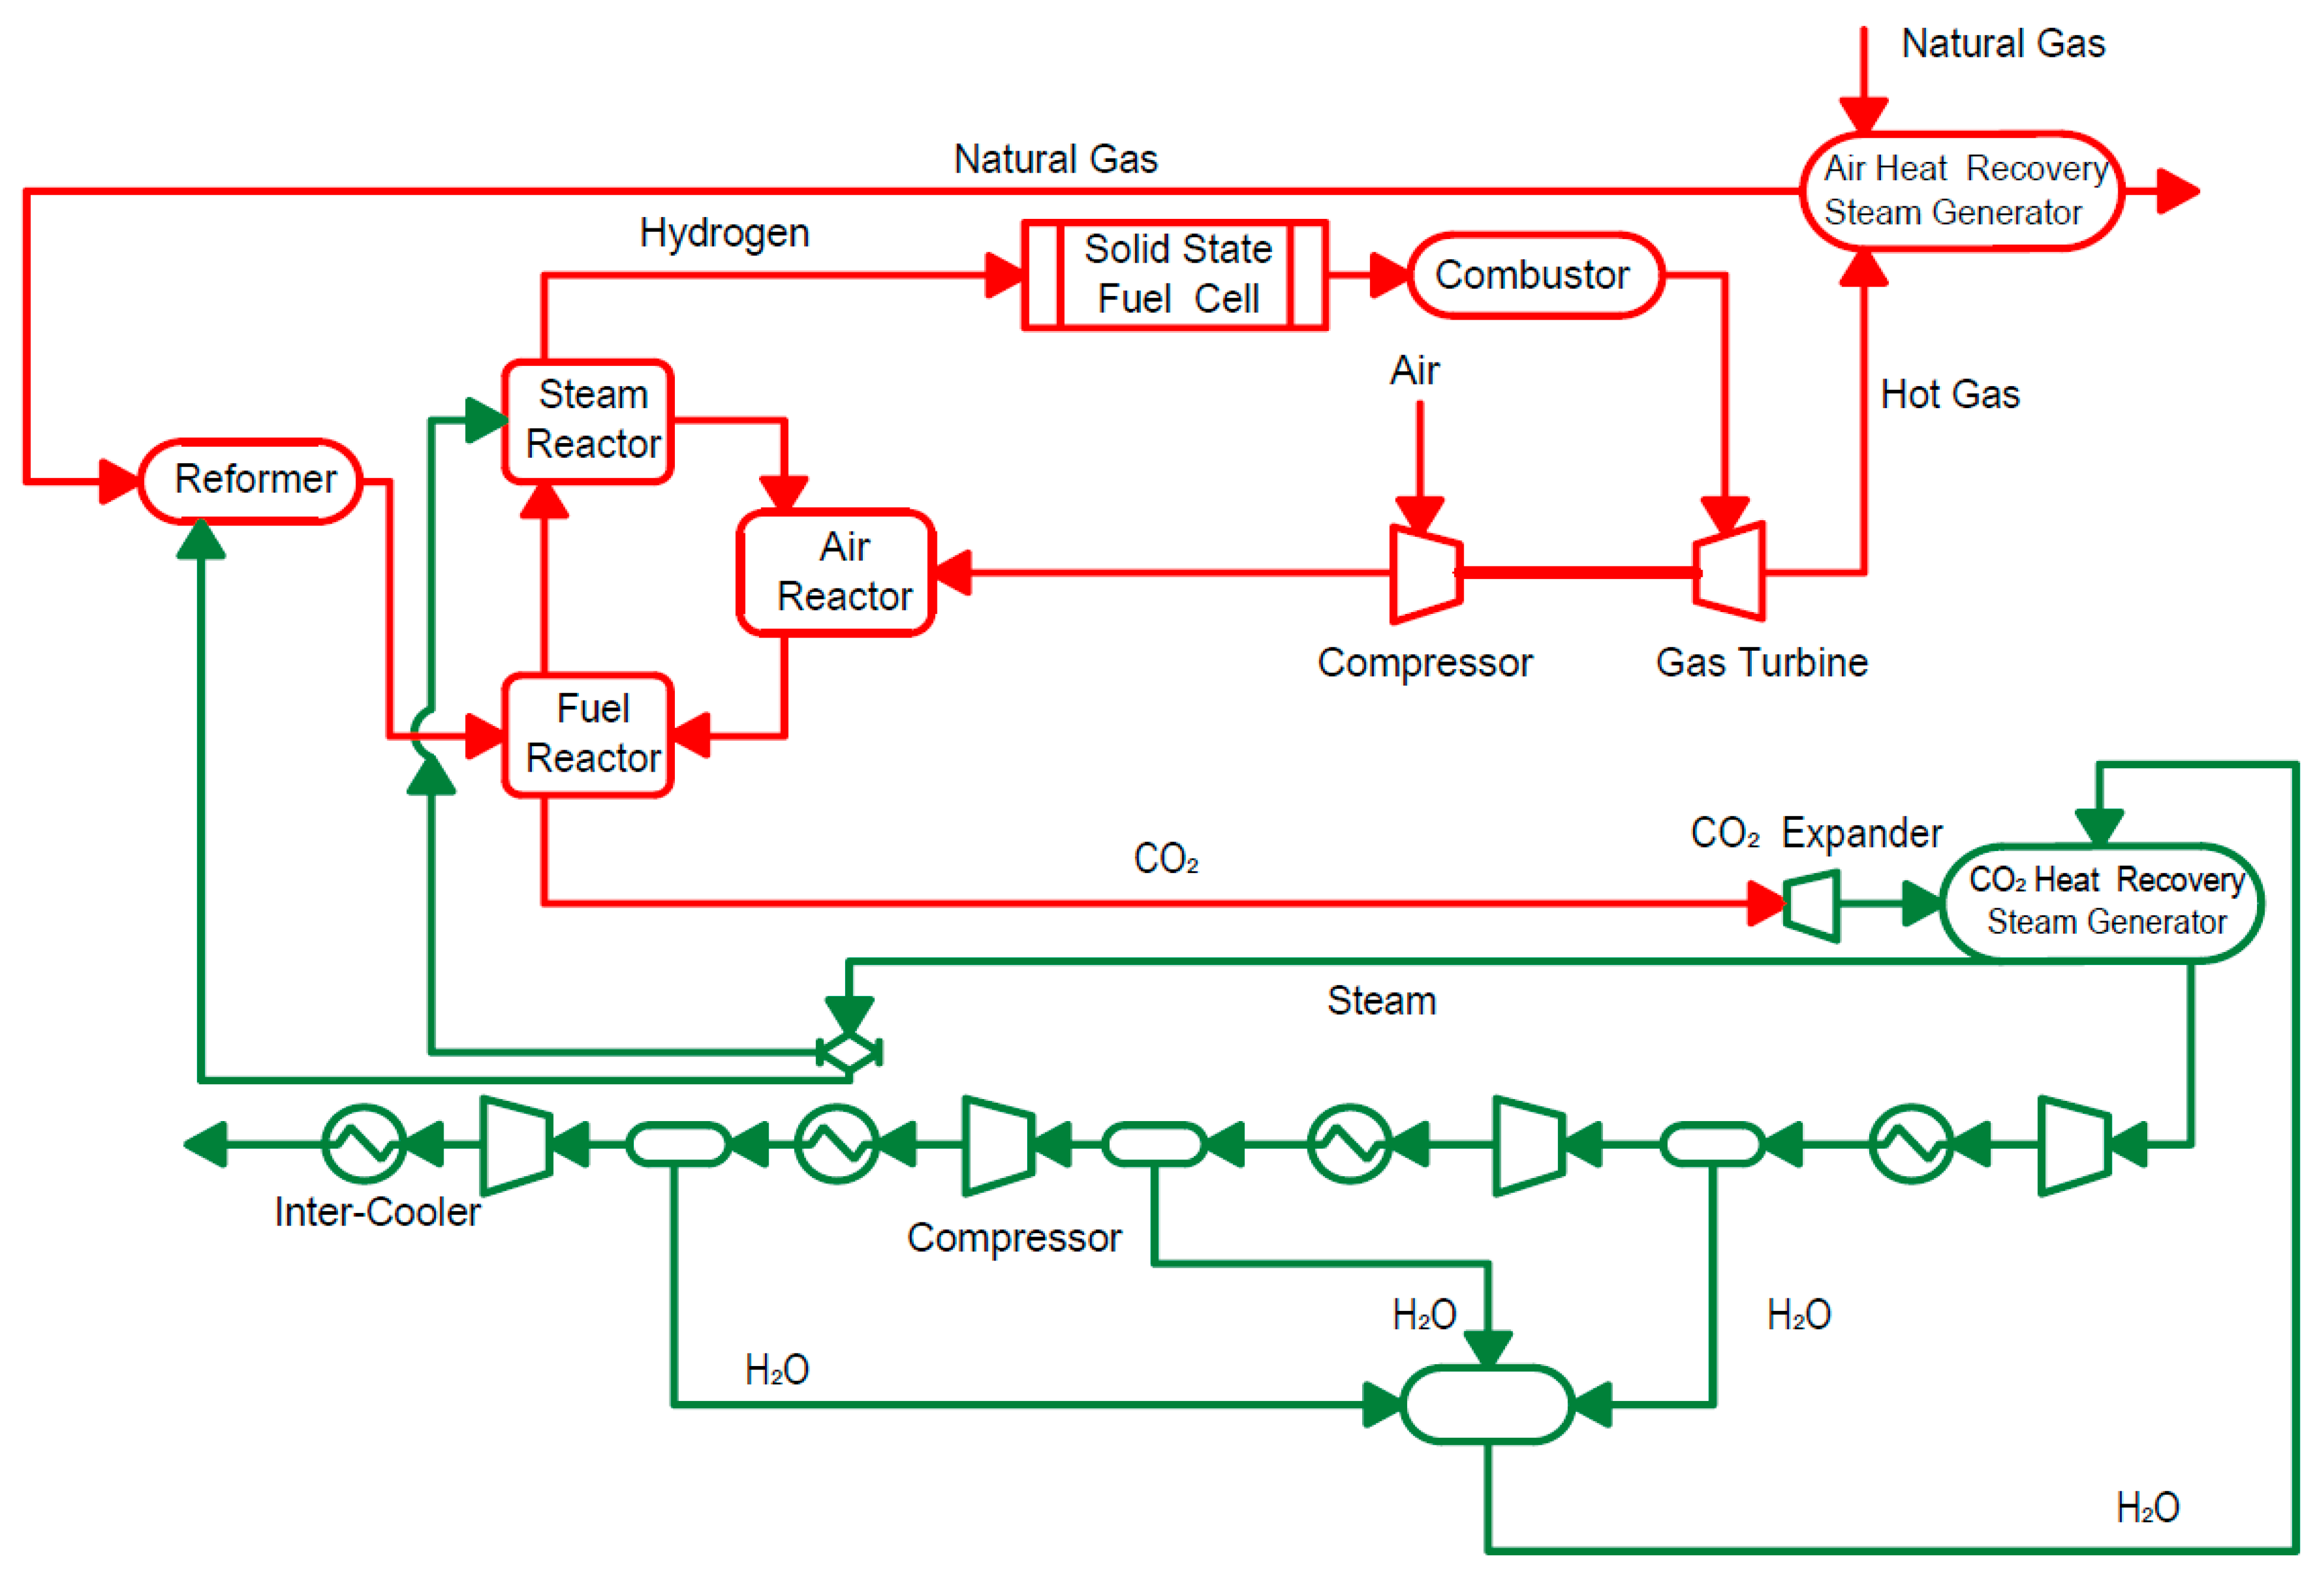
The findings pertaining to the application of carbon capture in different energy systems in summary are as follows: For micro gas turbine systems, EGR can increase CO2 concentration by 2.2 times the baseline mGT cycle, and can be increased to a ratio of 0.55, significantly decreasing the volumetric flow rate to the capture plant. This leads to decreased capital and operating costs of the capture plant. S-EGR can enhance CO2 concentrations further than EGR while maintaining stable combustion. Conversion into the mHAT cycle can increase global efficiency to 25.8% compared to the baseline efficiency of 23.0%. Improved energy integration using turbine exhaust heat for reboiler duty can increase the cycle efficiency up to 26.8% when there is no heat demand. For the hybrid solid state fuel cell and micro gas turbine systems, the maximum net efficiency was found to be 51.4% LHV and a 100% carbon capture ratio can be achieved. The biomass-fired organic Rankine cycle systems allow for negative carbon emissions when integrated with CC. The maximum system efficiency was found to be 13.7%, not including the effects of CC. This must be further assessed. When the CO2 capture system is integrated, it accounts for 62.0% of the total system investment; thermal expenditures for MEA solvent regeneration account for 27.8% of the annual operating and maintenance costs. Moreover, direct air capture was also identified as a potential technology for negative carbon emissions. However, further development is required to reduce the substantial energy penalty and increase the economic feasibility.
Currently, carbon capture, as applied at small-scale in buildings applications, is in the developmental stages, and further research must be performed to reduce the energy penalty of the capture process for economic feasibility. Additionally, the majority of the results from the literature were obtained through numerical analyses. Therefore, it is necessary that more extensive experimental work be accomplished to validate the current findings. Further, there is a gap in the literature pertaining to the economic feasibility of small-scale carbon capture systems, and, in the future, a full cost analysis must be performed to address this.
Although large-scale CC/CCS/CCUS systems are currently deployed in a range of industrial applications, the integration of small-scale CC in micro-CHP systems for buildings in full-scale projects is required to advance the understanding and practice necessary for demonstration and deployment of this technology. To achieve this, as mentioned above, more research and development are required to develop innovative concepts that have the capacity to improve the operability, reliability and environmental performance, and to substantially decrease the costs of CC for use in new and existing residential, commercial and institutional buildings. Experimental pilot and demonstration scales are required to address these gaps.
The effective deployment of integrated small-scale CC in building energy systems requires the active involvement and engagement of government, building constructers, power utilities, CC manufacturers, policy makers and owners. It is anticipated that this review paper will be of interest to all concerned parties to enhance awareness of the challenges and issues, and to contribute more to this area.

Author Contributions

Conceptualization, W.Y.; methodology, W.Y.; formal analysis, W.Y., E.E. and M.L.; investigation, W.Y., E.E. and M.L.; data curation, E.E. and M.L.; writing—original draft preparation, W.Y., E.E. and M.L.; writing—review and editing, W.Y., E.E. and M.L. All authors have read and agreed to the published version of the manuscript.

Funding

Funding for this research was provided by Natural Resources Canada through the Program of Energy Research and Development.

Institutional Review Board Statement

Not applicable.

Informed Consent Statement

Not applicable.

Data Availability Statement

Data are contained within this review article.

Acknowledgments

The authors would like to thank the Office of Energy Research and Development (OERD) of Natural Resources Canada for their valuable financial support.

Conflicts of Interest

The authors declare no conflict of interest.

Nomenclature

CCcarbon capture
CCScarbon capture and storage
CCUScarbon capture, utilization and storage
CH4methane
C2H6ethane
CHPcombined heat and power
COcarbon monoxide
CO2carbon dioxide
DACdirect atmospheric capture
DPPdynamic payback period
EGRexhaust gas recirculation
EORenhanced oil recovery
FCfuel cell
GHGgreenhouse gas
GTgas turbine
HRSGheat recovery steam generator
HVACheating, ventilation, and air conditioning
H2hydrogen
IEAInternational Energy Agency
IPCCIntergovernmental Panel on Climate Change
LEClevelized energy cost
LHVlower heating value
MEAmonoethanolamine
micro-CHPmicro combined heat and power
mGTmicro gas turbine
mHATmicro humidified air turbine
NETnegative emissions technology
NGCCnatural gas combined cycle
NPInet power index
NPVnet present value
NOxoxides of nitrogen
O2oxygen
ORCorganic Rankine cycle
PACTpilot-scale advanced capture technology
REVAPregenerative evaporation
S-EGRselective exhaust gas recirculation
SOAstate-of-the-art
SOFCsolid oxide fuel cell
SRCCSSpecial report on carbon dioxide capture and storage
STIGsteam injected gas turbine
TRCLthree-reactors chemical looping
UHCunburned hydrocarbon
USDOEUS department of energy
VUBVrije Universiteit Brussel
WACwater atomizing inlet air cooling
ZEPZero Emissions Platform

References

  1. IEA. Net Zero by 2050, A Roadmap for the Global Energy Sector. 2021. Available online: https://www.iea.org/reports/net-zero-by-2050 (accessed on 15 February 2022).
  2. IEA. World Energy Outlook 2021; IEA: Paris, France, 2021; Available online: https://www.iea.org/reports/world-energy-outlook-2021 (accessed on 15 February 2022).
  3. IRENA. Global Energy Transformation: A Roadmap to 2050; International Renewable Energy Agency: Abu Dhabi, United Arab Emirates, 2018; Available online: www.irena.org/publications (accessed on 15 February 2022).
  4. Haszeldine, R.S.; Flude, S.; Johnson, G.; Scott, V. Negative Emissions Technologies and Carbon Capture and Storage to Achieve the Paris Agreement Commitments; Philosophical Transactions the Royal Society Publishing: Edinburgh, UK, 2018. [Google Scholar]
  5. IEA. Energy Technology Perspectives 2020, Special Report on Carbon Capture, Utilisation and Storage, CCUS in Clean Energy Transitions. 2020. Available online: https://webstore.iea.org/download/direct/4191 (accessed on 15 February 2022).
  6. IEA. About CCUS. 2021. Available online: https://www.iea.org/reports/about-ccus (accessed on 15 February 2022).
  7. Global CCS Institute. Global Status of CCS Report; Fluid Branding: Melbourne, Australia, 2021. [Google Scholar]
  8. Martin-Roberts, V.; Scott, S.; Flude, G.; Johnson, R.S.; Haszeldine, S. Gilfillan, Carbon capture and storage at the end of a lost decade. One Earth 2021, 4, 1569–1584. [Google Scholar] [CrossRef]
  9. Singh, B.; Strømman, A.H.; Hertwich, E.G. Comparative life cycle environmental assessment of CCS technologies. Int. J. Greenh. Gas Control 2011, 5, 911–921. [Google Scholar] [CrossRef]
  10. Cuellar-Franca, R.M.; Azapagic, A. Carbon capture, storage and utilisation technologies: A critical analysis and comparison of their life cycle environmental impacts. J. CO2 Util. 2015, 9, 82–102. [Google Scholar] [CrossRef]
  11. Leung, D.Y.C.; Caramanna, G.; Maroto-Valer, M.M. An overview of current status of carbon dioxide capture and storage technologies. Renew. Sustain. Energy Rev. 2014, 39, 426–443. [Google Scholar] [CrossRef] [Green Version]
  12. Abanades, J.C.; Arias, B.; Lyngfelt, A.; Mattisson, T.; Wiley, D.E.; Li, H.; Ho, M.T.; Mangano, E.; Brandani, S. Emerging CO2 capture systems. Int. J. Greenh. Gas Control 2015, 40, 126–166. [Google Scholar] [CrossRef] [Green Version]
  13. Bui, M.; Adjiman, C.S.; Bardow, A.; Anthony, E.J.; Boston, A.; Brown, S.; Fennel, P.S.; Fuss, S.; Galindo, A.; Hackett, L.A.; et al. Carbon capture and storage (CCS): The way forward. Energy Environ. Sci. 2018, 11, 1062–1176. [Google Scholar] [CrossRef] [Green Version]
  14. Wang, M.; Oko, E. Special issue on carbon capture in the context of carbon capture, utilisation and storage (CCUS). Int. J. Coal Sci. Technol. 2017, 4, 1–4. [Google Scholar] [CrossRef] [Green Version]
  15. IPCC (Intergovernmental Panel on Climate Change). IPCC Special Report on Carbon Dioxide Capture and Storage; Metz, B., Davidson, O., de Coninck, H.C., Loos, M., Meyer, L.A., Eds.; Prepared by working group III of the intergovernmental panel on climate change; Cambridge University Press: Cambridge, UK; New York, NY, USA, 2005; ISBN 13 978-0-521-86643-9. [Google Scholar]
  16. Wang, M.; Lawal, A.; Stephenson, P.; Sidders, J.; Ramshaw, C. Postcombustion CO2 capture with chemical absorption: A state-of the-art review. Chem. Eng. Res. Des. 2011, 89, 1609–1624. [Google Scholar] [CrossRef] [Green Version]
  17. Baena-Moreno, F.M.; Rodríguez-Galán, M.; Vega, F.; Alonso-Fariñas, B.; Arenas, L.F.V.; Navarrete, B. Carbon capture and utilization technologies: A literature review and recent advances. Energy Sources Part A Recovery Util. Environ. Eff. 2019, 41, 1403–1433. [Google Scholar] [CrossRef]
  18. Jiang, K.; Ashworth, P.; Zhang, S.; Liang, X.; Sun, Y.; Angus, D. China’s carbon capture, utilization and storage (CCUS) policy: A critical review 2019. Renew. Sustain. Energy Rev. 2019, 119, 109601. [Google Scholar] [CrossRef]
  19. Gür, T.M. Carbon dioxide emissions, capture, storage and utilization: Review of materials, processes and technologies. Prog. Energy Combust. Sci. 2022, 89, 100965. [Google Scholar] [CrossRef]
  20. Hong, W.Y. A techno-economic review on carbon capture, utilisation and storage systems for achieving a net-zero CO2 emissions future. Carbon Capture Sci. Technol. 2022, 3, 100044. [Google Scholar] [CrossRef]
  21. Hasan, M.M.F.; First, E.L.; Boukouvala, F.; Floudas, C.A. A multi-scale framework for CO2 capture, utilization, and sequestration: CCUS and CCU. Comput. Chem. Eng. 2015, 81, 2–21. [Google Scholar] [CrossRef] [Green Version]
  22. Yan, J.; Zhang, Z. Carbon Capture, Utilization and Storage (CCUS). Appl. Energy 2019, 235, 1289–1299. [Google Scholar] [CrossRef]
  23. Dowell1, N.M.; Fennell, P.S.; Shah, N.; Maitland, G.C. The role of CO2 capture and utilization in mitigating climate change. Nat. Clim. Chang. 2017, 7, 243–249. [Google Scholar] [CrossRef] [Green Version]
  24. Peridas, G.; Mordick Schmidt, B. The role of carbon capture and storage in the race to carbon neutrality. Electr. J. 2021, 34, 106996. [Google Scholar] [CrossRef]
  25. Raza, A.; Gholami, R.; Rezaee, R.; Rasouli, V.; Rabiei, M. Significant aspects of carbon capture and storage—A review. Petroleum 2019, 5, 335–340. [Google Scholar] [CrossRef]
  26. Karimi, F.; Khalilpour, R. Evolution of carbon capture and storage research: Trends of international collaborations and knowledge maps. Int. J. Greenh. Gas Control 2015, 37, 362–376. [Google Scholar] [CrossRef]
  27. Vögele, S.; Rübbelke, D.; Mayer, P.; Kuckshinrichs, W. Germany’s “No” to carbon capture and storage: Just a question of lacking acceptance? Appl. Energy 2018, 214, 205–218. [Google Scholar] [CrossRef]
  28. Beck, L. Carbon capture and storage in the USA: The role of US innovation leadership in climate-technology commercialization. Clean Energy 2020, 4, 2–11. [Google Scholar] [CrossRef]
  29. Zhang, K.; Xie, J.; Li, C.; Hu, L.; Wu, X.; Wang, Y. A full chain CCS demonstration project in northeast Ordos Basin, China: Operational experience and challenges. Int. J. Greenh. Gas Control 2016, 50, 218–230. [Google Scholar] [CrossRef]
  30. Li, J.; Hou, Y.; Wang, P.; Yang, B. A Review of carbon capture and storage project investment and operational decision-making based on bibliometrics. Energies 2019, 12, 23. [Google Scholar] [CrossRef] [Green Version]
  31. IEA. 20 Years of Carbon Capture and Storage—Accelerating Future Deployment, International Energy Agency, Paris, France. Available online: https://www.iea.org/publications/freepublications/publication/20-years-ofcarbon-capture-and-storage.html (accessed on 20 February 2022).
  32. Quale, S.; Rohling, V. The European Carbon dioxide Capture and Storage Laboratory Infrastructure (ECCSEL). Green Energy Environ. 2016, 1, 180–194. [Google Scholar] [CrossRef]
  33. MIT. CCS Project Database, Massachusetts Institute of Technology, Boston, USA. Available online: https://sequestration.mit.edu/tools/projects/index_capture.html (accessed on 18 February 2022).
  34. NETL. NETL’s Carbon Capture and Storage (CCS) Database—Version 5, National Energy Technology Laboratory, USA. Available online: https://www.netl.doe.gov/research/coal/carbon-storage/strategic-program-support/database (accessed on 20 February 2022).
  35. Rubin, E.; Davison, J.E.; Herzog, H.J. The cost of CO2 capture and storage. Int. J. Greenh. Gas Control 2015, 40, 378–400. [Google Scholar] [CrossRef]
  36. Leeson, D.; Dowell, N.M.; Shah, N.; Petit, C.; Fennell, P.S. A techno-economic analysis and systematic review of carbon capture and storage (CCS) applied to the iron and steel, cement, oil refining and pulp and paper industries, as well as other high purity sources. Int. J. Greenh. Gas Control 2017, 61, 71–84. [Google Scholar] [CrossRef]
  37. Plaza, M.G.; Martínez, S.; Rubiera, F. CO2 capture, use, and storage in the cement industry: State of the art and expectations. Energies 2020, 13, 5692. [Google Scholar] [CrossRef]
  38. Petrakopoulou, F.; Tsatsaronis, G. Can carbon dioxide capture and storage from power plants reduce the environmental impact of electricity generation? Energy Fuels 2014, 28, 5327–5338. [Google Scholar] [CrossRef]
  39. Wilberforce, T.; Baroutaji, A.; Soudan, B.; Al-Alami, A.H.; Olabi, A.G. Outlook of carbon capture technology and challenges. Sci. Total Environ. 2019, 657, 56–72. [Google Scholar] [CrossRef] [Green Version]
  40. Pan, S.Y.; Chiang, P.C.; Pan, W.; Kim, H. Advances in state-of-art valorization technologies for captured CO2 toward sustainable carbon cycle. Crit. Rev. Environ. Sci. Technol. 2018, 48, 471–534. [Google Scholar] [CrossRef]
  41. AdamsIi, T.A., II; Hoseinzade, L.; Madabhushi, P.B.; Okeke, I.J. Comparison of CO2 capture approaches for fossil-based power generation: Review and meta-study. Processes 2017, 5, 44. [Google Scholar] [CrossRef] [Green Version]
  42. González-Salazar, M.A. Recent developments in carbon dioxide capture technologies for gas turbine power generation. Int. J. Greenh. Gas Control 2015, 34, 106–116. [Google Scholar] [CrossRef]
  43. Hetti, R.K.; Karunathilake, H.; Chhipi-Shrestha, G.; Sadiq, R.; Hewage, K. Prospects of integrating carbon capturing into community scale energy systems. Renew. Sustain. Energy Rev. 2020, 133, 110193. [Google Scholar] [CrossRef]
  44. Liyanage, D.R.; Hewage, K.; Karunathilake, H.; Chhipi-Shrestha, G.; Sadiq, R. Carbon Capture Systems for Building-Level Heating Systems—A Socio-Economic and Environmental Evaluation. Sustainability 2021, 13, 10681. [Google Scholar] [CrossRef]
  45. Kanniche, M.; Gros-Bonnivard, R.; Jaud, P.; Valle-Marcos, J.; Amann, J.M.; Bouallou, C. Pre-combustion, post-combustion and oxy-combustion in thermal power plant for CO2 capture. Appl. Therm. Eng. 2009, 30, 53–62. [Google Scholar] [CrossRef] [Green Version]
  46. Hossain, M.M.; de Lasa, H.I. Chemical-looping combustion (CLC) for inherent CO2 separation—A review. Chem. Eng. Sci. 2008, 63, 4433–4451. [Google Scholar] [CrossRef]
  47. Lawal, A.; Wang, M.; Stephenson, P.; Yeung, H. Dynamic modelling of CO2 absorption for post combustion capture in coal-fired power plants. Fuel 2009, 88, 2455–2462. [Google Scholar] [CrossRef] [Green Version]
  48. Cousins, A.; Wardhaugh, L.T.; Feron, P.H.M. A survey of process flow sheet modifications for energy efficient CO2 capture from flue gases using chemical absorption. Int. J. Greenh. Gas Control 2011, 5, 605–619. [Google Scholar] [CrossRef]
  49. Vega, F.; Baena-Moreno, F.M.; Fernández, L.M.G.; Portillo, E.; Navarrete, B.; Zhang, Z. Current status of CO2 chemical absorption research applied to CCS: Towards full deployment at industrial scale. Appl. Energy 2020, 260, 114313. [Google Scholar] [CrossRef]
  50. Asif, M.; Suleman, M.; Haq, I.; Jamal, S.A. Post-combustion CO2 capture with chemical absorption and hybrid system: Current status and challenges. Greenh. Gases Sci. Technol. 2018, 8, 998–1031. [Google Scholar] [CrossRef]
  51. Sreedhar, I.; Nahar, T.; Venugopal, A.; Srinivas, B. Carbon capture by absorption—Path covered and ahead. Renew. Sustain. Energy Rev. 2017, 76, 1080–1107. [Google Scholar] [CrossRef]
  52. Ben-Mansour, R.; Habib, M.A.; Bamidele, O.E.; Basha, M.; Qasem, N.A.A.; Peedikakkal, A.; Laoui, T.; Ali, M. Carbon capture by physical adsorption: Materials, experimental investigations and numerical modeling and simulations—A review. Appl. Energy 2016, 161, 225–255. [Google Scholar] [CrossRef]
  53. Belmabkhout, Y.; Guillerm, V.; Eddaoudi, M. Low concentration CO2 capture using physical adsorbents: Are metal–organic frameworks becoming the new benchmark materials? Chem. Eng. J. 2016, 296, 386–397. [Google Scholar]
  54. Jiang, L.; Gonzalez-Diaz, A.; Ling-Chin, J.; Roskilly, A.P.; Smallbone, A.J. Post-combustion CO2 capture from a natural gas combined cycle power plant using activated carbon adsorption. Appl. Energy 2019, 245, 1–15. [Google Scholar] [CrossRef]
  55. Khalilpour, R.; Mumford, K.; Zhai, H.; Abbas, A.; Stevens, G.; Rubin, E.S. Membrane-based carbon capture from flue gas: A review. J. Clean. Prod. 2015, 103, 286–300. [Google Scholar] [CrossRef]
  56. Zhao, S.; Feron, P.H.M.; Deng, L.; Favre, E.; Chabanon, E.; Yan, S.; Hou, J.; Chen, V.; Qi, H. Status and progress of membrane contactors in post-combustion carbon capture: A state-of-the-art review of new developments. J. Memb. Sci. 2016, 511, 180–206. [Google Scholar] [CrossRef]
  57. Sreedhar, I.; Vaidhiswaran, R.; Kamani, B.M.; Venugopal, A. Process and engineering trends in membrane based carbon capture. Renew. Sustain. Energy Rev. 2017, 68, 659–684. [Google Scholar] [CrossRef]
  58. Olajire, A.A. CO2 capture and separation technologies for end-of-pipe applications—A review. Energy 2010, 35, 2610–2628. [Google Scholar]
  59. Somehsaraei, H.N.; Majoumerd, M.M.; Breuhaus, P.; Assadi, M. Performance analysis of a biogas-fueled micro gas turbine using a validated thermodynamic model. Appl. Therm. Eng. 2014, 66, 181–190. [Google Scholar] [CrossRef]
  60. De Paepe, W.; Contino, F.; Delattin, F.; Bram, S.; de Ruyck, J. Optimal waste heat recovery in micro gas turbine cycles through liquid water injection. Appl. Therm. Eng. 2014, 70, 846–856. [Google Scholar] [CrossRef]
  61. Stathopoulos, P.; Paschereit, C.O. Retrofitting micro gas turbines for wet operation, A way to increase operational flexibility in distributed CHP plants. Appl. Energy 2015, 154, 438–446. [Google Scholar] [CrossRef]
  62. Ebrahimi, M.; Soleimanpour, M. Design and evaluation of combined cooling, heating and power using micro gas turbine, adsorption chiller and a thermal damping tank in micro scale. Appl. Therm. Eng. 2017, 127, 1063–1076. [Google Scholar] [CrossRef]
  63. Rist, J.F.; Dias, M.F.; Palman, M.; Zelazo, D.; Cukurel, B. Economic dispatch of a single micro-gas turbine under CHP operation. Appl. Energy 2017, 200, 1–18. [Google Scholar] [CrossRef]
  64. De Paepe, W.; Montero Carrero, M.; Bram, S.; Parente, A.; Contino, F. Toward Higher Micro Gas Turbine Efficiency and Flexibility—Humidified Micro Gas Turbines: A Review. ASME J. Eng. Gas Turbines Power 2018, 140, 081702. [Google Scholar] [CrossRef]
  65. Turbec. T100 Microturbine System: User manual, Technical Description—T100 Natural Gas. D14127–03. Version 3, 09/12/29. 2009. Available online: https://manualzz.com/doc/33686173/t100-microturbine-system-technical-description-t100-natur. (accessed on 18 February 2022).
  66. Giorgetti, S.; Bricteux, L.; Parente, A.; Blondeau, J.; Contino, F.; de Paepe, W. Carbon capture on micro gas turbine cycles: Assessment of the performance on dry and wet operations. Appl. Energy 2017, 207, 243–253. [Google Scholar] [CrossRef]
  67. Giorgetti, S.; de Paepe, W.; Bricteux, L.; Parente, A.; Contino, F. Carbon capture on a micro gas turbine: Assessment of the performance. In Proceedings of the 8th International Conference on Applied Energy—ICAE2016, Bejing, China, 10 August 2016. [Google Scholar]
  68. De Paepe, W.; Carrero, M.M.; Giorgetti, S.; Parente, A.; Bram, S.; Contino, F. Exhaust gas recirculation on humidified flexible micro gas turbines for carbon capture applications. In Proceedings of the ASME Turbo Expo 2016, Seoul, Korea, 13–17 June 2016. no. ASME GT2016-57265. [Google Scholar]
  69. Akram, M.; Ali, U.; Best, T.; Blakey, S.; Finney, K.N.; Pourkashanian, M. Performance evaluation of PACT Pilot-plant for CO2 capture from gas turbines with Exhaust Gas Recycle. Int. J. Greenh. Gas Control 2016, 47, 37–150. [Google Scholar] [CrossRef]
  70. Majoumerd, M.M.; Somehsaraei, H.N.; Assadi, M.; Breuhaus, P. Micro gas turbine configurations with carbon capture—Performance assessment using a validated thermodynamic model. Appl. Therm. Eng. 2014, 73, 172–184. [Google Scholar] [CrossRef]
  71. Ali, U.; Best, T.; Finney, K.N.; Palma, C.F.; Hughes, K.J.; Ingham, D.B.; Pourkashanian, M. Process simulation and thermodynamic analysis of a micro turbine with post-combustion CO2 capture and exhaust gas recirculation. Energy Procedia 2014, 63, 986–996. [Google Scholar] [CrossRef] [Green Version]
  72. Ali, U.; Font-Palma, C.; Somehsaraei, H.N.; Majoumerd, M.M.; Akram, M.; Akram, M.; Finney, K.N.; Best, T.; Said, N.B.M.; Assadi, M.; et al. Benchmarking of a micro gas turbine model integrated with post-combustion CO2 capture. Energy 2017, 126, 475–487. [Google Scholar] [CrossRef]
  73. Bellas, J.-M.; Finney, K.N.; Diego, M.E.; Ingham, D.; Pourkashanian, M. Experimental investigation of the impacts of selective exhaust gas recirculation on a micro gas turbine. Int. J. Greenh. Gas Control 2019, 90, 102809. [Google Scholar] [CrossRef]
  74. Darabkhani, H.G.; Jurado, N.; Prpich, G.; Oakey, J.E.; Wagland, S.T.; Anthony, E.J. Design, process simulation and construction of a 100 kW pilot-scale CO2 membrane rig: Improving in situ CO2 capture using selective exhaust gas recirculation (S-EGR). J. Nat. Gas Sci. Eng. 2018, 50, 128–138. [Google Scholar] [CrossRef]
  75. De Paepe, W.; Carrero, M.M.; Bram, S.; Contino, F.; Parente, A. Waste heat recovery optimization in micro gas turbine applications using advanced humidified gas turbine cycle concepts. Appl. Energy 2017, 207, 218–229. [Google Scholar] [CrossRef]
  76. De Paepe, W.; Carrero, M.M.; Bram, S.; Contino, F. T100 micro gas turbine converted to full humid air operation—A thermodynamic performance analysis. In Proceedings of the ASME Turbo Expo 2015, Montreal, QC, Canada, 19 June 2015. no. ASME GT2015-56673, V003T06A015. [Google Scholar]
  77. Best, T.; Finney, K.N.; Ingham, D.B.; Pourkashanian, M. CO2-enhanced and humidified operation of a micro-gas turbine for carbon capture. J. Clean. Prod. 2018, 176, 370–381. [Google Scholar] [CrossRef]
  78. Giorgetti, S.; Parente, A.; Bricteux, L.; Contino, F.; de Paepe, W. Carbon Clean Combined Heat and Power Production from micro Gas Turbines: Thermodynamic Analysis of Different Scenarios. Energy Procedia 2017, 142, 1622–1628. [Google Scholar] [CrossRef]
  79. Giorgetti, S.; Parente, A.; Bricteux, L.; Contino, F.; de Paepe, W. Optimal design and operating strategy of a carbon-clean micro gas turbine for combined heat and power applications. Int. J. Greenh. Gas Control 2019, 88, 469–481. [Google Scholar] [CrossRef]
  80. Sammes, N.M.; Boersma, R. Small-scale fuel cells for residential applications. J. Power Sources 2000, 86, 98–110. [Google Scholar] [CrossRef]
  81. Kazempoor, P.; Dorer, V.; Weber, A. Modelling and evaluation of building integrated SOFC systems. Int. J. Hydrog. Energy 2011, 36, 13241–13249. [Google Scholar] [CrossRef]
  82. Allane, K.; Saari, A.; Ugursal, I.; Good, J. The financial viability of an SOFC cogeneration system in single-family dwellings. J. Power Sources 2006, 158, 403–416. [Google Scholar] [CrossRef]
  83. Staffell, I.; Green, R. The cost of domestic fuel cell micro-CHP systems. Int. J. Hydrog. Energy 2013, 38, 1088–10102. [Google Scholar] [CrossRef] [Green Version]
  84. Haseli, Y.; Dincer, I.; Naterer, G. Thermodynamic modeling of a gas turbine cycle combined with a solid oxide fuel cell. Int. J. Hydrog. Energy 2008, 33, 5811–5822. [Google Scholar] [CrossRef]
  85. Mehrpooya, M.; Akbarpour, S.; Vatani, A.; Rosen, M.A. Modeling and optimum design of hybrid solid oxide fuel cell-gas turbine power plants. Int. J. Hydrog. Energy 2014, 39, 21196–21214. [Google Scholar] [CrossRef]
  86. Cheddie, D.F. Thermo-economic optimization of an indirectly coupled solid oxide fuel cell/gas turbine hybrid power plant. Int. J. Hydrog. Energy 2011, 36, 1702–1709. [Google Scholar] [CrossRef]
  87. Zabihian, F.; Fung, A.S. Performance analysis of hybrid solid oxide fuel cell and gas turbine cycle: Application of alternative fuels. Energy Convers. Manag. 2013, 76, 571–580. [Google Scholar] [CrossRef]
  88. Isfahani, S.N.R.; Sedaghat, A. A hybrid micro gas turbine and solid state fuel cell power plant with hydrogen production and CO2 capture. Int. J. Hydrog. Energy 2016, 41, 9490–9499. [Google Scholar] [CrossRef]
  89. Chaney, L.J.; Tharp, M.R.; Wolf, T.W.; Fuller, T.A.; Hartvigson, J.J. Fuel Cell/Micro-Turbine Combined cycle, DOE Contract: DE-AC26-98FT40454, Final Report; McDermott Technology, Inc.: Alliance, OH, USA; Northern Research and Engineering Corporation: Portsmouth, NH, USA, 1999. [Google Scholar]
  90. Liu, A.; Weng, Y. Performance analysis of a pressurized molten carbonate fuel cell/micro-gas turbine hybrid system. J. Power Sources 2010, 195, 204–213. [Google Scholar] [CrossRef]
  91. Costamagna, P.; Magistri, L.; Massardo, A.F. Design and part-load performance of a hybrid system based on a solid oxide fuel cell reactor and a micro gas turbine. J. Power Sources 2001, 96, 352–368. [Google Scholar] [CrossRef]
  92. Rajashekara, K. Hybrid fuel-cell strategies for clean power generation. IEEE Trans. Ind. Appl. 2005, 41, 682–689. [Google Scholar] [CrossRef]
  93. Basrawi, M.F.B.; Yamada, T.; Nakanishi, K.; Katsumata, H. Analysis of the performances of biogas-fuelled micro gas turbine cogeneration systems (MGT-CGSs) in middle-and small-scale sewage treatment plants: Comparison of performances and optimization of MGTs with various electrical power outputs. Energy 2012, 38, 291–304. [Google Scholar] [CrossRef]
  94. Kupechi, J. Off-design analysis of a micro-CHP unit with solid oxide fuel cells fed by DME. Int. J. Hydrog. Energy 2015, 40, 12009–12022. [Google Scholar] [CrossRef] [Green Version]
  95. Chan, C.W.; Ling-Chin, J.; Roskilly, A.P. A review of chemical heat pumps, thermodynamic cycles and thermal energy storage technologies for low grade heat utilisation. Appl. Therm. Eng. 2013, 50, 1257–1273. [Google Scholar] [CrossRef]
  96. Quoilin, S.; Broek, M.V.D.; Declaye, S.; Dewallef, P.; Lemort, V. Techno-economic survey of Organic Rankine Cycle (ORC) systems. Renew. Sustain. Energy Rev. 2013, 22, 168–186. [Google Scholar] [CrossRef] [Green Version]
  97. Mahmoudi, A.; Fazli, M.; Morad, M.R. A recent review of waste heat recovery by organic Rankine cycle. Appl. Therm. Eng. 2018, 143, 660–675. [Google Scholar] [CrossRef]
  98. Tocci, L.; Pal, T.; Pesmazoglou, I.; Franchetti, B. A small scale organic Rankine cycle (ORC): A techno-economic review. Energies 2017, 10, 413. [Google Scholar] [CrossRef]
  99. Rahbar, K.; Mahmoud, S.; Dadah, R.K.; Moazami, N.; Mirhadizadeh, S.A. Review of organic Rankine cycle for small-scale applications. Energy Convers. Manag. 2017, 134, 135–155. [Google Scholar] [CrossRef]
  100. Dong, L.L.; Liu, H.; Riffat, S. Development of small-scale and micro-scale biomass fuelled CHP systems—A literature review. Appl. Therm. Eng. 2009, 29, 2119–22126. [Google Scholar] [CrossRef] [Green Version]
  101. Pereira, J.S.; Ribeiro, J.B.; Mendes, R.; Vaz, G.C.; André, J.C. ORC based micro-cogeneration systems for residential application—A state of the art review and current challenges. Renew. Sustain. Energy Rev. 2018, 92, 728–743. [Google Scholar] [CrossRef]
  102. Zhu, Y.; Li, W.; Li, J.; Li, H.; Wang, Y.; Li, S. Thermodynamic analysis and economic assessment of biomass-fired organic Rankine cycle combined heat and power system integrated with CO2 capture. Energy Convers. Manag. 2020, 204, 112310. [Google Scholar] [CrossRef]
  103. Giorgetti, S.; Coppitters, D.; Contino, F.; de Paepe, W.; Bricteux, L.; Aversano, G.; Parente, A. Surrogate-assisted modeling and robust optimization of a micro gas turbine plant with carbon capture. J. Eng. Gas Turbines Power 2020, 142, 011010. [Google Scholar] [CrossRef]
  104. Best, T.; Finney, K.N.; Ingham, D.B.; Pourkashanian, M. Impact of CO2-enriched combustion air on micro-gas turbine performance for carbon capture. Energy 2016, 115, 1138–1147. [Google Scholar] [CrossRef]
  105. Carrero, M.M.; de Paepe, W.; Magnusson, J.; Parente, A.; Bram, S.; Contino, F. Experimental characterisation of a micro Humid Air Turbine: Assessment of the thermodynamic performance. Appl. Therm. Eng. 2017, 118, 796–806. [Google Scholar] [CrossRef]
  106. Agbonghae, E.O.; Best, T.; Finney, K.N.; Palma, C.F.; Hughes, K.J.; Pourkashanian, M. Experimental and Process Modelling Study of Integration of a Micro-turbine with an Amine Plant. Energy Procedia 2014, 63, 1064–1073. [Google Scholar] [CrossRef] [Green Version]
  107. The Global Energy Institute. 2020. Available online: http://status.globalccsinstitute.com/ (accessed on 20 February 2022).
  108. SAPEA. Novel Carbon Capture and Utilisation Technologies; SAPEA: Berlin, Germany, 2018. [Google Scholar]
  109. Folger, P. Carbon Capture and Sequestration (CCS) in the United States; Congressional Research Service: Washington, DC, USA, 2018.
  110. CleanO2—Residential and Commercial Carbon Capture Unit. Available online: http://cleano2.ca/ (accessed on 20 February 2022).
  111. Pieri, T.; Nikitas, A.; Castillo-Castillo, A.; Angelis-Dimakis, A. Holistic Assessment of Carbon Capture and Utilization Value Chains. Environments 2018, 5, 108. [Google Scholar] [CrossRef] [Green Version]
  112. ZEP (Zero Emissions Platform). The Costs of CO2 Transport: Post-Demonstration CCS in the EU; European Technology Platform for Zero Emission Fossil Fuel Power Plants: Brussels, Belgium, 2011. [Google Scholar]
  113. USDOE. FE/NETL CO2 Transport Cost Model: Description and User’s Manual; Report No. DOE/NETL-2014/1660; US Dept of Energy, National Energy Technology Laboratory: Pittsburgh, PA, USA, 2014.
  114. Kuramochi, T.; Ramirez, A.; Turkenburg, W.; Faaij, A. Techno-economic prospects for CO2 capture from distributed energy systems. Renew. Sustain. Energy Rev. 2013, 19, 328–347. [Google Scholar]
  115. Loria, P.; Bright, M.B.H. Lessons captured from 50 years of CCS projects. Electr. J. 2021, 34, 106998. [Google Scholar] [CrossRef]
  116. Sanz-Perez, E.S.; Murdock, C.R.; Didas, S.A.; Jones, C.W. Direct capture of CO2 from ambient air. Chem. Rev. 2016, 116, 11840–11876. [Google Scholar]
  117. Shabbani, H.J.K. A review of CO2 adsorption from ambient air (direct air capture). Al-Qadisiyah J. Eng. Sci. 2020, 13, 1–6. [Google Scholar] [CrossRef]
  118. Fasihi, M.; Efimova, O.; Breyer, C. Techno-economic assessment of CO2 direct air capture plants. J. Clean. Prod. 2019, 224, 957–980. [Google Scholar] [CrossRef]
  119. Keith, D.W.; Holmes, G.; Angelo, D.S.; Heidel, K. A process for capturing CO2 from the atmosphere. Joule 2018, 2, 2179. [Google Scholar] [CrossRef]
  120. Kim, M.K.; Baldini, L.; Leibundgut, H.; Wurzbacher, J.A.; Piatkowski, N. A novel ventilation strategy with CO2 capture device and energy saving in buildings. Energy Build. 2015, 87, 134–141. [Google Scholar] [CrossRef]
  121. Kim, M.K.; Baldini, L.; Leibundgut, H.; Wurzbacher, J.A. Evaluation of the humidity performance of a carbon dioxide (CO2) capture device as a novel ventilation strategy in buildings. Appl. Energy 2020, 259, 112869. [Google Scholar] [CrossRef]
  122. Gall, E.T.; Nazaroff, W.W. New directions: Potential climate and productivity benefits from CO2 capture in commercial buildings. Atmos. Environ. 2015, 103, 378–380. [Google Scholar] [CrossRef] [Green Version]
  123. Viebahn, P.; Scholz, A.; Zelt, O. The potential role of direct air capture in the German energy research program—Results of a multi-dimensional analysis. Energies 2019, 18, 3443. [Google Scholar] [CrossRef] [Green Version]
  124. Deng, Y.; Li, J.; Miao, Y.; Izikowitz, D. A comparative review of performance of nanomaterials for Direct Air Capture. Energy Rep. 2021, 7, 3506–3516. [Google Scholar] [CrossRef]
  125. Sabatino, F.; Grimm, A.; Gallucci, F.; van Sint Annaland, M.; Kramer, G.J.; Gazzani, M. A comparative energy and costs assessment and optimization for direct air capture technologies. Joule 2021, 5, 2047–2076. [Google Scholar] [CrossRef]
  126. Baus, L.; Nehr, S. Potentials and limitations of direct air capturing in the built environment. Build. Environ. 2022, 208, 108629. [Google Scholar] [CrossRef]
Figure 1. Overview of carbon capture options (adapted from [15]).
Energies 15 02938 g001
Figure 2. Overview of carbon capture, utilization, and storage options (Adapted from [10]).
Energies 15 02938 g002
Figure 3. Schematic of the mGT and coupled CC unit representing the mGT Turbec T100 (adapted from [67]).
Energies 15 02938 g003
Figure 4. (a) Parallel and (b) series configurations of the selective EGR cycles (adapted from [73]). (a) parallel; (b) series.
Energies 15 02938 g004
Figure 5. The REVAP cycle, combining liquid water injection with aftercooling and feedwater preheat with economizer 2 (adapted from [75]).
Energies 15 02938 g005
Figure 6. Conventional mGT transformed into a mHAT through the addition of the humidification sub-cycle, depicted in orange (adapted from [66]).
Energies 15 02938 g006
Figure 7. Plant layout displaying the standard EGR in block A, the CHP application in block B, and, in the case of no heat demand where block B is bypassed, block C for humidification and block D for reboiler duty are activated (adapted from [78]).
Energies 15 02938 g007
Figure 8. Hybrid power plant schematic (adapted from [88]).
Energies 15 02938 g008
Figure 9. Conceptual design of three-reactors chemical looping for H2 generation (adapted from [88]).
Energies 15 02938 g009
Figure 10. Schematic process flow diagram of biomass-fired ORC-CHP system with MEA-based CC (adapted from [102]).
Energies 15 02938 g010
Table 1. Key design conditions of the mGT and CC plant (adapted from [67]).
UnitParameterValue
mGTElectrical power output (kW)100
Thermal power output (kW)153
Electrical efficiency (%)30
Pressure ratio (-)4.35
%CO2 (in the baseline mGT) (%)1.6
Turbine outlet temperature (°C)645
EGR ratio (-)0.62
%CO2 (in the mGT with EGR) (%)4.3
Carbon CaptureAbsorber dimensions (m × m)6 × 0.6
Stripper dimensions (m × m)6 × 0.45
Packing Type (-)IMPT
Packing Size (mm)38
Table 2. Comparison of the global plant efficiency with EGR and CC and traditional mGT efficiency (adapted from [67]).
ParameterValues
Electric power output (kW)758595100
mGT global plant efficiency (%) 28.028.328.529.0
mGT + EGR + CC global plant efficiency (%)22.022.222.222.2
Table 3. Effect of electric power output on reboiler duty (adapted from [67]).
ParameterValues
Electric power output (kW)7580859095100
Reboiler duty (kW)586165687275
Table 4. Effect of CO2 injection rates for the given operating envelope (60–100 kW) on CO and UHC emission concentrations (adapted from [73]).
Parameter Values
CO2 Injection Rate (kg/h) 050100150200250300
CO concentration
(ppm dry)
Operating power (kW)60100140180220300420510
7020205080100220305
8000003070100
900000205050
100000001020
UHC (CH4 + C2H6)
(ppm dry)
6081020304078105
700005103550
8000000510
900000055
1000000000
Table 5. Comparison of mHAT and mGT at 100 kW electrical load, 16% O2 in the combustor inlet, and constant turbine outlet temperature (adapted from [66]).
ParametermGTmHAT
EGRratio (-)0.610.46
Mass flow rate of the exhaust gas (kg/s)0.2950.360
CO2 concentration in the exhaust gas (%)4.33.0
Absolute electrical efficiency decrease (%)−1.3−0.9
Table 6. Influence of EGR ratio on O2 molar fraction at the combustor inlet and outlet, and on the CO2 and O2 molar fraction in flue gas (adapted from [71]).
ParameterValue
EGR (%)00.20.40.60.8
O2 at combustor inlet (%)21.020.119.016.09.0
O2 at combustor outlet (%)17.116.015.012.07.0
O2 in flue gas (%)17.816.215.112.95.1
CO2 in flue gas (%)1.92.753.04.08.0
Table 7. Optimal liquid/gas ratio, lean loading, and specific reboiler duty for flue gas with CO2 compositions from 3 to 8 mol% (adapted from [106]).
ParameterValue
Flue gas CO2 concentration345678
30 wt% MEA solution (wt%)
L/G (-)0.9071.2531.4961.9842.2202.454
Lean CO2 loading (-)0.2470.2550.2490.2650.2590.254
Specific reboiller duty (MJ/kg CO2)4.3994.3904.3744.4414.4314.437
35 wt% MEA solution (wt%)
L/G (-)0.8061.0031.2471.4881.9732.454
Lean CO2 loading (-)0.2600.2500.2500.2500.2730.285
Specific reboiller duty (MJ/kg CO2)4.2364.2614.2664.2824.2454.298
40 wt% MEA solution (wt%)
L/G (-)0.8061.0031.2471.4881.9732.454
Lean CO2 loading (-)0.2870.2780.2780.2780.2980.309
Specific reboiller duty (MJ/kg CO2)4.1144.1124.1154.1254.1384.200
Table 8. Comparison of the electrical efficiencies for various plant layouts functioning in CHP mode (adapted from [78]).
ParametermGTmGT + EGR mGT + EGR + CC
BlocksAA + BA + B
ηel (%)29.428.121.4
ηth (%)49.549.537.8
ηtot (%)78.977.659.2
Δηel (compared to mGT)-−1.3−8.0
Table 9. Comparison of the electrical efficiencies for different plant layouts where there is no heat demand (adapted from [78]).
Plant LayoutsBlocksηel (%)Δηel (Compared to mGT) (%)
mGT-29.4-
mGT + EGR + CCA21.4−8.0
mHATC32.4+3%
mHAT + EGRA + C31.5+2.1
mHAT + EGR + CCA + C24.1−5.3%
mGT + EGR + CC + Heat RecoveryA + D25.9−3.5%
mHAT + EGR + CC + Heat RecoveryA + C + D26.8−2.6%
Table 10. Efficiencies of plant layouts (adapted from [79]).
ParametermGT
Case (a)
mGT
Case (b)
mHAT
Case (c)
Electrical power production (kW)969697
Thermal power production (kW)165900
Fuel consumption mGT/mHAT (kW)340340322
Fuel consumption CC (kW)98046
Electrical efficiency (%)21.928.226.4
Thermal efficiency (%)37.726.60
Total efficiency (%) 59.654.826.4
Table 11. Transport costs for onshore pipelines at three diverse capacities (adapted from [35]).
Study3 MtCO2/Year10 MtCO2/Year30 MtCO2/Year
SRCCS (2002) [15] 3.0–5.01.5–2.60.9–1.5
IPCC (2005) [15]4.3–7.22.2–3.71.3–2.2
ZEP (2011) [112]10.93.3-
USDOE (2014) [113]4.9-1.7
Note: The values for SRCCS values are reported in 2002 USD/tCO2/250 km and the values for all other studies are in 2013 USD/tCO2/250 km.
Table 12. Transport costs for offshore pipelines at three diverse capacities (adapted from [35]).
Study3 MtCO2/Year10 MtCO2/Year30 MtCO2/Year
SRCCS (2002) [15]5.0–6.22.4–3.01.3–1.7
IPCC (2005) [15]7.2–8.93.4–4.31.9–2.4
ZEP (2011) [113]14.84.8-
Note: The values for SRCCS values are reported in 2002 USD/tCO2/250 km and the values for all other studies are in 2013 USD/tCO2/250 km.
Table 13. Onshore storage costs on a standard basis (2013 USD/tCO2) (adapted from [35]).
StudyIPCC (2005)ZEP (2011)GCCSI (2011)USDOE (2014)
Onshore storage costs Low1267
(USD/tCO2)High12181313
Table 14. Range of total costs for CC, transport and geological storage (2013 USD) (adapted from [35]).
Cost and Performance ParametersNGCC
with Post-Combustion Capture
Reference plant without CCS: Levelized cost of electricity (USD/MWh)42–83
Power plants with CCS
Increased fuel requirement per net MWh (%)13–18
CO2 captured (kg/MWh)360–390
CO2 avoided (kg/MWh)310–330
% CO2 avoided88–89
Power plant with capture, transport and geological storage
Levelized cost of electricity (USD/MWh)63–122
Electricity cost increase for CCS (USD/MWh)19–47
% increase28–72
Power plant with capture, transport and geological storage with EOR credits
Levelized cost of electricity (USD/MWh)48–112
Electricity cost increase for CCS (USD/MWh)3–37
% increase7–56
Table 15. Thermo-economic comparison of biomass-fired ORC-CHP system (R245fa) with and without CC (adapted from [102]).
ParameterBiomass-Fired ORC-CHP
Without CCWith CC
Total investment cost, INVtot (×104 USD)31.4882.9
Annual operation and maintenance costs, CO&M (×104 USD)39.2662.36
Net annual income, NAI (×104 USD/year)159.15136.05
Dynamic payback period, DPP (year)0.210.62
Profit ratio of investment, PRI (-)5.061.69
Net present value, NPV (×104 USD/year)1951.881663.98
Net power index, NPI (USD/kWe)1240.733267.31
levelized energy cost, LEC (USD/kWh)0.190.31
Publisher’s Note: MDPI stays neutral with regard to jurisdictional claims in published maps and institutional affiliations.

