Abstract
Good tightness is one of the necessary conditions for an anhydrite mine-out space to be used for underground crude oil storage. Combining engineering geological surveys, laboratory tests, and numerical simulations, this paper quantitatively analyses the tightness of the Anhui Hengtai anhydrite mine-out under different working conditions and discusses its suitability for underground crude oil storage. Triaxial compression tests of anhydrite rock considering seepage were carried out to study its hydraulic and mechanical characteristics during failure. The permeability coefficient–strain empirical formula of anhydrite was constructed. A numerical simulation was carried out on the basis of the finite difference method to study the tightness of the rock surrounding the mine-out after excavation and under 0.2 MPa, 0.6 MPa, and 1.0 MPa storage pressures, respectively. The results showed that the permeability coefficient increased with increasing storage pressure, and the growth rate gradually slowed after the storage pressure reached a certain value. Overall, the mine-out had good tightness, and the permeability coefficient of the surrounding rock was small. This study demonstrated the feasibility of using the anhydrite mine-out for crude oil storage and provides a scientific basis for the site selection of underground crude oil storage.
1. Introduction
Compared with traditional crude oil storage methods, including earth surface steel crude oil storage tanks, underground water-sealed crude oil storage caverns, and underground salt caves for crude oil storage, using underground abandoned anhydrite mine-out spaces to store crude oil has the advantages of shorter construction periods, lower investment costs, and broader application prospects [1,2,3,4,5,6]. As a type of underground storage, the storage of crude oil in anhydrite mine-out spaces should meet the following three conditions: the surrounding rock must have long-term stability during storage; the stored crude oil and oil gas must not leak out of the storage; and the stored crude oil must not interact with anhydrite rock [7].
The idea of using abandoned anhydrite mine-out to store crude oil was first put forward by Peng et al. (2013), who preliminarily analysed the feasibility of using the Anhui Hengtai anhydrite mine-out in China for crude oil storage and considered it to have the basic conditions for the construction of an underground crude oil storage facility [8]. Subsequently, some Chinese scholars took the Anhui Hengtai anhydrite mine-out as a case study and carried out systematic research on the scientific problems existing in the field of crude oil storage in anhydrite mine-out spaces. Previous research has shown that the Anhui Hengtai anhydrite mine-out has excellent airtightness and long-term stability for crude oil storage [4,7,9,10,11]. Anhydrite rock has no effect on the physical and chemical properties of crude oil, and the influence of crude oil on its mechanical properties can be ignored [7,12,13]. However, the current research on the tightness of anhydrite mine-out spaces used for underground crude oil storage is still limited. The permeability characteristics of the rock surrounding the anhydrite mine-out need to be further studied.
As a surrounding rock material, anhydrite is a dense sedimentary rock with extremely low porosity and permeability, which makes it impermeable in the intact state [14,15]. However, microcracks caused by the mining excavation and the loading of crude oil for storage may greatly increase the permeability of the disturbed surrounding rock, thus increasing the risk of crude oil leaking out of the storage through the surrounding rock [16,17,18,19]. In recent years, many scholars have carried out experimental research on the evolution law of rock permeability during deformation damage under hydro-mechanical coupling conditions, and their research shows that there is a certain relationship among stress, strain, and permeability throughout the process of rock damage failure. Moreover, the permeability curves show phase properties in the stress–strain process [20,21,22,23,24,25,26,27,28,29,30,31,32,33]. However, their research mainly focused on sandstone, limestone, granite, altered rock and other rock types, and there has been almost no research on anhydrite. Therefore, the absence of previous research and the proposal of using anhydrite mine-out space for crude oil storage stimulates the study of the permeability characteristics of the surrounding rock and the evaluation of its tightness. Some scholars found that the permeability coefficient of the surrounding rock of the underground water-sealed crude oil storage caverns after grouting can be reduced to a magnitude of 1 × 10⁻⁷–1 × 10⁻⁸ m/s by comparing the numerical calculation results with the field monitoring data [34,35,36]. To reach the range of water inflow required by the specification, the permeability coefficient of the surrounding rock needs to reach a magnitude of 1 × 10⁻⁹ m/s [37,38,39]. This can provide a reference for the tightness analysis of anhydrite mine-out used for underground crude oil storage.
In this paper, taking the Anhui Hengtai anhydrite mine-out as an engineering case study, a systematic method was proposed to analyse its tightness using triaxial compression tests while considering seepage and the results of the numerical simulation of strain. The stress–strain curve and permeability curve of anhydrite samples were obtained by using an MTS815 rock mechanics test system to construct the permeability coefficient–strain empirical formula. On the basis of numerical simulations, the unit strain information of anhydrite formation was collected, and the permeability coefficient of anhydrite formation was calculated by an empirical formula and visualized using FLAC3D version 5.0 software. The method of constructing the empirical formula of the permeability coefficient–strain of anhydrite rock and evaluating the tightness of the anhydrite mine-out used in this paper can be used as a reference for the analysis of permeability characteristics of other underground storage facilities.
2. Study Area
2.1. Engineering Overview
The Anhui Hengtai anhydrite mine-out is located in Ma’anshan City, Anhui Province, China. It began operation in 2004 with an ore production capacity of about 3 × 10⁵ m3/year [11]. After nearly 20 years of mining, a large underground mine-out space with a buried depth of more than 400 m and a volume of greater than 2.5 × 10⁶ m3 has been formed, including more than 350 transportation tunnels and mining caverns. Each transportation tunnel is 4.2 m high and 3.6 m wide; each mining cavern is 13 m high and 10 m wide; and the ore pillars are 10 m thick [7].
2.2. Geology and Hydrogeology
According to the geotechnical exploration reports, there are six main layers of strata in the mining area; from top to bottom, they are [11] ① the Quaternary (Q) alluvium and diluvium layer; ② the upper Cretaceous (K2) glutenite layer; ③ the Yueshan Formation (T2y) and Tongtoujian Formation (T2t) silty fine sandstone layer; ④ the Dongmaanshan Formation (T2d) karst limestone layer; ⑤ the Dongmaanshan Formation (T2d) anhydrite layer; and ⑥ the Dongmaanshan Formation (T2d) dolomitic limestone layer, as shown in Figure 1.
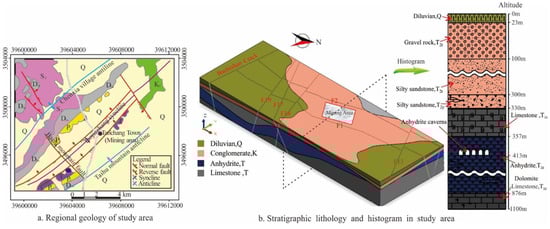
Figure 1.
Mine-out area landform and geological structure [11].
There are three main gentle folds in the study area, with small dip angles that are between 10° and 35°. Small folds are developed inside the ore body, whose dip angles vary greatly. Seven main faults are distributed in the mine area, which can be roughly divided into the following two groups: one fault group trends in the NE direction; the other fault group is oblique and trends in the NW direction. The mining area is located in the fault depression zone formed by four faults cutting the anhydrite ore body [4]. The fissures in the ore body are undeveloped, with a small number of compressive joints, whose openness is small. There are almost no tensile fractures or obvious dominant joint directions.
The groundwater in the mining area is mainly karst water, bedrock fissure water, and Quaternary pore water. The karst water mainly occurs in the karst limestone section of the Dongmaanshan Formation. This stratum has developed fissures and many karst caves. It is a strong aquifer and the direct water filling layer at the top of the anhydrite layer; the fissure water occurs in the local fracture development section of the upper Cretaceous (K2) glutenite; the pore water occurs in Quaternary (Q) alluvium and diluvium, which is greatly affected by the weather. The anhydrite layer has no water and is very dense and thick. During anhydrite mining, there was no water seepage into the tunnel walls [11]. Overall, the anhydrite layer is a natural water-resisting layer.
3. Experimental Study
3.1. Sample Type
A group of cylindrical anhydrite samples with diameters of 50 mm and heights of 100 mm were prepared from an intact representative anhydrite rock with a relatively complete structure and no surface macrocracks. According to the standard for Test Methods of Engineering Rock Mass (GB/T50266-2013), the diameter measurement deviations of the samples along the whole height were less than ±0.3 mm; the unevenness deviations at both ends of the samples were less than ±0.02 mm; the two ends of the samples were perpendicular to the axis; and their deviations were less than 0.25°. The samples were immersed in deionized distilled water under vacuum for at least 24 h to ensure saturation before testing.
3.2. Triaxial Compressive Strength of Anhydrite Samples
According to the relevant design of the axial load control mode in the test scheme, it is necessary to estimate the triaxial compressive strength of anhydrite under different confining pressures, and the corresponding calculation is completed using the Hoek–Brown failure criterion applicable to complete anhydrite, as shown in Equation (1) [4]:
where and are the major and minor principal stresses (MPa), respectively; is the uniaxial compressive strength (UCS) of the rock (MPa); and is the Hoek–Brown failure criterion material constant derived from the triaxial testing of the intact rock.
3.3. Experimental Instrument and Schemes
Triaxial compression tests were conducted on the MTS815 rock mechanics test system. The equipment is a multifunctional electrohydraulic servo control rigid testing machine specially produced by the MTS company of the United States for rock and concrete tests. It has four independent closed-loop servos controlling the axial pressure, confining pressure, pore water pressure, and temperature. It is mainly used for various static and dynamic tests of rock and concrete materials, including uniaxial compression tests, uniaxial tensile tests, and triaxial confining pressure tests. The test system shown in Figure 2 is mainly composed of a loading system, controllers, and a measuring system. The loading system includes a hydraulic source, loading frame, actuator, servo valves, triaxial test system, pore water pressure test system, and temperature control system. The stiffness of the equipment’s loading frame is 10.5 × 10³ N/m, the maximum axial load can reach 4600 kN, the maximum axial tension can reach 2300 kN, and the maximum confining pressure and the maximum pore water pressure are both 140 MPa.
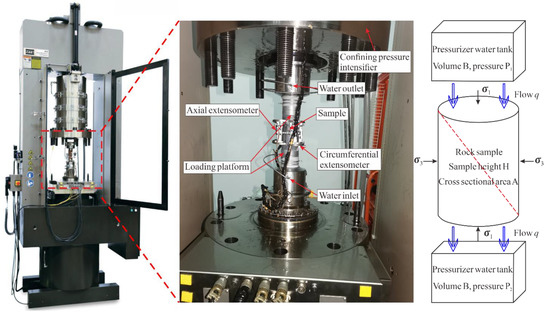
Figure 2.
MTS815 rock mechanics testing machine.
In the triaxial compression tests, the permeability of the samples was obtained by the pressure pulse transient method. During the tests, the initial differential pressure at both ends of the samples was set to 1 MPa, i.e., () was 1 MPa. Considering that the in situ stress at the mining caverns of the Anhui Hengtai anhydrite mine-out is approximately 10 MPa and that stress concentration may occur at local positions during mining and crude oil storage, the target values of the confining pressure σ3 were set to 10 MPa, 15 MPa, and 20 MPa, and the loading speed was 0.05 MPa per second, referring to the standard (GB/T 50266-2013). After the confining pressure σ3 reached the target value, the confining pressure σ3 was held unchanged; the axial pressure σ1 was applied at up to 0.8 times the triaxial compressive strength at a loading rate of 1.00 MPa per second; and then the axial pressure σ1 was increased by controlling the displacement at a loading rate of 0.01 mm/min until the sample was damaged [40]. In the above process, multiple measuring points were used to measure the water pressures at both ends of the samples, which were recorded as and at time . The permeability and permeability coefficient of each measuring point in the test can be calculated by Equations (2) and (3):
where is the permeability of the sample (m2); is the liquid compressibility coefficient; the empirical value of 0.0485 (m2/N) is taken; is the volume of the containers at both ends of the sample (m3); is the height of the sample (m); is the liquid dynamic viscosity (Pa·s); is the cross-sectional area of the sample (m2); is the cumulative time of data acquisition; and are the pore water pressure gradients of the samples at the beginning (0) and end (f) of the measurement, respectively (Pa/m); and , , , and are the water pressures at both ends of the sample at the beginning (0) and end (f) of the measurement, respectively (Pa);
where is the permeability coefficient (m/s) and is the gravitational acceleration (m/s2).
3.4. Experimental Results
3.4.1. Evolution Characteristics of the Strength, Deformation; and Permeability
The experimental results showed that the stress–strain curves of the anhydrite samples were consistent with the conventional rock stress–strain curve, which can be divided into five stages: the pore compaction stage (I); the linear elastic deformation stage (II); the stable microcrack development stage (III); the unstable development stage (IV); and the post-failure stage (V). In Figure 3, the stress–strain curves and the permeability coefficient–strain curves are summarized and compared. σcc, σci, σcd, and σc correspond to the crack closure threshold, the crack initiation threshold, the crack damage threshold, and the peak strength, respectively [41,42,43,44,45]. The short platforms on the stress–strain curves are consistent with the measuring points selected during the permeability measurements. They were caused by the slight creep phenomenon influenced by the constant axial load during measurement, which had little impact on the experimental results. According to the curves, the existence of the confining pressure improved the peak strength of the samples and caused the samples to transition from brittle failure to plastic flow. Under a confining pressure of 20 MPa, the sample could still bear the maximum bearing capacity for a long time after reaching the peak strength, showing good ductility.
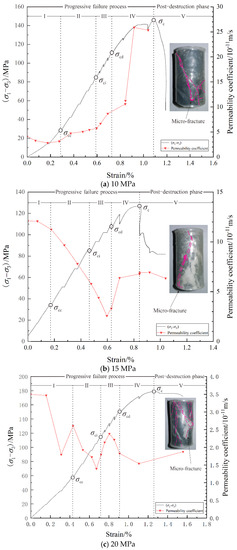
Figure 3.
Stress–strain curves and permeability coefficient–strain curves for anhydrite rock under different confining pressures.
Existing research has shown that the pore compression in the initial stage of the triaxial compression test reduces the permeability coefficient [20,21,22,23,24,25,26,27,28,29,30,31,32,33]. Through the comprehensive analysis of the stress–strain curves and permeability coefficient–strain curves, the permeability coefficient changes of the anhydrite rock can be divided into four stages: the pore compaction and linear elastic deformation stage (I and II); the microcrack stable development stage (III); the unstable development stage (IV); and the post-failure stage (V). It can be concluded that with an increasing axial load, the permeability coefficient of anhydrite rock generally decreases first and then increases. The existence of confining pressure also affects the permeability coefficient of the anhydrite rock. The variation range of the permeability coefficient decreases with increasing confining pressure. Under a confining pressure of 20 MPa, the permeability coefficient changed very little overall. In addition, the initial permeability coefficient of the sample under 15 MPa confining pressure was abnormally high, and the decrease range of the permeability coefficient in the stage of pore compaction and linear elastic deformation was also abnormally large, indicating that there were defects in the internal structure of the sample.
3.4.2. Empirical Formula of the Permeability Coefficient–Strain
Table 1 shows the calculation results of the permeability coefficients of the samples under different confining pressures. On the basis of the permeability coefficient–strain curves of anhydrite samples under different confining pressures, and considering the influence of test errors, it is believed that the permeability coefficient does not change significantly and that it is approximately 0 before and after failure when the confining pressure is greater than 15 MPa. Considering the abnormal performance of the anhydrite sample at 15 MPa confining pressure, it is proposed to construct the empirical formula of the permeability coefficient and strain based on the permeability coefficient–strain curve of the anhydrite sample at 10 MPa confining pressure. Referring to the research results of Xiao et al. (2020) on the permeability characteristics of red sandstone, the empirical relationship between the permeability coefficient and strain of anhydrite at 10 MPa confining pressure was constructed using Equation (4), and the fitting results are shown in Figure 4 [25].
where is the axial strain (%); and are the correlation coefficients, , ; is the initial permeability coefficient of the sample, ; and is the axial strain corresponding to the minimum permeability coefficient, .

Table 1.
Calculation results of the permeability coefficients.
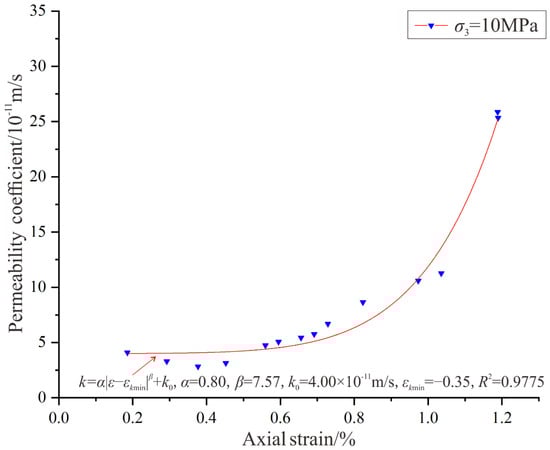
Figure 4.
Anhydrite permeability coefficient–strain fitting curve.
4. Numerical Analysis of Tightness
4.1. Numerical Model
On the basis of the stratigraphic borehole data of the Anhui Hengtai anhydrite mine-out and the actual excavation situation in 2020, a numerical model of the mine-out was constructed using FLAC3D. The model was 2310 m long, 1291 m wide, and 620 m high and consisted of 781,852 grid points and 1,630,569 elements. To simplify the calculations, the strata of the model were divided into four layers from top to bottom: the Quaternary (Q) alluvium and diluvium soil, the Cretaceous (K2) glutenite, the Triassic (T2d) limestone, and the Triassic (T2d) anhydrite (Figure 5). These layers were assumed to be continuous and uniform media with self-weight. In the calculation process, the ground surface was free; the horizontal and vertical displacements of the bottom surface and the horizontal displacements of the side surfaces were fixed. Referring to the research result of Wang et al. (2018), the Mohr–Coulomb failure criterion was adopted for the soil layer, glutenite layer and, limestone layer, while the generalized Hoek–Brown failure criterion was adopted for the anhydrite layer, and the parameters are shown in Table 2 and Table 3. The Moh–Coulomb failure criterion is shown in Equation (5), and the generalized Hoek–Brown failure criterion is shown in Equation (6) [4]:
where , , and are the Hoek–Brown failure criterion material constants, which can be calculated by Equation (7):
where is the geological strength index; is the disturbance factor; and is the Hoek–Brown failure criterion material constant.

Figure 5.
Numerical model.
Table 2.
Mohr–Coulomb failure criterion parameters of the anhydrite rock mass [4].
Table 3.
Generalized Hoek–Brown failure criterion parameters of the anhydrite rock mass [4].
4.2. Numerical Simulation Scheme
According to the existing engineering experience, the oil storage pressure of underground sealed oil depots is usually between 0.2 MPa and 1.0 MPa, and the specific value varies according to the storage scale, storage type, cavern buried depth, groundwater level, regional engineering geological conditions, and other factors. Considering that the excavation and crude oil storage could have a certain impact on the stress distribution of the surrounding rock and then affect the strain and permeability coefficient, the tightness of the anhydrite mine-out after mining and during crude oil storage were studied through the following four schemes, as shown in Table 4.
Table 4.
Numerical simulation scheme.
After the numerical calculations, the element strain information of anhydrite formation was output; the permeability coefficient of anhydrite formation was then calculated using the constructed permeability coefficient–strain empirical formula, and its visual–spatial distribution was created.
4.3. Tightness Analysis of the Anhydrite Mine-Out
4.3.1. Permeability Coefficient of the Surrounding Rock after Excavation
Figure 6 shows the distribution of the permeability coefficient of the surrounding rock after the excavation of the mining caverns. It can be seen in the figure that the excavation had a certain impact on the permeability coefficient of the anhydrite layer, and the permeability coefficients of the upper surface of the anhydrite layer and the corresponding part of the mine-out increased, resulting in a regional concentration. The permeability coefficients of the top and bottom layers of the mining caverns were large, and the permeability coefficients of the walls on both sides were small. The maximum value of the permeability coefficients appears at the intersection of the bottom of the mining caverns and the transportation roadways, which was approximately 4.32 × 10⁻¹¹ m/s. Considering the permeability coefficient distribution of the surrounding rock mass elements of the mining caverns, it is considered that its permeability is small and that the mine-out has good tightness.

Figure 6.
Distribution of the permeability coefficient of the anhydrite layer after excavation.
4.3.2. Permeability Coefficient of the Surrounding Rock during Oil Storage
The distributions of the permeability coefficient of the surrounding rock under different storage pressures are shown in Figure 7, Figure 8 and Figure 9. The maximum permeability coefficients of the surrounding rock under storage pressures of 0.2 MPa, 0.6 MPa, and 1.0 MPa are 4.3181 × 10⁻¹¹ m/s, 4.3189 × 10⁻¹¹ m/s, and 4.3191 × 10⁻¹¹ m/s, respectively. In addition, the permeability coefficients of the upper surface of the anhydrite layer and the corresponding part of the mine-out increased regionally, but the overall growth range was small. The permeability coefficients in the top and bottom layers of the anhydrite mining caverns were large, while the permeability coefficients of the sidewalls on both sides were small. The maximum permeability coefficient appeared at the intersection of the mining caverns and transportation roadways, which is worthy of special attention during an oil storage operation.

Figure 7.
Distribution of the permeability coefficient of the anhydrite layer under 0.2 MPa storage pressure.

Figure 8.
Distribution of the permeability coefficient of the anhydrite layer under 0.6 MPa storage pressure.

Figure 9.
Distribution of the permeability coefficient of the anhydrite layer under 1.0 MPa storage pressure.
The curves of the maximum permeability coefficient of the surrounding rock under four different storage pressures of 0 MPa, 0.2 MPa, 0.6 MPa, and 1.0 MPa with the storage pressure can be drawn, as shown in Figure 10. As can be seen in the curves, with the continuous increase in storage pressure, the maximum permeability coefficient of the mine-out also increased, but the increase was small. In addition, when the storage pressure reached a certain value, the growth rate of the maximum permeability coefficient also began to slow. Comprehensive analysis of the size and distributions of the permeability coefficients of the rock surrounding the mine-out suggests that the mine-out has good tightness during oil storage.

Figure 10.
Curve of the maximum permeability coefficient of the surrounding rock mass elements under different storage pressures.
5. Discussion
In the field of seepage-–stress coupling of underground space rock masses, previous research has mostly studied the evolution law of the strength, deformation, and permeability of rock under simulated natural stress and seepage environments in laboratory tests, which is rarely applied in practical engineering. In this study, the evolution law of the stress, strain, and permeability coefficients of anhydrite rock during compression failure were evaluated using triaxial compression tests considering seepage, and the corresponding relationship between the permeability coefficient and the strain of anhydrite rock was constructed. On the basis of the findings, the tightness of the abandoned anhydrite mine-out space after excavation and when used for crude oil storage was studied, enriching the research results of anhydrite mine-outs, which further confirms the feasibility of using an anhydrite mine-out for oil storage and provides an important reference for the tightness evaluation of an underground storage space.
The numerical results show that the maximum permeability coefficient of the anhydrite mine-out increased with the increase of crude oil storage pressure, and the growth rate began to slow when the storage pressure reached a certain value. Overall, the permeability coefficient was small, with a magnitude of 1 × 10⁻¹¹ m/s. This can provide a reference for the practical engineers and designers to calculate the crude oil loss rate and evaluate whether the anhydrite mine-out is suitable for crude oil storage. However, there are still many problems in this study’s proposed method of evaluating the tightness of the anhydrite mine-out, which needs to be further improved and perfected. For example, in this study, the anhydrite rock was regarded as a homogeneous material, without considering factors such as rock fracture and rock dispersion, so there is still a certain gap between the hypothetical conditions and the actual situation. Moreover, this study only considered the tightness of the anhydrite mine-out under excavation unloading and crude oil storage loading conditions and did not consider the cyclic loading and unloading of crude oil, which occurs in the actual storage operation. In addition, the permeability coefficient of the anhydrite formation was mainly calculated using the empirical permeability coefficient–strain formula combined with numerical simulation, and the accuracy of the calculation results needs to be demonstrated. These problems should be considered, and further research is needed to make the research results closer to the actual situation of the project. Furthermore, the tightness monitoring of the anhydrite mine-out used to store crude oil is crucial and should be considered in future studies. Bouchaala et al. (2019a, 2019b) showed that fracture development in rocks can be monitored through unconventional seismic attributes, such as seismic attenuation [46,47]. Furthermore, Takougang et al. (2019) suggested a new workflow based on the Reverse Time Migrated (RTM) to monitor fractures around reservoir zones [48]. Therefore, seismic monitoring may be a good option for monitoring natural tanks for crude oil storage.
6. Conclusions
By combining lab tests and numerical simulations, this paper investigated the tightness of anhydrite mine-out for crude oil storage under different working conditions. Through the above analysis, the following conclusions can be drawn:
- With an increasing axial load, the permeability coefficients of the anhydrite samples generally decreased first and then increased, and the variation amplitude decreased with increasing confining pressure. When the confining pressure was greater than 15MPa, the permeability coefficient of the anhydrite rock was 0.
- After excavation, the maximum permeability coefficient of the anhydrite mine-out appeared at the intersection of the bottom of the mining caverns and the transportation roadways. The permeability coefficients of the upper surface of the anhydrite layer and the corresponding part of the mine-out increased regionally, but its range was small, and the mine-out had good tightness.
- During oil storage, although the maximum permeability coefficient of the anhydrite mine-out increased with increasing storage pressure, the overall value was still small. After the storage pressure reached a certain value, the growth rate of the maximum permeability coefficient gradually slowed, and the mine-out had good tightness.
Author Contributions
Conceptualization, H.W.; Data curation, A.D.; Formal analysis, S.L.; Funding acquisition, B.Z.; Investigation, A.D.; Methodology, H.W.; Project administration, B.Z.; Resources, B.Z.; Software, H.W.; Supervision, H.W.; Validation, B.Z.; Visualization, A.D.; Writing—original draft, S.L.; Writing—review & editing, S.L. All authors have read and agreed to the published version of the manuscript.
Funding
This work was supported by the National Natural Science Foundation of China (Nos. 41972300 and 42107201), the China Postdoctoral Science Foundation (2020M680625), and the Fundamental Research Funds for the Central Universities of China (No. 292019072).
Institutional Review Board Statement
Not applicable.
Informed Consent Statement
Not applicable.
Data Availability Statement
Not applicable.
Acknowledgments
This work was supported by the National Natural Science Foundation of China (Nos. 41972300 and 42107201), the China Postdoctoral Science Foundation (2020M680625), and the Fundamental Research Funds for the Central Universities of China (No. 292019072).
Conflicts of Interest
The authors declare no conflict of interest.
References
- Bergman, S.M. Underground storage of oil and gas. J. Energy Eng.-ASCE 1984, 110, 181–190. [Google Scholar] [CrossRef]
- Kiyoyama, S. The present state of underground crude oil storage technology in Japan. Tunn. Undergr. Space Technol. 1990, 5, 343–349. [Google Scholar] [CrossRef]
- Zhao, J.; Choa, V.; Broms, B.B. Construction and utilization of rock caverns in Singapore Part B: Development costs and utilization. Tunn. Undergr. Space Technol. 1996, 11, 73–79. [Google Scholar] [CrossRef]
- Wang, H.X.; Zhang, B.; Fu, D.; Ndeunjema, A. Stability and airtightness of a deep anhydrite cavern group used as an underground storage space: A case study. Comput. Geotech. 2018, 96, 12–24. [Google Scholar] [CrossRef]
- Davis, R.M. National strategic petroleum reserve. Science 1981, 213, 618–622. [Google Scholar] [CrossRef]
- Zhang, N.; Shi, X.L.; Zhang, Y.; Shan, P.F. Tightness analysis of underground natural gas and oil storage caverns with limit pillar widths in bedded rock salt. IEEE Access 2020, 8, 12130–12145. [Google Scholar] [CrossRef]
- Zhang, B.; Wang, H.X.; Wang, L.; Mei, G.; Shi, L.; Xu, N.X.; Li, J.Y. Large-scale field test on abandoned deep anhydrite mine-out for reuse as crude oil storage-A case study. Eng. Geol. 2020, 267, 105477. [Google Scholar] [CrossRef]
- Peng, Z.H.; Li, J.Y.; Yang, S.; Wang, J.C. Feasibility analysis of utilization of waste gypsum mine for crude oil storage. J. Eng. Geol. 2013, 21, 470–475. (In Chinese) [Google Scholar]
- Feng, J. Study on Surrounding Rock Stability and Optimized Layout of Underground Energy Storage in Anhydrite. Master’s Thesis, China University of Geosciences (Beijing), Beijing, China, 2015. (In Chinese). [Google Scholar]
- Zhang, B.; Wang, H.X.; Wang, L.; Xu, N.X. Stability analysis of a group of underground anhydrite caverns used for crude oil storage considering rock tensile properties. Bull. Eng. Geol. Environ. 2019, 78, 6249–6265. [Google Scholar] [CrossRef]
- Wang, H.X.; Zhang, B.; Yu, X.; Xu, N.X.; Ye, J.H. Long-term stability and deformation behaviour of anhydrite mine-out for crude oil storage. Rock Mech. Rock Eng. 2020, 53, 1719–1735. [Google Scholar] [CrossRef]
- Fu, D. Research on strength timeliness of anhydrite rocks immersed in distilled water and crude oil. Master’s Thesis, China University of Geosciences (Beijing), Beijing, China, 2017. (In Chinese). [Google Scholar]
- Wang, H.X.; Zhang, B.; Wang, L.; Yu, X.; Shi, L.; Fu, D. Experimental investigation on the long-term interactions of anhydrite rock, crude oil, and water in a mine-out space for crude-oil storage. Eng. Geol. 2020, 265, 105414. [Google Scholar] [CrossRef]
- Hangx, S.J.T.; Spiers, C.J.; Peach, C.J. Mechanical behavior of anhydrite caprock and implications for CO2 sealing capacity. J. Geophys. Res.-Solid Earth 2010, 115, B07402. [Google Scholar] [CrossRef]
- Hangx, S.J.T.; Spiers, C.J.; Peach, C.J. The effect of deformation on permeability development in anhydrite and implications for caprock integrity during geological storage of CO2. Geofluids 2010, 10, 369–387. [Google Scholar] [CrossRef]
- Kelsall, P.C.; Case, J.B.; Chabannes, C.R. Evaluation of excavation-induced changes in rock permeability. Int. J. Rock Mech. Min. Sci. 1984, 21, 123–135. [Google Scholar] [CrossRef]
- Souley, M.; Homand, F.; Pepa, S.; Hoxha, D. Damage-induced permeability changes in granite: A case example at the URL in Canada. Int. J. Rock Mech. Min. Sci. 2001, 38, 297–310. [Google Scholar] [CrossRef]
- Fisher, Q.J.; Haneef, J.; Grattoni, C.A.; Allshorn, S.; Lorinczi, P. Permeability of fault rocks in siliciclastic reservoirs: Recent advances. Mar. Pet. Geol. 2018, 91, 29–42. [Google Scholar] [CrossRef] [Green Version]
- Meng, T.; Liu, R.C.; Meng, X.X.; Zhang, D.H.; Hu, Y.Q. Evolution of the permeability and pore structure of transversely isotropic calcareous sediments subjected to triaxial pressure and high temperature. Eng. Geol. 2019, 253, 27–35. [Google Scholar] [CrossRef]
- Heiland, J. Permeability of triaxially compressed sandstone: Influence of deformation and strain-rate on permeability. Pure Appl. Geophys. 2003, 160, 889–908. [Google Scholar] [CrossRef]
- Wang, H.L.; Xu, W.Y.; Shao, J.F. Experimental researches on hydro-mechanical properties of altered rock under confining pressures. Rock Mech. Rock Eng. 2013, 47, 485–493. [Google Scholar] [CrossRef]
- Chen, Y.F.; Hu, S.H.; Wei, K.; Hu, R.; Zhou, C.B.; Jing, L.R. Experimental characterization and micromechanical modeling of damage-induced permeability variation in Beishan granite. Int. J. Rock Mech. Min. Sci. 2014, 71, 64–76. [Google Scholar] [CrossRef]
- Wang, L.; Liu, J.F.; Pei, J.L.; Xu, H.N.; Bian, Y. Mechanical and permeability characteristics of rock under hydro-mechanical coupling conditions. Environ. Earth Sci. 2015, 73, 5987–5996. [Google Scholar] [CrossRef]
- Chen, X.; Tang, C.A.; Yu, J.; Zhou, J.F.; Cai, Y.Y. Experimental investigation on deformation characteristics and permeability evolution of rock under confining pressure unloading conditions. J. Cent. South Univ. 2018, 25, 1987–2001. [Google Scholar] [CrossRef]
- Xiao, W.J.; Zhang, D.M.; Wang, X.J. Experimental study on progressive failure process and permeability characteristics of red sandstone under seepage pressure. Eng. Geol. 2020, 265, 105406. [Google Scholar] [CrossRef]
- Brace, W.F.; Walsh, J.B.; Frangos, W.T. Permeability of granite under high pressure. J. Geophys. Res.-Atmos. 1968, 73, 2225–2236. [Google Scholar] [CrossRef]
- Chen, Z.Q.; Yang, Z.M.; Wang, M.R. Hydro-mechanical coupled mechanisms of hydraulic fracture propagation in rocks with cemented natural fractures. J. Pet. Sci. Eng. 2018, 163, 421–434. [Google Scholar] [CrossRef]
- Chen, Y.L.; Zhang, Y.N.; Li, X.L. Experimental study on influence of bedding angle on gas permeability in coal. J. Pet. Sci. Eng. 2019, 179, 173–179. [Google Scholar] [CrossRef]
- Mitchell, T.M.; Faulkner, D.R. Experimental measurements of permeability evolution during triaxial compression of initially intact crystalline rocks and implications for fluid flow in fault zones. J. Geophys. Res. 2008, 113, B11412. [Google Scholar] [CrossRef]
- Oda, M.; Takemura, T.; Aoki, T. Damage growth and permeability change in triaxial compression tests of Inada granite. Mech. Mater. 2002, 34, 313–331. [Google Scholar] [CrossRef]
- Patsoules, M.G.; Cripps, J.C. An investigation of the permeability of yorkshire chalk under differing pore water and confining pressure conditions. Energy Sources 2007, 6, 321–334. [Google Scholar] [CrossRef]
- Schulze, O.; Popp, T.; Kern, H. Development of damage and permeability in deforming rock salt. Eng. Geol. 2001, 61, 163–180. [Google Scholar] [CrossRef]
- Wang, S.G.; Elsworth, D.; Liu, J.S. Permeability evolution during progressive deformation of intact coal and implications for instability in underground coal seams. Int. J. Rock Mech. Min. Sci. 2013, 58, 34–45. [Google Scholar] [CrossRef]
- Usmani, A.; Kannan, G.; Nanda, A.; Jain, S.K. Seepage behavior and grouting effects for large rock caverns. Int. J. Geomech. 2015, 15, 06014023. [Google Scholar] [CrossRef]
- Tang, D.; Jiang, Z.M.; Huang, S.C. Optimization of grouting measures at the bottom of a water-sealed oil storage cavern. J. Eng. Geol. 2020, 28, 142–148. [Google Scholar]
- Qiao, L.P.; Wang, Z.C.; Li, S.C.; Bi, L.P.; Xu, Z.H. Assessing containment properties of underground oil storage caverns: Methods and a case study. Geosci. J. 2017, 21, 579–593. [Google Scholar] [CrossRef]
- GB 50455-2020; Code for Design of Underground Oil Storage in Rock Caverns. China Planning Press: Beijing, China, 2020.
- He, G.F. Estimation and analysis of water inflow of a underground water sealed cavern in Zhanjiang. West-China Explor. Eng. 2011, 23, 7. [Google Scholar]
- Zhang, Q.H.; Li, Y.J.; Yuan, D.; Zhao, X.; Zhang, W.H. Water injection test about water curtain borehole for underground water-sealed cavern and analysis of rock equivalent permeability parameter. Rock Soil Mech. 2015, 36, 2648–2658. [Google Scholar]
- GB/T 50266-2013; Standard for Test Methods of Engineering Rock Mass. China Planning Press: Beijing, China, 2013.
- Martin, C.D.; Chandler, N.A. The progressive fracture of Lac du Bonnet granite. Int. J. Rock Mech. Min. Sci. 1994, 31, 643–659. [Google Scholar] [CrossRef]
- Eberhardt, E.D. Brittle Rock Fracture and Progressive Damage in Uniaxial Compression. Ph.D. Thesis, University of Saskatchewan, Saskatoon, Sask, 1998. [Google Scholar]
- Yu, J.; Chen, S.J.; Chen, X.; Zhang, Y.Z.; Cai, Y.Y. Experimental investigation on mechanical properties and permeability evolution of red sandstone after heat treatments. J. Zhejiang Univ.-SCI A 2015, 16, 749–759. [Google Scholar] [CrossRef] [Green Version]
- Chen, S.W.; Yang, C.H.; Wang, G.B. Evolution of thermal damage and permeability of Beishan granite. Appl. Therm. Eng. 2017, 110, 1533–1542. [Google Scholar] [CrossRef]
- Pepe, G.; Mineo, S.; Pappalardo, G.; Cevasco, A. Relation between crack initiation-damage stress thresholds and failure strength of intact rock. Bull. Eng. Geol. Environ. 2018, 77, 709–724. [Google Scholar] [CrossRef]
- Bouchaala, F.; Ali, M.Y.; Bouzidi, Y.; Takougang, T.; Mohamed, A.A. Azimuthal investigation of compressional seismic-wave attenuation in a fractured reservoir. Geophysics 2019, 84, 437–446. [Google Scholar] [CrossRef]
- Bouchaala, F.; Ali, M.Y.; Bouzidi, Y.; Takougang, T.; Mohamed, A.A. Scattering and intrinsic attenuation as a potential tool for studying of a fractured reservoir. J. Pet. Sci. Eng. 2019, 174, 533–543. [Google Scholar] [CrossRef]
- Takougang, T.; Ali, M.Y.; Bouzidi, Y.; Bouchaala, F.; Mohamed, A.A. Extraction and characterization of faults and fractures from 3D VSP data in a carbonate reservoir: A workflow. J. Pet. Sci. Eng. 2019, 182, 106328. [Google Scholar] [CrossRef]
Publisher’s Note: MDPI stays neutral with regard to jurisdictional claims in published maps and institutional affiliations. |
© 2022 by the authors. Licensee MDPI, Basel, Switzerland. This article is an open access article distributed under the terms and conditions of the Creative Commons Attribution (CC BY) license (https://creativecommons.org/licenses/by/4.0/).