Article

DC and AC Tests of Moisture Electrical Pressboard Impregnated with Mineral Oil or Synthetic Ester—Determination of Water Status in Power Transformer Insulation

by
Pawel Zukowski
1,
Przemyslaw Rogalski
1,
Tomasz N. Kołtunowicz
1,*,
Konrad Kierczynski
1,
Marek Zenker
2,
Alexander D. Pogrebnjak
3 and
Matej Kucera
4
1
Department of Electrical Devices and High Voltage Technology, Faculty of Electrical Engineering and Computer Science, Lublin University of Technology, 38A Nadbystrzycka Str., 20-618 Lublin, Poland
2
Department of Electrotechnology and Diagnostics, West Pomeranian University of Technology, 37 Sikorskiego Str., 70-313 Szczecin, Poland
3
Department of Nanoelectronic and Surface Modification, Sumy State University, 2 R-Korsakova Str., 40007 Sumy, Ukraine
4
Department of Measurement and Application Electrical Engineering, University of Zilina, 8215/1 Univerzitná, 01026 Zilina, Slovakia
*
Author to whom correspondence should be addressed.
Energies 2022, 15(8), 2859; https://doi.org/10.3390/en15082859
Submission received: 24 March 2022 / Revised: 7 April 2022 / Accepted: 12 April 2022 / Published: 13 April 2022

Abstract

:
In this study, the conductivity and permittivity of electrical pressboard—insulating liquid—water composites were investigated, and the electrical properties of the composites and water were analysed comparatively. Mineral oil and synthetic ester were used as insulating liquids. It was found that the presence of water caused an increase in the permeability of the composite in the frequency range below 100 Hz. The value of static permittivity determined by water in the content of 5 wt. % was approximately 15. To obtain this value caused by liquid water, its volume should be approximately five (oil) and four times (ester) higher than its actual content, respectively. The determined values of the activation energy of the DC conductivity of the composites were several times higher than the values of the activation energy of the conductivity of the liquid water. The experimental values of the dielectric relaxation times were many orders of magnitude higher than the dielectric relaxation times of water. This means that the experimental results obtained for the dielectric permittivity, the activation energy of conductivity and the dielectric relaxation times for moisture electrical pressboard impregnated by mineral oil or synthetic ester exclude the possibility of the presence of liquid water in the composites. It was found that the conductivity of the composites increased exponentially with increasing water content. Such dependencies are characteristic of hopping conductivity, caused by the quantum phenomenon of electron tunnelling between nanometre-sized potential wells. As the increase in conductivity is determined by the presence of water in the composites, therefore, the nanometre potential wells were single-water molecules or nanodrops.

1. Introduction

For more than 100 years, so-called liquid–solid insulation, consisting of cellulose materials and insulating liquids, has been used in the manufacture of power transformers. The production processes for transformers can be summarised as follows. The copper windings of a transformer are insulated with cellulose materials such as winding paper and/or pressboard. Once the transformer components are made, they are assembled in a vat that is hermetically sealed. The air from the vat is then pumped out with a vacuum pump to a pressure below 1 hPa, and the windings and their insulation are heated. This causes vacuum drying of the insulation, during which the moisture content of the cellulose is reduced to approximately 0.8–1.0% by weight or even below [1,2]. Then, also under vacuum, the transformer tank is filled with insulating liquid, heated to above 60 °C, and specially prepared to remove water and dissolved gases. The moisture content of the liquid is 3–7 ppm, depending on the high voltage level of the transformer [3,4]. An impregnation process takes place, during which the insulating liquid fills the capillaries in the cellulose insulation and the voids between the insulation and other elements of the transformer structure. After the impregnation is completed and the pressure in the tank is raised to atmospheric levels, the liquid is additionally pressurised and completely fills the empty spaces in the insulation.
Over decades of transformer operation, moisture very slowly enters the transformer and dissolves into the liquid, and then the liquid delivers water molecules to the cellulose [5,6]. Water is absorbed by the cellulose because the solubility of water in impregnated cellulose is approximately 1000 times higher than in liquid [7]. Over many years of use, the moisture content of impregnated cellulose can increase to approximately 5% by weight and even slightly higher. This level of moisture is a critical value. If it is exceeded, it may constitute the threat of the catastrophic failure of the transformer [8,9]. In order to detect the state, approaching the critical value, periodical measurements of the state of moisture of the solid component of the insulation should be carried out. Due to the fact that the transformer is made as a hermetic device, electrical methods are used to estimate the water content. In the return voltage measurement (RVM) method, the dielectric relaxation time and its dependence on the water content are determined [10,11]. In the polarization and depolarization current (PDC) method, the dependence of DC conductance on the insulation moisture content is measured [12,13,14]. The most commonly used is the frequency domain spectroscopy (FDS) method, which determines AC parameters measured over a wide range of frequencies from sonic to ultralow [15,16].
To analyse the results obtained from FDS measurements, dielectric relaxation models are used, which do not always accurately describe the phenomena occurring in the constant component of transformer insulation. Recently, a publication [17] presented the results of laboratory tests that indicated that the value of dampness estimated by the FDS meter software was inconsistent with the real value, determined by the Karl Fischer titration method [18].
Pressboard impregnated with insulating oil is a two-phase composite material. However, its moisturization during the operation of transformers causes the composite to become three-phase.
Two mechanisms are currently used to describe the electrical properties of composites. The first is the percolation mechanism in composite materials, consisting of two phases, each with macroscopic dimensions. One phase, which is highly resistive, is the matrix and the other is the conducting phase. On the basis of percolation theory and experimental studies (see, for example, [19]), it was found that at low concentrations of the conducting phase, there is a conductivity with a value close to that of the dielectric phase. With increasing conductive phase content, its molecules begin to contact each other until they form a percolation channel connecting the electrodes. This causes a sharp increase in the DC and the conductivity of the composite. The concentration of the conductive phase for which a sharp increase in current is observed is called the percolation threshold. Well above the percolation threshold, the conductivity is close to the value characteristic of the conducting phase.
The second mechanism of conductivity of composites is step conductivity based on the quantum mechanical phenomenon of electron tunnelling. This mechanism is observed for nanocomposites in which the conducting phase is in the form of nanometre-sized objects, that is, with dimensions below 100 nm [20]. When the distances between adjacent potential wells are also nanometre, the electron on the tunnelling path can pass under the potential barrier from one well to another. Electron tunnelling in an electric field is manifested by the flow of direct current. The role of potential wells can be played, for example, by single atoms such as dopants and point defects in semiconductors and ionic crystals and nanoparticles of a conducting or semiconducting phase [21,22].
In nanocomposites conducting by tunnelling, the contact of potential wells is not needed for the formation of a percolation channel, because a conductive path is formed when there are certain distances between them. One of the pioneers in the development of conductivity by electron tunnelling was Nevil F. Mott [22]. Both models and a large number of experiments show (see, for example, [23,24]) that the dependence of nanocomposite conductivity on nanoparticle concentration is exponential. With the rapid development of nanotechnology, many papers have been written on the occurrence of step conductivity in nanocomposites by electron tunnelling [25,26,27,28,29].
A correct estimation of the moisture content of the solid component of the insulation can be obtained by using a physical model that accurately reflects the conductivity and dielectric relaxation processes occurring in the insulation. Such a physical model can be created only on the basis of the knowledge of the state and structure of water contained in the three-phase composite of pressboard—insulating liquid—water.
Currently, three models are known for the structure and state of water in cellulose–insulating oil–moisture composites.
The first one, presented in [30], on the basis of DC measurements of moisturized composites assumes that water in a three-phase composite is in the form of single molecules. The DC conductivity of the composite is determined by the presence of water and takes place through electron tunnelling between water molecules, which form potential wells.
The second mechanism, which is based on DC and AC studies of the conductivity of composites [31,32], assumes that water can exist in the form of nanodrops, forming potential wells. On average, there are approximately 200 water molecules in each nanodrop. The diameters of the nanodrops are about 2.2 nm. When an electron tunnels from one potential well to another, a dipole is formed, resulting in additional dielectric polarisation of the composite [33]. The value of dielectric relaxation time is a function of the average distance between adjacent potential wells, dielectric permittivity and temperature [32,34]. From both of these mechanisms, it can be seen that during the many years of operation of power transformers, moisturizing of the insulation occurs and the pressboard–insulating liquid composite is transformed into a nanocomposite. The nano-dimensional phase in it are water molecules or nanodrops.
Recently, a paper [35] negated the possibility of the presence of water nanodrops in pressboard–insulating oil–water composites and proposed a third mechanism, which assumes that the DC conductivity of the composite is due to the presence of liquid water in the composite, containing high concentrations of inorganic salt ions.
A comparison of the conclusions from the three mechanisms mentioned above shows that both the DC conductivity, permittivity and dielectric relaxation should vary dramatically depending on the actual structure and state of the water present in the three-phase composites.
In order to correctly estimate the level of moisture in the liquid–solid insulation of power transformers, it is necessary to use a model that faithfully describes the processes of conductivity and dielectric relaxation. In order to choose the correct model, a comparative analysis of the electrical properties of the three-phase composite and its components should be carried out. The material parameters that determine the electrical properties of composites are conductivity, dielectric permittivity and their temperature dependence.
Over the past decades, mineral oil was the dominant insulating liquid. Nowadays, other insulating liquids, such as Midel 7131 synthetic esters and natural ester oils (e.g., Midel eN 1204), are gradually being introduced into transformer manufacturing. These liquids have a high flash point, good insulating properties and are more environmentally friendly due to the fact of their high biodegradability [36,37,38].
The aim of this paper was to study the DC and AC electrical properties of three-component composites comprised of electrical pressboard—insulating liquid—water to carry out a comparative analysis of the electrical properties of the composites and water and to determine on this basis the state of the water in the pressboard impregnated with insulating liquids. Mineral oil and synthetic ester used to insulate the power transformers were used as insulating liquids.

2. Materials and Methods

Laboratory tests of ternary composites are carried out, as a rule, on samples of pressboard, vacuum-dried, then moistened to a given value and impregnated with insulating liquid [39,40].
A commonly used method, described in [41,42], was used to prepare the samples in this study. In the study, a 1 mm thick electrical pressboard manufactured by Weidman was used. Drying was carried out in a vacuum below 1 hPa for 72 h. The temperature was 353 K. After drying, the mass of the sample was determined, and on its basis the mass that it would gain after moisturizing to a given level was determined. Moistening was carried out in air, from where the sample absorbed moisture until the determined mass was obtained. The sample was then immersed in an insulating liquid for impregnation. In [41,42,43,44], it was found that the process of impregnation of the pressboard at atmospheric pressure may take from one week to approximately 6 months and depends on the sample’s thickness and temperature. The research described in [45,46,47] shows that the time of impregnation of 2 mm thick samples at room temperature was approximately 40 days. As it is known, the impregnation time is proportional to the oil viscosity and to the square of the sample thickness. In order to reduce the impregnation time, 1 mm thick samples were used for this study. Increased temperature lowers the viscosity of the insulating liquid and, thus, accelerates the impregnation process [48]. The impregnation was performed in a climate chamber at 45 °C. The impregnation time was two weeks. A series of samples with water contents from 0.6 to 5.0 wt. % were made in this way. The uncertainty in determining the water content was ±4%.
The tests were carried out using the test stand described in papers [47,49,50,51]. The stand consisted of a three-electrode measuring capacitor, an FDS PDC DIRANA meter—FDS-PDC dielectric response analyser (OMICRON Energy Solutions GmbH, Berlin, Germany), an Agilent 34970A temperature recorder (Agilent Technologies, Inc., Santa Clara, CA, USA), a thermostat that maintained the temperature with an uncertainty no less than ±0.05 °C and a computer, which was used to control the thermostat, the measurements and to acquire the measurement results.
The pressboard under test was placed between the voltage and measurement electrodes in a three-electrode measuring system. The system was hermetically sealed in a vessel with insulating liquid and placed in a thermostat. Once the set temperature was reached, the thermostat maintained it over a period of hours. DC and AC measurements were made with a DIRANA meter in the frequency range from 10−4 to 5000 Hz. Measurements were made over a wide temperature range, corresponding to the operating temperatures of the transformers. The measurements started from a temperature of 293.15 K. After reaching this temperature, the measuring system was supplied with DC voltage, and the value of the current intensity was registered every second during 7200 s. During the measurements, after a certain time, the current intensity reached a steady state. Its value was calculated as the average of the last 50 s. After disconnecting the power supply, the electrodes were short-circuited in order to discharge the capacitor. The discharge time was 7200 s. Next, AC measurements were carried out starting from a frequency of 5000 Hz up to a frequency of 0.0001 Hz.
The electrical properties of insulating materials are described by two basic parameters, conductivity and permittivity, entering Maxwell’s second equation [52]:
Δ × H = j R + j C = σ ( ω ) E 0 sin ( ω t ) + ω ε ( ω ) ε 0 E 0 sin ( ω t π 2 ) ,
where H —the magnetic field strength vector on a closed circuit surrounding the material with current; j R —the conduction current density; j C —the displacement current density; σ(ω)—the conductivity; ω = 2πf—the circular frequency; f—the frequency; t—the time; ε’(ω)—the dielectric permittivity of the material; ε0—the dielectric permittivity of the vacuum.
The ability of an insulating material to conduct electricity is described by conductivity. The dielectric permittivity, on the other hand, characterises the polarisation of the insulating material, and its changes with frequency are related to dielectric relaxation.
The DIRANA meter used in this work [53,54] in the parallel equivalent scheme determines the following parameters: f—the measurement frequency; CP′—the real and CP″—the imaginary components of the complex capacitance; RP—the resistance; Z—the impedance; tgδ—the tangent of the loss angle; PF = cosφ—the power factor. Using the values of RP, CP′ and the geometrical dimensions—the surface area of the measuring electrode, S, and the thickness of the blanket, d, from the known formulas [55]—the values of the conductivity and the real component of the permittivity are calculated:
σ = d R p S ,
where σ—conductivity; d—thickness; S—surface area of the measuring electrode; Rp—resistance.
ε = C P d ε 0 S ,
where ε′—permittivity; Cp—capacitance; d—thickness; ε0—vacuum dielectric permittivity; S—the surface area of the measuring electrode.
Other electrical parameters of the insulating materials, determined by FDS meters including the Dirana meter, were derived from conductivity, permittivity, frequency and vacuum dielectric permittivity, ε0.

3. Measurements of DC Conductivity and Dielectric Permittivity of Moistened Electrical Pressboard Impregnated with Mineral Oil or Synthetic Ester and Their Comparative Analysis with Electrical Properties of Water

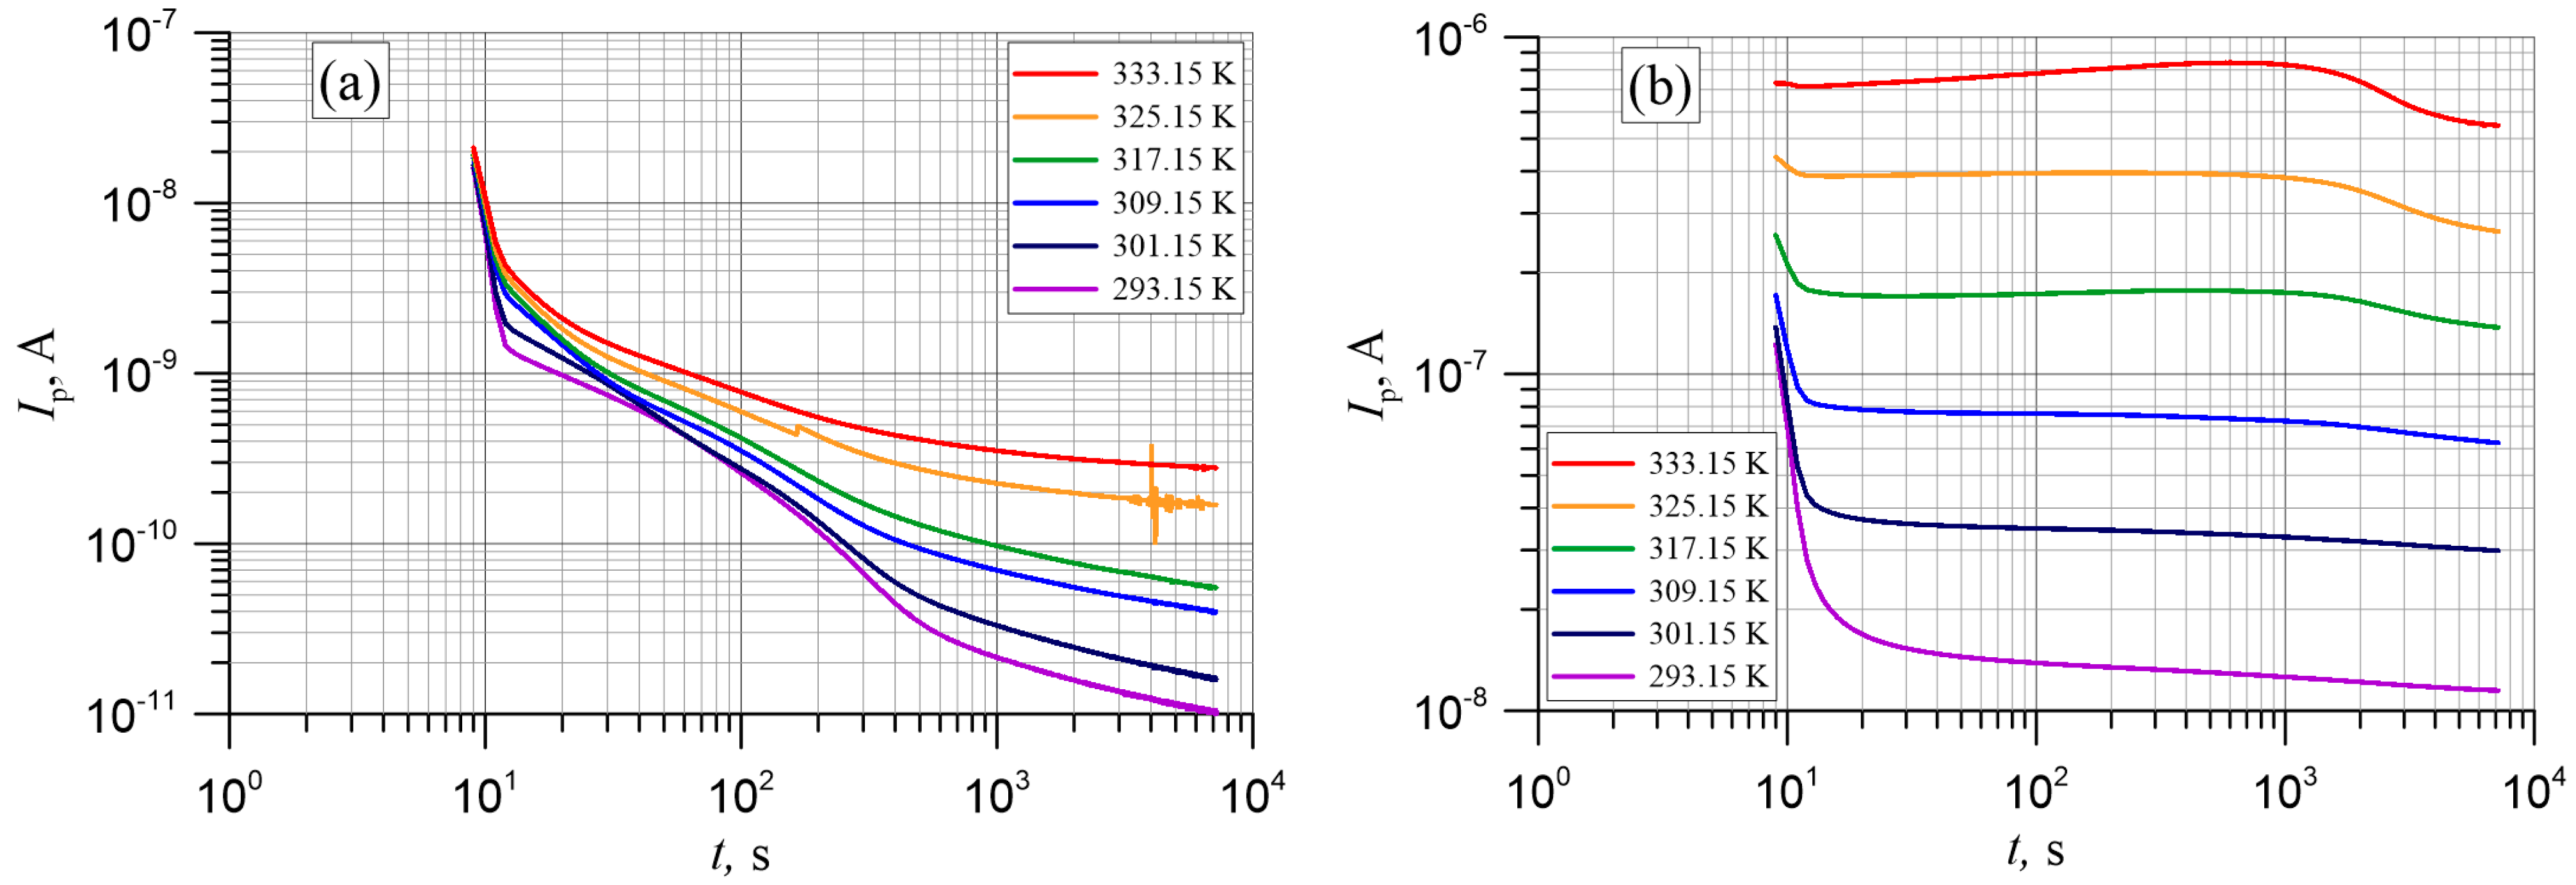
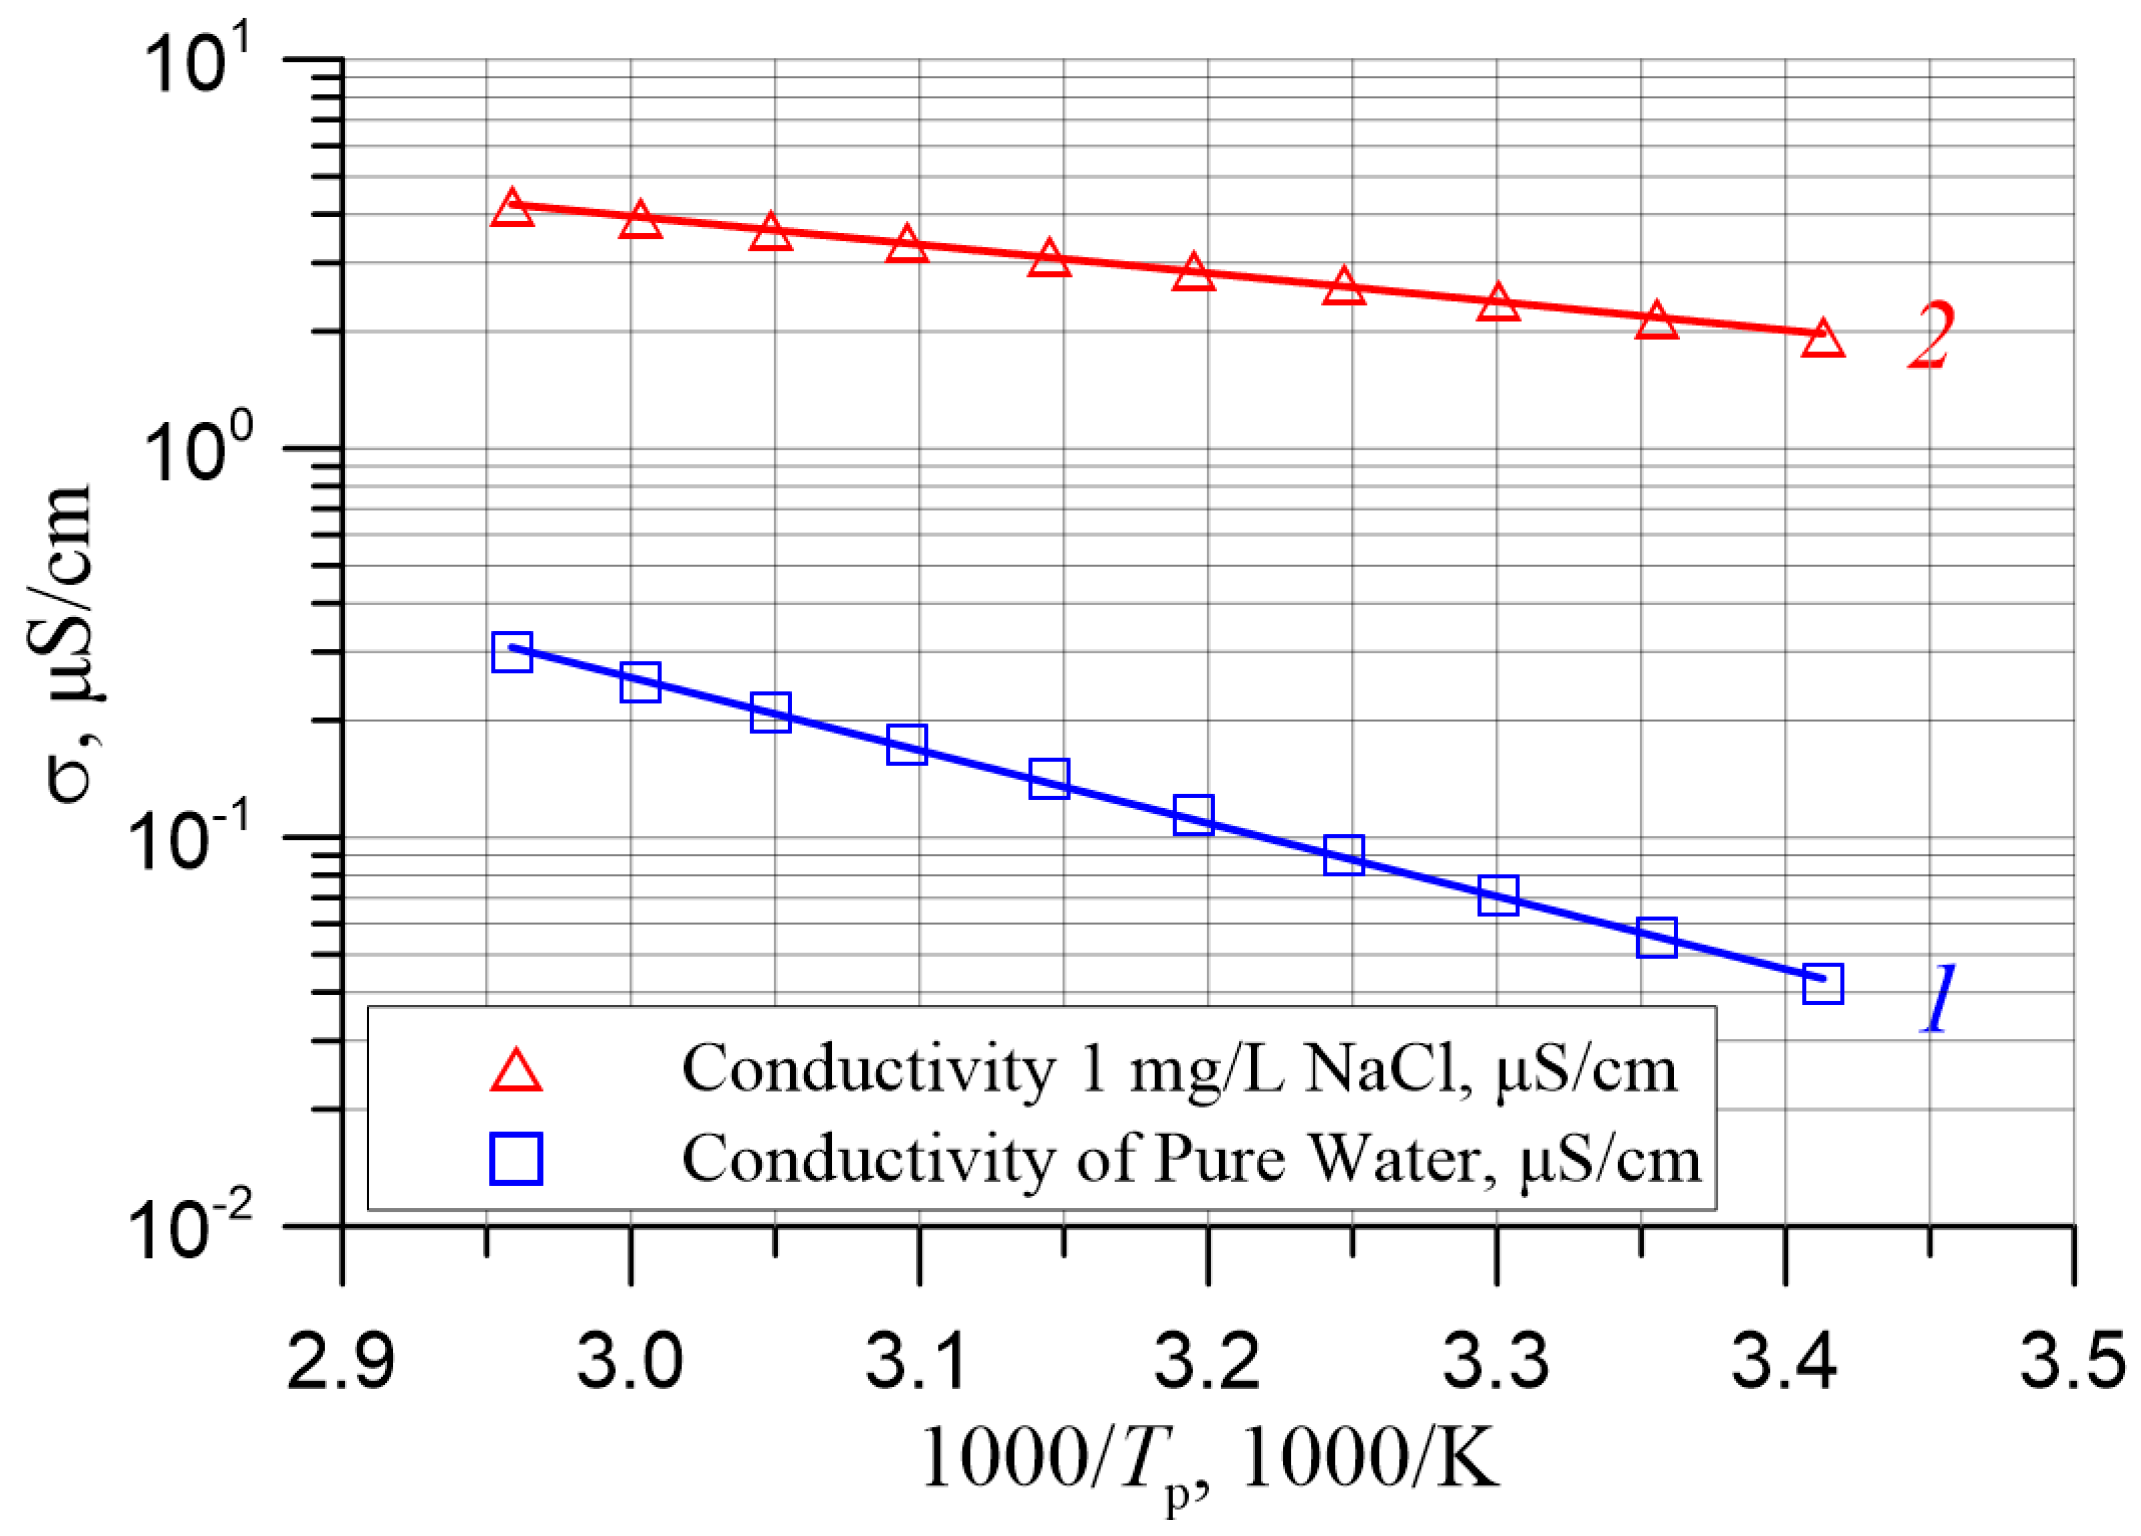
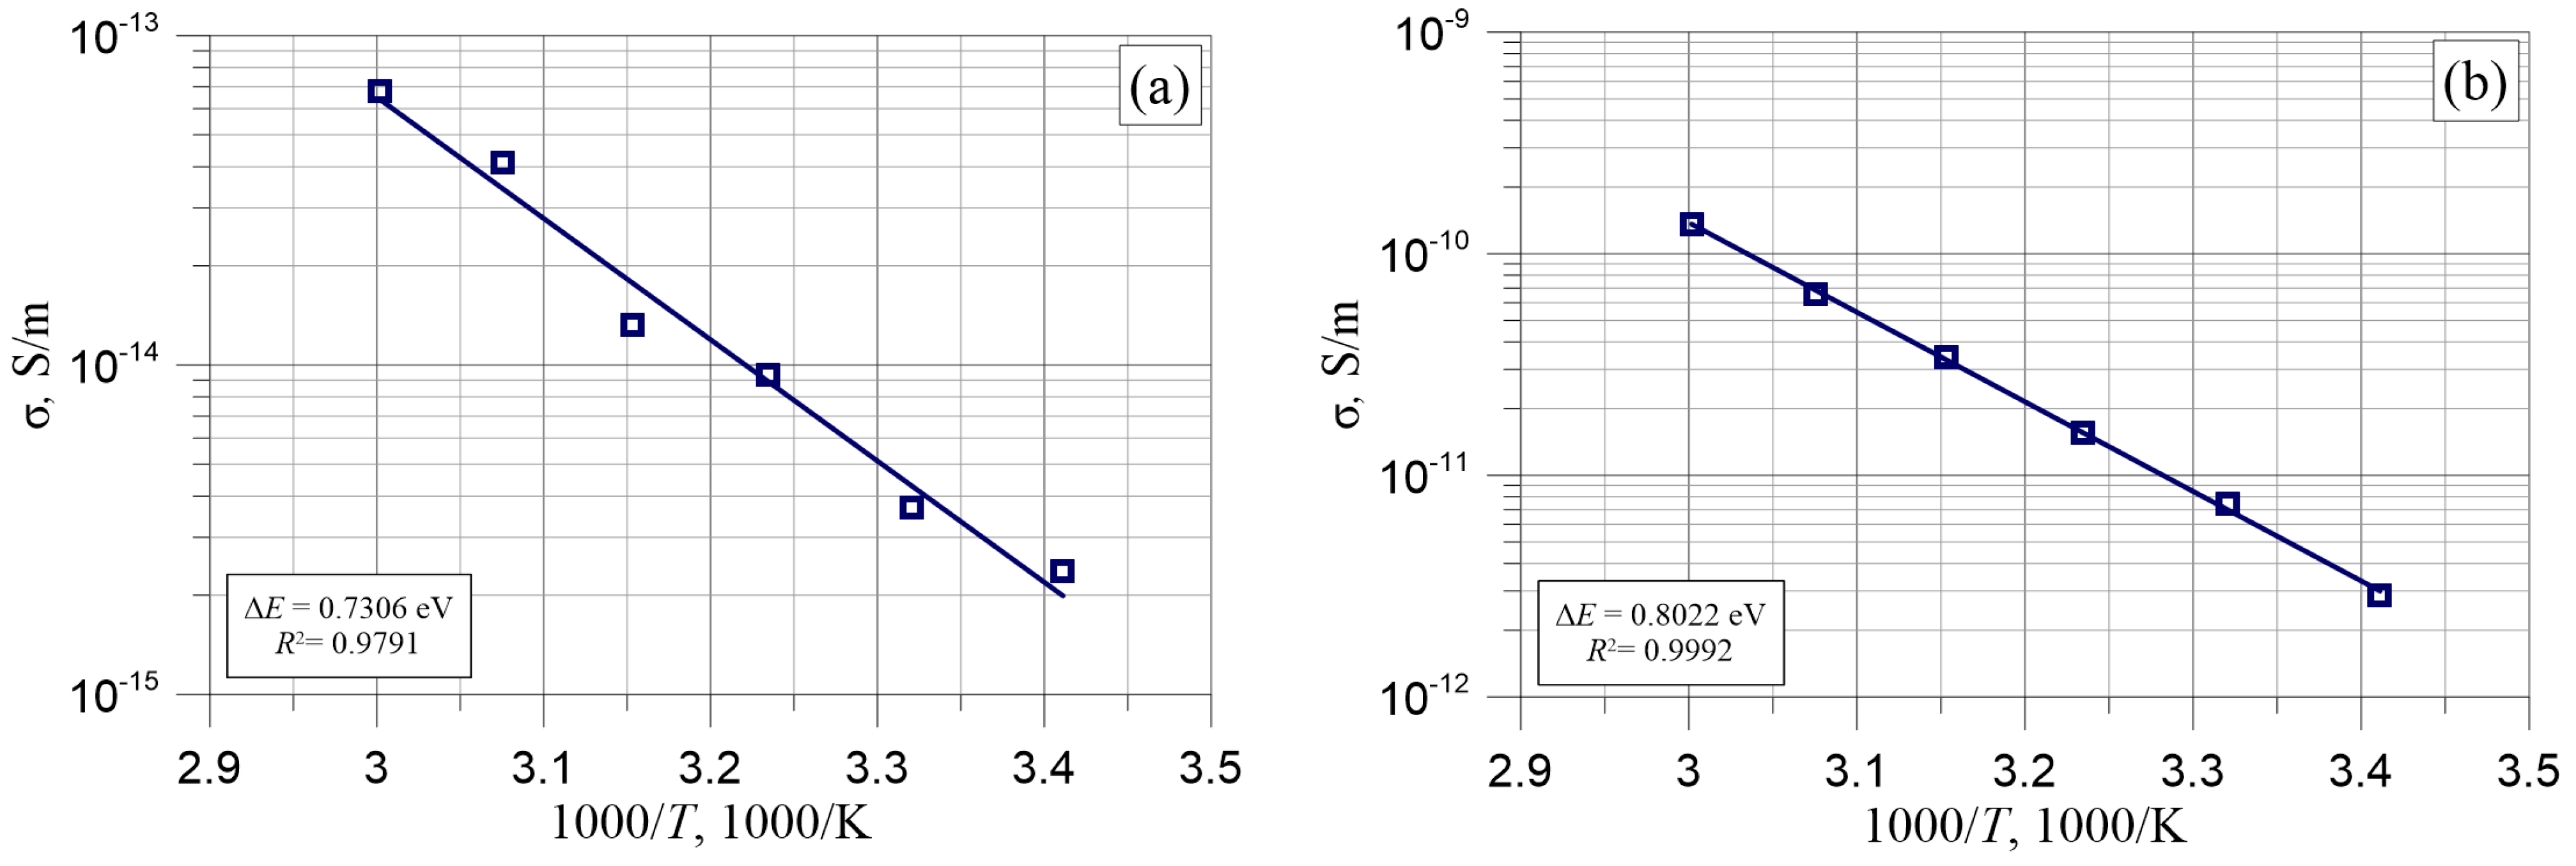
3.1. Analysis of the Effect of Water on the DC Conductivity of a Composite of Electrical Pressboard—Mineral Oil—Moisture

Tests were carried out on two samples of pressboard impregnated with mineral oil. The moisture contents were 0.6% by weight and 5% by weight. The sample with a content of 0.6 wt. % can be considered practically dry impregnated with mineral oil. The content of 5 wt. % is a critical value; the exceeding of which threatens catastrophic failure of the transformer [8,9,56,57]. Figure 1 shows the time dependence of the DC current for samples with moisture contents of 0.6 and 5 wt. %
It can be seen from the Figure 1 that in the initial period, there were high currents associated with the charging of the measurement capacitor. As the current flow time increased, the capacitor was increasingly charged and the current intensity decreased. For large values of time, when the capacitor was charged to a voltage equal to the supply voltage, the value of the current intensity stabilised. On the basis of the determined value of the current i, the value of the supply voltage U and the surface area of the measuring electrode S and the thickness of the blanket d, the conductivity values were calculated using the known formula:
σ = i d U S ,
where σ—DC conductivity of the composite; i—steady-state value of the current; U—the voltage forcing the current flow; d—the thickness of the pressboard; S—the area of the measuring electrode.
It can be seen from Figure 1 and Figure 2 that for a temperature of 20 °C, there was a change in the moisture content from 0.6 to 5 wt. % (i.e., by 8.33 times), which resulted in an increase in the conductivity by approximately 1200 times. Similar changes occurred for the other measuring temperatures. Undoubtedly, it follows that the increase in the conductivity of the three-phase composite was determined by the presence of water and was much faster than linear. An increase in temperature results in an increase in the steady-state current intensity and conductivity.
Figure 2 shows Arrhenius plots of the 1000/T inverse temperature dependence of conductivity for samples impregnated with mineral oil and with moisture contents of 0.6 and 5.0 wt. %.
The thermal activation energy of the DC conductivity ΔE was calculated from the Arrhenius diagrams. For a moisture content of 0.6 wt. %, it was ΔE ≈ 0.731 eV, and for a content of 5 wt. %, it was ΔE ≈ 0.8022 eV. The average value was ΔE ≈ 0.766 ± 0.035 eV.
Water quality control is based on DC conductivity measurements [58,59]. The results of water conductivity tests are presented in many articles (see, for example, [58,59,60]) and in standards (see, for example, [61]). In the following, an analysis of the possibility of the occurrence in three-phase composites of water with high contents of mineral salt ions and its influence on the properties of the composites is presented on the basis of the results of water conductivity tests known from the literature. Figure 3 shows a cross-section of a three-phase composite containing 5 wt. % water in the form of clusters with macroscopic volumes. Obviously, in a real composite the water inclusions can take other shapes.
Figure 3 shows that the current lines passing perpendicularly from one electrode to the other cross the series-connected sections of dry pressboard and water inclusions. This means that the water inclusions can be compacted into a layer parallel to the electrode. Its thickness should be approximately 5% of the thickness of the pressboard, given that the mass densities of pressboard and water were similar. The equivalent circuit diagram is a series connection of two resistances—the resistance of the dry blanket impregnated with insulating oil, RPR, and the resistance of the water layer, RW:
R = R P R + R W ,
where R—the equivalent resistance of the moistened impregnated pressboard; RPR—the resistance of the dry pressboard impregnated with insulating oil; RW—the resistance of the water layer.
From Equation (5) it follows that even if the conductivity of water were equal to infinity (zero resistivity), the equivalent conductivity of the system would increase by approximately 5%. Experiments (Figure 2) show that the conductivity of the tested pressboard with a water content of 5 wt. % was approximately 1200 times higher than the conductivity of the almost dry composite with a water content of 0.6 wt. %. In order to explain such a large difference in conductivity, it should be assumed that there were water-filled channels in the pressboard impregnated with insulating oil that connected the electrodes.
The electrical schematic of such a system is a series-parallel scheme and consists of a series of connected resistances of dry impregnated pressboard and a water layer. The resistance of the water-filled channels is connected in parallel.
In a sheet of pressboard, there may be many parallel channels connecting the electrodes at various points. Their resultant conductance is:
G K = i G K i = i σ W S K i d = σ W d i S K i = σ W S K d ,
where GK—the conductivity of water in the form of channels; GKi—the conductivity of i—channels; SKi—the cross-sectional area of i—channels; σW—the conductivity of water; SK—the summed cross-sectional area of all channels; d—the thickness of the pressboard.
We calculated the conductance of the series branch, taking into account that the cross-sectional area S will decrease by the sum of the cross-sectional areas of the channels SK:
G S = ( S S k ) σ P R σ W d ( 0.95 σ W + 0.05 σ P R ) ,
where σPR—the conductivity of the dry oil-impregnated pressboard.
The total conductance of the system is the sum of the conductances GS and GK, given by Equations (6) and (7):
G = σ a w S d = G S + G K = ( S S K ) σ P R σ W d ( 0.95 σ W + 0.05 σ P R ) + σ W S K d ,
where σaw—is the equivalent conductivity of the system, determined from measurements.
From Equation (8), we can determine the equivalent conductivity σaw:
σ a w = ( S S K ) σ P R σ W S ( 0.95 σ W + 0.05 σ P R ) + σ W S K S .
Dividing the numerator and denominator of the first component by σW and opening the brackets in the numerator, we obtain:
σ a w = σ P R ( 0.95 + 0.05 σ P R σ W ) S K σ P R S ( 0.95 + 0.05 σ P R σ W ) + σ W S K S .
The sum of the first and second components should be less than 1.05 σPR. It follows from Equation (10) that the conductivity σaw, is determined by the water conductivity σW, and the ratio of the cross-sectional areas of the channels SK to the area of the measuring electrode S:
S K S = V K V σ a w σ W ,
where VK—the volume of water in the channels connecting the electrodes; V—the volume of the pressboard.
For calculations according to Equation (11), the values of the conductivity of the ternary pressboard with a water content of 5 wt. % should be used, which is σaw ≈ 2.8 × 10⁻¹² S/m and water. In [35], it does not specify what the conductivity of water with a high content of mineral salt ions should be. We chose possible conductivity values based on the analysis of data from the standard [61], which gives values for ultrapure water and for different mineral salt contents. Ultrapure water has the lowest possible conductivity. This is due to the absence of foreign ions in it. The conductivity of ultrapure water takes place through the transfer of self-ions in the electric field, which are formed by auto dissociation under the influence of temperature [62]. For a temperature of 20 °C, the conductivities were: ultrapure water 4.10 × 10⁻⁶ S/m; ultrapure water with dissolved 1 mg/L NaCl 1.913 × 10⁻⁴ S/m; ultrapure water with dissolved 0.74 g/L KCl 1.3 × 10⁻¹ S/m [61]. As can be seen, relatively small contents of inorganic salt ions sharply increased the conductivity of the ultrapure water. Applying the above conductivity values to Equation (18), we calculated that the volumes of water in the channels connecting the electrodes were: for ultrapure water approximately 6.8 × 10⁻⁵ wt. %; for ultrapure water +1 mg/L NaCl approximately 1.46 × 10⁻⁶ wt. %; for ultrapure water +0.74 g/L KCl approximately 2.15 × 10⁻⁹ wt. %. Comparison of the obtained results with the actual water content showed that a very small amount of water, present in the form of channels connecting the measuring and voltage electrodes, was sufficient to obtain the experimentally determined conductivity value. The remaining water with a content of almost 5 wt. % remained in the pressboard in the form of inclusions which did not come into contact with the electrodes.
Figure 4 shows Arrhenius plots based on the numerical data for the ultrapure water and for the ultrapure water with 1 mg/L NaCl dissolved, presented in tabular form in [61].
From the Arrhenius plots, shown in Figure 4, the activation energies of the conductivity were determined for the ultrapure water, the value of which was approximately 0.377 eV, and for the ultrapure water with 1 mg NaCl dissolved, for which the activation energy was approximately 0.147 eV. It can be seen from the figure that the addition of mineral cola to ultrapure water results in a lower activation energy of the DC conductivity. This is because NaCl, as well as other water-soluble inorganic salts, dissociates without requiring thermal activation. The activation energy in this case is equal to the activation energy of migration of Na+ and Cl ions. In the case of ultrapure water, an additional activation energy of self-dissociation is required.
A comparison of the activation energies for ultrapure water (approximately 0.377 eV) and ultrapure water with dissolved 1 mg/L NaCl (approximately 0.147 eV) with activation energies of DC conductivity of the three-phase composite ΔE ≈ 0.766 ± 0.035 eV (Figure 2), shows that these values were smaller by 2.03 and 5.2 times, respectively. Such large differences in activation energies of conductivity of the three-phase composite of pressboard—mineral oil—water with the values for ultrapure water and with ultrapure water + NaCl exclude the possibility of conduction through water, occurring in the form of channels connecting the electrodes.

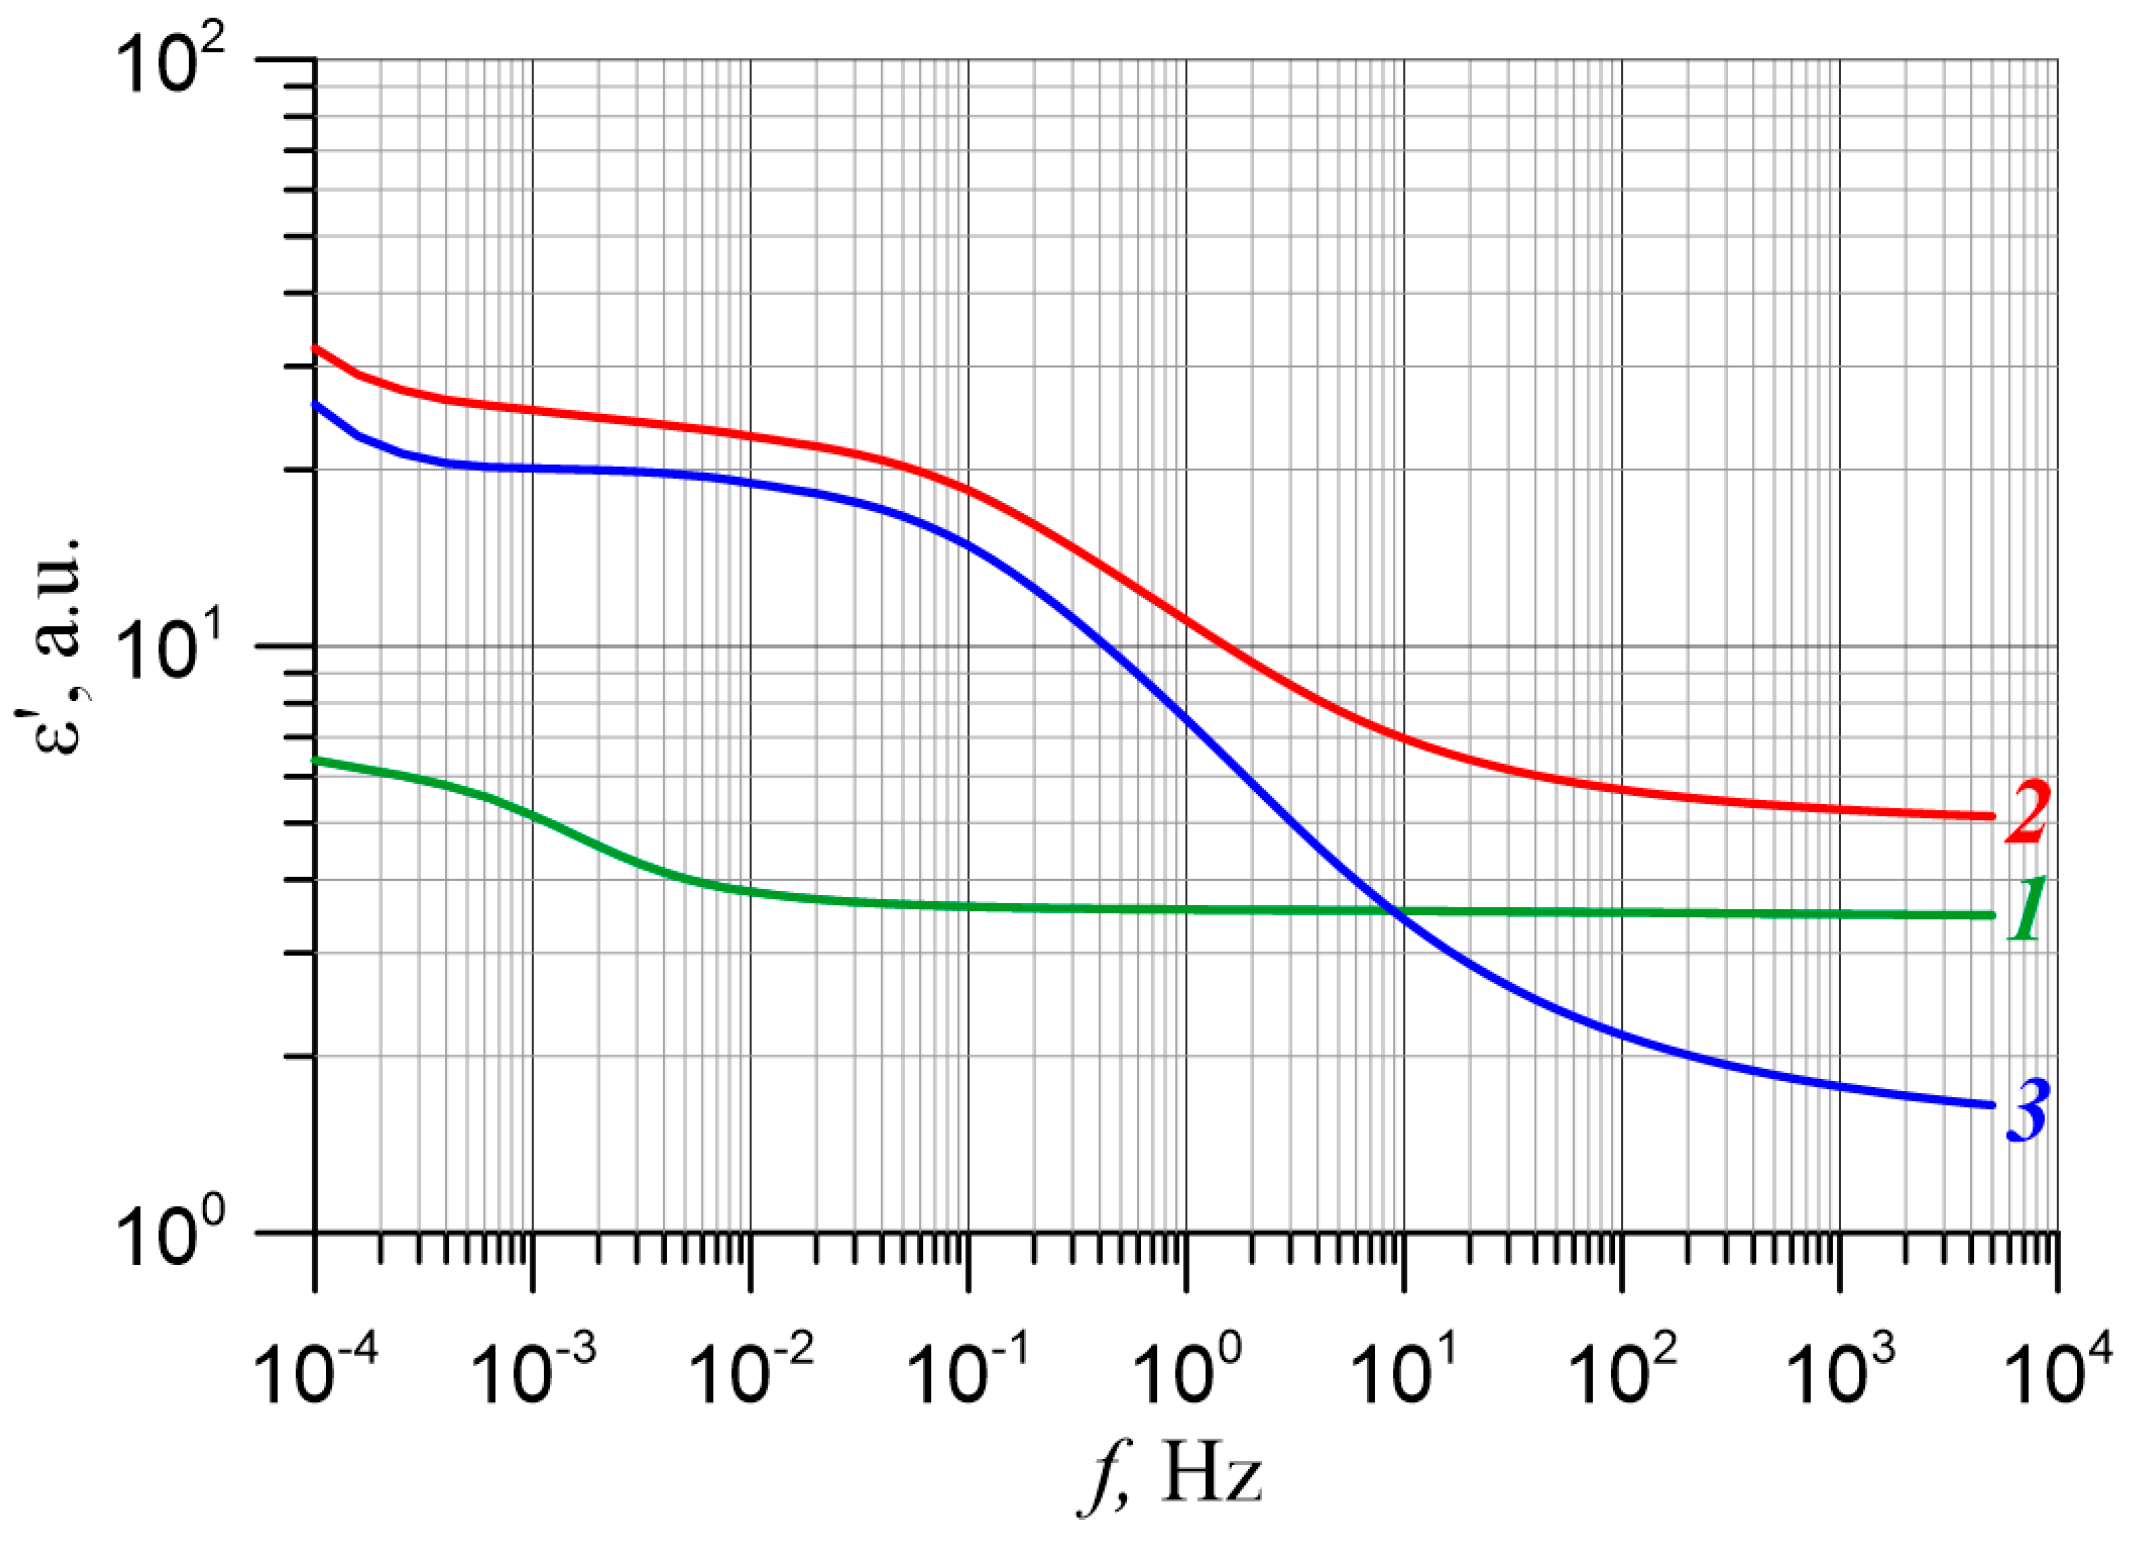
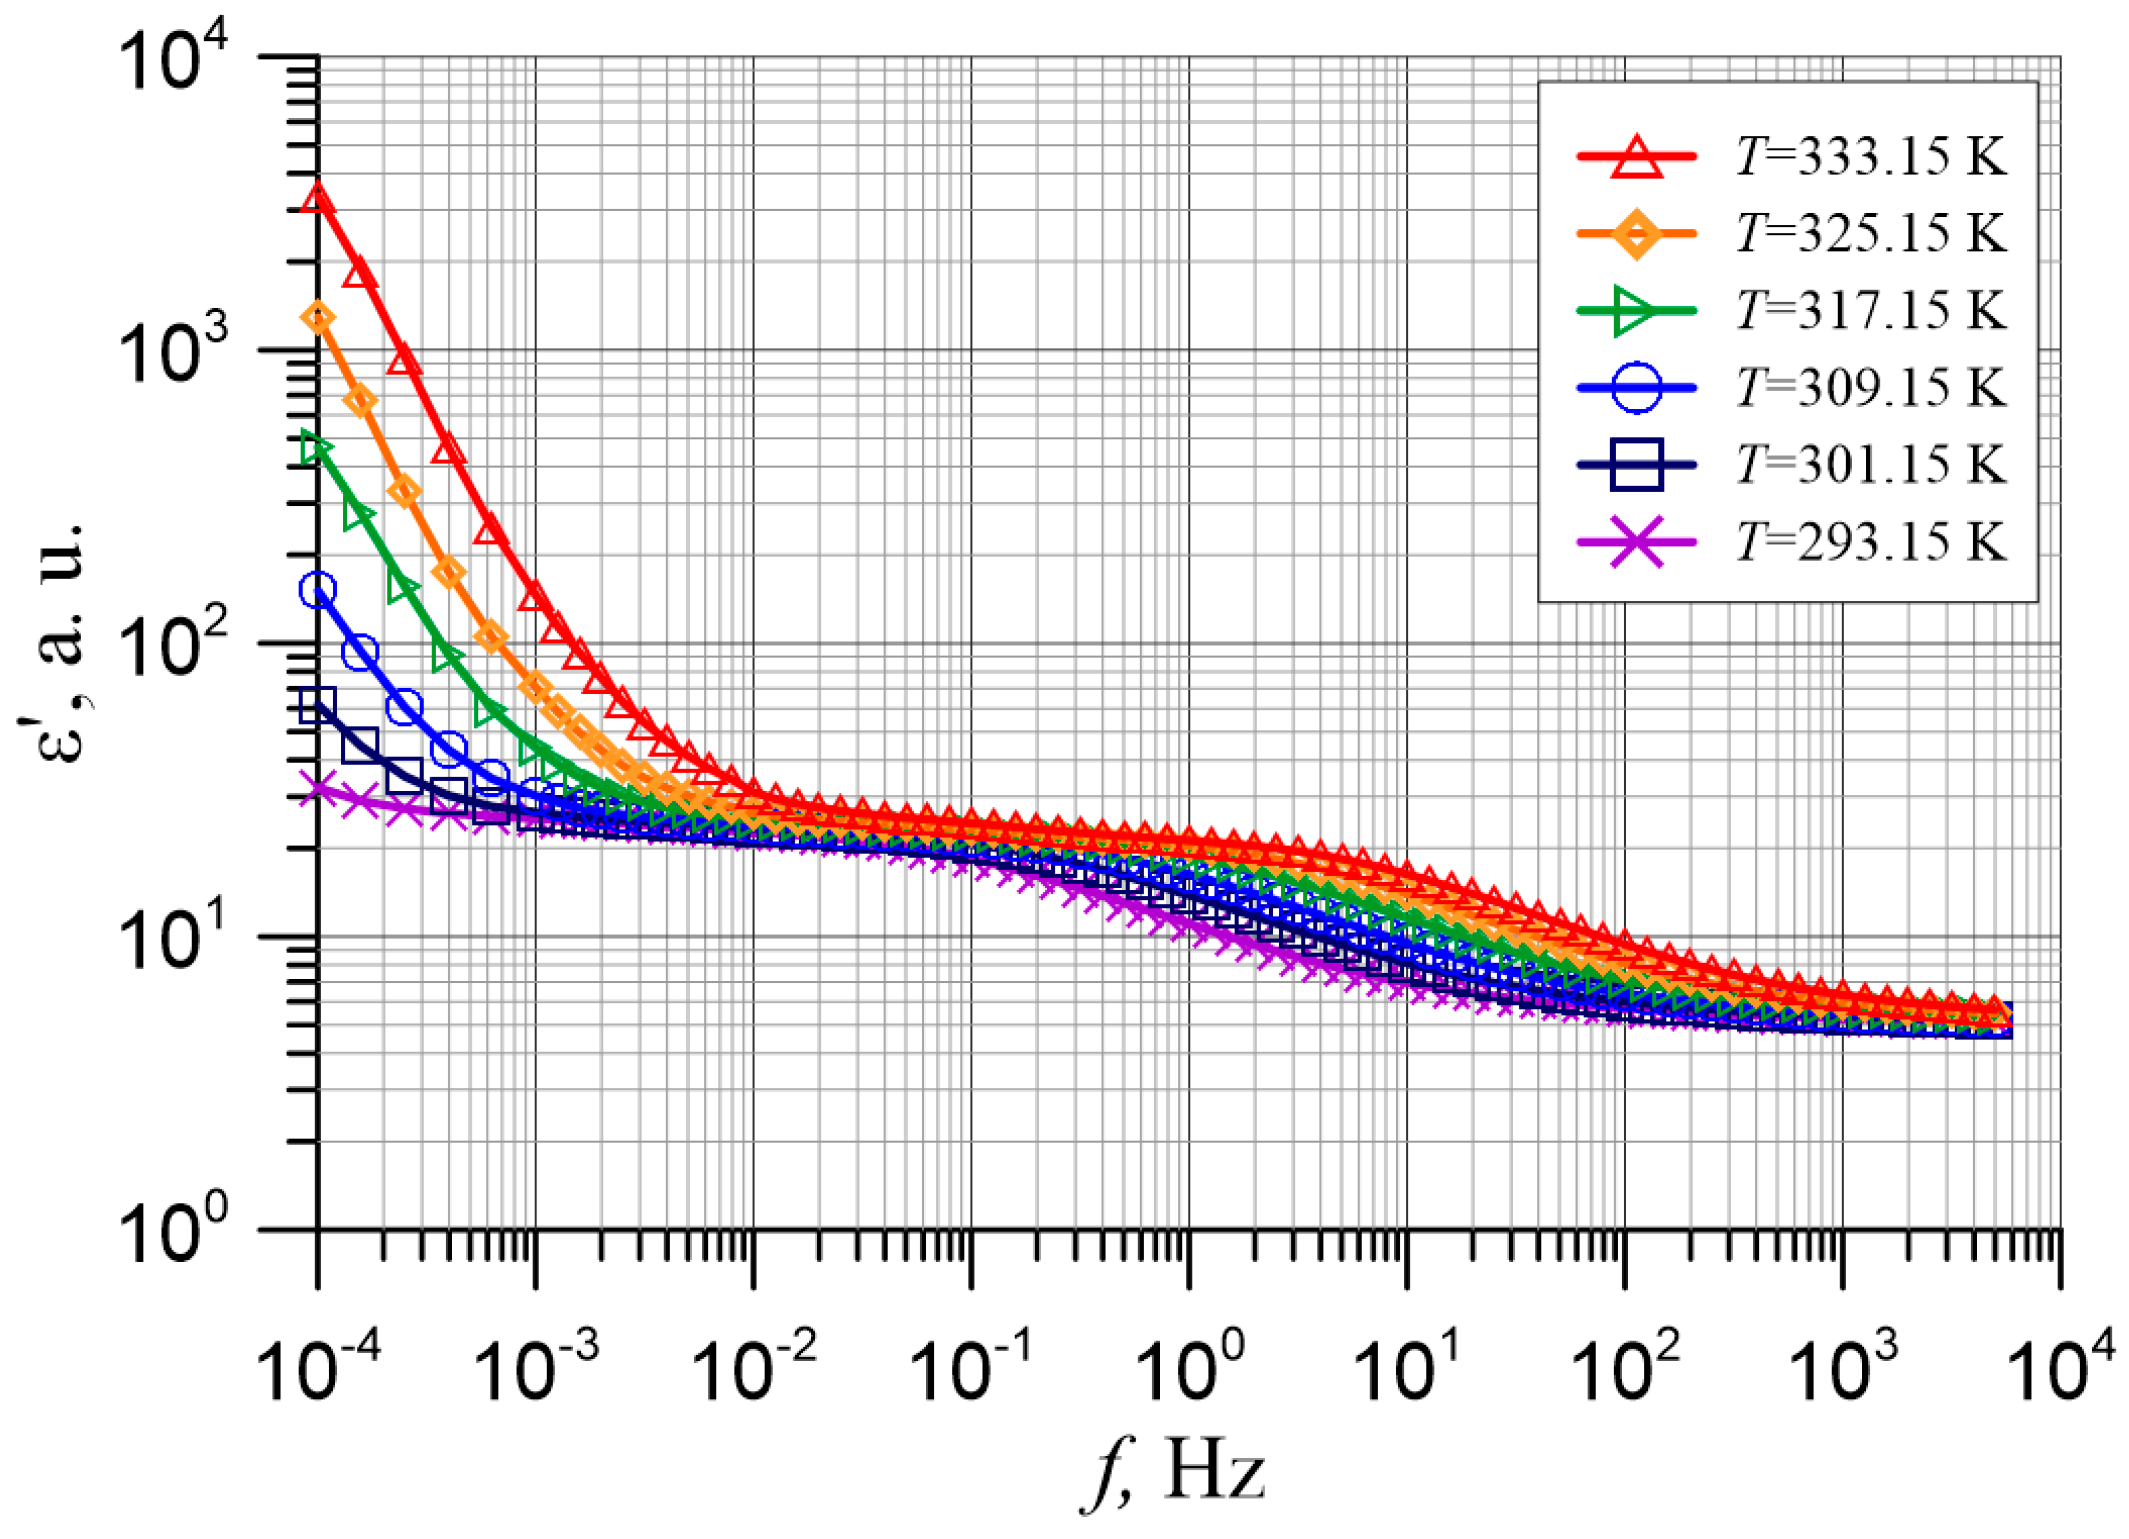
3.2. Dielectric Permittivity of Moistened Mineral Oil-Impregnated Pressboard

The frequency dependence of the permittivity of composites with water contents of 0.6 wt. % and 5 wt. % was investigated using the FDS method. The frequency curves obtained at 20 °C are shown in Figure 5.
The difference between these curves is also shown in this figure. Figure 5 shows that in the frequency range below 103 Hz the permittivity of the sample with a water content of 5 wt. % significantly exceeds that of the sample with a water content of 0.6 wt. %. The increase in permittivity in this frequency range is undoubtedly due to the presence of water.
In the frequency region of about 2 × 10⁻³ Hz, the static permittivity due to water with 5 wt. % is about 20—Equation (3).
In the case where the water is concentrated in the spray paper in the form of inclusions of macroscopic dimensions (Figure 3), the capacitance system is a series and the resultant capacitance is determined by the formula:
1 C = 1 C P R + 1 C W .
The capacitance of the series circuit is the smaller of the capacitances. The smaller of the series system in Figure 3 is the capacitance of the dry impregnated pressboard. Its thickness is greater than the thickness of the water layer and its permittivity is less. This means that such an arrangement cannot produce the experimentally observed increase in permittivity with increasing water content in the composite.
There is also a second possibility, namely, the presence of water-filled channels, connecting the electrodes. In this case, the capacitances of the blanket and the channels are connected in parallel and their values added together:
C a w = C P R + C W ,
where Caw—the capacity of moistened impregnated pressboard; CPR—the capacity of dry impregnated pressboard; CW—the capacity of water-filled channels.
The capacitance values entering Equation (13) are determined by the formulas:
C P R = ε P R ε 0 ( S S K ) d = ε P R ε 0 S d ε P R ε 0 S K d ,
C W = ε W ε 0 S K d ,
where S—the surface area of the measuring electrode; SK—the cross-sectional area of the water-filled channels connecting the electrodes; εPR—the permittivity of the dry mineral oil-impregnated pressboard; εW—the permittivity of water; εaw—the equivalent permittivity of the test sample.
By substituting Equations (14) and (15) into Equation (13) we obtain:
C = ε a w ε 0 S d = ε P R ε 0 S d ε P R ε 0 S K d + ε W ε 0 S K d ,
where εaw—the equivalent permittivity of the composite.
From Equation (16), we can calculate the equivalent permittivity of the moistened impregnated pressboard:
ε a w = ε P R ε P R S K S + ε W S K S .
The cross-sectional area of the channels SK < S. The permittivity of the dry impregnated pressboard at a frequency of approximately 2 × 10⁻³ Hz is εPR ≈ 3, and the permittivity of the pressboard with a moisture content of 5 wt. % εaw ≈ 25 (Figure 5). Using Equation (17), the ratio of the cross-sectional area of the channels SK to the cross-sectional area of the measuring electrode S can be calculated. Practically the same ratio was found for the volume of water in the channels to the volume of the composite:
S K S = V W V = ( ε a w ε P R ) ( ε W ε P R ) .
The permittivity of water at 20 °C is approximately 80 [62]. By substituting the permeabilities εPR, εaw and εW into the formula, we can calculate the value or S K S = V W V 0.266 or 26.6 wt. %. This means that the experimental value of the permittivity can be obtained when the water content in the channels, connecting the electrodes, is higher than the real one (5 wt. %) by about 5.3 times. This excludes the possibility of water in the channels connecting the electrodes.
Another of the basic composite parameters is the dielectric relaxation time. The permittivity relaxation time is determined by the frequency at which the permittivity value halves [63,64,65]:
τ = 1 2 π f 1 / 2 .
where f1/2—the frequency at which the value of the permittivity is half of the static value.
Figure 5 shows that at 20 °C, the frequency f1/2 ≈ 0.4 Hz. From Equation (19), we calculated the dielectric relaxation time for 20 °C, the value of which was approximately 0.4 s. Figure 6 shows the frequency dependence of the permittivity for a sample with a water content of 5 wt. %, measured at temperatures from 20 to 60 °C. It can be seen from the figure that increasing the temperature up to 60 °C decreased the relaxation time to approximately 8 × 10⁻³ Hz. According to studies presented in [66], up to a frequency of approximately 1010 Hz, the static permittivity of water remains constant and then begins to decrease. The relaxation time for liquid water is 9.55 × 10⁻¹² s at 20 °C [62]. This means that the values of the relaxation times of the permittivity due to the presence of water in the three-phase composite were about 9–10 orders of magnitude greater than the values of the relaxation time of liquid water, depending on the temperature. This fact also excludes the possibility of the presence of water in the composite in macroscopic form.

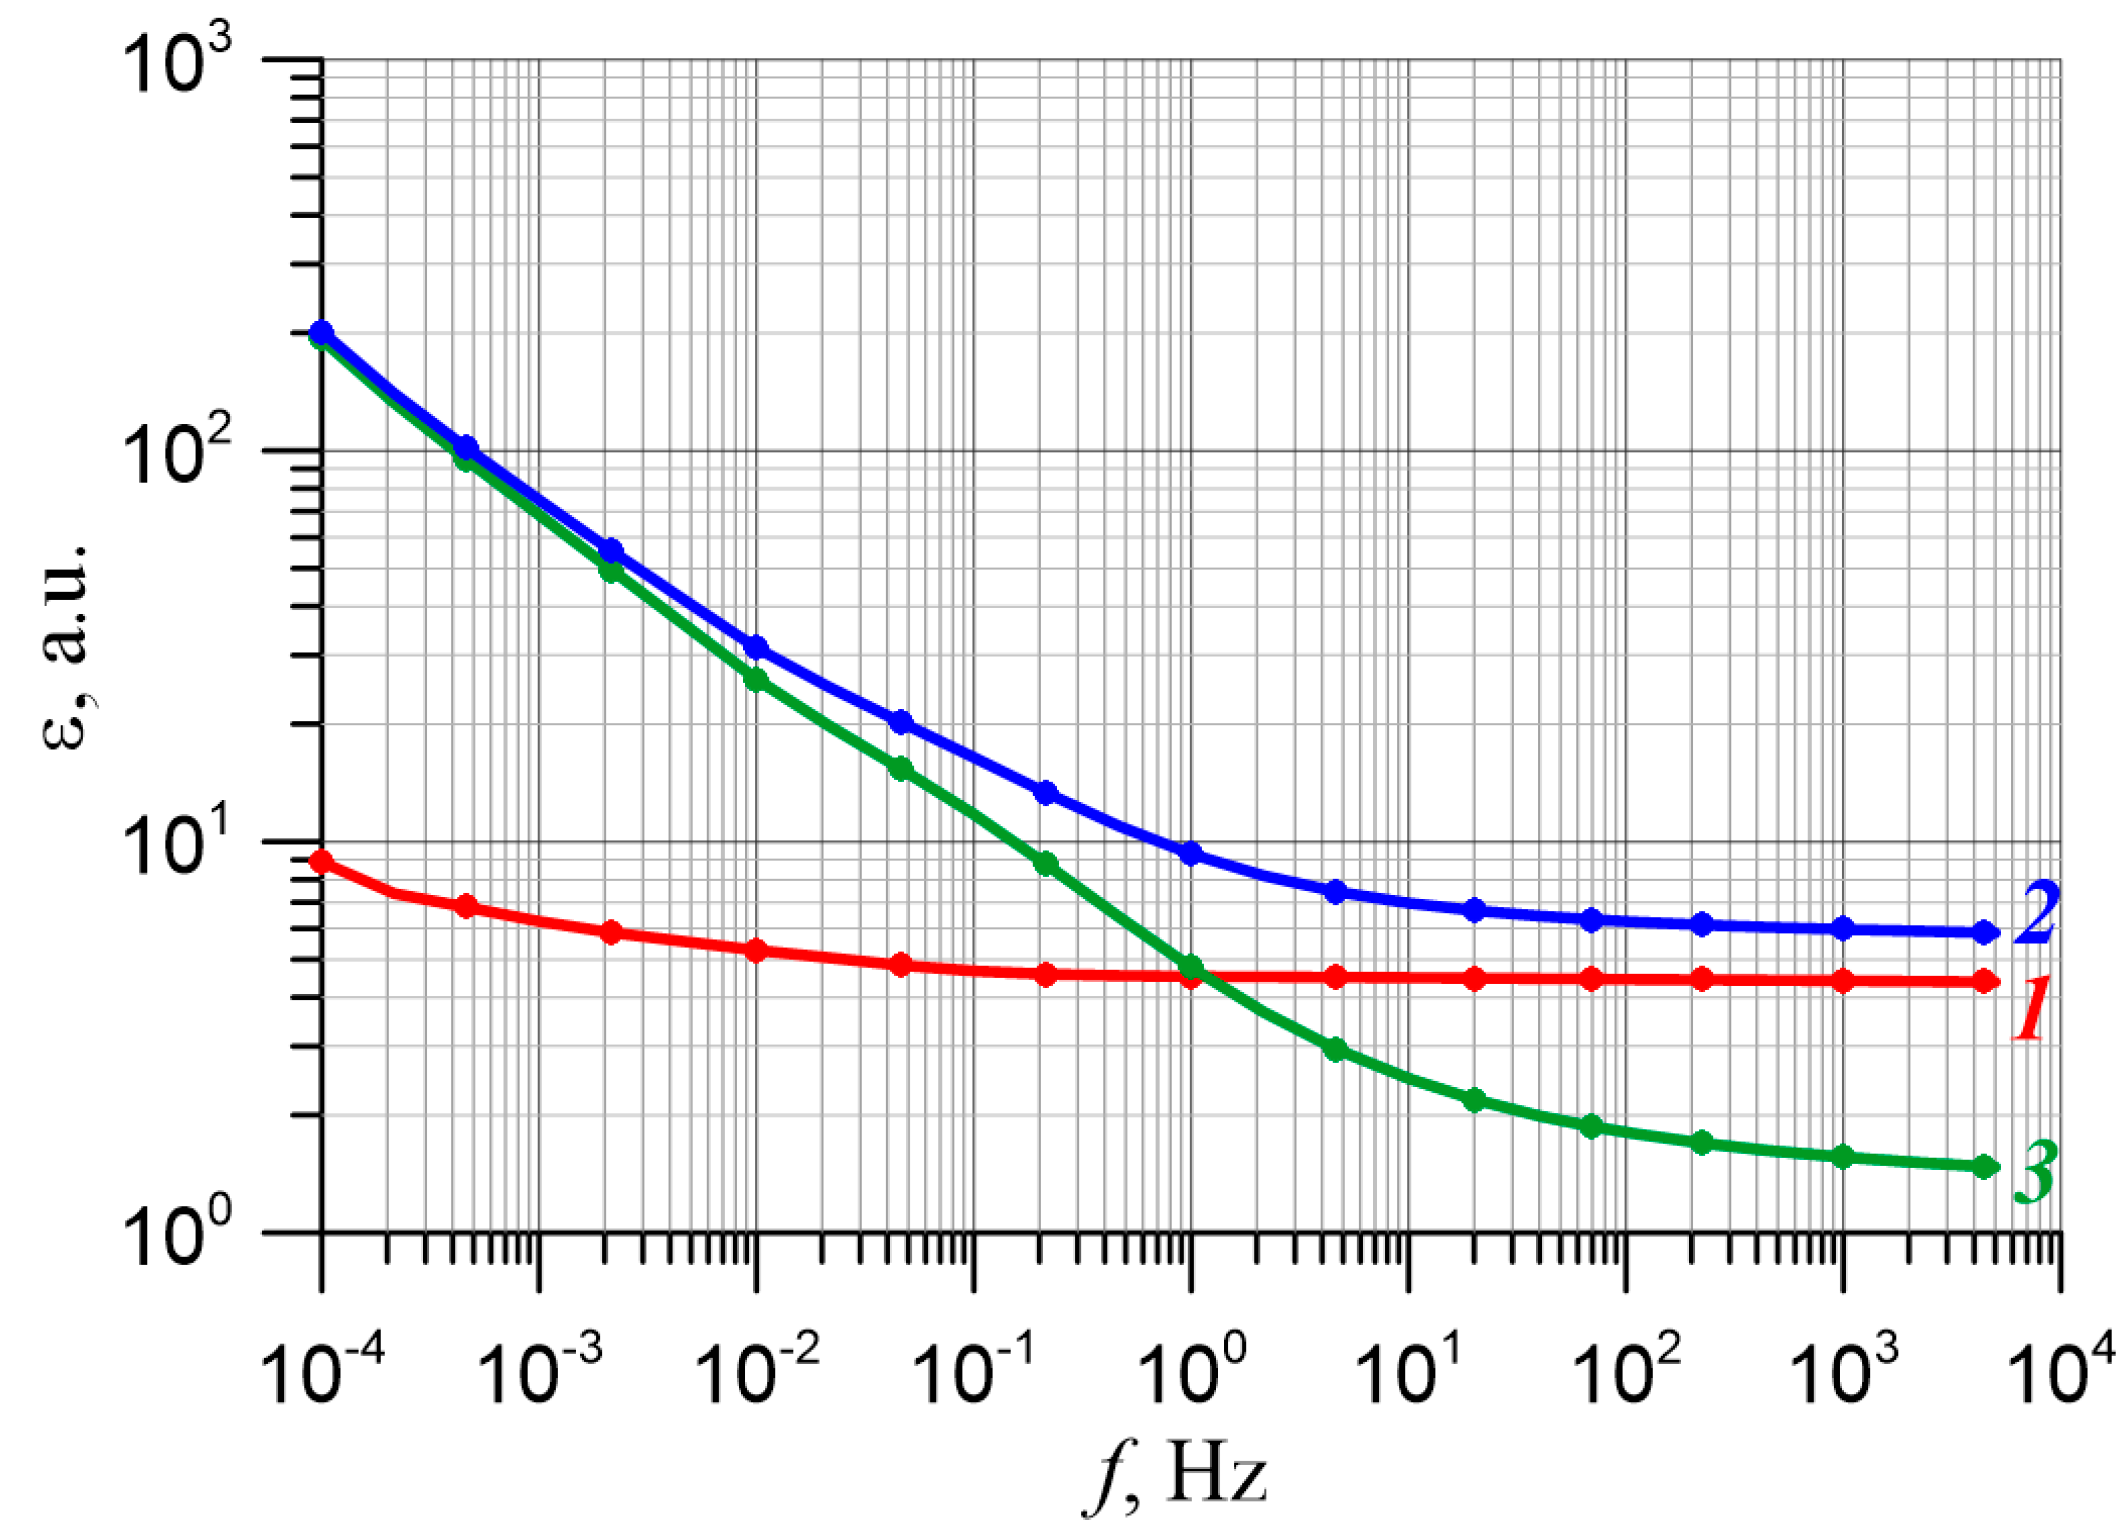
3.3. Analysis of the Effect of Water on the Electrical Properties of a Composite of Electrical Pressboard—Synthetic Ester—Moisture

In [67], the temperature dependence of the DC conductivity of a moistened composite of electrical pressboard impregnated with the synthetic ester Midel 7131 was investigated. The tests were carried out for samples with a moisture content of 0.6 wt. % (practically dry sample) and with a moisture content of 6 wt. % (practically dry sample) and with a water content of 4.8 wt. %. For the dry sample, the DC conductivity at 20 °C was approximately 4.5 × 10⁻¹² S/m, whereas for the sample with a water content of 4.8 wt. % the conductivity value was approximately 7 × 10⁻¹⁰ S/m. This means that a change in moisture content from 0.6 to 4.8 wt. % (i.e., by eight times) caused a change in the conductivity of the sample (i.e., by 8 times), resulting in an increase in the conductivity by 155 times. This is undoubtedly due to the presence of water in the composite. Based on Equation (18), the conductivity values in the composite of pressboard—synthetic ester for water content of 4.8 wt. % and conductivity values for ultrapure water, ultrapure water +1 mg/L NaCl and ultrapure water +0.74 g/L KCl, given in Section 3.1, the water content in the channels connecting the electrodes was calculated. Their values were as follows: for ultrapure water approximately 1.7 × 10⁻³ wt. %, for ultrapure water +1 mg/L NaCl approximately 5.9 × 10⁻⁴ wt. % and for ultrapure water +0.74 g/L KCl about 5.4 × 10⁻⁸ wt. %. This means that, as in the case of moisture-impregnated mineral oil-impregnated pressboard, in the synthetic ester-impregnated pressboard only a very small proportion of the water should be present in the channels connecting the electrodes in order to lower the conductivity to the experimental value.
In [67], the activation energy of the DC conductivity of synthetic ester-impregnated pressboard containing 4.8 wt. % water was determined from the Arrhenius diagram. Its value was ΔE ≈ 0.840 eV, and it was slightly higher than the value of 0.766 eV determined in Section 3.3 for the mineral oil-impregnated pressboard. This was probably due to the fact that the permittivity of ester is higher than that of mineral oil and is approximately 3.2 [68]. However, also in the case of impregnation with synthetic ester the activation energy was approximately 2.2 times higher than for ultrapure water and approximately 5.7 times higher than for ultrapure water with 1 mg/L NaCl dissolved. Such differences in activation energies exclude the possibility of liquid water occurring in the channels connecting the electrodes in the composite impregnated with synthetic ester.
Figure 7 shows the frequency dependence of the permittivity of a three-phase composite of electrical pressboard—synthetic ester—moisture, measured at 20 °C for a moisture content of 0.6 and 5 wt. %, and the difference between them.
It can be seen from Figure 7 that in the frequency region below 100 Hz, an increase in the moisture content of the synthetic ester-impregnated pressboard caused an increase in permittivity compared to the nearly dry pressboard. This means that the presence of water in the ester-impregnated pressboard induced additional permittivity. For a frequency of approximately 0.04 Hz, the value of the static permittivity caused by the presence of water was approximately 15. From Equation (18), the volume of water in liquid form, which will cause such an increase in permittivity, should be approximately 20% wt. %. This was about four times more than the actual water content in the composite, which was 5 wt. %. This means that for a synthetic ester-impregnated pressboard, as for one impregnated with mineral oil, the experimental permittivity values require a liquid water content several times greater than the actual content. The water-induced decrease in permittivity, evident from the permittivity difference for 5 and 0.6 wt. %, started at a frequency of approximately 0.04 Hz. Based on Equation (19), given that the frequency at which the permittivity value halved was about 0.4 Hz, the permittivity relaxation time due to the water was approximately 0.4 s. This was more than 10 orders of magnitude greater than the relaxation time of liquid water [62]. This also means that in the case of synthetic ester-impregnated pressboard containing moisture, the activation energy of the DC conductivity, the permittivity and the dielectric relaxation time exclude the possibility of the presence of liquid water in ternary composites with macroscopic volumes.
Studies have shown that the DC conductivity of composites impregnated with mineral oil and synthetic ester increases much faster than the water content. For mineral oil, an increase in water content from 0.6 to 5 wt. % (by approximately 8.33 times) caused an increase in conductivity (by approximately 8.33 times), resulting in an increase in conductivity by approximately 1200 times. For the synthetic ester impregnation case, an increase in water content from 0.6 to 4.8 wt. % (eight times) caused an increase in conductivity by 155 times. In [69], it was shown that the observation of an exponential dependence of conductivity on the content of a second phase in materials in the form of admixtures, impurities or inclusions was a sufficient condition for establishing the presence of step conductivity. Hopping conductivity is caused by the quantum phenomenon of electron tunnelling between potential wells of nanometre dimensions [70]. That is because the observed increase in conductivity is determined by the presence of water in the composites, and the nanometre-sized potential wells should contain water. There can be single-water molecules [30] or their nanometre-sized clusters—nanodrops [31,32]. The research has shown that conductivity and its activation energy, permittivity and dielectric relaxation times in water-containing composites consisting of mineral oil- or synthetic ester-impregnated pressboard were determined by the quantum phenomenon of electron tunnelling between potential wells consisting of single-water molecules or nanodrops of water. This means that the DC properties, polarisation and dielectric relaxation in three-phase composites of electrical pressboard—insulating liquid—moisture depend only on the moisture content and do not depend on the type of insulating liquid.

4. Conclusions

In this paper, measurements were carried out on the basic DC and AC electrical properties (i.e., conductivity and permittivity) of ternary composites of electrical pressboard—insulating liquids—water in a wide temperature range. Mineral oil and synthetic ester were used as insulating liquids to impregnate the pressboard.
A comparative analysis of the experimental results of the conductivity and permittivity of the composite of pressboard—insulating liquid—water with those determined on the basis of a model in which water with a high content of inorganic salt ions is responsible for the DC conductivity, showed the presence of certain contradictions.
It was found that the occurrence of conductivity, compatible with experimental results for the composite, requires the presence of water in the channels connecting the electrodes. Obtaining the conductivity, consistent with the experimental results for the composite with the water content of 5 wt. %, requires its presence in the channels, connecting the electrodes. The volume of water in the channels should not exceed 10−5 wt. %.
The experimentally determined values of water volume permittivity in the channels were approximately 5.3 and 4 times higher than the actual content of 5 wt. %, respectively. A small proportion of the water in the channels is needed for conductivity; there should be several times as much water as in reality for permittivity. This excludes the possibility of the simultaneous explanation of DC conductivity and permittivity by the presence of macroscopic volumes of water in the channels connecting the electrodes. Experimentally determined values of activation energies of DC conductivity of composites, several times higher than activation energies of water conductivity, contradict this model. In addition, the values of dielectric relaxation times for the composites, which were approximately 9–10 orders higher than the dielectric relaxation times for water, did not agree with the model. This means that the experimental results obtained for dielectric permittivity, activation energy of conductivity and dielectric relaxation times for moisture electrical pressboard impregnated by mineral oil or synthetic ester exclude the possibility of the presence of liquid water in the composites.
It was found that the DC conductivity of the composites increased much faster than the water content. With an increase in water content from 0.6 to approximately 5 wt. % for mineral oil, an increase in conductivity of approximately 1200 times was observed and for synthetic ester by approximately 155 times. These were exponential relationships that occur in the case of step conductivity caused by the quantum phenomenon of electron tunnelling between nanometre-sized potential wells. Since the increase in conductivity is determined by the presence of water in the composites, the nanometre-sized potential wells can be single-water molecules or nanodrops. Nonlinear conductivity variations should be taken into account when estimating moisture content by nondestructive electrical methods such as PDC or FDS.

Author Contributions

Conceptualization, P.Z. and T.N.K.; methodology, P.Z., P.R., T.N.K., K.K. and M.Z.; software, P.R. and K.K.; validation, T.N.K. and K.K.; formal analysis, P.Z., P.R., T.N.K., K.K., M.Z., A.D.P. and M.K.; investigation, P.R., K.K. and M.Z.; resources, T.N.K., K.K. and M.K.; data curation, P.R. and K.K.; writing—original draft preparation, P.Z.; writing—review and editing, T.N.K. and A.D.P.; visualization, P.R. and K.K.; supervision, T.N.K.; funding acquisition, P.Z., P.R., T.N.K. and K.K. All authors have read and agreed to the published version of the manuscript.

Funding

The research was supported by a subsidy from the Ministry of Education and Science (Poland) for the Lublin University of Technology as funds allocated for scientific activities in the scientific discipline of Automation, Electronics and Electrical Engineering—grants: FD-20/EE-2/702, FD-20/EE-2/703, FD-20/EE-2/707, FD-20/EE-2/709.

Conflicts of Interest

The authors declare no conflict of interest.

References

  1. Lundgaard, L.E.; Hansen, W.; Linhjell, D.; Painter, T.J. Aging of oil-impregnated paper in power transformers. IEEE Trans. Power Deliv. 2004, 19, 230–239. [Google Scholar] [CrossRef]
  2. Oommen, T.V.; Prevost, T.A. Cellulose insulation in oil-filled power transformers: Part II—Maintaining insulation integrity and life. IEEE Electr. Insul. Mag. 2006, 22, 5–14. [Google Scholar] [CrossRef]
  3. Fabre, J.; Pichon, A. Deteriorating processes and products of paper in oil application to transformers. In Proceedings of the International Conference on Large High Voltage Electric Systems (CIGRE), Paris, France, 15–25 June 1960; p. 137. [Google Scholar]
  4. Liu, J.; Zhang, H.; Geng, C.; Fan, X.; Zhang, Y. Aging assessment model of transformer insulation based on furfural indicator under different oil/pressboard ratios and oil change. IEEE Trans. Dielectr. Electr. Insul. 2021, 28, 1061–1069. [Google Scholar] [CrossRef]
  5. Jusner, P.; Schwaiger, E.; Potthast, A.; Rosenau, T. Thermal stability of cellulose insulation in electrical power transformers—A review. Carbohydr. Polym. 2021, 252, 117196. [Google Scholar] [CrossRef]
  6. Li, X.; Tang, C.; Wang, J.; Tiang, W.; Hu, D. Analysis and mechanism of adsorption of naphthenic mineral oil, water, formic acid, carbon dioxide, and methane on meta-aramid insulation paper. J. Mater. Sci. 2019, 54, 8556–8570. [Google Scholar] [CrossRef]
  7. Oommen, T.V. Moisture equilibrium in paper oil systems. In Proceedings of the 16th Electrical/Electronics Insulation Conference, Chicago, IL, USA, 3–6 October 1983; pp. 162–166. [Google Scholar]
  8. Hill, J.; Wang, Z.; Liu, Q.; Krause, C.; Wilson, G. Analysing the power transformer temperature limitation for avoidance of bubble formation. High Volt. 2019, 4, 210–216. [Google Scholar] [CrossRef]
  9. Garcia, B.; Villarroel, R.; Garcia, D. A Multiphysical model to study moisture dynamics in transformers. IEEE Trans. Power Deliv. 2019, 34, 1365–1373. [Google Scholar] [CrossRef]
  10. Martínez, M.; Pleite, J. Improvement of RVM test interpretation using a Debye equivalent circuit. Energies 2020, 13, 323. [Google Scholar] [CrossRef] [Green Version]
  11. Islam, M.M.; Lee, G.; Hettiwatte, S.N. A review of condition monitoring techniques and diagnostic tests for lifetime estimation of power transformers. Electr. Eng. 2018, 100, 581–605. [Google Scholar] [CrossRef]
  12. Zheng, H.; Liu, J.; Zhang, Y.; Ma, Y.; Shen, Y.; Zhen, X.; Chen, Z. Effectiveness analysis and temperature effect mechanism on chemical and electrical-based transformer insulation diagnostic parameters obtained from PDC data. Energies 2018, 11, 146. [Google Scholar] [CrossRef] [Green Version]
  13. Li, Y.; Zhou, K.; Zhu, G.; Li, M.; Li, S.; Zhang, J. Study on the Influence of Temperature, Moisture and Electric Field on the Electrical Conductivity of Oil-Impregnated Pressboard. Energies 2019, 12, 3136. [Google Scholar] [CrossRef] [Green Version]
  14. Mishra, D.; Haque, N.; Baral, A.; Chakravorti, S. Assessment of interfacial charge accumulation in oil-paper interface in transformer insulation from polarization-depolarization current measurements. IEEE Trans. Dielectr. Electr. Insul. 2017, 24, 1665–1673. [Google Scholar] [CrossRef]
  15. Liao, R.; Du, Y.; Yang, L.; Gao, J. Quantitative diagnosis of moisture content in oil-paper condenser bushing insulation based on frequency domain spectroscopy and polarisation and depolarisation current. IET Gener. Transm. Distrib. 2017, 11, 1420–1426. [Google Scholar] [CrossRef]
  16. Xie, J.; Dong, M.; Yu, B.; Hu, Y.; Yang, K.; Xia, C. Physical Model for Frequency Domain Spectroscopy of Oil–Paper Insulation in a Wide Temperature Range by a Novel Analysis Approach. Energies 2020, 13, 4530. [Google Scholar] [CrossRef]
  17. HAEFELY. RVM 5462 Advanced Automatic Recovery Voltage Meter for Diagnosis of Oil Paper Insulation. Available online: https://hvtechnologies.com/hv-equipment/substation-test-equipment/rvm-5462-recovery-voltage-meter/ (accessed on 22 January 2022).
  18. IEC 60814:2.0. Insulating Liquids—Oil-Impregnated Paper and Pressboard—Determination of Water by Automatic Coulometric Karl Fischer Titration; International Electrotechnical Commission: Geneva, Switzerland, 1997. [Google Scholar]
  19. Mamunya, Y.P.; Davydenko, V.V.; Pissis, P.; Lebedev, E.V. Electrical and thermal conductivity of polymers filled with metal powders. Eur. Polym. J. 2002, 38, 1887–1897. [Google Scholar] [CrossRef]
  20. ISO/TS 80004-2:2015; Nanotechnologies—Vocabulary—Part 2: Nano-Objects. International Organization for Standardization: Geneva, Switzerland, 2015.
  21. Imry, Y. Introduction to Mesoscopic Physics; Oxford University Press: Oxford, UK, 2002. [Google Scholar]
  22. Mott, N.F. Metal-Insulator Transitions; Taylor and Francis: London, UK, 1974. [Google Scholar]
  23. Pollak, M.; Geballe, T.H. Low-Frequency Conductivity Due to Hopping Processes in Silicon. Phys. Rev. 1961, 122, 1753. [Google Scholar] [CrossRef]
  24. Ravich, Y.I.; Nemov, S.A. Hopping conduction via strongly localized impurity states of indium in PbTe and its solid solutions. Semiconductors 2002, 36, 1–20. [Google Scholar] [CrossRef]
  25. Gerashchenko, O.V.; Ukleev, V.A.; Dyad’kina, E.A.; Sitnikov, A.V.; Kalinin, Y.E. Hopping Conductivity with the “1/2” Law in the Multilayer Nanocomposite [(Co40Fe40B20)34(SiO2)66/C]47. Phys. Solid State 2017, 59, 164–167. [Google Scholar] [CrossRef]
  26. Kavokin, A.; Kutrovskaya, S.; Kucherik, A.; Osipov, A.; Vartanyan, T.; Arakelyan, S. The crossover between tunnel and hopping conductivity in granulated films of noble metals. Superlattices Microstruct. 2017, 111, 335–339. [Google Scholar] [CrossRef]
  27. Pogrebnjak, A.; Ivashchenko, V.; Maksakova, O.; Buranich, V.; Konarski, P.; Bondariev, V.; Zukowski, P.; Skrynskyy, P.; Sinelnichenko, A.; Shelest, I.; et al. Comparative measurements and analysis of the mechanical and electrical properties of Ti-Zr-C nanocomposite: Role of stoichiometry. Measurement 2021, 176, 109223. [Google Scholar] [CrossRef]
  28. Svito, I.; Fedotova, J.A.; Milosavljević, M.; Zhukowski, P.; Koltunowicz, T.N.; Saad, A.; Kierczynski, K.; Fedotov, A.K. Influence of sputtering atmosphere on hopping conductance in granular nanocomposite (FeCoZr)x(Al2O3)1-x films. J. Alloys Compd. 2014, 615, S344–S347. [Google Scholar] [CrossRef]
  29. Koltunowicz, T.N. Dielectric properties of (CoFeZr)x(PZT)(100-x) nanocomposites produced with a beam of argon and oxygen ions. Acta Phys. Pol. A 2014, 125, 1412–1414. [Google Scholar] [CrossRef]
  30. Żukowski, P.; Kołtunowicz, T.N.; Kierczyński, K.; Subocz, J.; Szrot, M.; Gutten, M. Assessment of water content in an impregnated pressboard based on DC conductivity measurements. Theoretical assumptions. IEEE Trans. Dielectr. Electr. Insul. 2014, 21, 1268–1275. [Google Scholar] [CrossRef]
  31. Żukowski, P.; Kołtunowicz, T.N.; Kierczyński, K.; Subocz, J.; Szrot, M. Formation of water nanodrops in cellulose impregnated with insulating oil. Cellulose 2015, 22, 861–866. [Google Scholar] [CrossRef] [Green Version]
  32. Żukowski, P.; Kierczyński, K.; Kołtunowicz, T.N.N.; Rogalski, P.; Subocz, J. Application of elements of quantum mechanics in analysing AC conductivity and determining the dimensions of water nanodrops in the composite of cellulose and mineral oil. Cellulose 2019, 26, 2969–2985. [Google Scholar] [CrossRef] [Green Version]
  33. Zukowski, P.; Rogalski, P.; Kierczynski, K.; Koltunowicz, T.N. Precise Measurements of the Temperature Influence on the Complex Permittivity of Power Transformers Moistened Paper-Oil Insulation. Energies 2021, 14, 5802. [Google Scholar] [CrossRef]
  34. Żukowski, P.; Kołtunowicz, T.N.; Kierczyński, K.; Rogalski, P.; Subocz, J.; Szrot, M.; Gutten, M.; Sebok, M.; Jurcik, J. Permittivity of a composite of cellulose, mineral oil, and water nanoparticles: Theoretical assumptions. Cellulose 2016, 23, 175–183. [Google Scholar] [CrossRef] [Green Version]
  35. Kosmulski, M. There are no nanodroplets of water in wet oil-impregnated pressboard. Cellulose 2021, 28, 5991–5992. [Google Scholar] [CrossRef]
  36. MIDEL 7131. Increased Fire Safety; MIDEL: Manchester, UK, 2016. [Google Scholar]
  37. Fernández, I.; Ortiz, A.; Delgado, F.; Renedo, C.; Pérez, S. Comparative evaluation of alternative fluids for power transformers. Electr. Power Syst. Res. 2013, 98, 58–69. [Google Scholar] [CrossRef]
  38. Liu, Q.; Wang, Z. Streamer characteristic and breakdown in synthetic and natural ester transformer liquids with pressboard interface under lightning impulse voltage. IEEE Trans. Dielectr. Electr. Insul. 2011, 18, 1908–1917. [Google Scholar] [CrossRef]
  39. Koch, M.; Prevost, T. Analysis of dielectric response measurements for condition assessment of oil-paper transformer insulation. IEEE Trans. Dielectr. Electr. Insul. 2012, 19, 1908–1915. [Google Scholar] [CrossRef]
  40. Blennow, J.; Ekanayake, C.; Walczak, K.; García, B.; Gubanski, S.M. Field experiences with measurements of dielectric response in frequency domain for power transformer diagnostics. IEEE Trans. Power Deliv. 2006, 21, 681–688. [Google Scholar] [CrossRef]
  41. Ekanayake, C.; Gubanski, S.M.; Graczkowski, A.; Walczak, K. Frequency Response of Oil Impregnated Pressboard and Paper Samples for Estimating Moisture in Transformer Insulation. IEEE Trans. Power Deliv. 2006, 21, 1309–1317. [Google Scholar] [CrossRef]
  42. Zhang, M.; Liu, J.; Lv, J.; Chen, Q.; Qi, P.; Sun, Y.; Jia, H.; Chen, X. Improved method for measuring moisture content of mineral-oil-impregnated cellulose pressboard based on dielectric response. Cellulose 2018, 25, 5611–5622. [Google Scholar] [CrossRef]
  43. Fafana, I.; Hemmatjou, H.; Meghnefi, F.; Farzaneh, M.; Setayeshmehr, A.; Borsi, H.; Gockkenbach, E. On the frequency domain dielectric response of oil-paper insulation at low temperatures. IEEE Trans. Dielectr. Electr. Insul. 2010, 17, 799–807. [Google Scholar] [CrossRef]
  44. Walczak, K.; Graczkowski, A.; Gielniak, J.; Morańda, H.; Mościcka-Grzesiak, H.; Ekanayake, C.; Gubański, S. Dielectric frequency response of cellulose samples with various degree of moisture content and aging. Przegląd Elektrotechniczny 2006, 82, 264–267. [Google Scholar]
  45. Rogalski, P. Optical registration of transformer oil absorption processes in electrical pressboard nano-capillaries. In Advanced Topics in Optoelectronics, Microelectronics, and Nanotechnologies VIII; Vladescu, M., Tamas, R.D., Cristea, I.C., Eds.; SPIE: Bellingham, WA, USA, 2016; p. 100101R. [Google Scholar]
  46. Rogalski, P.; Okal, P. Optical registration of the vacuum impregnation process of electrotechnical pressboard by transformer oil. In Photonics Applications in Astronomy, Communications, Industry, and High Energy Physics Experiments 2017; Romaniuk, R.S., Linczuk, M., Eds.; SPIE: Bellingham, WA, USA, 2017; p. 104455E. [Google Scholar]
  47. Zukowski, P.; Kierczynski, K.; Koltunowicz, T.N.; Rogalski, P.; Subocz, J.; Korenciak, D. AC conductivity measurements of liquid-solid insulation of power transformers with high water content. Measurement 2020, 165, 108194. [Google Scholar] [CrossRef]
  48. Rouabeh, J.; M’barki, L.; Hammami, A.; Jallouli, I.; Driss, A. Studies of different types of insulating oils and their mixtures as an alternative to mineral oil for cooling power transformers. Heliyon 2019, 5, e01159. [Google Scholar] [CrossRef] [Green Version]
  49. Rogalski, P. Measurement Stand, Method and Results of Composite Electrotechnical Pressboard-Mineral Oil Electrical Measurements. Devices Methods Meas. 2020, 11, 187–195. [Google Scholar] [CrossRef]
  50. Zukowski, P.; Rogalski, P.; Koltunowicz, T.N.; Kierczynski, K.; Subocz, J.; Sebok, M. Influence of temperature on phase shift angle and admittance of moistened composite of cellulose and insulating oil. Measurement 2021, 185, 110041. [Google Scholar] [CrossRef]
  51. Zukowski, P.; Rogalski, P.; Koltunowicz, T.N.; Kierczynski, K.; Bondariev, V. Precise measurements of the temperature-frequency dependence of the conductivity of cellulose—insulating oil—water nanoparticles composite. Energies 2020, 14, 32. [Google Scholar] [CrossRef]
  52. Landau, L.D.; Lifshitz, E.M.; Pitaevskiĭ, L.P. Electrodynamics of Continuous Media; Butterworth-Heinemann: Oxford, UK, 1984. [Google Scholar]
  53. DIRANA PTM User Manual ENU; Omicron Electronics Gmbh: Wien, Austria, 2017.
  54. Liu, J.; Fan, X.; Zhang, Y.; Zhang, C.; Wang, Z. Aging evaluation and moisture prediction of oil-immersed cellulose insulation in field transformer using frequency domain spectroscopy and aging kinetics model. Cellulose 2020, 27, 7175–7189. [Google Scholar] [CrossRef]
  55. Halliday, D.; Resnick, R. Physics, Part II; John Wiley & Sons: New York, NY, USA, 1978. [Google Scholar]
  56. Rahman, M.F.; Nirgude, P. Partial discharge behaviour due to irregular-shaped copper particles in transformer oil with a different moisture content of pressboard barrier under uniform field. IET Gener. Transm. Distrib. 2019, 13, 5550–5560. [Google Scholar] [CrossRef]
  57. Zhou, L.; Wang, D.; Cui, Y.; Zhang, L.; Wang, L.; Guo, L. A Method for Diagnosing the State of Insulation Paper in Traction Transformer Based on FDS Test and CS-DQ Algorithm. IEEE Trans. Transp. Electrif. 2021, 7, 91–103. [Google Scholar] [CrossRef]
  58. Light, T.S.; Licht, S.; Bevilacqua, A.C.; Morash, K.R. The fundamental conductivity and resistivity of water. Electrochem. Solid-State Lett. 2005, 8, E16. [Google Scholar] [CrossRef]
  59. Wang, Q.; Cha, C.S.; Lu, J.; Zhuang, L. Ionic Conductivity of Pure Water in Charged Porous Matrix. Chem. Phys. Chem. 2012, 13, 514–519. [Google Scholar] [CrossRef]
  60. Smirnov, S.A.; Shutov, D.A.; Bobkova, E.S.; Rybkin, V.V. Chemical Composition, Physical Properties and Populating Mechanism of Some O(I) States for a DC Discharge in Oxygen with Water Cathode. Plasma Chem. Plasma Process. 2016, 36, 415–436. [Google Scholar] [CrossRef]
  61. ASTM D1125-95 2005. Standard Test Methods for Electrical Conductivity and Resistivity of Water; ASTM International: West Conshohocken, PA, USA, 2016. [Google Scholar]
  62. Stillinger, F.H. Proton Transfer Reactions and Kinetics in Water. Theor. Chem. 1978, 3, 177–234. [Google Scholar]
  63. Cole, K.S.; Cole, R.H. Dispersion and Absorption in Dielectrics I. Alternating Current Characteristics. J. Chem. Phys. 1941, 9, 341–351. [Google Scholar] [CrossRef] [Green Version]
  64. Cole, K.S.; Cole, R.H. Dispersion and Absorption in Dielectrics II. Direct Current Characteristics. J. Chem. Phys. 1942, 10, 98–105. [Google Scholar] [CrossRef]
  65. Jonscher, A.K. Dielectric Relaxation in Solids; Chelsea Dielectrics Press: London, UK, 1983. [Google Scholar]
  66. Popov, I.; Ben Ishai, P.; Khamzin, A.; Feldman, Y. The mechanism of the dielectric relaxation in water. Phys. Chem. Chem. Phys. 2016, 18, 13941–13953. [Google Scholar] [CrossRef] [PubMed]
  67. Kierczyński, K.; Zenker, M. Comparison of DC conductivity of the synthetic ester and a composite of cellulose, synthetic ester, water nanoparticles. In Advanced Topics in Optoelectronics, Microelectronics, and Nanotechnologies IX; Vladescu, M., Tamas, R.D., Cristea, I.C., Eds.; SPIE: Bellingham, WA, USA, 2018; p. 109771K. [Google Scholar]
  68. Liu, Q.; Wang, Z.D. Streamer characteristic and breakdown in synthetic and natural ester transformer liquids under standard lightning impulse voltage. IEEE Trans. Electr. Insul. 2011, 18, 285–294. [Google Scholar] [CrossRef]
  69. Shklovskii, B.I.; Efros, A.L. Electronic Properties of Doped Semiconductors; Springer: Berlin, Germany, 1984. [Google Scholar]
  70. Mott, N.F.; Davis, E.A. Electronic Processes in Non-Crystalline Materials, 2nd ed.; Clarendon Press: Oxford, NY, USA, 1979. [Google Scholar]
Figure 1. Time dependence of the DC intensity for a sample impregnated with mineral oil with a moisture content of 0.6 wt. % (a) and with a moisture content of 5 wt. % (b) for measuring temperatures from 20 to 60 °C with a step of 8 °C.
Energies 15 02859 g001
Figure 2. Arrhenius diagrams for samples impregnated with mineral oil with a moisture content of 0.6 (a) and 5 wt. % (b).
Energies 15 02859 g002
Figure 3. Cross-section of a composite with 5 wt. % water content: 1—electrodes; 2—water inclusions.
Energies 15 02859 g003
Figure 4. Arrhenius diagrams for ultrapure water (1), ultrapure water with 1 mg/L NaCl salt dissolved in it (2). Prepared on the basis of figures in [61].
Energies 15 02859 g004
Figure 5. Frequency dependences of permittivity of mineral oil-impregnated pressboard for moisture content: 1—0.6 wt. %, 2—5 wt. %, 3—difference between the dependencies for 0.6 wt. % and 5 wt. %.
Energies 15 02859 g005
Figure 6. Frequency dependence of the permittivity for temperatures from 20 to 60 °C of the mineral oil-impregnated pressboard with a water content of 5 wt. % [33].
Energies 15 02859 g006
Figure 7. Frequency dependences of the permittivity of the three-phase composite of electrical pressboard—synthetic ester—moisture for moisture content: 1—0.6 wt. %, 2—5 wt. %, 3—difference between the dependencies for 5 and 0.6 wt. %. Measuring temperature 2 °C.
Energies 15 02859 g007
Publisher’s Note: MDPI stays neutral with regard to jurisdictional claims in published maps and institutional affiliations.

