1. Introduction
In a conventional power system, electrical energy is produced in large power plants and transmitted through transmission and distribution networks to its end-consumers. During energy system transition, the high proliferation of solar and wind power plants forces transmission and distribution network operators to procure additional balancing solutions to ensure the security and quality of supply. Another driver of the energy transition is the energy consumers, who are increasing their level of awareness and shifting from passive to active participants in the electricity system. In addition to network operators who seek to solve balancing or network congestion problems, a very important role in the energy transition will also be assigned to energy communities and citizen co-ownership in renewable energy [
1]. The transition to a more dynamic and variable power system opens the possibility to incorporate novel solutions for real-time and long-term demand and supply balancing. Besides posing new technical challenges, the massive integration of renewable energy sources and new technologies on the demand side (e.g., electric vehicles and heat pumps) are changing the landscape of energy systems by creating new possibilities to produce, use, and store energy [
2].
Technological changes are occurring rapidly, and new solutions that allow consumers to become active participants in the energy transition are becoming more affordable. Changes in national regulatory frameworks that are crucial for the integration of new market actors, such as aggregators or energy communities, are happening, though at a slower pace.
In the Clean Energy for all Europeans package [
3], the European Union (EU) has set ambitious energy and climate targets for 2030 to boost long-term neutrality by 2050. The new rulebook places the “energy efficiency first” principle as a priority and sets a target to increase the efficiency of EU energy use by almost one-third—at least 32.5%—by 2030. Moreover, a particular emphasis in [
3] is placed on the improvement of energy performance in the building sector, which is highlighted as crucial for the clean energy transition. Buildings are the largest energy consumers and account for 40% of the final energy consumption and 36% of greenhouse gas emissions in Europe. The key priorities for the package are thus energy efficiency first, the EU’s global leadership in renewables, and a fair deal for energy consumers.
Consistent with empowering the activation of final consumers, in the framework of the Clean Energy package, an important boost is expected to be realised by the establishment of energy communities. Citizen energy communities’ rights and obligations are described in Article 16 of EU Directive 2019/944 for common rules for the internal market for electricity [
4]. As set in the directive [
4], citizen energy communities are entitled to arrange, within the community, the electricity that is produced by the production units owned by the community and are financially responsible for any resulting imbalances in the electricity system. In a broader frame, this means that energy communities are capable of aggregating consumer assets (both production units and flexibility assets) and dispatching this energy.
Moreover, energy communities, also known as renewable energy communities, are also an integral part of EU Directive 2018/2001 on the promotion of the use of energy from renewable sources [
5], where a particular focus is given to household consumers. According to [
5], consumers are entitled to participate in a renewable energy community and are able to produce, consume, store, and sell renewable energy that is produced by production units, maintaining the rights and obligations of the renewable energy community members as customers who have access to all suitable energy markets. Additionally, the enabling framework indicated by the directive [
5] shall ensure that renewable energy communities that supply energy or provide aggregation or other commercial energy services are subject to the provisions relevant for such activities. The citizen energy communities and renewable energy communities recognised in directives [
4,
5] are also expected to have a crucial role in promoting energy efficiency and energy poverty alleviation.
Energy communities, whether they are called renewable or citizen energy communities, should be able to deliver innovative aggregation solutions at the local level. The unleashed flexibility potential of households could provide ancillary services to grid operators and self-balancing services for energy communities, or it could be directed towards achieving energy savings obligations (set by the Energy Efficiency Directive [
6]) and energy efficiency objectives.
In 2018, households, or the residential sector, represented 26.1% of final energy consumption or 16.6% of gross inland energy consumption in the EU. Most of the EU’s final energy consumption in the residential sector is covered by natural gas (32.1%) and electricity (24.7%) [
7]. The electricity consumption trends in the EU indicate that, whilst electricity consumption in the services sector increased by more than a third in the period from 2000 to 2018 (+35.4%), an increasing trend of 16.5% was registered in the household sector during the same period [
8]. Even if such indicators suggest the considerable potential for activating flexibility derived from electricity consumption in households, a more thorough analysis of the eligible loads, which could be involved in such flexibility provision, should be made.
Although the directives legitimise household asset aggregation through energy communities and aggregators at the EU level, the flexibility potential of households is still significantly unexplored at the global level for a variety of reasons: (i) the scarcity and frequent absence of historical data with the desired resolution for load profiles; (ii) absence of information on installed equipment in consumer households; (iii) diverse consumer behaviour; (iv) socio-economic background and resulting investment for state-of-the-art equipment; (v) availability of energy infrastructure mostly related to heating, i.e., district heating; (vi) diverse building energy efficiency performance; (vii) differing climatological conditions, etc.
Various works have been carried out to assess local market flexibility potential to procure ancillary services in local markets [
9] as a response to distribution system operator (DSO) requests [
10] for capacity market purposes [
11] or to solve local grid congestion [
12]. In the listed works, the delivered flexibility was obtained by shaping, shifting, shedding, or arbitraging (over time) the engaged load profiles. By means of a local aggregator, household demand response flexibility could also be triggered to achieve permanent energy savings as a reduction from the baseline load. This paper intends to study the possibility of delivering cumulative energy savings, obtained by individual demand reduction in season- and weather-sensitive loads, to a local energy community by means of an aggregator in an environment where historical smart metering data are scarcely available or not available at all. This type of flexibility activation is not envisioned as a response to a third-party (i.e., DSO) request but, on the contrary, addresses the possibility of delivering an energy savings programme to its users in a framework of a business model based on cumulative energy savings settlement. This type of flexibility activation programme does not need to consider simultaneous activation benefits and constraints. On the contrary, it relies on the possibility of aggregating energy savings obtained by each user through flexibility activation, thereby establishing a novel programme for local aggregators.
This paper proposes a methodology for the assessment of the energy savings flexibility potential of residential consumers, which considers scarcely available historical consumption data, surveyed data, climatological conditions, usual consumption patterns, and building energy performance.
Additionally, several scenarios for flexibility activation were modelled to interlink the technical and occupancy constraints of household consumers. This model is intended to optimise flexibility assets offered by end-users, deliver energy savings to their portfolio of consumers, and create new revenue for local aggregators.
4. Methodology
This paper firstly proposes a methodology for weather- and season-sensitive flexibility asset modelling based on surveyed data collected directly from consumers interlinked with outdoor temperature data, occupational constraints, and building energy performance. In order to simulate a real environment when load profile historical data are difficult to retrieve, this study relies solely on data collected from the surveyed consumers and does not use historical load profile data. Methods used for load disaggregation to obtain certain flexibility profiles are not applied in this case study due to their unavailability. Furthermore, considering different resolutions of energy consumption data collected from various consumers, this study proposes a methodology for mapping typical consumption patterns of flexible loads and thus modelling consumption baselines where needed.
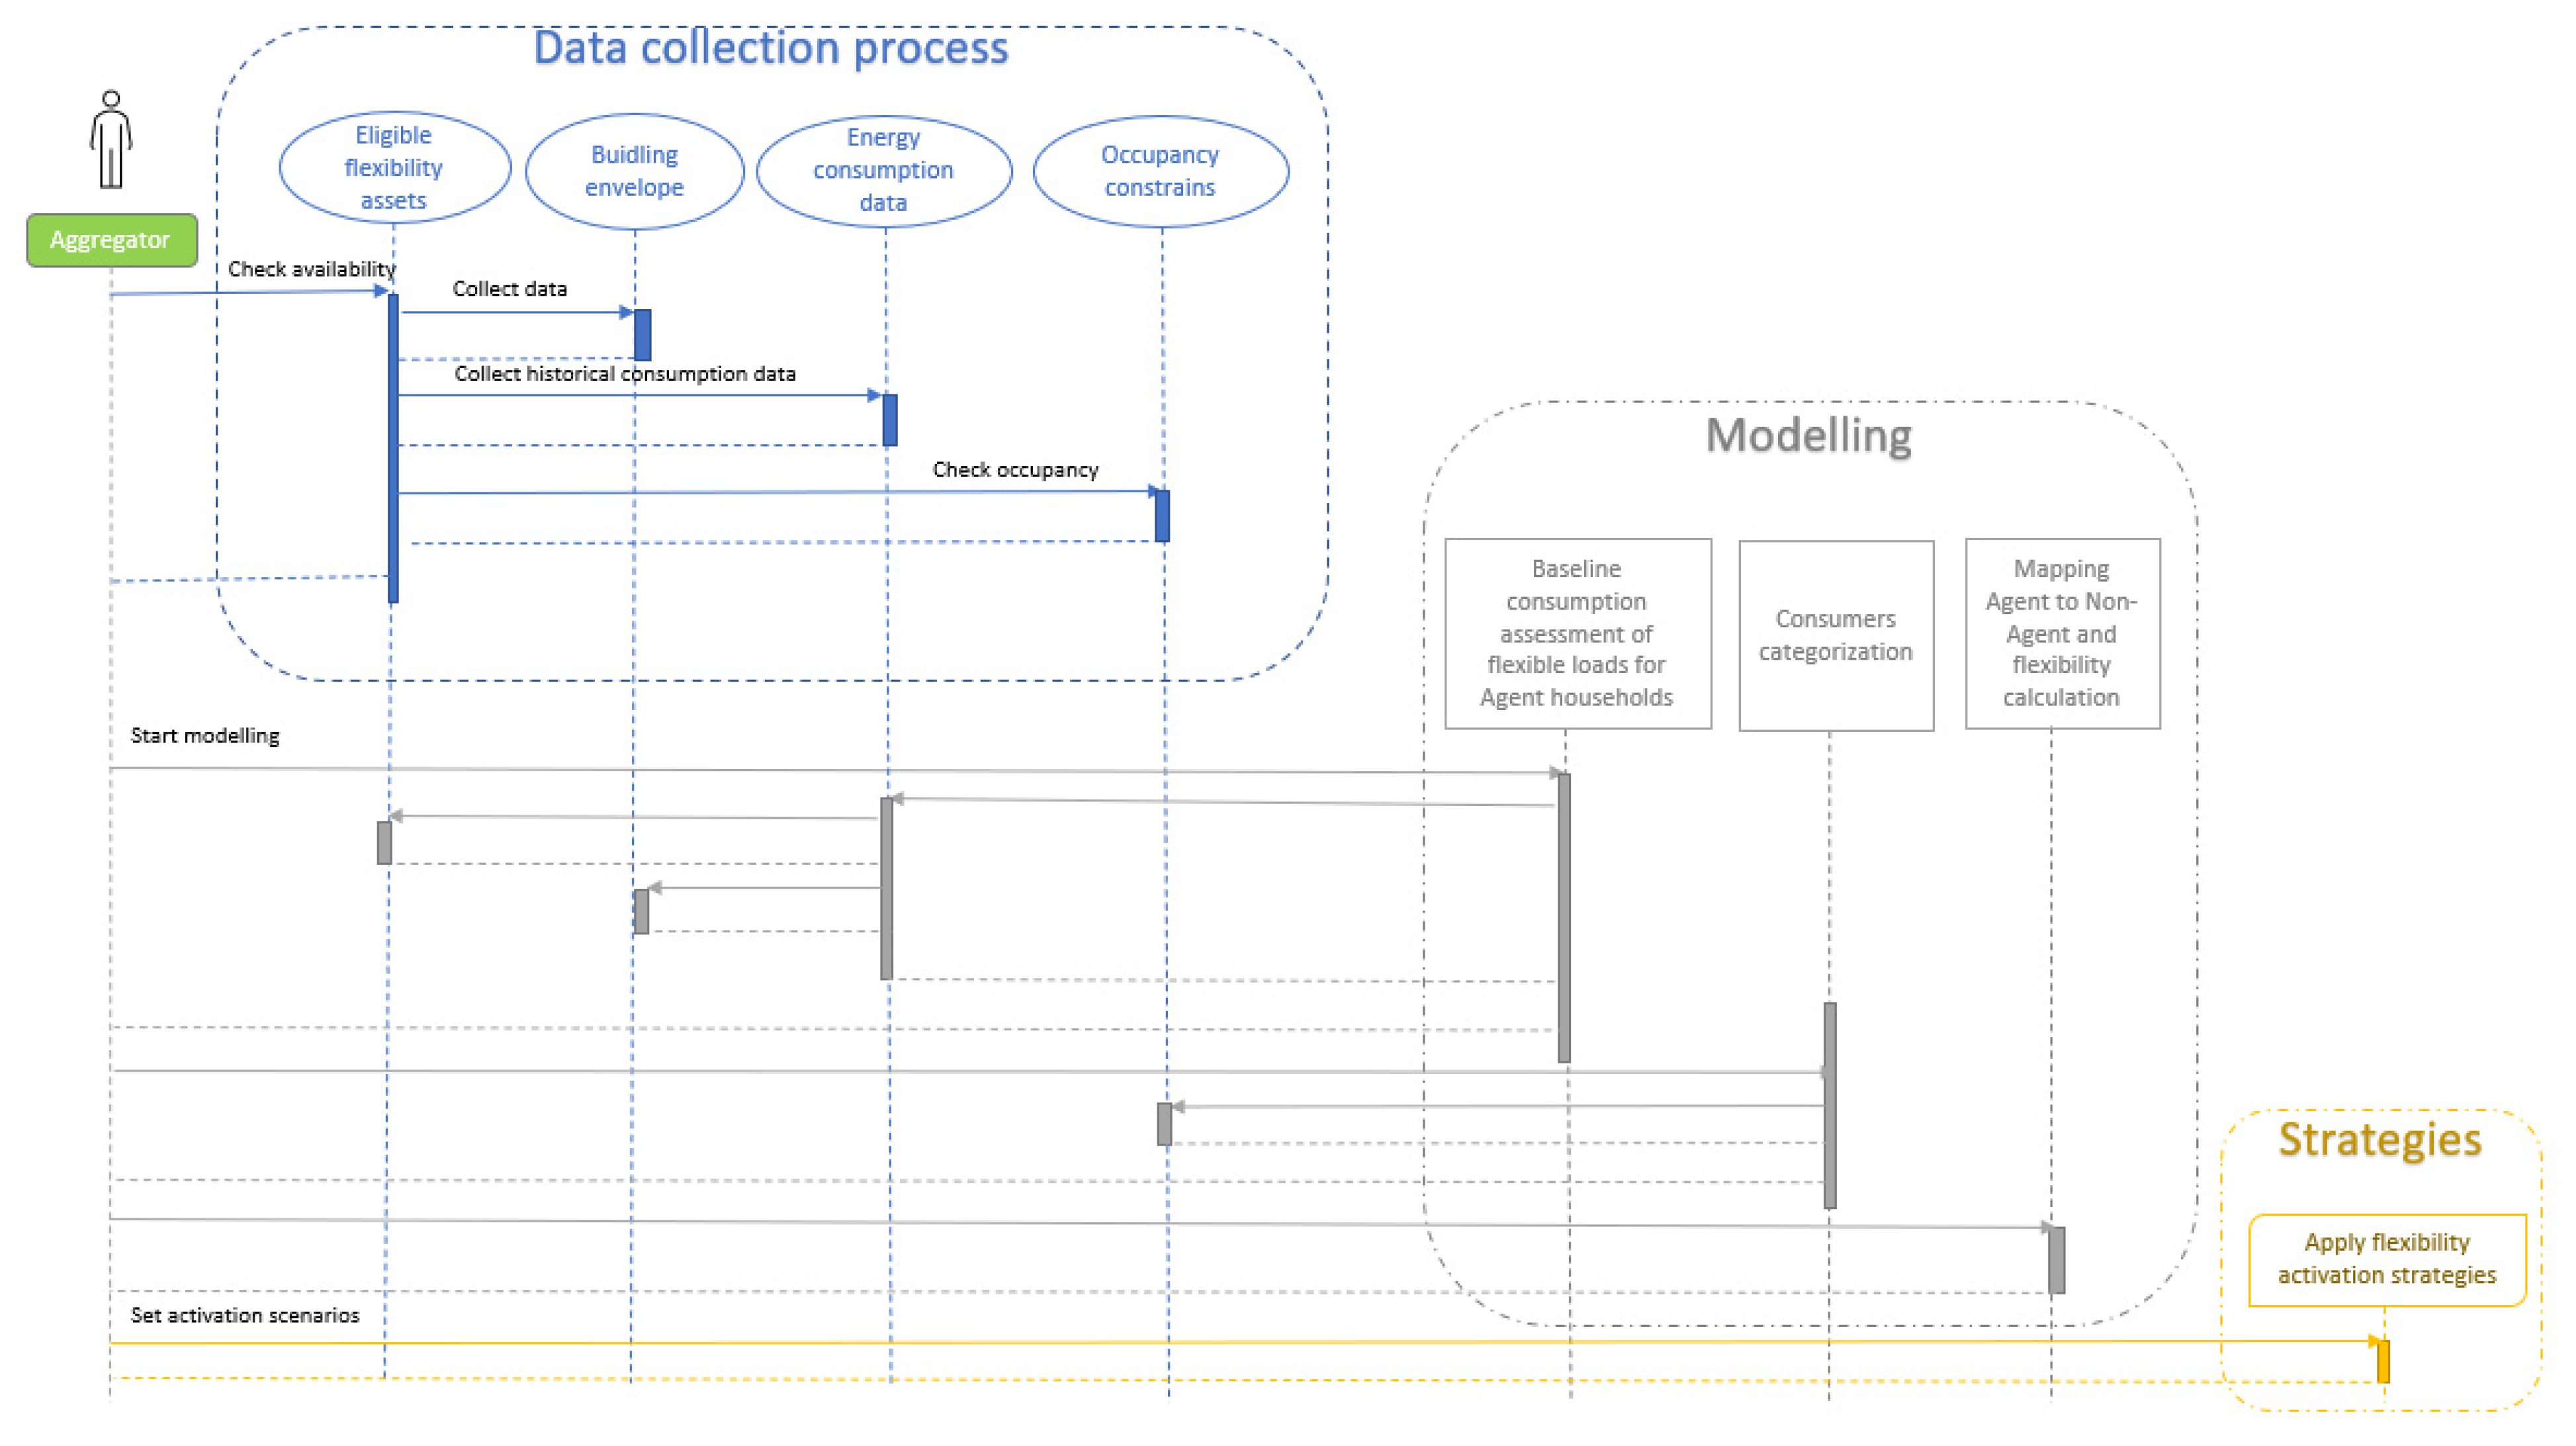
Secondly, to obtain cumulative energy savings at the local level based on modelled and collected data, activation strategies and criteria for flexibility activation are proposed. The sequence diagram developed for the process of assessing, modelling, and activating flexibility to obtain energy savings proposed in this paper is shown in
Figure 1.
The first step is to assess the availability of flexibility assets as suitable candidates for load reduction. These are controllable loads whose operating point can be adjusted to decrease consumption by a certain percentage (i.e., thermostatically). Taking into account the absence of electric vehicle charging points (EV) in the case study, heat pumps (HPs) and air-conditioning (AC) units are the most suitable assets qualified for load reduction and, consequently, energy savings.
As potential candidates for flexibility procurement, users were divided into three main categories: those that use the heat pump solely for heating, those that use it for both heating and cooling, and finally, those that use air-conditioning units for cooling in the summer months. Consumers for whom electrical energy is not the primary source of heating, whose air-conditioning systems are used for reheating and increasing thermal comfort, were not considered eligible for flexibility programmes, as they directly influence the user’s comfort. Besides flexibility assets, in the data collection process, each user was surveyed about the building envelope, occupancy, and energy consumption.
Following the data collection process, methodologies for flexibility modelling are described in the following subsections, along with the simulated activation strategies.
4.1. Baseline Analysis and Assessment of Monthly Flexible Load Consumption for “Agent” Households
Since monthly historical consumption data were solely available for a small number of buildings, the first step of the modelling process is to select “agent” end-users with available monthly data to determine specific electrical energy consumption for heating, cooling, and/or both. The overall goal of this exercise is to extrapolate the consumption patterns from the “agent” households to the remaining ones based on selected criteria and, in this way, achieve a sort of mapping that requires proper end-user categorisation considering their technical and behavioural constraints.
Three household buildings were selected as agent buildings to represent three types of heating and cooling modalities: “Agent 1” uses a heat pump just for heating; “Agent 2” uses a heat pump for both heating and cooling; and finally, “Agent 3” uses a heat pump or air-conditioning (AC) unit for cooling in the summer months.
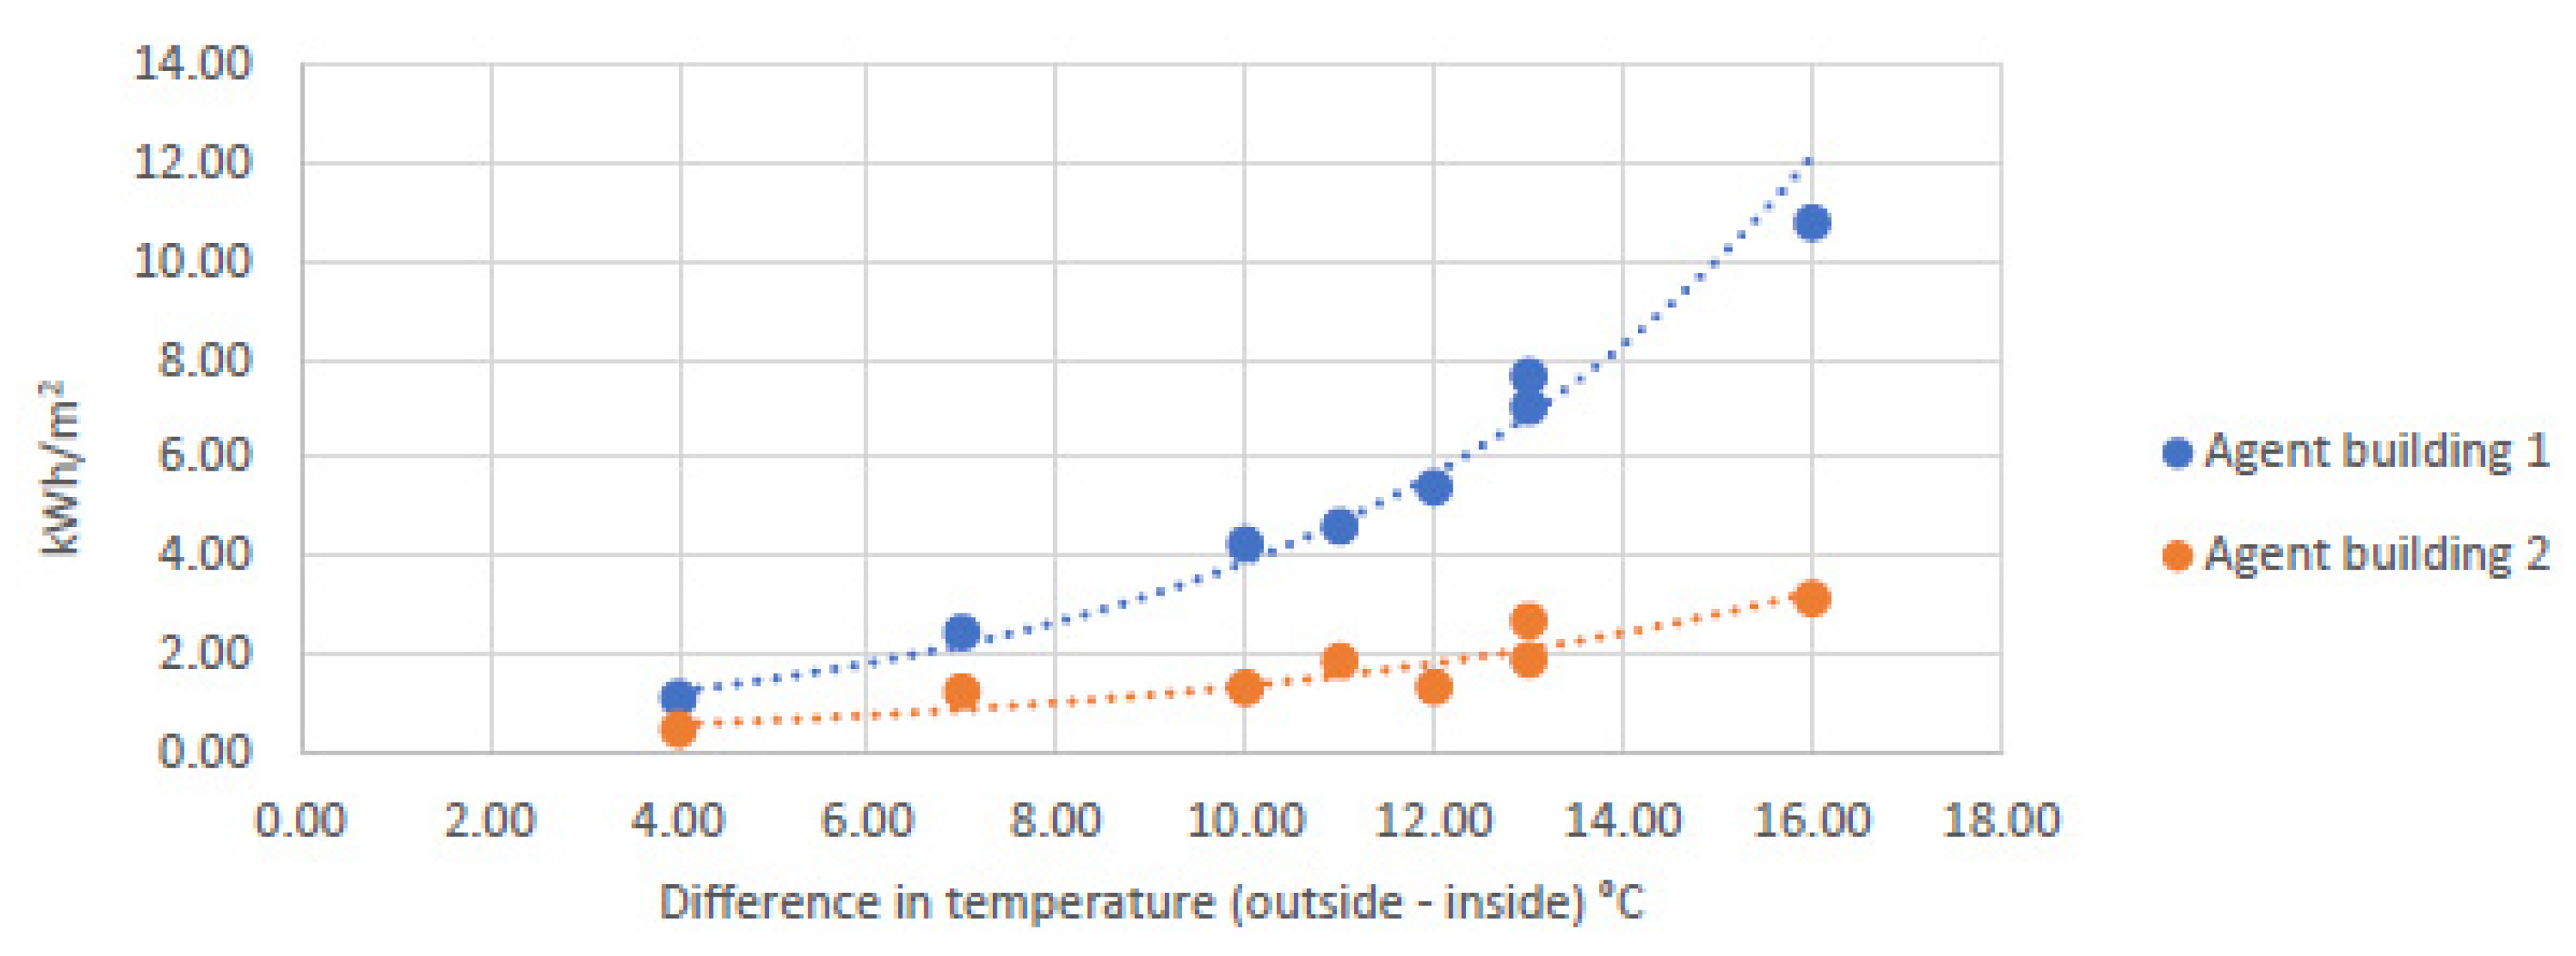
Eligible loads for obtaining energy savings in this exercise are highly season- and weather-sensitive. A linear regression analysis of monthly consumption variations in relation to the outside temperature was performed using monthly energy consumption data. A negative relationship between overall monthly energy consumption (as a dependent variable) for a building that is occupied on a full-time basis and uses a heat pump solely for heating purposes and average outdoor monthly temperatures (as an independent variable) is shown in
Figure 2. The coefficient of determination (or R-squared) was 0.89, indicating a significant causality between outside temperature and heating energy consumption, which was further considered in the baseline modelling process.
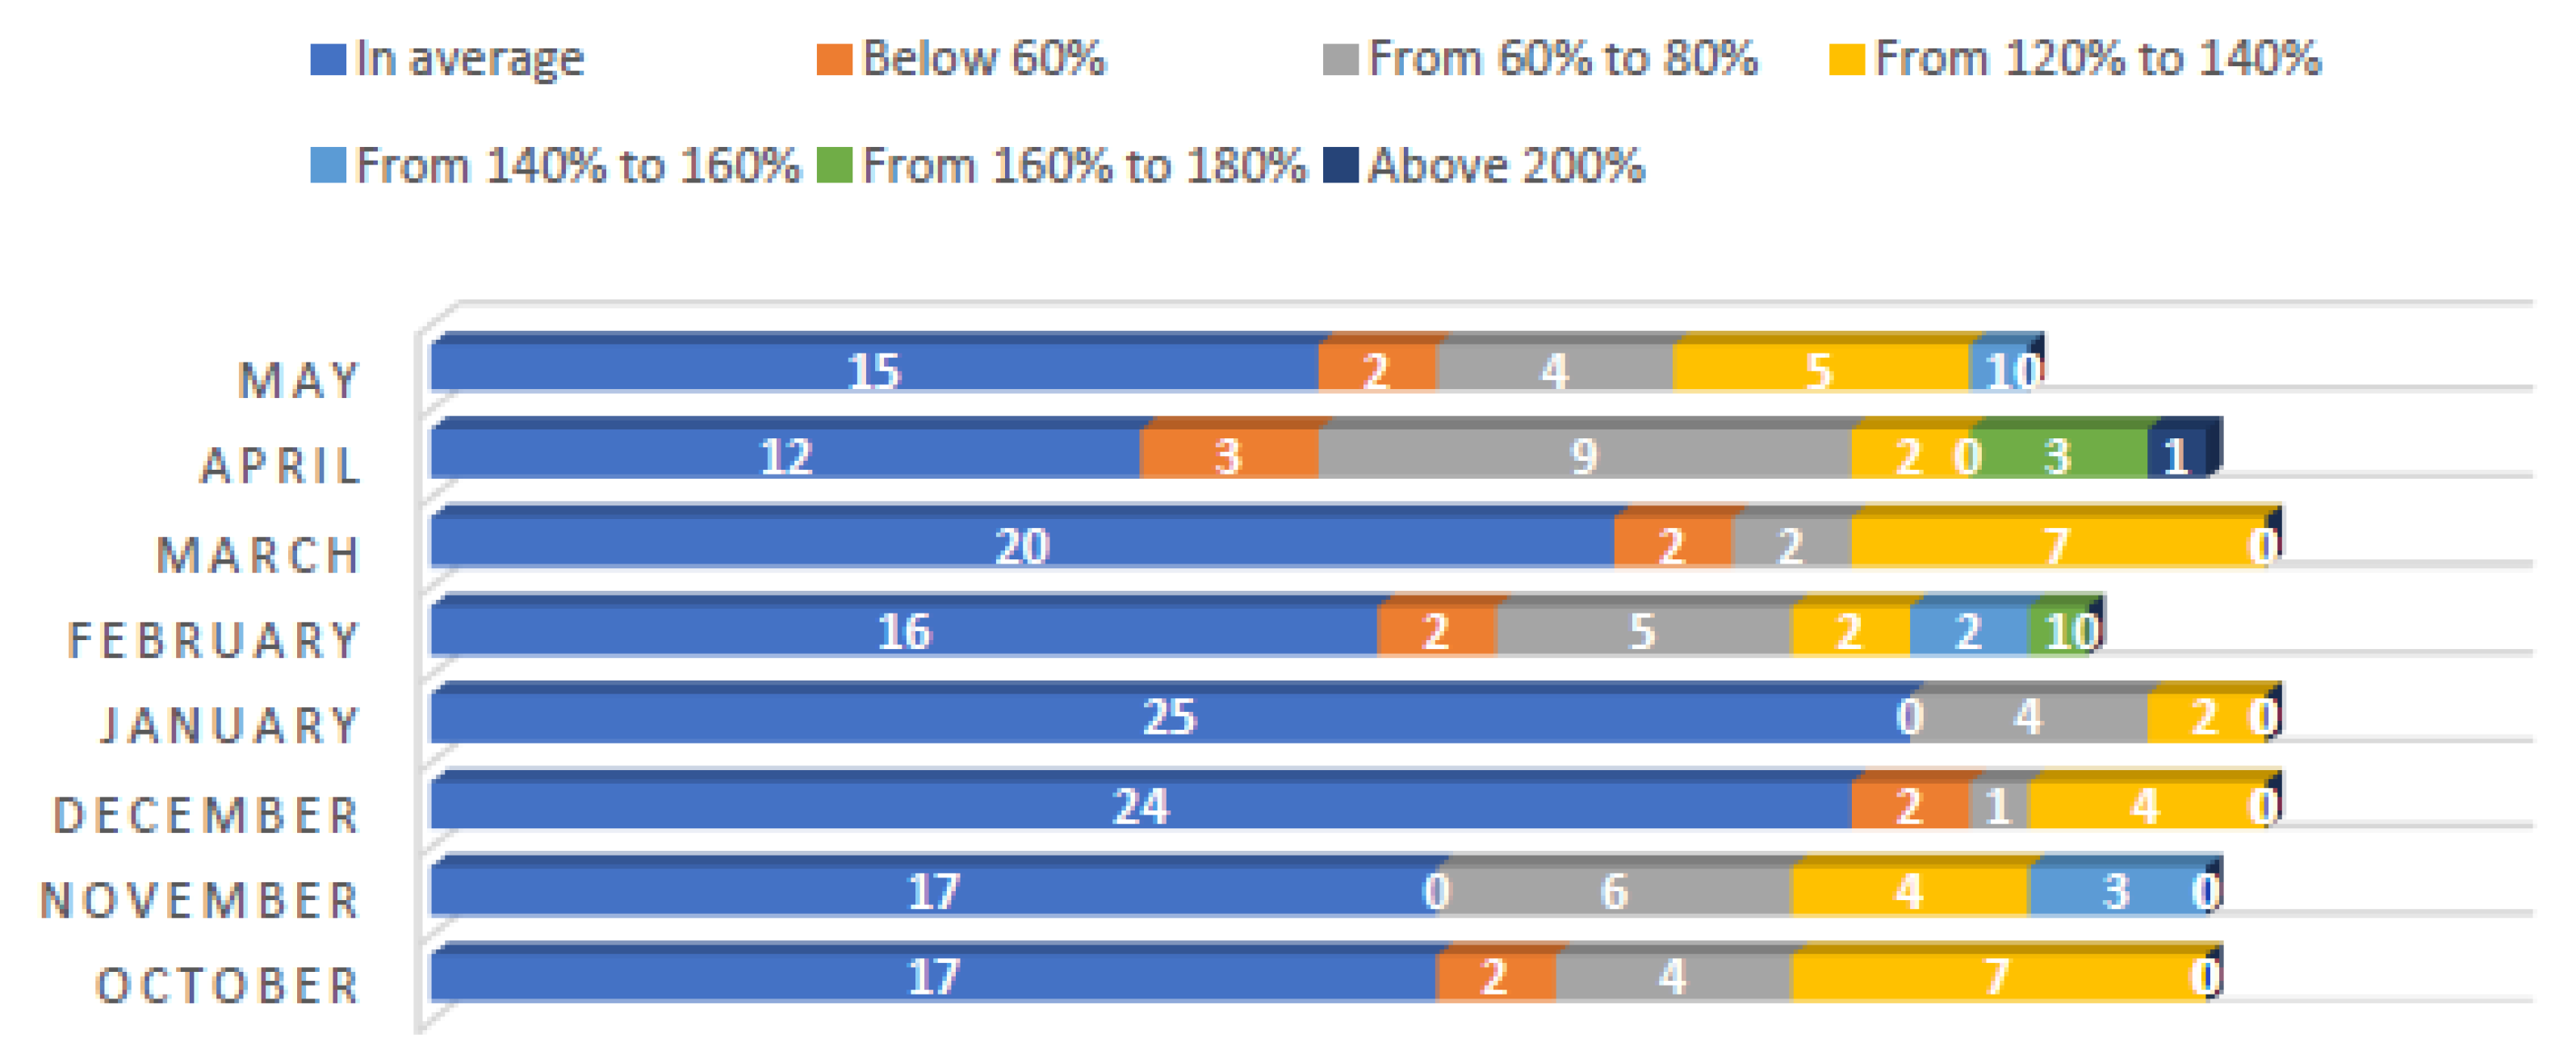
Once the dependencies between outdoor conditions and energy consumption were determined, the next step was to analyse the energy performance of different buildings in correlation with the mentioned variables. A commonly used variable to calculate building energy consumption and building energy performance is the degree day. Heating degree days (HDDs) are a measure of how much (in degrees) and for how long (in days) the outside air temperature was lower than a set indoor temperature. Using the pre-set constant temperature of the observed users and their location, HDDs were calculated. Bearing in mind that this exercise step analyses the causality between monthly energy consumption and outdoor conditions, the share of electricity used for heating purposes was estimated from the colder months (
Eheating,HP monthly), i.e., October (32%), November (50), December (59%), January (73%), February (59%), March (55%), April (45%), and May (18%), based on the difference between the pre-set indoor temperatures and heating degree days (HDDs), whose values are comparable to the shares in [
34]. The values were applied for both Agent 1 and Agent 2, since they both use HP for heating purposes.
Figure 3 depicts a notable deviation in energy consumption between the two buildings during heating months, especially with increasing differences between indoor and outdoor temperatures. This discrepancy indicates that energy consumption is highly affected by building energy performance, since both examined end-users use specific setpoints of constant indoor temperature in the heating months and are all-year residents in their related households.
Once monthly energy consumption engaged for heating was calculated based on the performance analysis of agent buildings, specific monthly electrical energy engaged for heating Eheating,HP spec (kWh/m2) was calculated for both buildings. Once monthly consumption used specifically for heating was obtained, indicating that energy consumption is directly affected by building energy performance, a building classification of different energy consumption in relation to its performance was needed.
To enable this classification, based on available data in the absence of energy audits, an assumption for specific annual heating energy demand
QH,nd annual of agent buildings was made. The Algorithm for calculating the energy required for heating and cooling building space according to HRN EN ISO 13790 norm [
40], among other things, defines the steps for calculating the specific heating energy demand for residential buildings under different climatological conditions in the Republic of Croatia. The norm specifies that when the calculation of the specific annual heating energy demand (kWh/m
2 a) for a building is completed, an energy class with the letter (
A+,
A,
B,
C,
D,
E,
F,
G) [
39] is indicated on the energy certificate of the building. In this specific case, as the specific monthly and thereafter annual consumption of electrical energy dedicated to heating
Eheating,HP annual (kWh/m
2 a) was already calculated for agent buildings, these values needed to be converted into heating-specific energy demand
Qheating,HP annual in order to obtain the classes and thus allow mappings.
The seasonal performance factor (SPF) is an indicator used to evaluate the efficiency of heat pumps. It is presented as a ratio between the total heat supplied by the heating system to a building and the electricity used by the heat pump and related devices of the heating system over the year [
41]. The SPF value also depends on the efficiency of the heat pump (coefficient of performance, COP) and climatic conditions [
42]. For the purpose of this paper, a conservative average factor [
43] of 2.5 for air-source heating pumps was used as the SPF, meaning that
Qheating,HP annual = SPF × Eheating,HP annual, classifying Agent 1 as class
D and Agent 2 as class
B. The authors considered this to be adequate on the basis of the envelope and insulation information collected by a survey.
The next step is dedicated to remodelling the specific consumption by agent buildings according to different levels of energy performance. Since the energy performance of buildings is particularly relevant for heating, and specific annual heating energy demands
QH,nd annual are already prescribed in [
39] according to specific climatic circumstances and building energy performance, the relations between different levels of
QH,nd were used (i.e.,
D in
A+ is;
Eheating,HP annual (
A+) =
Eheating,HP annual (
D)/10).
For cooling, Agent 2 and Agent 3 were examined. Since the main source of cooling within the household premises is split units (the same one as a standard AC system), the specific results of Agent 3 could be applied to all case study households using an AC system. The main difference is in the fact that the heat pump provides a centralised cooling system for the entire building, while AC units are separate units (for example, one unit in the living room and the second in the bedroom). For cooling purposes, the share of engaged electricity (
Ecooling,HP/AC monthly) was estimated based on the degree days for cooling (CDD) in May (3%), June (20%), July (49%), August (55%), and September (25%), which is also comparable to the assumptions in [
34]. Cooling degree days (CDDs) are a measure of how much (in degrees) and for how long (in days) the outside air temperature was higher than a set indoor temperature. The monthly energy consumption engaged for cooling was therefore recalculated to specific monthly electrical energy engaged for cooling
Ecooling spec (kWh/m
2).
Dedicated formal energy performance grading does not exist for cooling, so classifying buildings according to cooling performance could lead to the wrong conclusion, as previously mentioned in the literature review. Occupants tend to activate and deactivate AC units as a function of weather conditions as opposed to the interior temperature. The steps of this procedure are graphically shown in
Figure 4.
4.2. End-User Building and Consumption Categorisation
Once monthly consumption patterns had been defined for agent buildings with different energy performance characteristics, the following step was to remodel or map the results obtained in the previous step. Each building user was assigned to a specific “Agent” (
Table 2) with specific monthly consumption dedicated to heating and cooling. Whilst the categorisation for heating is far more tailored to the different energy performance of buildings, all buildings were categorised under the same
Ecooling,HP/AC monthly due to the lack of a correlation between their consumption and building performance.
4.3. Methodology for Aggregator Flexibility Asset Modelling and Activation Strategies
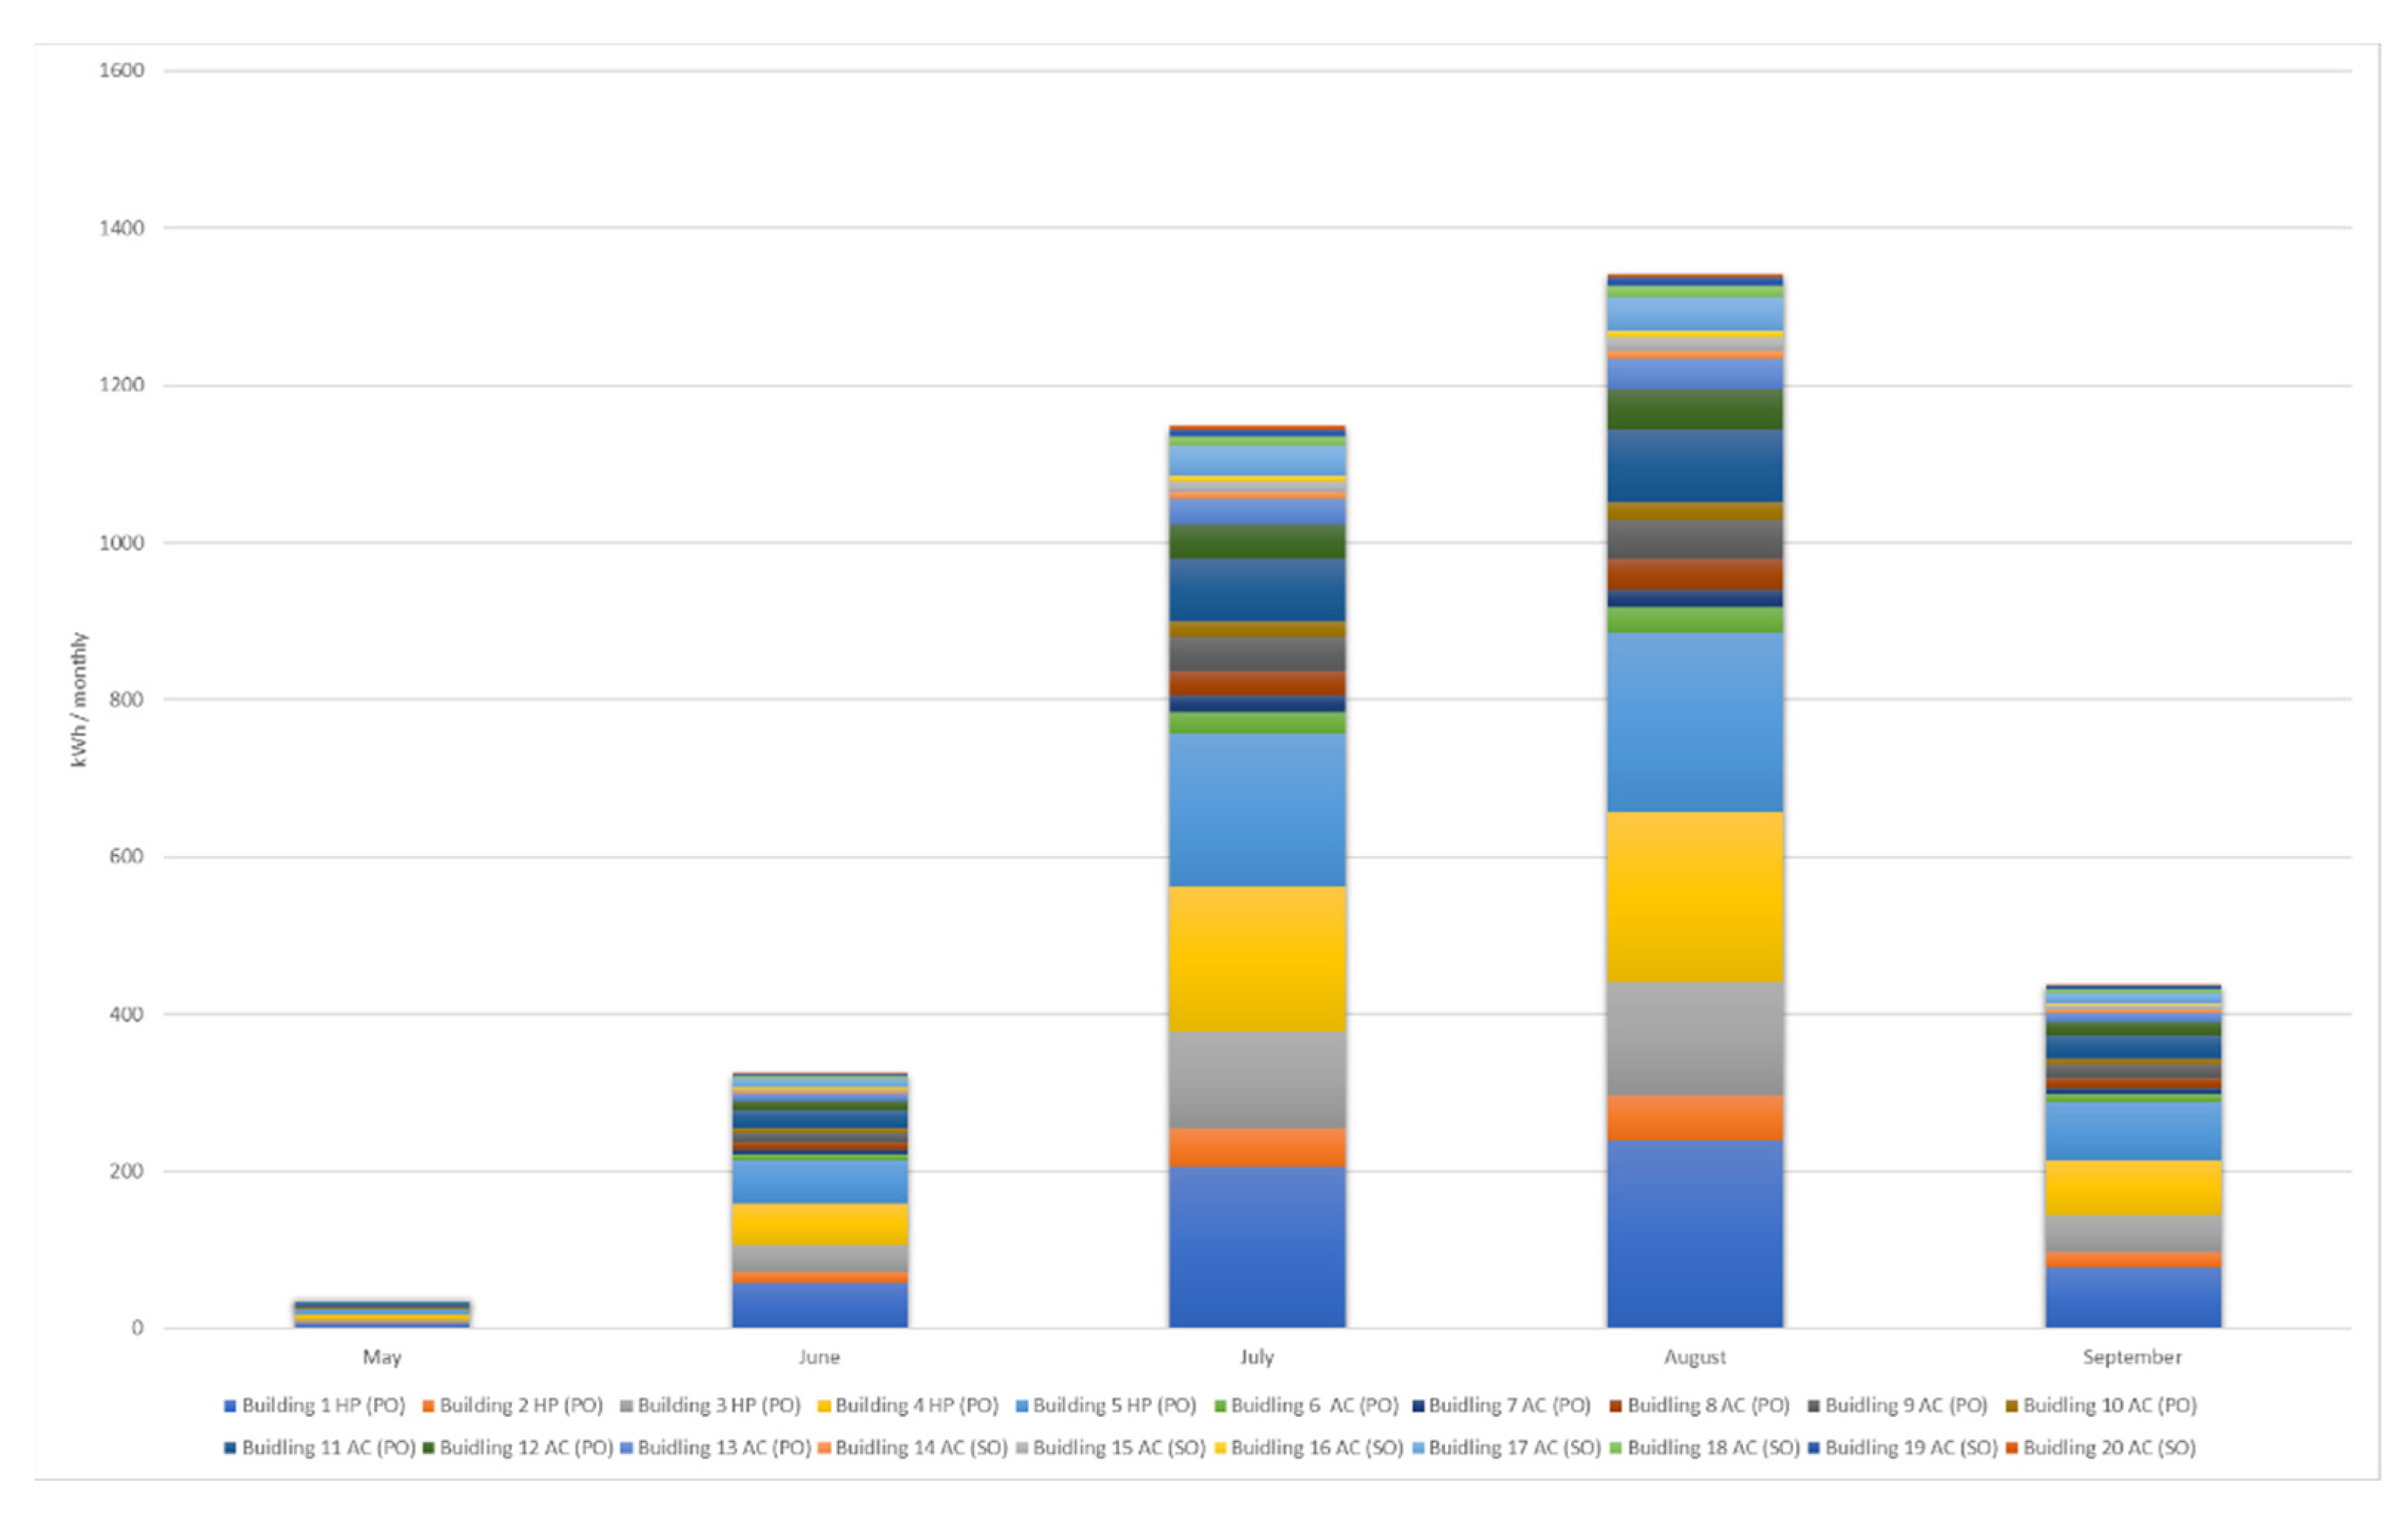
Figure 5 presents the steps for aggregator flexibility asset modelling developed for the analysed sample. Baseline monthly energy consumption per flexibility asset (kWh/m
2) was created in the previously described methodology for agent buildings. After each user was appointed to a specific “Agent” with the specific monthly consumption for heating (
Eheating,HP spec (kWh/m
2)) and cooling (
Ecooling spec (kWh/m
2)), using input parameters such as square metres of heated area and cooled area, baseline monthly energy consumption for flexibility assets for each month was obtained.
Whilst specific energy consumption for heating considers the building energy performance (
Figure 6), this is not the case for cooling for the previously mentioned reasons (
Figure 7).
After monthly consumption profiles have been created, the next step is to model daily baseline consumption profiles of flexibility assets. This means that monthly flexibility consumption profiles need to be converted into daily consumption profiles. For this purpose, HDD and CDD parameters from [
38] were used for the location of Krk (Omišalj). Indoor temperatures were set at 22.5 °C for heating and 21 °C for cooling (as an average obtained from the survey), while for days where HDD and CDD were below 2 and 1, respectively, they were not considered. The main purpose of HDD and CDD is to quantify the demand for energy needed to heat or cool a building. For the analysed period of one year, a total of 238 days for heating and 95 days for cooling were considered. Additionally, average daily HDD (
Figure 8) and CDD (
Figure 9) were considered for each month, meaning that daily energy consumption variations were calculated.
For the purpose of converting the average daily consumption of flexibility assets into the engaged power (kW), it is assumed that the heating system is active for td,heating = 17 (h/d), mainly from 06:00 to 23:00, as a normative used for calculations in the HRN EN ISO 13790 norm for residential buildings with non-continuous operation. Although 17 daily active hours for a heating system may seem to be a high number, it should be noted that normative values for determining the annual heating energy demand QH,nd annual of the building were used to perform building energy performance categorisation. This part of the calculation should therefore correspond to the previous steps. Moreover, building occupants were consulted to estimate the active hours of heating, and it could be deduced that if occupants are present on their premises, these hours correlate with the norm. Nevertheless, if heating hours are reduced because of occupancy factors, users with heating pumps and thermostats tend to pre-heat the building and consume more energy. These periods are not eligible for flexibility activation to achieve energy savings, as they directly affect user comfort, which should be a priority. For cooling, on the other hand, the norm imputes td,cooling = 24 h for systems with continuous operation and td,cooling = 17 (h/per day) for systems with non-continuous operation, where the latter was used for consumers with a cooling system. With these normative active hours, a very conservative baseline was obtained, but the positive impact is that flexibility activation would minimise the effect on user comfort.
A moderate decrease of 10% in power was used to define baseline flexibility. Obviously, daily occupancy is an imperative factor for activating a DR event; thus, occupancy constraints are presented here as a possibility to allow daily repetitions of a DR event. Therefore, several scenarios were considered. Likewise, the presence of PV could lead to self-consumption prioritisation and a higher level of awareness of building occupants in terms of energy savings [
44]. In this case, an associated correction for DR event activation was made.
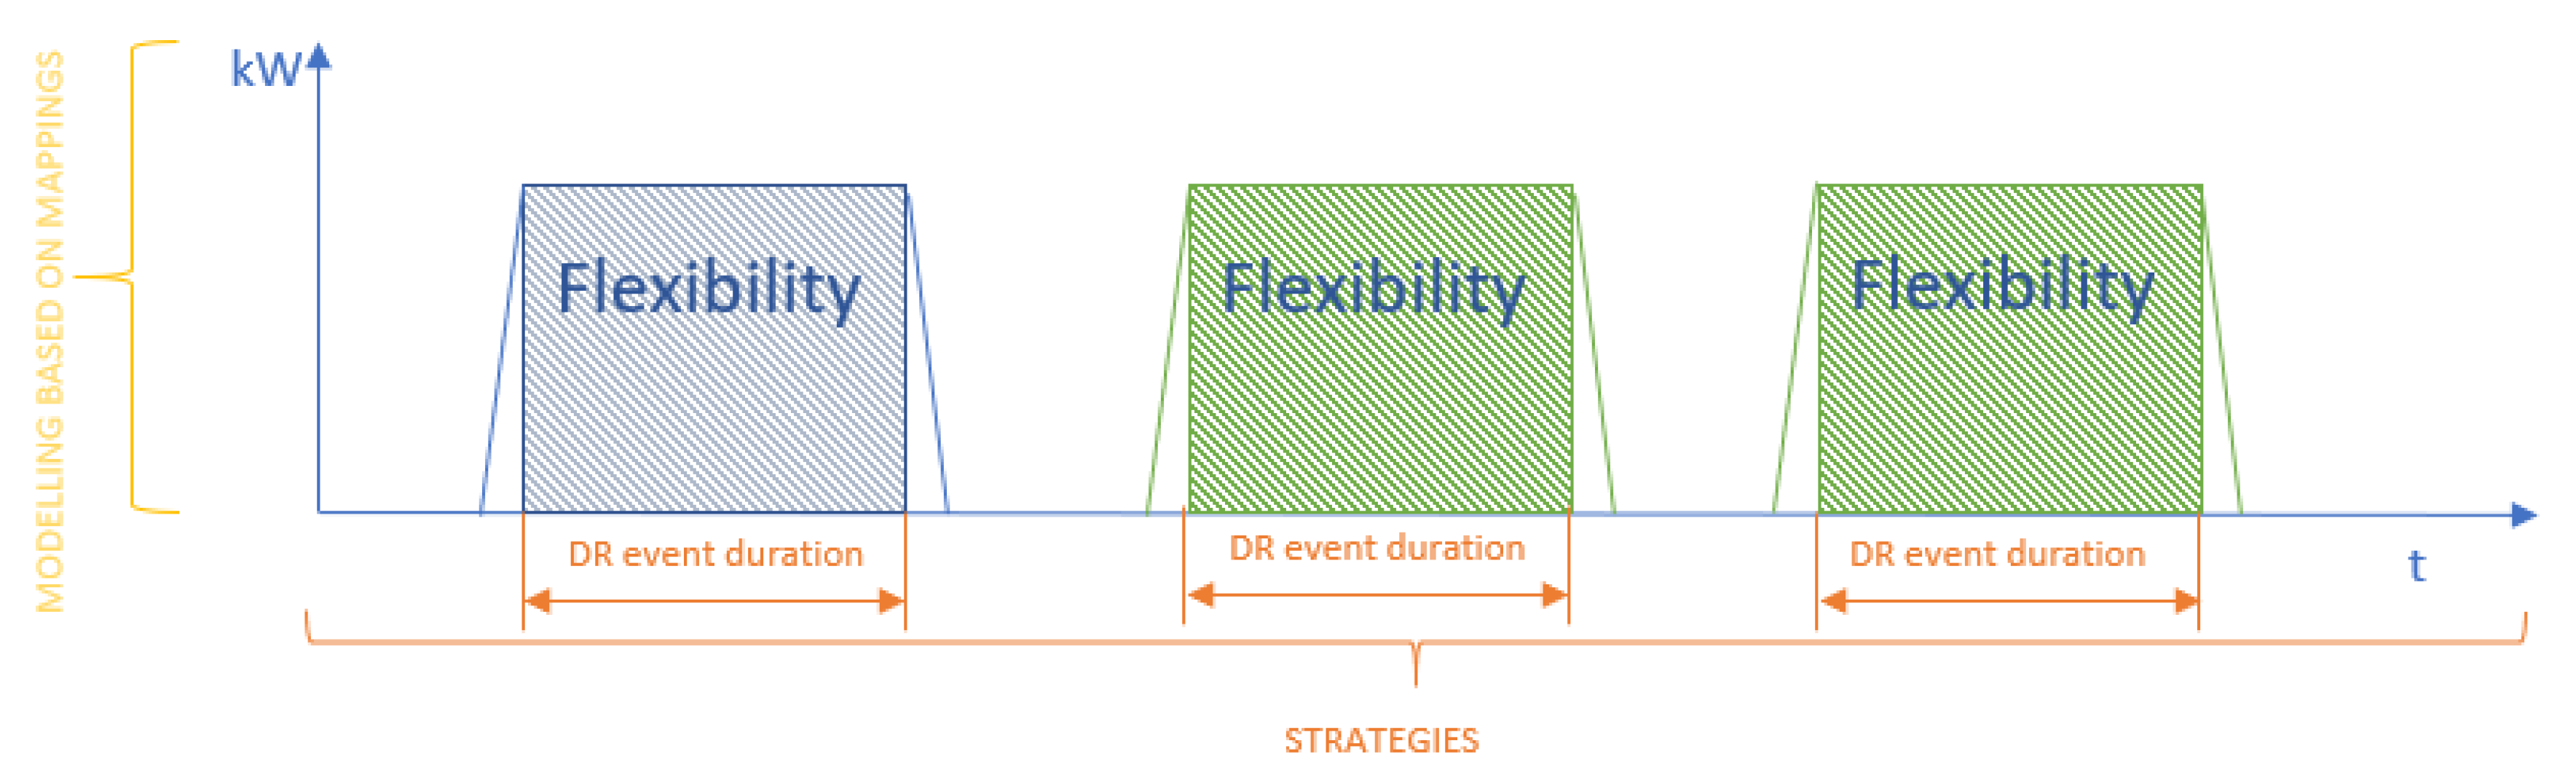
Engaged capacities were modelled according to the available flexibility assets, whilst activation strategies, in terms of event duration and repetitions, were set as a function of building energy performance characteristics and behavioural and occupancy limitations, along with the presence of PV. The duration of a flexibility (DR) event was considered a function of building energy performance characteristics, and consequently, flexibility event activation strategies were applied. As shown in
Figure 10, the
y-axis represents the calculated baseline load, while the
x-axis represents the time engaged in a DR event. The duration of a flexibility event is subject to strategies directed towards maximising the savings obtained from flexibility per calculated engaged capacity.
The final part of activation strategies is related to occupancy and behavioural constraints, which are presented in the form of DR event repetitions. Once the DR event duration has been calculated (
Figure 10), the next step is to assess its daily repetition possibilities (
Figure 11) for achieving additional energy savings. As part of the activation strategies, it was considered that daily repetition activation scenarios are dependent on seasonal limitations, occupant presence, and behavioural factors related to the existence of PV. It is expected that PV owners tend to increase self-consumption when PV is producing energy, which was also considered in the applied activation scenarios.
6. Discussion
This work involves two different levels of assessments. The first assessment is related to the definition of baseline consumption for heating and cooling, which entails the mapping of existent energy consumption data to households with limited data. The second assessment considers aggregator flexibility based on the existing portfolio of users. Different energy consumption patterns for heating and cooling were assessed. When making this assumption, HDD and CDD are used, allowing a more accurate assumption of the heating and cooling demand to be made compared to a simple average daily or monthly temperature. This is particularly evident in the months of December and February, where the average temperature is the same, but heating energy demand is more prominent in February due to more temperature variations. Whilst automated heating systems powered by heat pumps provide more consistent consumption, the system usually activates as the room temperature drops below a selected setpoint. Cooling is much more inconsistent, especially when considering decentralised air-conditioning units and lower occupancy of household premises during summer months. Building and user classification is more accurate when analysing heating flexibility performance, since the correlation between building performance and heating consumption is obvious. On the contrary, the uncertainty of the assessment is more prevalent during cooling months, especially when considering solely decentralised AC units as the flexibility provider.
This exercise mostly relies on baseline energy modelling and energy demand parameters that are usually used for building energy demand calculations. Probabilistic load models commonly applied for households, such as a Monte Carlo simulation [
46], are useful to determine the outcome and the likelihood of certain events when aggregated or certain load profile data exist, and hence, variables and constraints can be directly set.
The modelling proposed in this paper is not aimed at a more precise extrapolation of a single load profile. On the contrary, the principal goal of the proposed method is to utilise a limited dataset to extract a conservative estimate of average power engaged by flexibility assets. The estimated value of the power engaged for cooling on a specific day is shown in
Figure 18, where the estimate from the proposed method is compared with the actual values in a house recorded with real-time measurement equipment. In the depicted case, the heat pump operates continuously, and the impact on user comfort should remain minimal if flexibility activation is applied.
Recent work in [
47] explored the uncertainty in aggregated energy flexibility in high-rise residential building clusters using a data-driven stochastic model. This captures the stochasticity of occupancy patterns using the Markov chain Monte Carlo occupancy model combined with the TRNSYS simulation tool building thermal model. Such data-driven building energy performance modelling requires the existence of detailed data on the building envelope and installed systems (HVAC, AC, etc.). Even if this approach is not applicable to numerous single-family detached buildings because of the lack of such data, the results from [
47] positively demonstrate that energy flexibility estimates for a cluster of buildings are more reliable than those for a single building, which is in line with the main postulates of this paper. However, the model in [
47] does not consider the behavioural parameters related to the presence of PV, which could implicitly put some constraints on flexibility asset activation, as shown in this paper.
Households that use centralised heat pumps for cooling are considered to be a more adequate and reliable provider for delivering flexibility. On the other hand, the assessment of baseline consumption for households with decentralised AC systems is more susceptible to uncertainties [
32]; thus, their performance in delivering flexibility is more inconsistent. To assess cooling patterns in households, more research is needed to properly assess their flexibility potential, and building up an aggregator use case for these could be questionable. The work in [
48] demonstrated the capability of AC and hot water heaters to ensure community-level control strategies for distribution voltage regulations dedicated to residential consumers. Obviously, this is not in conflict with the results reported in this paper and could lead to the conclusion that thermostatically controllable loads of residential consumers can offer both energy savings and flexibility services to distribution system operators.
Since this paper proposes a novel business model for a local aggregator or an energy community, a fair system of rewards achieved in such an energy savings programme could be the focus of future research. It should be noted that the peer-to-peer (P2P) trading mechanism [
49], usually applied for renewable energy trading within a community, is not applicable in the particular case of energy savings. The results obtained using the methodology proposed in this research could open a path for future works to develop performance indicators (KPIs) for dedicated energy savings remuneration. These KPIs should be based on mappings to define the baseline flexibility of a given portfolio of household consumers and therefore quantify savings, flexibility, or both. This could facilitate novel energy performance contract (EPC) savings calculations [
50], as measurement and verification techniques usually imply programme settlement as well as impact estimates.
7. Conclusions
As the unavailability of historical consumption data and the absence of real-time data are common issues when assessing the flexibility potential of household consumers, holistic methods that combine surveyed data and publicly available data are often a priority. From an aggregator perspective, the availability of data for defining flexibility profiles of amalgamated assets is an initial step for analysing its portfolio. Moreover, as consumers are becoming much more aware of data privacy and ownership issues, data availability could be a critical problem. Based on the experiences from this case study, when performing a survey, a specific set of questions needs to be directed towards obtaining the desired information—e.g., it is not sufficient to ask whether a surveyed user has a heat pump: the question should ask if it is the primary source of heating or if another source is usually used for that purpose; otherwise, wrong conclusions can be made. For this reason, mapping methods capable of assessing residential energy consumers’ flexibility potential using surveyed and historical (at least monthly) energy consumption data could be very important for aspirational flexibility aggregators.
This paper primarily focusses on the aggregator as a provider of energy savings services, which is still an unexplored approach, unlike the use of an aggregator as an ancillary service provider or energy market participant. From the illustrated results, it can be deduced that energy savings can be achieved from such programmes with a very conservative load reduction of 10% per specific flexibility asset. The proposed savings consider only the flexibility potential of heating and cooling systems in residential buildings and respect the additional limits coming from the building energy performance tied with occupancy and behavioural constraints. With such an approach, individual flexibility activation may not yield significant savings. However, if such granular permanent savings are aggregated and properly identified, this could create novel business opportunities for a local energy savings aggregator.
Moreover, the novelty of this approach is that with limited data available on building energy performance, the proposed method takes into account the thermal inertia of buildings in flexibility calculations by properly combining qualitative and quantitative data retrieved from the survey.
Energy efficiency obligation schemes in Europe, reported in Article 7 of the EED [
6], set an obligation for energy companies (such as suppliers/retailers) to achieve energy savings targets [
51]. Obliged parties and modalities for energy savings purchasing from third parties are defined in national regulations. If savings obtained from flexibility activation can be aggregated and properly verified, monitored, and purchased, this could create new business opportunities for a local permanent savings aggregator. This would be additionally facilitated by explicit demand response and information communication technologies that are able to support the verification of curtailment and signal identification, extending the possible scope of aggregation business.
Nevertheless, it needs to be considered that offering energy savings programmes through local aggregators, as part of a flexibility service, creates more awareness of their benefits as consumers become more aware of the energy costs and impacts of energy use. Accordingly, participation in such energy savings programmes offered by local aggregators could create implicit energy savings for local communities by virtue of behavioural changes with regard to energy consumption.


