
Emission Characteristics of Polychlorinated Dibenzo-p-Dioxins/Dibenzofurans (PCDD/DFs) in Commercial Bio-SRF and SRF Incineration Plants


Abstract
:1. Introduction
2. Experimental Section
2.1. Incineration Plants
2.2. Materials and Methods
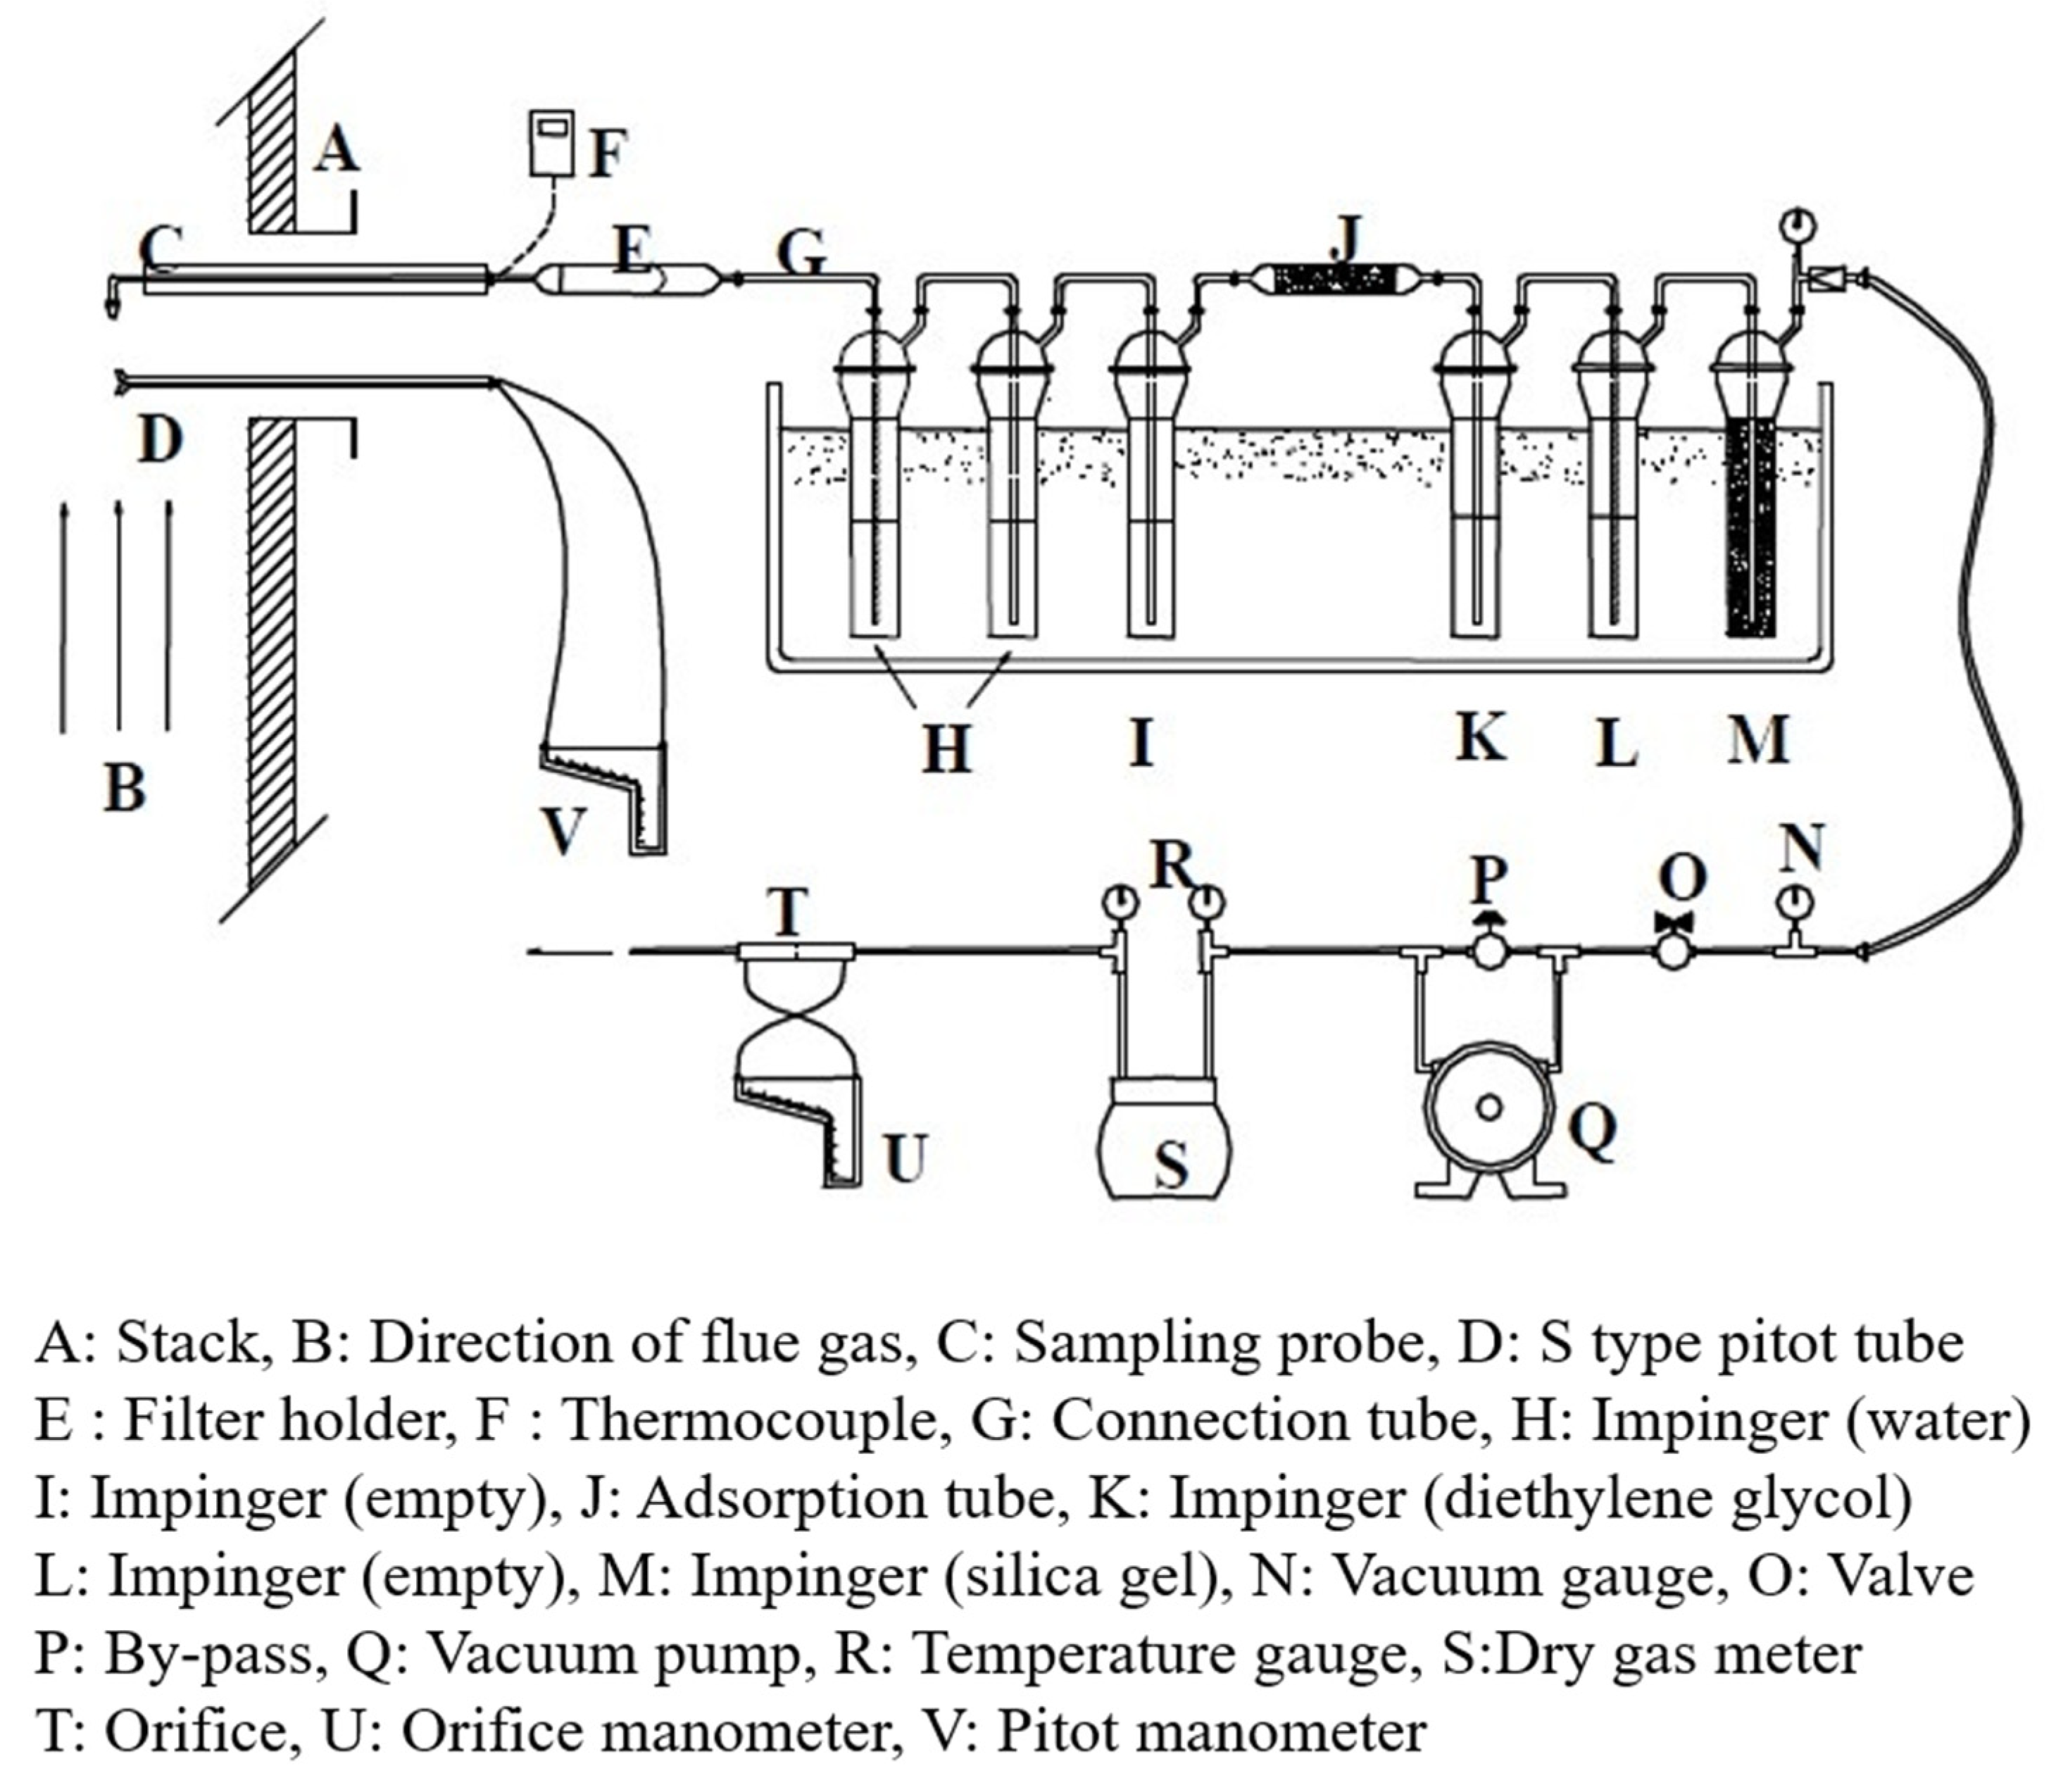
2.2.1. Sampling Method
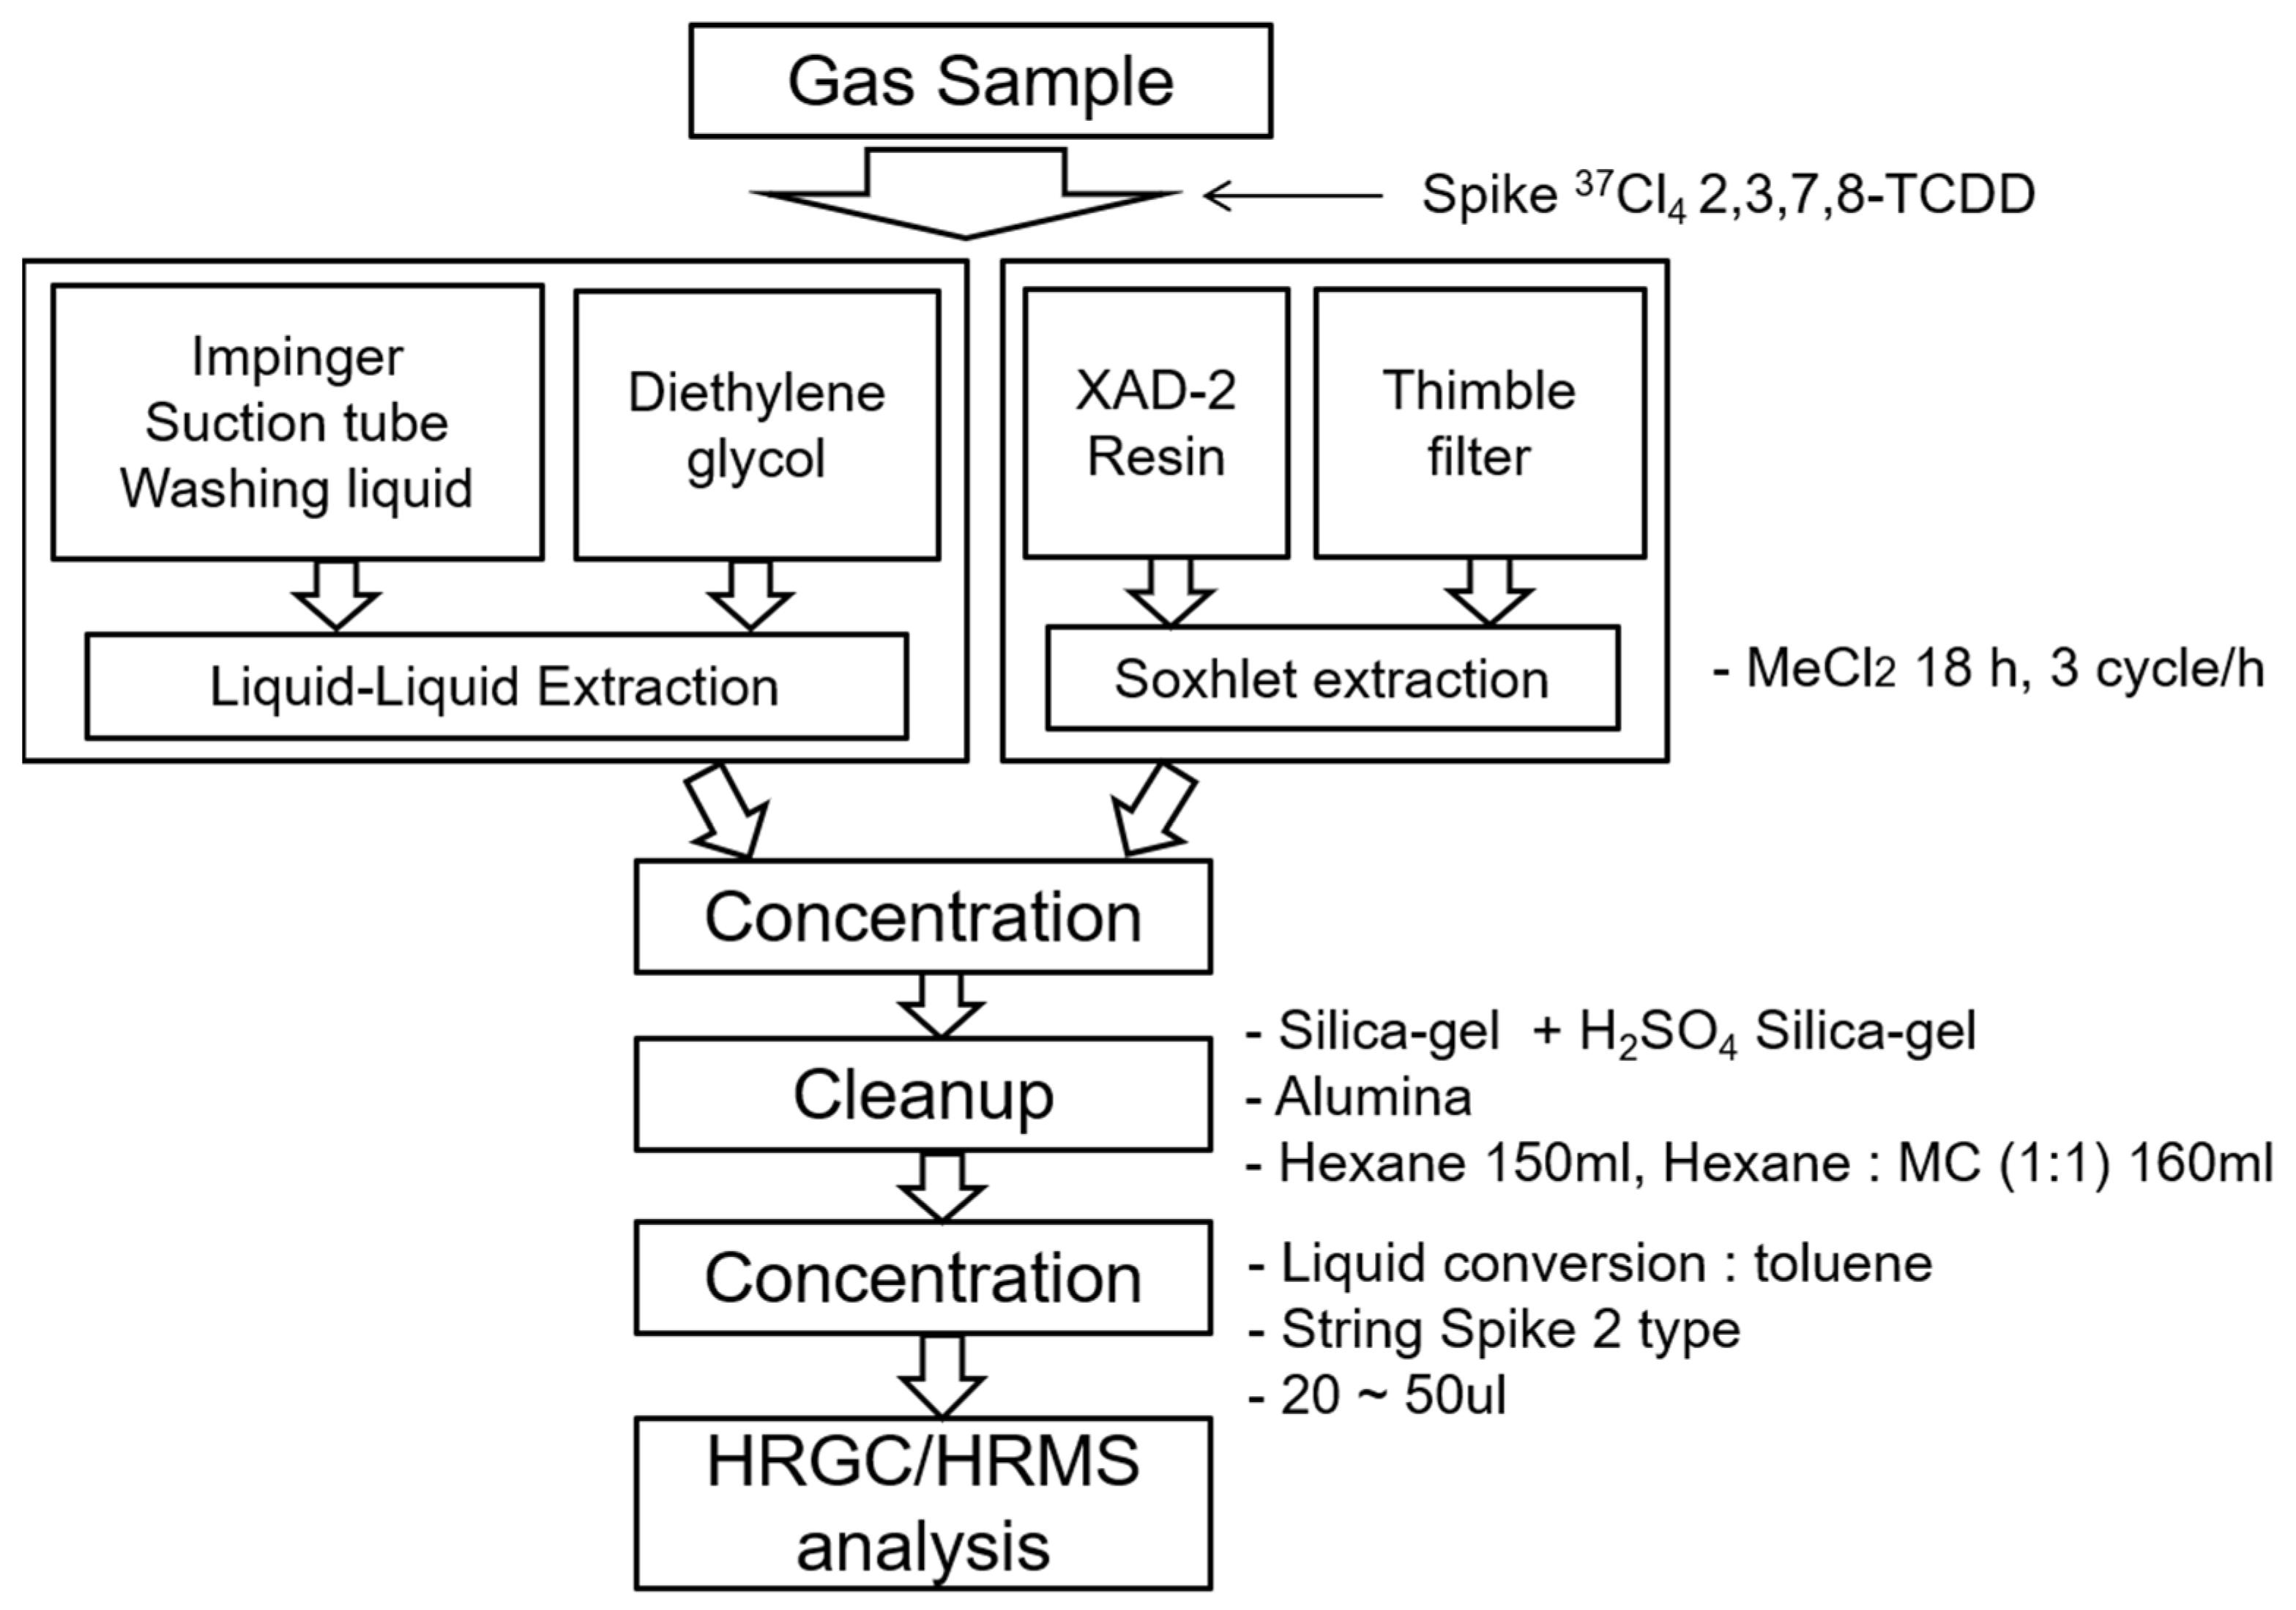
2.2.2. Processing for PCDD/DFs Analysis
3. Results
3.1. Emission Characteristics of Air Pollutants
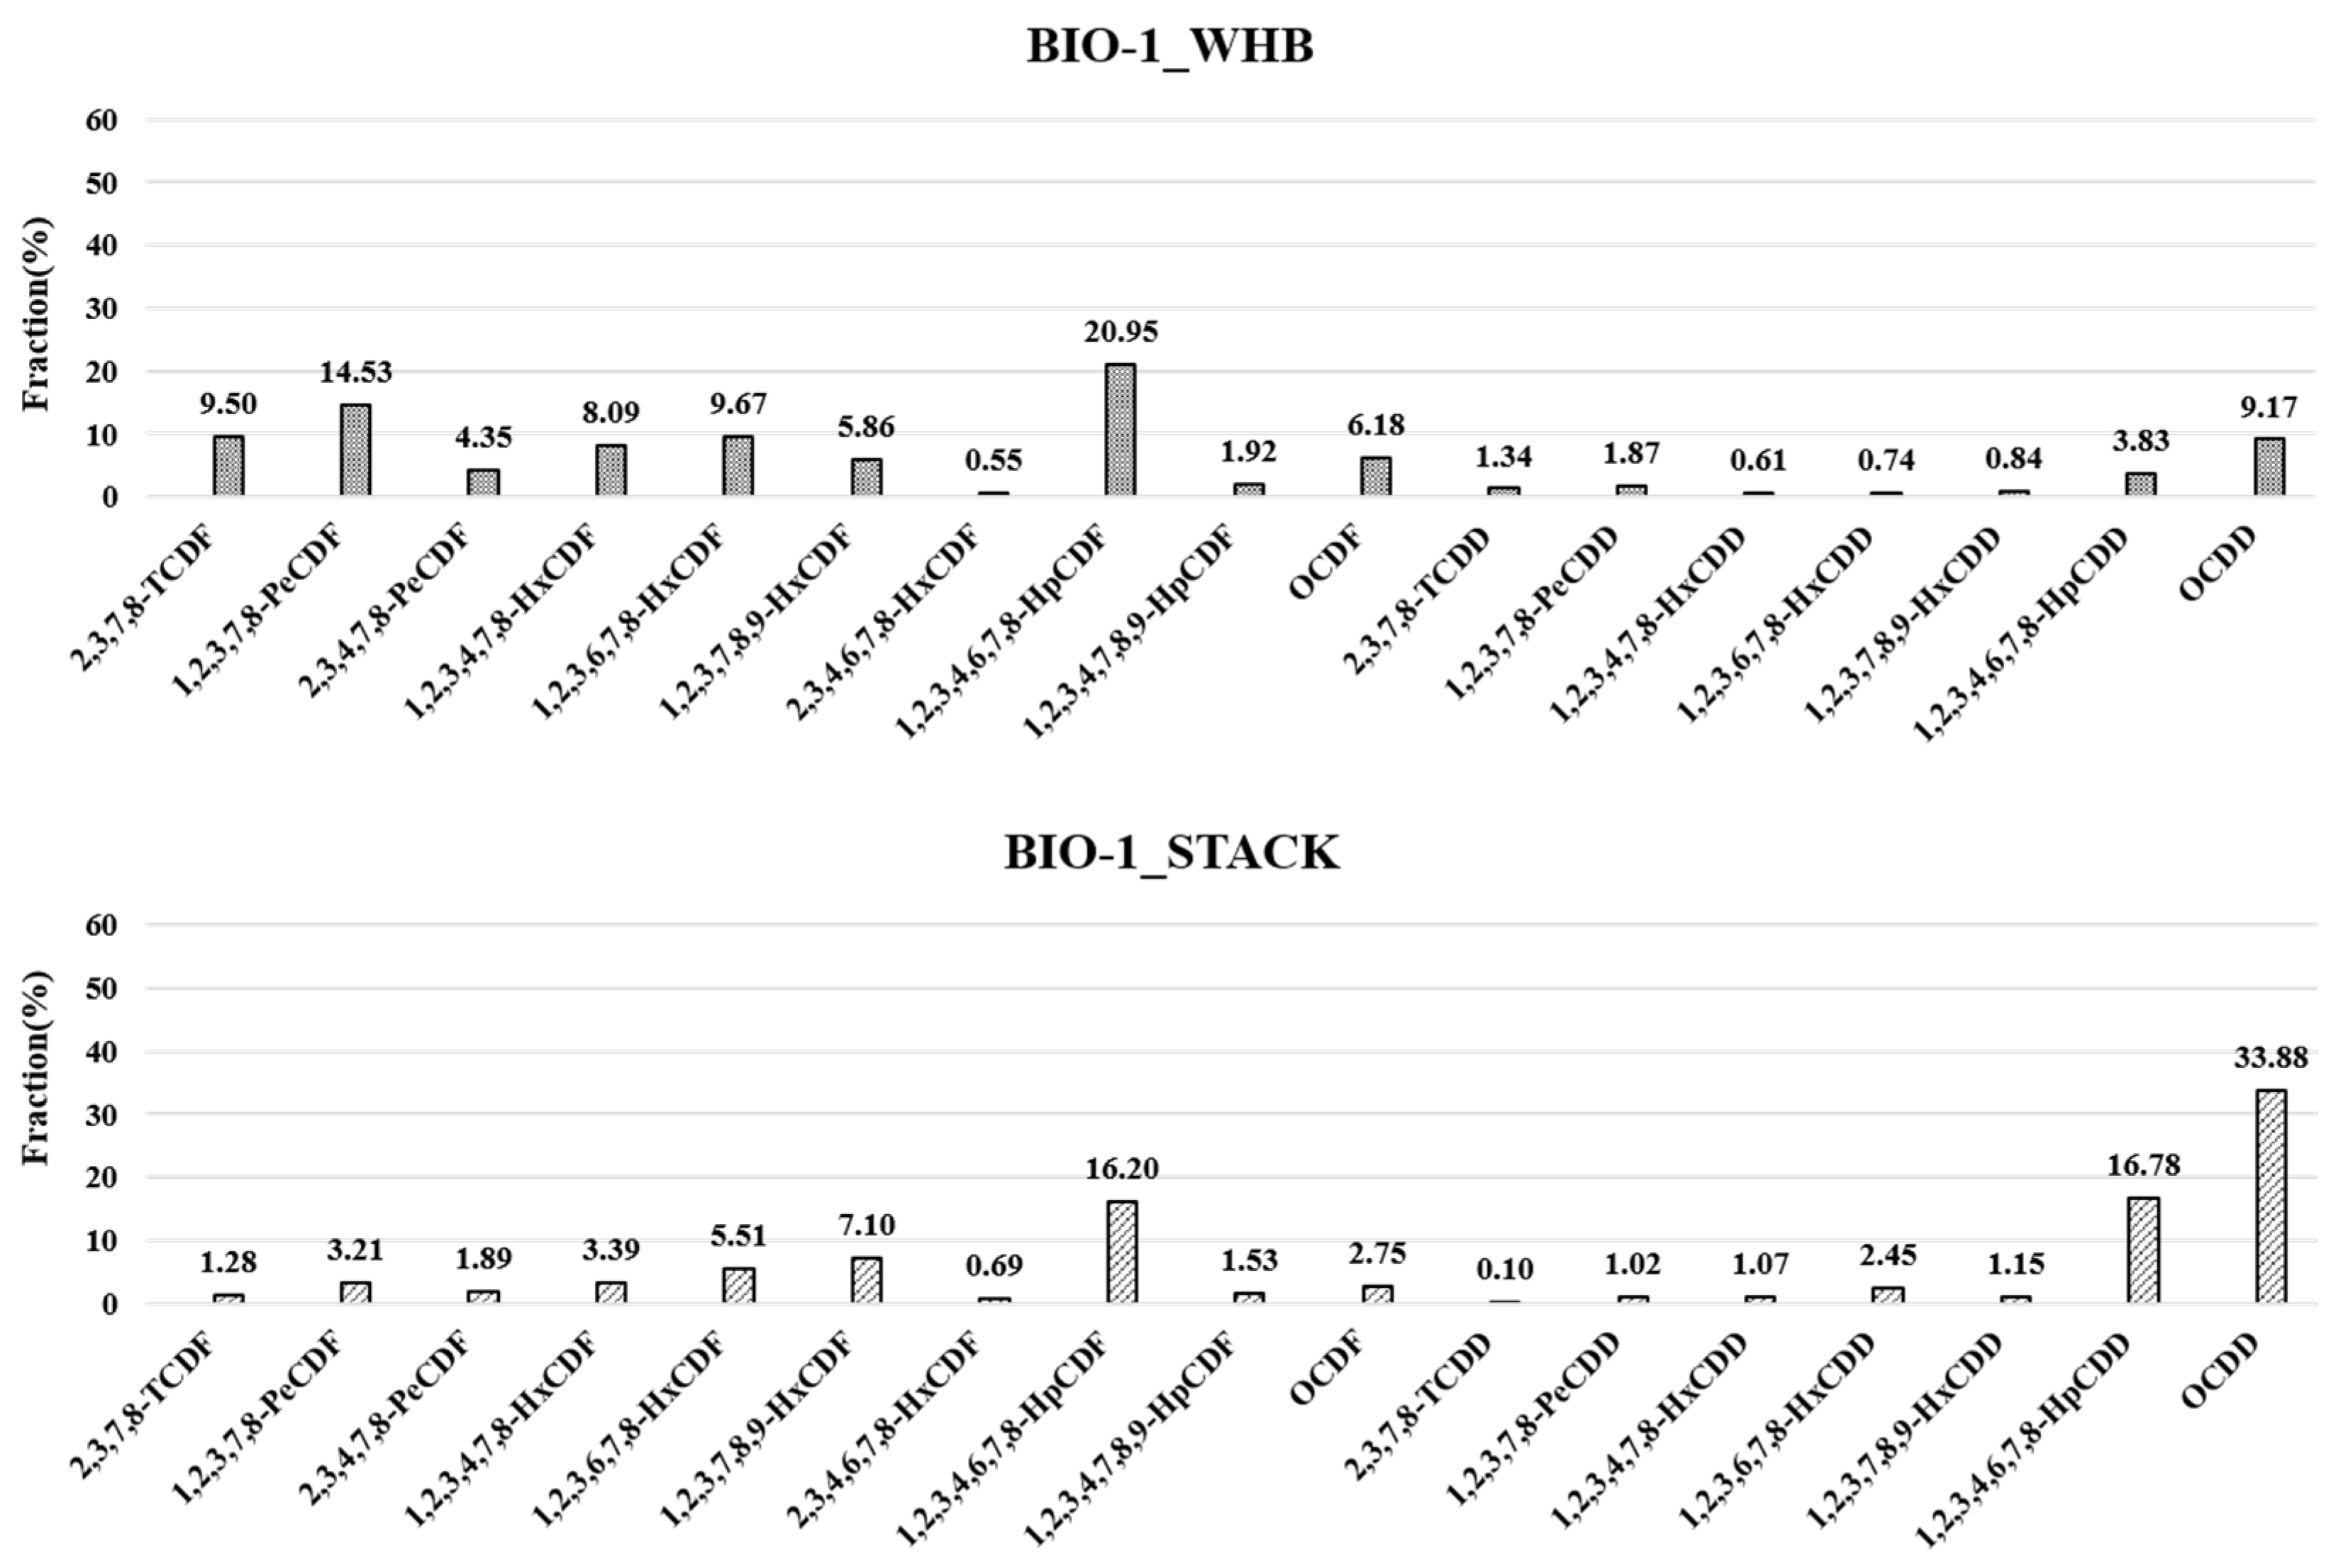
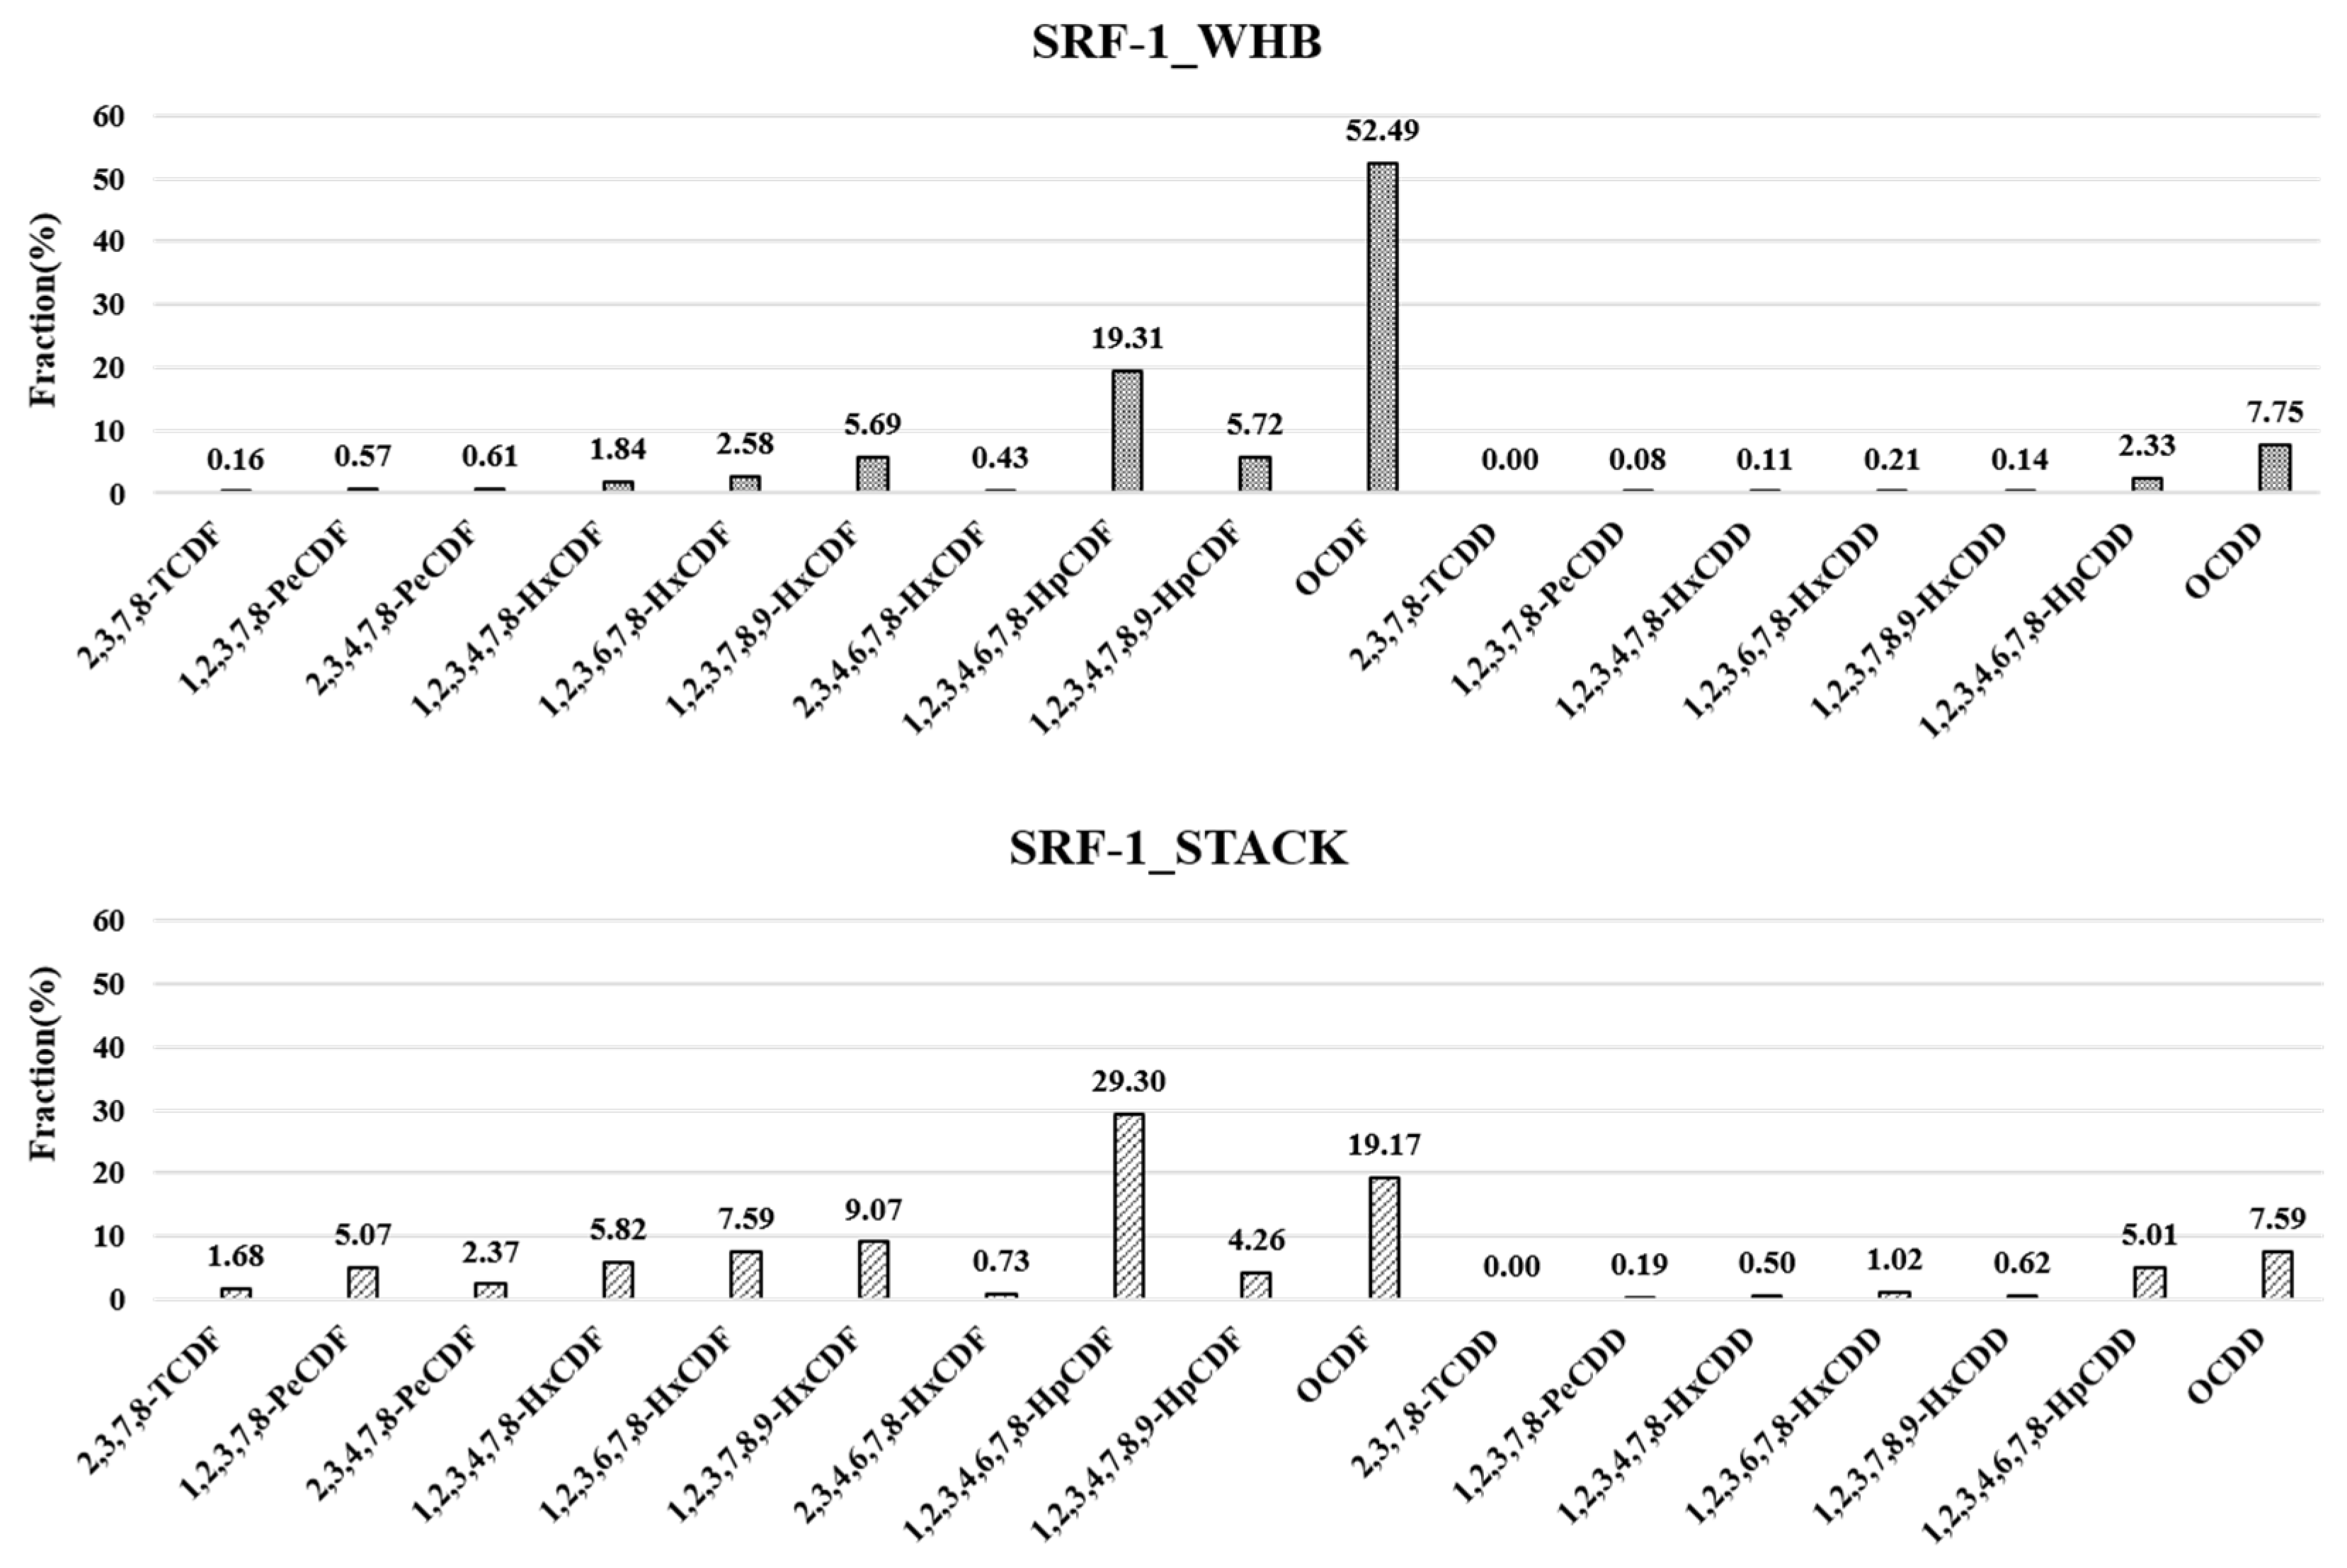
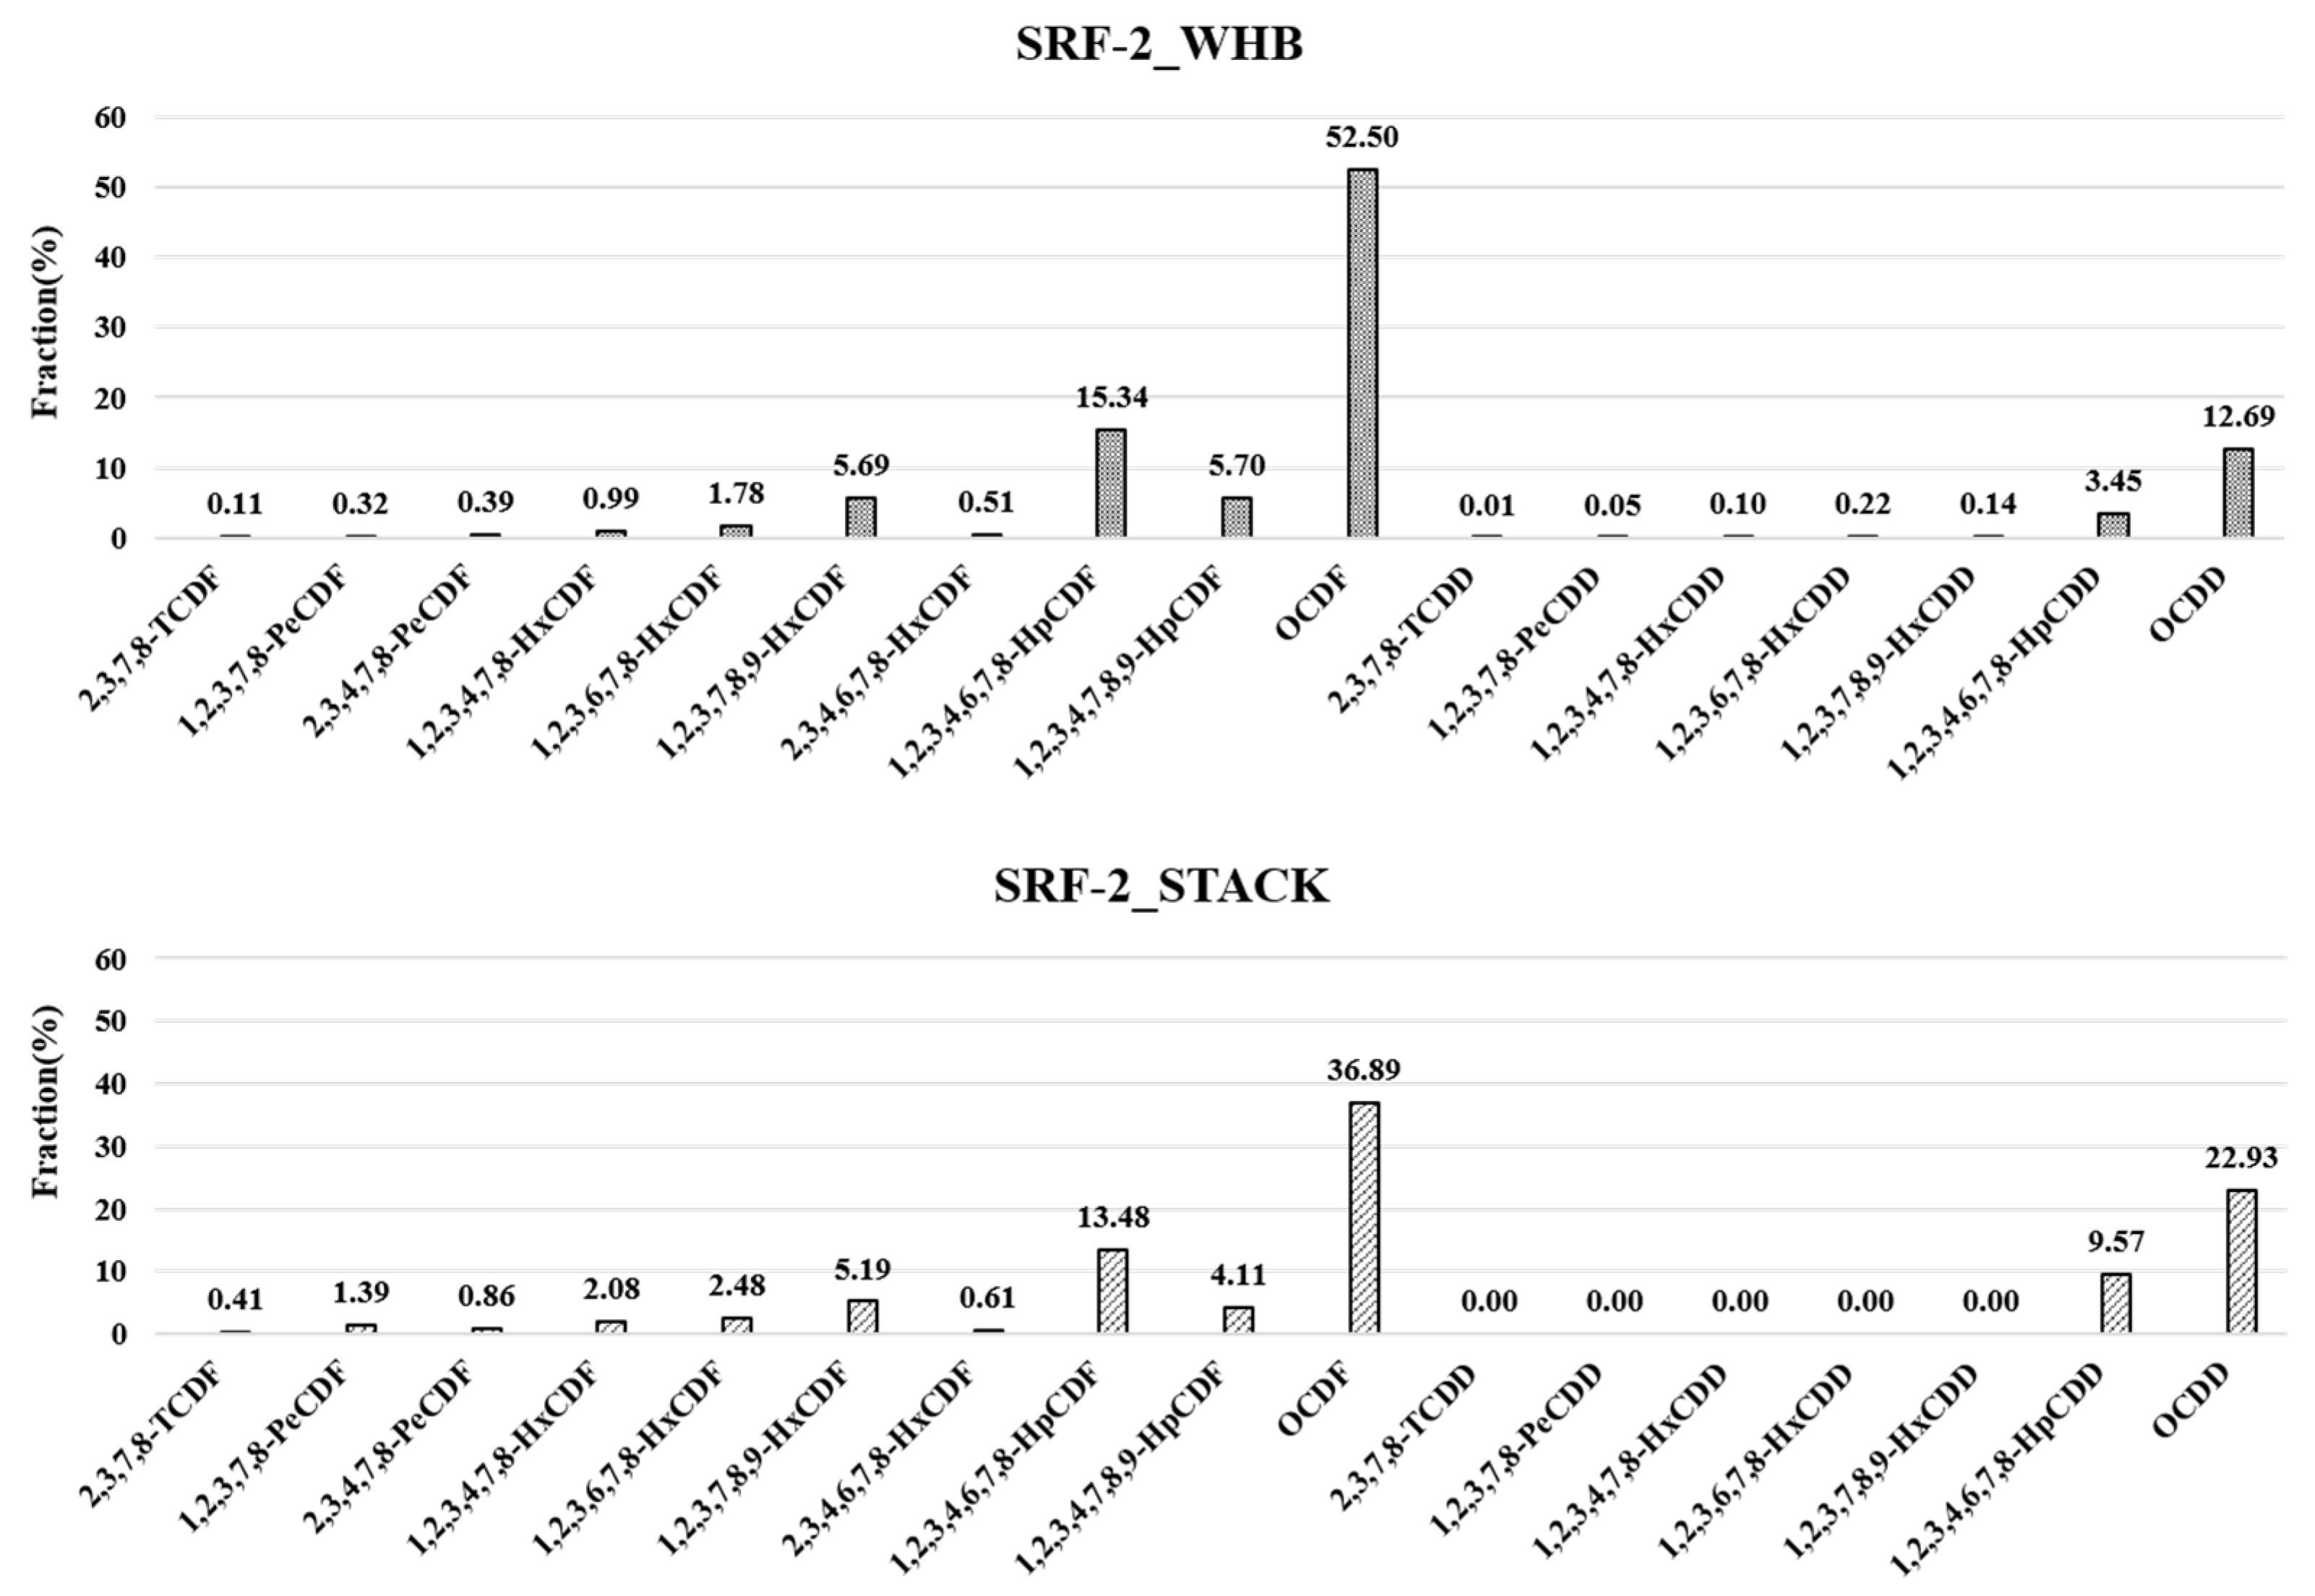
3.2. Concentration and Congener Pattern of Dioxin Emission in Incineration Plants
3.3. Reduction Rate of PCDD/DFs Congener Concentration in WHB and Stack
4. Conclusions
Author Contributions
Funding
Institutional Review Board Statement
Informed Consent Statement
Data Availability Statement
Conflicts of Interest
References
- Rada, E.C.; Ragazzi, M. Selective collection as a pretreatment for indirect solid recovered fuel generation. Waste Manag. 2014, 34, 291–297. [Google Scholar] [CrossRef] [PubMed]
- Białowiec, A.; Pulka, J.; Stępień, P.; Manczarski, P.; Gołaszewski, J. The RDF/SRF torrefaction: An effect of temperature on characterization of the product-Carbonized Refuse Derived Fuel. Waste Manag. 2017, 70, 91–100. [Google Scholar] [CrossRef]
- Garg, A.; Smith, R.; Hill, D.; Longhurst, P.J.; Pollard, S.J.T.; Simms, N.J. An integrated appraisal of energy recovery options in the United Kingdom using solid recovered fuel derived from municipal solid waste. Waste Manag. 2009, 29, 2289–2297. [Google Scholar] [CrossRef] [PubMed]
- Korea Environment Corporation. Status of Manufacturing, Usage, Import of SRF. Available online: https://www.srf-info.or.kr/lbry/lbryDtlR.do (accessed on 7 March 2022).
- Kogevinas, M. Human health effects of dioxins: Cancer, reproductive and endocrine system effects. Hum. Reprod. Update 2001, 7, 331–339. [Google Scholar] [CrossRef] [PubMed]
- Tuomisto, J.; Tuomisto, J.T. Is the fear of dioxin cancer more harmful than dioxin? Toxicol. Lett. 2012, 210, 338–344. [Google Scholar] [CrossRef]
- Huang, Y.Q.; Lu, J.W.; Xie, Y.S.; Hong, C.Y.; Shi, L.Z.; Hai, J. Process tracing of PCDD/Fs from economizer to APCDs during solid waste incineration: Re-formation and transformation mechanisms. Waste Manag. 2021, 120, 839–847. [Google Scholar] [CrossRef] [PubMed]
- Chen, Z.L.; Zhang, S.; Lin, X.Q.; Li, X.D. Decomposition and reformation pathways of PCDD/Fs during thermal treatment of municipal solid waste incineration fly ash. J. Hazard. Mater. 2020, 394, 122526. [Google Scholar] [CrossRef] [PubMed]
- Weidemann, E.; Marklund, S.; Bristav, H.; Lundin, L. In-filter PCDF and PCDD formation at low temperature during MSWI combustion. Chemosphere 2014, 102, 12–17. [Google Scholar] [CrossRef] [PubMed]
- Ma, Y.F.; Lin, X.Q.; Chen, Z.L.; Li, X.D.; Lu, S.Y.; Yan, J.H. Influence factors and mass balance of memory effect on PCDD/F emissions from the full-scale municipal solid waste incineration in China. Chemosphere 2020, 239, 124614. [Google Scholar] [CrossRef] [PubMed]
- Palmer, D.; Pou, J.O.; Gonzalez-Sabaté, L.; Díaz-Ferrero, J.; Conesa, J.A.; Ortuño, N. New models used to determine the dioxins total amount and toxicity (TEQ) in atmospheric emissions from thermal processes. Energies 2019, 12, 4434. [Google Scholar] [CrossRef] [Green Version]
- Wei, J.X.; Li, H.; Liu, J.G. Phase distribution of PCDD/Fs in flue gas from municipal solid waste incinerator with ultra-low emission control in China. Chemosphere 2021, 276, 130166. [Google Scholar] [CrossRef] [PubMed]
- Kim, S.J.; Park, S.Y.; Choi, S.P.; Lee, D.S. PCDD/Fs levels and congener pattern characteristics in stack gas and fly ash from waste incinerators environmental media, food, and human tissues: An overview. J. Environ. Toxicol. 2004, 19, 1–24. [Google Scholar]
- Kim, M.H.; Song, H.S. Characteristics of second blower efficiency for reduction of oxygen concentration of MSWI. In Proceedings of the KSWM’s 30th Anniversary Celebration Conference, Jeju, Korea, 14–16 November 2013. [Google Scholar]
- Son, J.I.; Kim, K.H.; Hong, Y.H. A study on the characteristics of combustion in plant using SRF (Solid Refused Fuel) by waste plastics. J. Korea Soc. Waste Manag. 2014, 31, 480–486. [Google Scholar] [CrossRef]
- Asghar, U.; Rafiq, S.; Anwar, A.; Iqbal, T.; Ahmed, A.; Jamil, F.; Khurram, M.S.; Akbar, M.M.; Farooq, A.; Shah, N.S.; et al. Review on the progress in emission control technologies for the abatement of CO2, SOx and NOx from fuel combustion. J. Environ. Chem. Eng. 2021, 9, 106064. [Google Scholar] [CrossRef]
- Korean Law Information Center. Persistent Organic Pollutants Control Act. Available online: https://www.law.go.kr/LSW/eng/engLsSc.do?menuId=2§ion=lawNm&query=persistent&x=0&y=0#liBgcolor0 (accessed on 8 March 2022).
- Cheruiyot, N.K.; Wang, L.C.; Lin, S.L.; Yang, H.H.; Chen, Y.T. Effects of selective catalytic reduction on the emissions of persistent organic pollutants from a heavy-duty diesel engine. Aerosol Air Qual. Res. 2017, 17, 1658–1665. [Google Scholar] [CrossRef] [Green Version]
- Karasek, F.W.; Dickson, L.C. Model studies of polychlorinated dibenzo-p-dioxin formation during municipal refuse incineration. Science 1987, 237, 754–756. [Google Scholar] [CrossRef] [PubMed]
- Yoon, Y.W.; Son, J.H.; Kwon, Y.H.; Kang, J.G.; Shin, S.K.; Jeon, T.W. PCDDs/DFs emissions and congener distribution of municipal solid waste incinerators. J. Korea Soc. Waste Manag. 2017, 34, 737–743. [Google Scholar] [CrossRef]


| Fuel Type | Plant | Capacity | Feedstocks | Incinerator | Air Pollutant Control Device |
|---|---|---|---|---|---|
| Bio-SRF | Bio-1 | 31.1 ton/h | Fluff | Fluidized bed | SNCR-SDR-B/F-SCR |
| Bio-2 | 45.8 ton/h | Fluff + Pellet | Fluidized bed | SNCR-DR-B/F-SCR | |
| Bio-3 | 24.5 ton/h | Fluff | Fluidized bed | SNCR-DR-AC-B/F | |
| SRF | SRF-1 | 2 ton/h | Fluff + Pellet | Stoker | SNCR-SDR-DR-B/F-SCR |
| SRF-2 | 3.8 ton/h | Fluff | Stoker | SNCR-SDR-B/F-SCR | |
| SRF-3 | 6.7 ton/h | Pellet | Fluidized bed | SNCR-DR-B/F-AC | |
| SRF-4 | 5.8 ton/h | Fluff | Fluidized bed | SNCR-SDR-AC-Dry Venturi-B/F |
| Addition Point | PCDD | PCDF |
|---|---|---|
| Before pretreatment | 37Cl4-2,3,7,8-TCDD | |
| After the extraction | 13C12-2,3,7,8-TCDD | 13C12-2,3,7,8-TCDF |
| 13C12-1,2,3,7,8-PeCDD | 13C12-1,2,3,7,8-PeCDF | |
| 13C12-1,2,3,4,7,8-HxCDD | 13C12-2,3,4,7,8-PeCDF | |
| 13C12-1,2,3,6,7,8-HxCDD | 13C12-1,2,3,4,7,8-HxCDF | |
| 13C12-1,2,3,4,6,7,8-HpCDD | 13C12-1,2,3,6,7,8-HxCDF | |
| 13C12-OCDD | 13C12-2,3,4,6,7,8-HxCDF | |
| 13C12-1,2,3,4,6,7,8-HpCDF | ||
| 13C12-1,2,3,4,7,8,9-HpCDF | ||
| Before HRGC/HRMS analysis | 13C12-1,2,3,4-TCDD | |
| 13C12-1,2,3,7,8,9-HxCDD |
| Instrument | Condition | |
|---|---|---|
| HRGC | Capillary column | SP-2331 (60 m × 0.32 mm × 0.20 μm) |
| Oven temp. | 120 °C (1 min)→20 °C/min→220 °C→2 °C/min→265 °C (20 min) | |
| Inlet temp. | 260 °C | |
| Injection mode | Splitless (injection volume 1 μL) | |
| Carrier gas | He (99.9999%) | |
| Flow rate | 1 mL/min | |
| HRMS | Ionization | EI mode (electron ionization) |
| Measuring | SIM mode (selected ion monitoring) | |
| Chamber Temp | 270 °C | |
| Interface Temp | 260 °C | |
| Ionization Energy | 38 eV | |
| Ionizing current | 600~700 μA | |
| O2 [%] | CO [ppm (12)] | CO2 [%] | NOx [ppm (12)] | SOx [ppm (12)] | |||||||
|---|---|---|---|---|---|---|---|---|---|---|---|
| WHB | Stack | WHB | Stack | WHB | Stack | WHB | Stack | WHB | Stack | ||
| National regulation | - | - | - | 50 | - | 50 | - | 70 | - | 30 | |
| Bio-SRF | Bio-1 | 4.9 | 6.3 | 1.1 | 0.9 | 11.9 | 10.8 | 47.5 | 18.6 | 0.0 | 0.0 |
| Bio-2 | 3.5 | 3.6 | 4.9 | 4.8 | 13.0 | 12.7 | 10.1 | 9.9 | 0.0 | 0.0 | |
| Bio-3 | 4.6 | 5.3 | 2.4 | 2.4 | 12.2 | 11.5 | 21.8 | 21.7 | 0.0 | 0.0 | |
| SRF | SRF-1 | 12.0 | 13.0 | 15.6 | 15.0 | 6.6 | 5.8 | 13.3 | 13.1 | 0.1 | 0.0 |
| SRF-2 | 10.5 | 11.2 | 16.5 | 16.3 | 7.8 | 7.2 | 50.2 | 1.6 | 0.5 | 0.3 | |
| SRF-3 | 6.2 | 7.3 | 0.3 | 0.3 | 11.0 | 10.0 | 26.2 | 26.0 | 0.1 | 0.1 | |
| SRF-4 | 8.8 | 9.6 | 3.5 | 3.4 | 9.0 | 8.3 | 14.9 | 14.6 | 0.1 | 0.1 | |
| Average | 7.21 | 8.04 | 6.33 | 6.16 | 10.21 | 9.47 | 26.29 | 15.07 | 0.11 | 0.07 | |
| WHB | Stack | ||||||
|---|---|---|---|---|---|---|---|
| PCDD | PCDF | PCDD/DFs | PCDD | PCDF | PCDD/DFs | ||
| Bio-SRF | Bio-1 | 0.1132 | 0.2895 | 0.4027 | 0.0055 | 0.0135 | 0.0190 |
| Bio-2 | 0.0051 | 0.0167 | 0.0218 | - | 0.0004 | 0.0004 | |
| Bio-3 | 0.0815 | 0.1356 | 0.2171 | 0.0013 | 0.0039 | 0.0052 | |
| SRF | SRF-1 | 0.0593 | 0.8798 | 0.9391 | 0.0051 | 0.0582 | 0.0633 |
| SRF-2 | 0.8013 | 8.6662 | 9.4675 | 0.0001 | 0.0025 | 0.0026 | |
| SRF-3 | 0.0565 | 0.2824 | 0.3389 | 0.0001 | 0.0013 | 0.0014 | |
| SRF-4 | 0.0960 | 0.7132 | 0.8092 | 0.0227 | 0.0282 | 0.0509 | |
| Average | 0.1733 | 1.5691 | 1.7423 | 0.0050 | 0.0154 | 0.0204 | |
| Congener | PCDD/DFs Reduction Rate (%) | ||||||
|---|---|---|---|---|---|---|---|
| Bio-1 | Bio-2 | Bio-3 | SRF-1 | SRF-2 | SRF-3 | SRF-4 | |
| 2,3,7,8-TCDF | 98.82 | 97.95 | 99.43 | 74.96 | 99.92 | 99.66 | 91.74 |
| 1,2,3,7,8-PeCDF | 98.05 | 98.68 | 97.41 | 79.29 | 99.91 | 99.71 | 82.04 |
| 2,3,4,7,8-PeCDF | 96.17 | 97.77 | 97.39 | 90.89 | 99.96 | 99.59 | 96.13 |
| 1,2,3,4,7,8-HxCDF | 96.31 | 100 | 94.17 | 92.61 | 99.96 | 99.69 | 98.43 |
| 1,2,3,6,7,8-HxCDF | 94.97 | 98.40 | 94.50 | 93.12 | 99.97 | 99.62 | 97.68 |
| 1,2,3,7,8,9-HxCDF | 89.32 | 96.60 | 93.41 | 96.27 | 99.98 | 99.48 | 94.49 |
| 2,3,4,6,7,8-HxCDF | 88.95 | 88.95 | 93.43 | 96.02 | 99.98 | 98.26 | 90.40 |
| 1,2,3,4,6,7,8-HpCDF | 93.18 | 98.63 | 89.82 | 96.46 | 99.98 | 99.67 | 98.91 |
| 1,2,3,4,7,8,9-HpCDF | 92.95 | 89.33 | 95.23 | 98.26 | 99.99 | 99.46 | 96.79 |
| OCDF | 96.07 | 96.96 | 85.81 | 99.15 | 99.99 | 99.66 | 99.31 |
| 2,3,7,8-TCDD | 99.33 | 100 | 99.31 | 100 | 100 | 100 | 100 |
| 1,2,3,7,8-PeCDD | 95.20 | 100 | 97.89 | 94.17 | 100 | 100 | 100 |
| 1,2,3,4,7,8-HxCDD | 84.68 | 100 | 94.12 | 89.69 | 100 | 100 | 54.76 |
| 1,2,3,6,7,8-HxCDD | 70.71 | 88.73 | 95.78 | 88.51 | 100 | 97.95 | 30.47 |
| 1,2,3,7,8,9-HxCDD | 88.02 | 88.42 | 97.38 | 89.32 | 100 | 100 | 49.76 |
| 1,2,3,4,6,7,8-HpCDD | 61.33 | 91.17 | 97.68 | 94.98 | 99.94 | 99.01 | 59.19 |
| OCDD | 67.41 | 88.91 | 98.00 | 97.71 | 99.96 | 99.38 | 93.52 |
Publisher’s Note: MDPI stays neutral with regard to jurisdictional claims in published maps and institutional affiliations. |
© 2022 by the authors. Licensee MDPI, Basel, Switzerland. This article is an open access article distributed under the terms and conditions of the Creative Commons Attribution (CC BY) license (https://creativecommons.org/licenses/by/4.0/).
Share and Cite
Son, J.-I.; Lee, S.-J.; Park, S.-I.; Kwon, E.-H.; Namkung, H.; Kang, J.-G.; Lee, W. Emission Characteristics of Polychlorinated Dibenzo-p-Dioxins/Dibenzofurans (PCDD/DFs) in Commercial Bio-SRF and SRF Incineration Plants. Energies 2022, 15, 2787. https://doi.org/10.3390/en15082787
Son J-I, Lee S-J, Park S-I, Kwon E-H, Namkung H, Kang J-G, Lee W. Emission Characteristics of Polychlorinated Dibenzo-p-Dioxins/Dibenzofurans (PCDD/DFs) in Commercial Bio-SRF and SRF Incineration Plants. Energies. 2022; 15(8):2787. https://doi.org/10.3390/en15082787
Chicago/Turabian StyleSon, Jun-Ik, Seung-Jae Lee, Se-In Park, Eun-Hye Kwon, Hueon Namkung, Jun-Gu Kang, and Wonseok Lee. 2022. "Emission Characteristics of Polychlorinated Dibenzo-p-Dioxins/Dibenzofurans (PCDD/DFs) in Commercial Bio-SRF and SRF Incineration Plants" Energies 15, no. 8: 2787. https://doi.org/10.3390/en15082787
APA StyleSon, J.-I., Lee, S.-J., Park, S.-I., Kwon, E.-H., Namkung, H., Kang, J.-G., & Lee, W. (2022). Emission Characteristics of Polychlorinated Dibenzo-p-Dioxins/Dibenzofurans (PCDD/DFs) in Commercial Bio-SRF and SRF Incineration Plants. Energies, 15(8), 2787. https://doi.org/10.3390/en15082787