
A Visualization and Analysis Method by Multi-Dimensional Crossplots from Multi-Well Heterogeneous Data

Abstract
:1. Introduction
2. Analysis Model of Augmented-Dimensional Display of Crossplots
3. The Realization of Augmented-Dimensional Display Technology of Crossplots
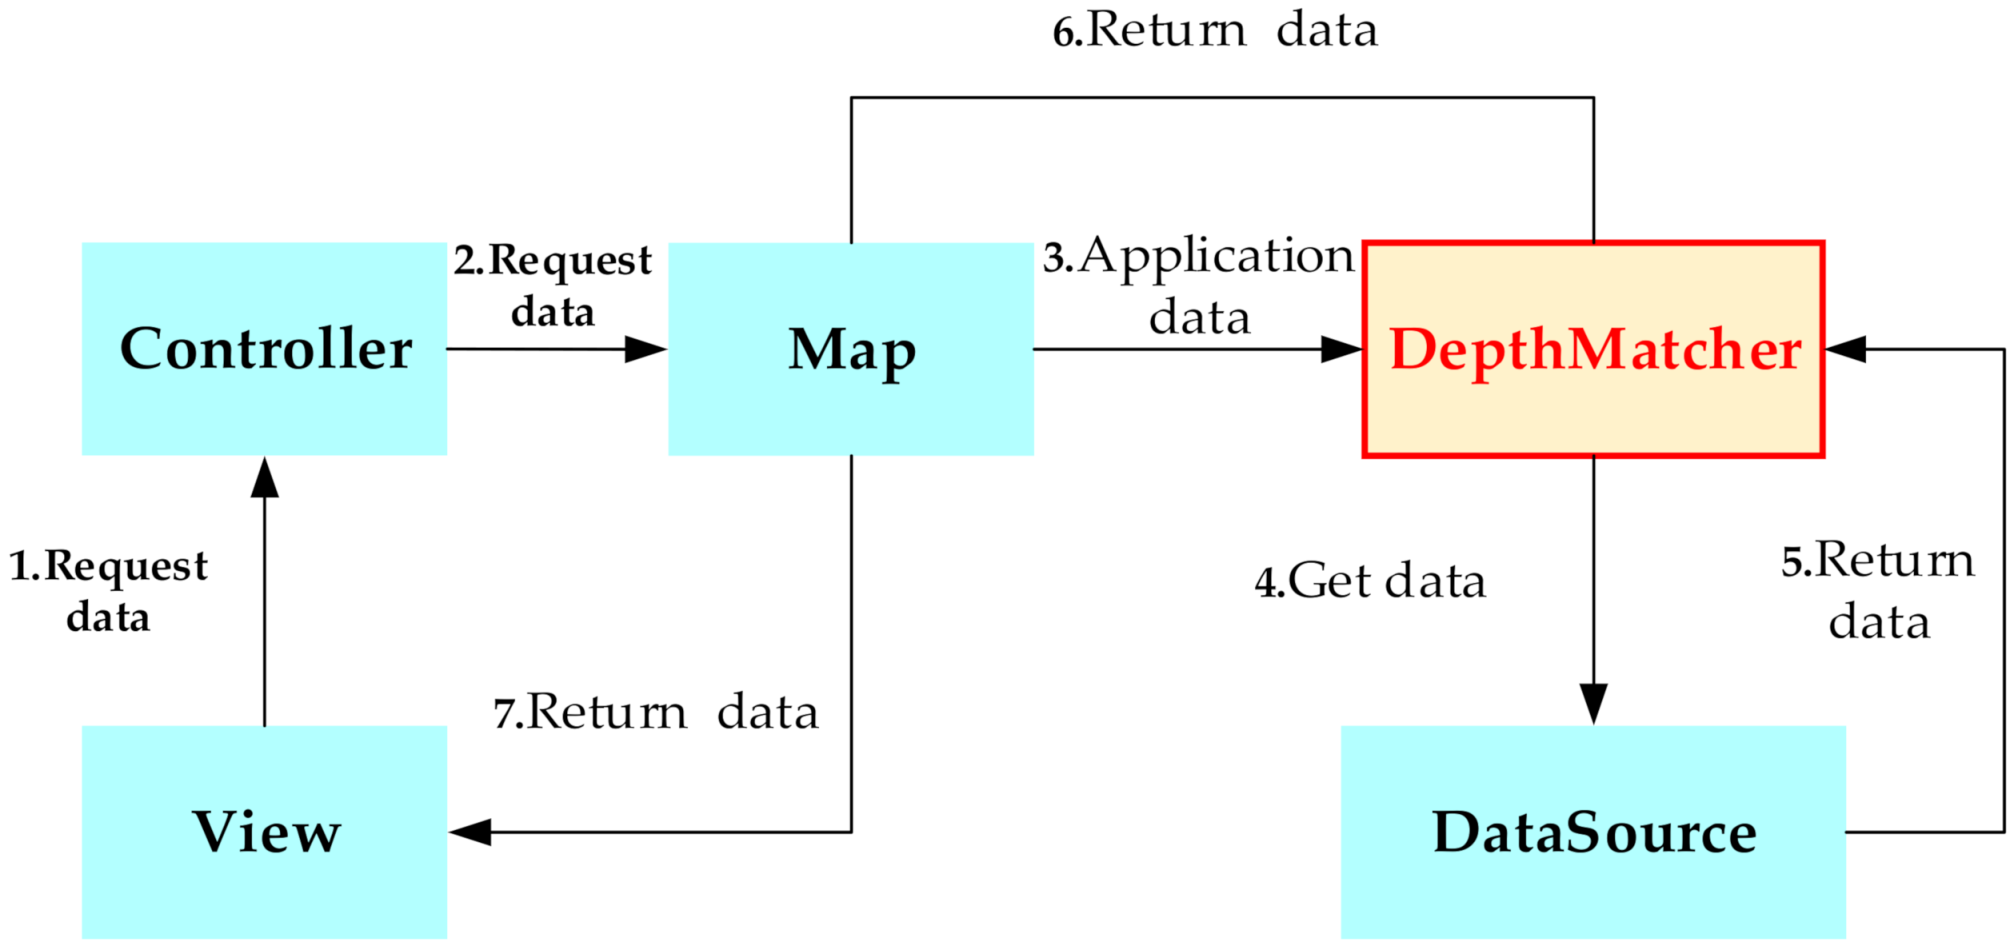
3.1. Approach
3.2. Augmented-Dimensional Depth Match Matrix for Heterogeneous Data
3.2.1. Alignment Grid Matrix
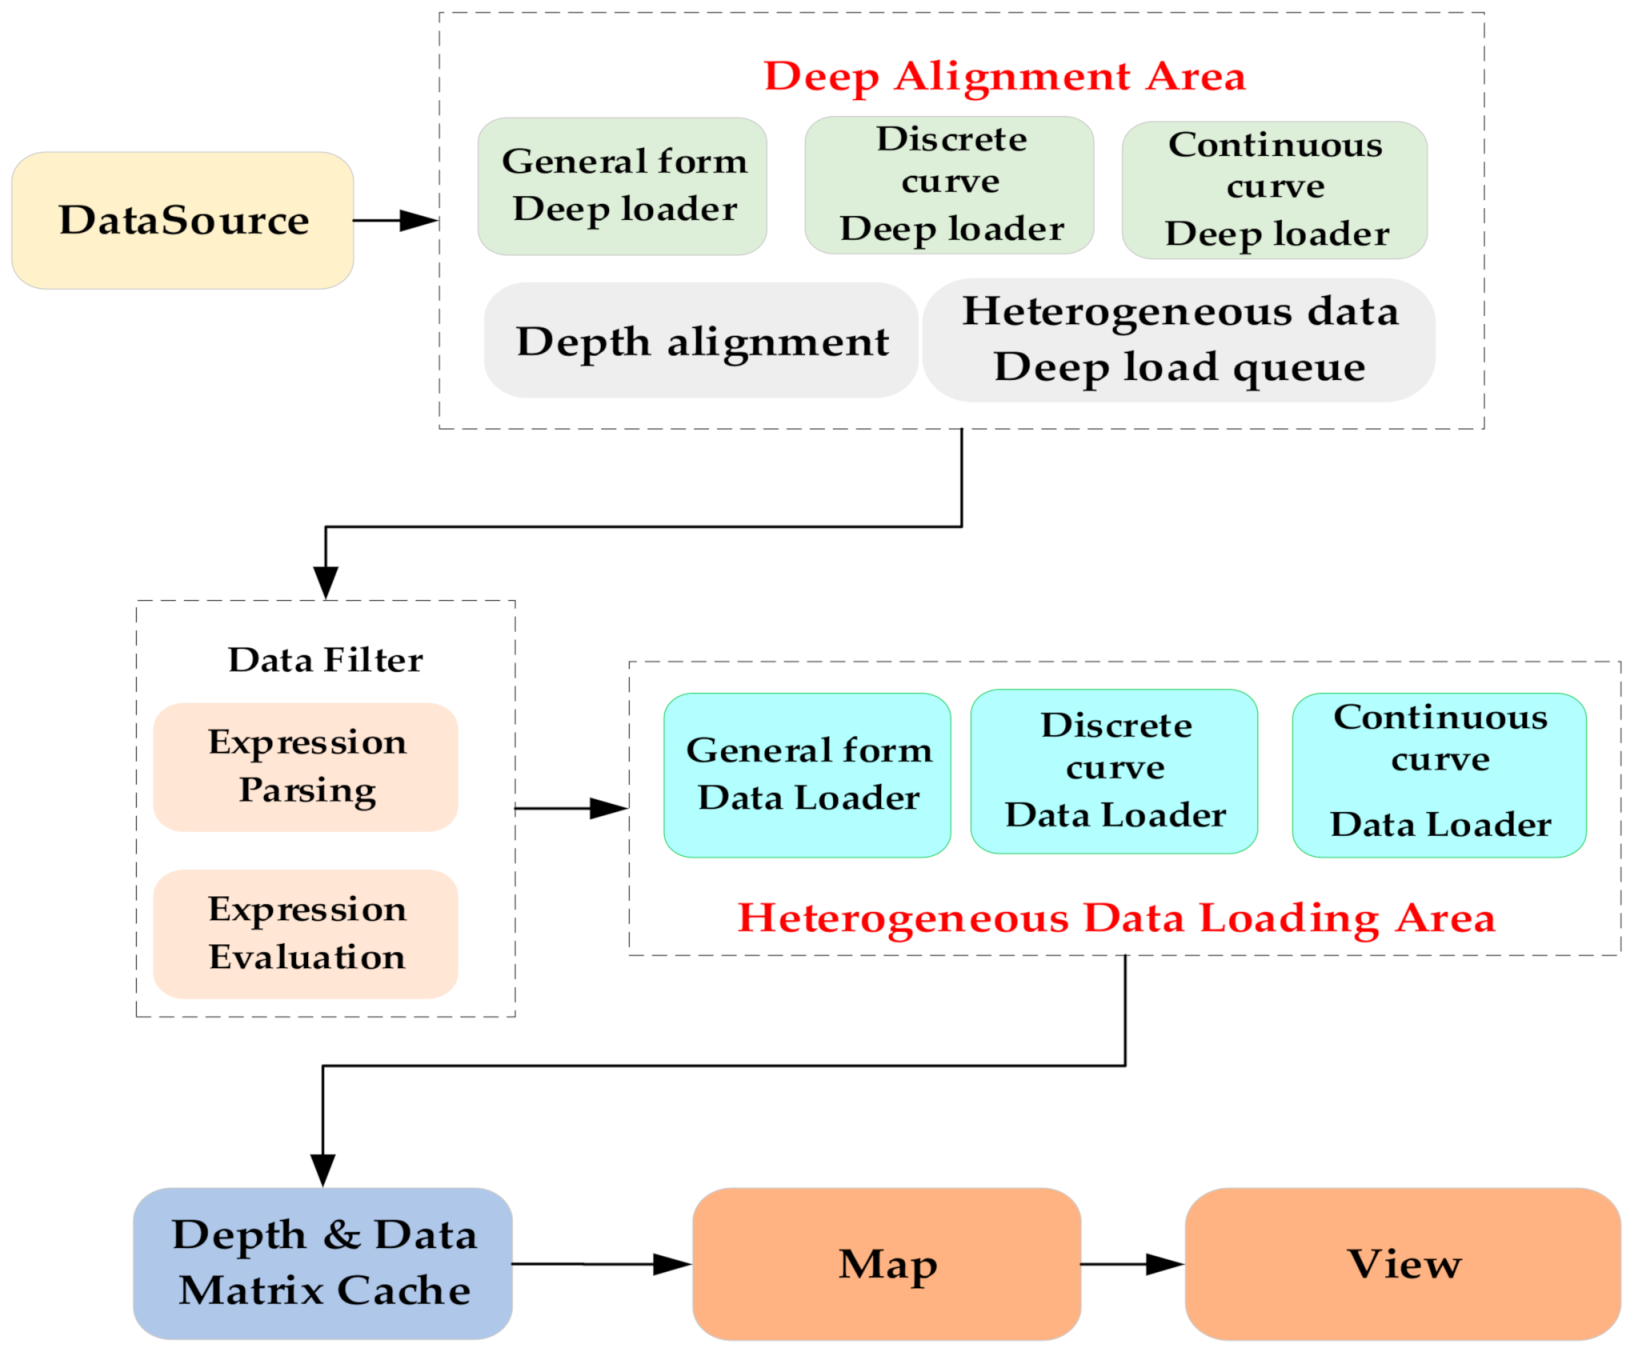
3.2.2. Deep Alignment Area
3.2.3. Data Filter
Approach
- (1)
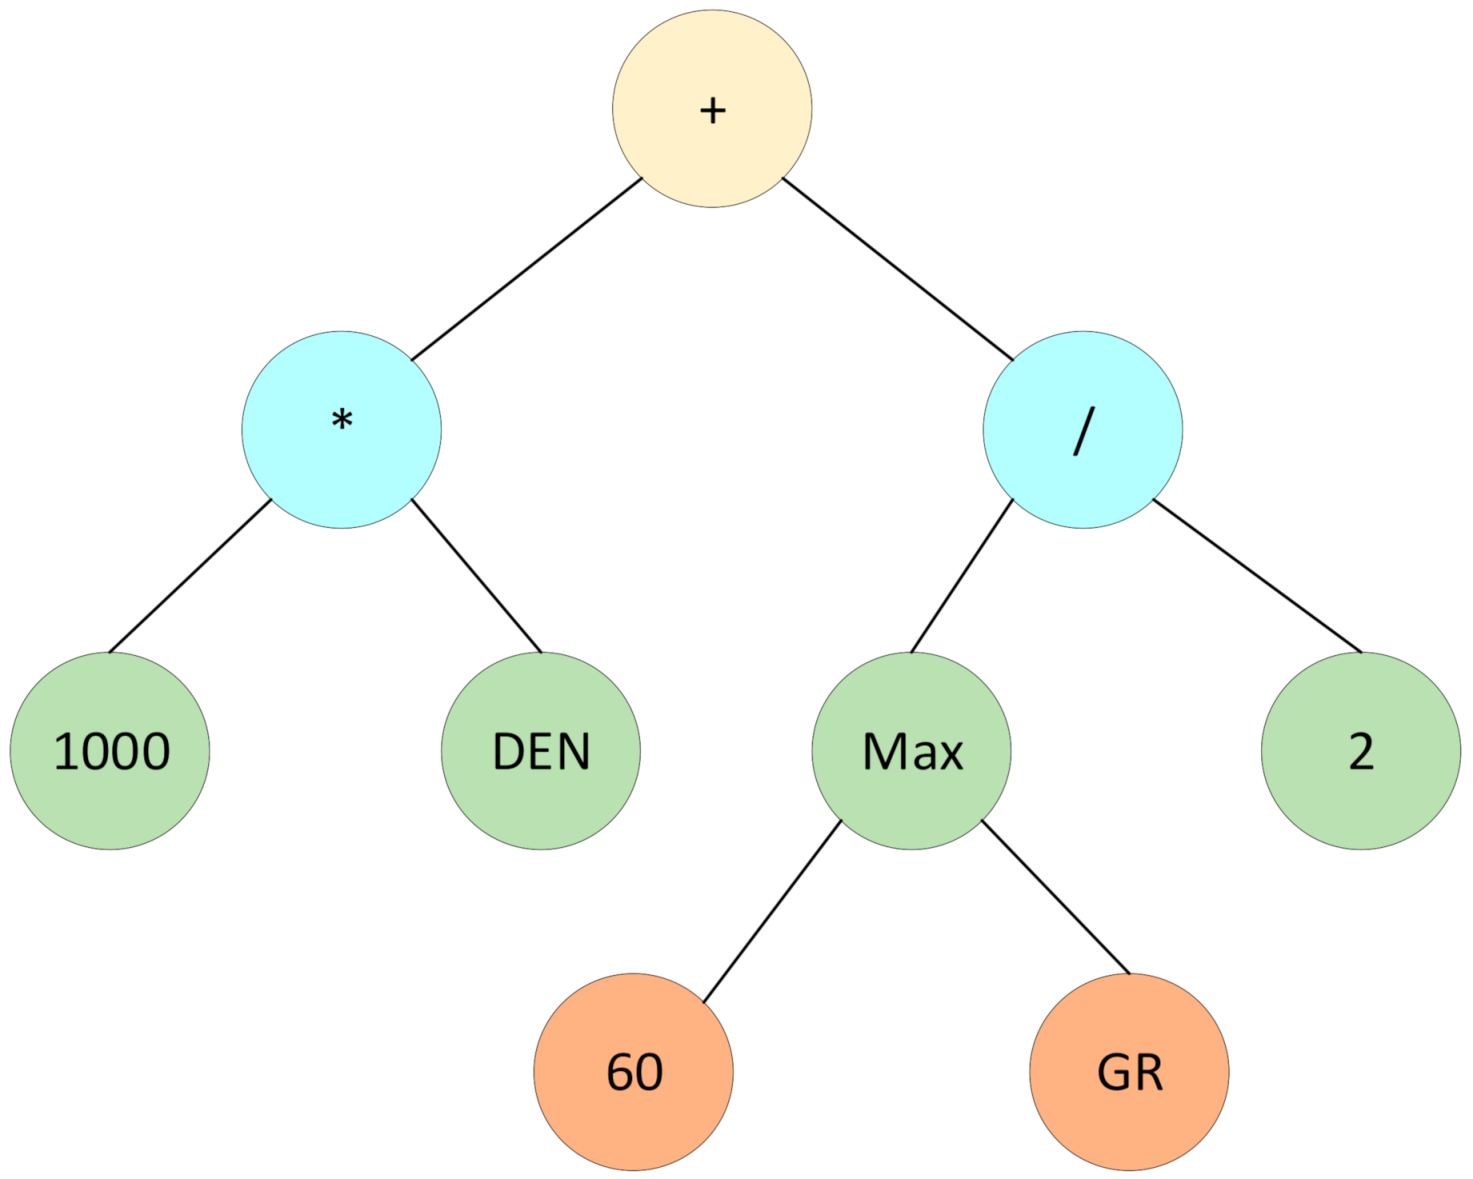
- Unit conversion. When logging data is inconsistent with the unit of crossplot scale, unit conversion of logging curve is needed. For example, the unit of density logging curve (DEN) is , but the current crossplot is calibrated according to , so the unit conversion of logging curve is needed, and the curve expression is entered in the crossplot ‘1000 * DEN ’.
- (2)
- Curve correction. When the curve is corrected, the data is projected to the interpretation chart of the crossplot. When the distribution of the vast majority of data points is dense but deviates from the lithology line of the interpretation chart, the additional correction of the curve is needed. That is, the additional correction of the x-axis or y-axis curve in the crossplot is added to the ∆x and ∆y, so that most data points are located near the known lithology line of the interpretation chart.
- (3)
- Multi-curve conditional logging filter and curve effective calibration range. For example, natural gamma logging is a method to measure the natural gamma ray intensity of rock strata. Rocks generally contain different amounts of radioactive elements, and constantly emit rays. The more argillaceous they contain in sedimentary rocks, the stronger their radioactivity is. Interpreters pay more attention to the distribution of sandstone and filter out possible mudstone data points. Therefore, logging filter conditions can be set in the crossplot ‘GR < 60&&GR > 0′. That is, only crossplot points with natural gamma values less than 60 and greater than 0 are displayed.
- (1)
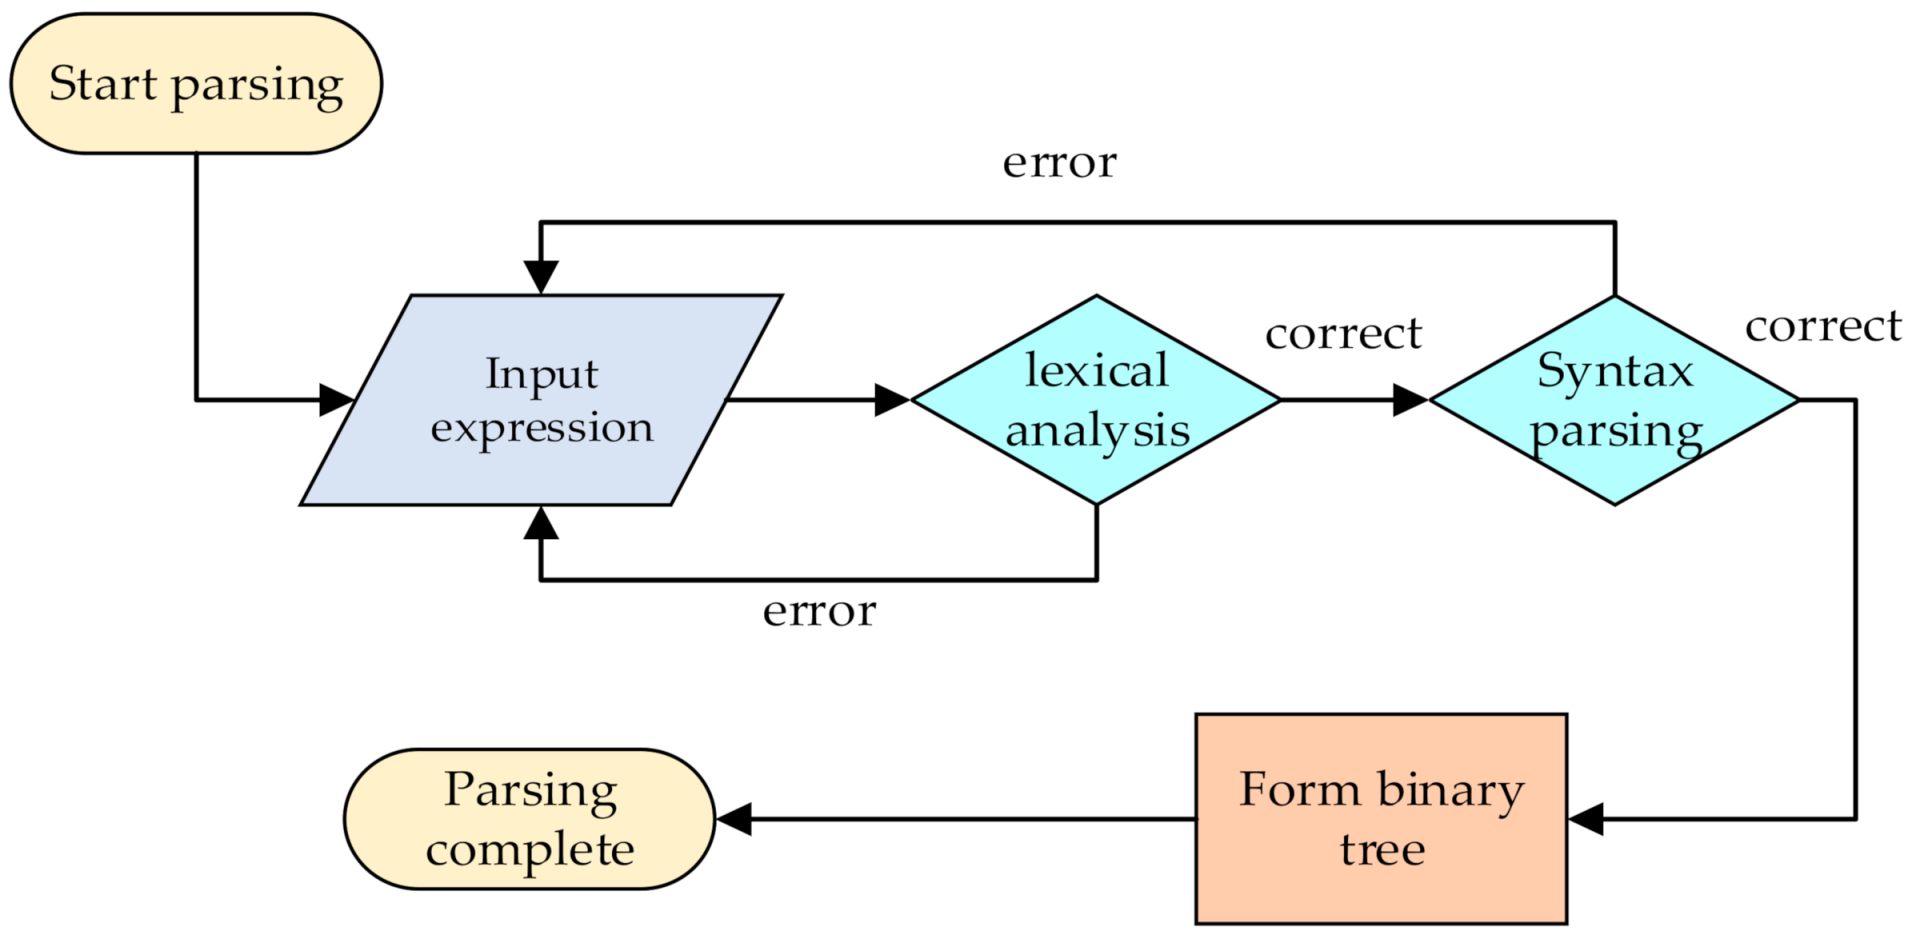
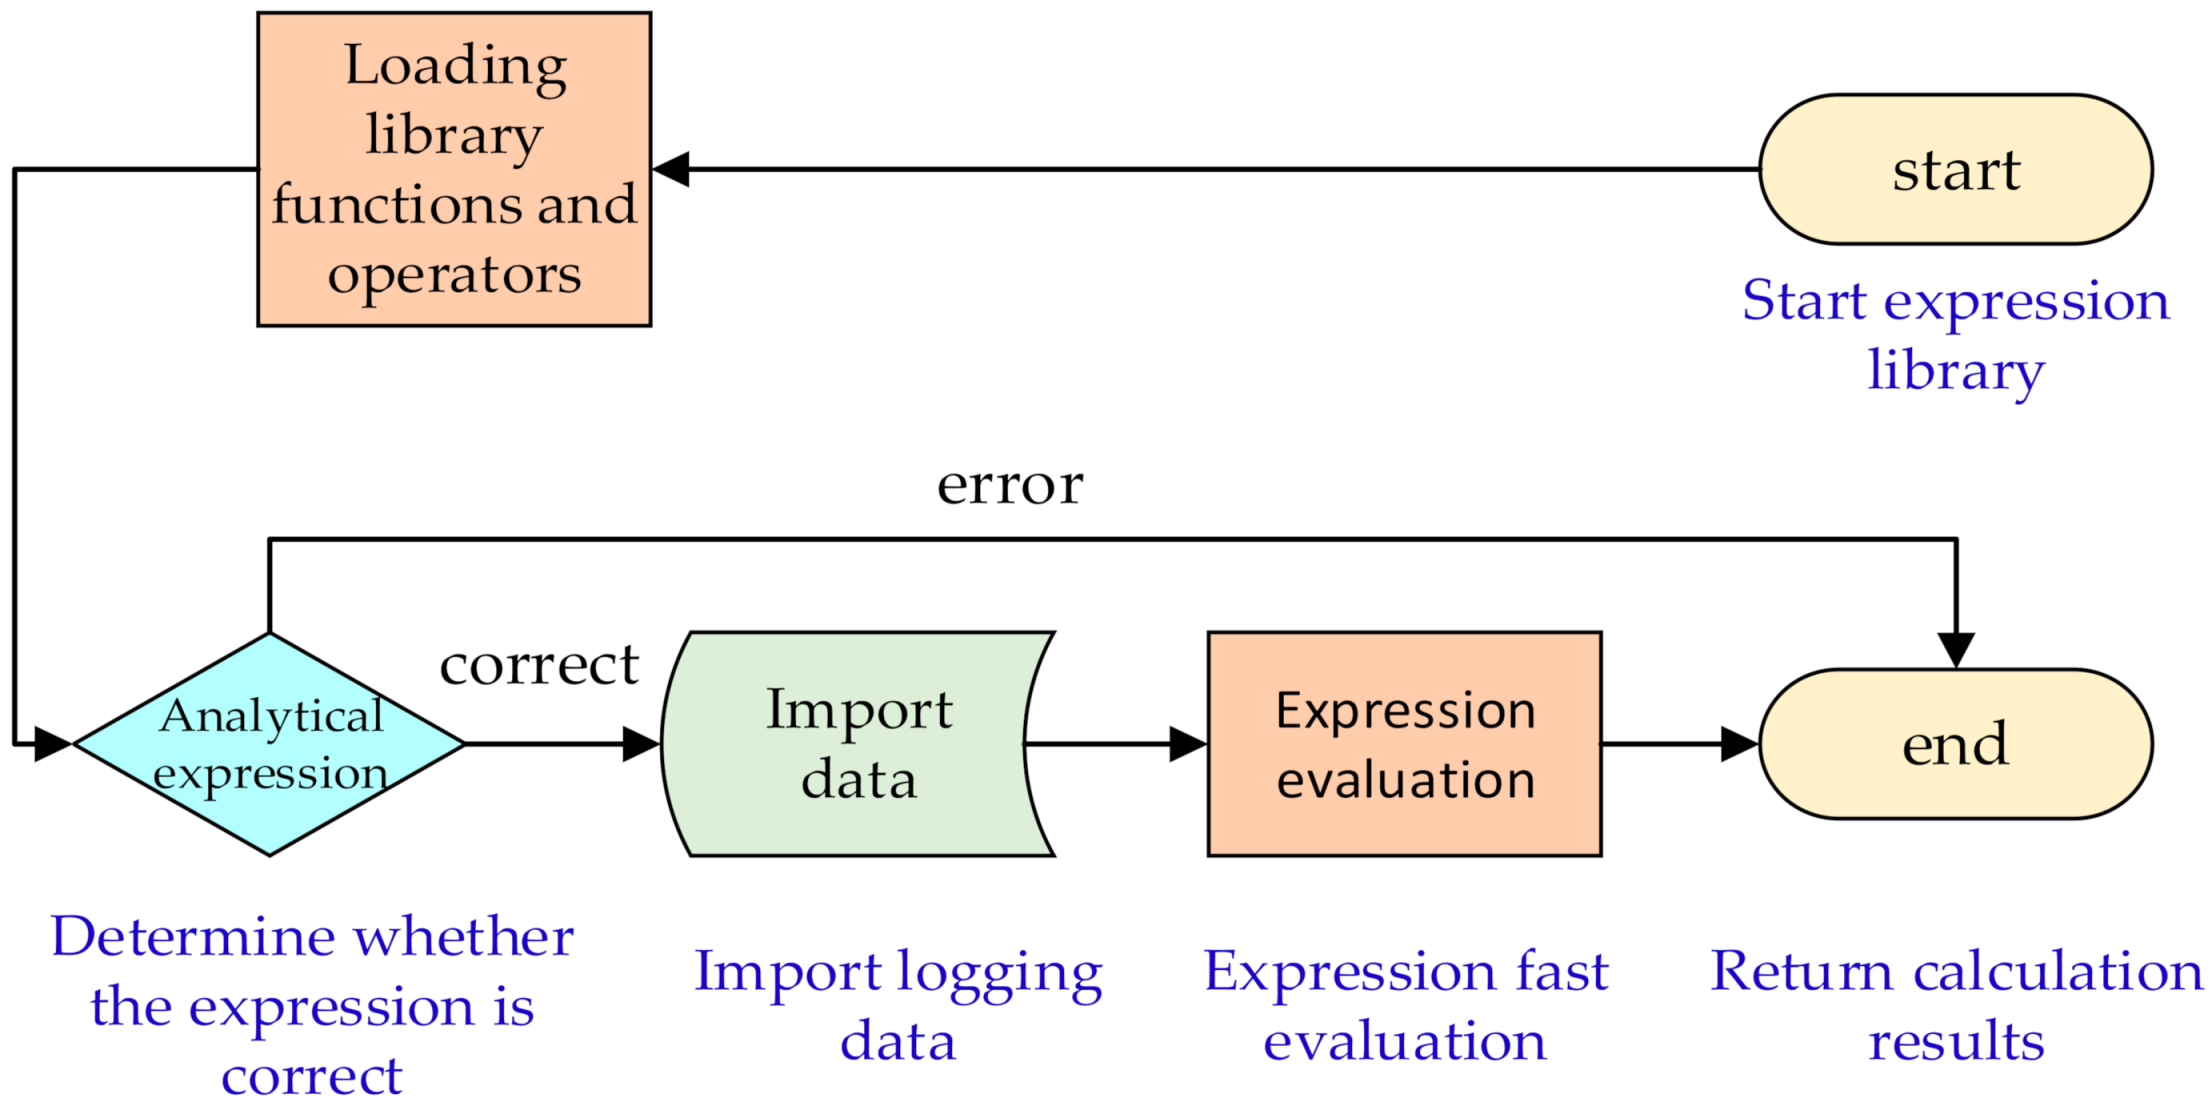
- Expression analysis is complex. In the analysis process, the logging curve name, operator, and mathematical function in the expression need to be identified and classified. When the curve name contains operators, or the curve name is a function keyword, the analysis is more complex.
- (2)
- Expressions should not only support operators, but also support a variety of functions, even logical expressions, and also consider the priority and operation order.
- (3)
- There are many logging data points and a large amount of calculation, so the calculation speed is required.
Expression Parsing
Expression Evaluation
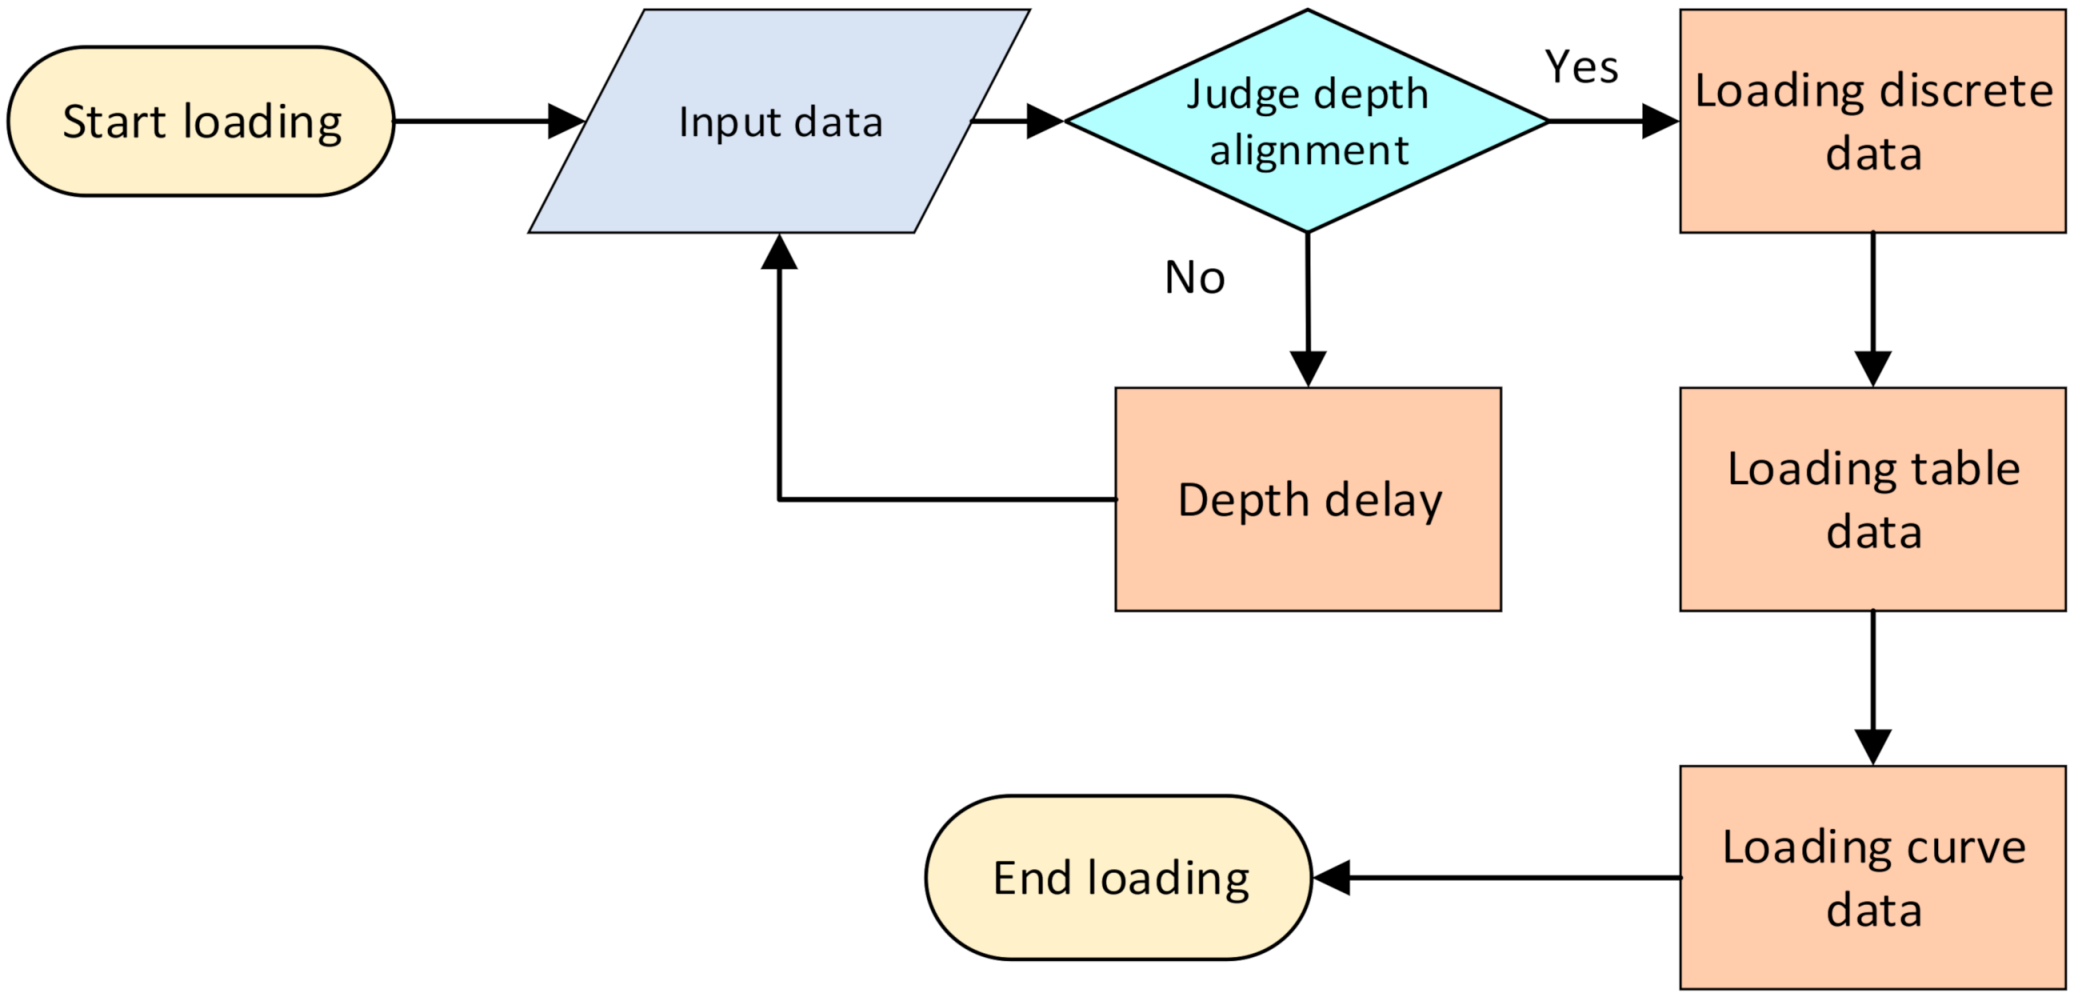
3.2.4. Heterogeneous Data Loading Area
3.2.5. Depth and Data Matrix Cache
- (1)
- Management of current interpretation and processing data flow, and coordination of multi-well and multi-dimensional module interactions
- (2)
- Improving access efficiency
- (3)
- Ensuring multi-well and multi-dimensional heterogeneous data consistency
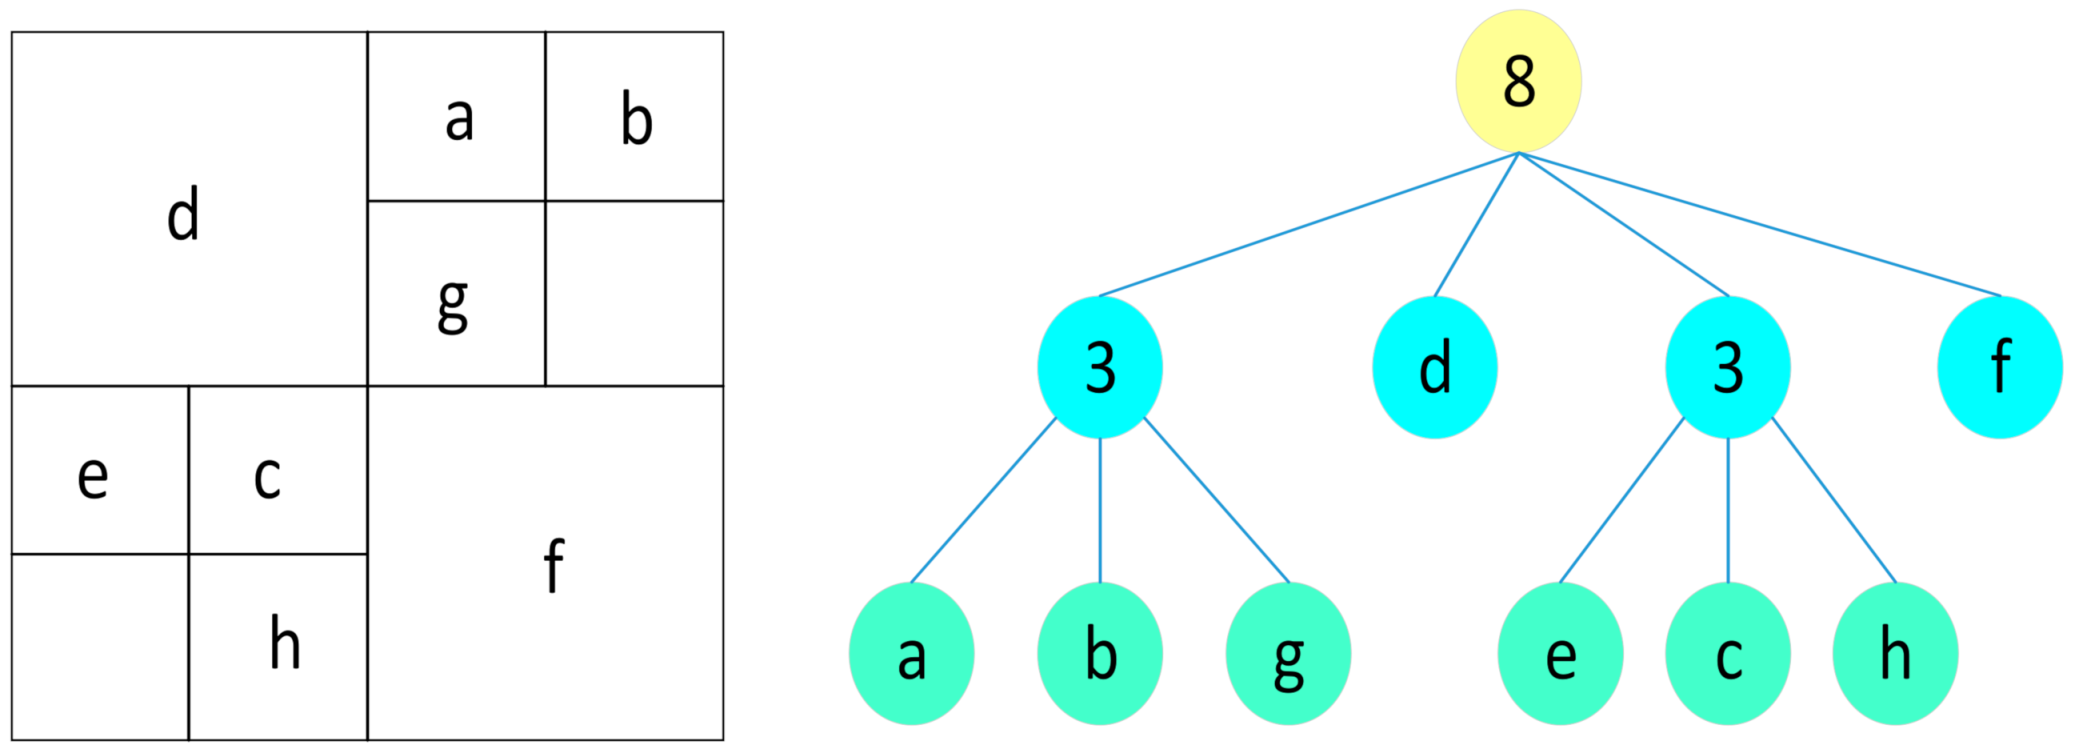
3.3. The Display Method of the Crossplots from Multi-Well Data by Quadtree Index
3.4. The Crossplot Communication Technology
4. Application Effect
4.1. Method
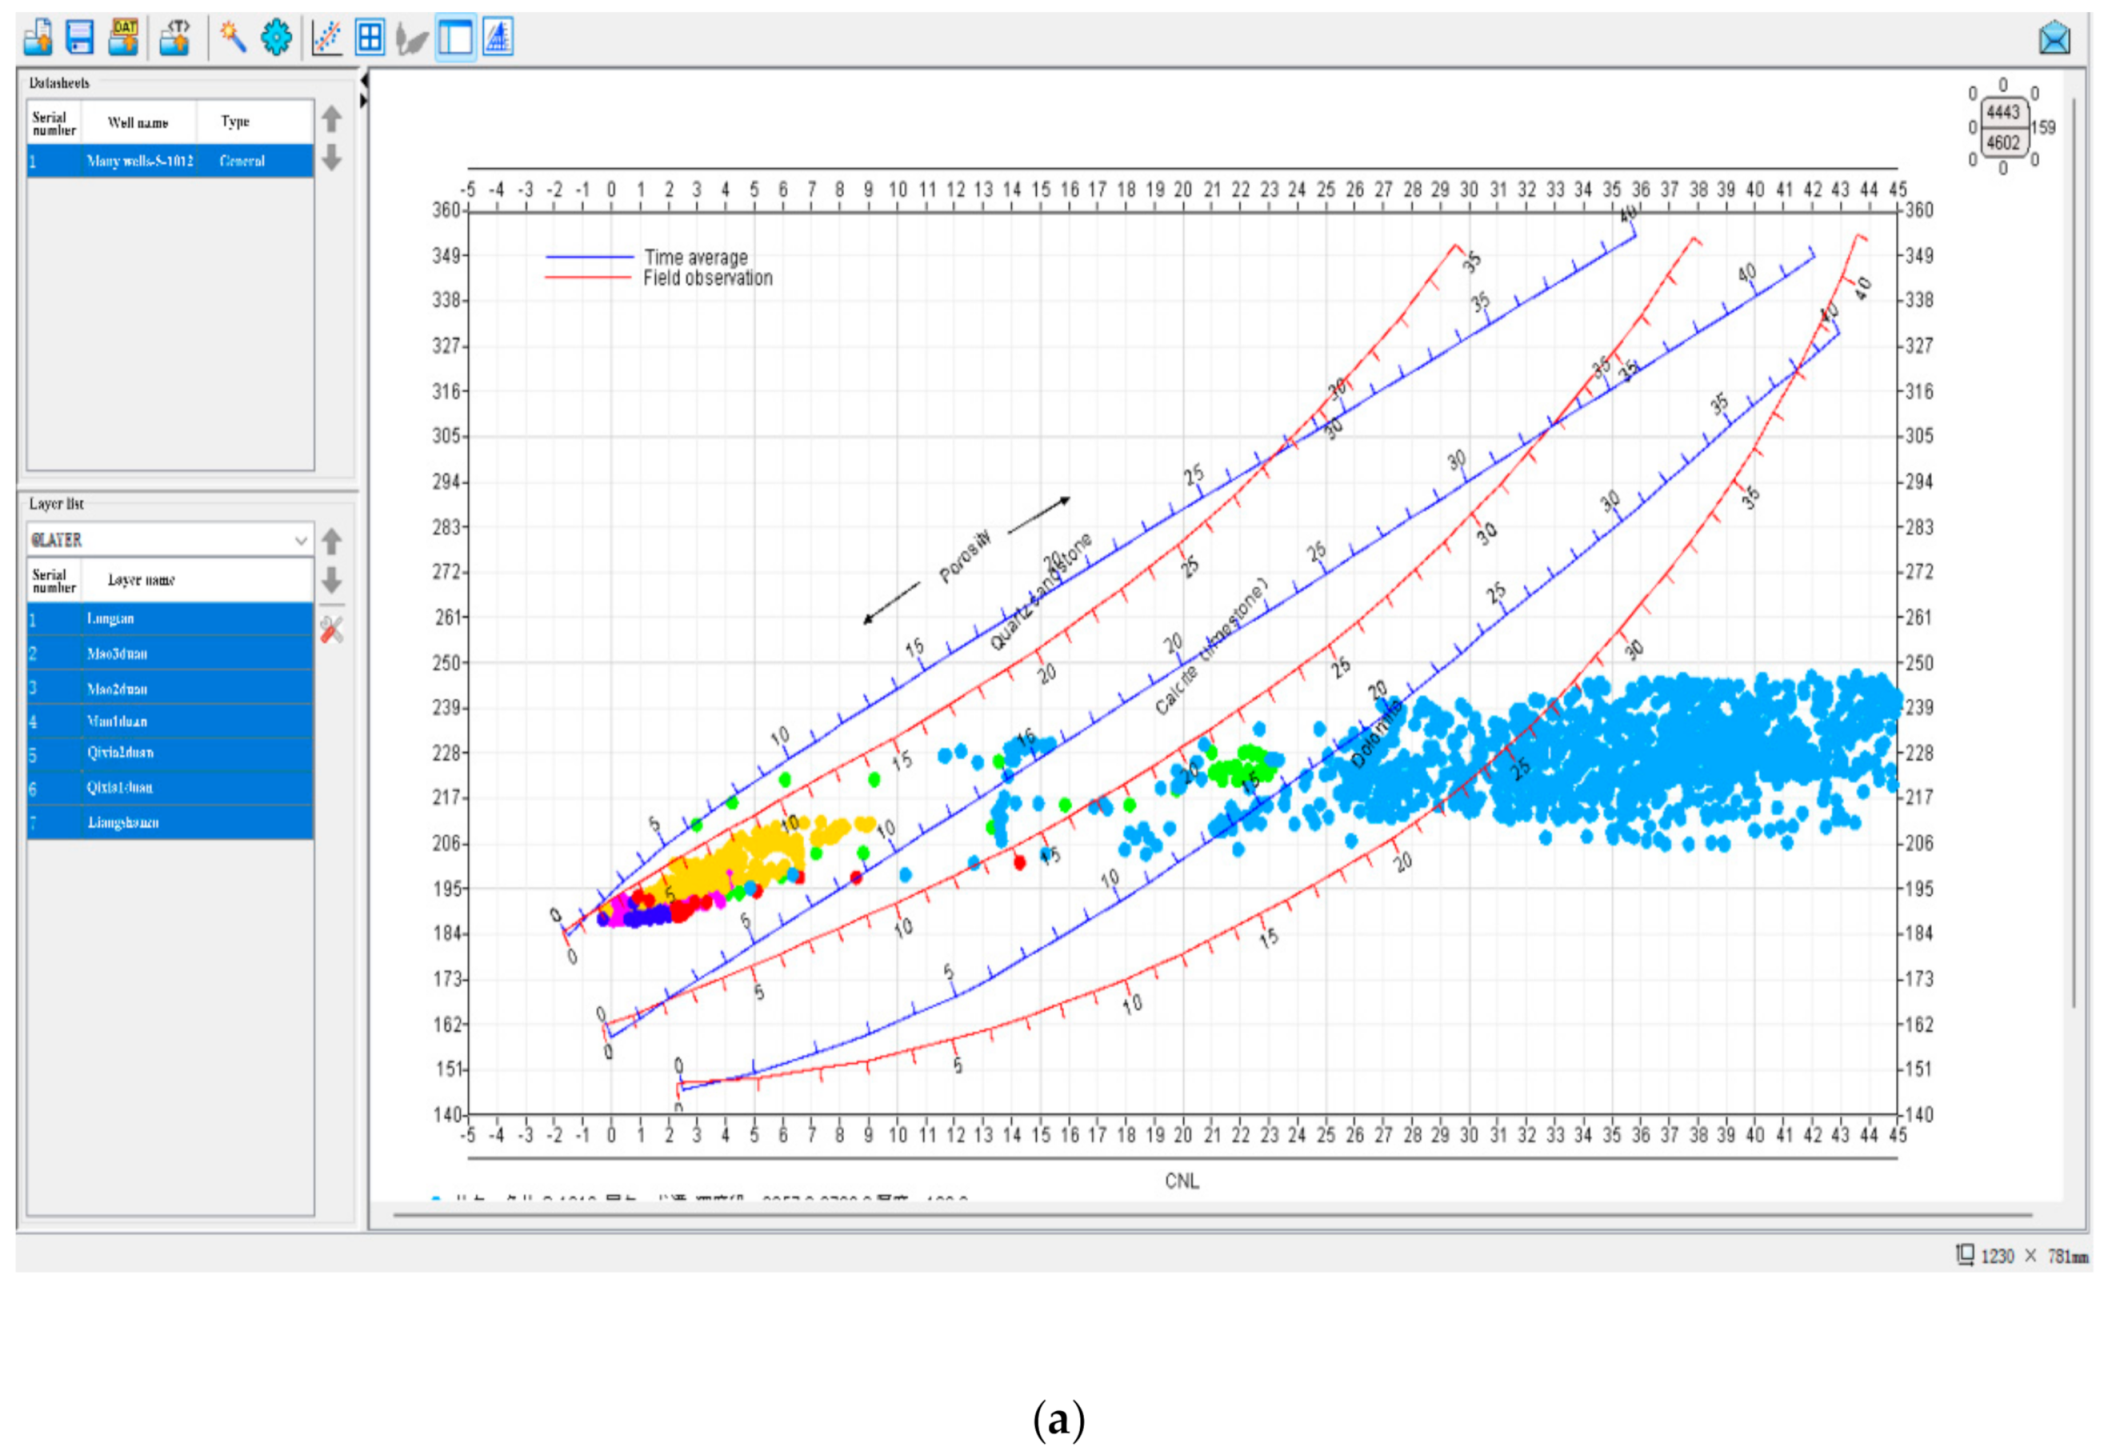
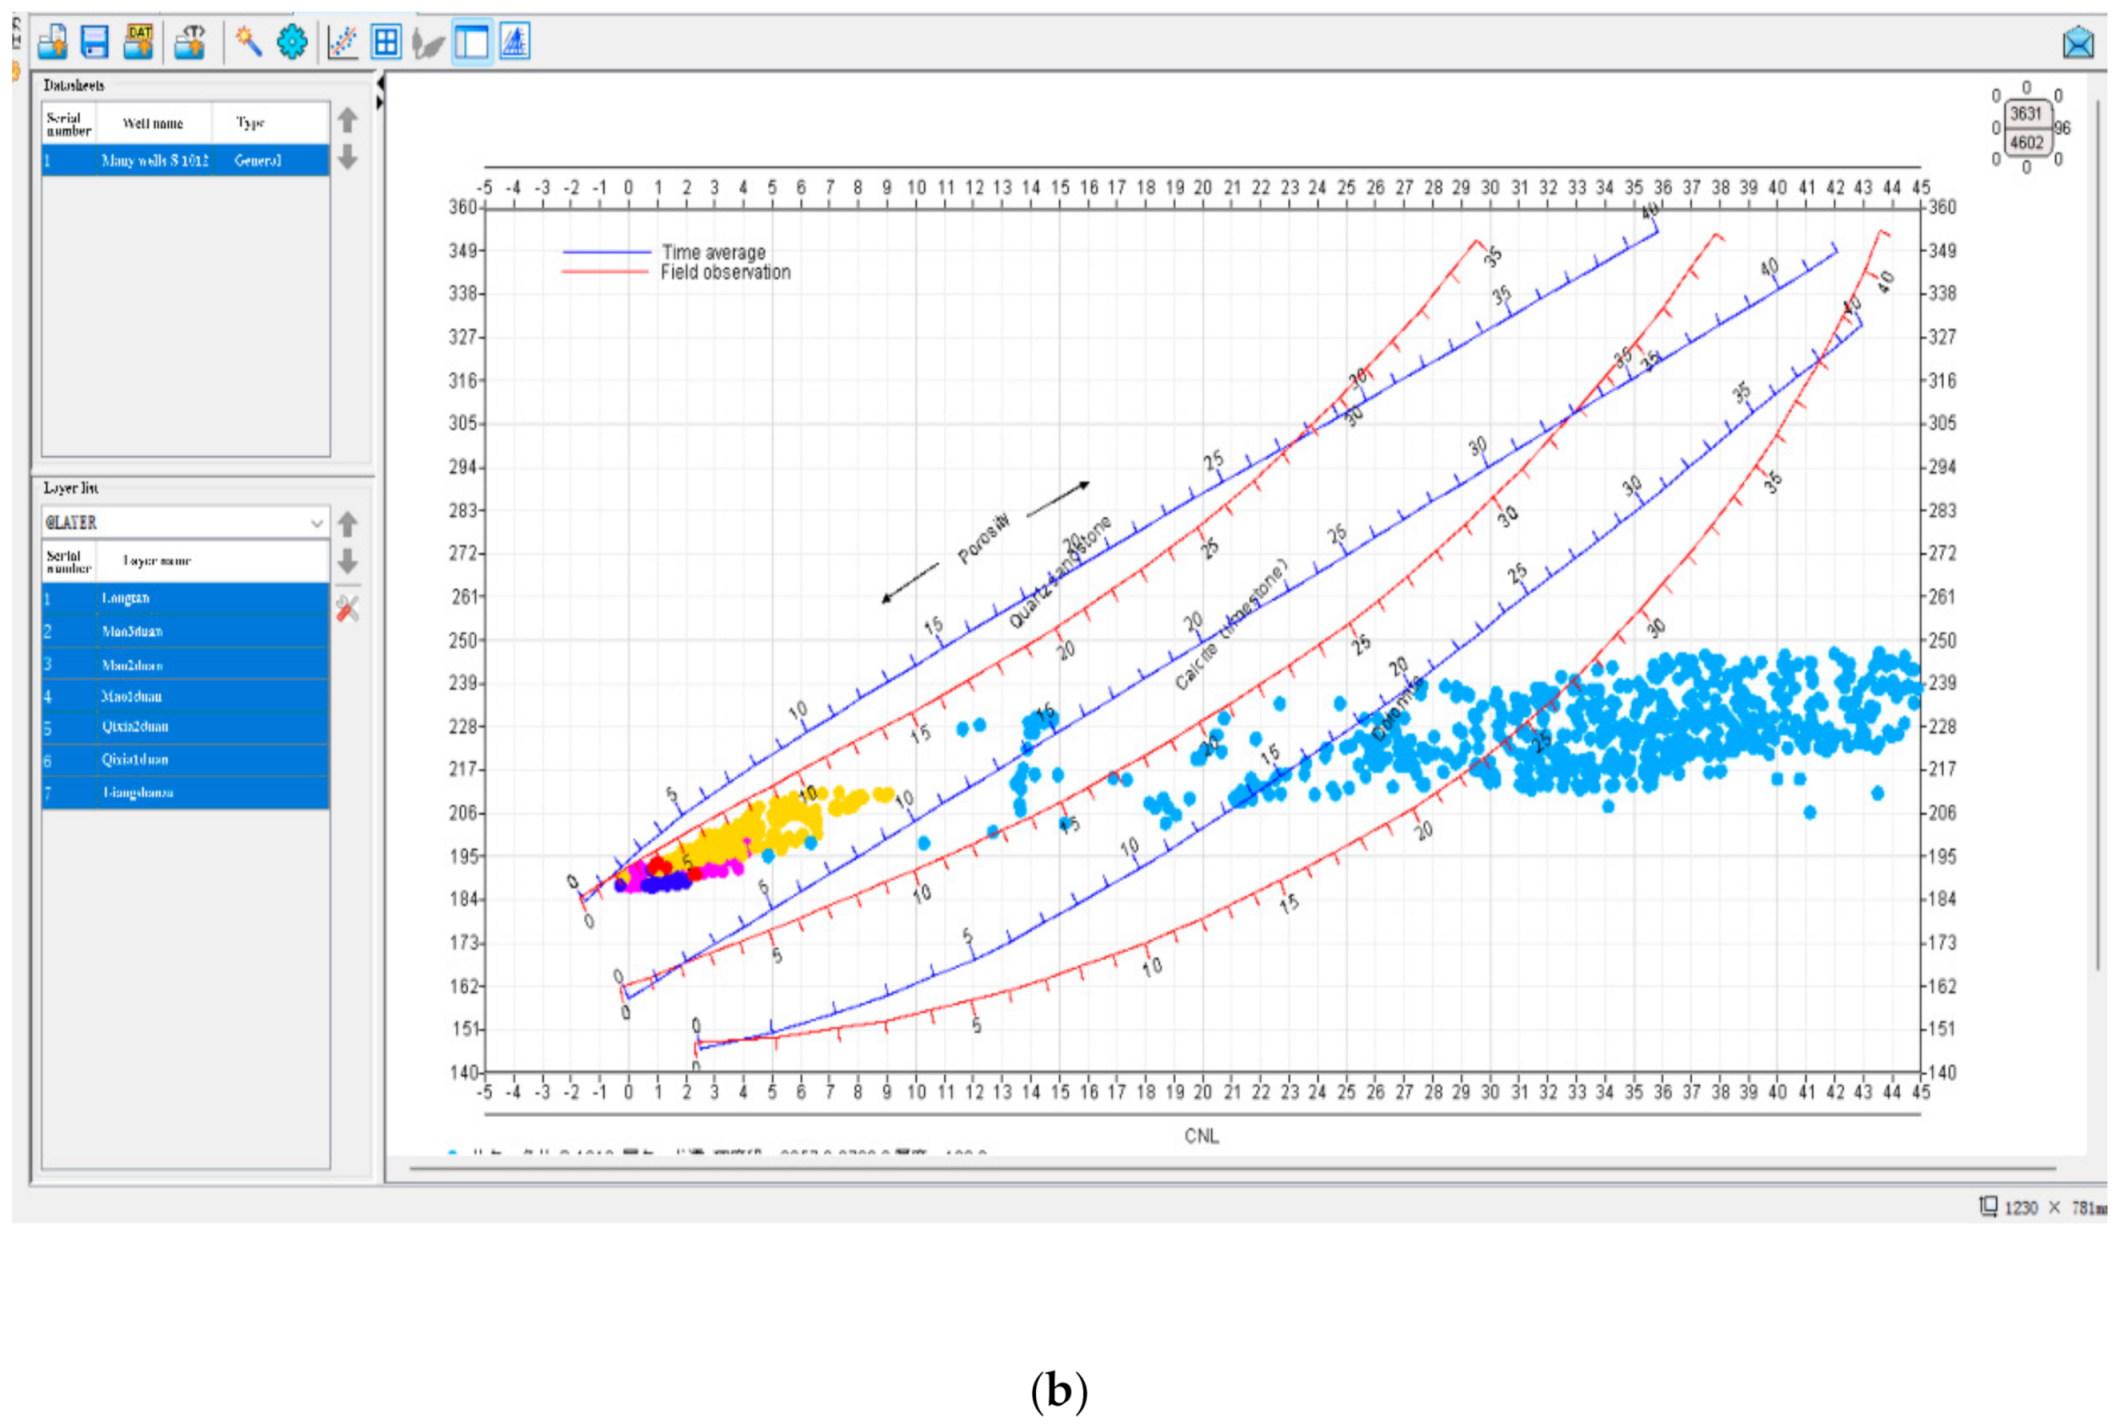
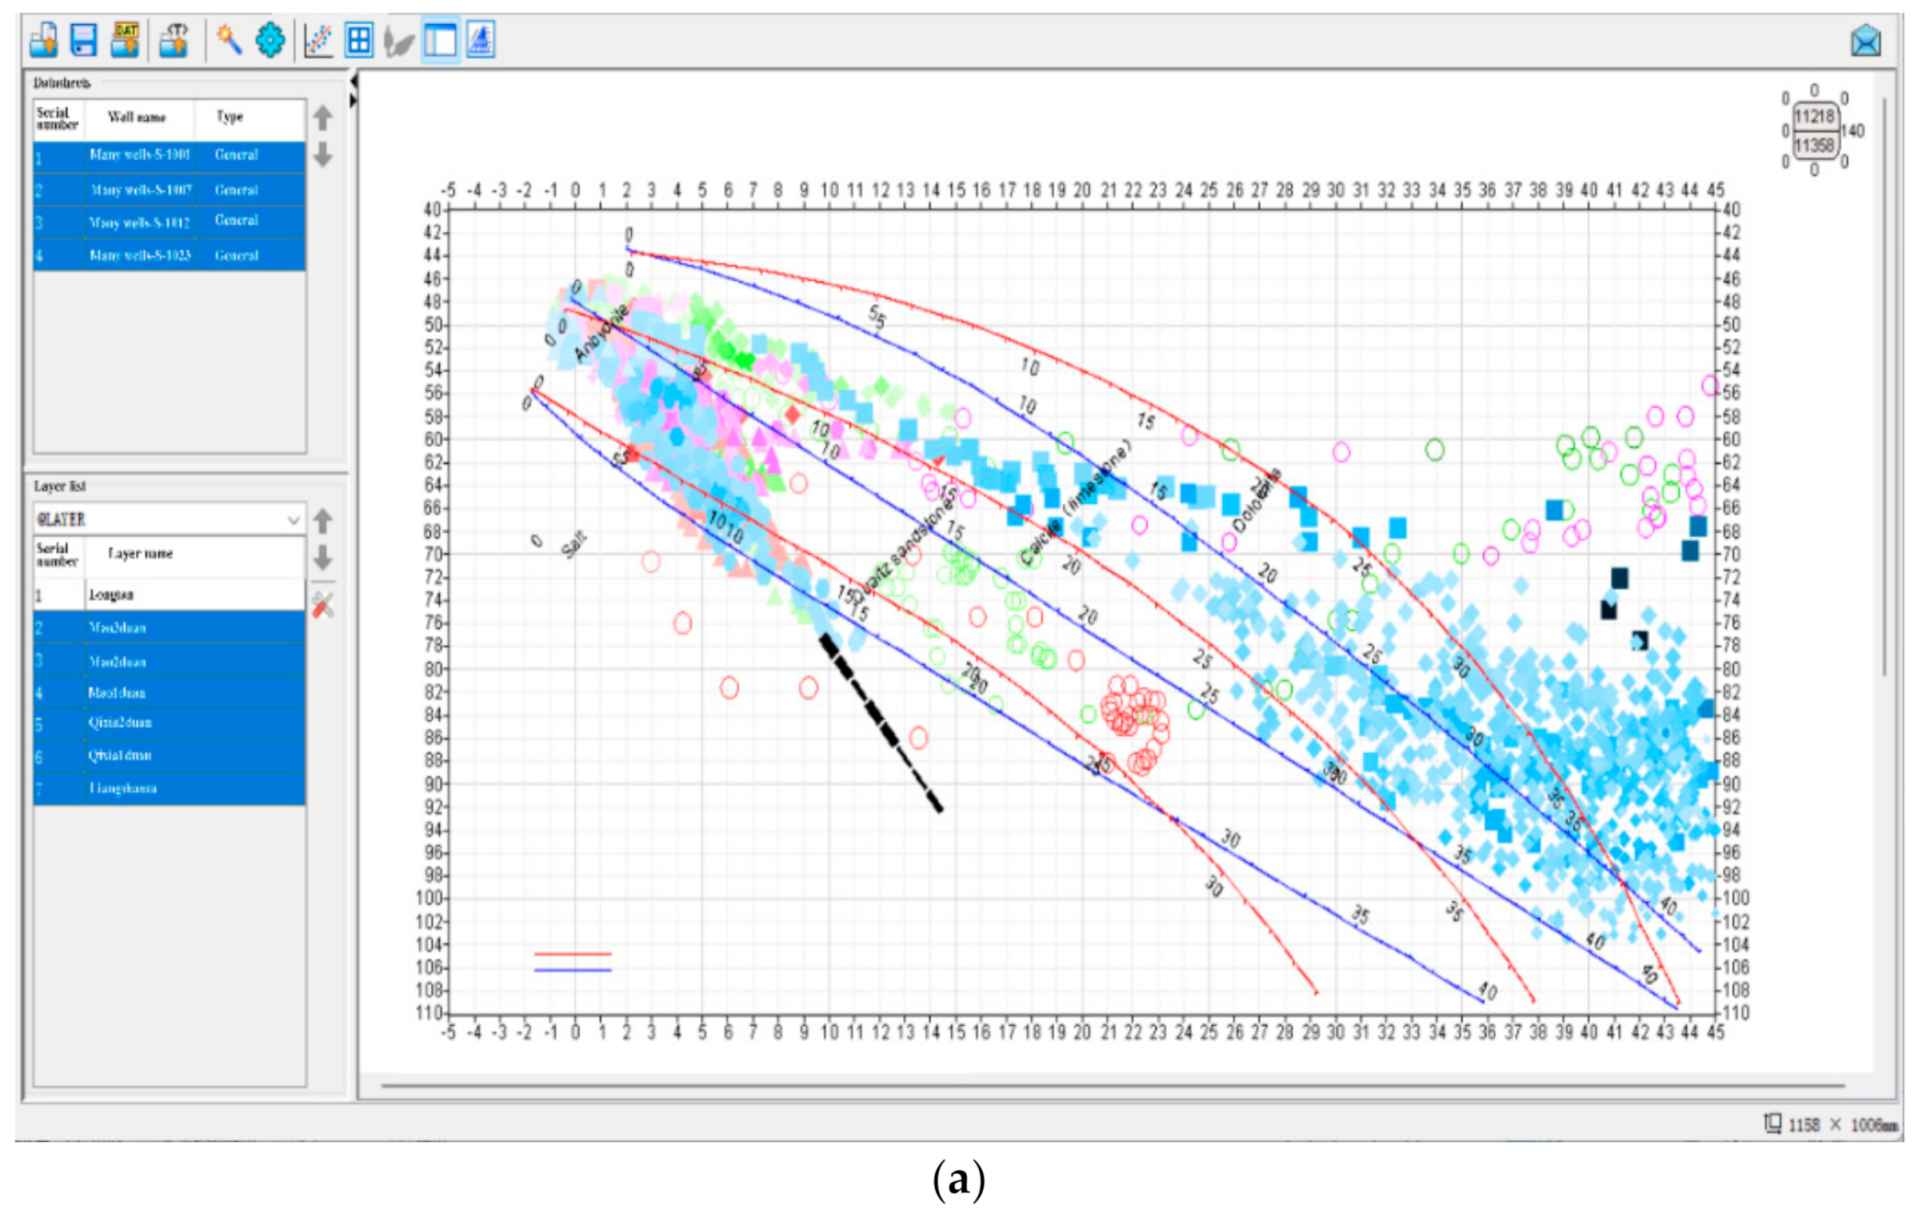
4.2. Analysis of Dimension Increasing Crossplot of Multi-Well and Multi-Sections
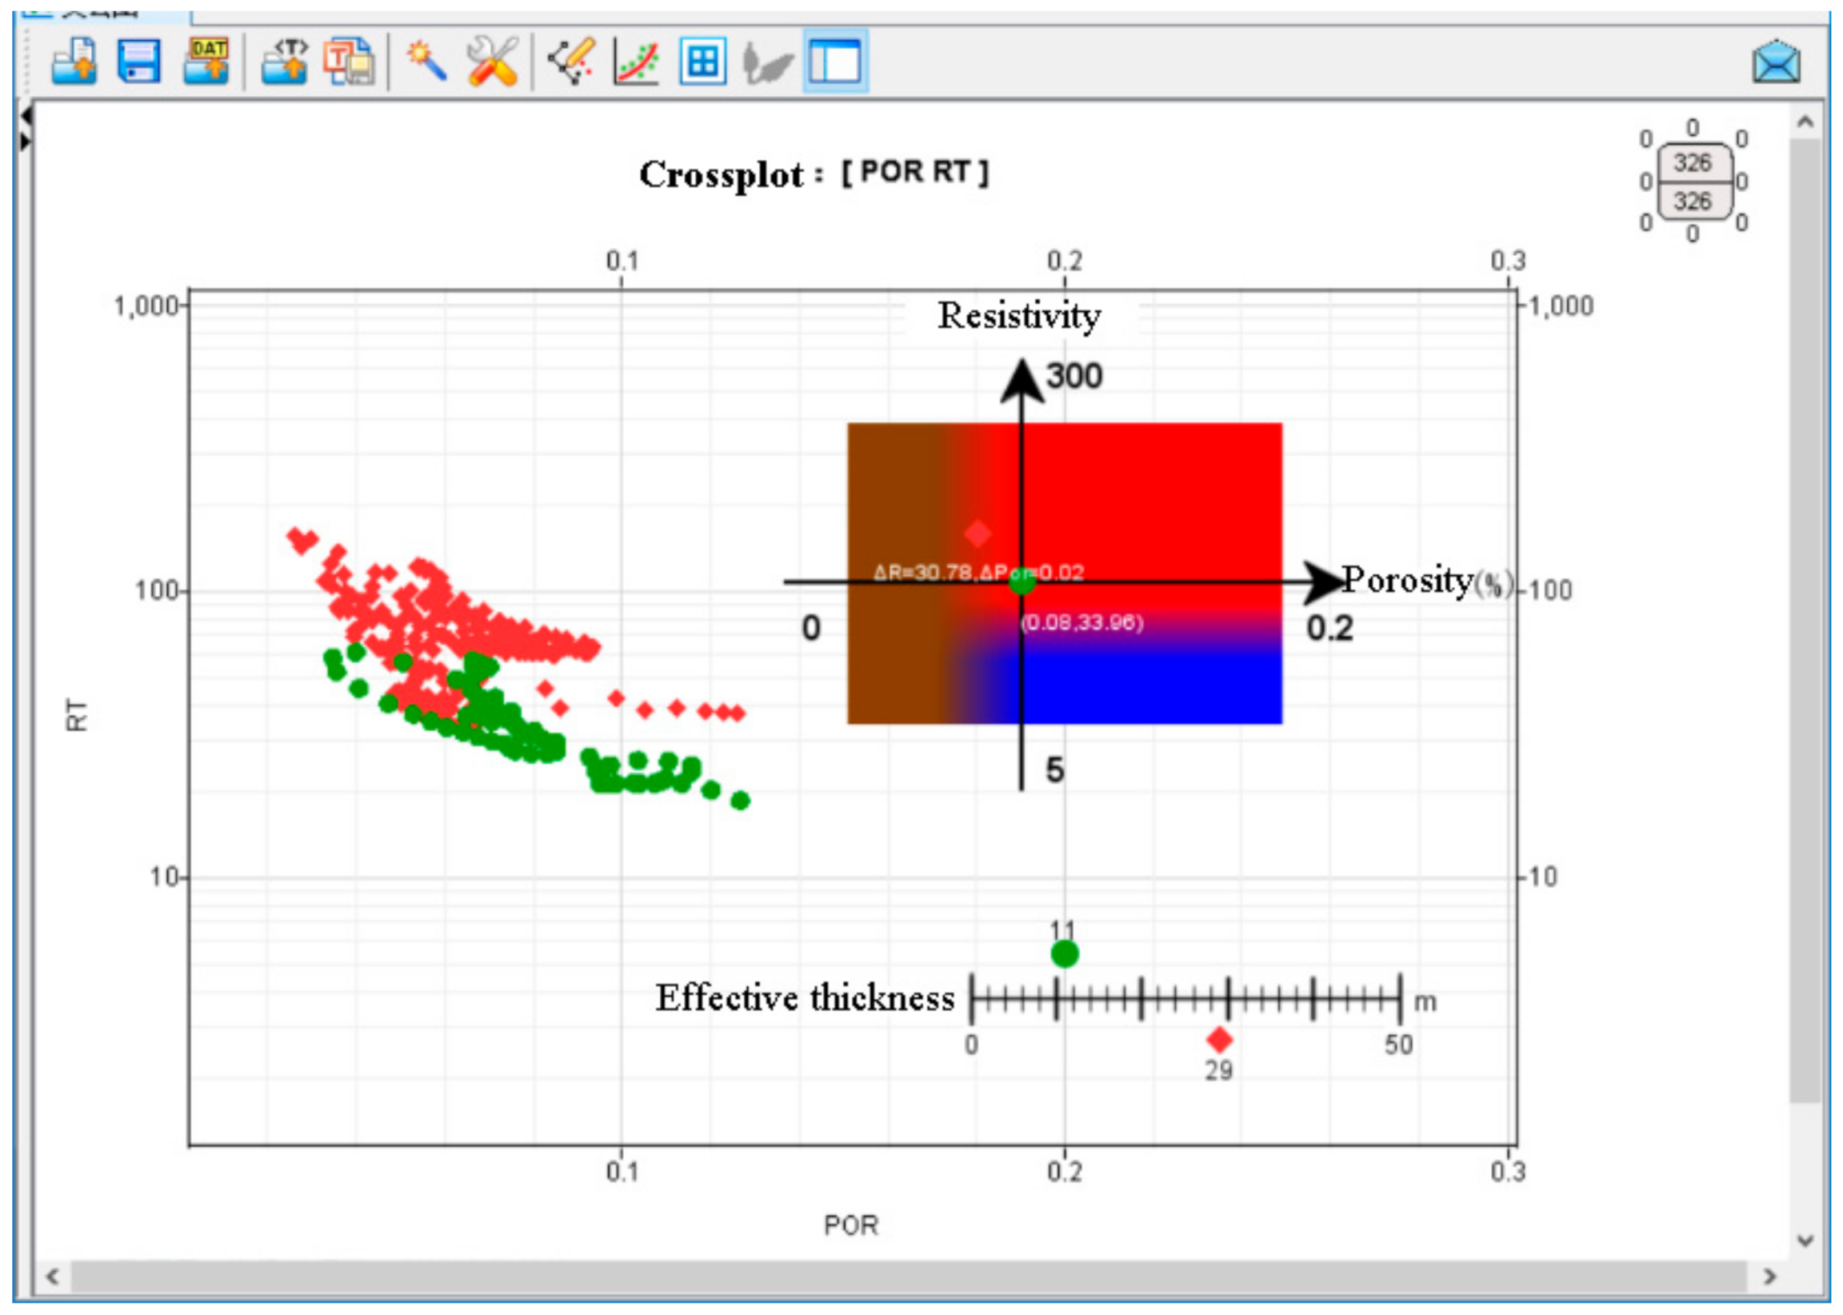
4.3. Productivity Prediction Crossplot
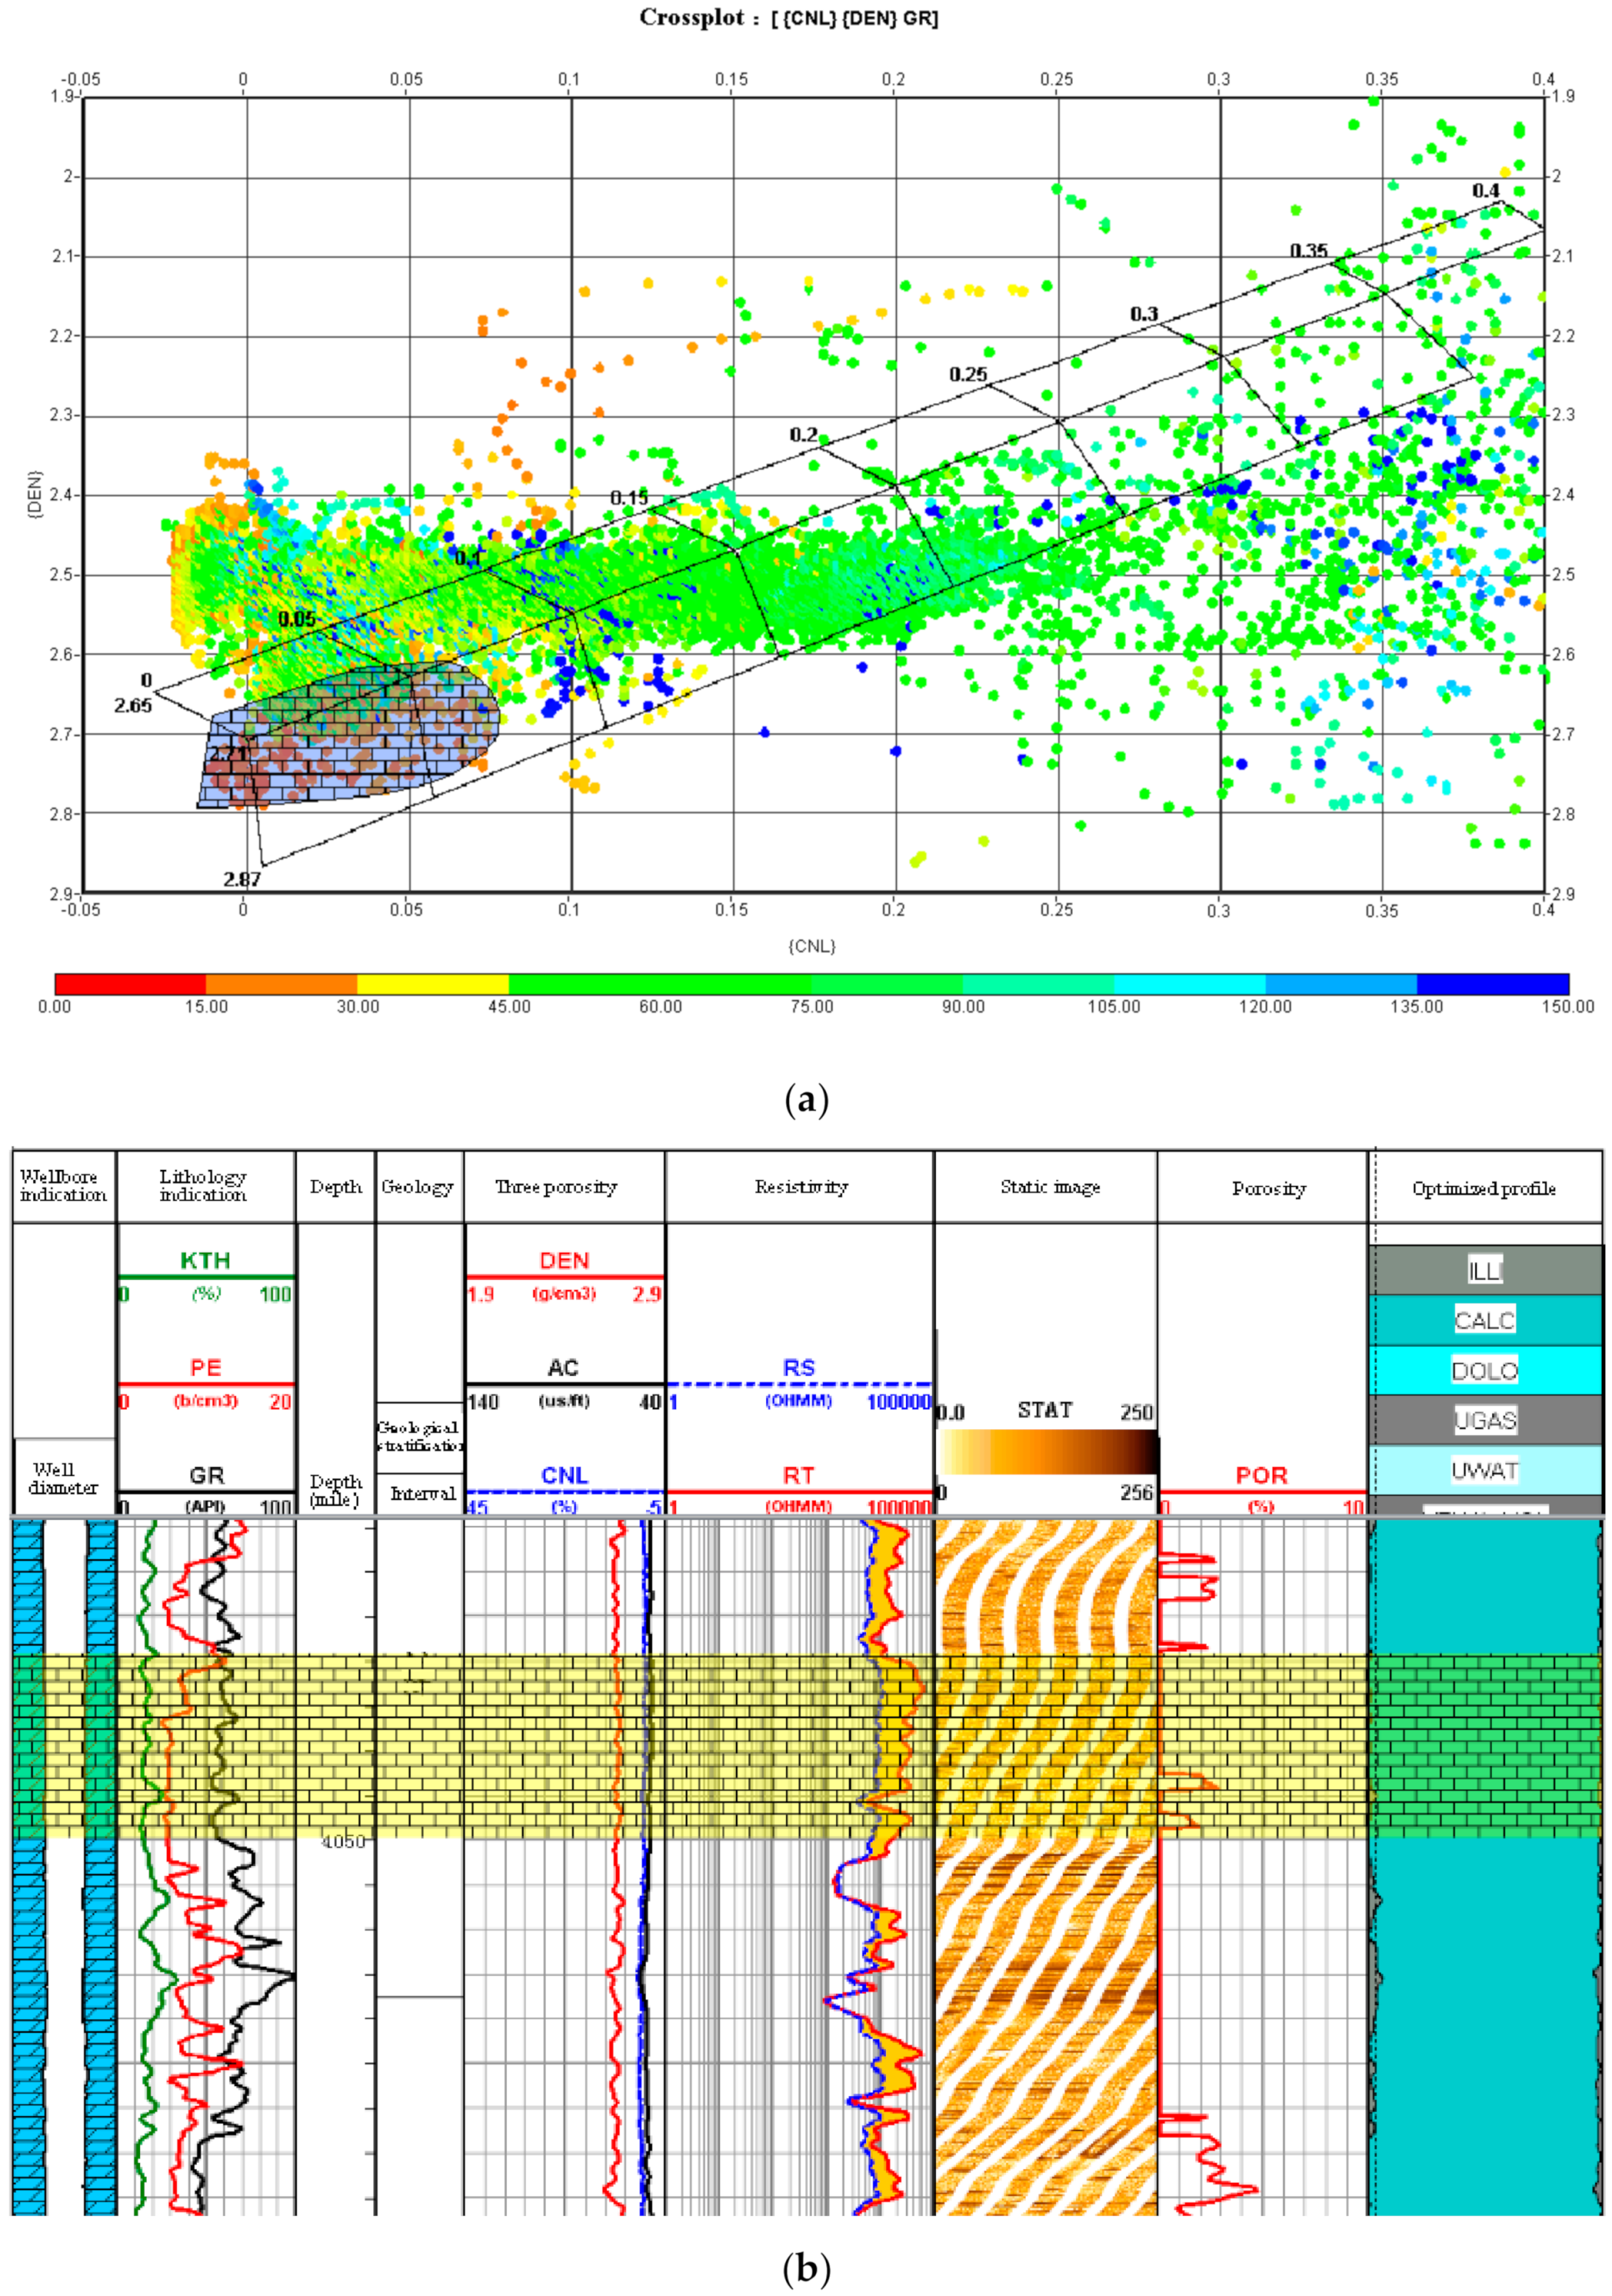
4.4. Multi-Module Auxiliary Crossplots Augmented-Dimensional Analysis
5. Discussion
- (1)
- (2)
6. Conclusions
Author Contributions
Funding
Institutional Review Board Statement
Informed Consent Statement
Data Availability Statement
Conflicts of Interest
References
- Xianhong, L.; Hao, H.; Jiangwa, Z. Application of Background Deviation Distance Method in AVO Crossplot Analysis. In Proceedings of the 11th Excellent Academic Paper Selection Meeting of Hubei Petroleum Society, Wuhan, China, 14–18 August 2004; pp. 143–147. [Google Scholar]
- Lei, W.; Huaimin, X.; Hancheng, J. Application of Neural Network Technology Based on Crossplot and Multivariate Statistics in Volcanic Rock Identification. Oil Geophys. Prospect. 2006, 41, 81. [Google Scholar]
- Limei, L.; Gaoming, Y.; Ming, L.; Huan, Y. Application of Neural Network Simulation Crossplot in Fluid Identification of Low Resistivity Reservoir in H Oilfield. Pet. Geol. Eng. 2011, 25, 39–40, 43. [Google Scholar]
- Yu, G.; Aguilera, R. Use of Pickett Plots for Evaluation of Shale Gas Formations. In Proceedings of the SPE Annual Technical Conference and Exhibition, Denver, CO, USA, 30 October–2 November 2011. [Google Scholar] [CrossRef]
- Delong, X.; Tao, L.; Baohua, H.; Na, L. Study on Identification of Lithology and Fluid Types in Foreign M Oilfield by Crossplot Method. Prog. Geophys. 2012, 27, 1123–1132. [Google Scholar]
- Xingneng, W.; Chengwen, X.; Chengsen, Z.; Guo, H.B.; Wentong, F. A New Method for Multimineral Treatment of Carbonate Rock Based on Intersection Technique. Well Logging Technol. 2014, 38, 228–233. [Google Scholar]
- Moradi, S.; Moeini, M.; Al-Askari, M.K.G.; Mahvelati, E.H. Determination of Shale Volume and Distribution Patterns and Effective Porosity from Well Log Data Based on Cross-Plot Approach for A Shaly Carbonate Gas Reservoir. IOP Conf.Ser. Earth Environ. Sci. 2016, 44, 042002. [Google Scholar] [CrossRef] [Green Version]
- Xiaochang, W.; Zhang, J.; Jun, L.; Song, H.; Qiangfu, K. Conventional Logging Identification Method of Fracture—Cave Type Based on Crossplot Decision Tree—A Case Study of Ordovician in Tahe Oilfield. Oil Gas Geol. 2017, 38, 805–812. [Google Scholar]
- Choi, J.; Kim, B.; Kim, S.; Byun, J.; Popovici, A.M.; Fomel, S. Probabilistic facies analysis using 3D crossplot of stochastic forward-modeling results. In Proceedings of the 2017 SEG International Exposition and Annual Meeting, Houston, TX, USA, 24–27 September 2017. [Google Scholar] [CrossRef]
- Wodajo, L.T. Integrity Assessment of Earthen Dams and Levees Using Cross-Plot Analysis of Seismic Refraction and Electrical Resistivity Tomograms. Ph.D. Thesis, University of Mississippi, Oxford, MS, USA, 2018. [Google Scholar]
- Mondal, S.; Yadav, A.; Chatterjee, R. Integration of rock physical signatures with depositional environments: A case study from East Coast of India. J. Appl. Geophys. 2018, 148, 256–264. [Google Scholar] [CrossRef]
- Austin, O.E.; Agbasi, O.; Samuel, O.; Etuk, S.E. Cross plot Analysis of Rock Properties from Well Log Data for gas detection in Soku Field, Coastal Swamp Depobelt, Niger Delta Basin. J. Geosci. Eng. Environ. Technol. 2018, 3, 180–186. [Google Scholar] [CrossRef]
- Connolly, P. Elastic Property Reflectivities as Basis Vectors for Intercept-Gradient Crossplots. In Proceedings of the 81st EAGE Conference and Exhibition 2019, London, UK, 3–6 June 2019. [Google Scholar] [CrossRef]
- Okeugo, C.G.; Onuoha, K.M.; Ekwe, C.A.; Anyiam, O.A.; Dim, C.I.P. Application of crossplot and prestack seismic-based impedance inversion for discrimination of lithofacies and fluid prediction in an old producing field, Eastern Niger Delta Basin. J. Pet. Explor. Prod. Technol. 2019, 9, 97–110. [Google Scholar] [CrossRef]
- Lim, U.Y.; Gibson, R.L., Jr.; Kabir, N. Estimation of total organic carbon (TOC) content of shale from AVO inversion: A new crossplot approach based on Zoeppritz equations. In Proceedings of the SPE/AAPG/SEG Unconventional Resources Technology Conference, Denver, CO, USA, 22–24 July 2019; pp. 2247–2259. [Google Scholar]
- Wodajo, L.T.; Hickey, C.J.; Brackett, T.C. Application of Seismic Refraction and Electrical Resistivity Cross-Plot Analysis: A Case Study at Francis Levee Site. In Levees and Dams; Springer: Cham, Switzerland, 2019; pp. 23–40. [Google Scholar] [CrossRef]
- Ehsan, M.; Gu, H. An integrated approach for the identification of lithofacies and clay mineralogy through Neuro-Fuzzy, cross plot, and statistical analyses, from well log data. J. Earth Syst. Sci. 2020, 129, 101. [Google Scholar] [CrossRef]
- Radwan, A.E. Hydrocarbon type estimation using the synthetic logs: A case study in Baba Member, Gulf of Suez, Egypt. AAPG/Datapages Search Discov. Artic. 2020, 20475. [Google Scholar] [CrossRef]
- Choi, J.; Kim, S.; Kim, B.; Byun, J. Probabilistic reservoir characterisation using 3D pdf of stochastic forward modelling results in Vincent oil field. Explor. Geophys. 2020, 51, 341–354. [Google Scholar] [CrossRef]
- Zakaria, M.T.; Muztaza, N.M.; Zabidi, H.; Salleh, A.N.; Mahmud, N.; Samsudin, N.; Rosli, F.N.; Olugbenga, A.T.; Jia, T.Y. 2-D Cross-Plot Model Analysis Using Integrated Geophysical Methods for Landslides Assessment. Appl. Sci. 2021, 11, 747. [Google Scholar] [CrossRef]
- Azuoko, G.-B.; Ekwe, A.; Emmanuel, A.; Usman, A.; Ndidiamaka, E.; Victor, O.; Kufre, U. Rock Property Cross-Plot Analysis and Post-Stack Acoustic Impedance Inversion for Optimal Reservoir Characterization in Aplha Field, Onshore Niger Delta Basin. In Proceedings of the SPE Nigeria Annual International Conference and Exhibition, Lagos, Nigeria, 1–3 August 2021. [Google Scholar]
- Jiao, C.; He, S.; Xie, Q.; Gu, D.; Zhu, H.; Sun, L.; Liu, H. Experiment for stress sensitivity of ultra-low permeability sandstone reservoir. Acta Pet. Sin. 2011, 32, 489–494. [Google Scholar]
- Ning, L.; Caizhi, W.; Liu, Y.M.; Weizhong, L.; Shouji, X.; Field, A.W. CIFLog: The 3rd generation logging software based on Java-Netbeans. Acta Pet. Sin. 2013, 34, 192–200. [Google Scholar]
- Caizhi, W.; Ning, L.; Liu, Y.M. Application of component development technology in large-scale well logging software platform-CIFLog. Acta Pet. Sin. 2014, 35, 402–406. [Google Scholar]
- Ning, L.; Caizhi, W.; Liu, Y.M.; Weizhong, L.; Shouji, X.; Haicheng, F.; Field, A.W. The Integrated network logging processing and interpretation software platform CIFLog. Oil Forum 2013, 32, 6–10, 65. [Google Scholar]
- Shouji, X.; Ning, L.; Weizhong, L.; Xiaobai, L. Design of integration framework for multi-language applications on logging platform in Java. Acta Pet. 2010, 31, 810–814. [Google Scholar]
- Chun, C. CIFLog: The 3rd generation logging software is released in China. Pet. Explor. Dev. 2011, 38, 281. [Google Scholar]
- Ning, L.; Caizhi, W.; Hongliang, W.; Kewen, W. Independent R&D of CIFLog Logging Software and Its Development Orientation. Oil Forum 2021, 40, 113–117. [Google Scholar]
- Li, N.; Wang, M.; Cui, J.; Wang, J.; Wang, C. CifNet network multi-well data management system. Appl. Geophys. 2004, 1, 129–131. [Google Scholar] [CrossRef]
- Zhao, Y.; Li, N.; Wang, C. Remote wireless transmission and error recovery of log data. Appl. Geophys. 2007, 4, 308–312. [Google Scholar] [CrossRef]
- Bentley, J.L. Multidimensional Binary Search Trees in Database Applications. IEEE Trans. Softw. Eng. 1979, 5, 333–340. [Google Scholar] [CrossRef]
- Hassanat, A.B.A. Norm-Based Binary Search Trees for Speeding Up KNN Big Data Classification. Computers 2018, 7, 54. [Google Scholar] [CrossRef] [Green Version]
- Komorowski, M.; Trzciński, T. Random Binary Search Trees for approximate nearest neighbour search in binary spaces. Appl. Soft Comput. 2019, 79, 87–93. [Google Scholar] [CrossRef]
- Hsu, L.R.; Reinhardt, S.K.; Iyer, R.; Makineni, S. Communist, utilitarian, and capitalist cache policies on CMPs: Caches as a shared resource. In Proceedings of the 15th International Conference on Parallel Architectures and Compilation Techniques, Seattle, WA, USA, 16–20 September 2006; pp. 13–22. [Google Scholar]
- Jain, P.N.; Surve, S.K. A review on shared resource contention in multicores and its mitigating techniques. Int. J. High Perform. Syst. Archit. 2020, 9, 20–48. [Google Scholar] [CrossRef]
- El-Sayed, N.; Mukkara, A.; Tsai, P.-A.; Kasture, H.; Ma, X.; Sanchez, D. KPart: A hybrid cache partitioning-sharing technique for commodity multicores. In Proceedings of the 2018 IEEE International Symposium on High Performance Computer Architecture (HPCA), Vienna, Austria, 24–28 February 2018; IEEE: Piscataway, NJ, USA, 2018; pp. 104–117. [Google Scholar]
- Liu, Y.M.; Ning, L.; Shouji, X.; Caizhi, W.; Ling, Z. Design and realization of the high-efficiency data operation cache on the Java well logging software platform. Pet. Explor. Dev. 2011, 38, 328–331. [Google Scholar]
- Yu, S.; Langar, R.; Fu, X.; Wang, L.; Han, Z. Computation Offloading with Data Caching Enhancement for Mobile Edge Computing. IEEE Trans. Veh. Technol. 2018, 67, 11098–11112. [Google Scholar] [CrossRef]
- Yerry, M.A.; Shephard, M.S. A Modified Quadtree Approach to Finite Element Mesh Generation. IEEE Comput. Graph. Appl. 1983, 3, 39–46. [Google Scholar] [CrossRef]
- Zhongliang, F.; Yulong, H.; Baofeng, W.; Rui, P. M-Quadtree Index: A Spatial index: Index Method for Cloud Storage Environment Based on Modified Quadtree Coding Approach. Acta Geod. Cartogr. Sin. 2016, 45, 1342–1351. [Google Scholar] [CrossRef]
- Park, K. A hierarchical binary quadtree index for spatial queries. Wirel. Netw. 2019, 25, 1913–1929. [Google Scholar] [CrossRef]
- Rasool, Z.; Zhou, R.; Chen, L.; Liu, C.; Xu, J. Index-based Solutions for Efficient Density Peaks Clustering. IEEE Trans. Knowl. Data Eng. 2020, 1. [Google Scholar] [CrossRef]
- Ning, L.; Binsen, X.; Hongliang, W.; Zhou, F.; Yusheng, L.; Kewen, W.; Peng, L. Application status and prospects of artificial intelligence in well logging and formation evaluation. Acta Pet. Sin. 2021, 42, 508–522. [Google Scholar]
- Hua, W.; Yushun, Z. Research Status and Prospect of Artificial Intelligence in Logging Data Processing and Interpretation. Well Logging Technol. 2021, 45, 345–356. [Google Scholar]
- Alghamdi, M. AI Driven Approach to Predict Sonic Response Utilizing Typical Formation Evaluation Logs. In Proceedings of the International Petroleum Technology Conference, Riyadh, Saudi Arabia, 21–23 February 2022. [Google Scholar] [CrossRef]
- Abe, S.; Olowokere, M.; Enikanselu, P. Development of model for predicting elastic parameters in ‘bright’ field, Niger Delta using rock physics analysis. NRIAG J. Astron. Geophys. 2018, 7, 264–278. [Google Scholar] [CrossRef]
- Hayashi, K.; Inazaki, T.; Kitao, K.; Kita, T. Statistical Estimation of Soil Parameters in from Cross-Plots of S-Wave Velocity and Resistivity Obtained by Integrated Geophysical Method. In Levees and Dams; Springer: Cham, Switzerland, 2019; pp. 1–21. [Google Scholar] [CrossRef]
- Daniel, O.; Ayuk, M. Rock physics analysis as a tool for enhancing characterization of Niger Delta deep water sands. Arab. J. Geosci. 2022, 15, 1–12. [Google Scholar] [CrossRef]


| Cache Information | Description |
|---|---|
| Curve list | Curve data used in multi-well multi-dimensional module processing |
| Layer list | Multi—well Multi—dimensional Module Processing Deep Layer |
| Exegetical mode | Interpretation Model Formula for Multi—well Multi—dimensional Module Processing |
| Processing parameters | Processing parameters formed by multi-well multi-dimensional module processing, such as skeleton density |
| resource information | Resource information for multi-well and multi-dimensional use, such as drawing templates, color labels, etc. |
| Adjacent well date | adjacent well test results, lithology, physical properties, water analysis data and other information |
Publisher’s Note: MDPI stays neutral with regard to jurisdictional claims in published maps and institutional affiliations. |
© 2022 by the authors. Licensee MDPI, Basel, Switzerland. This article is an open access article distributed under the terms and conditions of the Creative Commons Attribution (CC BY) license (https://creativecommons.org/licenses/by/4.0/).
Share and Cite
Cao, M.; Gao, Z.; Yuan, Y.; Yan, Z.; Zhang, Y. A Visualization and Analysis Method by Multi-Dimensional Crossplots from Multi-Well Heterogeneous Data. Energies 2022, 15, 2575. https://doi.org/10.3390/en15072575
Cao M, Gao Z, Yuan Y, Yan Z, Zhang Y. A Visualization and Analysis Method by Multi-Dimensional Crossplots from Multi-Well Heterogeneous Data. Energies. 2022; 15(7):2575. https://doi.org/10.3390/en15072575
Chicago/Turabian StyleCao, Maojun, Zhiyong Gao, Ye Yuan, Zhao Yan, and Yihong Zhang. 2022. "A Visualization and Analysis Method by Multi-Dimensional Crossplots from Multi-Well Heterogeneous Data" Energies 15, no. 7: 2575. https://doi.org/10.3390/en15072575
APA StyleCao, M., Gao, Z., Yuan, Y., Yan, Z., & Zhang, Y. (2022). A Visualization and Analysis Method by Multi-Dimensional Crossplots from Multi-Well Heterogeneous Data. Energies, 15(7), 2575. https://doi.org/10.3390/en15072575