Article

Simulation and Modeling of Ported Shroud Effects on Radial Compressor Stage Stability Limits

Dipartimento di Ingegneria Meccanica, Energetica, Gestionale e dei Trasporti (DIME), Università degli Studi di Genova, Via Montallegro 1, 16145 Genoa, Italy
*
Author to whom correspondence should be addressed.
Energies 2022, 15(7), 2571; https://doi.org/10.3390/en15072571
Submission received: 5 March 2022 / Revised: 29 March 2022 / Accepted: 30 March 2022 / Published: 1 April 2022
(This article belongs to the Section J: Thermal Management)

Abstract

:
The design features of a centrifugal compressor must guarantee high performance and a wide operating range. The ported shroud was developed specifically to extend the operating limit. It is a passive flow control device based on a cavity for flow recirculation to avoid blade passage blocking in near surge conditions. A CFD simulation campaign using a simplified model identified the differences in the performance of the centrifugal compressor with ported shroud, compared to the baseline case. The use of a stability criterion to determine the limit mass flow rate, developed in a previous study by the authors, highlighted and quantified the extension of the surge margin in the case with ported shroud for different rotational speeds. An increase in the surge margin of 11% was detected at design speed, but with a lower trend at higher speeds. An in-depth flow analysis showed the main physical mechanisms in the compressor that occur for different operating conditions: at near surge conditions the cavity recirculates the low momentum flow located in the inducer region; it re-energizes the mainstream decreasing the circumferential velocity component; an improvement of up to 7% of the pressure ratio was obtained. Instead, at best efficiency conditions the flow recirculation worsens the performance by reducing the flow incidence at the rotor leading edge. Finally, using unsteady simulations with a complete 3D model and with the application of the stability criterion it was possible to confirm that the ported shroud can effectively extend the operating range.

1. Introduction

Centrifugal compressors are increasingly used due to their intrinsic ability of achieving high-pressure ratios, despite their small size. They are widely used in various applications, from industrial (to supply compressed air, cooling systems, natural gas, or process fluid) to automotive. In this latter sector, centrifugal compressors have become an important technology not only to increase the engine performance, but also for the downsizing strategies, to reduce carbon emissions [1,2]. Radial compressors for turbocharging require a wide operating range, which is limited by two distinct phenomena: the choking at high mass flow rate and the surge at low mass flow rate. The surge phenomenon induces strong mass flow oscillations and pressure fluctuations that can cause severe damage to the compressor and to the entire system. These unstable conditions must be absolutely avoided, and a large surge margin is a design strategy with increasing importance.
There are two main approaches to increase the operating range of a centrifugal compressor: active or passive flow control devices. The former method uses add-ons or actuation devices; among them are the variable inlet guide vanes [3,4,5]. The latter method induces changes in the flow structure. The passive control system includes casing treatment (such as ported shroud [6,7,8]), inducer casing bleed system [9], and internal recirculation or ring groove arrangements [10]. In modern automotive turbochargers, it is common practice to install the ported shroud due to its low production cost and simplicity of the design; this device was initially proposed by Fisher in 1988 [11]. It consists of an axisymmetric cavity that connects a portion of the impeller with the adduction duct. The cavity of the ported shroud is usually designed with a U- or L-like shape. Its operating principle consists of forcing the low momentum flow, in the inducer region at low mass flow rate, to be ingested and recirculated into the cavity. This flow is re-injected into an upstream section, where it mixes with the main flow. In this way, the incoming stream to the rotor inducer is re-energized with a reduction in the low momentum flow, that otherwise would partially obstruct the inducer area [12]. With the above strategy, the surge condition can be shifted to a lower mass flow. On the other hand, the performance can decrease for certain conditions far from surge due to the cavity flow. Numerous scientific works have been focused on the study and optimization of the ported shroud strategy. Several researchers confirmed that the benefit of this device, in terms of extension of the surge margin, is due to the considerable amount of swirl in the same direction of the rotor produced by the recirculated flow at the impeller inducer [13]. Other authors believed that it is more effective to introduce a counter swirl through the installation of vanes into the cavity, to control the recirculating flow, extending the surge margin without excessive efficiency penalty [14]. Tamaki [15,16] installed a guide vane inside the recirculation cavity on a high-pressure turbocharger and achieved a significant improvement in the surge margin. Nikpour [17] worked on optimizing the ported shroud geometry, in particular by analyzing the slot positions, the passage area, and the cavity length. Xiao et al. [18] studied different slot positions and found that moving the cavity opening further upstream to the impeller can reduce the worsening of the compressor efficiency, but it reduces the surge margin extension due to a lower mass flow rate into the cavity. Sivagnanasundaram et al. [9] studied the effect of the cavity width on the shroud of the impeller, demonstrating that a width increase extends the surge margin, with a worsening of the compressor stage efficiency. Kanzaka et al. [19] analyzed the number of struts and verified a more uniform axial velocity distribution along the span. Intensive experimental campaigns to investigate surge phenomena, on a specific circuit, have been also undertaken both without [20,21] and with ported shroud [22,23]. Moreover, the ported shroud has been analyzed to understand its acoustic characteristics near surge [24] and at design conditions [25].
CFD techniques are currently used for the design and flow analysis of turbomachinery, even with fully 3D stage configuration. Complete, fully 3D unsteady analysis can be performed to study the component coupling near surge conditions [26] or to simulate a complete surge cycle [27]. The same authors performed unsteady simulations at near surge conditions in centrifugal compressors with vaned diffusers [28]. In previous works, the authors have developed different criteria to predict the limit mass flow rate at surge conditions by using a simple and efficient CFD 3D approach during the design and development phase of a compressor stage. Both vaned [27] and vaneless diffusers [29,30] have been considered.
In this paper, with the use of a specific CFD model, the differences in the performance of a centrifugal compressor with ported shroud compared to a baseline case are investigated. The model was validated by comparing the numerical characteristic curve with available experimental data. Then, a simulation campaign carried out for different rotational speed showed the strengths and the weaknesses of the ported shroud solution [31]. Through the application of the critical angle stability criterion, to determine the limit mass flow rate (previously developed by the authors in centrifugal compressors with a vaneless diffuser [30]) it was possible to detect the extension of the surge margin in the ported shroud case. In addition, the main differences in performance were explained by analyzing the flow structure in the stage for the two configurations at best efficiency and at near surge operating points. The cavity behavior and the characteristics of the recirculated flow are also discussed. Fully 3D unsteady CFD simulation was carried out in order to confirm the effective extension of the operating range predicted by the previous stability criterion coupled to a simple CFD model.

2. Materials and Methods

2.1. Reference Centrifugal Compressor with Ported Shroud Geometry

The machine studied in this paper is a small size centrifugal compressor with ported shroud for turbocharging automotive applications. Since the compressor is proprietary and covered by a non-disclosure agreement, the geometric data are provided in non-dimensional form with respect to the inlet diffuser radius and some numerical data are expressed in corrected form (referred to the corresponding design value) or omitted. The compressor with vaneless diffuser is equipped with six main blades and six splitter blades; both are backswept. Table 1 reports the main non-dimensional geometric ratios of the configuration while Figure 1 shows a sketch of the compressor including all components, i.e., adduction, impeller, diffuser, volute, and ported shroud (the labels define the geometrical data of Table 1).

2.2. CFD Model

The CFD simulations was carried out using mainly two numerical models: the Simple + Volute and the Fully 3D unsteady. The commercial Ansys CFX software was used to solve the Reynolds Averaged Navier–Stokes equations.

2.2.1. Simple + Volute Model

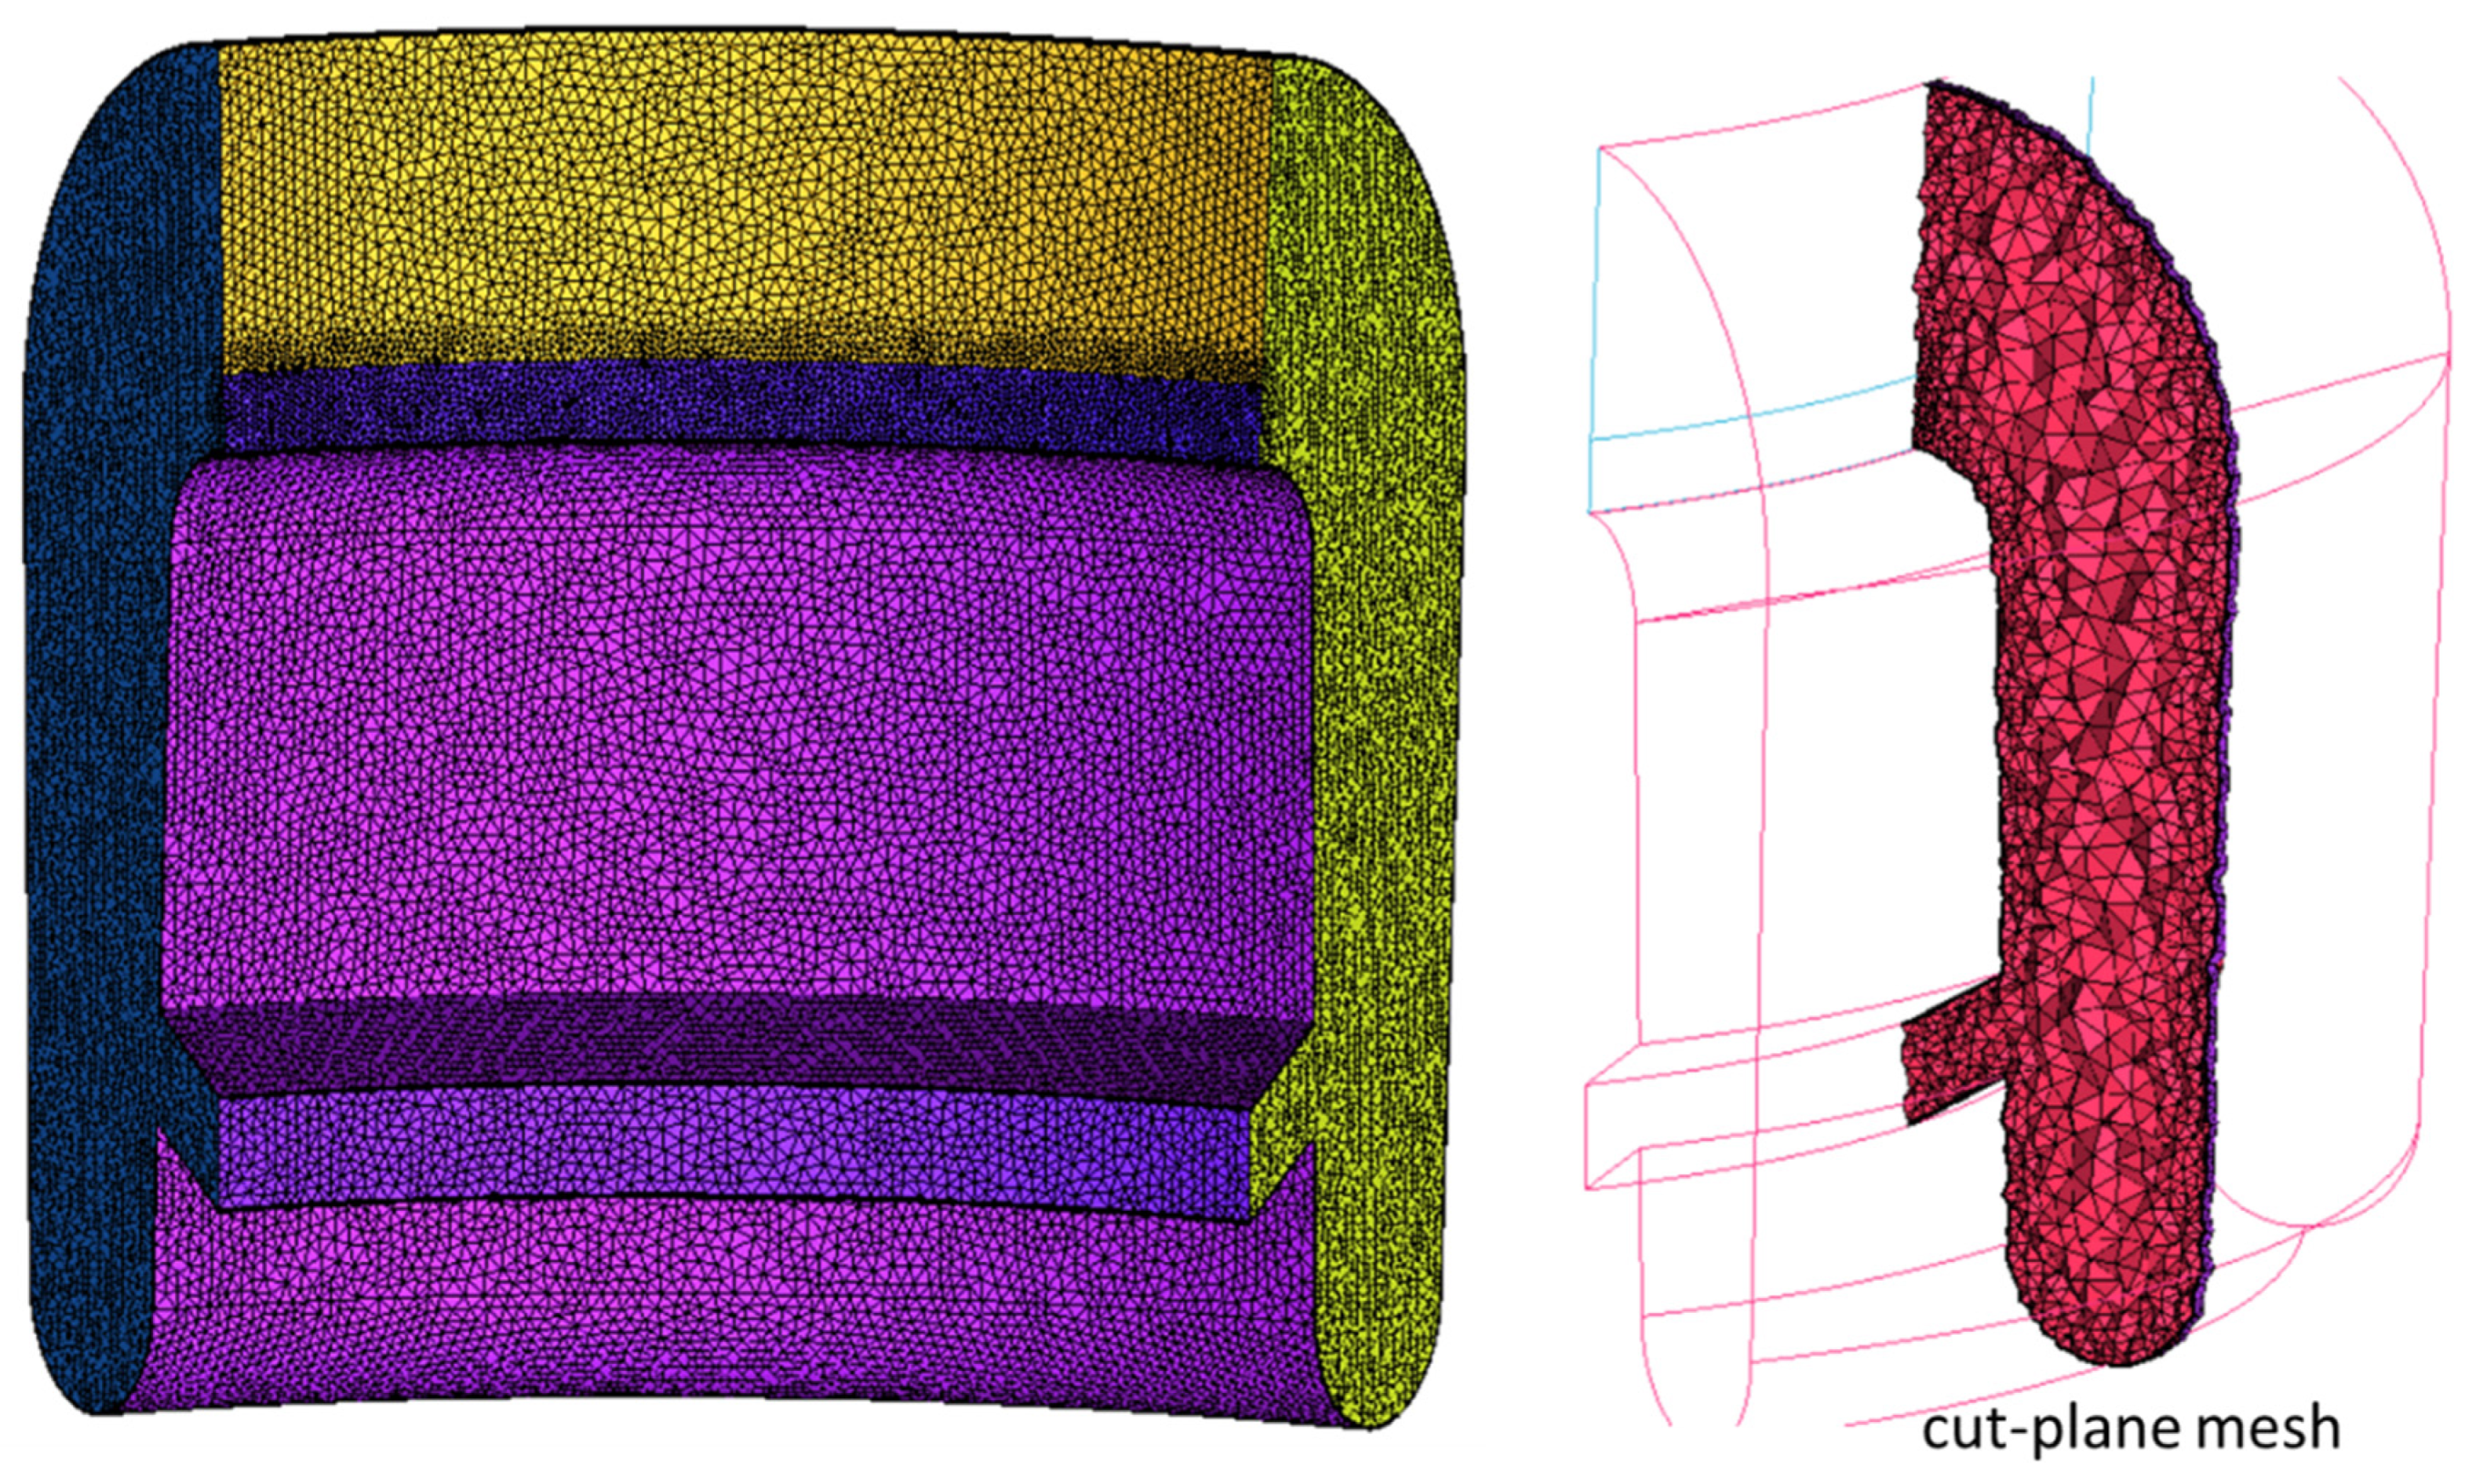
This model was designed to be efficient from a computational point of view to be routinely used in the design phase or to simulate the performance maps in a large dataset of operating conditions. It was tuned and validated from previous research activities [27,28] to simulate the compressor stage performance. It consists of a sector of the adduction channel, a single impeller channel (with a main blade and splitter blade), a single diffuser channel, and the volute with an outlet duct. The ported shroud was added with an angular portion equal to that of the stage (60° from the number of main blades). Figure 2 shows the mesh of the single stage.
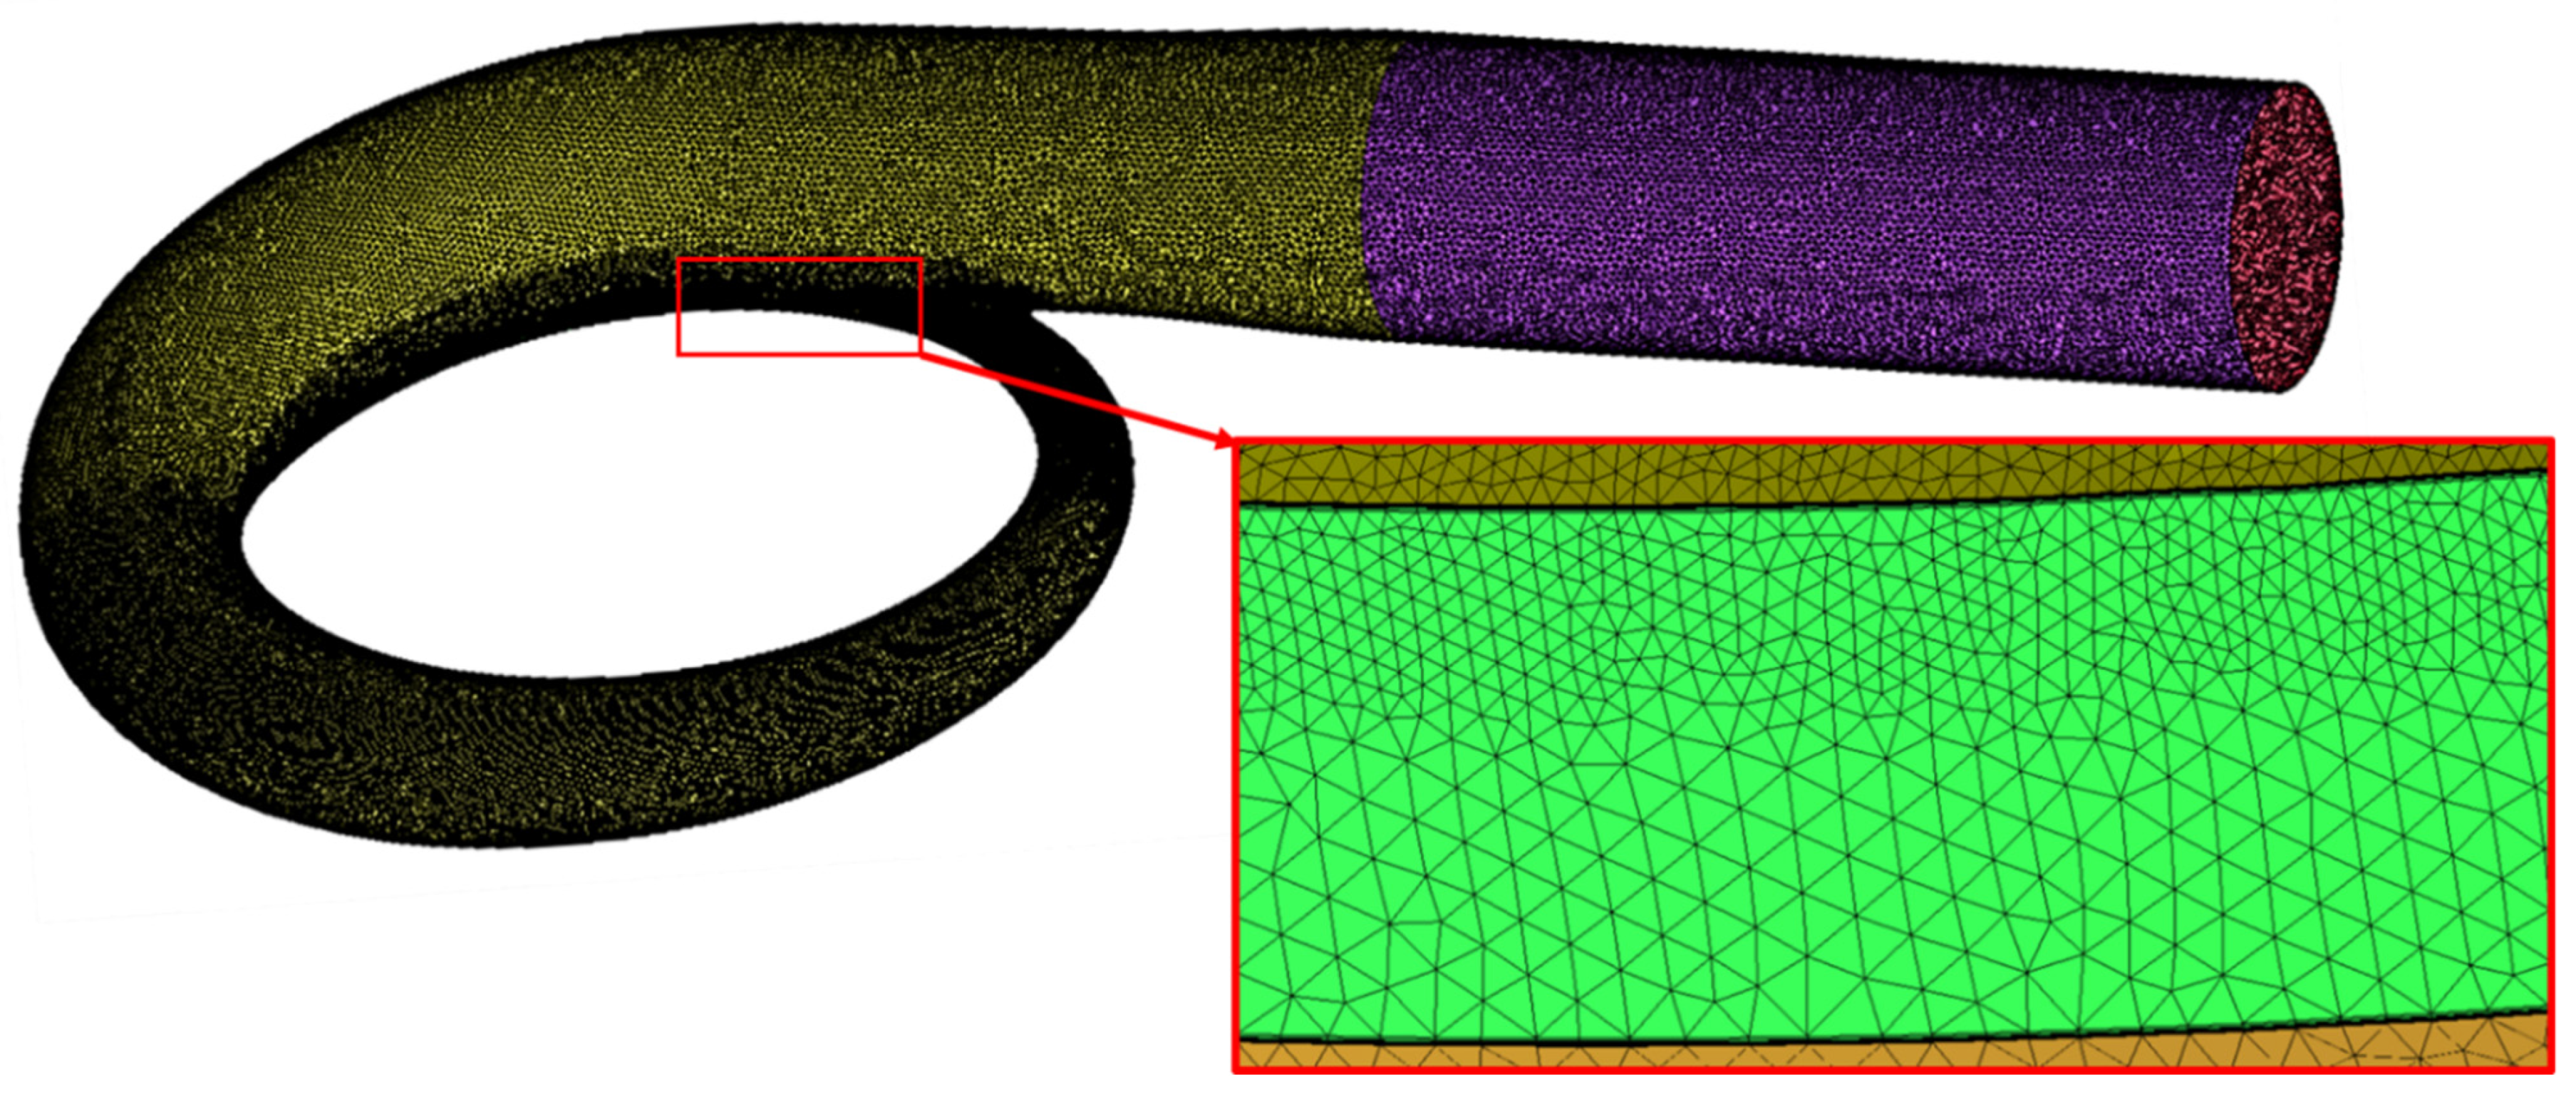
The stage was meshed with Ansys Turbogrid software using a structured mesh with hexahedral elements using the ATM optimized topology. The ported shroud (Figure 3) and the volute (Figure 4) were discretized with an unstructured grid using ICEM CFD from the Ansys CFD platform. Special attention was given to the grid clustering at the walls of each component, in order to ensure a Y+ value lower than unity. At least 48 cells in the blade spanwise direction were used to model the blade with a tip clearance gap. Ten prismatic layers were created in the unstructured grids to solve the boundary layer; a cell size range between 2.0 and 0.1 mm in high curvature regions was used for the tetrahedral elements. The global mesh of the model consists of about 7.1 million cells: 2.16 Mcells for the stage, 1.05 Mcells for the ported shroud portion, and 4.7 Mcells for the volute.
The mesh sensitivity analysis was carried out to select the mesh that predicts a performance variation less than 1% with respect to finer meshes. This sensitivity analysis was performed using the mesh parameters used in previous works for the compressor stage [27,28,29,30]. Here, only a specific grid sensitivity was performed for the additional component, i.e., the ported shroud, where three different grids with different global mesh sizes were tested. In Table 2, the total pressure difference between section A–B and the mass flow rate into the cavity (MRF), for a near surge condition (OP2), are reported for the different grids. The configuration M2 with 1.05 million cells is the most adequate to be used as the reference (negligible variations with finer meshes).
The turbulence model adopted was the k-ω SST, which is a combination of the k-ε and k-ω turbulence models; the former model is used for the free stream flow and the latter is used for modeling near wall turbulence. A local Y+ value lower than one was always obtained using the abovementioned meshes. Mathematical blending functions were employed to switch between models without user interaction [32]. The SST has been frequently applied to model centrifugal compressor flows recently as it provides good predictions of the flow field and compressor performance over a broad range of operating conditions [33]. The total energy model was activated to solve the energy equation written in terms of enthalpy. The following boundary conditions were imposed: at the inlet the total pressure, the total temperature and a turbulence intensity of 5% were set; at the volute outlet the mass flow rate condition was set, except for the near choking conditions where the static pressure was used. The adduction–impeller and impeller–diffuser interfaces were modeled with the mixing plane, as well as the interface between the diffuser and the volute (with a specified pitch angle of 60°–360°). The ported shroud was coupled to the rotating domain (downstream interface) with a frozen rotor interface and a specified pitch angle of 60° on both sides, by using the “not-overlap option” to specify the counter-rotating condition for the impeller shroud. Here, the meshes of the two domains do not face each other; the upstream interface between the adduction duct and the cavity was set up as a simple GGI fluid–fluid interface. Finally, the periodicity condition was set on the side surfaces of the stage and of the ported shroud portion, while the remaining walls were modeled as adiabatic no-slip, with the exception of the upstream hub, which was set as an inviscid wall. All the equations were solved with second order numerical schemes and steady simulations were performed using this model. The experience gained using the proposed simple CFD model is that the numerical instabilities arise at a mass flow rate value lower than the one of the actual stability limit (frequently with a large margin) [27]. This unique aspect is essential for the application of the stability criteria.

2.2.2. Fully 3D Unsteady Model

This model is representative of the complete geometry of the centrifugal compressor. In addition to the volute, in this case both the stage (adduction, impeller, and diffuser) and the ported shroud have an angular extension of 360°. For this reason, the grids of these components were replicated with a global mesh of 24 million cells. This model clearly requires higher computational resources, but it can simulate the actual flow interaction between the stage components. The same boundary conditions were adopted as in the previous model, with the exception of the interfaces between the rotor and stator domains that were set as frozen rotor (in the steady run for the initialization) and stator-rotor for the unsteady runs. In this case, the interface between the diffuser and the volute was modeled as a GGI fluid–fluid interface because the diffuser extension was also 360°. A timestep of 9.5 × 10⁻⁶ s was set that gives an angular resolution of the blade passage equal to 7.5 degrees. The unsteady simulations satisfy the CFL condition and they were stopped only after reaching a periodic behavior in the main monitored quantities.

2.3. Validation

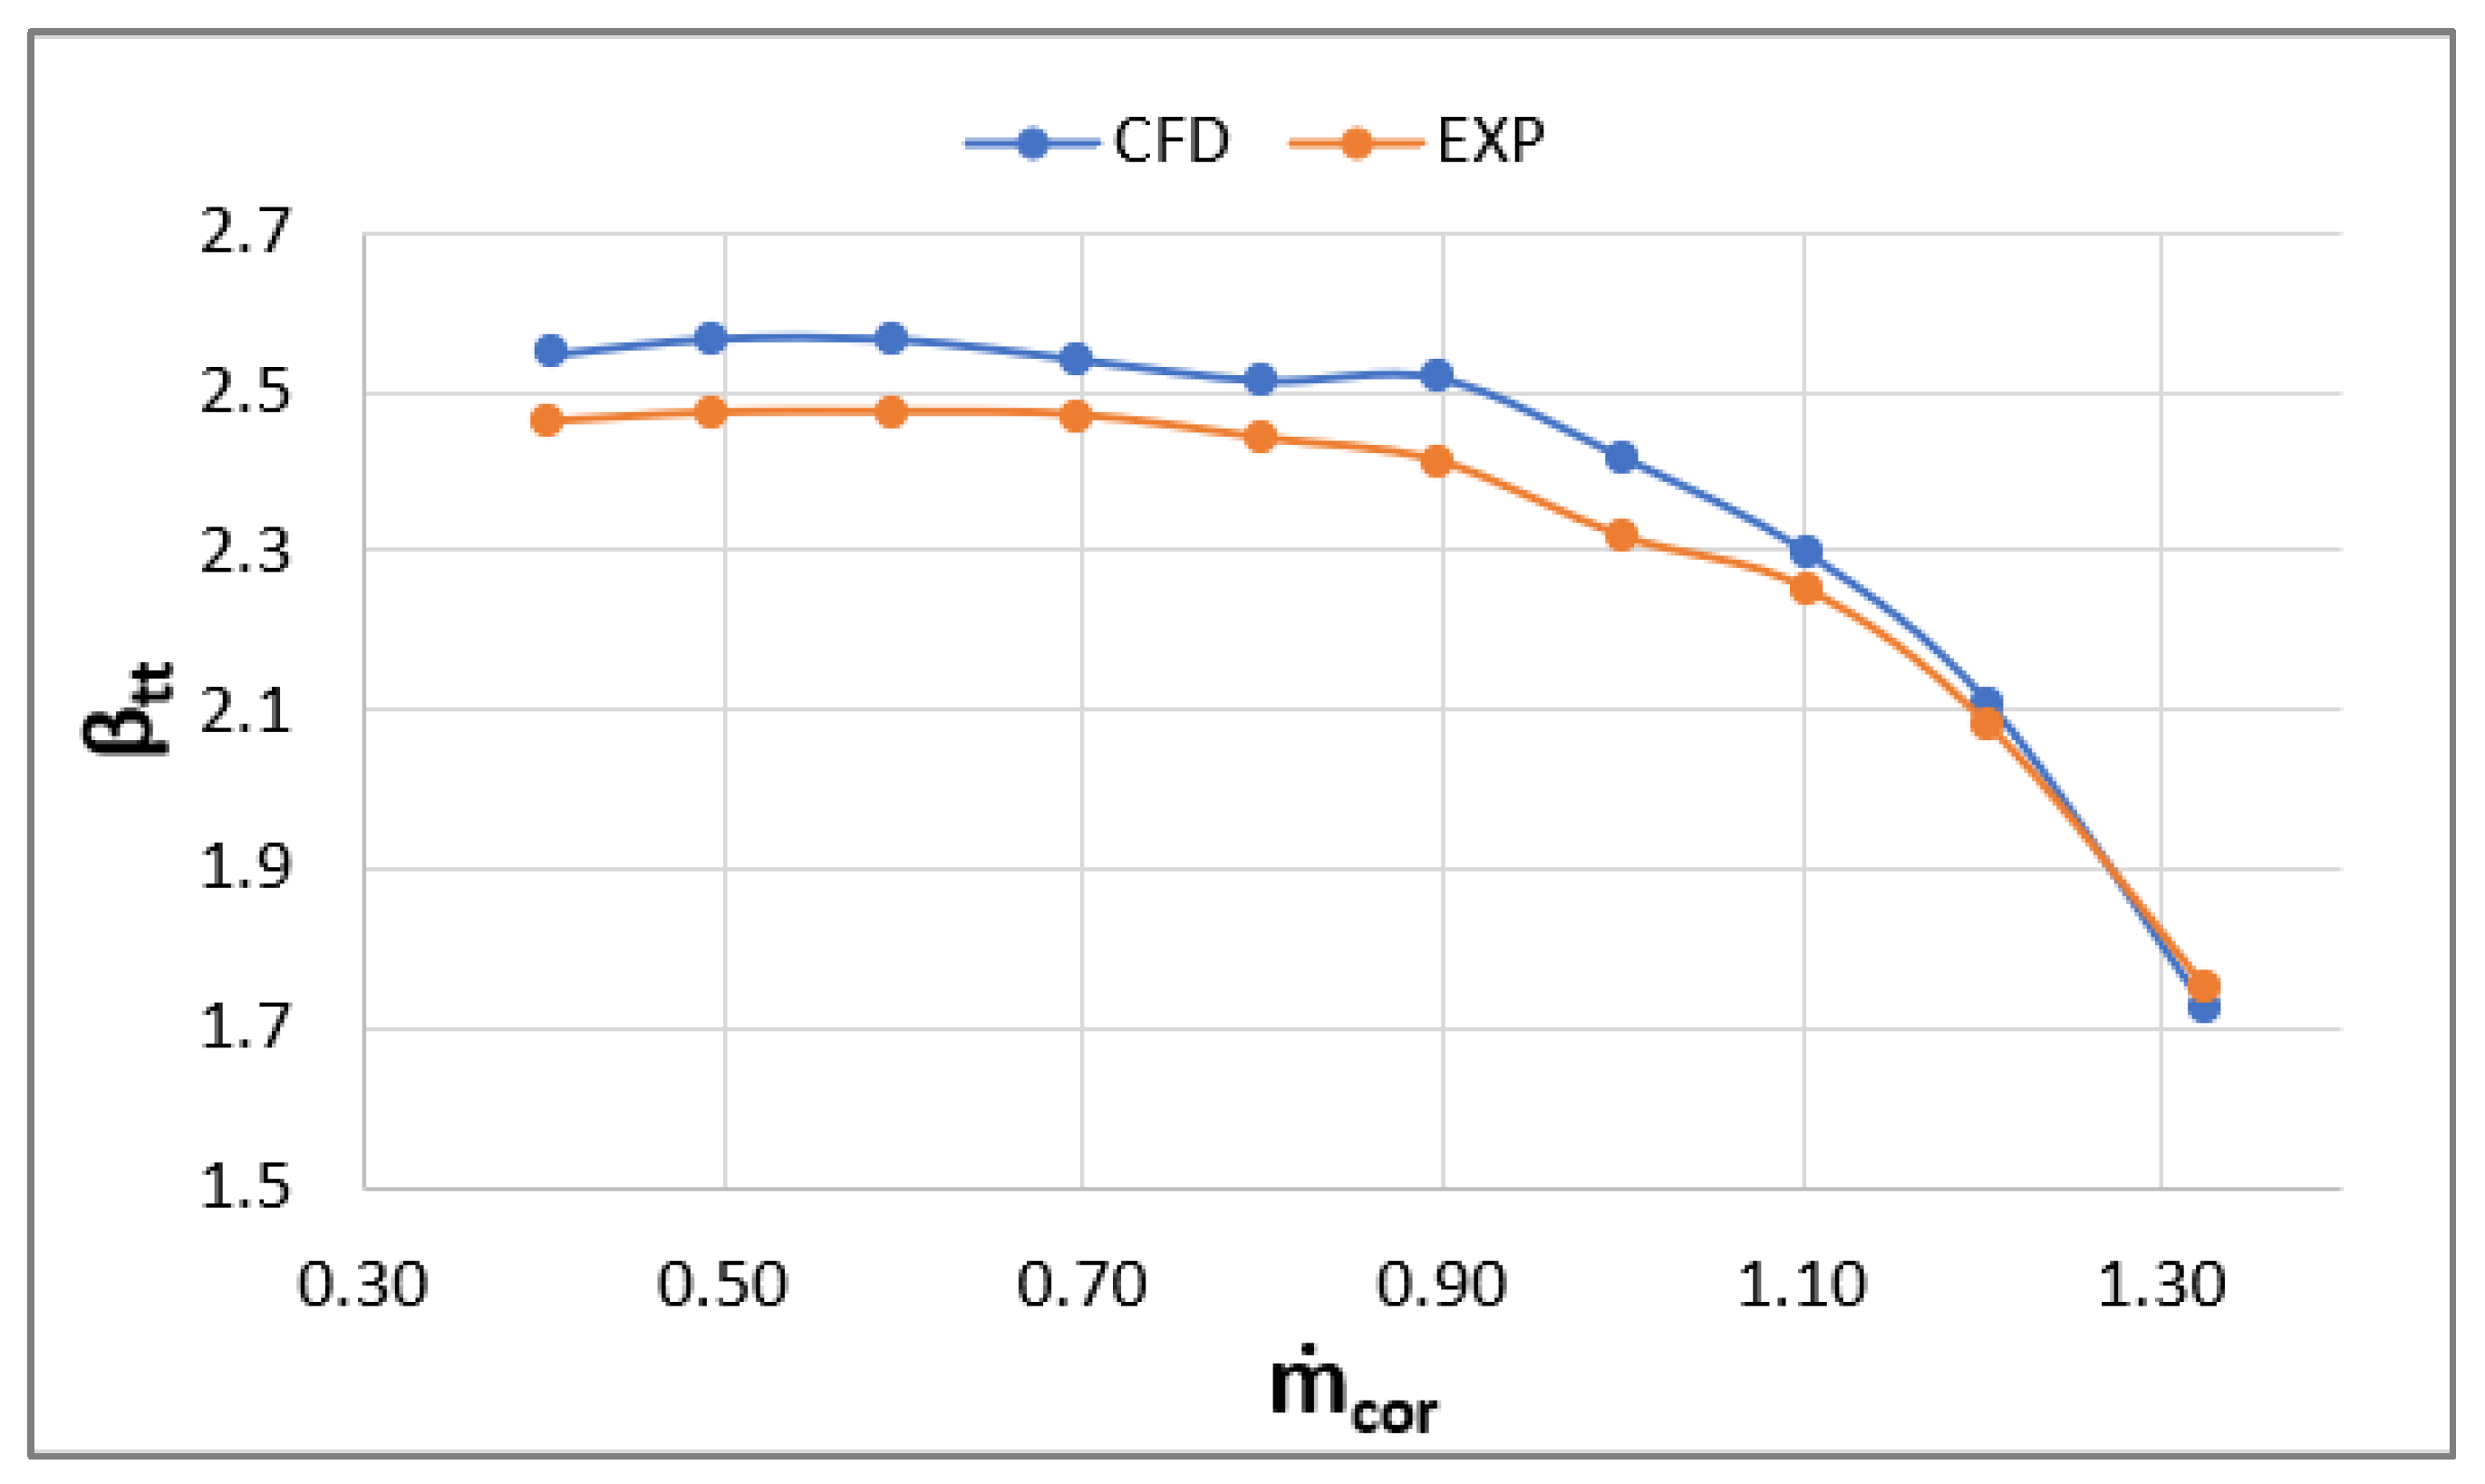
A validation activity of the CFD model adopted for the main analysis, i.e., the Simple + Volute model, was performed. The performance curves from the CFD results of the compressor with ported shroud were compared to the available experimental data from the supplier test rig. This comparison is reported in Figure 5, for the design rotational speed. The total-to-total pressure ratio was plotted versus a corrected mass flow rate (mass flow rate divided by a reference mass flow).
The CFD model perfectly captures the trend with the slope change in the pressure ratio measured experimentally. The numerical curve slightly overestimates the performance and a maximum deviation of 3.5% was detected. The simplified model was considered reliable for the analysis of the performance and flow structure inside the compressor.

3. Results

In this section, the performance comparison with and without the ported shroud is discussed and then a detailed flow analysis shows the main differences in the two configurations, by starting from the flow inside the cavity and then the main effect on the mainstream at the rotor leading edge. The advantage of a wider operating range in the ported shroud was determined through the use of a stability criterion, previously developed by the authors, initially applied to the simplified model and then to the unsteady model, in order to confirm the effectiveness of the additional device and to validate the approach.

3.1. Performance Comparison between the Compressor with Ported Shroud and Baseline

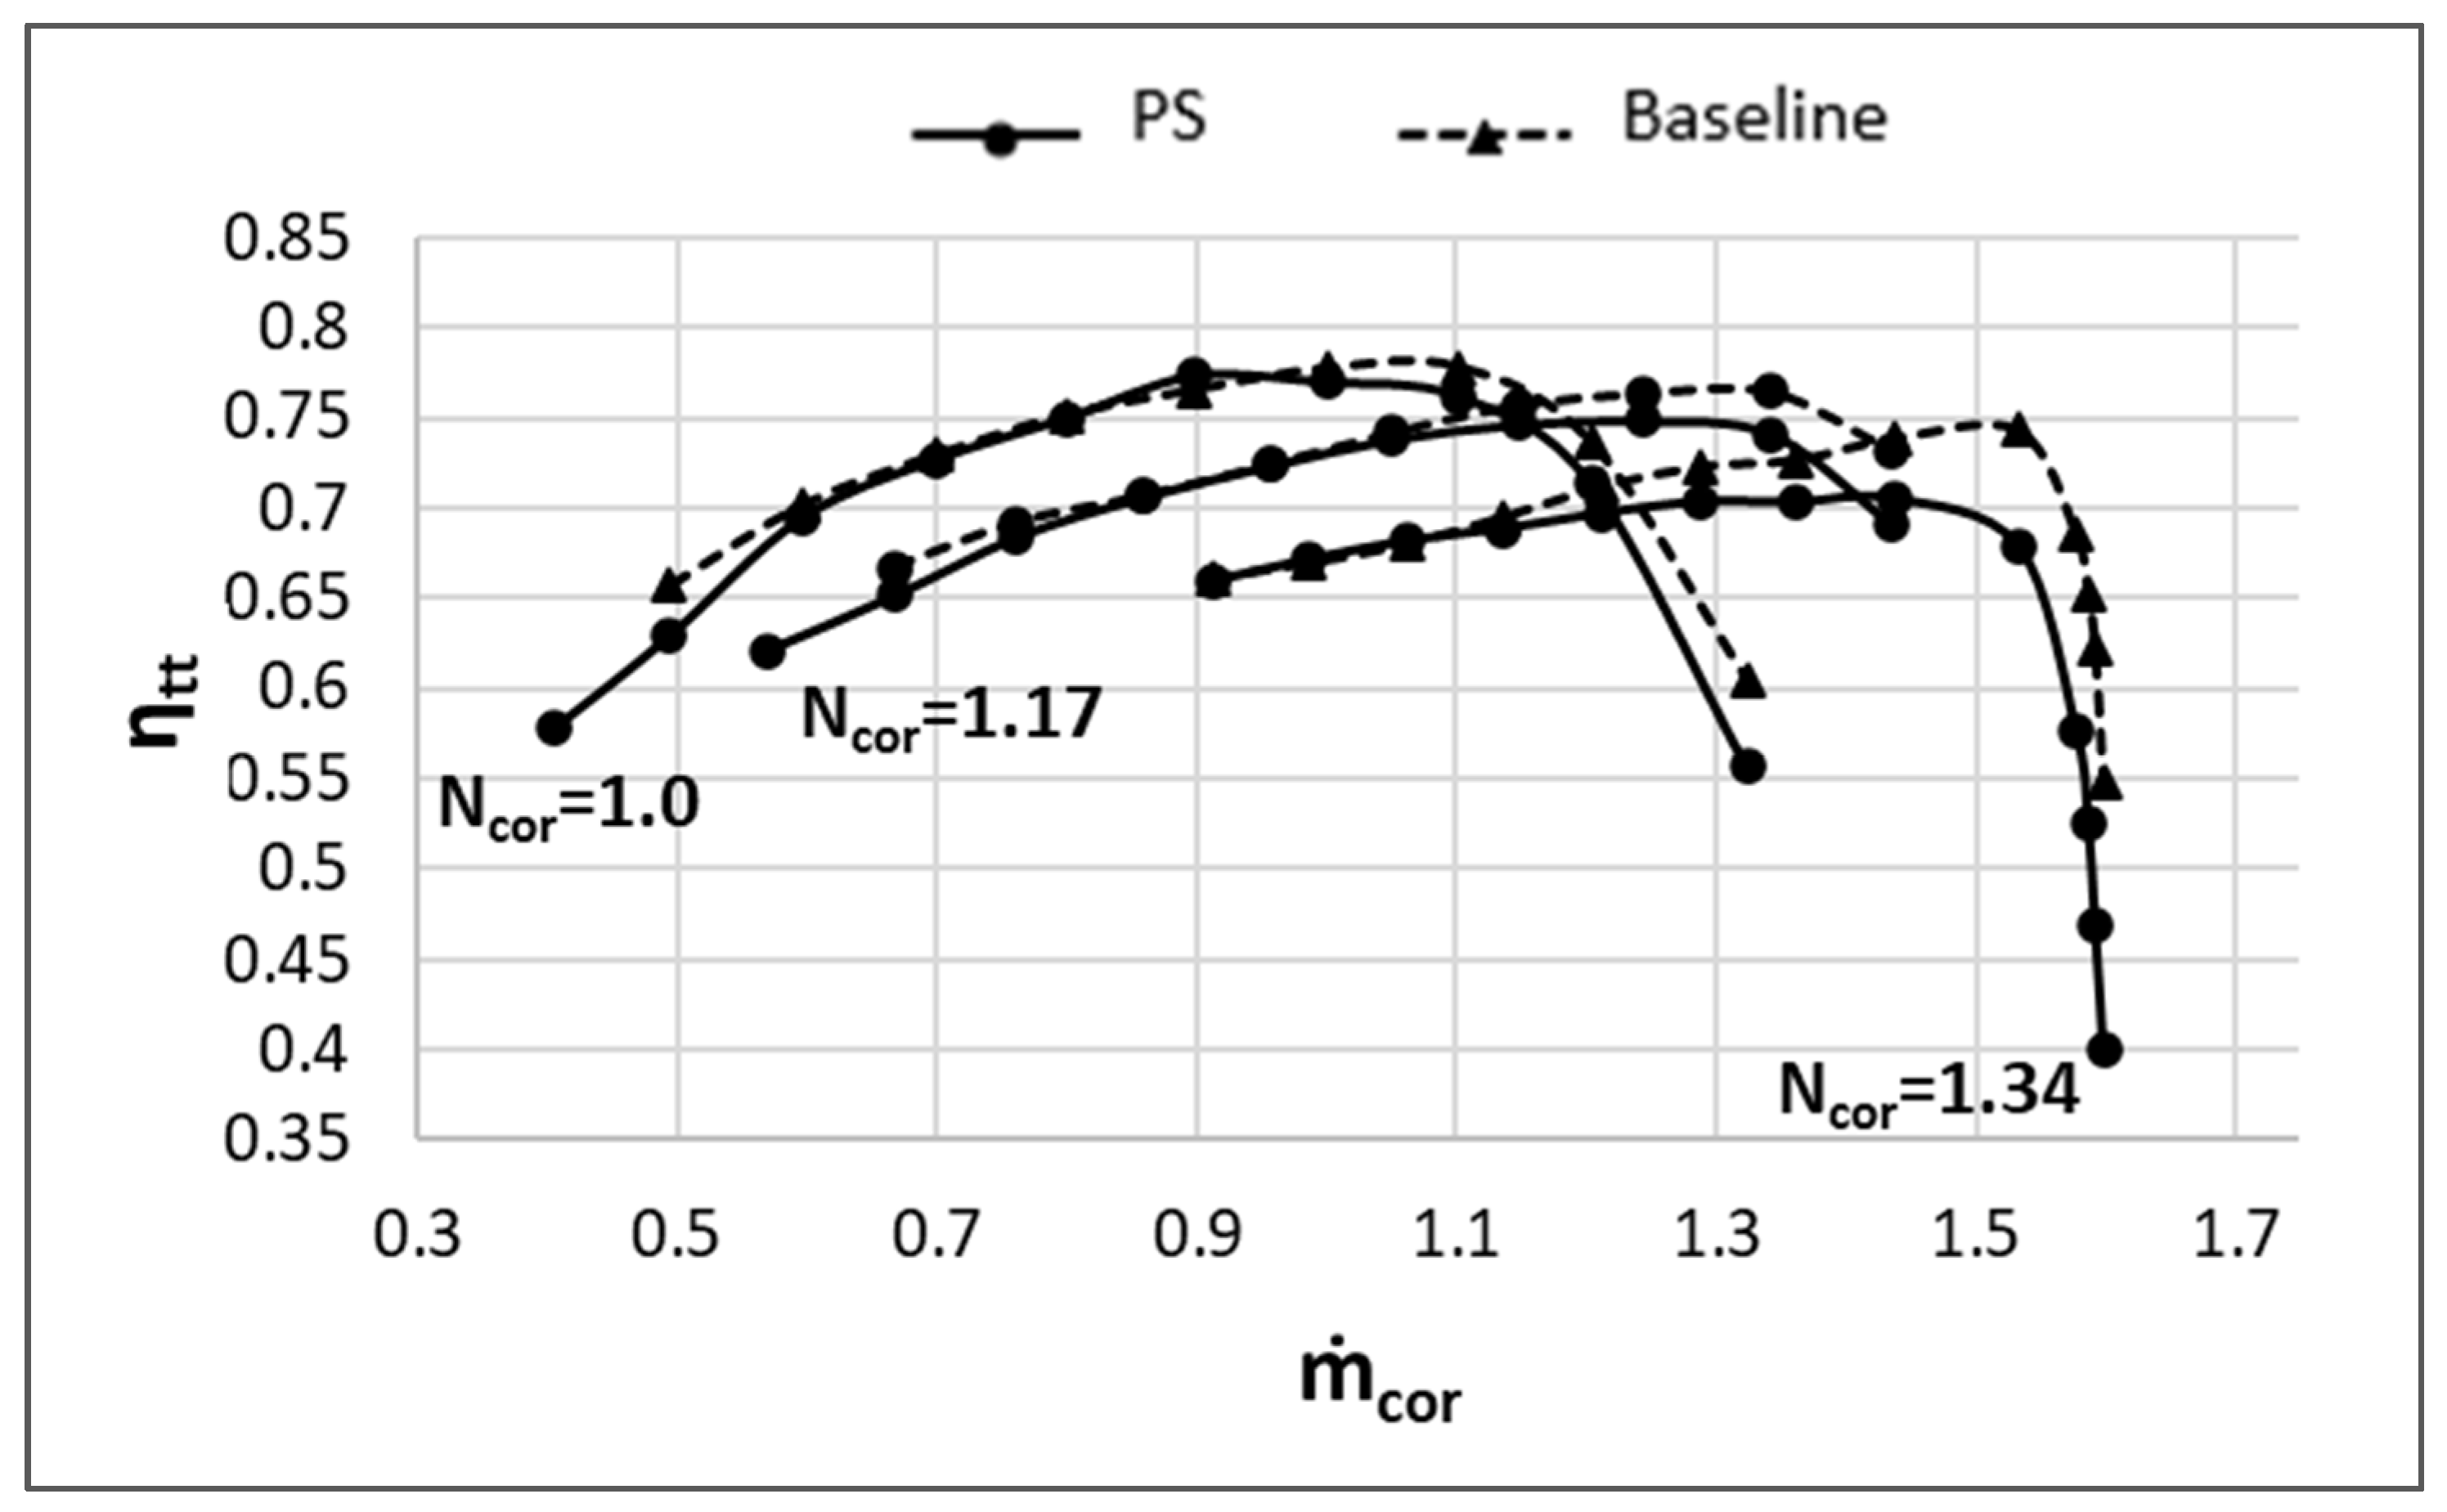
In this section, the performance maps of the centrifugal compressor with ported shroud are compared to those of the baseline case, at different rotational speeds. In Figure 6 and Figure 7, the curves of the pressure ratio and the isentropic total to total efficiency are, respectively, shown. In Figure 6, the main operating points used for the following detailed flow analysis are highlighted. The curves were calculated according to Equations (1) and (2), using the inlet adduction duct (section 0) and the volute outlet (section 6) reference sections [34]:
β t t = P t 6 P t 0
η t t = ( P t 6 / P t 0 ) ( k 1 ) / k 1 ( T t 6 / T t 0 ) 1
It can be noted that, for each speed line, there is a lower pressure ratio in the ported shroud case for the operating points with higher mass flow rate (from best efficiency to the choking). On the contrary, for lower mass flow rate (from best efficiency to surge), the behavior is opposite; the pressure ratio is higher in the ported shroud case. This advantage tends to grow by increasing the rotational speed, as reported in Figure 6, where the two curves at Ncor = 1.34 deviate by 7%. A reduction for the isentropic efficiency is observed with ported shroud with respect to the baseline for all operating conditions and for all rotational speeds. This efficiency loss tends to increase as the rotational speed increases (especially at best efficiency, where a reduction of over 5% has been observed). The main advantage from the ported shroud is the extension of the operating range. In fact, the ported shroud allows the compressor to be stable for lower mass flow rates with respect to baseline. To evaluate the extent of the operating range, the following equation was adopted, which measures the surge margin increase for the ported shroud case [34]:
S M P S = m ˙ S u r g e _ b a s e l i n e m ˙ S u r g e _ P S m ˙ C h o c k _ b a s e l i n e m ˙ S u r g e _ b a s e l i n e × 100 %
An increase in the surge margin of about 11% at Ncor = 1.0, and 9% at Ncor = 1.17 for the PS configuration is predicted while no extension at Ncor = 1.34 is evident. However, regarding near surge, for the highest regime, the pressure ratio has increased while the efficiency has slightly worsened. In the previous performance maps, the minimum mass flow rate for each speed line was determined using the stability criterion of the critical angle at the diffuser inlet, developed for the baseline case [29]. The application of the criterion is discussed in the following parts.

3.2. Flow Dynamic Analysis

To understand the differences identified in the performance of the ported shroud configuration compared to the baseline, an in-depth flow dynamic analysis was carried out. The physical mechanism for the ported shroud effects to extend the operating range can be discussed. This analysis was performed at the design rotational speed, for different operating conditions, using the simplified CFD model (Section 2.2.1).

3.2.1. The Cavity

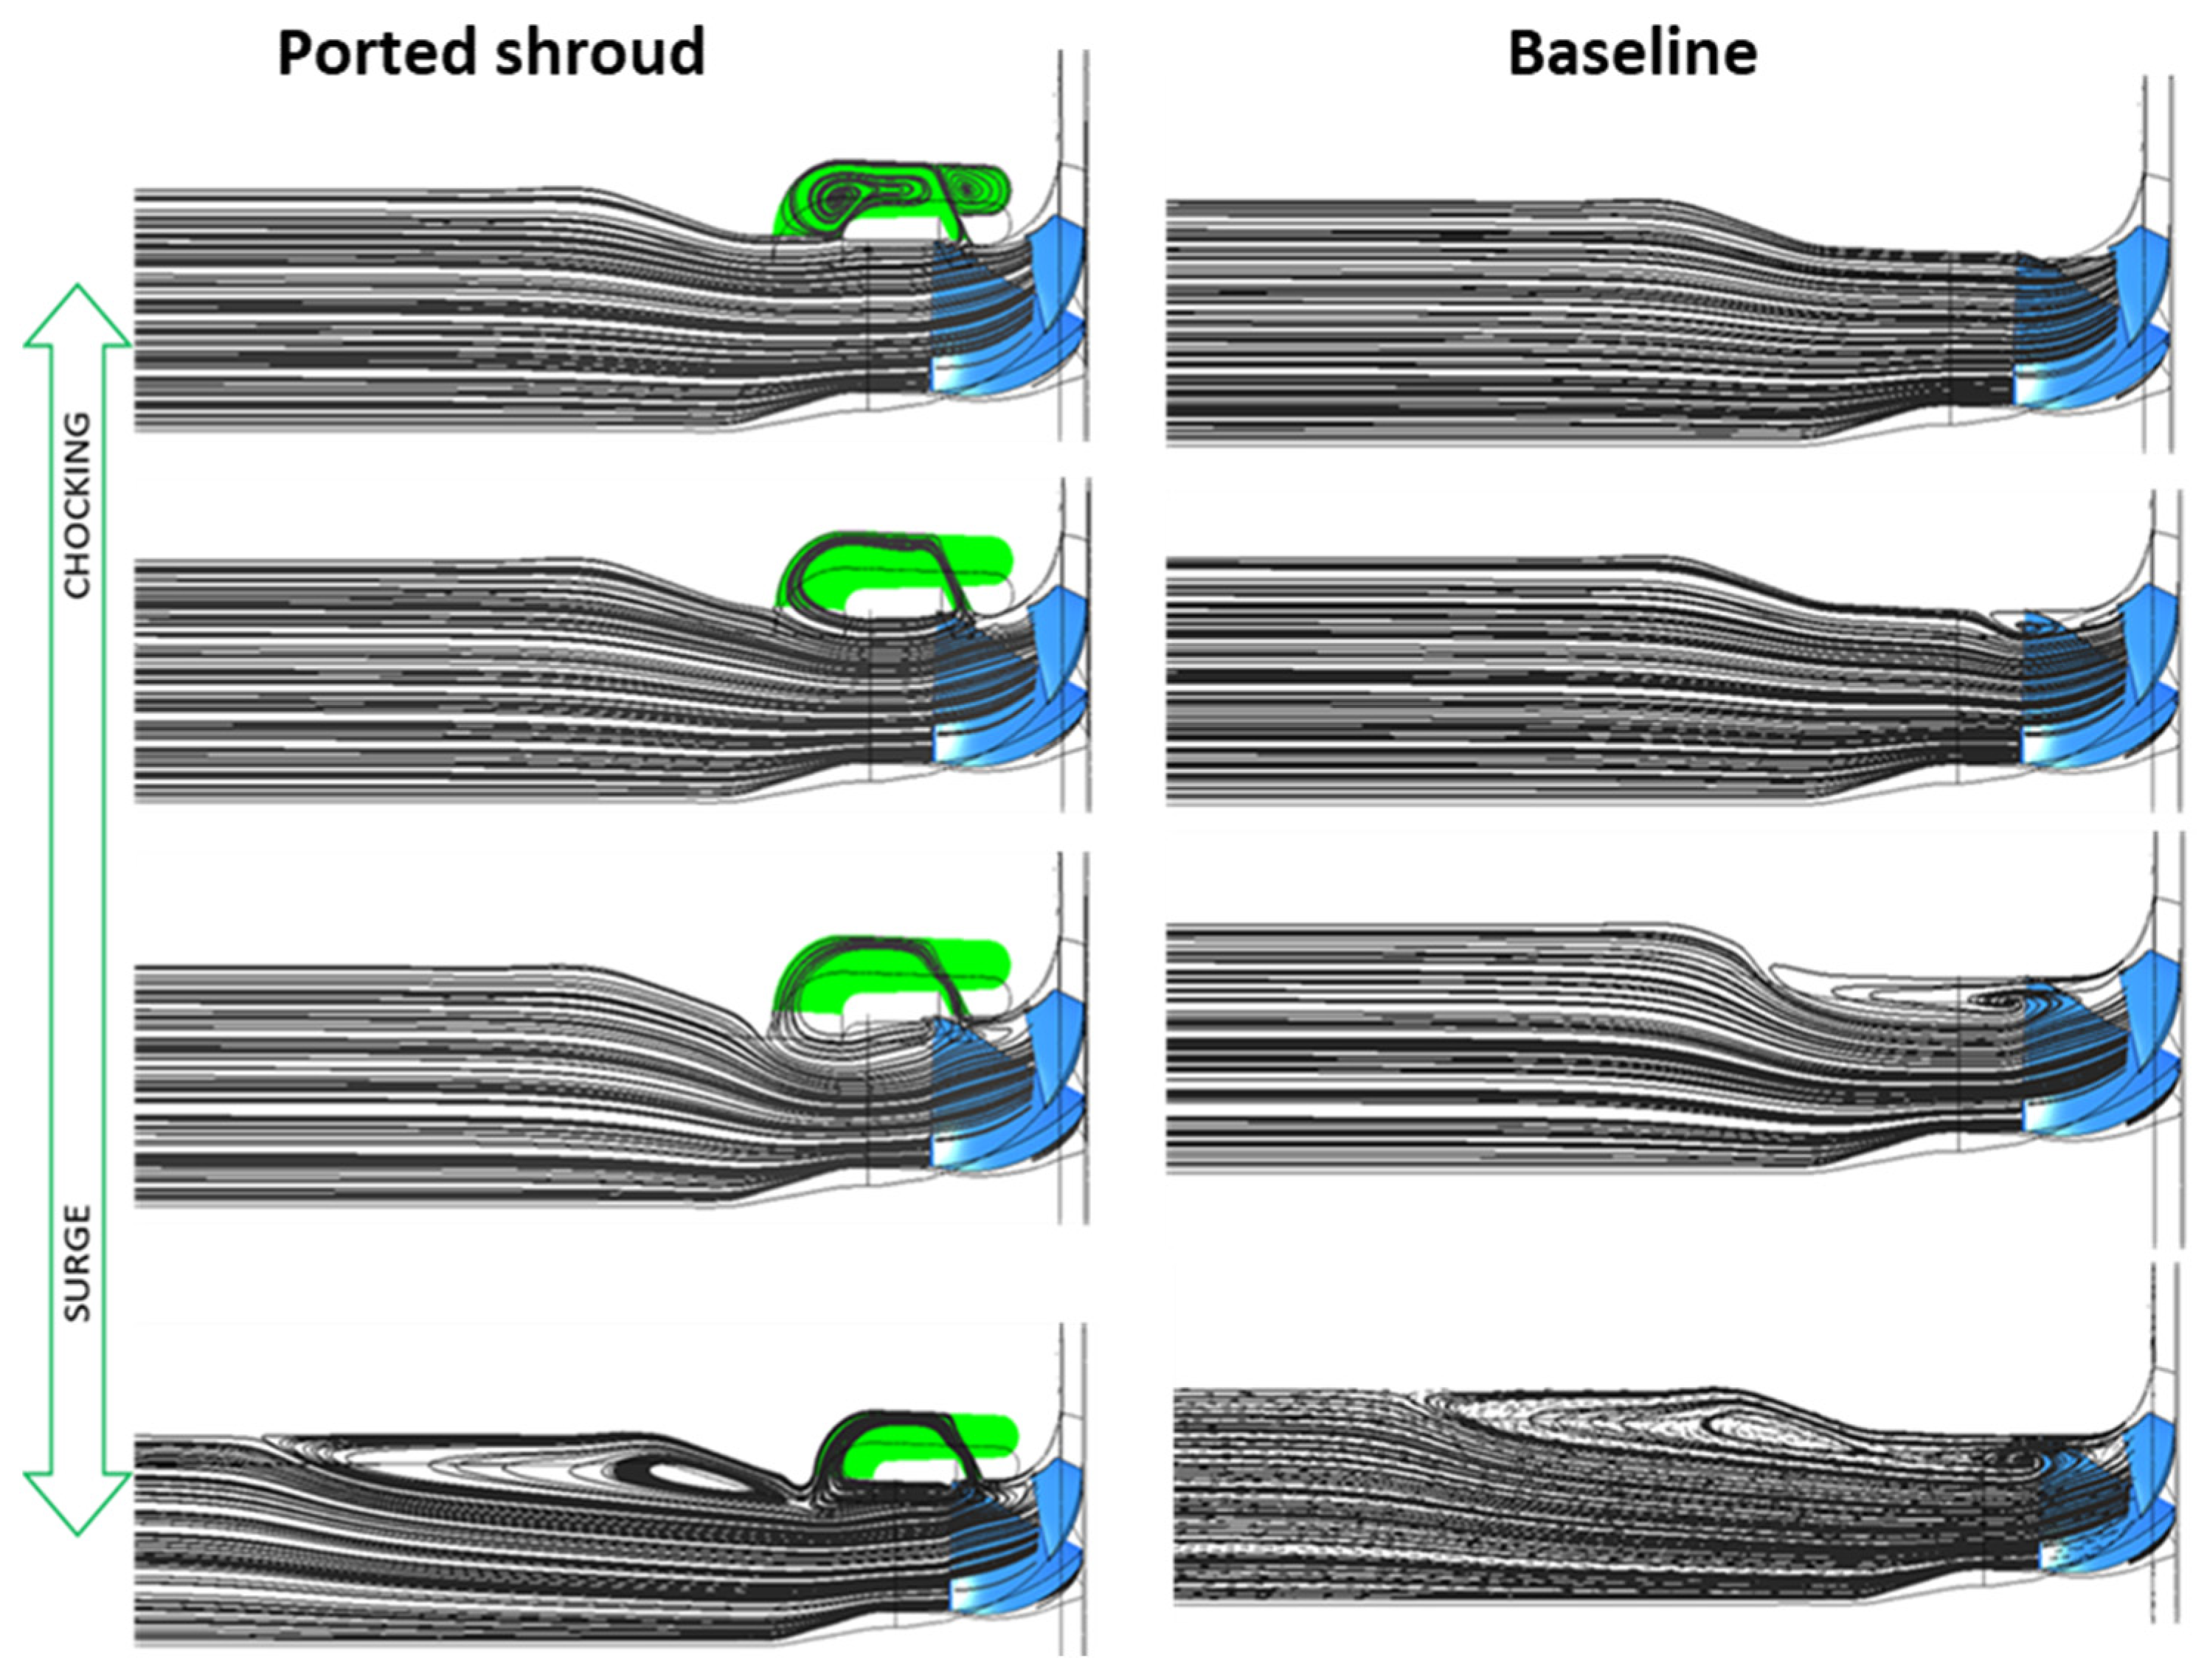
The flow analysis was primarily focused on the cavity, in order to understand its flow characteristics, for different operating conditions. Figure 8 shows the streamlines in the meridional plane for the configurations with and without ported shroud at different operating conditions.
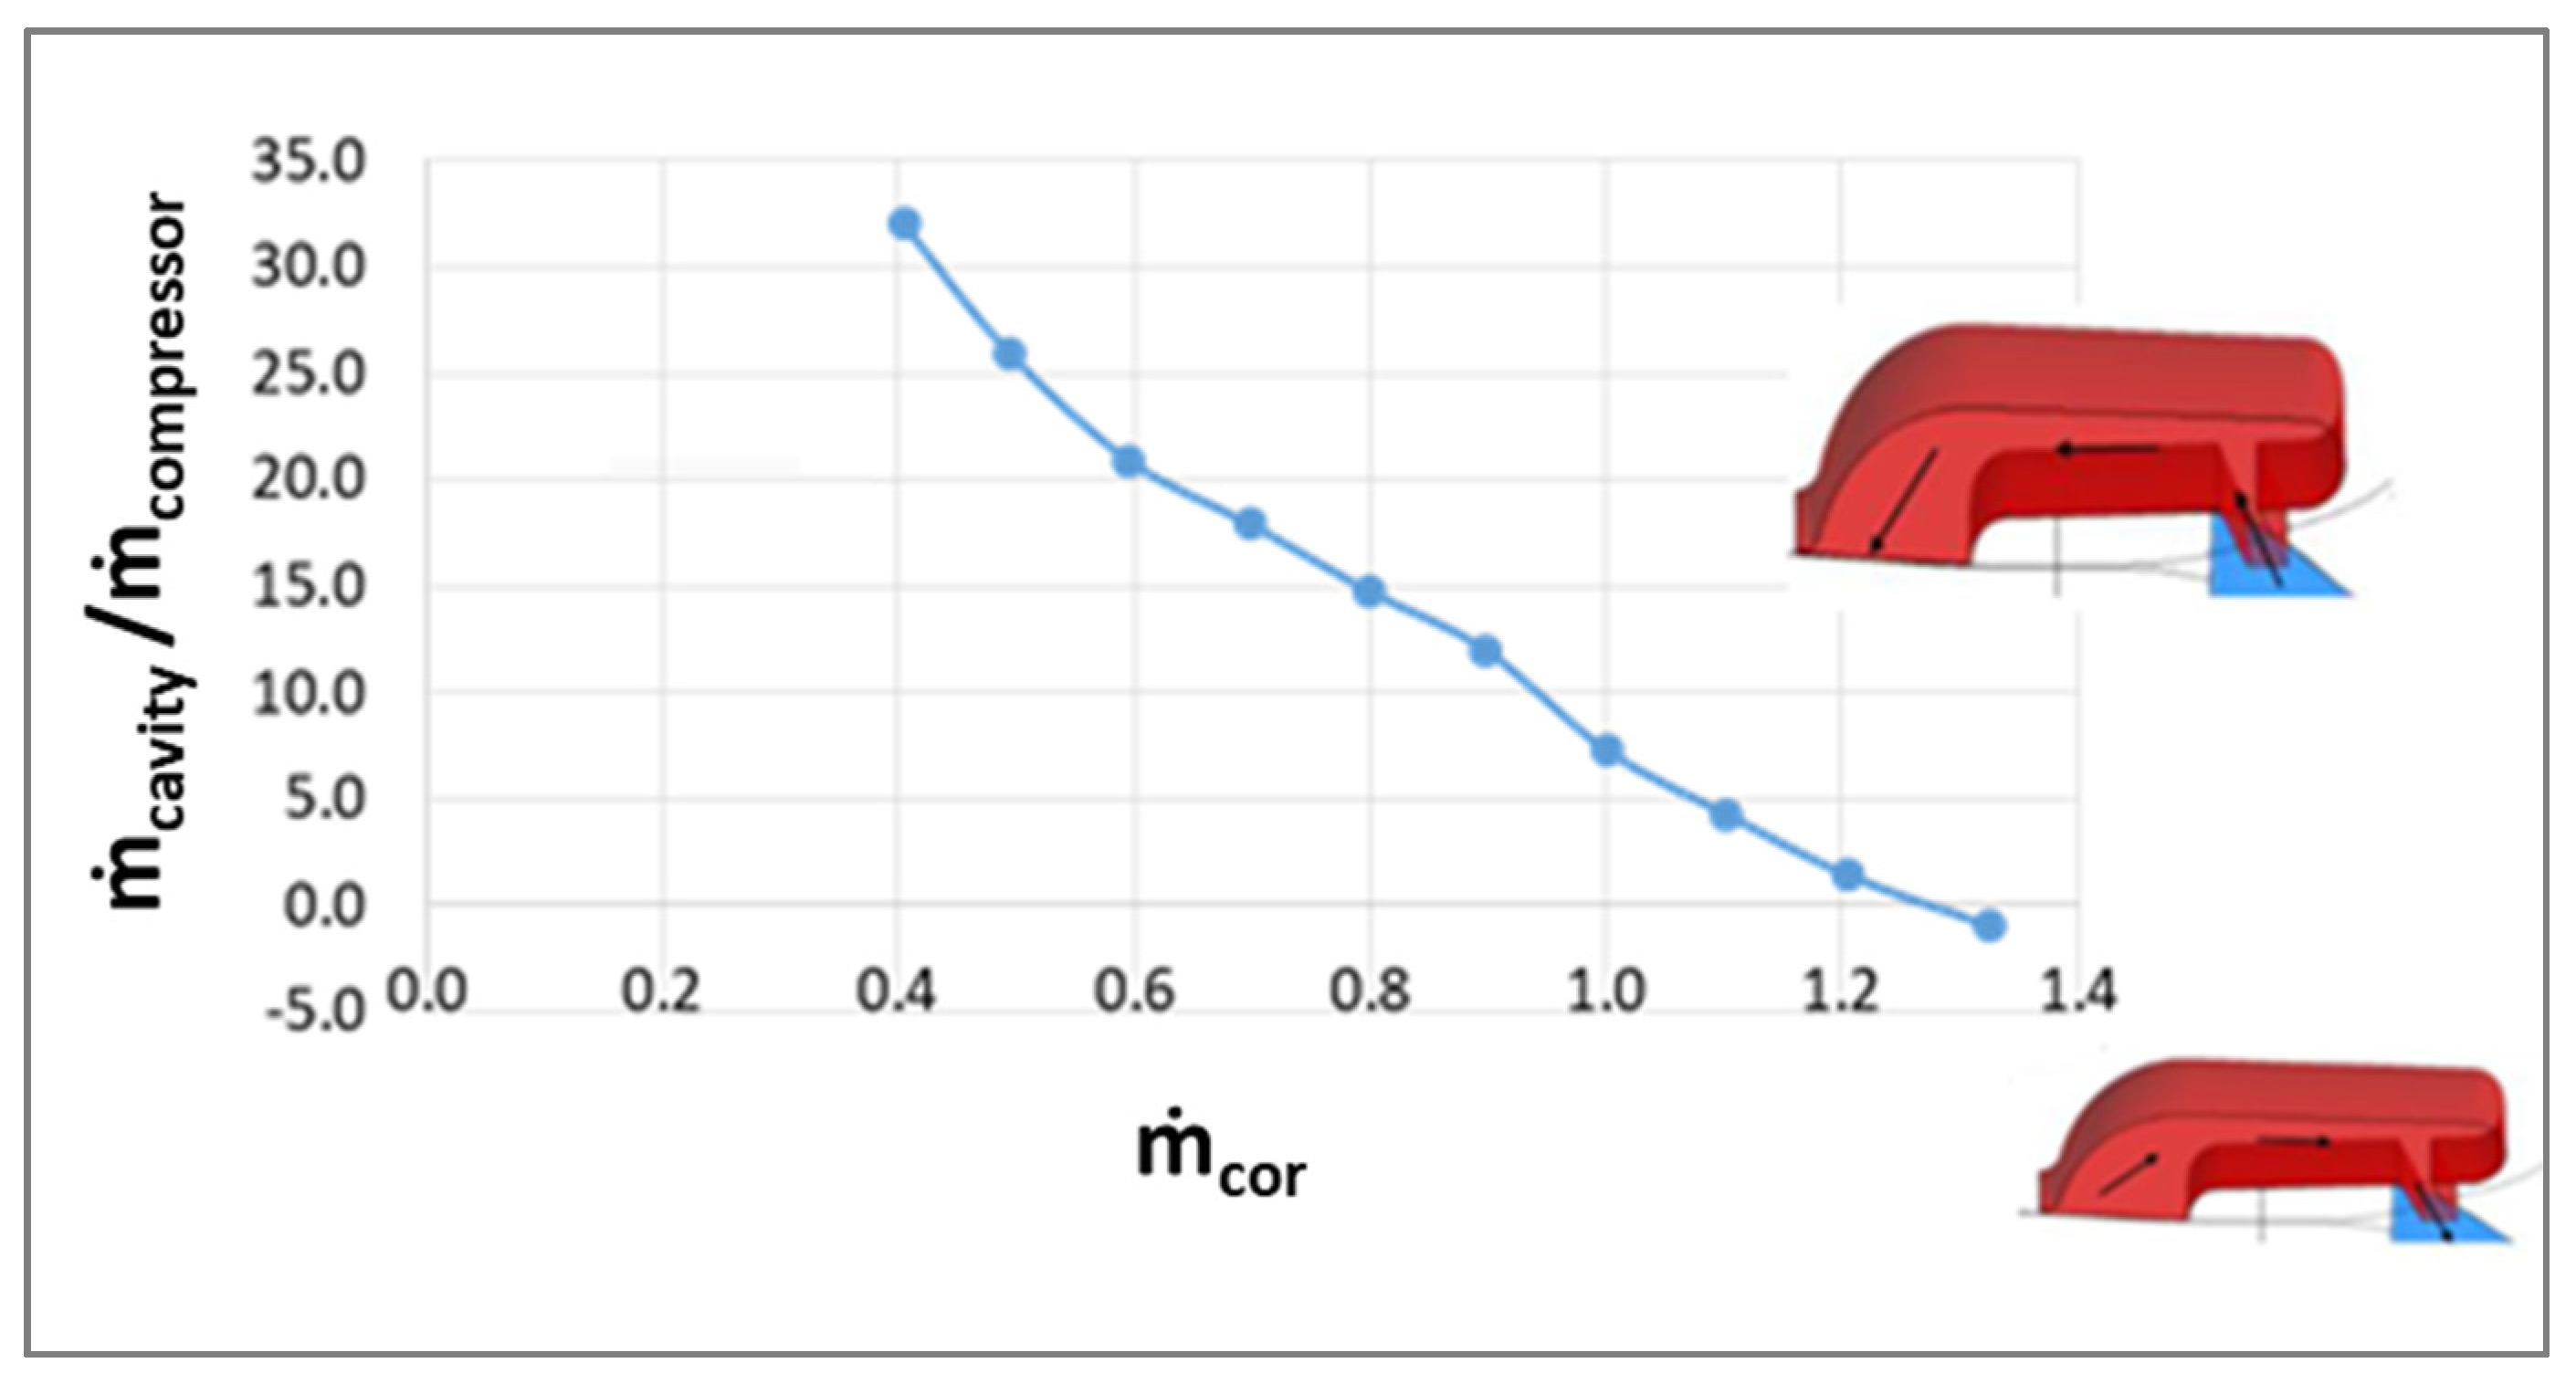
For the operating conditions towards choking, the streamlines in the main channel are perfectly parallel, without recirculation zones; on the contrary, when mass flow rate is reduced, there is a recirculation zone near the leading edge of the impeller towards the shroud, which increases especially in the baseline case. This low momentum region is smaller with ported shroud and this ensures a larger clean flow zone in the main channel. The function of the ported shroud is, therefore, to suck the low momentum zone from downstream to upstream. The mass flow rate inside the cavity increases by decreasing the operating mass flow conditions due to the increase in the swirling area that can be recirculated. Figure 9 shows that the mass flow rate trend though the cavity (expressed in terms of ratio) supports this aspect at different operating conditions.
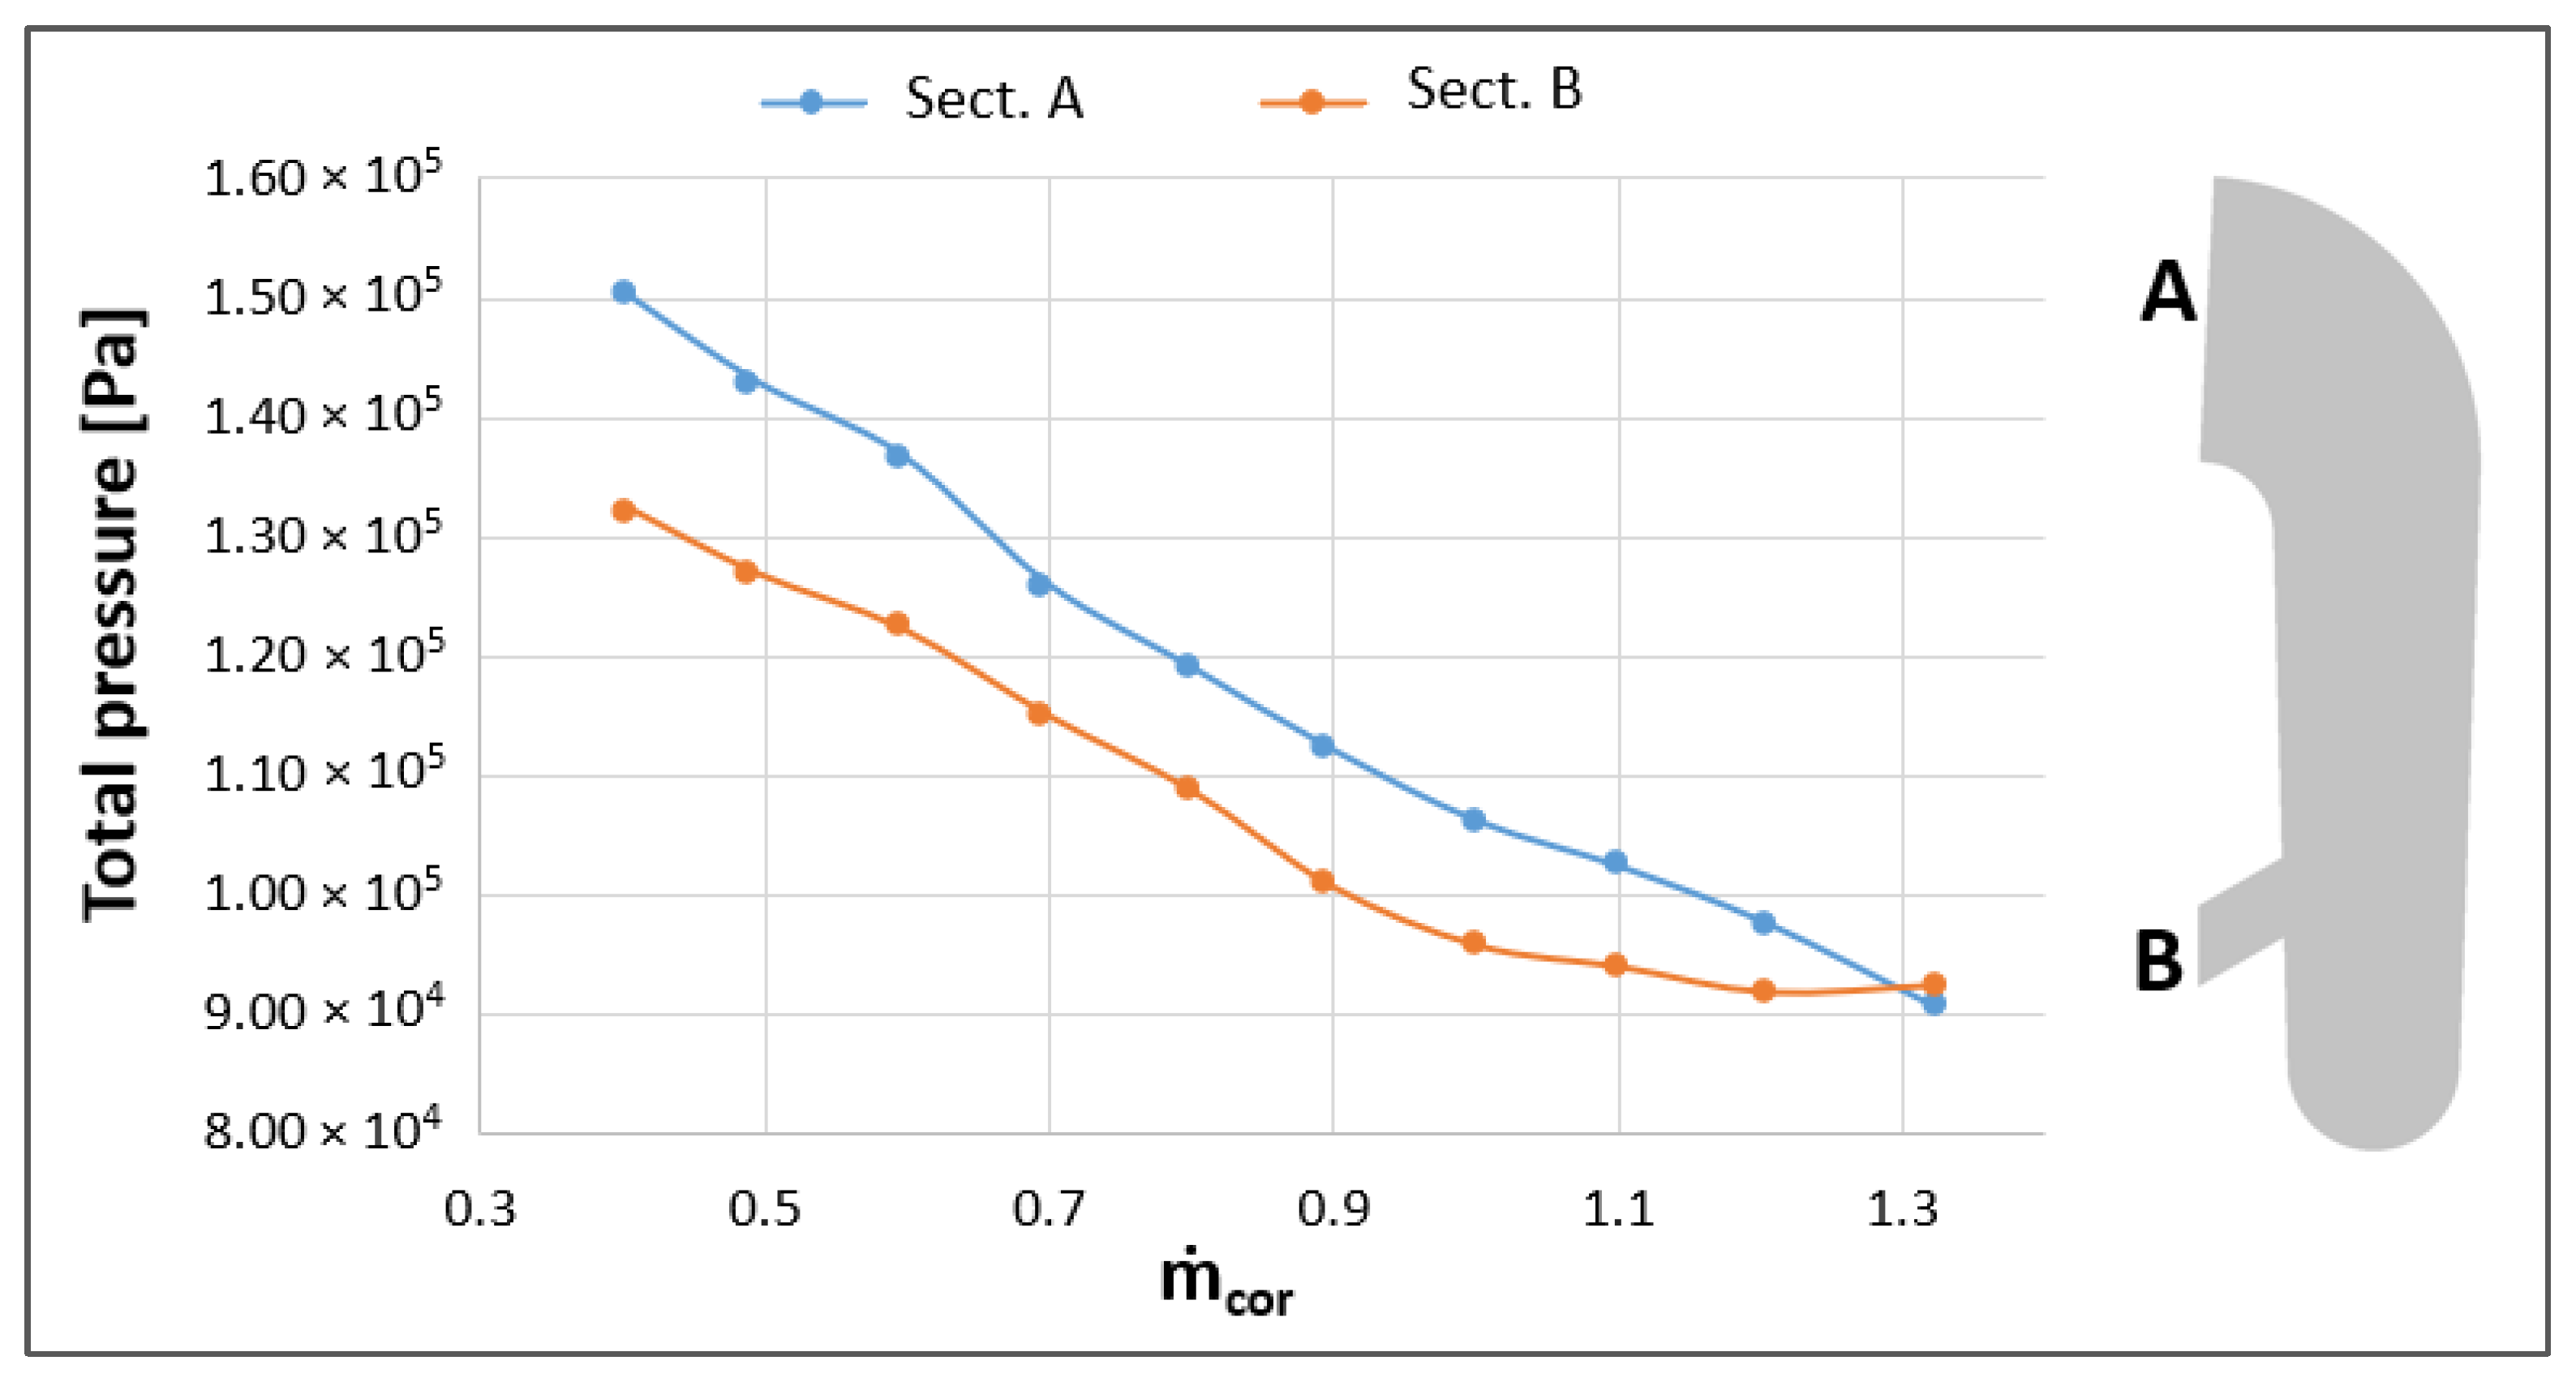
The positive values represent the recirculation of the flow from downstream into the cavity (which increases towards the surge) and the negative values represent the by-pass condition of the fluid, which flows though the cavity from upstream to downstream (toward choking). The recirculation or by-pass condition in the cavity is controlled by the total pressure difference between the cavity sections A and B. Figure 10 reports the trend of the total pressure in those sections, as the compressor mass flow rate changes.
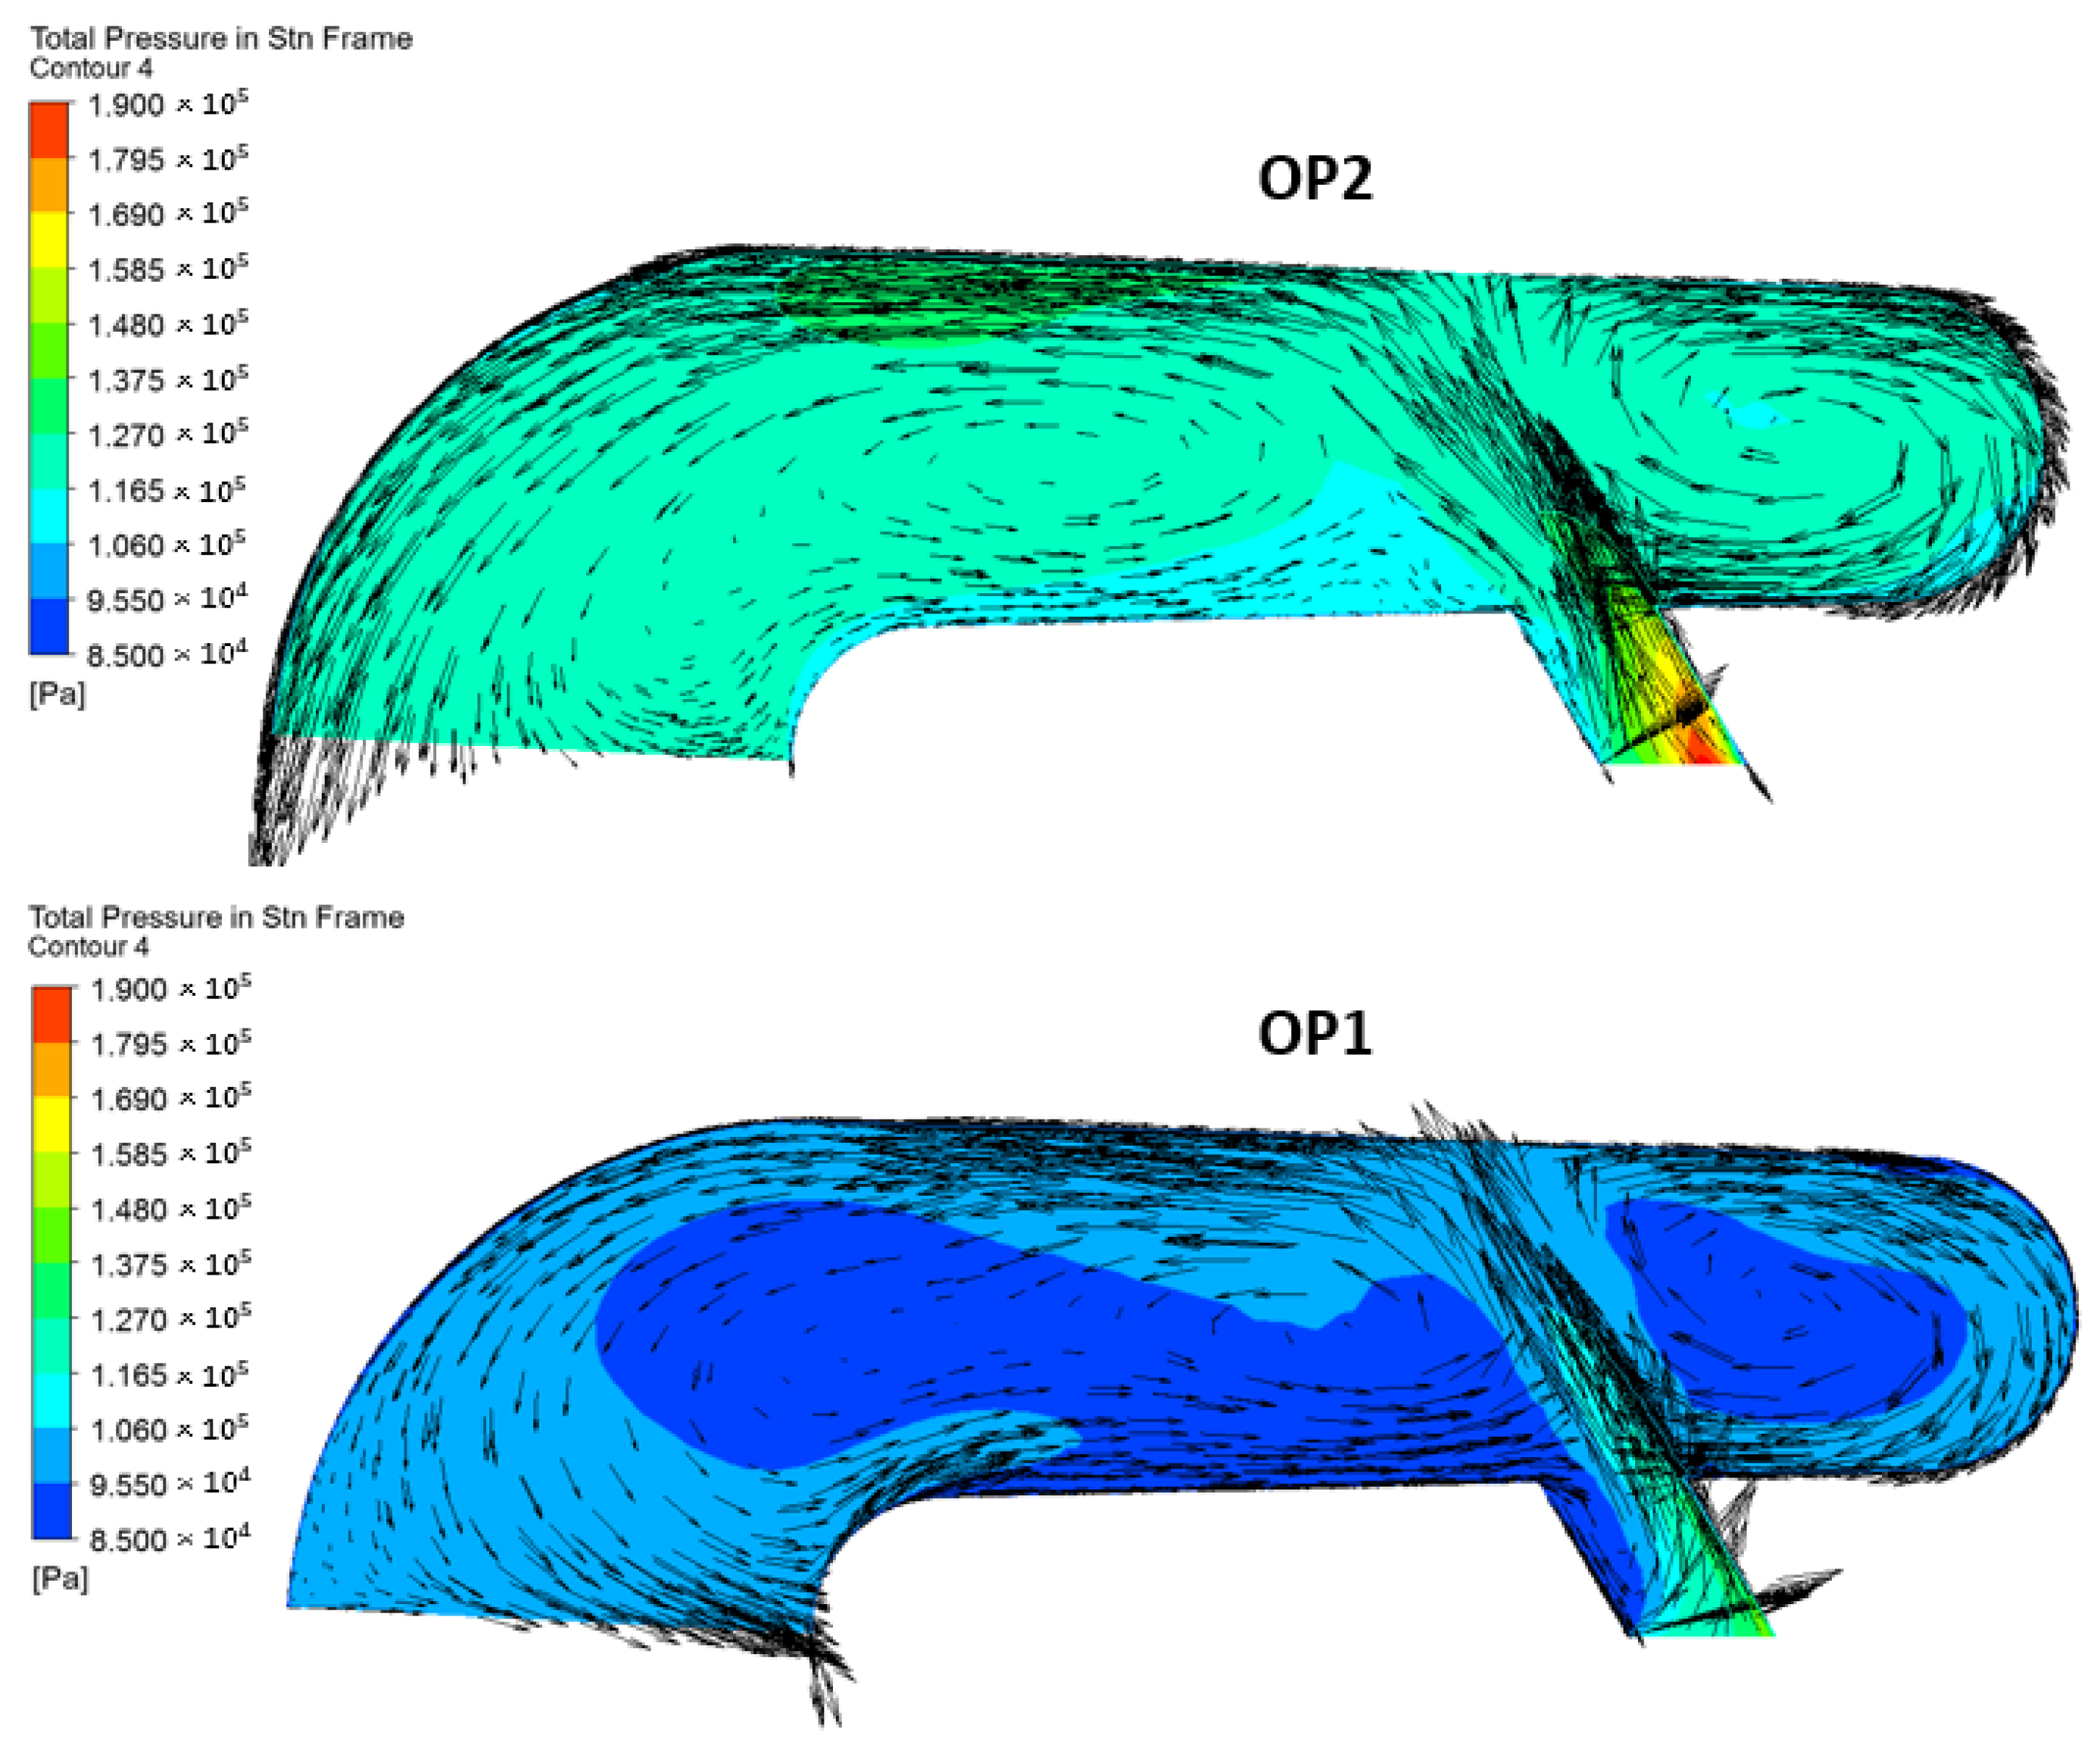
It can be noted that the total pressure values in the section A are almost always above the respective values in section B. Only for the highest mass flow rate the curves cross and the trend is opposite; in this condition (choking) there is the by-pass of the flow, while for all the other conditions there is flow recirculation from downstream to upstream through the cavity. Towards surge, the difference between the two curves and the total pressure difference between the two sections tends to increase; this difference is the main cause for the increase in the recirculating flow into the cavity, as the operating mass flow decreases. Figure 11 shows the total pressure contours with superimposed velocity vectors inside the cavity at the best efficiency condition OP1 (under) and at near surge OP2 (above).
The cavity tends to be effective near surge with a more organized flow, which better exploits the entire passage area. On the other hand, at best efficiency, the cavity has various recirculating zones inside. It is evident how, near surge, the flow collects in the upper part of the cavity and tends to continue its reverse path even to the upstream section A; this flow has a strong tangential component. On the contrary, at best efficiency, the flow quantity decreases, by reaching section A with a lower momentum and a lower tangential component; it leaves section A with the same tangential direction as the main stream in the compressor. Table 3 reports the main flow characteristics at section A for the two operating conditions (OP1 and OP2).
The structure of the flow that exits the cavity is responsible for the main fluid dynamics changes into the mainstream flow as discussed in the following section.

3.2.2. Flow Analysis at the Impeller Leading Edge

In this part, the main differences in the flow structure of the main channel, focusing on the impeller leading edge area, are discussed. The analysis was completed at best efficiency (OP1) and near surge (OP2). The hub-to-shroud distributions of the meridional velocity at the leading edge (Figure 12) and the contours of the relative Mach number in the impeller meridional plane (Figure 13) for the operating condition OP2 are reported for both baseline and with ported shroud.
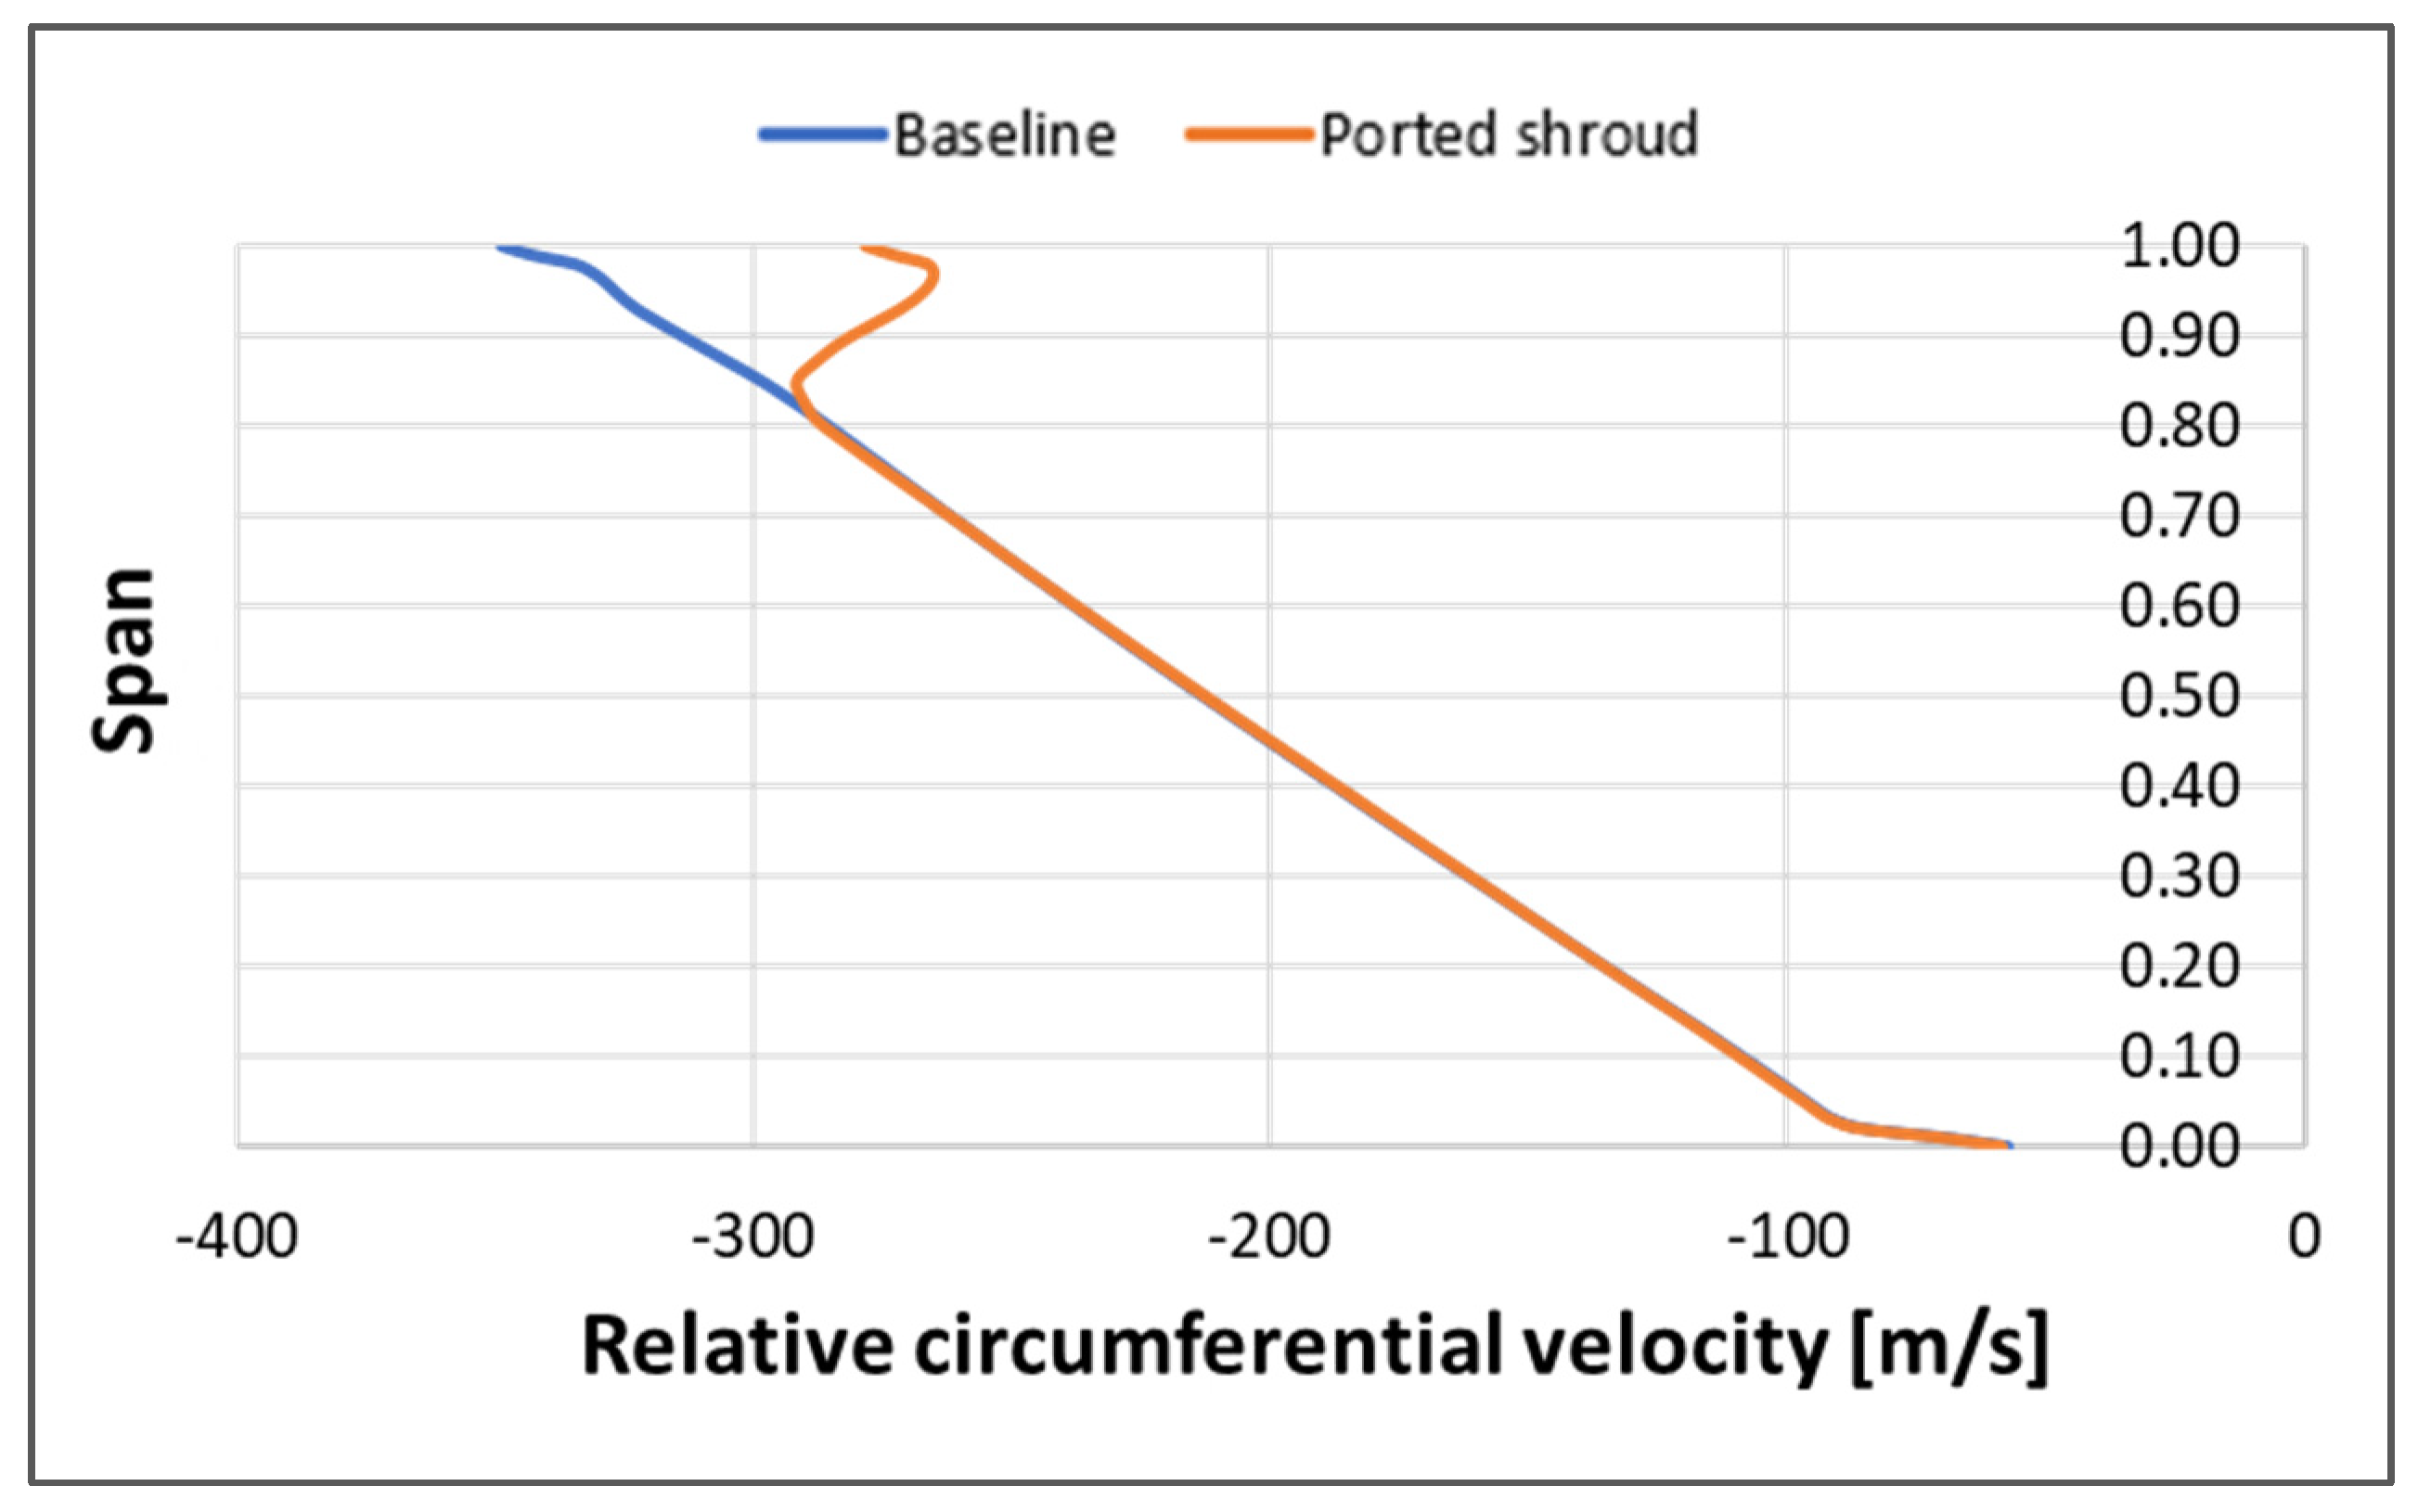
It is clear that, in comparison to the baseline case, the recirculation zone (negative velocity) at the leading edge is eliminated in the PS case. The low momentum flow (blue color) recirculates into the cavity and it is reintroduced into the main channel in an upstream area (see Table 3). In this zone, the two streams mix causing a re-energization of the stream in the main channel and a higher relative Mach near the blade tip. This mixing also causes a variation in the tangential velocity, with a decrease in its absolute value. To confirm this, Figure 14 shows the hub-to-shroud distributions of the relative circumferential velocity at the leading edge for the ported shroud and baseline configurations, at near surge conditions.
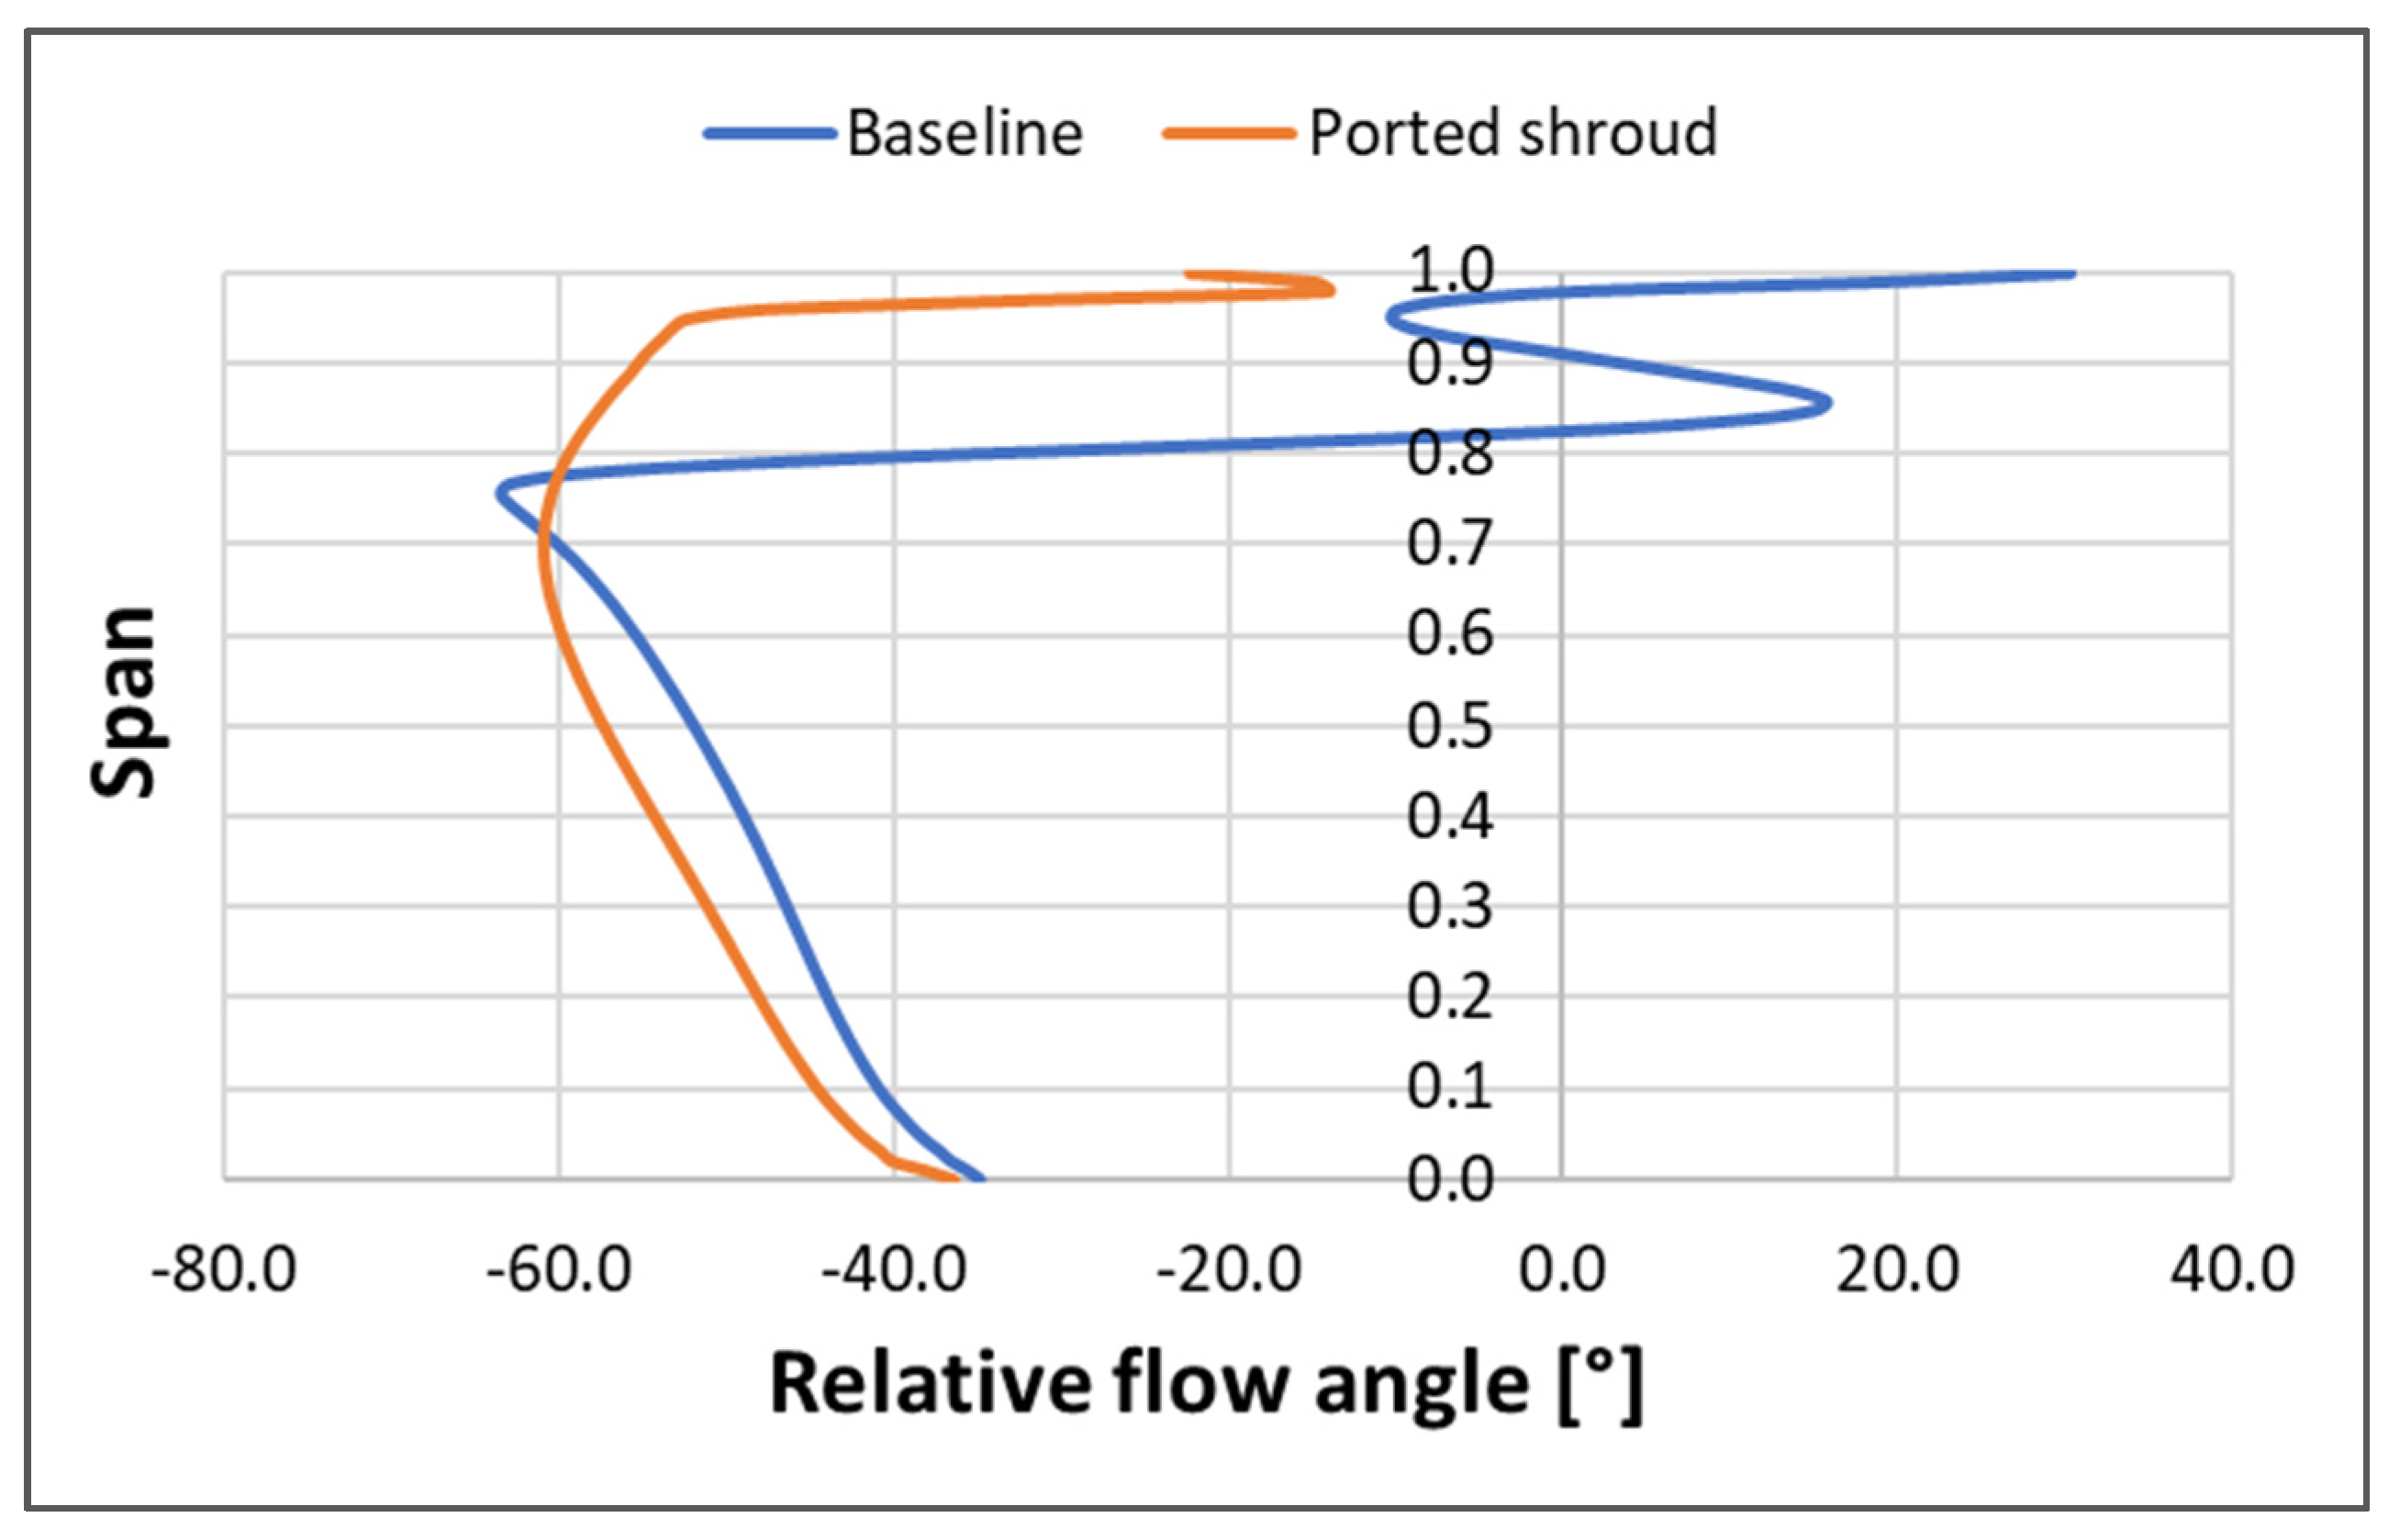
The variation in the relative circumferential velocity affects the relative flow angle and consequently the flow incidence on the impeller. For this reason, Figure 15 reports the comparison between the two configurations (with and without ported shroud) of the hub-to-shroud distribution of the relative flow angle at the leading edge, at near surge.
It is clear that with ported shroud a larger span portion of the blade can work efficiently with respect to the baseline case; there is a reduced portion of incoming flow stalled. This is the main mechanism that leads to the stability limit extension in the ported shroud case, allowing the compressor to operate in a stable condition at or a lower mass flow rate. For the best efficiency condition, a recirculating flow from the cavity is also observed, even if smaller. This flow has a certain tangential component (see Table 3), which mixes in a similar way to the near surge condition, causing a variation in the flow direction. Figure 16 shows the comparison between the configuration with and without ported shroud of the hub-to-shroud distributions of the relative circumferential velocity at the leading edge, at the best efficiency condition.
Additionally, for this condition, the flow incidence is reduced with the ported shroud. This reduction, that occurs in the channel area at higher span, is evident in Figure 17, where the hub-to-shroud distributions of the relative flow angle at the leading edge for the two configurations at best efficiency are reported.
This causes a performance decrease, as previously observed in Figure 6 and Figure 7. Therefore, if towards surge the flow incidence variation is responsible for the extension of the stable operation of the compressor, at best efficiency this variation in the tip region is an undesirable effect.

3.3. Stability Criteria

The operating point at minimum mass flow rate can be predicted using the criterion of the critical angle at the diffuser inlet. To identify the stability limit in configurations with and without ported shroud, the hub-to-shroud distribution of the absolute flow angle at the diffuser inlet was analyzed. It is necessary to quantify the percentage of span (defined with the S parameter) that exceeds the critical value of the angle defined by the Senoo–Kobayashi equation [35]. As long as this parameter is lower than the critical value Scritic = 20, a stable operating condition corresponds to that mass flow rate, while a mass flow rate above this critical value corresponds an unstable operating point [30]. Using this procedure, the minimum mass flow rate of each iso-speed in the performance map of Figure 6 and Figure 7 can be identified, and it is the last with S < 20. Figure 18 shows the trend of parameter S (with or without ported shroud) as the mass flow rate varies, for different rotational speeds; the reference critical condition is marked in green.
From these trends is clear that for Ncor = 1.0 and 1.17, the ported shroud curves are always below the baseline ones; therefore, the critical value Scritic = 20 is reached at a lower mass flow rate. This confirms that the ported shroud is effective in the operating range extension for the compressor. On the other hand, at the highest rotational speed (Ncor = 1.34), the two configurations have a similar trend for S with no evident effect of the ported shroud. It is confirmed that the ported shroud is less effective at higher speeds; for these regimes, other factors come into play to trigger instability in the compressor, such as the volute peripheral counter pressure [29].
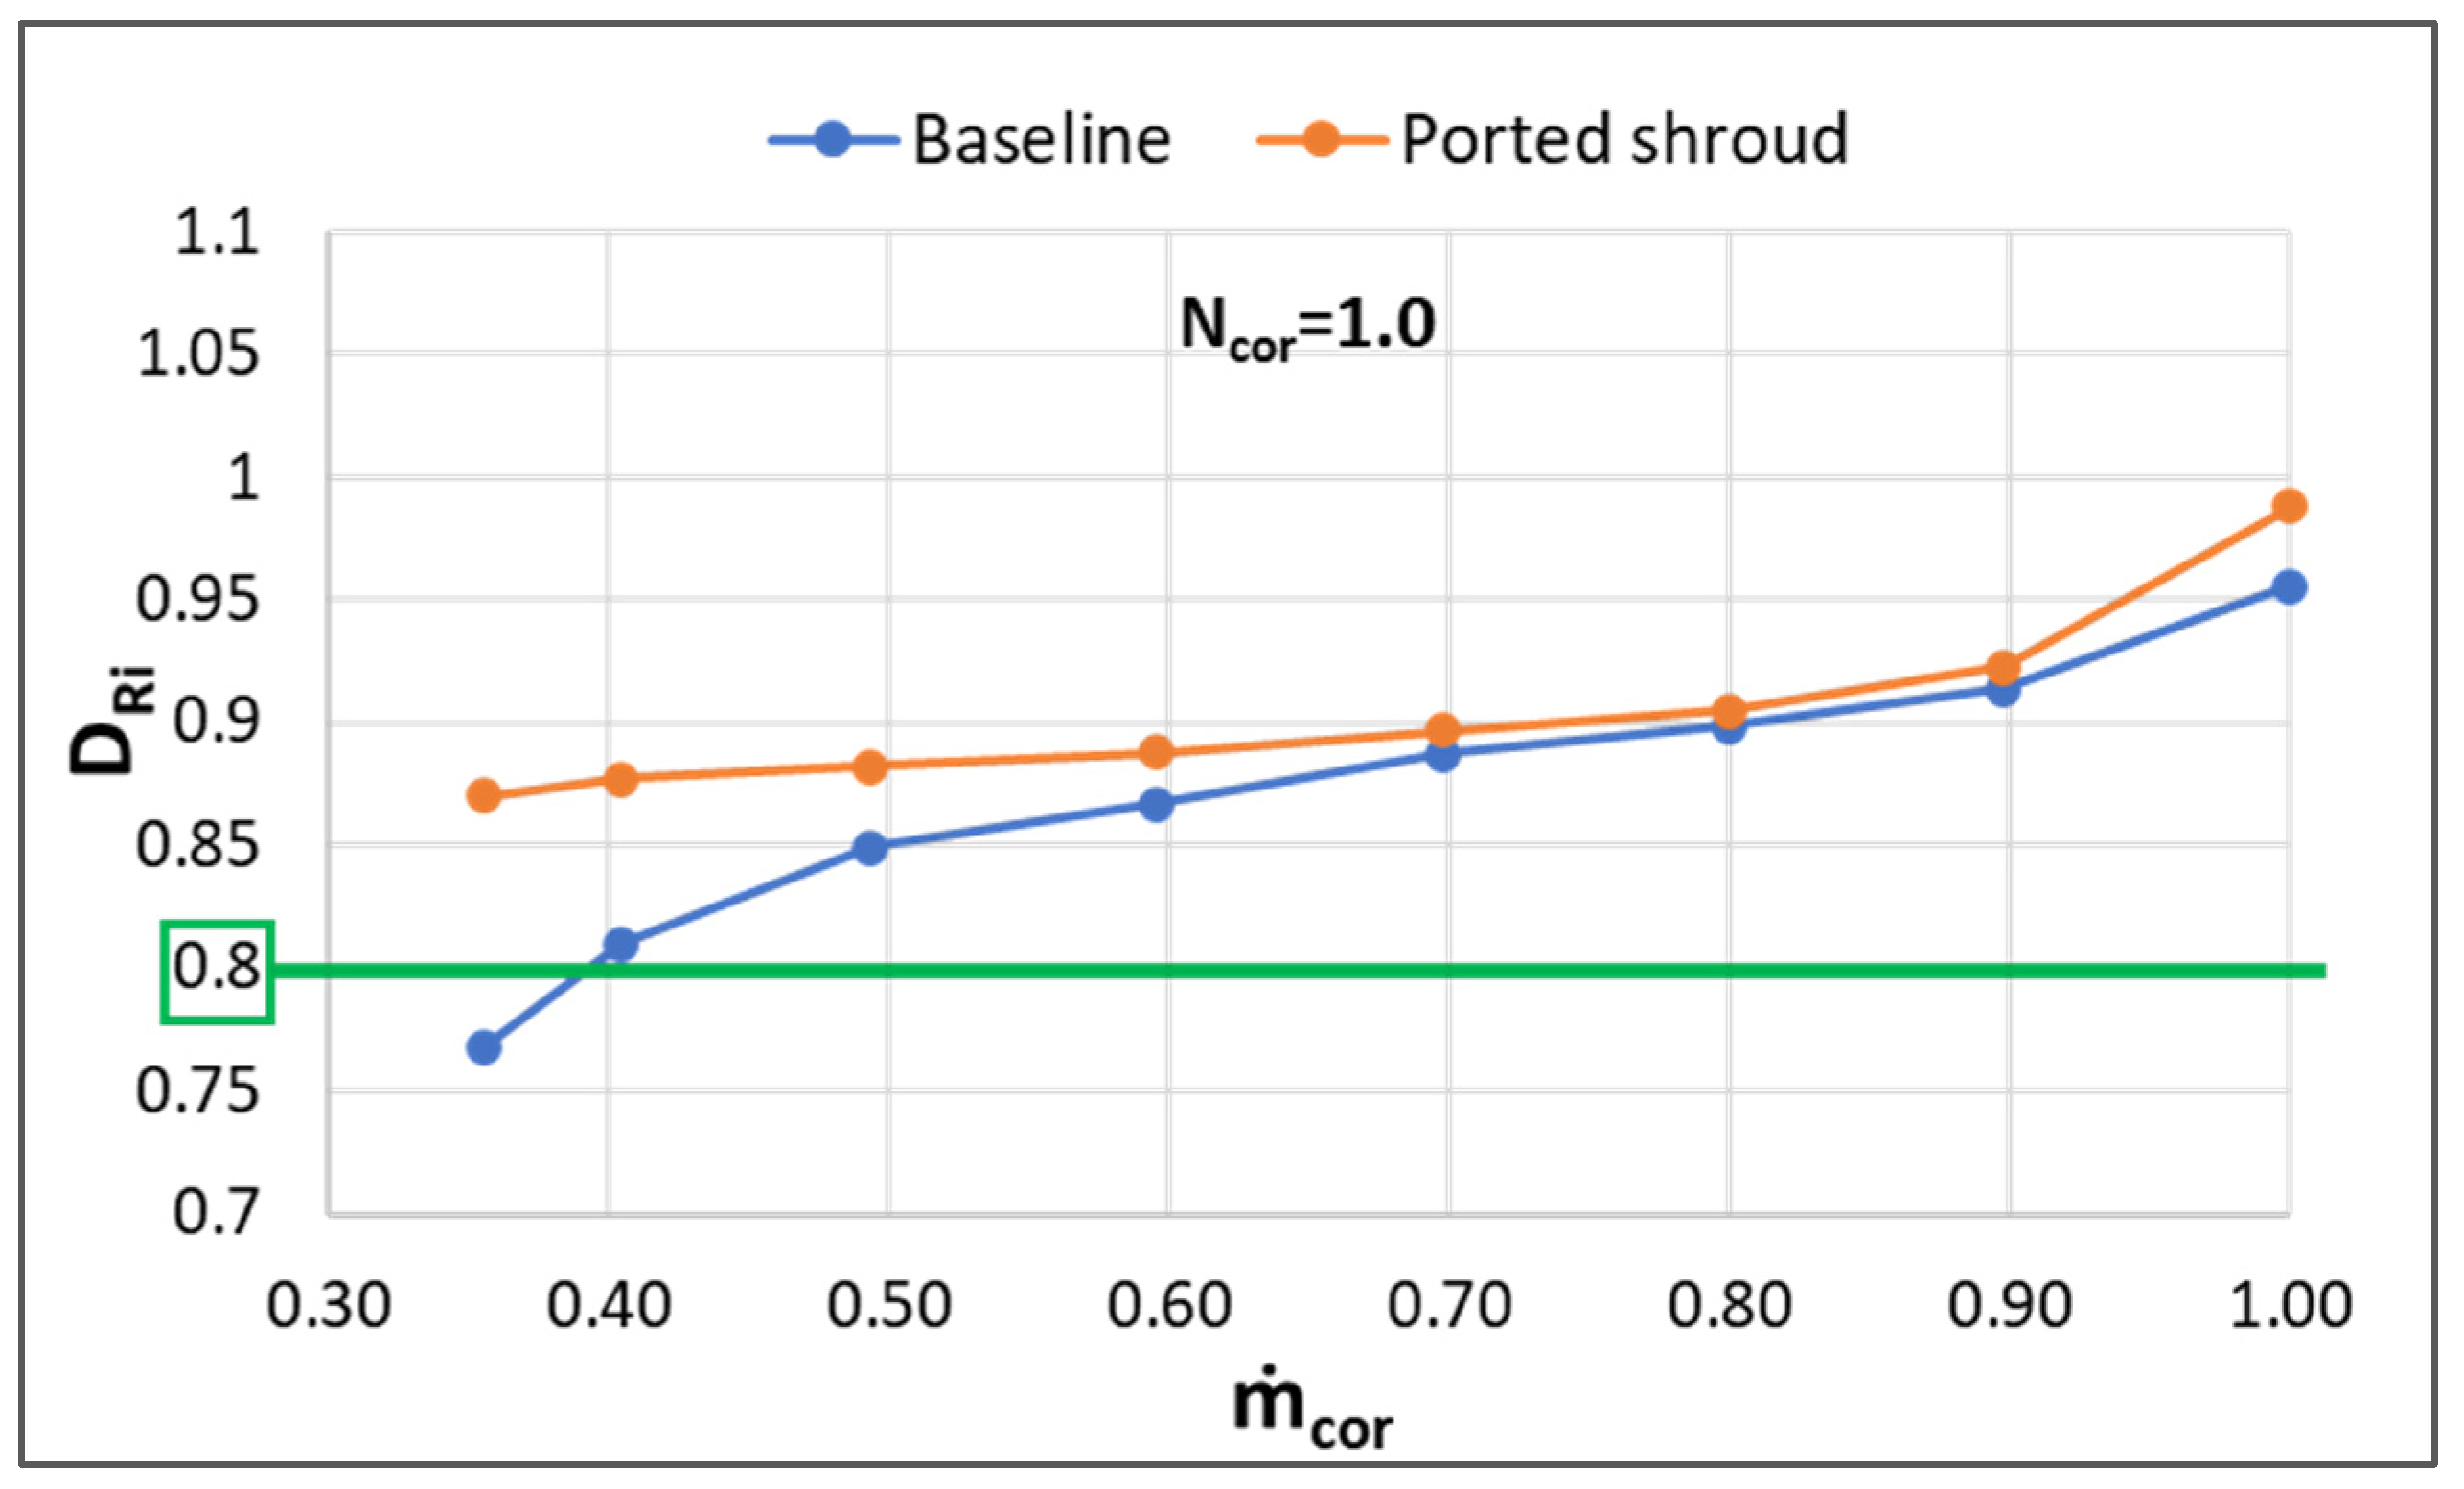
Other criteria were also developed to identify the stable operating points in centrifugal compressors [30]. The diffusion ratio DRi, focused on the impeller, considers the trend for the ratio of the relative velocity between the trailing edge and the impeller inlet versus the mass flow rate. The limit condition is reached when the ratio is lower than 0.80. Figure 19 shows the trend of the diffusion ratio with the mass flow rate, at the design rotational speed Ncor = 1.0, with and without ported shroud.
The stabilizing effect of the ported shroud on the entire compressor is evident: the values for the ported shroud case are higher than for the baseline at the lowest mass flow rate. The critical value DRi = 0.80 (in green) is reached in the baseline case and not with ported shroud.

3.4. Unsteady Analysis

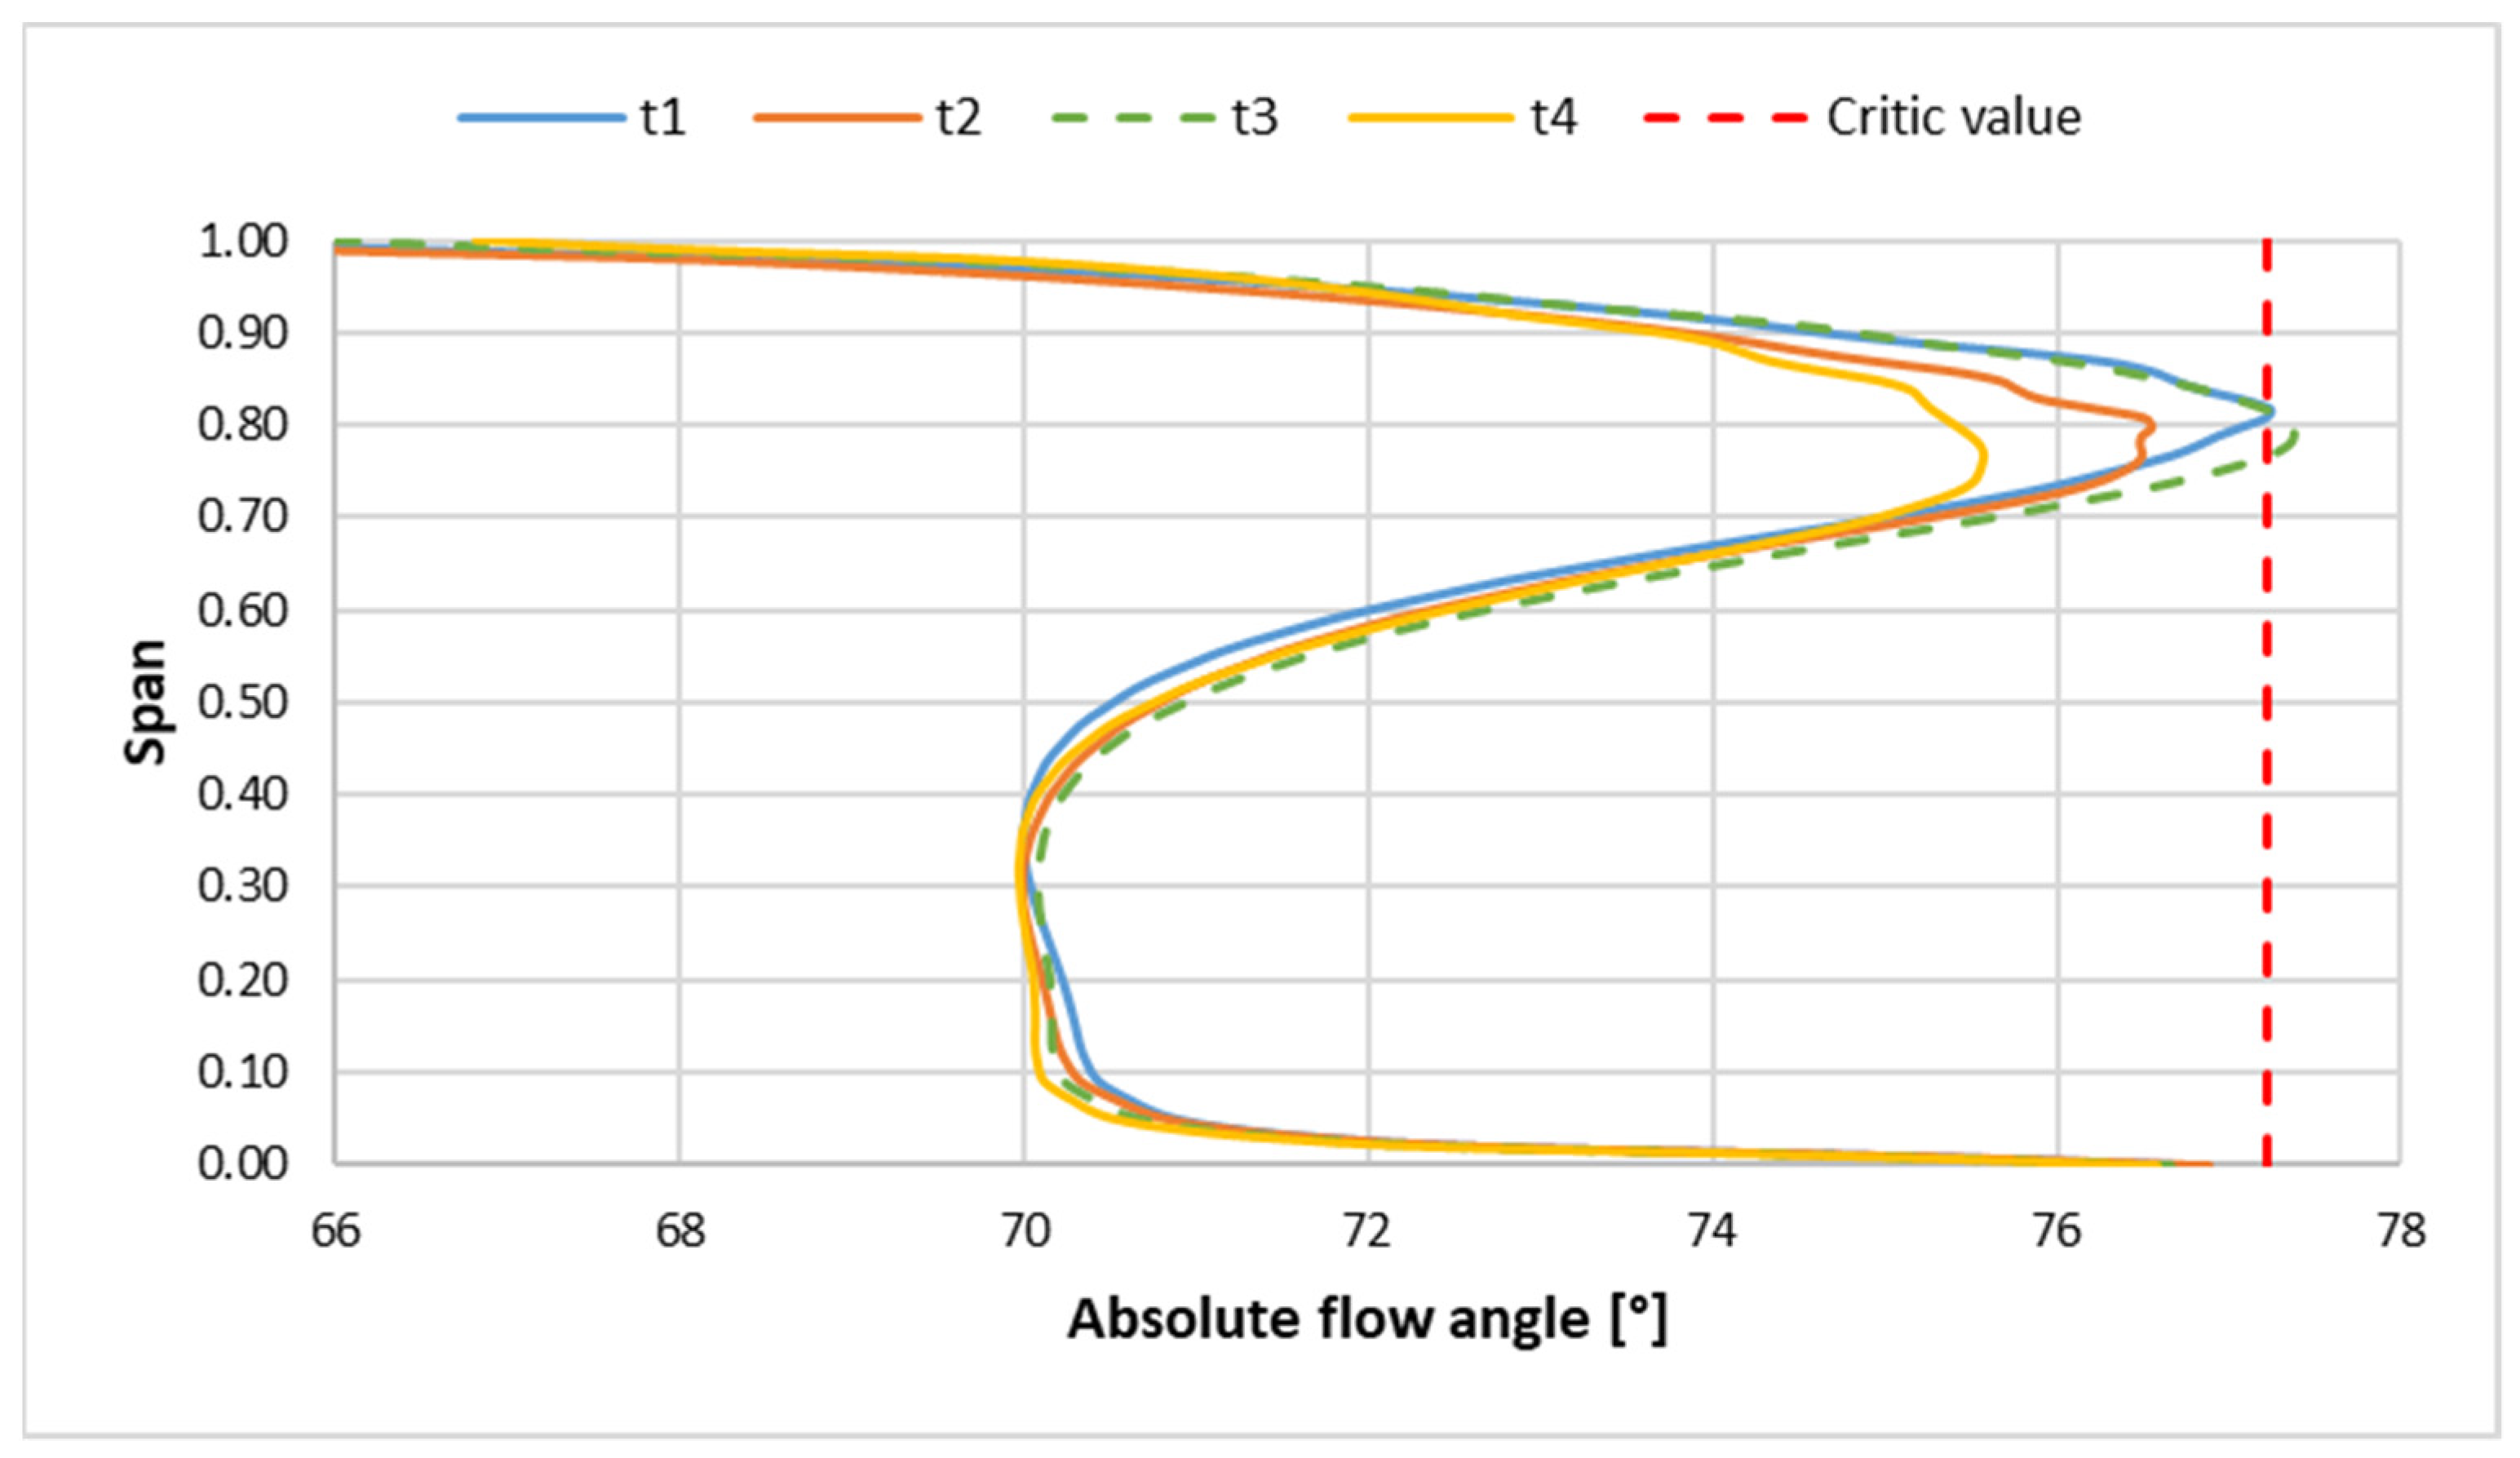
The aim was to verify if the operating point OP3 (condition of minimum mass flow rate for the design iso-speed) is actually stable with ported shroud, as predicted by the critical angle criterion with steady analysis and simplified CFD model. The baseline case, on the other hand, is not stable at this operating condition. To do this, an unsteady simulation was carried out with the fully 3D model according to the settings discussed in Section 2.2.2. The critical angle criterion was then applied to the unsteady data with post-processing operation. Being far from the best efficiency condition, the periodicity of the monitors in the simulation was obtained after about 20 complete revolutions of the impeller. Figure 20 shows the hub-to-shroud distribution of the absolute flow angle at the diffuser inlet; only four different time instants were considered (corresponding to different rotor blade positions) for brevity.
It can be observed that the flow angle exceeds the critical Senoo value only in one instant (time instant t3) and with a very limited span extension; the distributions for the other instants are below the critical value.
The same unsteady analysis for the operating condition OP3 was carried out for the baseline case. In Figure 21, the hub-to-shroud distribution of the absolute flow angle at the diffuser inlet at different instants is reported for the same OP3.
It is evident that the critical angle criterion is violated for the entire set of instants considered, giving clear indications of the unstable conditions inside the centrifugal stage. In fact, the steady simulations for this baseline configuration (both Simple + Volute and Fully 3D) at the operating point OP3 did not converge. To be able to perform the unsteady run at OP3, a steady (frozen rotor) simulation at the steady point with mass flow ṁcor = 0.5 (lowest steady condition for the baseline case) was used to initialize the unsteady run; the mass flow boundary condition OP3 was changed during the unsteady simulation from the previous value.
The flow periodicity was reached after about 40 complete rotor revolutions. In Figure 22, the pressure coefficient (Cp) signals at the rotor outlet show the different stability of the flow inside the compressor with or without (baseline) the ported shroud for the operating point OP3. The timesteps reported correspond to about the last 35 rotor revolutions; in the baseline configuration, there are significantly higher oscillations and a low frequency perturbation compared to the ported shroud case with an oscillation from a steady reference value (close to 7.4) having smaller amplitudes.
The above analysis confirms the capability of the ported shroud solution to extend the operating range of the compressor stage at lower mass flow rates.

4. Conclusions

The use of a simplified CFD model demonstrated its capabilities to support the understanding of the main differences in the performance of a centrifugal compressor with ported shroud compared to a baseline case. It was verified that, near surge, the performance (total pressure ratio) was improved with the ported shroud addition; the above beneficial effect is more evident at high rotational speed. There is a physiological reduction at the best efficiency condition with the ported shroud. The main drawback is the efficiency reduction for all operating ranges with this device. However, the main beneficial effect of the ported shroud consists of surge margin extension; an extension of 11% in the operating range was obtained at design speed. This extension, generally difficult to find in the literature, was quantified using the proposed CFD model coupled to the use of the critical angle stability criterion, developed in a previous work by the authors. An in-depth flow analysis in the cavity and in the main channel of the compressor explained, in some detail, the main fluid dynamic differences that occur with or without ported shroud. It was shown how the cavity recirculates the low momentum flow located in the inducer, present at the near surge conditions. This recirculation re-energizes the main channel and decreases the circumferential velocity component. At the best efficiency condition, the worsening of performance is due to the variation in the circumferential component (in absolute values) caused by the recirculation that, albeit to a lesser extent, still occurs in the cavity; this reduces the flow incidence at the leading edge at higher span. Unsteady fully 3D simulations confirmed the stability conditions of the configurations with or without ported shroud at operating point OP3 with a direct validation of the stability criterion based on the critical flow angle at the diffuser inlet. An interesting outcome of the research activity is the setting of an appropriate methodology to predict the performance of the centrifugal stage equipped with ported shroud based on affordable simulations required during the design and development phases.

Author Contributions

C.C., P.J.L. and D.M. have equally contributed to the concept of the research activity, the setup of the model, the discussion of the results, and the writing of the paper. All authors have read and agreed to the published version of the manuscript.

Funding

This research received no external funding.

Institutional Review Board Statement

Not applicable.

Informed Consent Statement

Not applicable.

Data Availability Statement

Not applicable.

Conflicts of Interest

The authors declare no conflict of interest.

Nomenclature

AArea, [mm2]
bSpan height, [mm]
CpPressure coefficient: (pout-p1)/(ptrel,1-pout)
DRiDiffusion ratio
kSpecific heat coefficient
lLength, [mm]
Mass flow rate, [kg/s]
MaMach number
NRotational speed, [rpm]
pPressure, [Pa]
RRadius, [mm]
SSpan percentage over critical flow angle
SMSurge margin
tcTip clearance, [mm]
TTemperature, [K]
VAbsolute velocity, [m/s]
WRelative velocity, [m/s]
Y+Non dimensional boundary layer distance from wall
zAxial coordinate, [mm]
ZbBlades number
αAbsolute flow angle: arctg(Vth/Va)
βPressure ratio
γFlow angle: arctg(Vr/Va)
ηEfficiency
Subscripts
0Model inlet (adduction duct inlet)
1Impeller inlet
4Diffuser inlet
5Diffuser outlet
6Volute outlet
aAxial
AUpstream interface of the ported shroud
BDownstream interface of the ported shroud
cCritic
corCorrected
effEffective
EXPExperimental
LELeading edge
mMeridional
maxMaximum
minMinimum
outRotor outlet
PSPorted shroud
rRadial
relIn relative frame
rotRotor
tTotal
TETrailing edge
TIPTip blade
thCircumferential
volVolute
Acronyms
CFDComputer fluid dynamic

References

  1. Ricardo, M.B.; Apostolos, P.; Yang, M. Overview of boosting options for future downsized engines. Sci. China Technol. Sci. 2011, 54, 318–331. [Google Scholar] [CrossRef]
  2. Alshammari, M.; Alshammari, F.; Pesyridis, A. Electric boosting and energy recovery systems for engine downsizing. Energies 2019, 12, 4636. [Google Scholar] [CrossRef] [Green Version]
  3. Rodgers, C. Centrifugal Compressor Inlet Guide Vanes for Increased Surge Margin. J. Turbomach. 1991, 113, 696–702. [Google Scholar] [CrossRef]
  4. Whitfield, A.; Abdullah, A.H. The performance of a Centrifugal Compressor with High Inlet Prewhirl. J. Turbomach. 1998, 120, 487–493. [Google Scholar] [CrossRef]
  5. Ishida, M.; Sakaguchi, D.; Ueki, H. Effect of Pre-Swirl on Unstable Flow Suppression in a Centrifugal Impeller with Ring Groove Arrangement. In Proceedings of the ASME Turbo Expo: Power for Land, Sea, and Air, Barcelona, Spain, 8–11 May 2006; GT2006-90400. p. 90400. [Google Scholar]
  6. Saha, S.L.; Kurokawa, J.; Matsui, J.; Imamura, H. Passive Control of Rotating Stall in a Parallel-Wall Vaned Diffuser by J-Grooves. J. Fluids Eng. 2001, 123, 507–515. [Google Scholar] [CrossRef]
  7. Macdougal, I.; Elder, R.L. The Improvements of Operating Range in a Small, High Speed, Centrifugal Compressor Using Casing Treatment. In Proceedings of the IMechE Conference on Turbochargers and Turbocharging C32/82, London, UK, 2–28 April 1982. [Google Scholar]
  8. Zheng, X.; Zhang, Y.; Yang, M.; Bamba, T.; Tamaki, H. Stability Improvement of High-Pressure-Ratio Turbocharger Centrifugal Compressor by Asymmetrical Flow Control—Part II: Nonaxisymmetrical Self-Recirculation Casing Treatment. J. Turbomach. 2002, 135, 021007. [Google Scholar] [CrossRef] [Green Version]
  9. Sivagnanasundaram, S.; Spence, S.; Early, J.; Nikpour, B. An impact of Various Shroud Bleed Slot configurations and Cavity Vanes on Compressor Map Width and the Inducer Flow Field. J. Turbomach. 2013, 135, 041003. [Google Scholar] [CrossRef]
  10. Guleren, K.M.; Afgan, I.; Turan, A. Predictions of Turbulent Flow for the Impeller of a NASA Low-Speed Centrifugal Compressor. J. Turbomach. 2010, 132, 021005. [Google Scholar] [CrossRef]
  11. Fisher, F.B. Application of Map Width Enhancement Devices to Turbocharger Compressor Stages. J. Engines 1988, 97, 1303–1310. [Google Scholar]
  12. Bousquet, Y.; Carbonneau, X.; Dufour, G.; Binder, N.; Trebinjac, I. Analysis of the Unsteady Flow Field in a Centrifugal Compressor from Peak Efficiency to Near Stall with Full-Annulus Simulations. Int. J. Rot. Mach. 2014, 2014, 729629. [Google Scholar] [CrossRef] [Green Version]
  13. Hunziker, R.; Dickman, H.P.; Emmrich, R. Numerical and experimental investigations of a centrifugal compressor with an inducer casing bleed system. Proc. Inst. Mech. Eng. Part A J. Power Energy 2001, 215, 783–791. [Google Scholar] [CrossRef]
  14. Yamaguchi, N. The Development of Effective Casing Treatment for Turbocharger Compressors. In Proceedings of the IMechE Seventh International Conference, London, UK, 14–15 May 2002. [Google Scholar]
  15. Tamaki, H. Effect of Recirculation Device on Performance of High-Pressure Ratio Centrifugal Compressor. In Proceedings of the Turbo Expo: Power for Land, Sea, and Air, Glasgow, UK, 14–18 June 2010; Volume 44021, pp. 1879–1889. [Google Scholar]
  16. Tamaki, H. Effect of recirculation device with counter swirl vane on performance of high-pressure ratio centrifugal compressor. J. Turbomach. 2012, 134, 051036. [Google Scholar] [CrossRef]
  17. Nikpour, B. Turbocharger Compressor Flow Range Improvement for Future Heavy Duty Diesel Engines. In Proceedings of the THIESEL 2004 Conference on Thermo-and Fluid Dynamic Processes in Diesel Engines, Valencia, Spain, 7–10 September 2004. [Google Scholar]
  18. Xiao, J.; Xu, W.; Gu, C.; Shu, X. Self-recirculating casing treatment for a radial compressor. Chin. J. Mech. Eng. 2009, 22, 567–573. [Google Scholar] [CrossRef]
  19. Kanzaka, T.; Ibaraki, S. Feature of Internal Flow Phenomena of Self Recirculation Casing Treatment in a Centrifugal Compressor for Turbochargers. In Proceedings of the 1st Global Power and Propulsion Forum; GPPF-2017-66; Global Power and Propulsion Society: Zug, Switzerland, 2017. [Google Scholar]
  20. Marelli, S.; Misley, A.; Taylor, A.; Silvestri, P.; Capobianco, M.; Canova, M. Experimental Investigation on Surge Phenomena in an Automotive Turbocharger Compressor. In Proceedings of the WCX World Congress Experience, Detroit, MI, USA, 10–12 April 2018; SAE Technical Paper 2018-01-0976. SAE: Warrendale, PA, USA, 2018. [Google Scholar]
  21. Marelli, S.; Misley, A.; Ferrando, M. Experimental Investigation in Turbocharger Compressors during Surge Operation. In Proceedings of the ASME Turbo Expo: Turbomachinery Technical Conference and Exposition, London, UK, 22–26 June 2020; Paper GT2020-15174. ASME: New York, NY, USA, 2020. [Google Scholar]
  22. Guillou, E.; Gancedo, M.; Gutmark, E.; Mohamed, A. PIV investigation of the flow induced by a passive surge control method in a radial compressor. Exp. Fluids 2012, 53, 619–635. [Google Scholar] [CrossRef]
  23. He, X.; Zheng, X. Roles and mechanisms of casing treatment on different scales of flow instability in high pressure ratio centrifugal compressors. Aerosp. Sci. Technol. 2019, 84, 734–746. [Google Scholar] [CrossRef]
  24. Sharma, S.; Broatch, A.; Garcia-Tiscar, J.; Nickson, A.K.; Allport, J.M. Acoustic and pressure characteristics of a ported shroud turbocompressor operating at near surge conditions. Appl. Acoust. 2019, 148, 434–447. [Google Scholar] [CrossRef] [Green Version]
  25. Sharma, S.; Broatch, A.; García-Tíscar, J.; Allport, J.M.; Nickson, A.K. Acoustic characteristics of a ported shroud turbocompressor operating at design conditions. Int. J. Engine Res. 2020, 21, 1454–1468. [Google Scholar] [CrossRef]
  26. Gooding, W.J.; Fabian, J.; Key, N. Numerical Analysis of Unsteady Vaned Diffuser Flow in a Centrifugal Compressor. In Proceedings of the 23rd International Society for Air Breathing Engines Conference, Manchester, UK, 3–8 September 2017. Paper ISABE 2017-21417. [Google Scholar]
  27. Carretta, M.; Cravero, C.; Marsano, D. Numerical Prediction of Centrifugal Compressor Stability Limit. In Proceedings of the ASME Turbo Expo: Turbomachinery Technical Conference and Exposition, Charlotte, NC, USA, 26–30 June 2017; Paper GT2017-63352. ASME: New York, NY, USA, 2017. [Google Scholar]
  28. Bardelli, M.; Cravero, C.; Marini, M.; Marsano, D.; Milingi, O. Numerical Investigation of Impeller-Vaned Diffuser Interaction in a Centrifugal Compressor. Appl. Sci. 2019, 9, 1619. [Google Scholar] [CrossRef] [Green Version]
  29. Cravero, C.; Marsano, D. Criteria for the Stability Limit Prediction of High-Speed Centrifugal Compressors with Vaneless Diffuser. Part I: Flow Structure Analysis. In Proceedings of the ASME Turbo Expo 2020: Turbomachinery Technical Conference and Exposition, Online, 21–25 September 2020; Paper GT2020-14579. ASME: New York, NY, USA, 2017. [Google Scholar]
  30. Cravero, C.; Marsano, D. Criteria for the Stability Limit Prediction of High-Speed Centrifugal Compressors with Vaneless Diffuser. Part II: The development of Prediction Criteria. In Proceedings of the ASME Turbo Expo 2020: Turbomachinery Technical Conference and Exposition, Online, 21–25 September 2020; Paper GT2020-14589. ASME: New York, NY, USA, 2017. [Google Scholar]
  31. Leutcha, P.J. Analysis and Design Criteria for Centrifugal Compressors with Ported Shroud. Ph.D. Thesis, University of Genoa, Genoa, Italy, May 2021. [Google Scholar]
  32. Menter, F.; Kuntz, M.; Langstry, R. Ten years of industrial experience with the SST turbulence model. Turbul. Heat Mass Transf. 2003, 4, 625–632. [Google Scholar]
  33. Smirnov, P.; Menter, F. Sensitization of the SST turbulence model to rotation and curvature by applying the Spalart-Shur correction term. J. Turbomach. 2009, 131, 041010. [Google Scholar] [CrossRef]
  34. Dixon, S.L.; Hall, C. Fluid Mechanics and Thermodynamics of Turbomachinery; Butterworth-Heinemann: Oxford, UK, 2013. [Google Scholar]
  35. Senoo, Y.; Kinoshita, Y. Limits of Rotating Stall and Stall in Vaneless Diffuser of Centrifugal Compressors. In Proceedings of the ASME Turbo Expo, London, UK, 9–13 April 1978; Paper 78 GT 19. ASME: New York, NY, USA, 2017. [Google Scholar]
Figure 1. Sketch of the reference centrifugal compressor with ported shroud, with the main geometrical parameters.
Energies 15 02571 g001
Figure 2. Mesh of a portion of the stage.
Energies 15 02571 g002
Figure 3. Mesh of a sector of the ported shroud with a cut-plane.
Energies 15 02571 g003
Figure 4. Mesh of the volute with the prism layer detail on the volute inlet.
Energies 15 02571 g004
Figure 5. Comparison of the pressure ratio curve of the centrifugal compressor with ported shroud obtained from the CFD Simple + Volute model with respect to the experimental data, at the design rotational speed of Ncor = 1.0.
Energies 15 02571 g005
Figure 6. Comparison of the characteristic curve of the pressure ratio between the ported shroud case and the baseline case, at different rotational speeds.
Energies 15 02571 g006
Figure 7. Comparison of the characteristic curve of the isentropic total to total efficiency between the ported shroud case and the baseline case, at different rotational speeds.
Energies 15 02571 g007
Figure 8. Streamlines on the meridional plane for different operating points in the configuration with ported shroud (left) and baseline (right), at Ncor = 1.0.
Energies 15 02571 g008
Figure 9. Distribution of the mass flow rate passing in the cavity, by varying the operating condition, at Ncor = 1.0.
Energies 15 02571 g009
Figure 10. Distribution of the total pressure at sections A and B by varying the operating condition—nominal rotational speed.
Energies 15 02571 g010
Figure 11. Contours of total pressure with superimposed the velocity vectors inside the cavity at the near surge condition OP2 (upper) and best efficiency OP1 (lower).
Energies 15 02571 g011
Figure 12. Comparison of the hub-to-shroud distribution of the meridional velocity at the leading edge between the configurations with ported shroud and baseline, at near surge condition OP2.
Energies 15 02571 g012
Figure 13. Contour of the relative Mach number in the meridional plane at near surge condition OP2—configurations with ported shroud (a) and baseline (b).
Energies 15 02571 g013
Figure 14. Comparison of the hub-to-shroud distribution of the relative circumferential velocity at the leading edge between the configurations with ported shroud and baseline, at near surge condition OP2.
Energies 15 02571 g014
Figure 15. Comparison of the hub-to-shroud distribution of the relative flow angle at the leading edge between the configurations with ported shroud and baseline, at near surge condition OP2.
Energies 15 02571 g015
Figure 16. Comparison of the hub-to-shroud distribution of the relative circumferential velocity at the leading edge between the configurations with ported shroud and baseline, at the best efficiency condition OP1.
Energies 15 02571 g016
Figure 17. Comparison of the hub-to-shroud distribution of the relative flow angle at the leading edge between the configurations with ported shroud and baseline, at the best efficiency condition OP1.
Energies 15 02571 g017
Figure 18. Variation in the parameter S with the mass flow rate, for different rotational speeds, for the configurations with ported shroud and baseline.
Energies 15 02571 g018
Figure 19. Variation in the diffusion ratio DRi with mass flow rate in the configurations with ported shroud and baseline, at Ncor = 1.0.
Energies 15 02571 g019
Figure 20. Hub-to-shroud distributions of the absolute flow angle at the diffuser inlet obtained with the fully 3D unsteady model with ported shroud at the condition OP3, for several instants.
Energies 15 02571 g020
Figure 21. Hub-to-shroud distributions of the absolute flow angle at the diffuser inlet obtained with the fully 3D unsteady model baseline at the condition OP3, for several instants.
Energies 15 02571 g021
Figure 22. Instantaneous Cp data at the rotor outlet for the configurations with ported shroud and baseline (last 35 rotor revolutions for operating point OP3).
Energies 15 02571 g022
Table 1. Geometrical non-dimensional data of the reference compressor.
Geometric ParameterValue
Impeller blade number: Zb6 + 6
Span at diffuser inlet: b4/R40.0706
Radius at rotor leading edge hub: RLE,hub/R40.1755
Radius at rotor leading edge tip: RLE,tip/R40.7166
Radius at diffuser outlet: R5/R41.5323
Ported Shroud length: lPS/R40.8201
Vertical position of the downstream interface of the ported shroud: zPS-impeller/R40.5141
Maximum radius of the volute: Rmax,vol/R42.3519
Table 2. Mesh configurations used for the mesh sensitivity with the total pressure difference and the mass flow rate through the cavity.
MeshCell Number
(Mcells)
ptA–ptB
(Pa)
MRF
M10.631,40026.59
M21.0525,00025.91
M31.724,90025.88
Table 3. Main flow characteristics exiting from section A of the cavity at the conditions OP1 (best efficiency) and OP2 (near surge).
VariableBest Efficiency
OP1
Near Surge
OP2
MRF (%)7.025.91
Va (m/s)43.8−8.9
Vth (m/s)91.6198.9
Vr (m/s)−20.9−58.3
α (°)63.7−48.6
γ (°)−26.546.6
Publisher’s Note: MDPI stays neutral with regard to jurisdictional claims in published maps and institutional affiliations.