Review

Decarbonizing Natural Gas: A Review of Catalytic Decomposition and Carbon Formation Mechanisms

1
School of Mechanical and Aerospace Engineering, Nanyang Technological University, Singapore 639798, Singapore
2
Energy Research Institute at NTU (ERI@N), Nanyang Technological University, 1 CleanTech Loop, Singapore 637141, Singapore
*
Author to whom correspondence should be addressed.
Energies 2022, 15(7), 2573; https://doi.org/10.3390/en15072573
Submission received: 1 March 2022 / Revised: 23 March 2022 / Accepted: 26 March 2022 / Published: 1 April 2022

Abstract

:
In the context of energy conservation and the reduction of CO2 emissions, inconsistencies between the inevitable emission of CO2 in traditional hydrogen production methods and eco-friendly targets have become more apparent over time. The catalytic decomposition of methane (CDM) is a novel technology capable of producing hydrogen without releasing CO2. Since hydrogen produced via CDM is neither blue nor green, the term “turquoise” is selected to describe this technology. Notably, the by-products of methane cracking are simply carbon deposits with different structures, which can offset the cost of hydrogen production cost should they be harvested. However, the encapsulation of catalysts by such carbon deposits reduces the contact area between said catalysts and methane throughout the CDM process, thereby rendering the continuous production of hydrogen impossible. This paper mainly covers the CDM reaction mechanisms of the three common metal-based catalysts (Ni, Co, Fe) from experimental and modelling approaches. The by-products of carbon modality and the key parameters that affect the carbon formation mechanisms are also discussed.

1. Introduction

1.1. Background

Since the Paris Agreement, a legally binding international treaty on climate change, was signed in 2015, each country has taken increasingly ambitious actions to reassess its existing energy mix to facilitate the future energy transition [1]. In 2020, all participating countries had submitted their plans for climate action, known as Nationally Determined Contributions (NDCs) [2]. Considering the unique circumstances of each country, the adoption of mitigation measures must consider affordability (energy equity) and energy security in addition to the environmental sustainability, which is the so-called Energy Trilemma [3]. For small countries with high economic activities but heavily dependent on imported energies (such as Singapore), they are all vulnerable to threat of energy security [4].
As a versatile and clean energy source, hydrogen and its carriers have been considered important energy vectors in the energy-mix future. Hydrogen can be produced by water electrolysis using renewable energy or by thermochemical methods such as steam reforming of fossil fuels. Depending on the resources, the evolution of hydrogen production can be roughly divided into the following three stages, as shown in Figure 1. Grey hydrogen includes coal gasification, petroleum, and natural gas reforming technologies. These are mature technologies with high energy conversion efficiency (≥70%) but inevitably emit CO2 and other harmful pollutants [5]. Grey hydrogen has taken up ~95% of the global hydrogen production share partly because of its low-cost production [6]. Blue hydrogen is essentially a combination of grey hydrogen technology and carbon capture and sequestration (CCS) technology, with natural gas being the primary source [7]. However, this technology has become controversial lately and may not be seen as a viable and environmentally benign energy alternative. Nevertheless, it can be seen as a transition approach bridging the current grey hydrogen production to the future green hydrogen production using pure renewable energy. Green hydrogen represents zero emissions in the hydrogen production process, which includes water electrolysis and photocatalytic water splitting using renewable energy sources.
Another color code for hydrogen, namely turquoise hydrogen [8], has been under consideration to serve as a transition approach towards green hydrogen production. Essentially, instead of converting the natural gas (mostly methane) into hydrogen and oxides of carbon (CO and CO2), catalytic decomposition of methane (CDM) is applied to convert the methane into hydrogen and solid carbons using renewable energy, thus such hydrogen production technology releases no or minimal CO2 to the atmosphere.

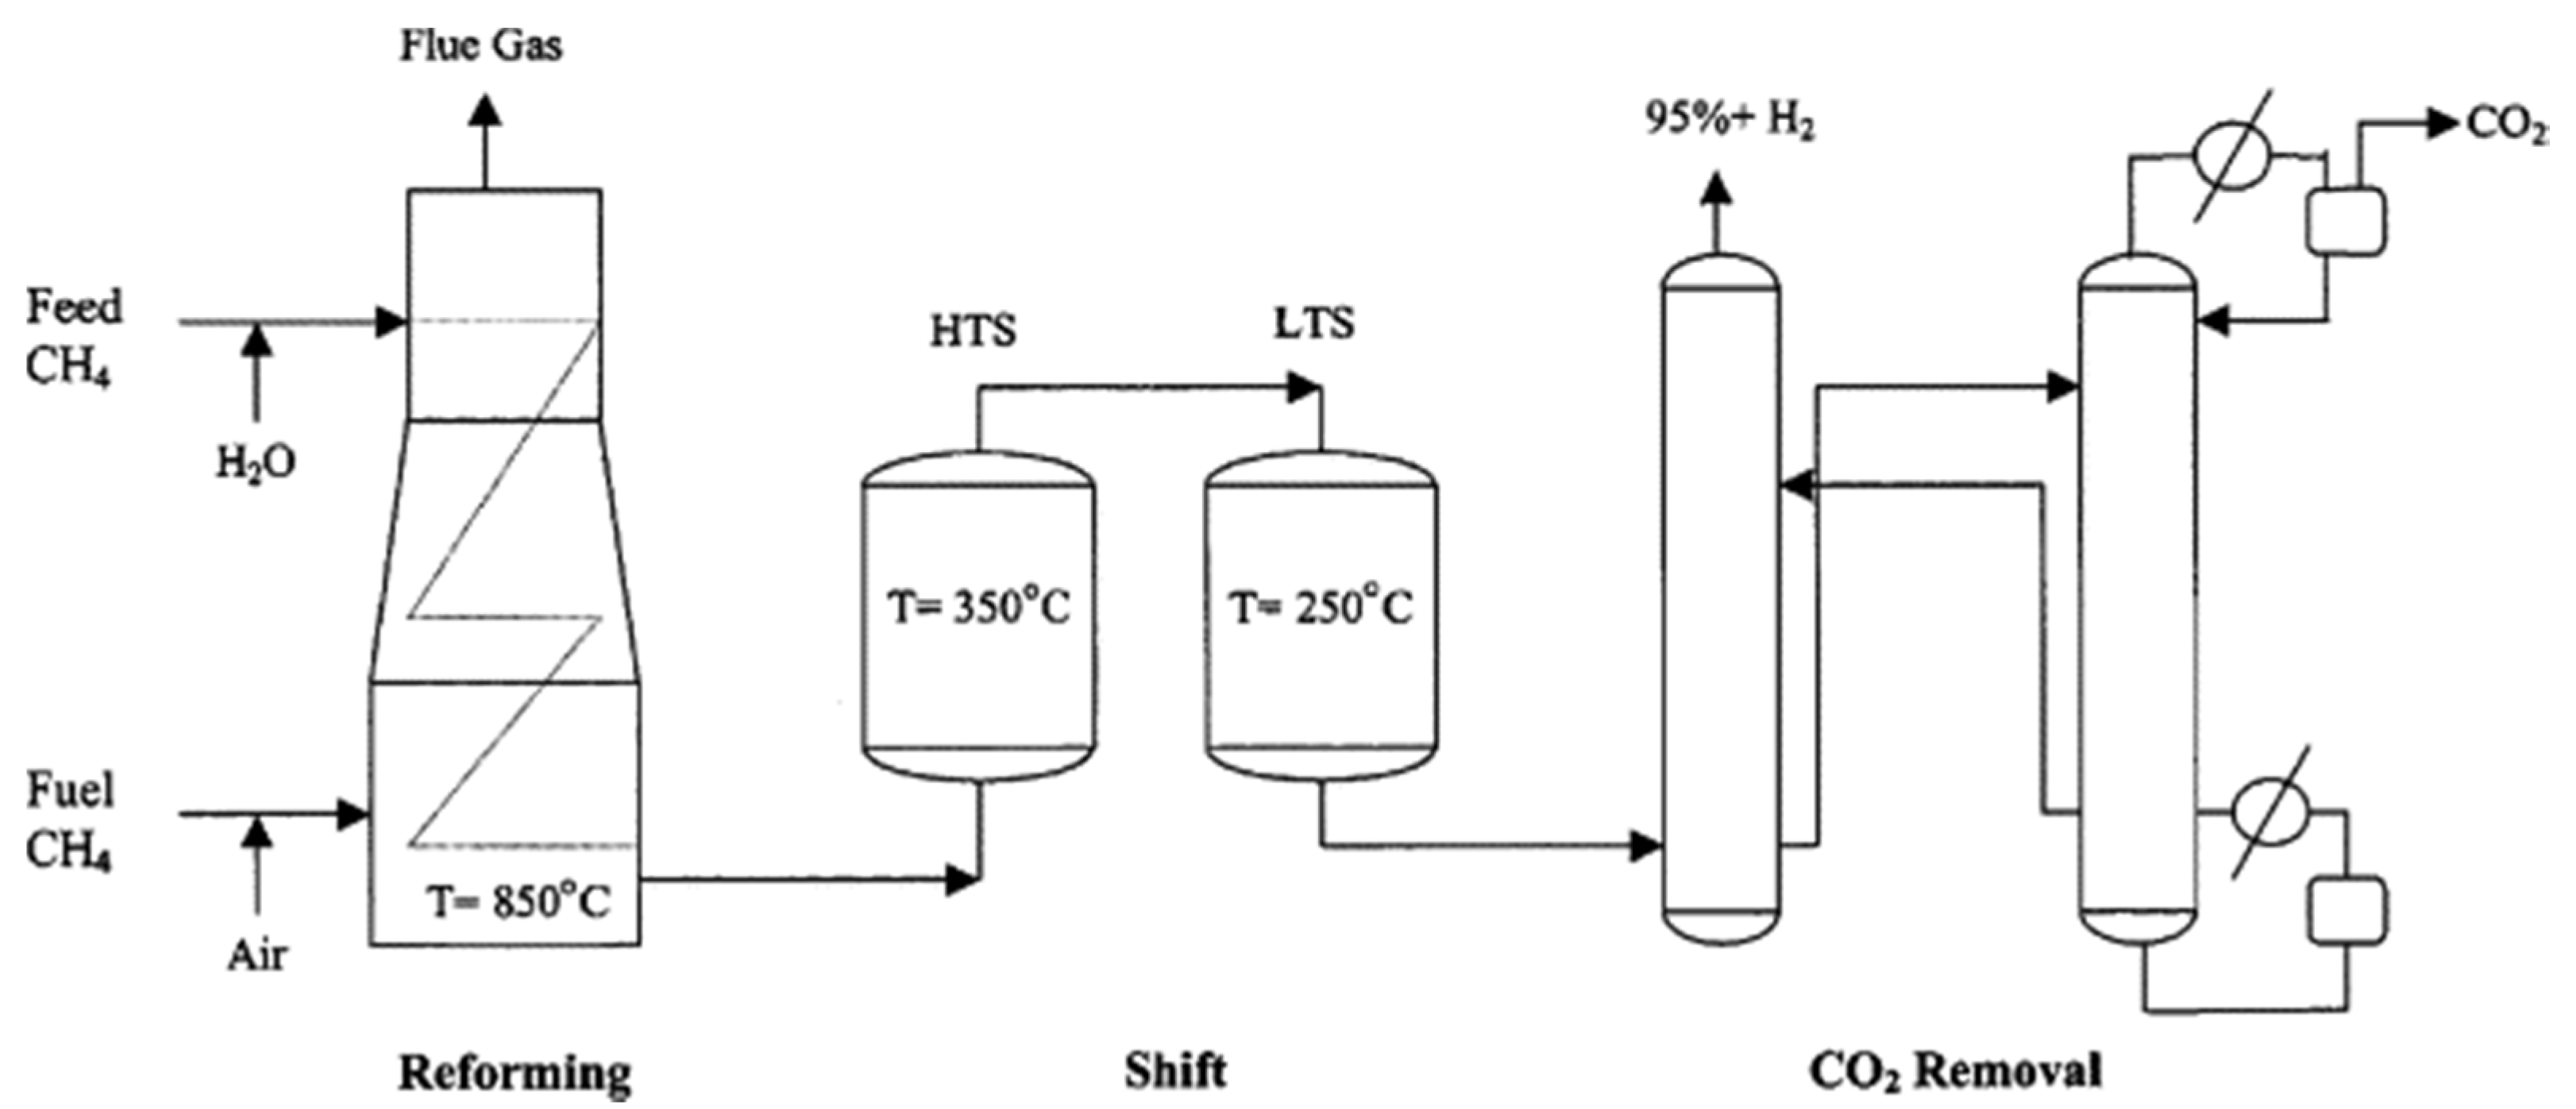
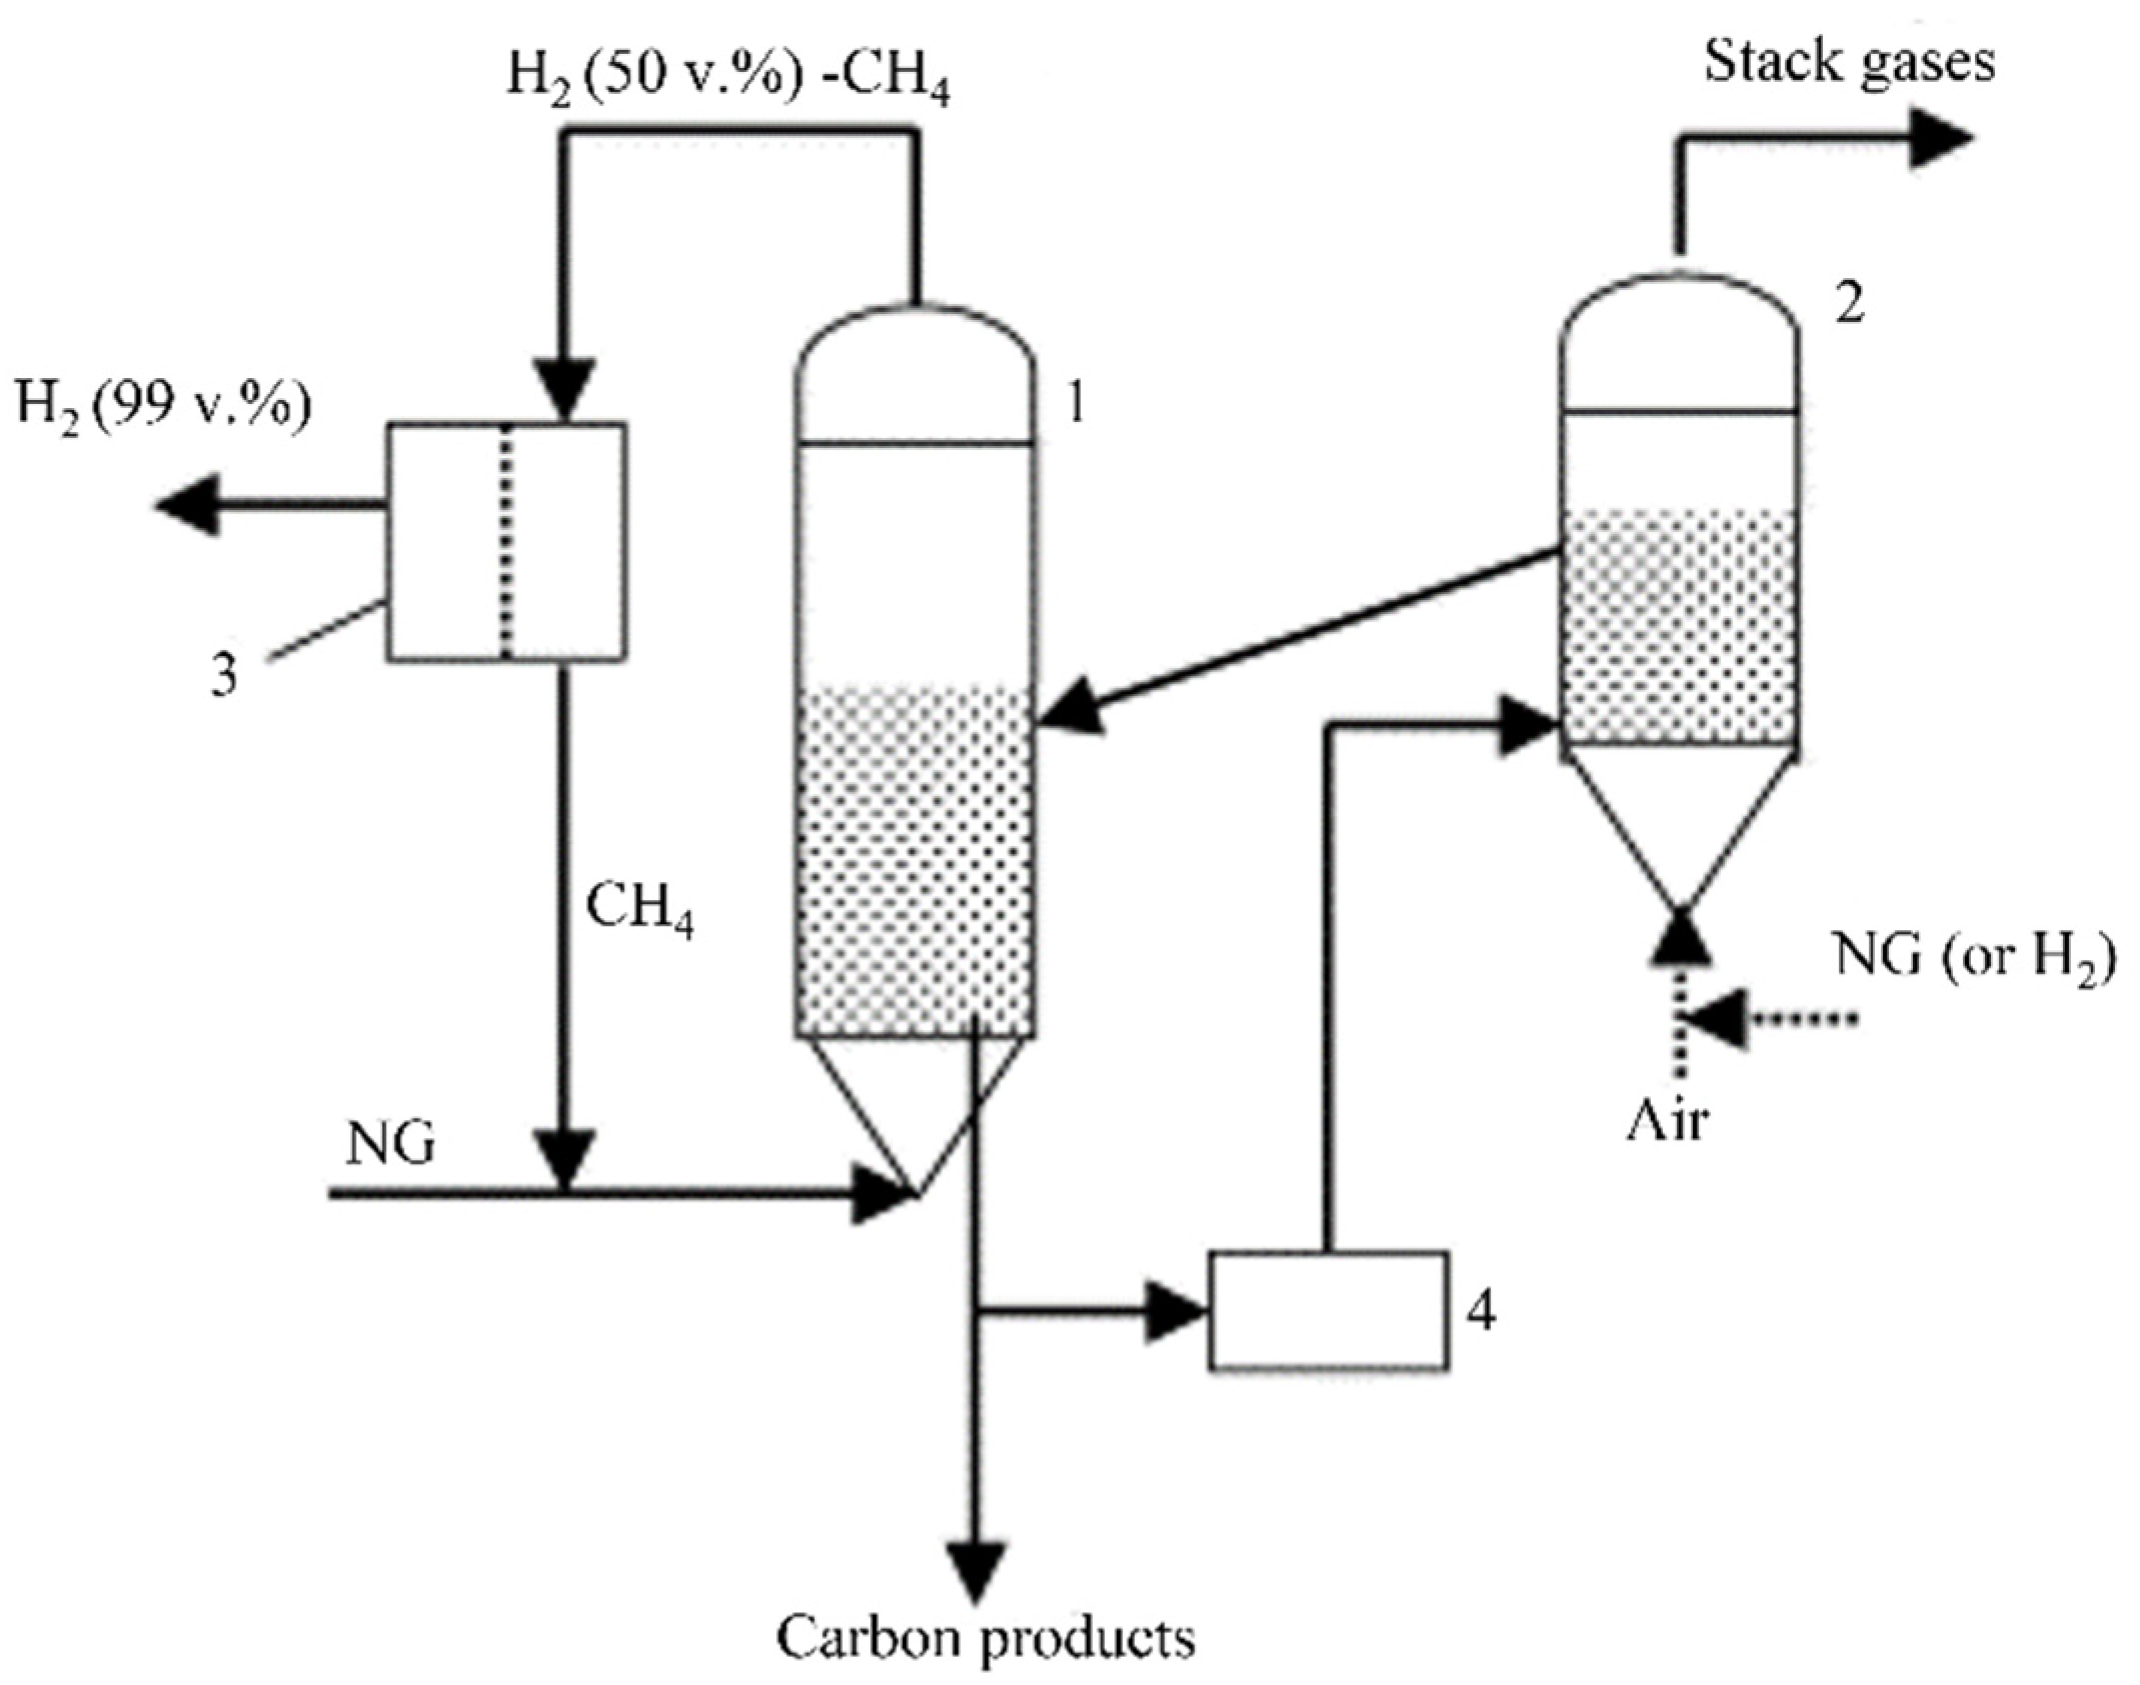
1.2. Hydrogen Generation Methods

As the most representative technology for “grey hydrogen” production, steam methane reforming (SMR) shown in Figure 2 is a multi-stage reaction process [9,10]. The first stage is the catalytic reforming of methane (see Equations (1) and (2)), which operates under high temperature and elevated pressure conditions. The by-products include CO and CO2, and the ratio between them is determined by the feedstocks. In the second stage, the syngas (H2 and COx) is channeled to the water-gas shifting (WGS) units converting CO into CO2 while increasing the hydrogen yield [11]. Finally, the third stage is to remove CO2 from hydrogen. Studies showed that pressure-swing adsorption (PSA) technology combined with Pd membrane can purify hydrogen to the desired grade for fuel cell electric vehicles [12].
CH 4 + H 2 O CO + 3 H 2 ,   Δ H 298 K = 206   kJ / mol
CH 4 + 2 H 2 O CO 2 + 4 H 2 ,   Δ H 298 K = 165   kJ / mol
CO + H 2 O CO 2 + H 2 ,   Δ H 298 K = 41.17   kJ / mol
By contrast, the CDM method originating from methane pyrolysis emerged in the 1960s. Essentially, energy is needed to break C-H bonds (~100 kcal/mol), producing hydrogen and solid carbons [13,14,15]. This endothermic reaction occurs at temperatures above 1200 °C when no catalyst is used [16]. Iron triad catalysts (Ni, Co, Fe) are often used to reduce the activation barrier of the reaction, thus reducing the process energy consumption. Figure 3 shows a typical set-up for CDM [11]. Methane gas flows through the fluidized bed reactor loaded with catalysts and cracks into hydrogen and solid carbons (Equation (4)) [17]. The gas mixture (H2 and non-reacted CH4) is then channeled to gas separation units, while the carbon deposits are extracted from the bottom of the reactor. During the CDM reaction, the catalyst activity is gradually degraded as the pores, and internal cavities of the catalyst beads are plugged by the accumulated carbon [18]. Ideally, the reactor should connect to a regeneration unit to restore the catalyst activity, allowing for continuous hydrogen production. In addition to the fluidized bed reactor, a molten salt reactor is also suited for the CDM process. This can optimize the heat transfer due to the high heat capacity of molten media, but the catalyst losses during the operation should be considered [19]. Current regeneration methods, such as air combustion or steam oxidation, have some common drawbacks while removing carbon from catalyst beads. It can be seen from Equations (5) and (6) that the carbon deposits are removed by converting the carbon to CO2 or CO at high temperatures [11]. This drawback may hinder the benefits of using CDM for clean hydrogen production if a significant amount of CO2 is released into the atmosphere during the regeneration stage.
CH 4 C s + 2 H 2 ,   Δ H 298 K = 75   kJ / mol
Regeneration method equations [11]:
Air regeneration:
C + O 2 CO 2 ,   Δ H 1073 K = 174.5   kJ / mol
Steam regeneration:
C + H 2 O CO + H 2 ,   Δ H 1073 K = 135.9   kJ / mol
A comparative study on the two methods above showed that SMR has become more energy-efficient and a mature technology after continuous improvements in the last few decades. However, it inevitably emits CO2 when generating H2 (~5.5–9 kg CO2/kg H2) [20]. The CDM method can produce carbon by-products with potential value while hydrogen is generated. As can be seen from the reaction equation, the CDM method consumes less energy with almost zero CO2 emissions. However, the main drawback of CDM is the unstable catalyst activity, which brings difficulties to continuous hydrogen production. More detailed parameters for these two hydrogen generation methods are listed in Appendix A Table A1. The table also compares CDM technology with other hydrogen production methods (i.e., coal gasification and water electrolysis) to objectively reflect its advantages and disadvantages.

1.3. Scope of the Review

This paper aims to review and summarize the critical aspects of the catalytic decomposition of the methane (CDM) process and is particularly useful for beginners who have keen interest to pursue the topic. Aside from providing a detailed description of the reaction mechanism of the methane cracking process, this review delves into an analysis of experimental results corresponding to three common metal-based catalysts (Ni, Co, Fe). Then, taking the carbon deposits as the core subject, it emphatically introduces various carbon formation mechanisms and catalyst carbon resistance studies. The purpose is to guide the development of a high carbon-to-metal (catalyst) ratio, high value-added carbon products, and potentially regenerative and reusable catalysts. Finally, the existing catalyst regeneration methods are summarized, and some possible optimizations are discussed.

2. Methane Dehydrogenation Mechanism

At the beginning of the catalytic decomposition of methane (CDM), methane molecules are adsorbed by the active sites on the catalyst surface. According to the first C-H bond breaking timing, the cracking mechanism can be classified into dissociative and non-dissociative mechanisms. This section details the processes and reaction rate-limiting steps of these two mechanisms based on the experiments and simulations in the literature.

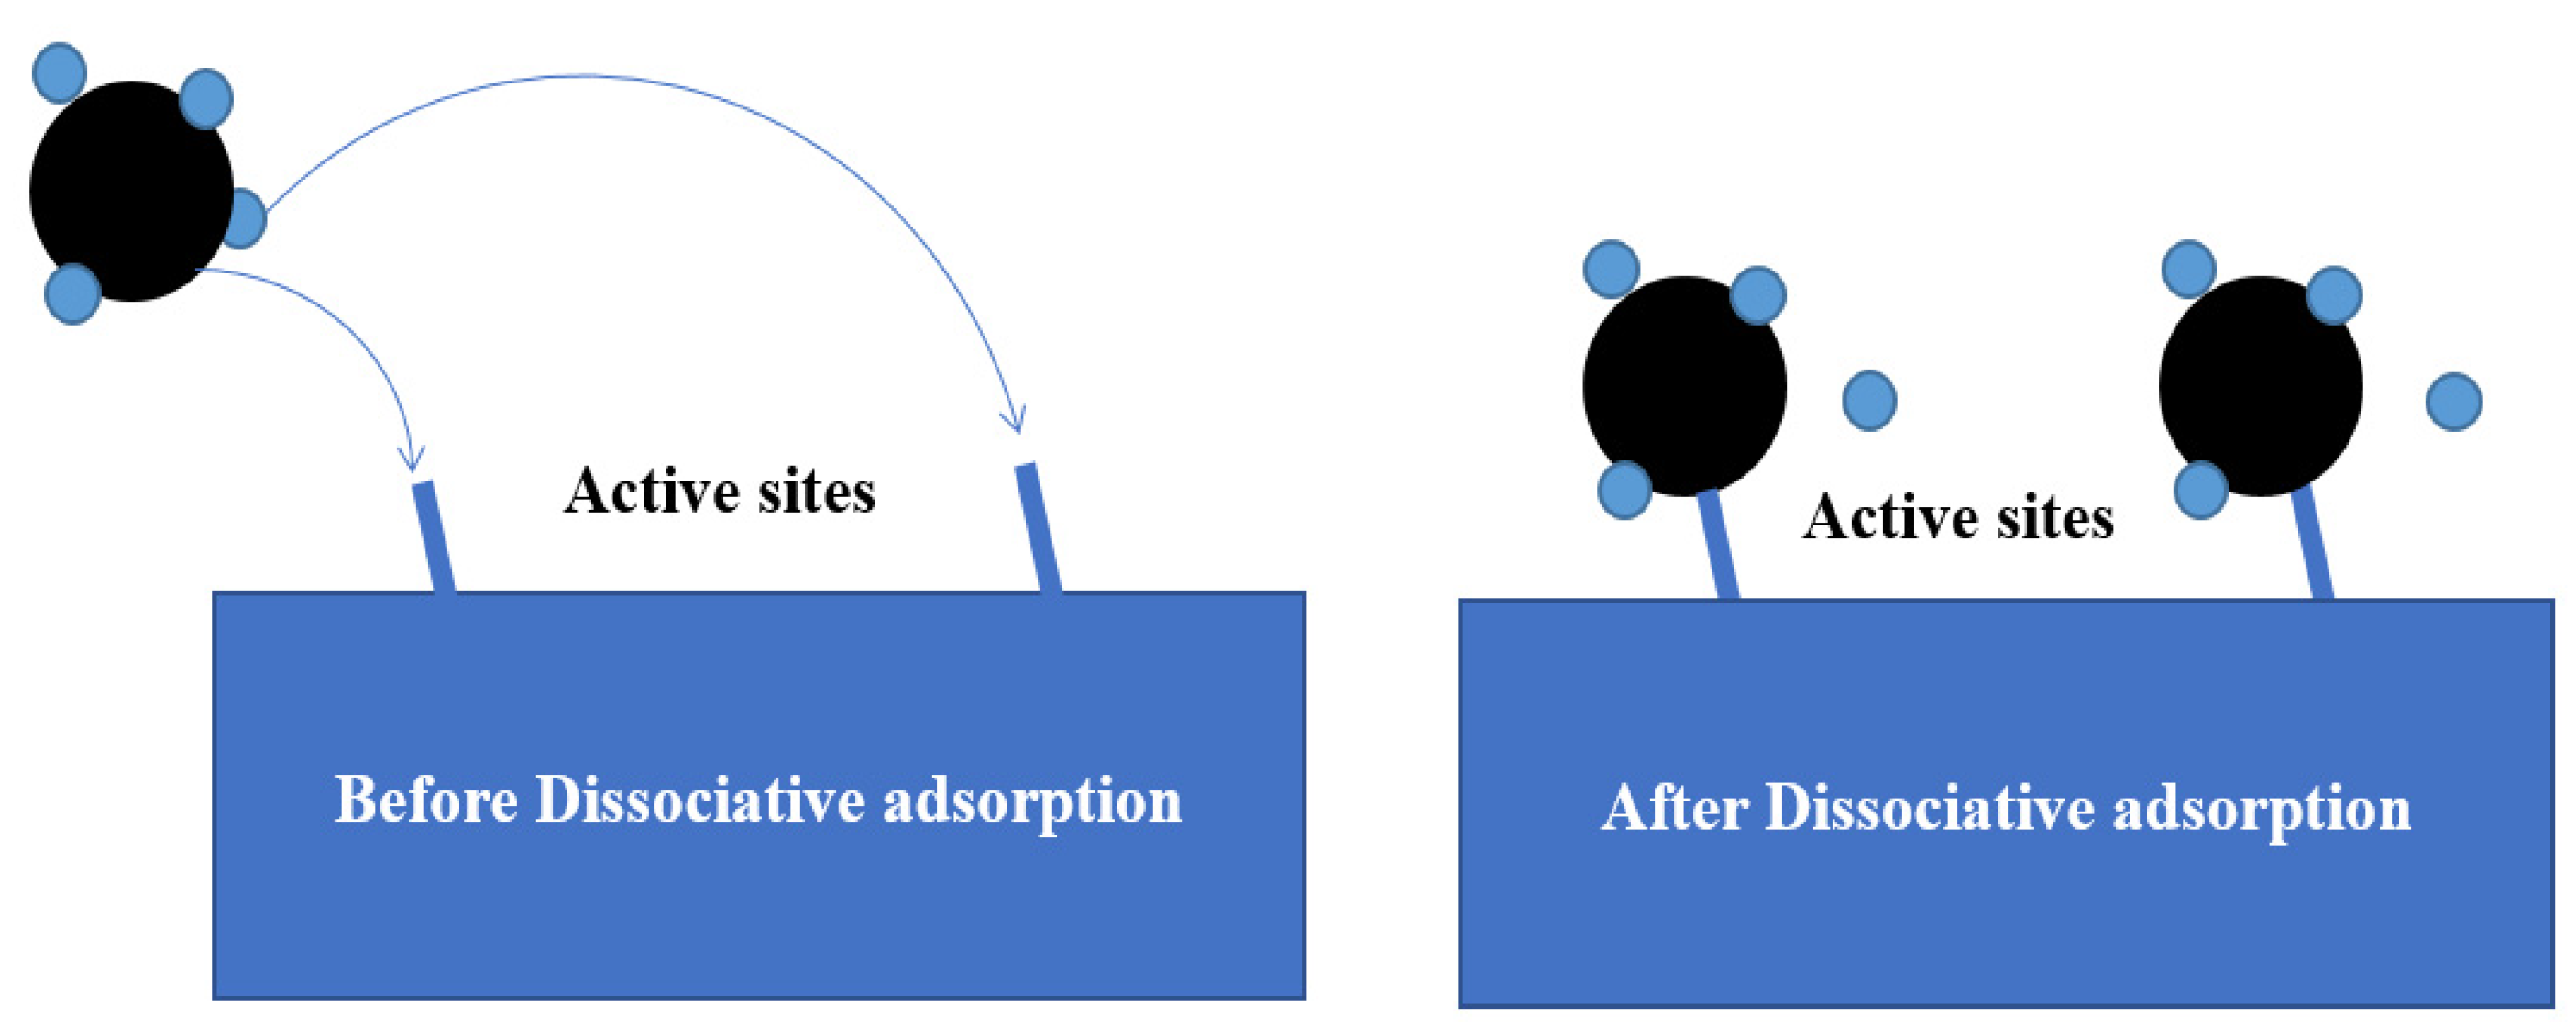
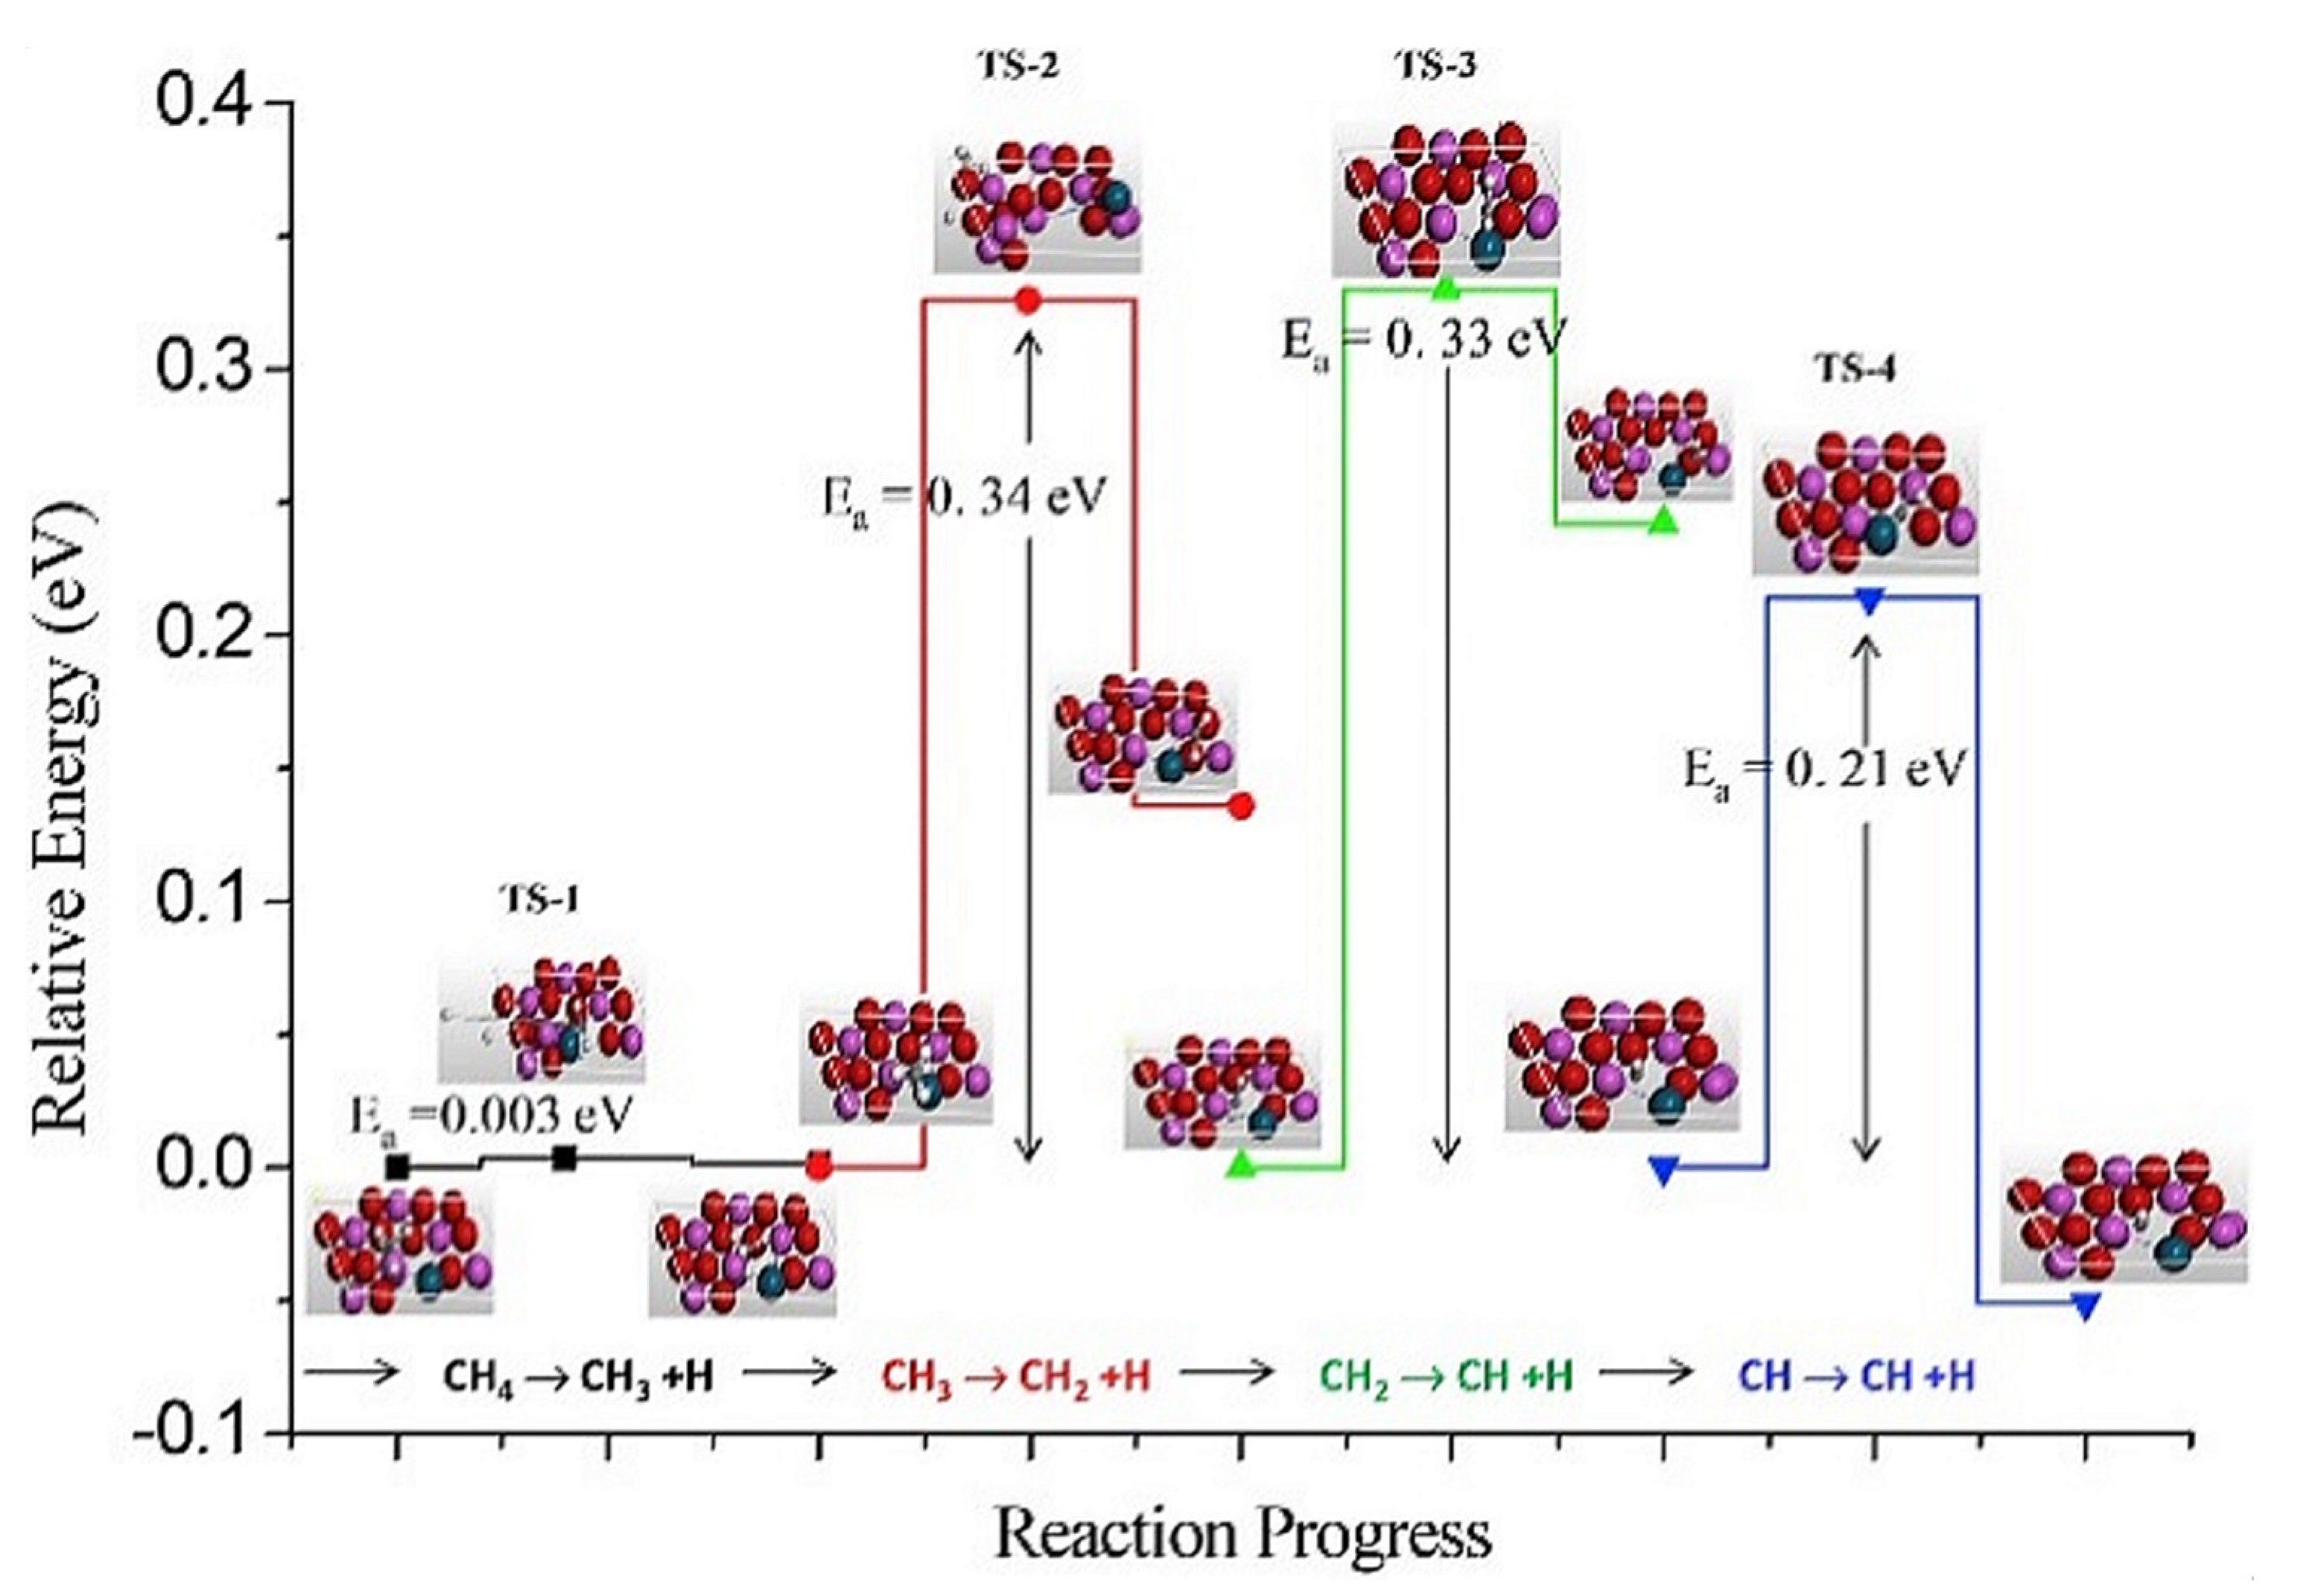
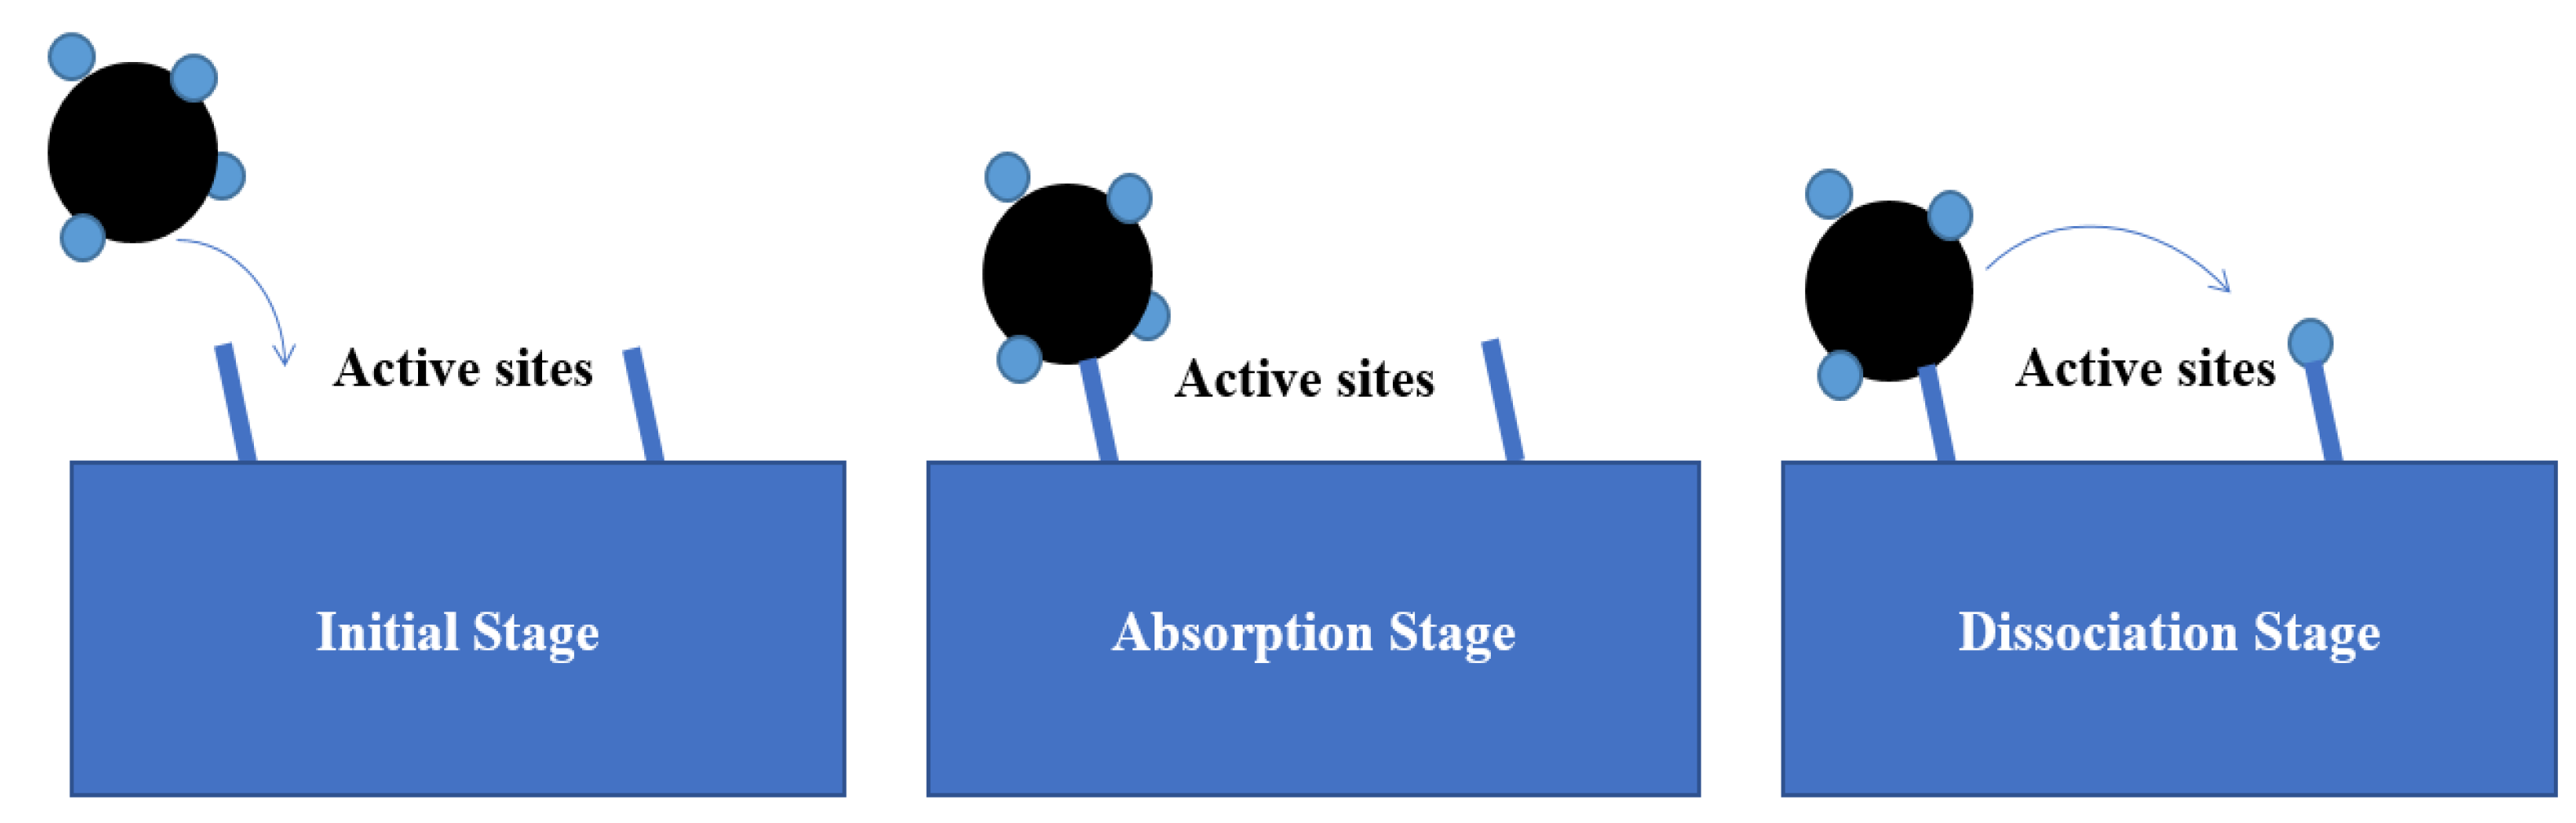
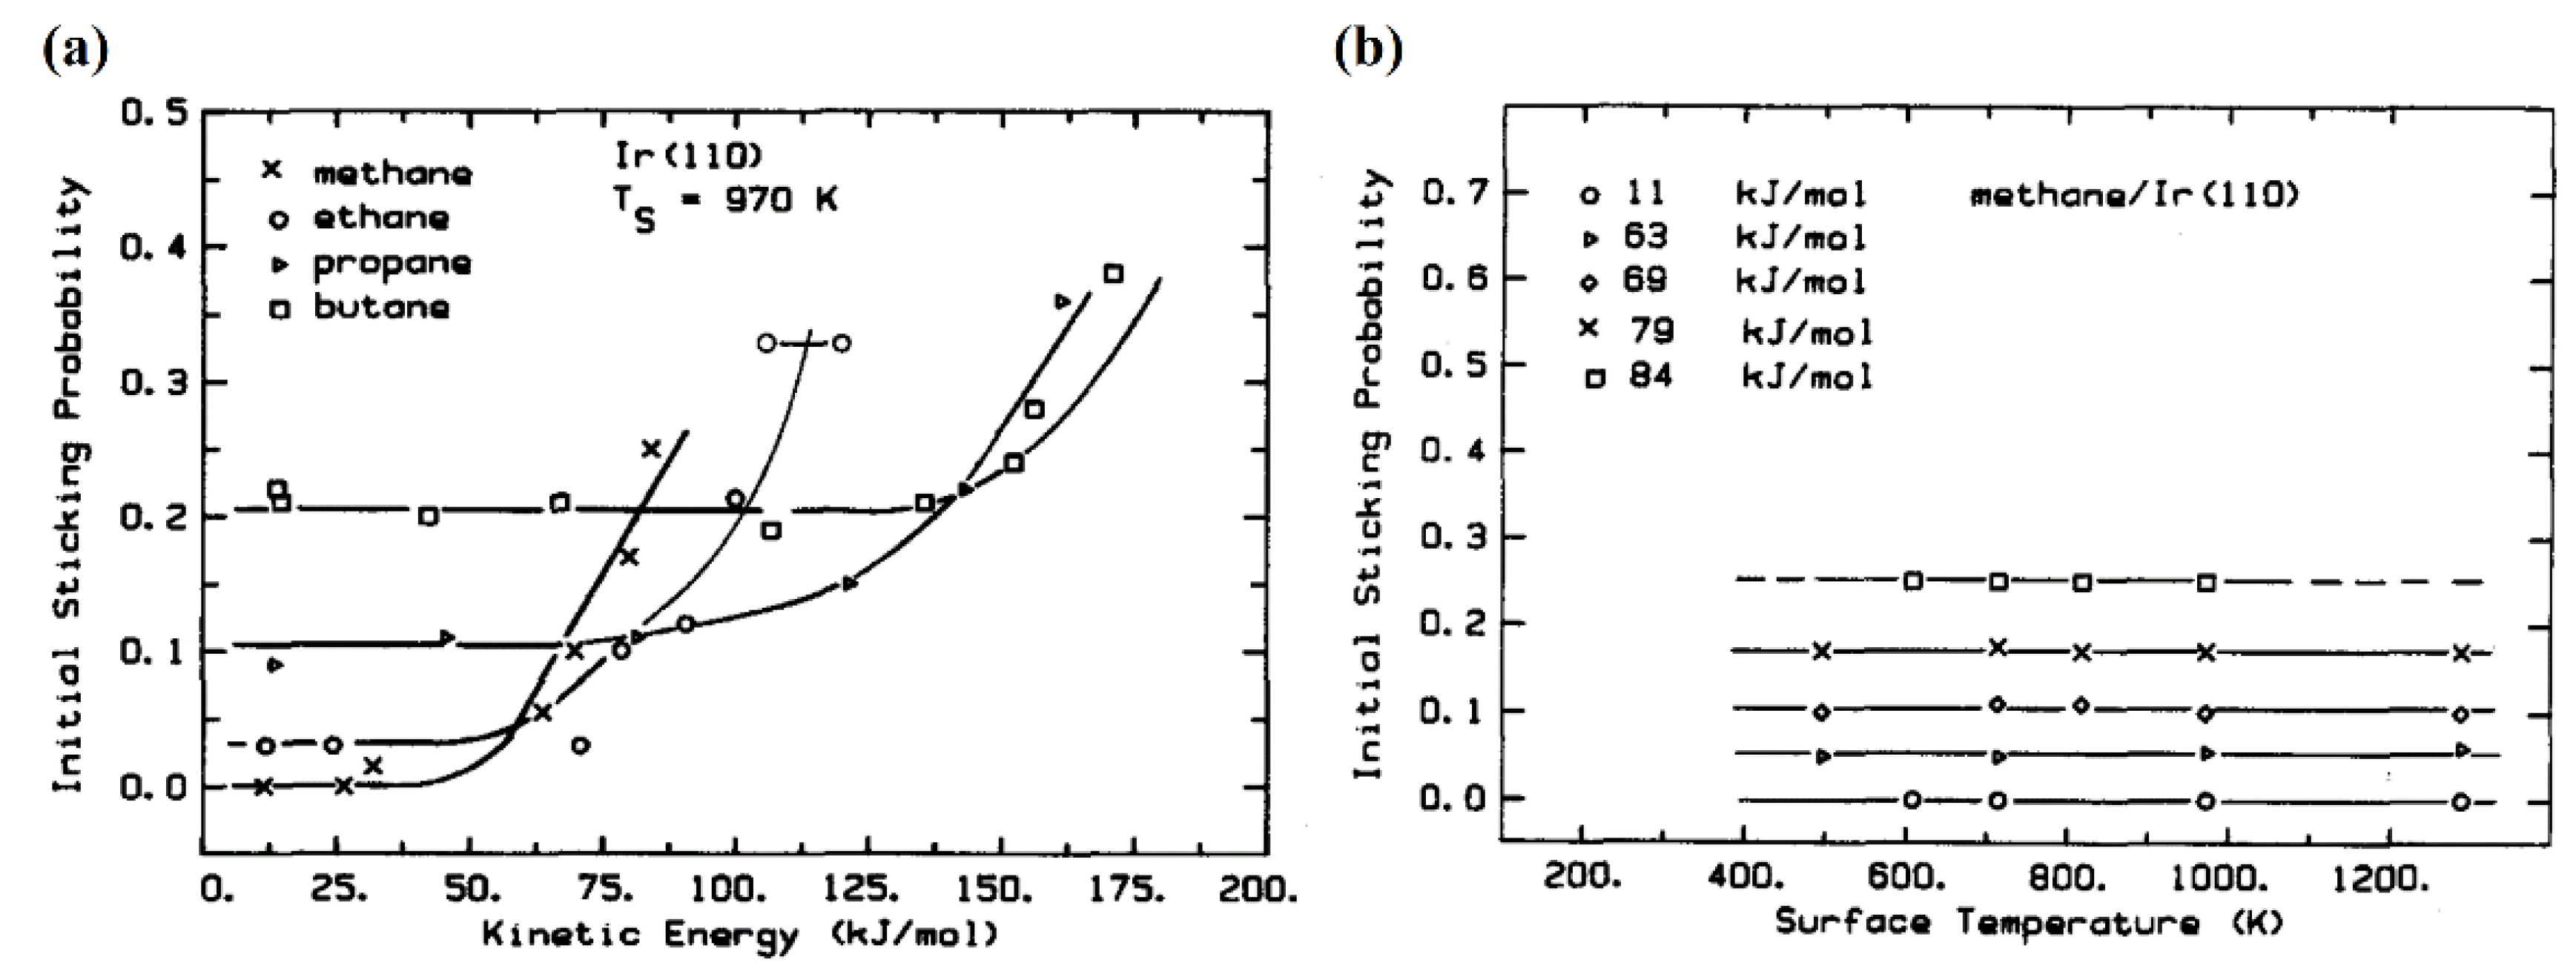
2.1. Dissociative Methane Adsorption

As shown in Figure 4, the dissociative adsorption mechanism suggests that the chemisorption of CH4 on the catalyst surface and the first C-H bond breakage occur simultaneously. By observing high-resolution electron energy loss spectroscopy (HREELS) results of methane cracking on Ni-based catalysts in Figure 5a, Lee et al. [21] indicated that the CH3 group was the primary intermediate in the CDM process. Two peaks at 370 and 1220 cm−1 represented the stretched Ni-CH3 group and the symmetrical deformed -CH3 groups, while the low peak at 2660 cm−1 included symmetric and asymmetric C-H bonds. Moreover, Fuhrmann et al. [22] conducted XPS analysis to investigate the dissociative adsorption of CH4 on the Pt (111) surface. Typical uptake experimental results in Figure 5b show two obvious peaks at the binding energies 282.45 and 282.85 eV. By vibrational spectroscopy, the adsorbate species have been identified as -CH3 group, which aligned with the previous opinion [23].
To further elucidate the reliability of this mechanism in practical experiments, Salam et al. [24] designed a DFT model for Ni/Al2O3 (001) catalyst to simulate the orderly dehydrogenation process in methane cracking. The energy band diagram in Figure 6 suggests the CDM reaction follows the dissociative adsorption mechanism since the energy required to break the first C-H bond is much less than the rest of the three bonds. This means the adsorption and cracking processes are able to be treated simultaneously.
The CDM process follows a dissociative adsorption mechanism [11]:
CH 4 + I Vacant   site CH 3 ad + H ad
CH 3 ad CH 2 ad + H ad
CH 2 ad CH ad + H ad
CH ad C ad + H ad
C ad C dissolved
2 H ad H 2 + 2 I
According to this mechanism, Zavarukhin and Kuvshinov [25] took the first H atom release as the rate-limiting step (Equation (7)) to derive a reaction kinetics model. They used the maximum carbon deposit rate (rcmax) to correlate the instantaneous reaction rate (rc) with the catalyst activity factor (a). Based on the CDM experiments involved in a flow vibro-fluidized bed reactor, the power exponent n in the rcmax formula was fitted (n = 2 for the best) and obtained the analytical solution of the catalyst activity factor a.
r c = r c m a x × a
in which
r c m a x = k P C H 4 P H 2 2 / K p 1 + k H P H 2 n     a = 1 cosh 2 r c m a x c m a x t
where PCH4 and PH2 are the species’ partial pressures. Kp and kH are the two main rate coefficients in the CDM reaction, which can be measured by experiments.
Their model reliability has been proven by good fitting of results between derived rate equations and the experimental methane cracking rate on 90% Ni/Al2O3 catalyst at 823 °C. Based on the results from the predecessors, Borghei et al. [26] refined the kinetics model by the Langmuir-Hinshelwood expression and proposed the rate equations for the above six steps, respectively. These sub-step rate equations are of second-order, which depends on time, temperature, and species pressure. Due to the equation constants being hard to measure in the experiments, the maximum methane conversion rate was derived with many assumptions and proved by the CDM experiments on Ni-Cu/MgO between 550–650 °C [27].

2.2. Non-Dissociative Methane Adsorption

Based on the enormous number of CDM experiments, the orderly dehydrogenation model is currently accepted, but methane adsorption at the initial stage is still controversial. The non-dissociative adsorption mechanism was first proposed by Grabke and is illustrated in Figure 7 [28,29]. Different from the previous mechanism, it is believed that methane adsorption and the breakage of the first C-H bond should be considered separately. In other words, the methane molecule is first attached to the active sites and then undergoes a series of dehydrogenation steps until the dissolved carbon and hydrogen are formed.
By considering the instability of alkanes on transitional metal catalysts, their dissociations usually proceed via a direct collisional activation. Exceptions existed for some noble metal-based catalysts, such as Pt and Ir. Adsorbed state methane molecules can be observed on these catalyst surfaces, which proves that CDM reaction based on these catalysts follow the non-dissociative adsorption mechanism [30]. This viewpoint was supported by Hamza et al. [31], who used low energy electron diffraction (LEED) and Auger electron spectroscopy (AES) optics to show the dissociative adsorption probability for C1-C4 alkanes on Ir(110) surface (Figure 8a). According to probability curves, only part of methane molecules was initially cracked (≤25%), while the rest were temporary in the adsorbed state. The probability was increased with the translation energy carried by the methane flows. Figure 8b describes the relationship between the probability of methane dissociative adsorption on the Ir(110) surface and temperatures. The results prove that the surface temperature was independent on the reaction mechanism, and it is more likely a threshold value to determine if the CDM reaction would take place [32].
When verifying this mechanism in the CDM process, Broclawik et al. [33] built a DFT model of methane cracked on a special noble metal Pd dimer catalyst (Pd2). In the molecular structure diagram in Figure 9, the methane molecule is weakly adsorbed between two Pd metal atoms in bridging form. Based on the simulation results, one of the C-H bonds was stretched but did not break. The regular C-H bond length is about 1.13 Å, and would increase to 1.23 Å after stretching. Meanwhile, the scission of the stretched C-H bond costs only 3 kcal/mol, which also explains the instability of the adsorbed state methane on the catalyst surface.
The CDM process follows the non-dissociative adsorption mechanism [11]:
CH 4 + I Vacant   site CH 4 ad
CH 4 ad CH 3 ad + H ad
CH 3 ad CH 2 ad + H ad
CH 2 ad CH ad + H ad
CH ad C ad + H ad
C ad C dissolved
2 H ad H 2 + 2 I
Except for the additional adsorption step, the remaining steps are consistent with the dissociative adsorption mechanism. However, their differences mainly reflect the boundary conditions given by the rate-limiting step chosen to derive the reaction kinetics model. For instance, Snoeck et al. [34] considered the first H atom released as the decisive step Equation (15) to derive a detailed reaction kinetics model. Since the stepwise reaction rate is hard to measure, the global cracking rate Equation (21) was simplified based on ignoring the H-I, CH-I, and CH2-I groups’ surface concentration and assuming all the Ni-based catalyst particles have the same diameter [34].
r c r a c k i n g = k M + × K C H 4 × P C H 4 k M K r × K C × c C N i , f × P H 2 2 1 + K c × c C N i , f + 1 K r × K C × c C N i , f × P H 2 3 2 + K C H 4 × P C H 4 2
where KCH4, kM, and Kc are the rate constants of the methane adsorption, first H atom release, and carbon segregation steps. PCH4 and PH2 are the species’ partial pressures. CcNi,f represents the maximum solubility of C in the catalyst metal phase Ni.
Their kinetics model also covered the carbon filament formation steps and was demonstrated by the CDM experiments on commercial Ni-based catalysts between 500–550 °C. Moreover, Demicheli et al. [35] used the methane adsorption step (Equation (14) as the rate-limiting step and developed a rate equation to predict carbon deposition through a separable kinetics technique. Two dependent variables were introduced into the model, the rate of carbon deactivation and catalyst activity factor, to illustrate that the methane conversion rate was reduced due to active sites being blocked by carbons. Their results fitted well with experiments of methane cracking on Ni/Al2O3-CaO samples in the 565–665 °C temperature range.

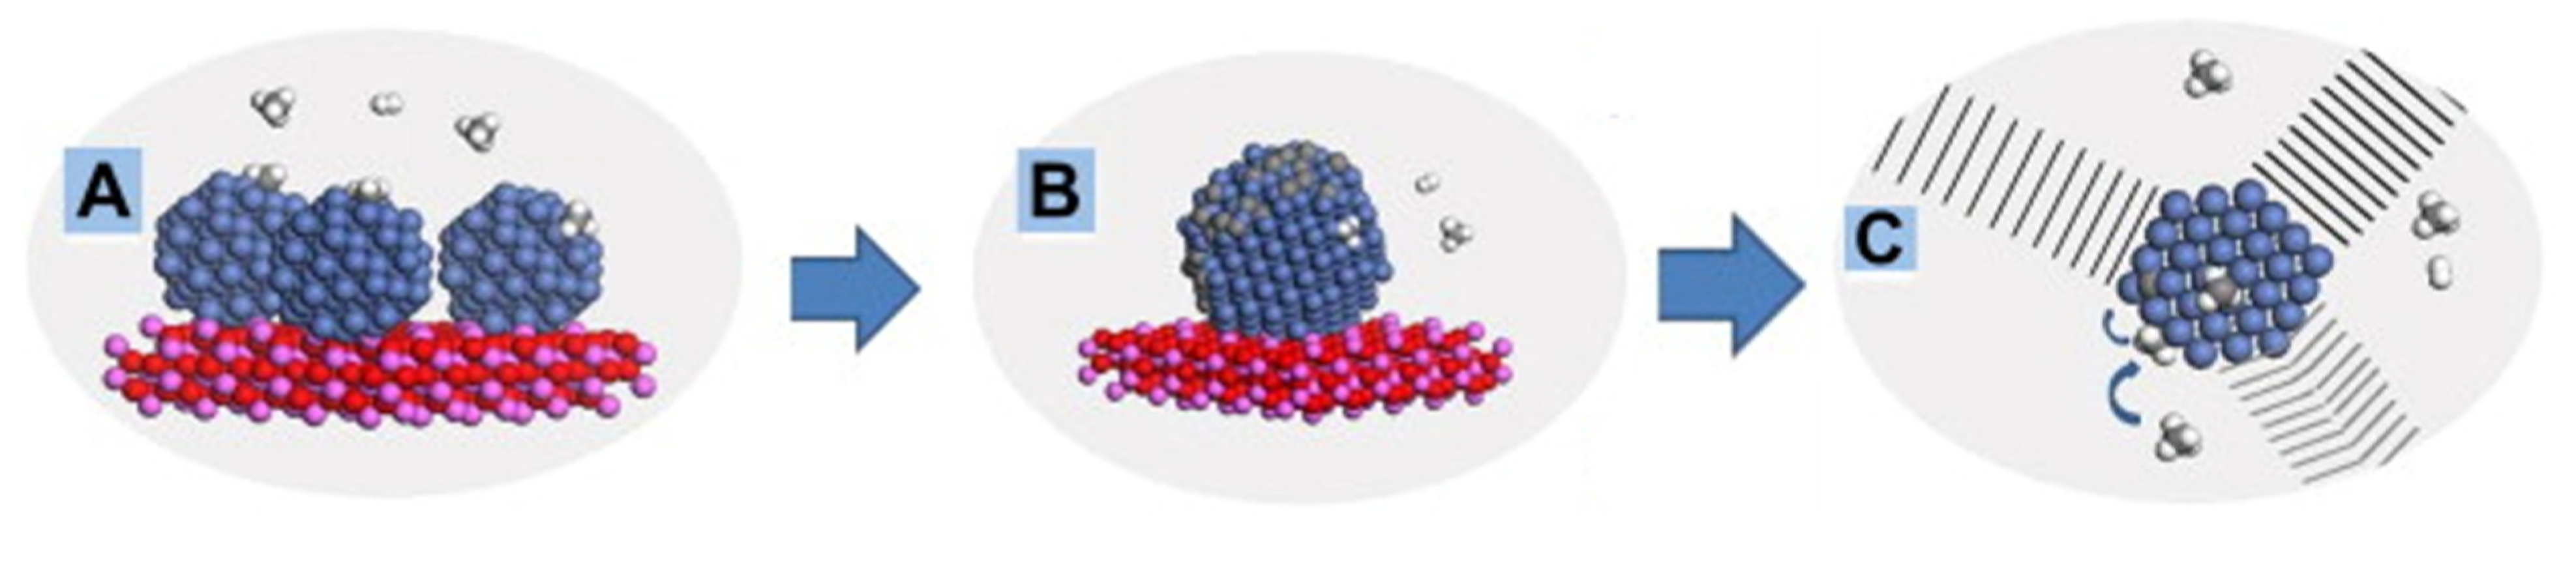
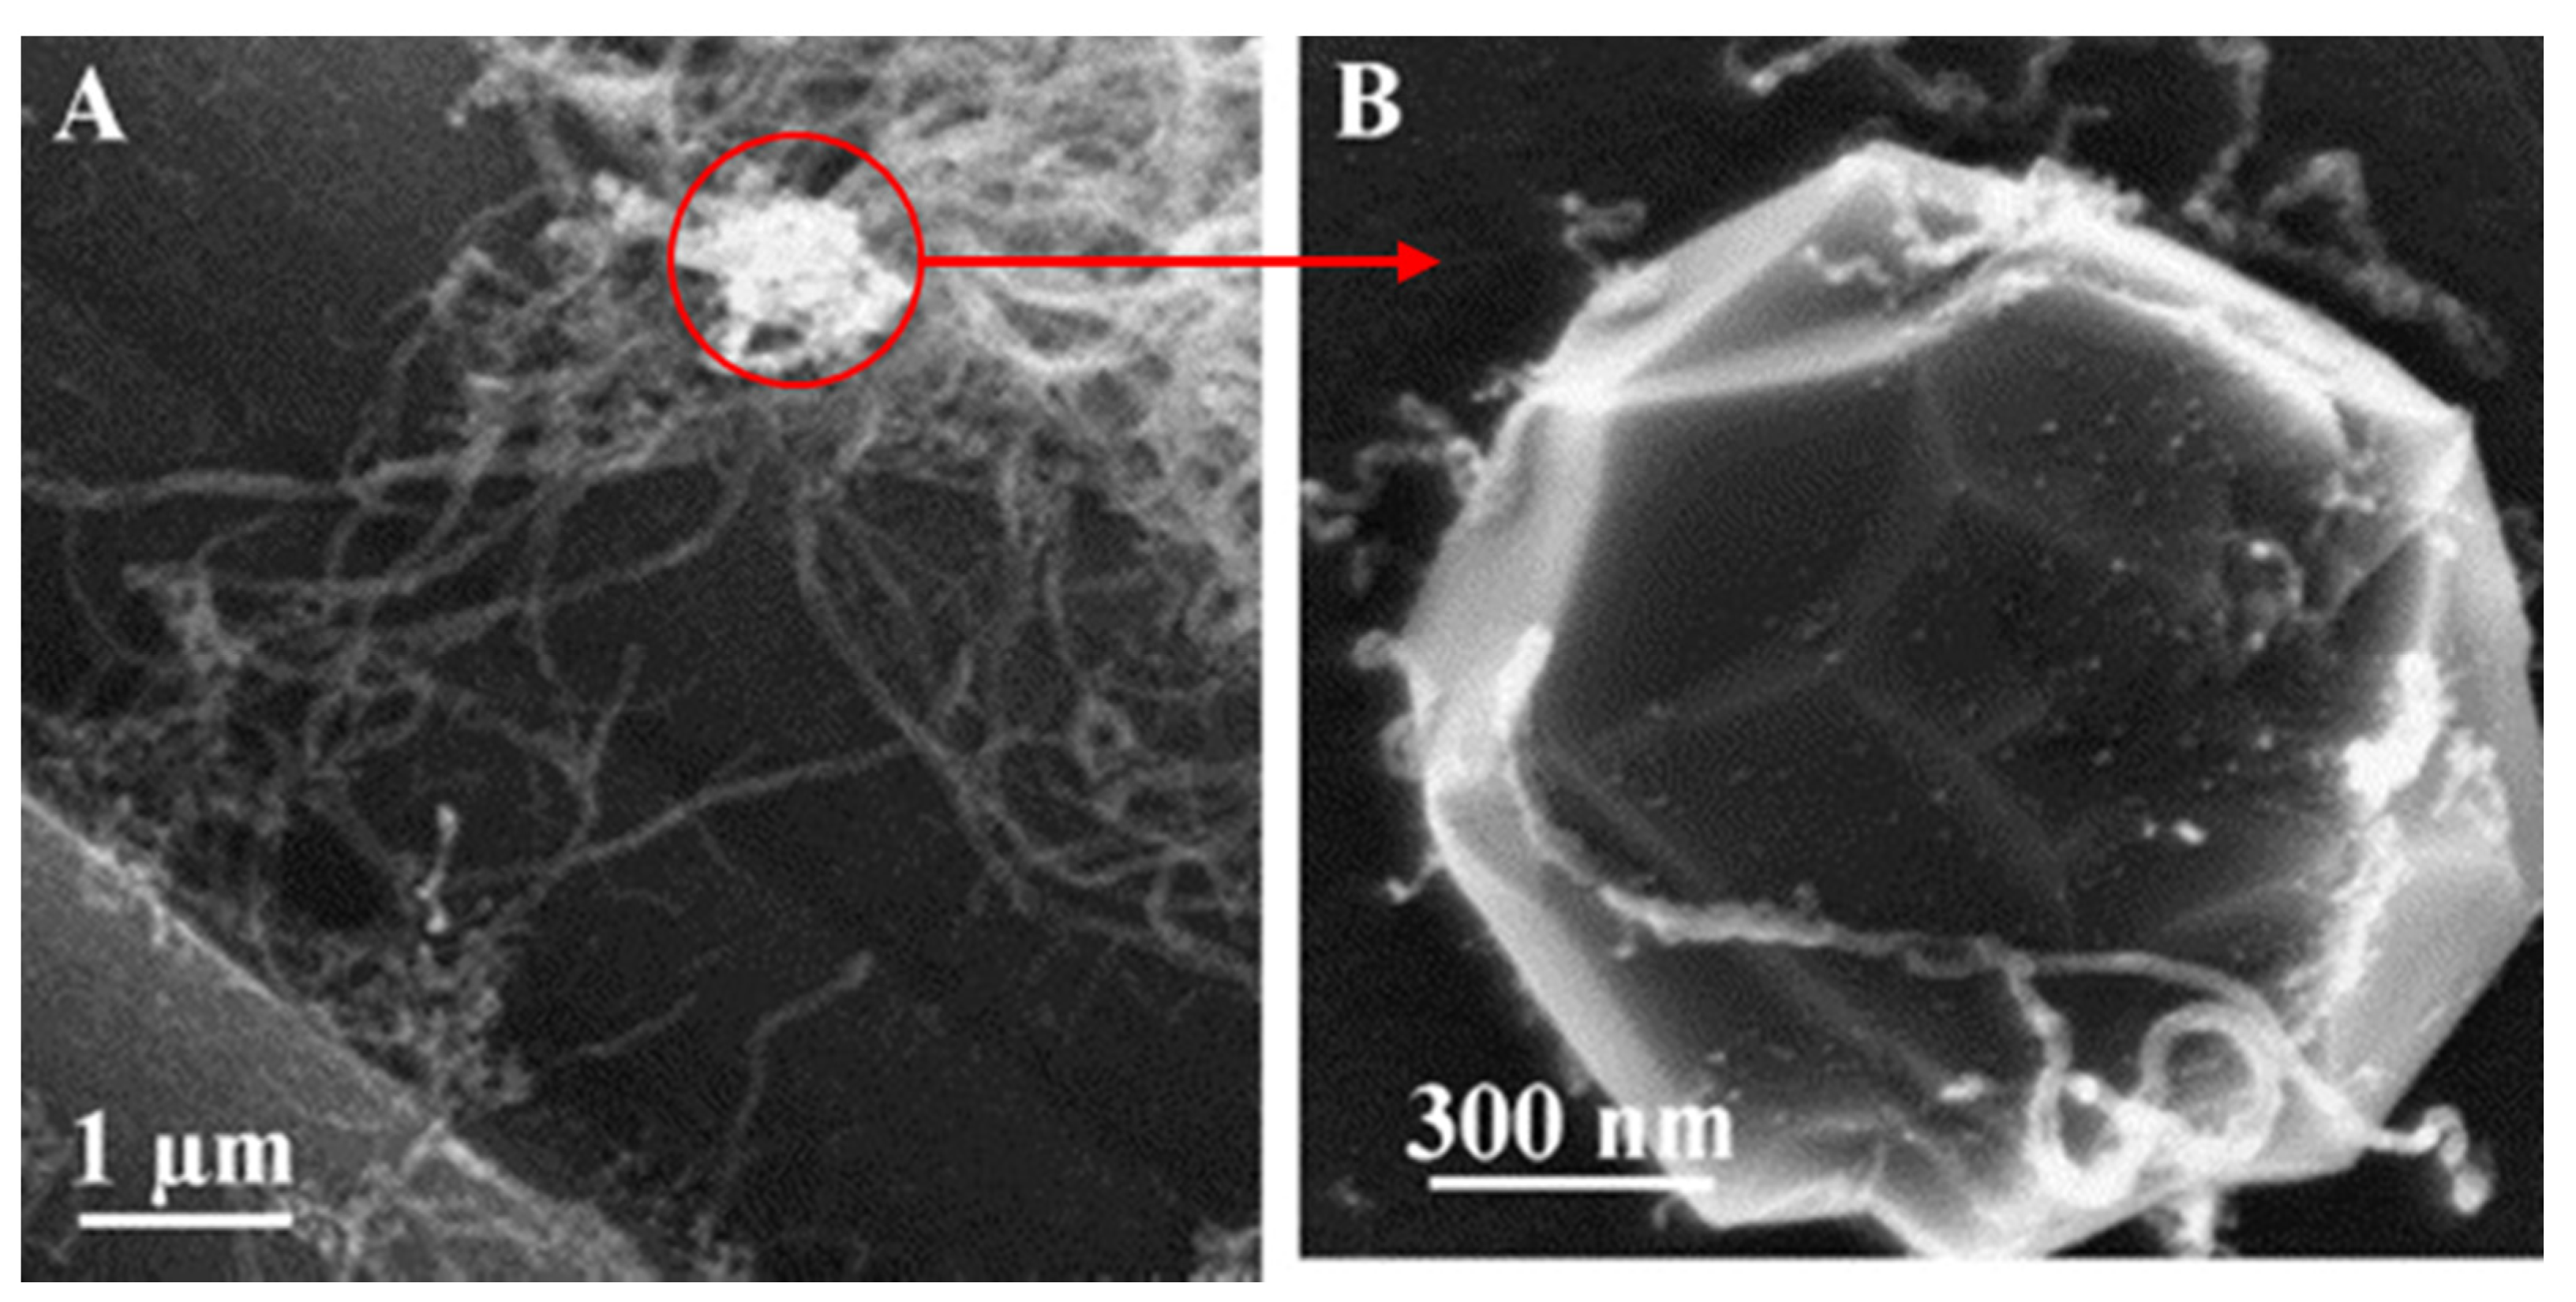
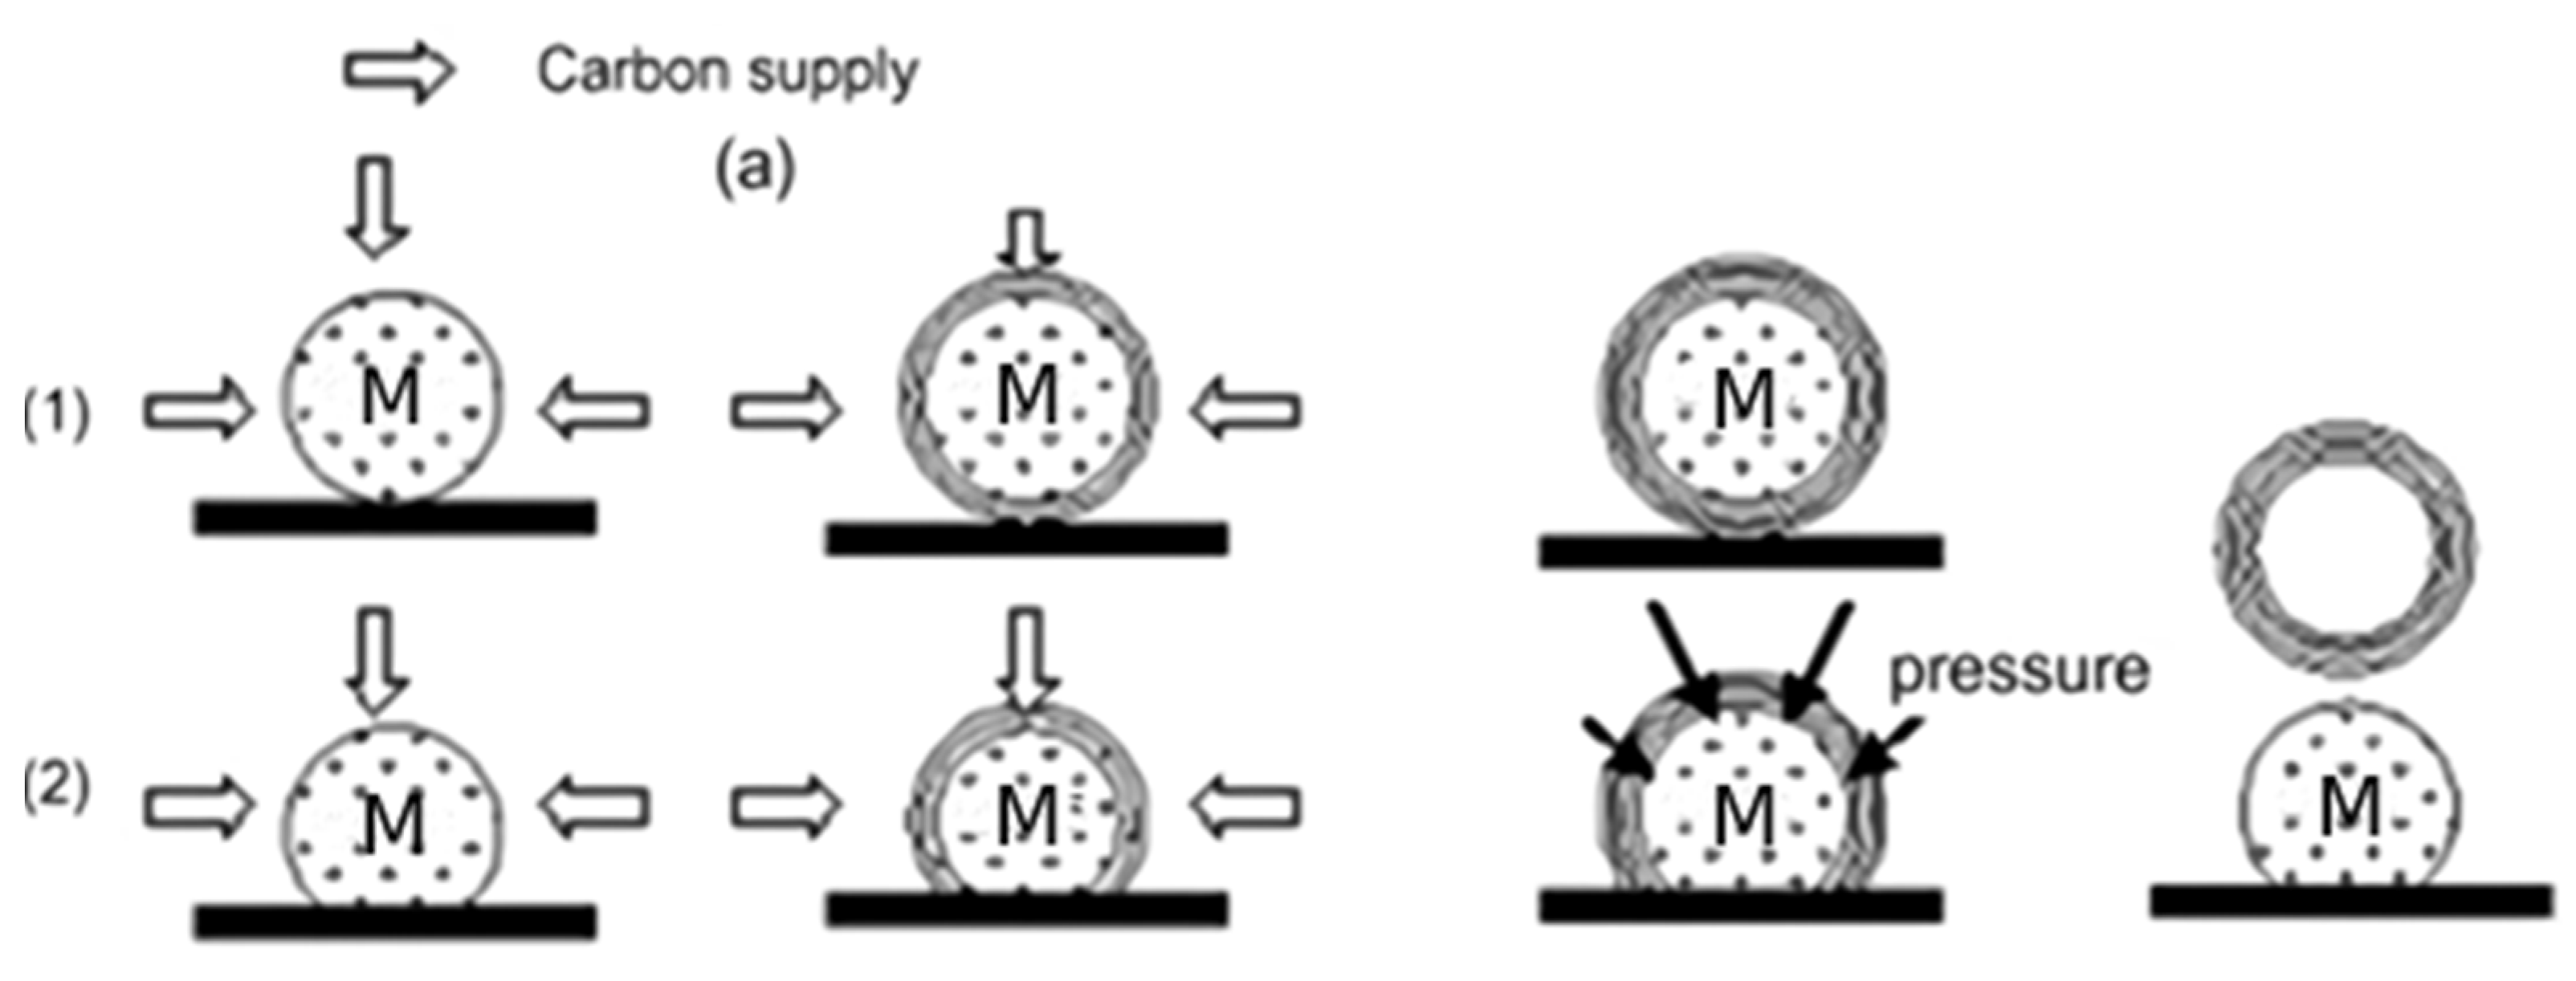
3. Carbon Formation Mechanism

Following the dehydrogenation mechanism mentioned above, after the four C-H bonds break successively, carbon nuclei precipitate from the supersaturated metal particles and become the initial growth point of carbon filament. Microscopically, carbon filaments are composed of stacked graphite layers, and the way they grow is determined by the interaction force between the metal and support phases. In this section, the “tip” and “base” growth mechanisms are discussed in detail separately with their corresponding experimental results.

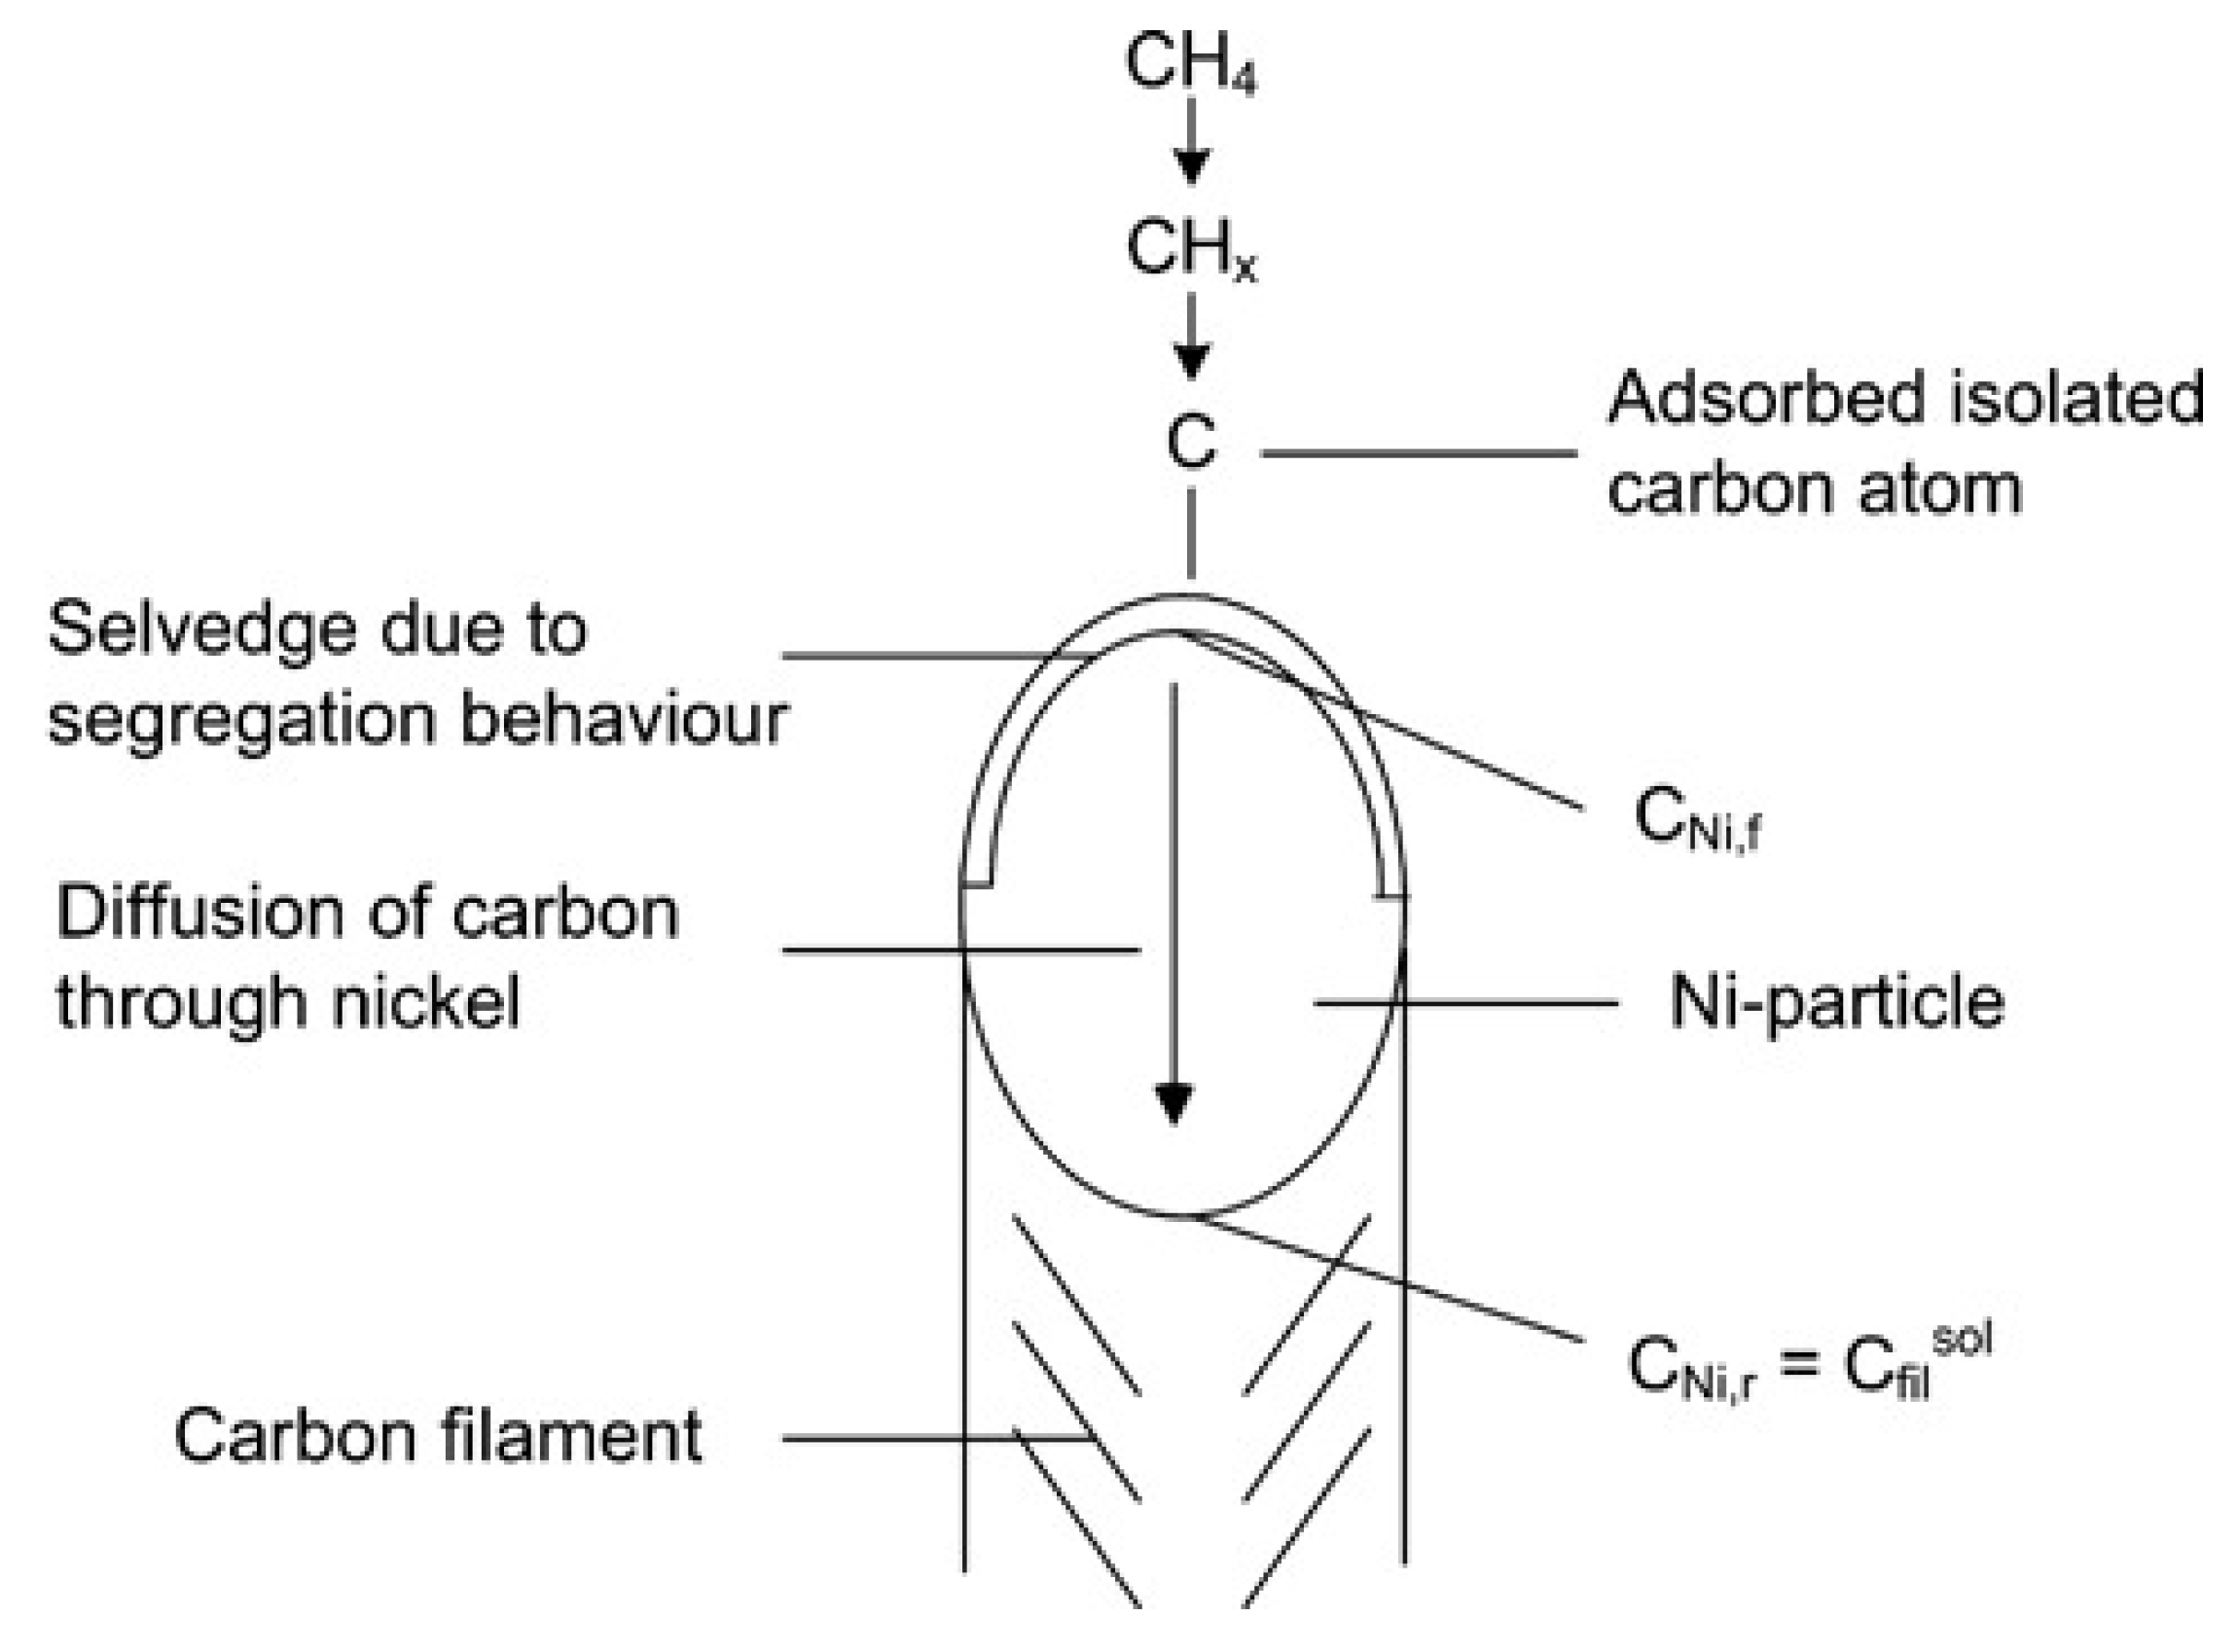
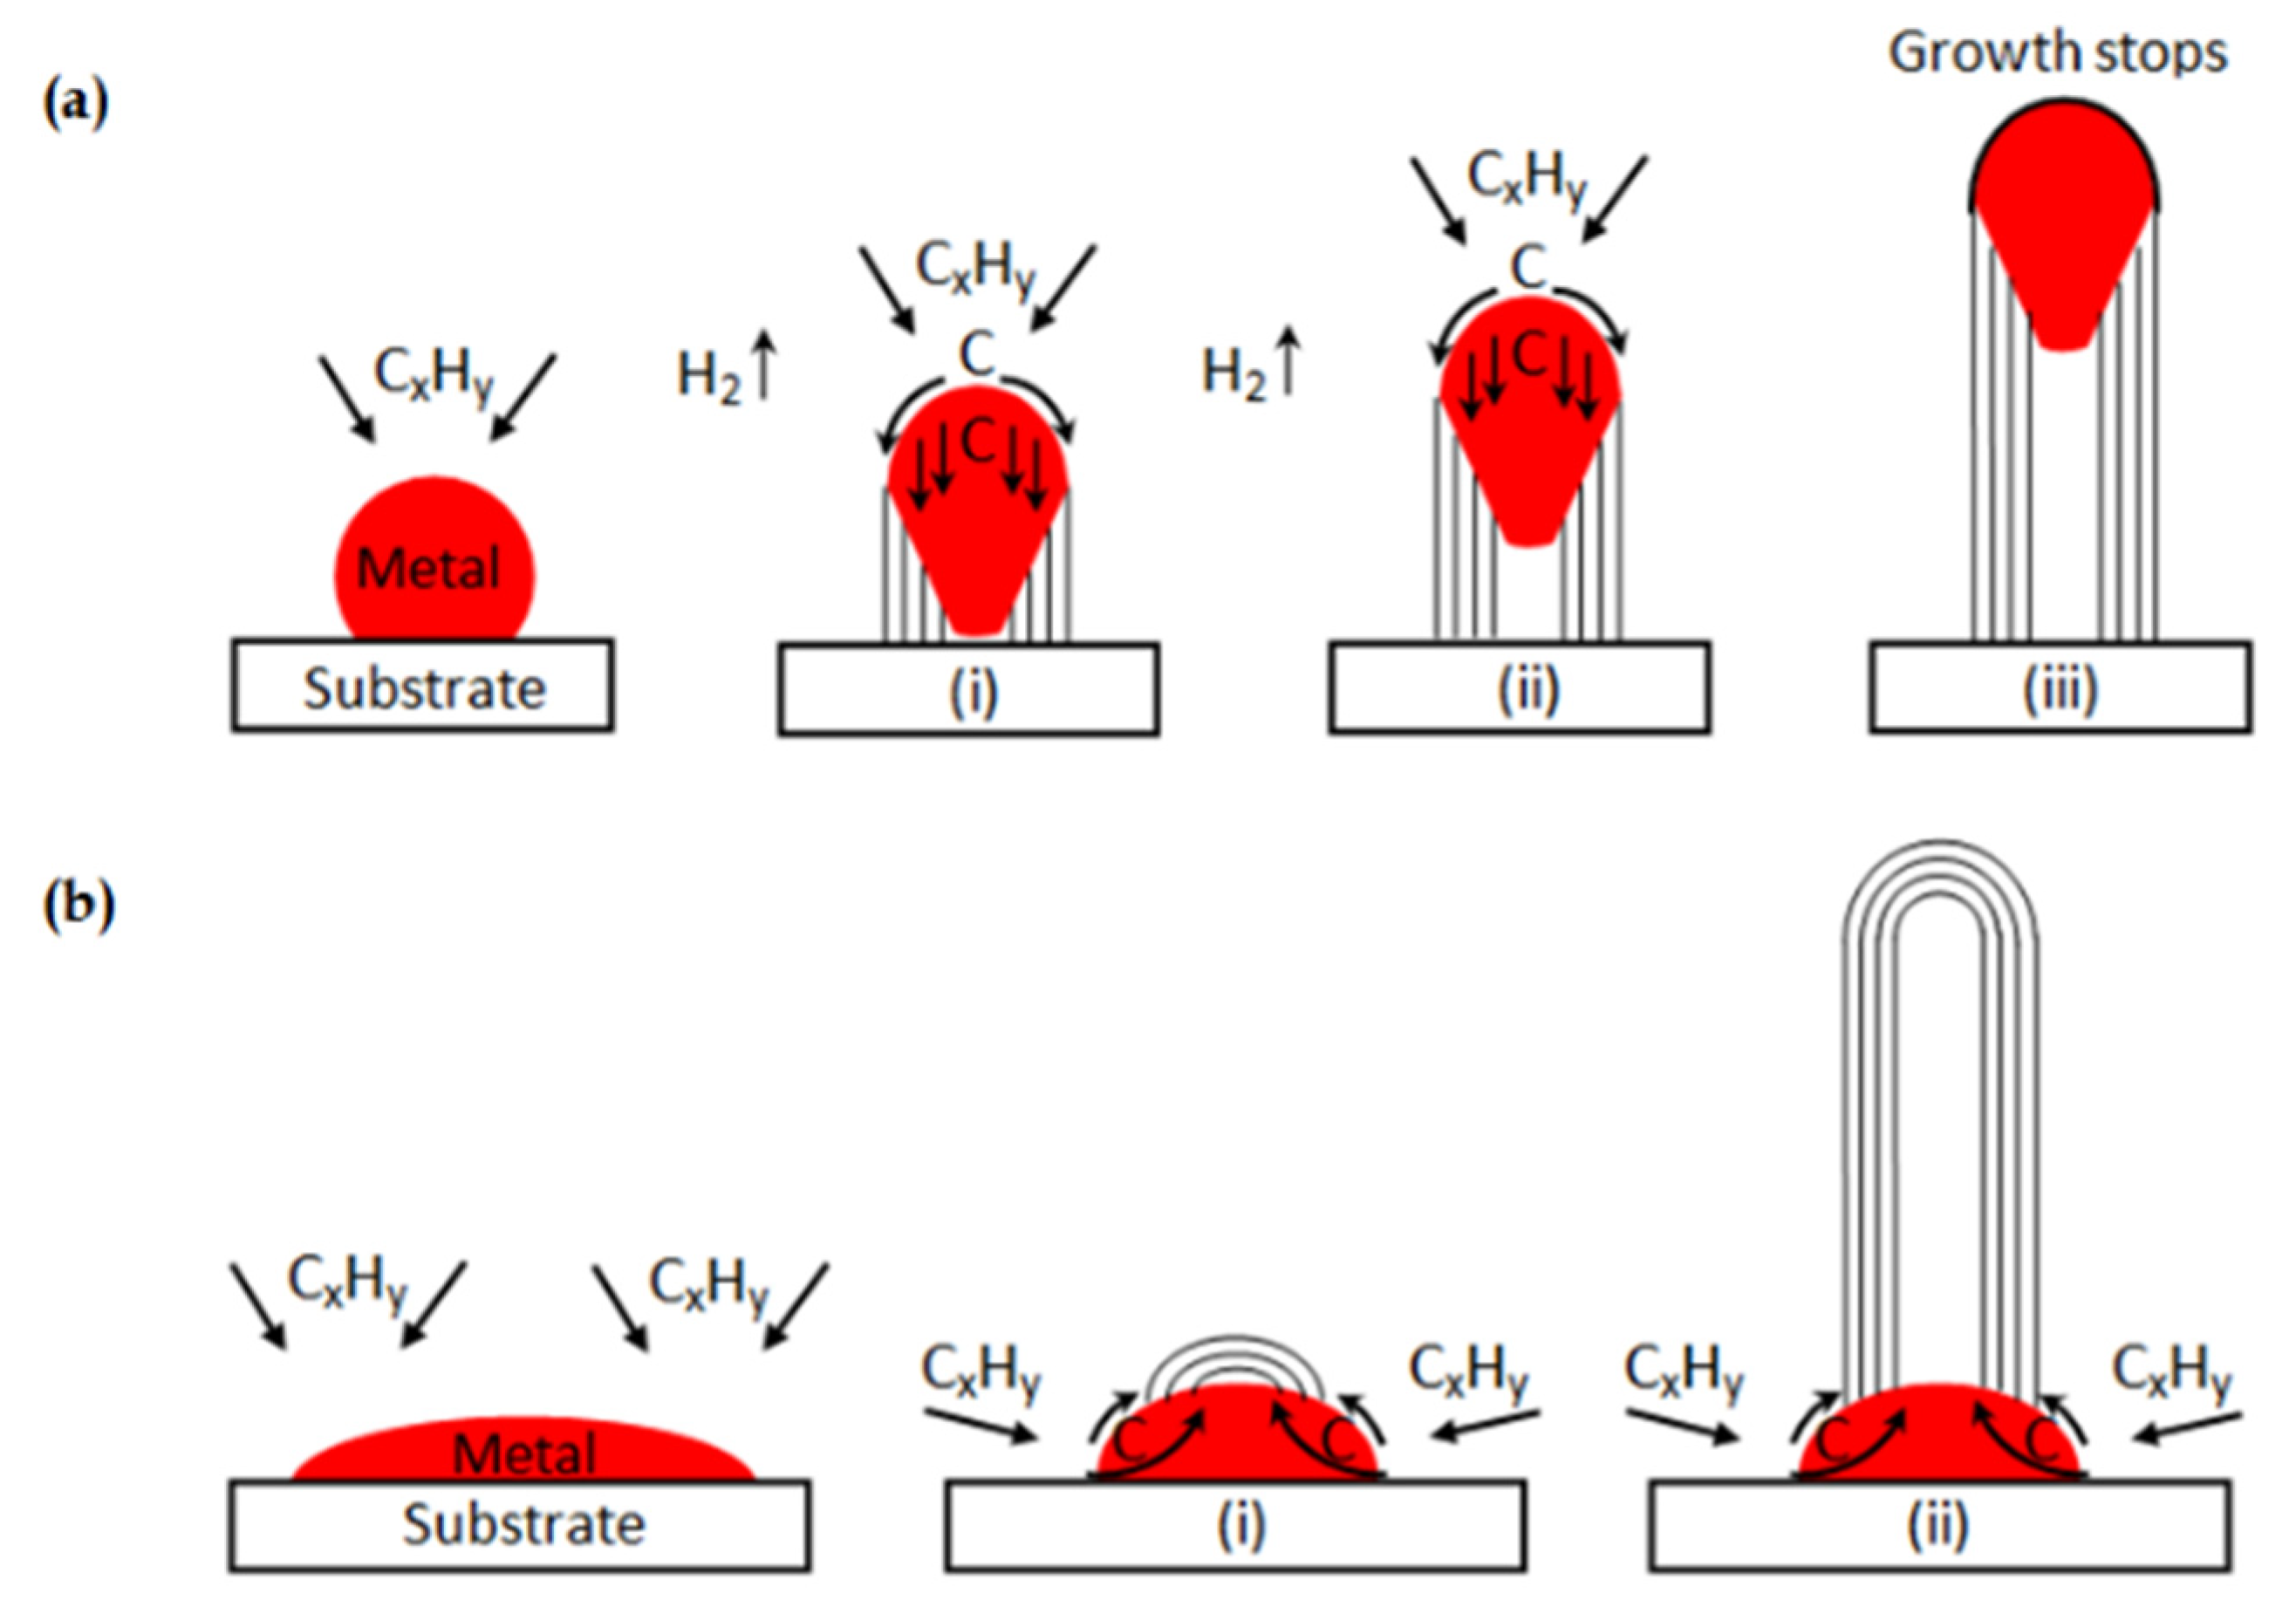
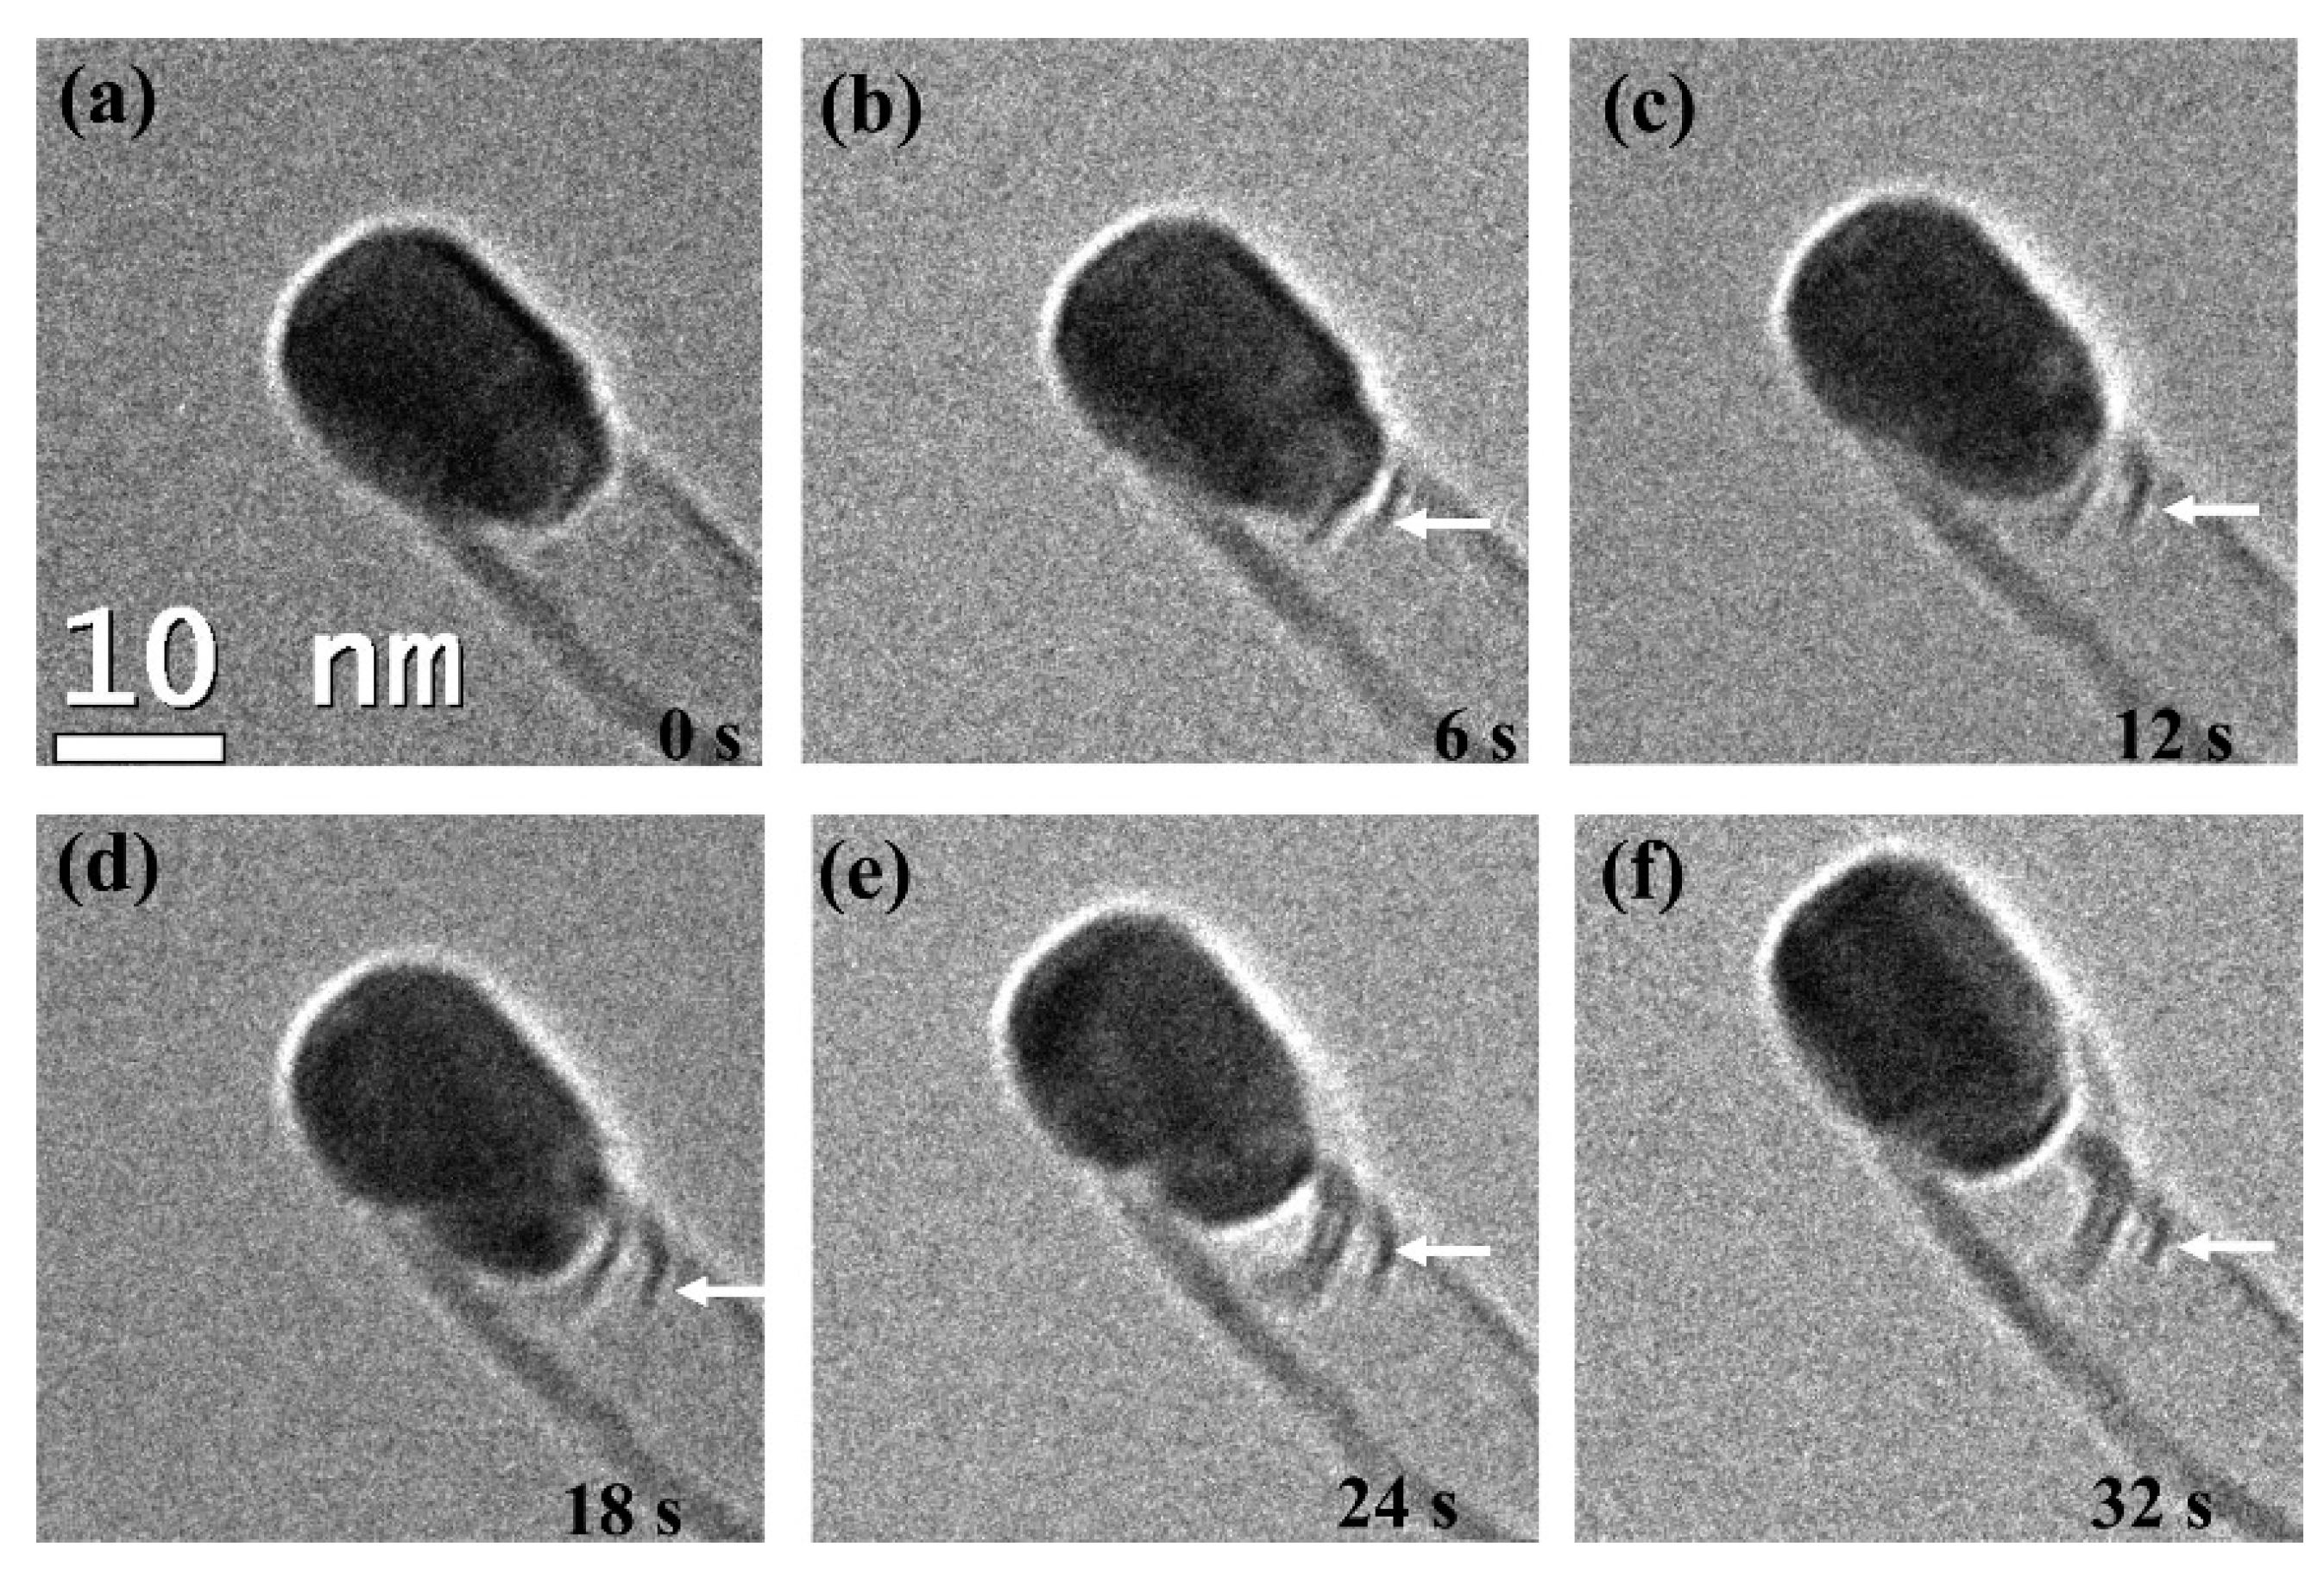
3.1. “Tip Growth” Mechanism

Carbon filaments following the “tip-growth” mechanism are the most common type of carbon deposition observed in the catalytic decomposition of methane (CDM) process, first defined by Reshetenko and his workmates [36]. According to their opinions, the “tip-growth” mechanism referred to one carbon filament growing from one catalyst particle, while the latter is always located at the top of the filament. Take the Ni-based catalyst in Figure 10 as an example in which the carbon filament grows from the carbon core on the metal-support side. With the continuous stacking of graphite layers, the Ni particle is separated from the support and remains at the tip of the carbon wire to ensure continuous contact with methane. The following section discusses experimental results on Ni, Co, and Fe-based catalysts that conform to this growth mechanism and summarizes the influencing factors for the carbon filament growth.
Zhang et al. and Shen et al. [37,38] captured carbon filament images on the deactivated Ni-based catalysts by SEM/TEM and proved their catalyst samples followed the “tip-growth” mechanism. Bright spots at the tip of these cross-growing carbon filaments were deactivated Ni metal particles due to carbon encapsulation, proved by EDS element identification (Figure 11a). Takenaka et al. [39,40] observed similar bright metal tips in carbon filaments from CDM experiments using Co and Fe-based catalysts (Figure 11b). They pointed out that the “tip-growth” mechanism would extend the catalyst lifetime and increase the hydrogen yield of fresh samples, but catalysts would lose their activity after the regeneration cycle. Although metal particles fell back to the supporting phase after the carbon removal process, it still led to irreversible damage to the catalyst structure.
Catalysts used for methane cracking usually consist of active metals and support materials. The active metal phase has more intuitive effects on the outcome because its type and loading ratio determines the number of active sites available. From CDM experiments conducted at 550 °C and atmospheric pressure, Avdeeva et al. [43] observed carbon filaments with Ni metal particles at the tip from highly loaded Ni/Al2O3 catalysts by TEM. Among them, the 90% Ni/Al2O3 sample obtained the highest carbon yield, equal to 145 gC/gNi. Therefore, they believed catalysts with a higher metal ratio provided more active sites in the reaction, which had better performance. However, the supporting phase is indispensable because the pure Ni particles without supports were quickly encapsulated by carbons and deactivated. Reshetenko and his co-workers also support these results [36,44]. With the same catalyst and operation conditions, they produced 111.1 gC/gNi carbon filaments that followed the “tip-growth” mechanism. As for Ni/Al2O3 with a low metal proportion, Li et al. [45] found that the surface particle distribution and activity can be improved by changing the preparation method. Based on the experimental results, the 12% Ni/Al2O3 sample produced 132 gC/gNi carbon depositions at 500 °C in the fixed bed reactor.
Except for different metal-loaded ratios, the supporting materials also affect the carbon filament growth through interphase interaction. Some experimental results revealed that Al2O3 is not the most suitable supporting material for Ni-based catalysts because the NiAl2O4 compound may form at high temperatures. This solid solution is difficult to reduce by hydrogen and limits the number of active sites. By comparing the cracking performance of 12% Ni loaded on Al2O3 and SiO2, Li et al. [45] pointed out that samples with SiO2 support obtained higher carbon and hydrogen yield under the same operating conditions. When the metal proportions were reduced to 5%, defects from solid solutions became more obvious. Correspondingly, Ermakova et al. [46] extracted 340 gC/gNi carbons from a 90% Ni/SiO2 catalyst sample in methane cracking experiments operated between 300–700 °C. Compared with Al2O3, SiO2 supports can bring better stability to the catalyst, which extends the lifetime of samples nearly three times under the same conditions. After realizing the good compatibility of Ni and SiO2, researchers represented by Takenaka [47,48] prepared Ni/SiO2 catalysts with different loading ratios to find the sample with the best catalytic activity. At 500 °C and a 60 mL/min pure methane flow rate, a 40% Ni/SiO2 catalyst showed the highest carbon yield (491 gC/gNi) and the longest lifetime (~70 h), which became the record at that time.
The CDM experiments on Co-based and Fe-based catalysts also produce carbon filaments conformed to the “tip-growth” mechanism. Avdeeva et al. [49] prepared 50–75 wt.% Co/Al2O3 samples and tested their catalytic activities between 475–600 °C. The optimal sample (75% Co-loaded) remained active for 15 h at 500 °C and produced 63 gC/gCo hollow carbon filaments. Although its yield was lower than Ni-based catalysts, more CNTs were observed in carbon by-products. These results are mostly consistent with Takenaka’s group [40]. They reported the performance of low-loaded Co catalysts in the CDM process between 500–800 °C and found the best sample produced 56.04 gC/gCo hollow carbon filaments. As for the supporting material in Co-based catalysts, Ashik and Daud [50] believed Al2O3 may be the most suitable. Under the same operating conditions, Co/SiO2 and Co/MgO samples had evident agglomeration issues. From the TEM images, most of the particles were tens of times larger than expected, which significantly reduced the specific surface area and caused samples rapidly deactivated.
Due to the special reaction mechanism, Fe-based catalysts show methane cracking after the temperature exceeds the activation threshold. Zhou et al. [51] first tested the performance of high-loaded Fe/Al2O3 catalysts in the CDM process and found the best sample showed a stable conversion rate in 10 h. On this basis, Anis et al. [42] reported the catalytic activity of the 20% Fe/Al2O3 sample at 800 °C. Within the first two hours of cracking it maintained the methane conversion rate between 80–85%. However, excessive carbon depositions plugged the reactor and led to a high backup pressure, which stopped the reaction. The choice of supporting materials of Fe-based catalysts was mentioned by Ermakova et al. [52] under the same loading ratio and reaction conditions. Their results proved that the adaptability of ZrO2, Al2O3, and TiO2 with Fe was not as good as SiO2. After optimization, the best Fe/SiO2 sample produced about 45 gC/gFe, which was mainly composed of thin-wall carbon nanotubes.

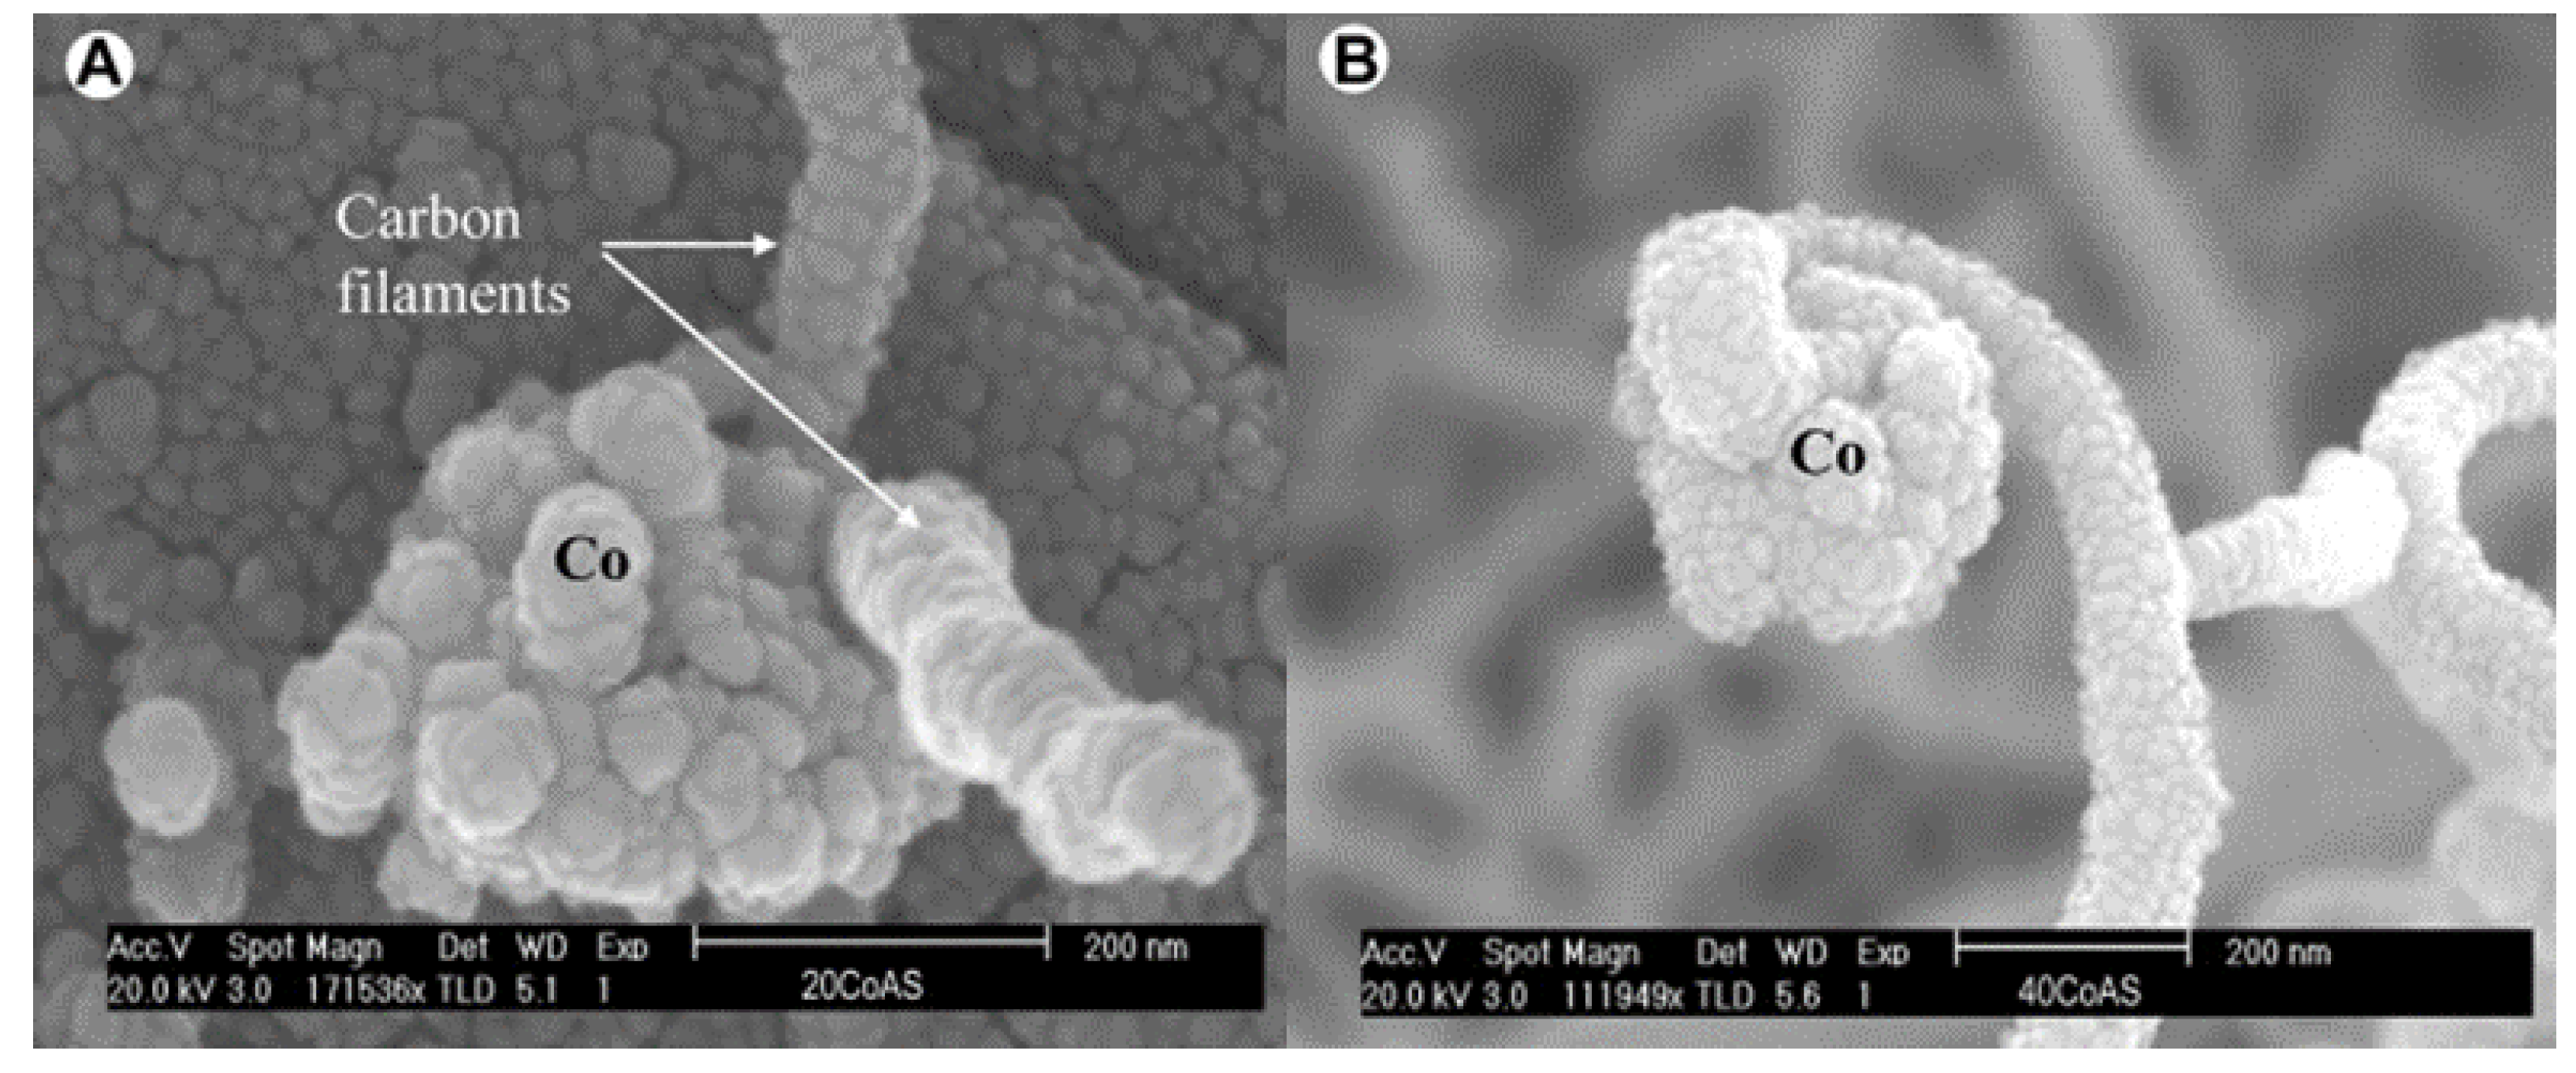
3.2. “Base Growth” Mechanism

Although most catalysts conform to the tip growth mechanism during the catalytic decomposition of methane (CDM) reaction, there are still some exceptions. When the interaction between phases is strong enough, the graphite layers stacking on the metal-support side fail to push the metal particle up. In this situation, the “base growth” mechanism shown in Figure 12b occurs, and carbon filaments are forced to grow from the metal-gas side [53]. Nevertheless, this mechanism results in the active sites on the surface quickly becoming covered by carbon deposits, thus reducing the effective lifetime of catalysts.
Most catalysts that follow the “base growth” mechanism are Co-based and produce hollow/solid seamless graphite cylinder carbon filaments. Frusteri et al. [54] verified this mechanism by methane cracking experiments on Co/Al2O3 samples with different loading ratios at 650 °C. Based on the carbon filament structure captured by SEM, they found that the growth mechanism on Co-based catalysts was closely related to the metal proportion. As shown in Figure 13a, carbon filaments on low-loaded Co samples (≤20%) were extended from the metal-gas side in multiple directions. By contrast, for high-loaded Co samples (≥40%), the growth of carbon filaments obeyed the “tip-growth” mechanism, as shown in Figure 13b. G.I.Talinao et al. [55] further revealed the fundamental reasons for the growth mechanism change. After temperature-programmed reduction (TPR) analysis, a large amount of Co3O4 was detected on the high-loaded Co-based catalysts. This caused low metallic dispersion and weak phase interactions. On the samples with low Co loading, the content of Co3O4 was reduced, and more metallic cobalt particles were formed, which produced better dispersion of the active metal phase and stronger interactions [56].
Takenaka et al. [40] prepared 20% Co/Al2O3 samples by the impregnation method and captured the carbon filaments that followed the “base growth” mechanism in CDM reactions operated between 600–800 °C. They further designed comparative experiments to summarize the pros and cons of two carbon filament growth mechanisms. The activity of fresh and regenerated Co-based samples was compared with 20% Ni/Al2O3 catalysts prepared under the same conditions. Fresh sample results showed that the Ni-based sample with the “tip-growth” mechanism had several times more hydrogen than Co-based catalysts with a prolonged lifespan. However, after several air oxidative regeneration cycles, the Ni-based catalyst activity decreased significantly with the number of regenerations cycles. This was due to the destruction of the catalyst structure brought by the carbon oxidation and elimination process. Co-based samples that conform to the “base growth” mechanism avoided this problem since the carbon deposits were easily removed without damaged catalyst structures. Therefore, the “base growth” mechanism is more suitable for the large-scale CDM process, which allows catalysts to maintain a stable methane conversion rate through multiple regeneration cycles to achieve continued hydrogen generation [55].

4. Special Carbon Depositions in CDM Reaction

Except for the above two classical carbon filament growth mechanisms, the CDM process can also produce special carbon deposition structures, namely, bamboo-shaped, octopus-shaped, and onion-like carbons. Each of them has a unique formation mechanism that usually requires matching the specific reaction temperature range and the catalyst modifications. In the following section, the above-mentioned carbon structures are reviewed and their properties are analyzed with experimental data support.

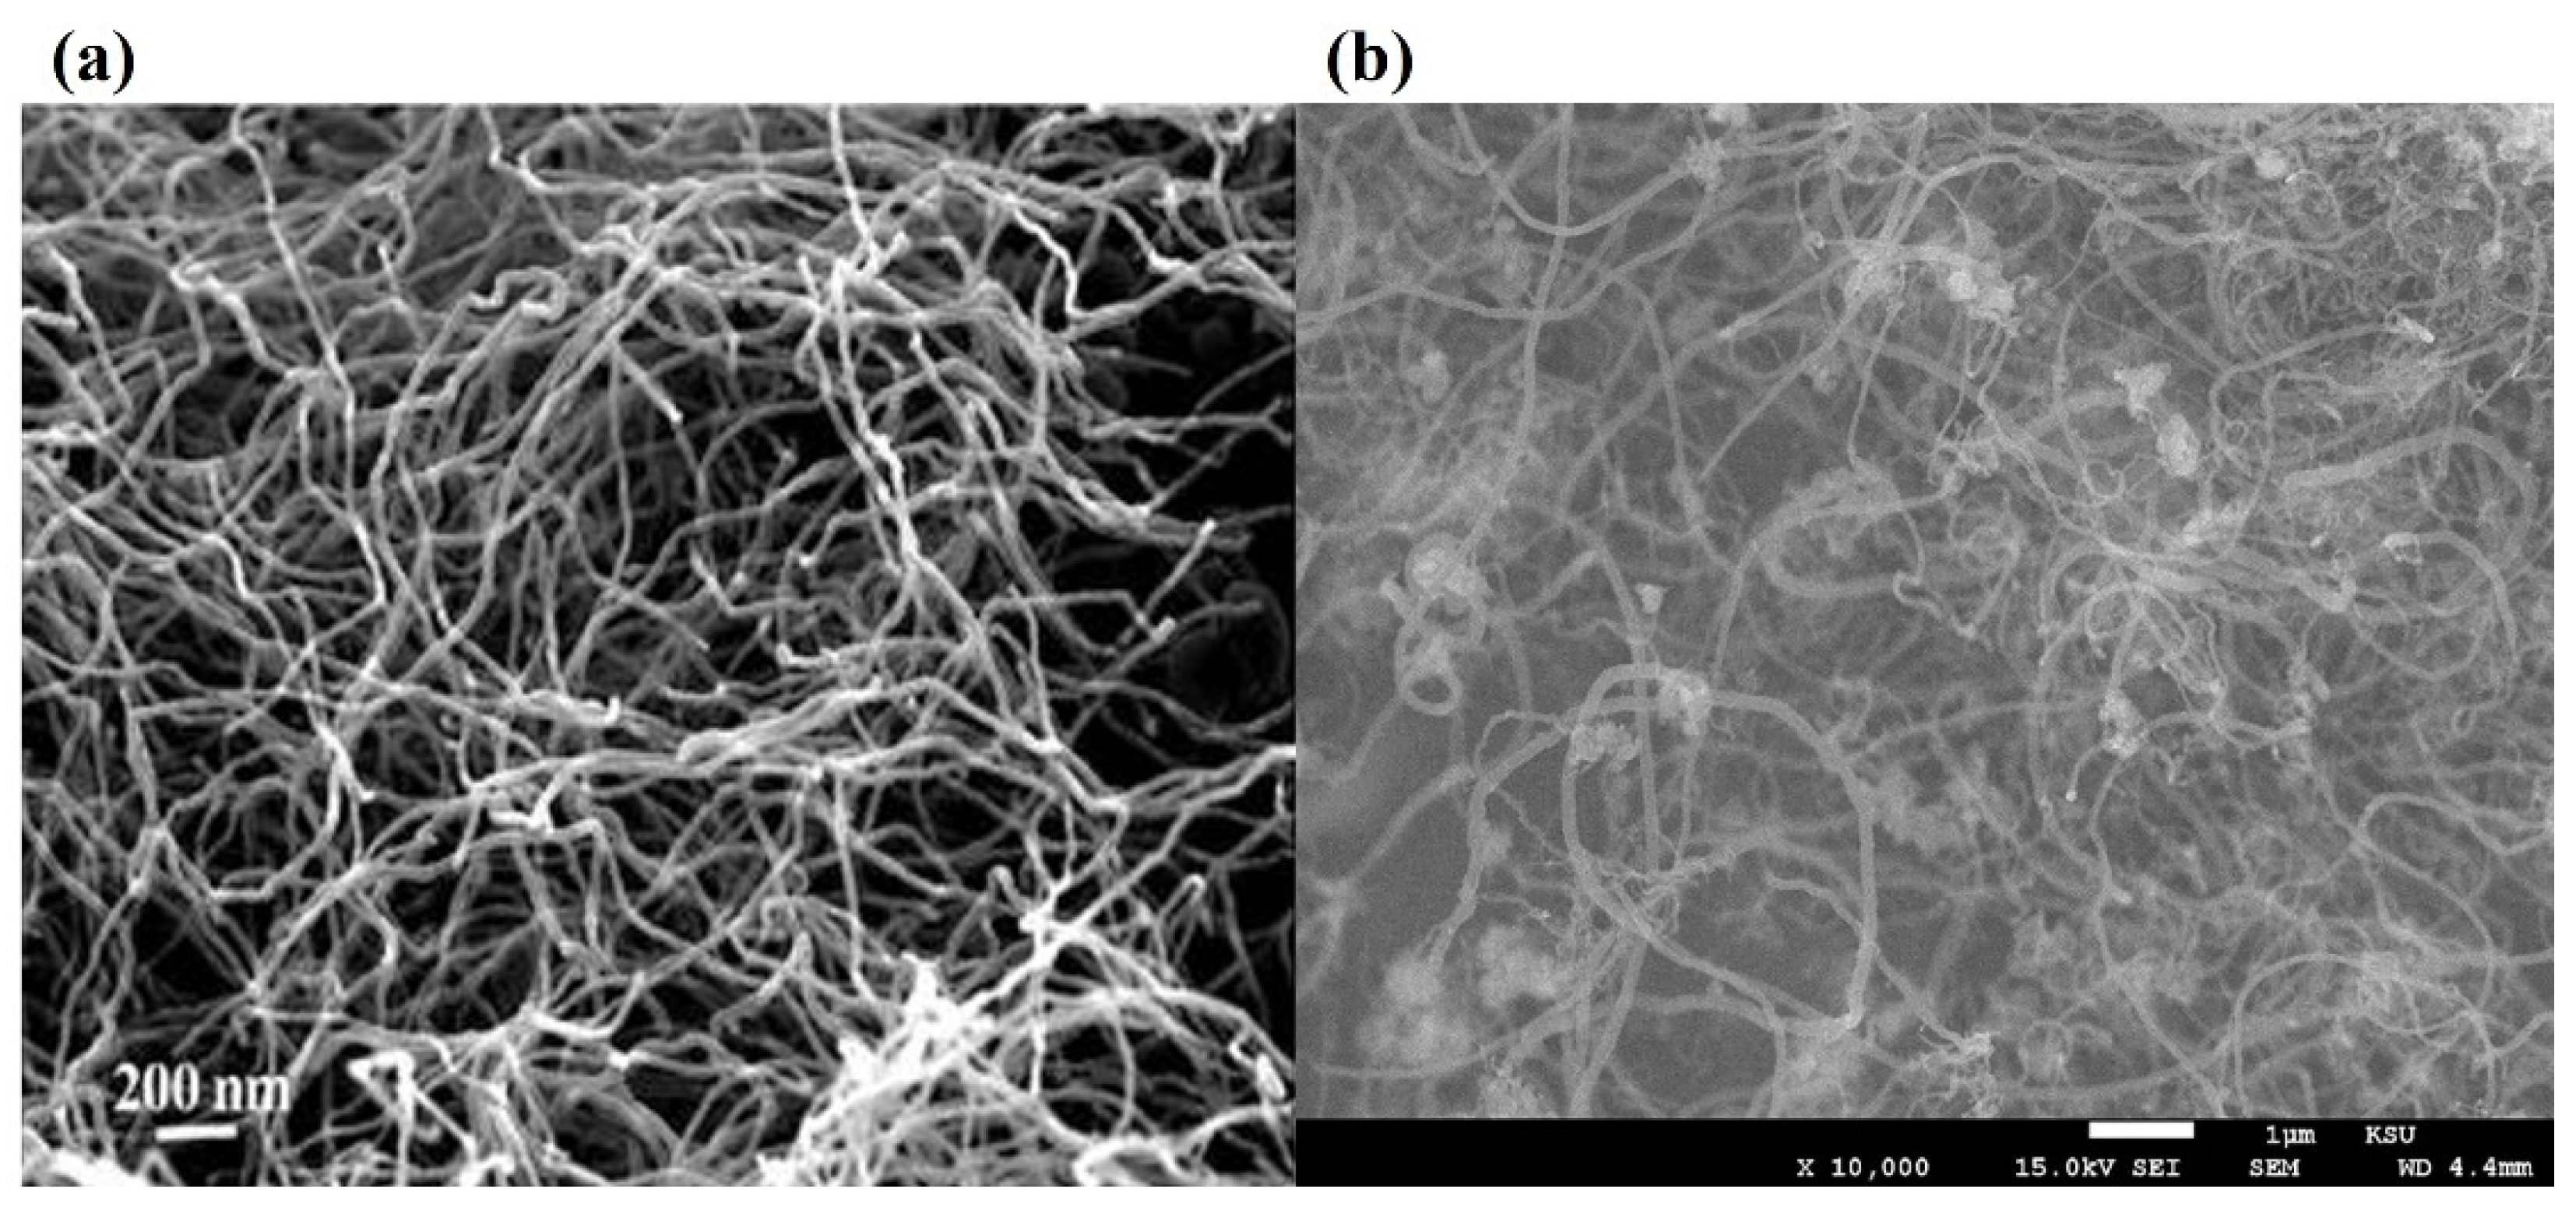
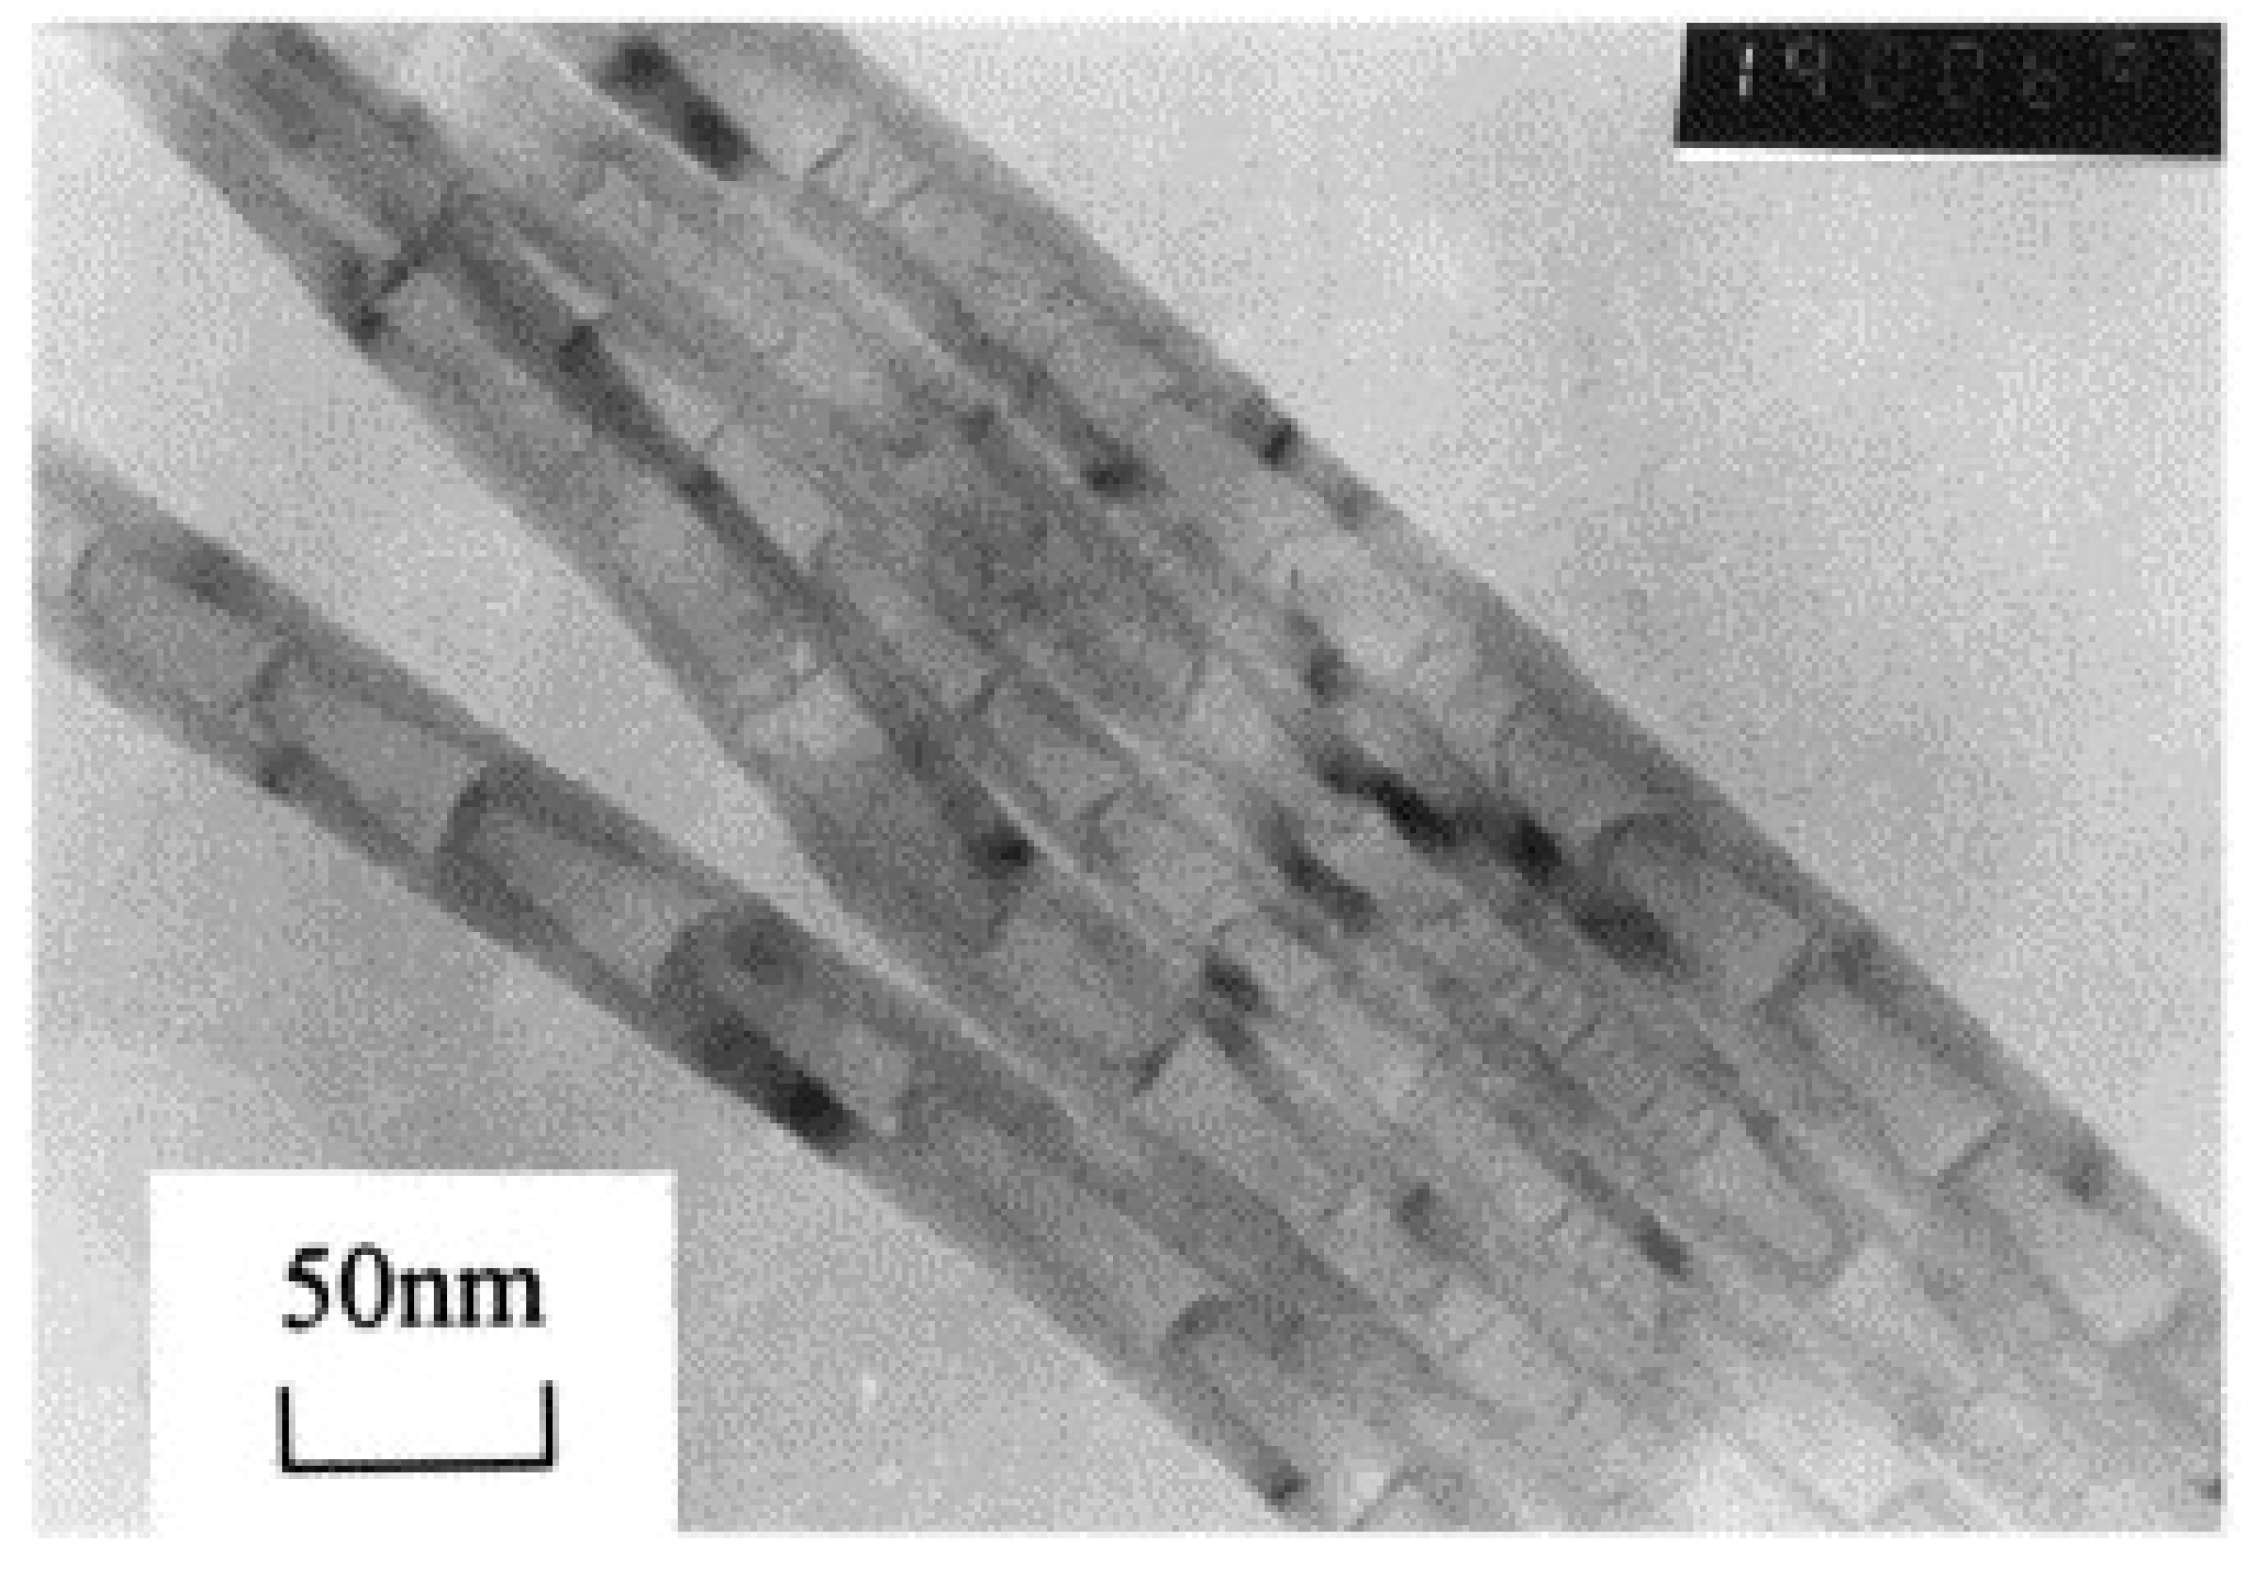
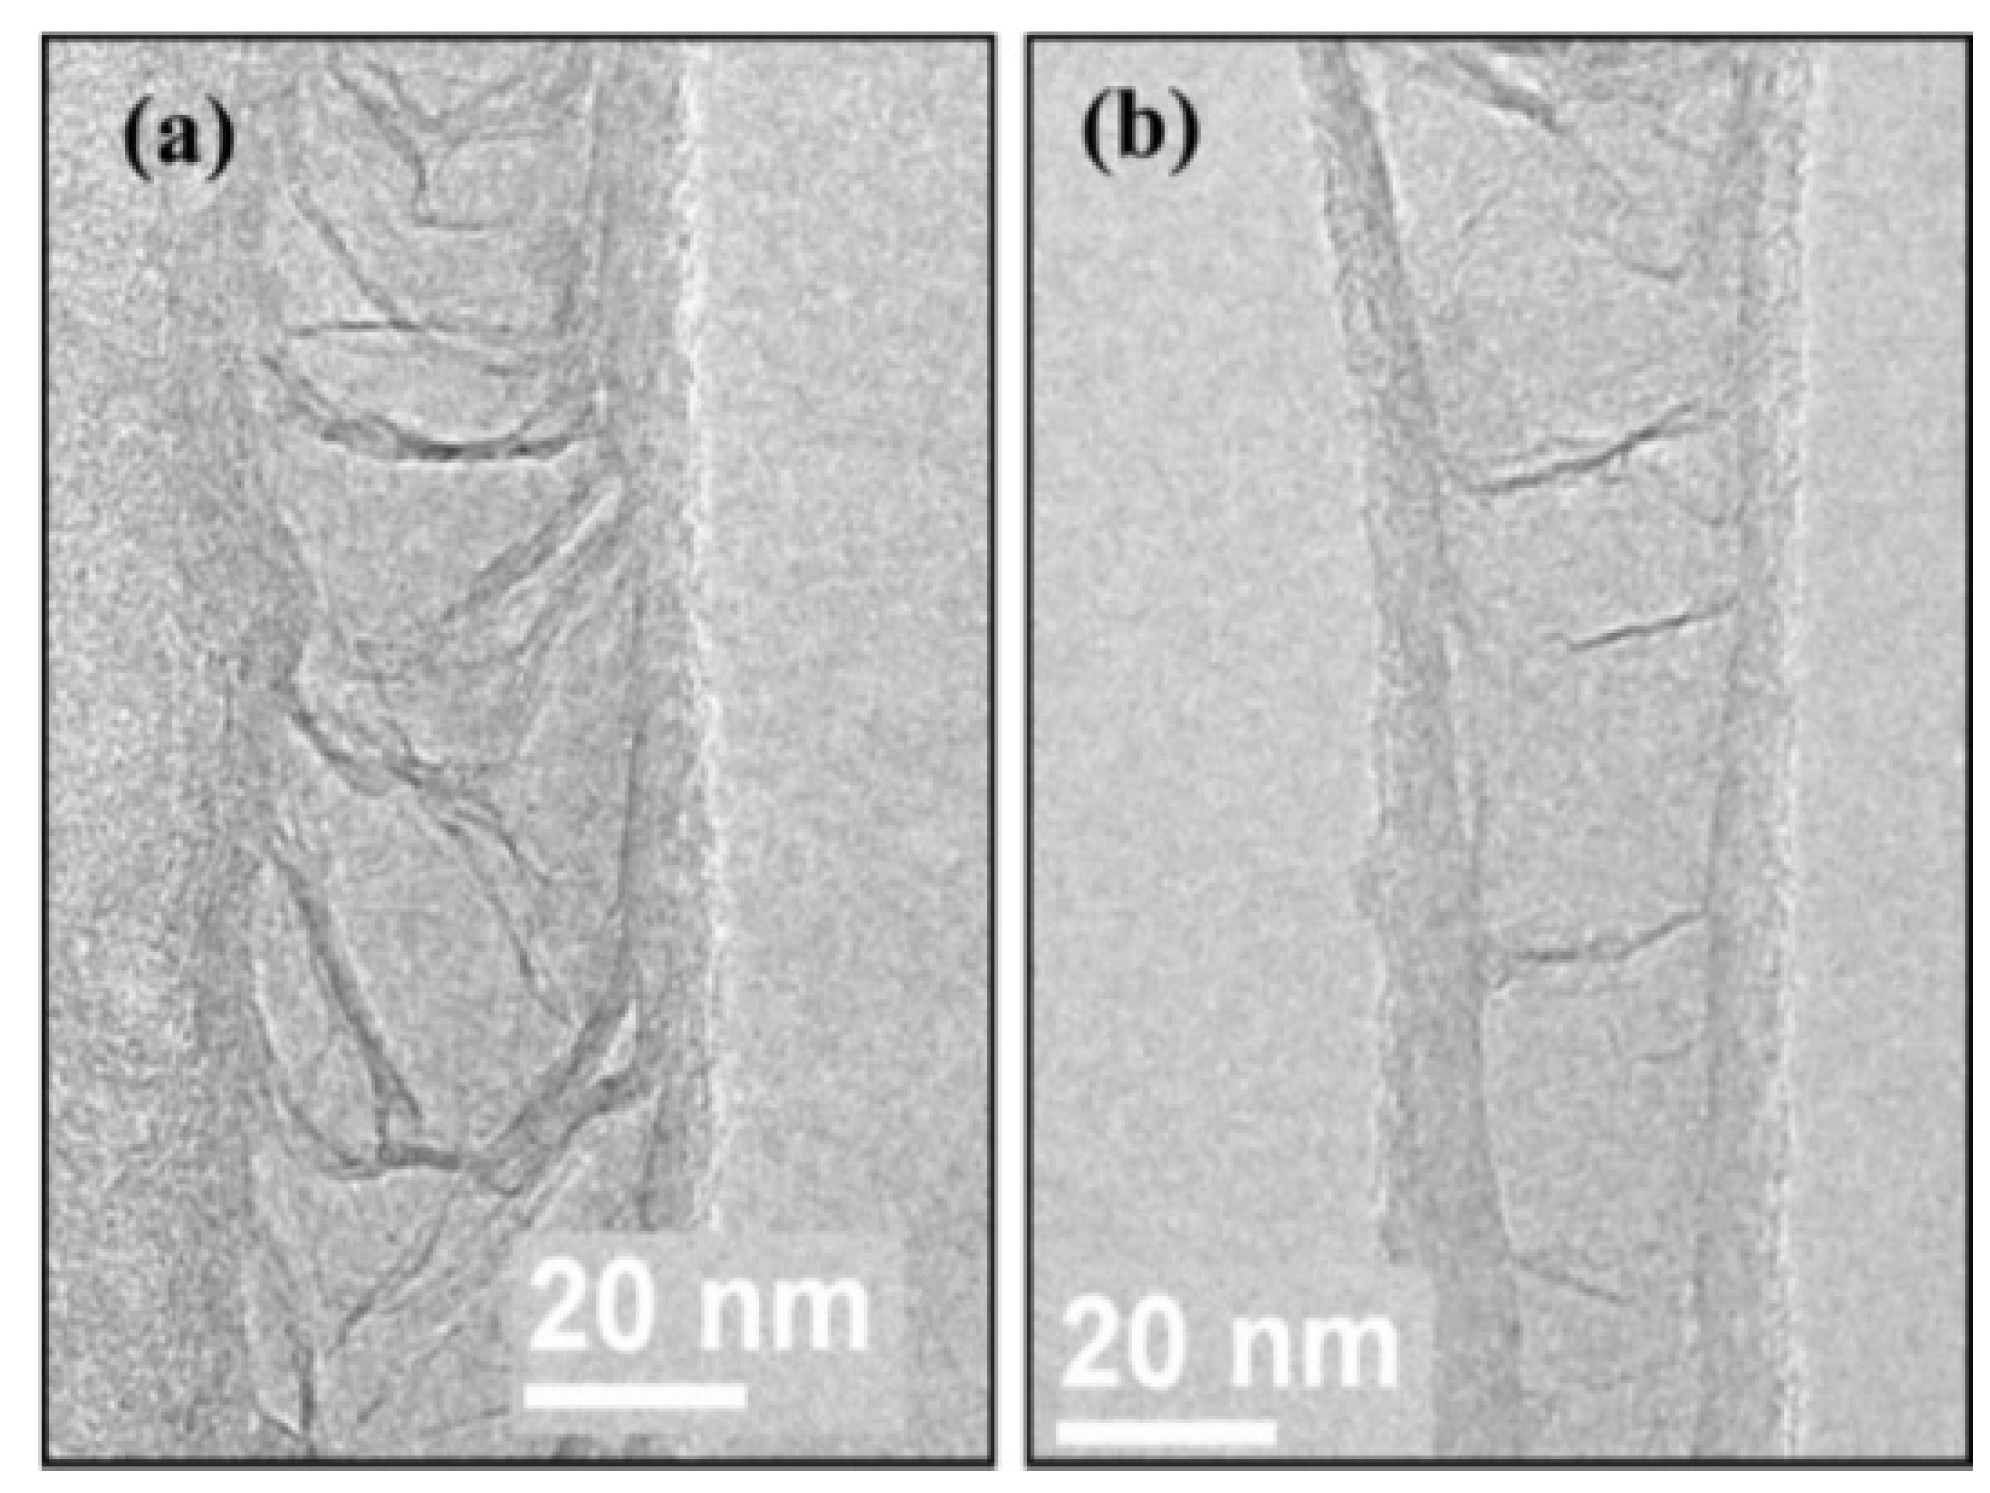
4.1. Bamboo-Shaped Carbon Nanotubes (BCNTs)

BCNTs refer to a unique deposited carbon structure that appears like bamboo joints. Its typical structure in Figure 14 is composed of linear chains of hollow compartments uniformly sized along the growth axis of the nanotube. These compartments have similar sizes and are orderly arranged, which can provide a large surface area and a high density of defects. Studies have shown that the surface defects of BCNTs attached more oxide functional groups than multiwalled CNTs, which gives them a higher electron transfer rate and expands their applications in the electrochemical field [57]. According to Chen et al. [58], the formation of BCNTs is related to catalyst properties and operating conditions, such as promoter, temperature, and space velocity.

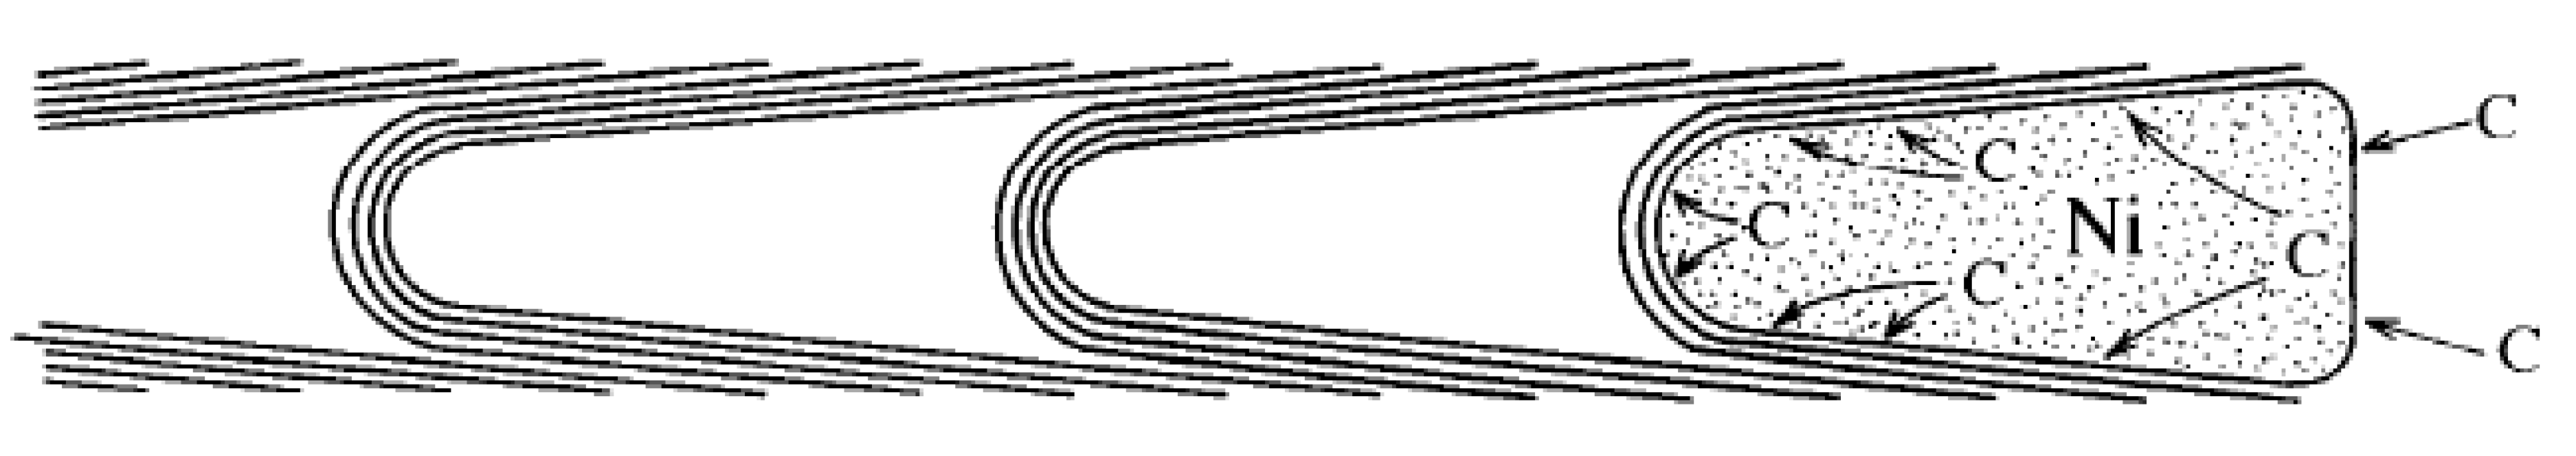
4.1.1. Formation Mechanism of BCNTs

Saito and Yoshikawa [59,60] first proposed the formation mechanism of BCNTs founded on experiments. They believed that BCNTs form if the stress forces on the carbon shell push the catalyst particles intermittently during the carbon nanotube growth. Taking the Ni-based catalyst in Figure 15 as an example, the deformed Ni particle remains at the tip of carbon wires during the CDM process. Simultaneously, dissolved state carbons are continuously diffused to the metal-support side driven by the concentration gradient and accumulated graphite layers. When the accumulated stress inside graphite layers is enough to overcome the surface tension of the Ni particle, the particle is pushed out of the carbon shell and leave correspondingly shaped cavities. Moreover, the quasi-liquid metal phase is considered a necessary condition for the BCNT formation [58]. Although the temperatures employed in the methane cracking are always lower than the melting points of metals and carbides, the quasi-liquid state can be explained by the quantum effect of small particle size and the interfacial interactions [61].
As shown in Figure 16, Lin et al. [62] further classified the BCNTs into complete and incomplete knots. The left side (a) was a typical BCNT with fully closed compartments, and the graphite layers bridged the inner diameter of the outer tube. This type of BCNT is produced by decomposing complex hydrocarbons [63]. However, the previous growth mechanism cannot explain the incomplete and sparse knots formed on the right side (b). Based on a series of bright-field TEM images of ethylene cracking on the Ni-based catalysts at 650 °C (Figure 17), the researchers suggested that BCNTs with incomplete knots were due to the rapid contraction of the Ni catalysts before the completion of inner layer growth. In other words, as the inner hemispherical cap formed around the bottom of the Ni particle, the cohesion of carbon layers was also restored. If the growth of graphite caps were completed before the contraction of the Ni catalyst particle due to the restoring cohesive forces, it would result in a complete BCNT knot. By contrast, partial growth of the inner wall would cause the carbon core to accumulate preferentially on one side. The rapid contraction of the Ni particle would occur before completing the inner layers’ growth, leaving a partial knot behind.

4.1.2. Influencing Factors and Related Experiments of BCNTs

CDM experimental results showed that the formation of BCNTs was mainly related to the catalyst composition and reaction temperature [38,58,64]. Ni-Cu-based catalysts are one of the most popular catalysts for BCNT production, with a relatively stable conversion rate and high yield. Other ferric alloy catalysts (such as Fe-Mo & Co-Ni) have also resulted in BCNT formation in the methane cracking. The quasi-liquid metallic phase is another factor determining if the cleavage reaction is sufficient to form BCNTs, as this unique carbon deposition grows only at relatively high temperatures.
In Ni-Cu-based catalysts, copper is not an active component for methane cracking. Its function is to reduce excessive methane conversion rate at high temperatures and achieve a dynamic balance between carbon deposition and carbon diffusion rates. Saraswat et al. [65] first reported the modification effects of Cu addition into Ni/SiO2 catalysts. The results of CDM experiments between 500–750 °C indicated that the 50% Ni-10% Cu/40% SiO2 sample produced the highest amount of BCNTs. Either excessive or insufficient Cu introduced leads to opposite effects. High Cu content allows active alloy phase transfer to the quasi-liquid state at lower temperatures, which reduces the catalyst structural stability and leads to agglomeration issues [66]. In contrast, insufficient Cu content cannot maintain rate balance and results in rapid deactivation of catalysts because of carbon encapsulation.
Except for catalyst composition, the reaction temperature is another critical factor affecting the quasi-liquid alloy phase. When the structure of BCNTs is observed by TEM/SEM, the catalyst particles tend to be highly deformed, and the cavities are droplet shaped. Li et al. [67] tested the performance of a 65% Ni-10% Cu/25% SiO2 sample in methane cracking at different temperatures and found that the catalytic activity significantly decreased with increasing temperature when the alloy phase was in the quasi-liquid state. This can be explained by the enhanced graphitic order of carbon depositions at high temperatures and fragmentation of Ni-Cu alloy particles during the growth of BCNTs. Chen et al. [68] further studied the Ni-Cu particle fragmentation issue at high temperatures and used EDS to detect element distribution. Upon careful study, when Ni-Cu particles suffered structural damage, the head part was enriched with Ni, and the tail was enriched with Cu. If the tail part was sucked into the cavity of BCNTs, the Ni content in the rest of the particle increased, and particle size decreased. This induced the agglomeration problem of particles at high temperatures, which reduced the overall cracking efficiency and catalyst lifetime.
To maximize the yield and economic benefit of BCNTs in the CDM process, Chen et al. [58] reported on methane cracking experiments with different ratios of Ni-Cu/Al2O3 samples and synthesized BCNTs with perfect structure (In Figure 14). In addition to the reaction temperature, they also indicated that species partial pressures affected the formation of BCNTs. Excessive CH4 partial pressure eliminates the bamboo cavity and replaces it with thick-walled hollow nanotubes with catalysts operated at the same temperature range. By adjusting the proportions of components, the optimal output was obtained from a 75% Ni-8% Cu/17% Al2O3 sample that produced the 33 gC/gNi BCNTs and maintained activity over 3.5 h at 720 °C. Again, related to supporting material, Shen et al. [38] conducted CDM experiments with Ni-Cu/CNT and observed BCNTs at 750 °C. With the Cu proportion increased, the particle deformability and the wettability between the metal-carbon interface were enhanced. It was deduced that alloy particles took a long time to contract and produced cavities with larger length-width ratios.
BCNTs were also observed in the CDM process with other catalysts. Zhou et al. [69] conducted CDM experiments on Fe/Al2O3 and observed BCNTs with part of the Fe3C particles in the tubes. Gonzalez et al. [64] used Ni-T20 nanoparticles as an unsupported catalyst and observed the growth of BCNTs with conical compartments during methane cracking. This followed the growth mechanism described above, but the yield was significantly lower than with conventionally supported catalysts, at only 6–7 gC/gcat. Meanwhile, Basset et al. [70] reported the performance of Ni-Pt binary nanoalloys in the CDM reaction. The formation of BCNTs and residual particles in the cavity were captured by TEM at 700 °C in the 90% Ni/10% Pt sample.
Compared to conventional CNTs, BCNTs consist of separated hollow compartments and knots growing straight along the axis [71]. Benefits include a high percentage of edge–plane sites on the surface, and BCNTs are expected to have good electrochemical characteristics. Compared with standard CNTs, BCNTs have a higher specific surface and higher density of defects, which further expand their application range in electrode modifications. Apart from the above, BCNTs also showed faster electrons transfer rate and more electroactive sites than single-walled CNTs in biosensing [71]. Currently, the yield of BCNTs produced by the CDM method is still low. Researchers are committed to improving their economic benefits by optimizing the reaction conditions or the catalyst preparation way (such as the sol-gel method) [72].

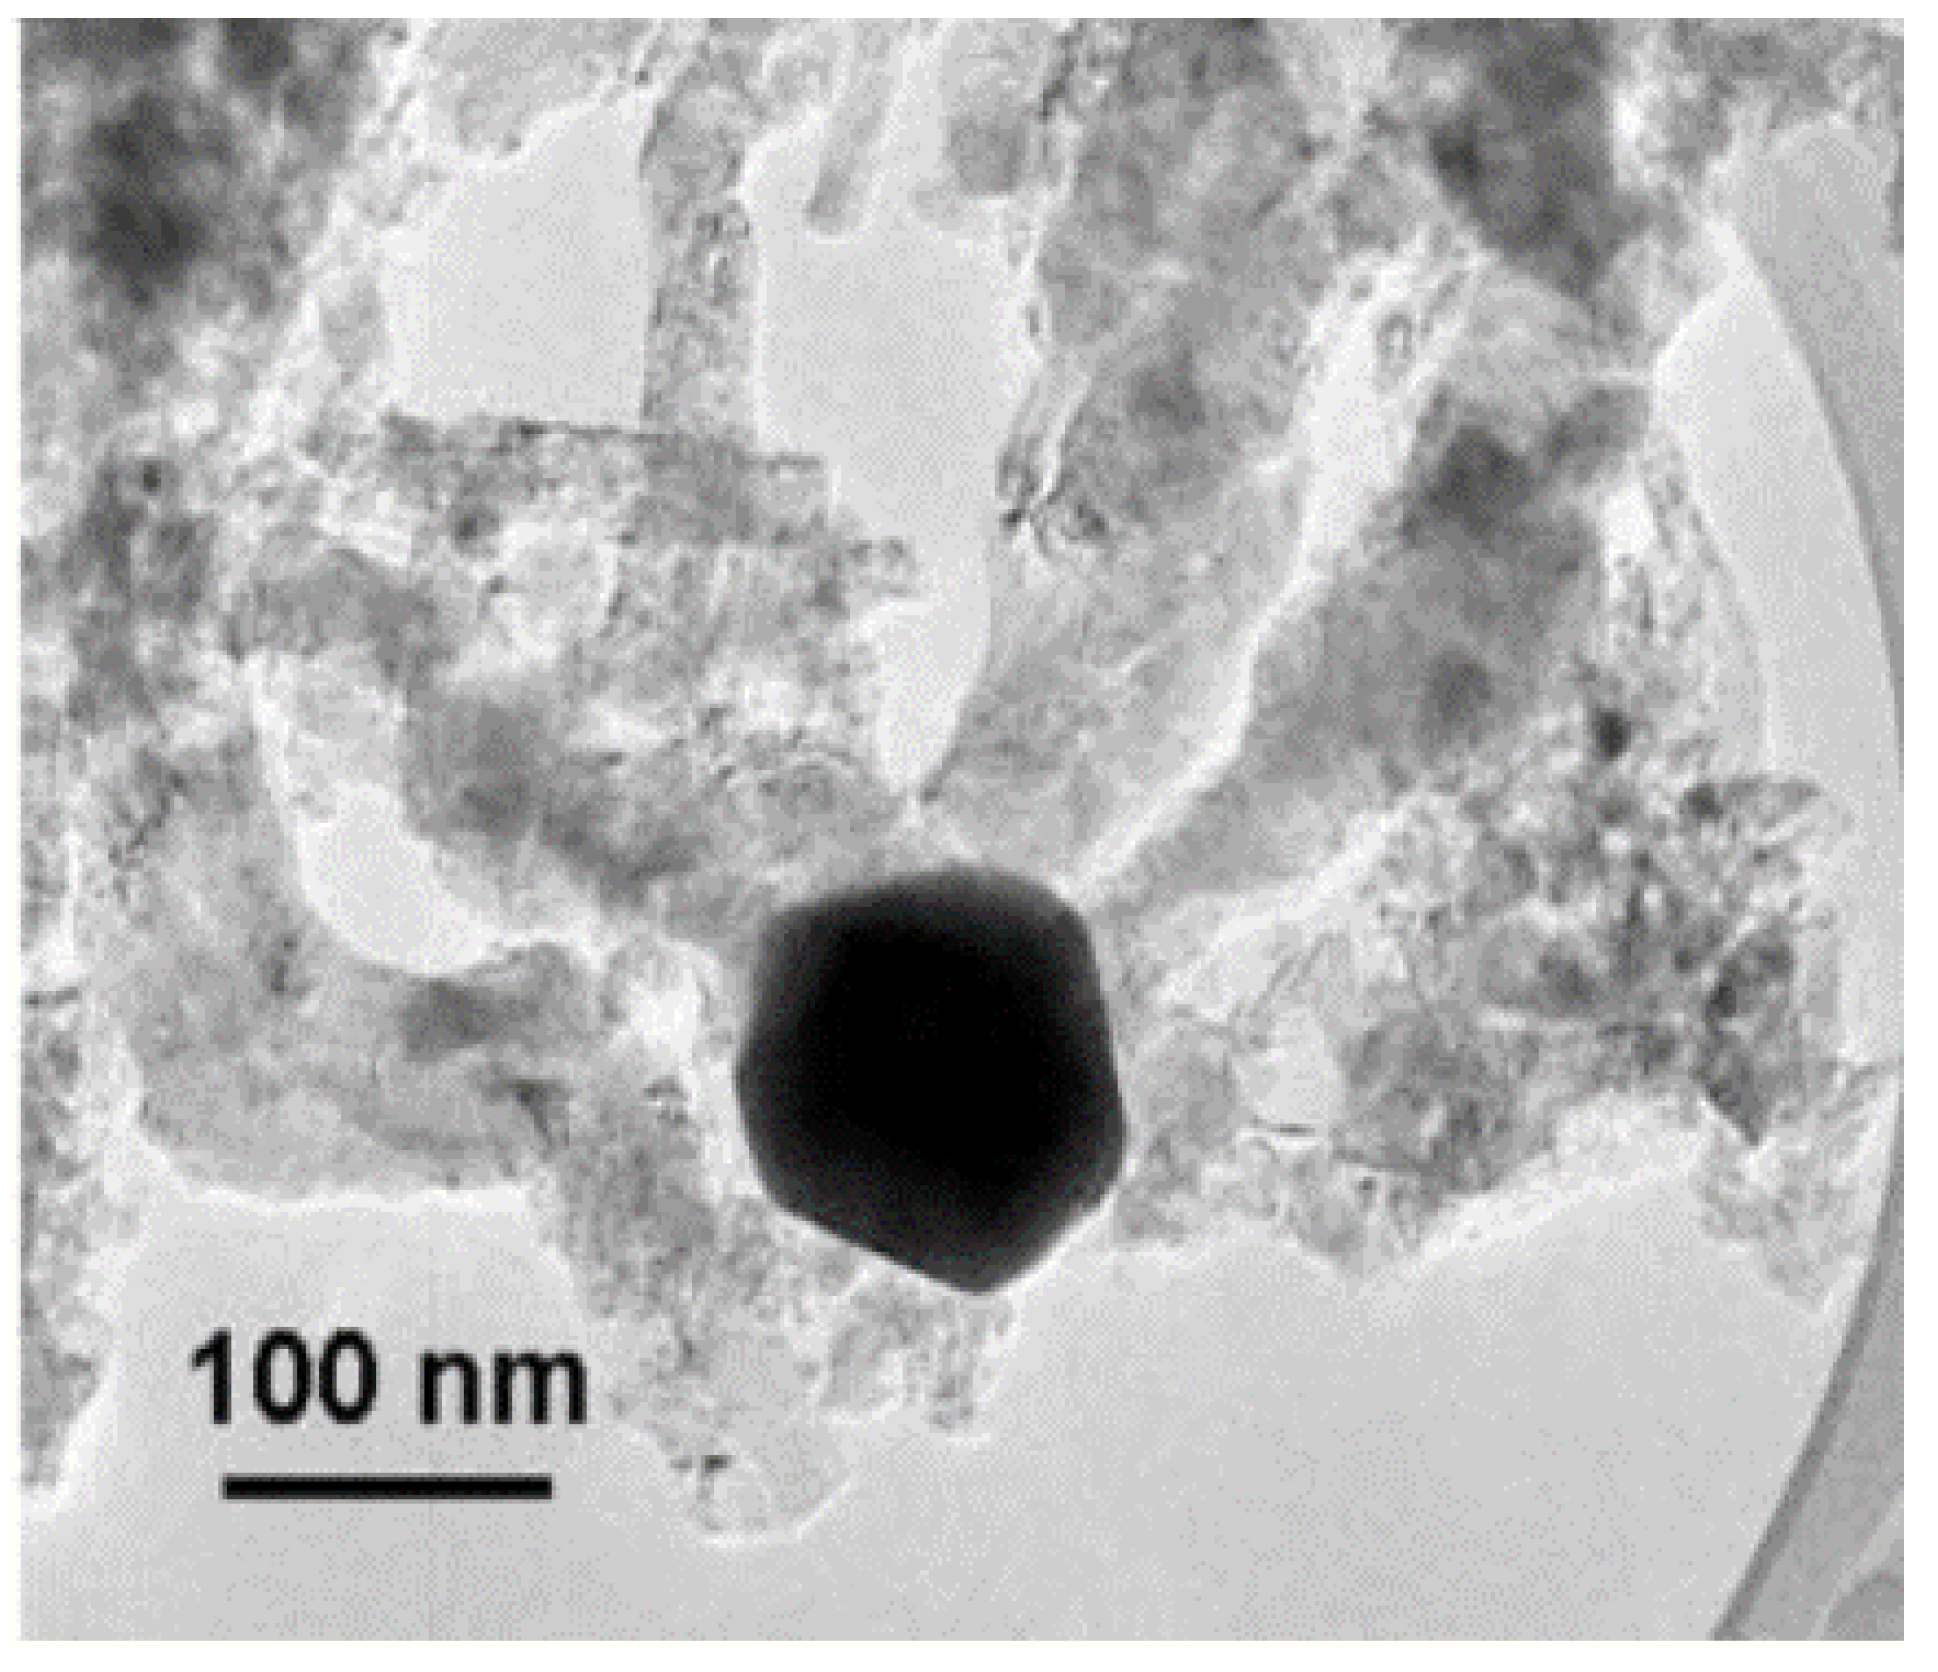
4.2. Octopus-Shaped Carbon Nanofibers (OCNFs)

Octopus-type carbon nanofibers (OCNFs) are special carbon deposition structures observed in the catalytic decomposition of methane (CDM) process under certain conditions. Different from regular carbon filaments, OCNFs can grow two or more carbon wires simultaneously from a large and multifaced catalyst particle. The typical structure is shown in Figure 18, depicting several carbon wires growing synchronously from the central Ni-Cu alloy particle. Monthioux et al. [73] showed that the growth of OCNFs was highly entangled, up to several micrometers long, and the diameter was much smaller than catalyst particles. This unique growth method leads to a pattern of carbon deposition like the octopus tentacles, hence the name. OCNFs have attracted researchers’ attention because of high carbon yield, and as a feasible way to produce carbon black [74].

4.2.1. Formation Mechanism of OCNFs

After observing the multidirectional growth of OCNFs on catalyst particles, Alstrup et al. [75] revealed its formation mechanism by comparing Ni-based and Ni-Cu-based catalysts. For the pure Ni-based catalyst, methane cracking occurred preferentially at the active sites on (100) and (110) planes, while carbon deposition and formation occurred on the precipitation planes (111) [76,77]. When Ni particles are supersaturated, (111) and planes extend and reconstruct for carbon filament growth. This view was supported by Schouten et al. [78,79], who used low-energy electron diffraction and auger electron spectroscopy to prove the interaction between methane and different crystal planes of Ni. However, in Ni-Cu-based catalysts, the segregation of Cu produces more evenly distributed Ni grains on the surface [80]. Surface enrichment of Cu inhibited the reconstruction of Ni (111) planes and forced them to separate into several small (111) facets. Since the crystallographic matching between Ni (111) and graphite (002) planes are relatively sound, thinner CNFs grow from multiple small (111) planes and present octopus-shaped carbon deposition.
Gathering the information from previous CDM experiments, Li et al. [81] summarized the formation process of OCNFs as shown in Figure 19. OCNFs grew from a central catalyst particle, which was determined by two crucial factors, i.e., low temperature and particle rigidity. SEM images taken by Pham et al. [82], as shown in Figure 20, supported this view since the magnified central particle in the OCNFs present regular geometric shapes. Moreover, they found that the alloy element may increase the diameter and development planes of catalyst particles, which results in OCNFs always having a platelet structure and large angles to the axis (>90°).

4.2.2. Influencing Factors and Related Experiments of OCNFs

According to the formation mechanism above, OCNFs result in a much higher carbon yield than other carbon deposition types in the CDM process. Since the catalyst regeneration methods are not mature enough currently, maximizing the carbon outputs on fresh catalysts becomes an effective way to optimize the economic benefits of methane cracking technology. After collating and summarizing the experimental results of OCNF formation in the CDM process, yield depends on metal phase components, operating temperature, and the supporting material.
Similar to the bamboo-shaped carbon nanotubes (BCNTs), OCNFs can also be produced by methane cracking on Ni-Cu-based catalysts. By controlling the mass fraction of the supporting phase as 10 wt.%, Avdeeva et al. [43] tested the catalytic activity of Ni-Cu/Al2O3 samples with different Cu ratios in CDM reactions. From the carbon capacity results, the best performing 82% Ni-8% Cu/Al2O3 sample produced 250 gC/gcat at 550 °C. This value was much higher than that of the control group without Cu introduced (145 gC/gcat). After checking the solid carbon structure under TEM, a pure Ni-based catalyst grew classical carbon filaments with slightly deformed metal particles at the top, while typical OCNFs were formed on Ni-Cu-based catalysts. Subsequently, Reshetenko et al. [83] expanded the range of Cu introduction ratio in the alloy phase and the reaction temperature based on previous studies. With 10 wt.% Al2O3 as the support phase, the best experimental result was found with a 75% Ni-15% Cu/Al2O3 sample at 625 °C. This kept the stable methane conversion rate around 20% in 40 h and accumulated 525 gC/gcat OCNFs. They also noted that the excessive introduction of Cu was counterproductive since it reduced the number of active sites and overall structural stability. Other researchers echo these points. After testing the Ni-Cu/Al2O3 catalysts’ performance with 15–33 wt.% of Cu proportion between 500–740 °C, Chen et al. [68] indicated that the excessive Cu ratio decreased the methane conversion rate and shortened the catalyst lifetime. As a supplement, Li et al. [67] pointed out that the Cu proportion impacts were also reflected in the particle size and the specific surface area of catalysts. From XRD results, the proper Cu ratio obtained uniform and homogenous particles with porous structures. Excessive Cu led to large diameter particles with low specific surface area, which were easily encapsulated by carbon deposition and deactivated.
Except for Cu proportion and operating temperatures, supporting materials have non-negligible impacts on OCNFs yield. Apart from the Al2O3 mentioned above, a report from Takenaka et al. [84] focused on low-loaded (5 wt.%) nickel alloy catalysts on SiO2. A variety of transition metals (Cu, Rh, Pd, Ir, and Pt) were introduced to the active metal phase in a fixed ratio and their catalytic activity tested for the methane cracking process. Different from the previous results, the performance of the Ni-Cu/SiO2 sample was worse than that of the control group (Ni/SiO2), and TEM did not capture octopus-shaped carbon deposition on its surface. Li et al. [67] prepared Ni-Cu/SiO2 samples by a sol-gel method and observed the formation of OCNFs on the high-loaded catalysts. They suggest that SiO2 is not the best choice for Ni-Cu-based catalysts since the improper interphase interactions are more evident under the low-loaded case.
For other metal oxide supports, Wang et al. [85] tested the activity of Ni-Cu/MgO samples in the CDM reaction between 600–1000 °C. Due to the solid solution formation (NiMgOx), it was difficult to reduce Ni back to the metallic state in the catalyst activation stage. In other words, most of Ni on the fresh catalyst surface was still in the oxide form, which limited the number of active sites and the methane conversion rate. Moreover, Li et al. [45] discussed the performance of Ni-Cu alloys loaded on an Nb2O5 support. Nb2O5 has similar properties to SiO2, but has better adaptability to alloy particles. It can improve the hydrogen mobility of the catalyst while ensuring the stability of crystal structural stability. By adjusting the ratio within the active alloy phase, it was found that a 65% Ni-25% Cu/10% Nb2O5 sample had the best performance at 600 °C (483 gC/gcat OCNFs). Therefore, the supporting material and alloy phase composition jointly affect interactions, thereby changing the particle size and the final yield of carbon depositions.
In addition to Ni-Cu-based catalysts, OCNFs were observed on other catalysts. For instance, carbon deposited on Ni-Pd/CF samples from the methane cracking process at 600 °C had a typical octopus-shaped structure. Takenaka et al. [84] claimed that an introduced trace of Pd can significantly improve conversion efficiency and extend the catalyst lifetime. The CDM experiments done by Ermakova et al. [86] showed mixed carbon depositions on the 90% Fe/Al2O3 sample at 680 °C, including multiwalled carbon nanotubes and OCNFs. Since the high activation temperature of Fe-based catalysts is not suited for OCNF formation, the insufficient number of active sites and poor catalytic performance only generated 14 gC/gFe solid carbons. Furthermore, OCNF formation on Co-based catalysts is rarely reported. Chesnokov et al. [87] used a 90% Co-10% Zn/Al2O3 alloy sample to generate partial OCNF deposition at 550 °C with the CDM reaction but did not quantified the specific hydrogen and carbon yields.
According to the XRD results, OCNFs formed at low temperatures of CDM reaction usually have low graphitic orders, mainly composed of amorphous carbons (such as carbon black) [76,88]. Although its economic benefits are less than carbon nanotubes, carbon black can be used in a wide range of applications, including strengthening rubber, pigments, UV stabilizer, and synthetic leather [89].

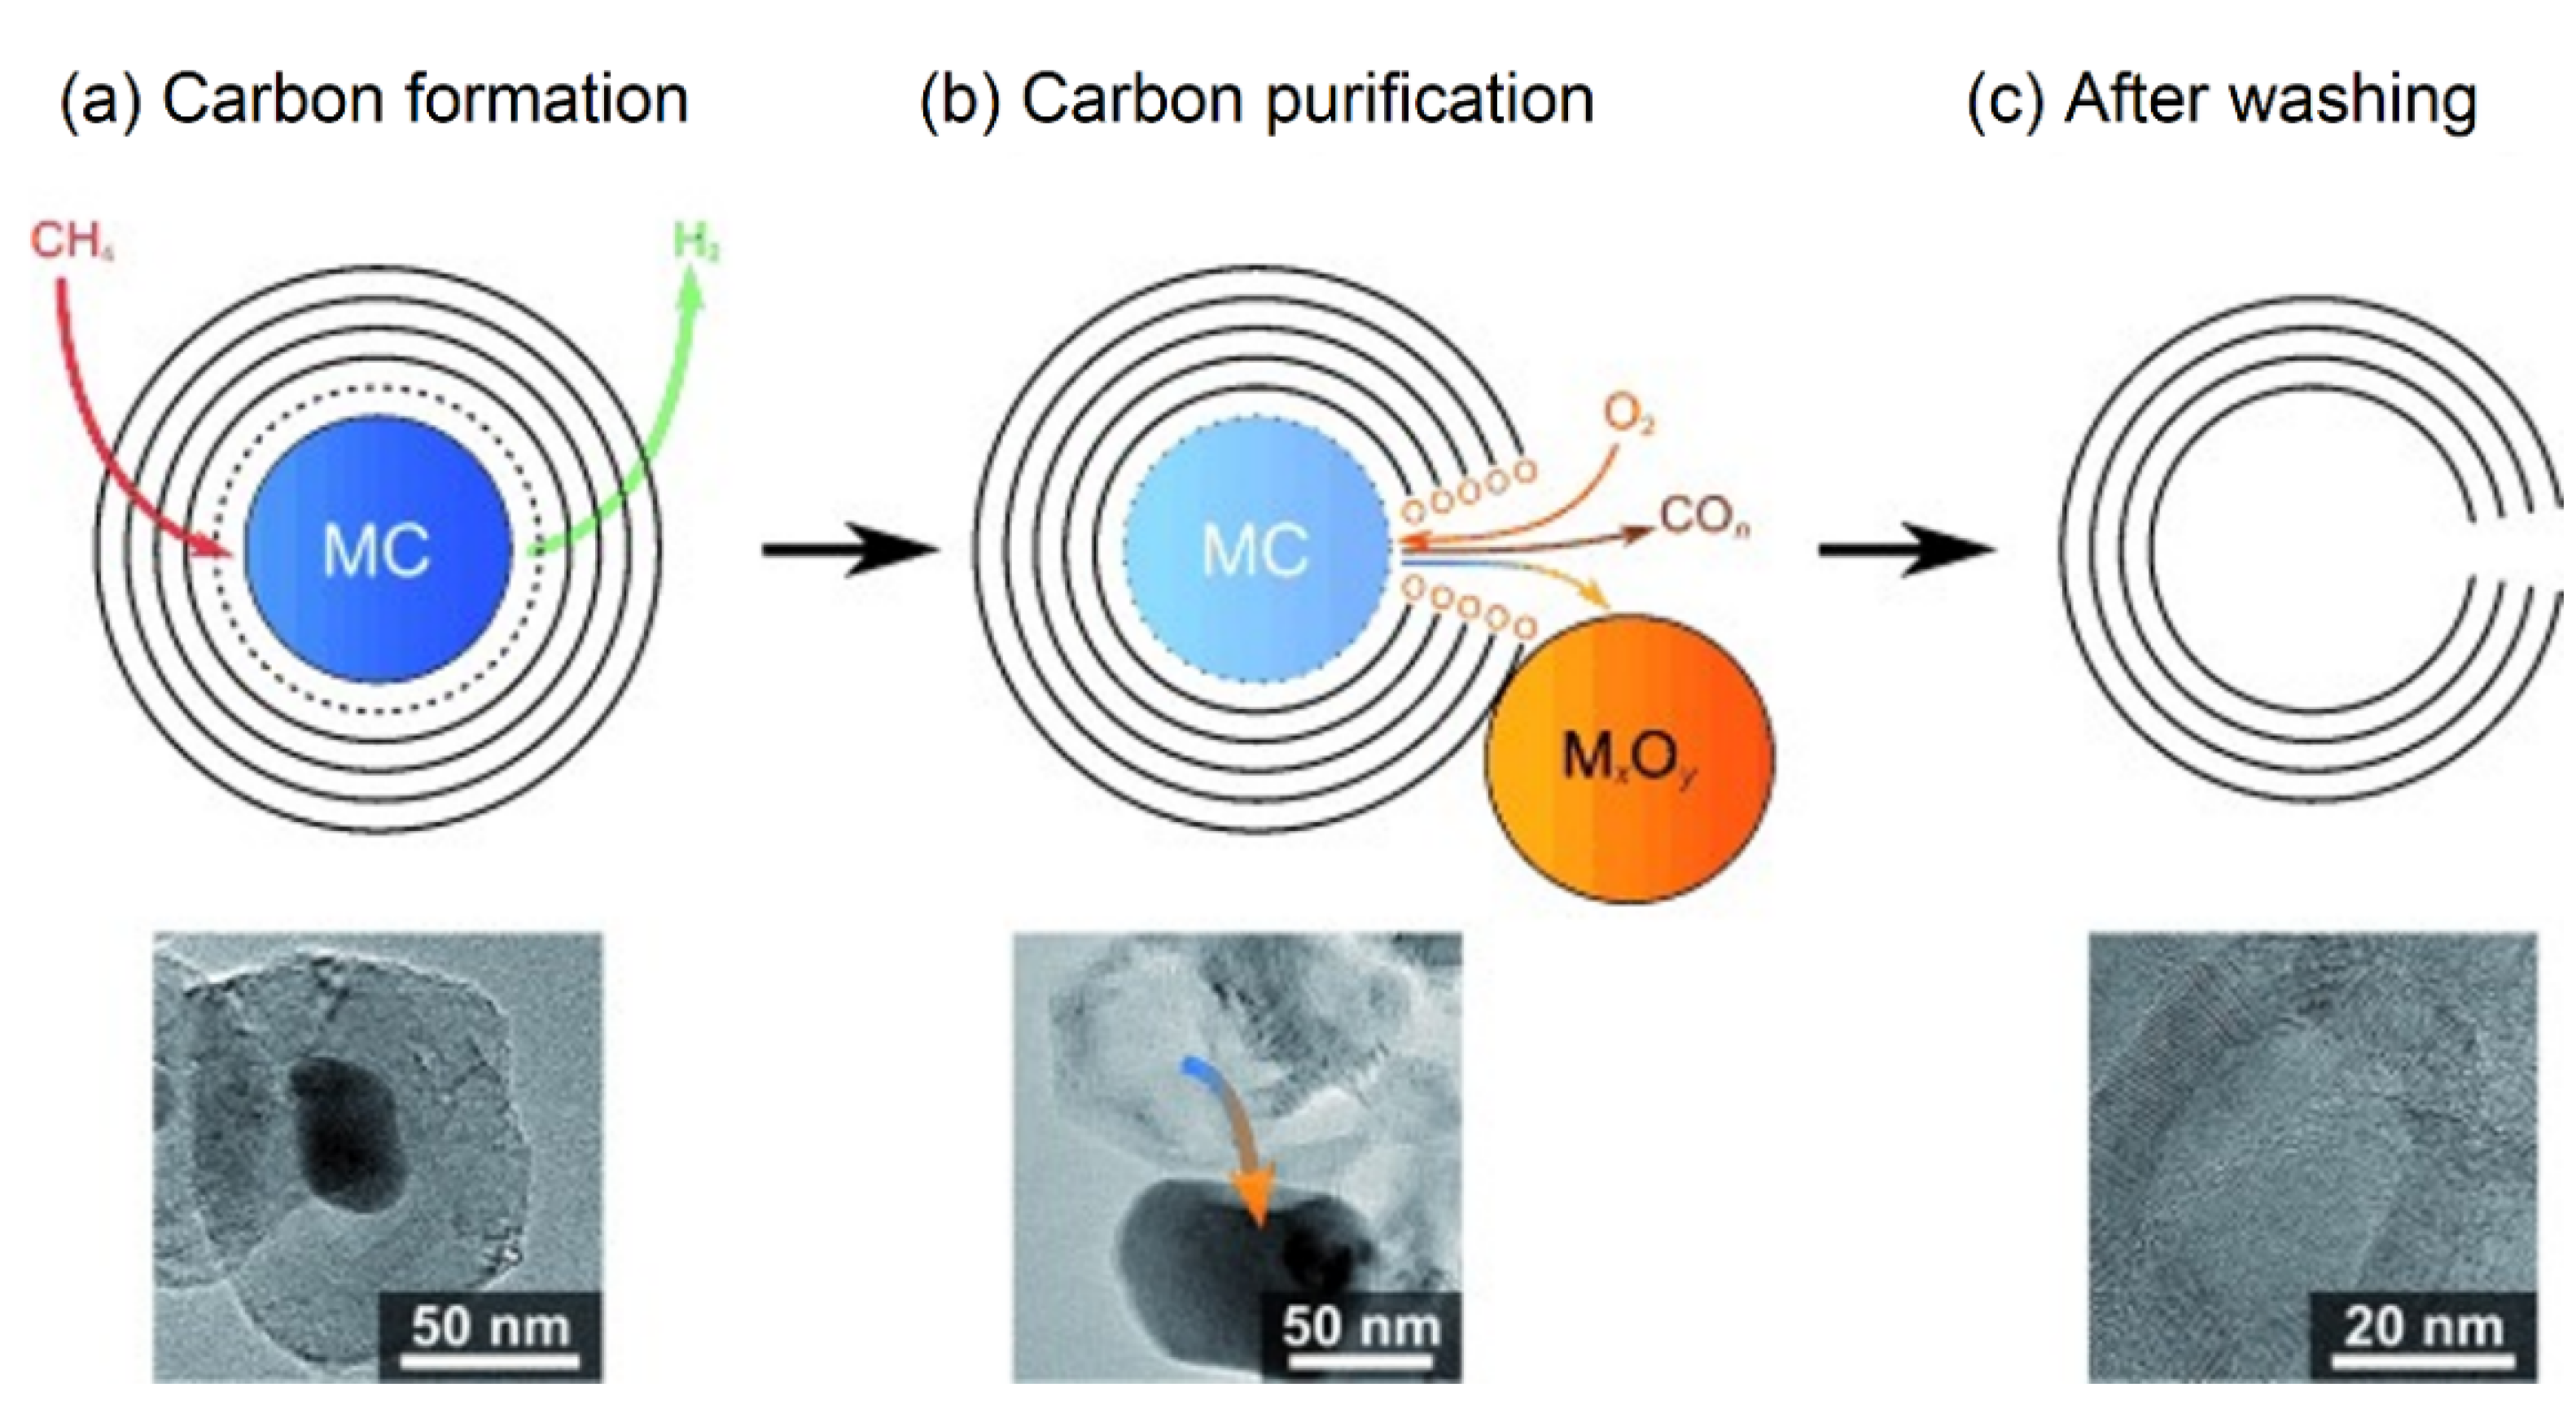
4.3. Carbon Nano-Onions (CNOs)

Carbon nano-onions (CNOs) are another special carbon deposition structure that may occur in the catalytic decomposition of the methane reaction (CDM). They are quasi-spherical carbon nanoparticles composed of concentric graphite shells. Iijima first discovered this onion-like graphite structure from the graphite electrode’s surface in 1980 [90]. After that, Ugarte successfully observed CNOs by using high intensity electron beams [91]. Traditional preparation methods for CNOs require high energy inputs and complex experimental conditions. CNOs formed in CDM might encapsulate catalyst particles inside, needing additional separation steps to ensure its purity.

4.3.1. Formation Mechanism of CNOs

There are two types of carbon nano-onions observed in the carbon deposition of methane cracking. One encapsulates metal particles as a core, while the other is hollow. After observing the structure of CNOs formed on specific catalysts by TEM, He et al. [92] showed that two types of CNOs can co-exist and further proposed the corresponding growth mechanism shown in Figure 21. Type 1 indicates the active metal particles can chemically adsorb methane molecules from multiple directions and cause the carbon to be deposited simultaneously on these active sites. If the metal phase has less solubility of carbon, the surface deposited carbons bond and directly form graphitic shells to encapsulate the metal particle. Since the encapsulated catalysts do not continuously contact with methane, the yield of CNOs is relatively limited. Type 2 describes the formation of hollow CNOs. After the carbon shells encapsulate the catalyst particles, some of them with small particle sizes are liquefied at high temperatures and gradually evaporate through the defects of graphitic shells. Although the melting point of the active metal phase is higher than the reaction temperature, it is greatly reduced because of the nanostructure and carbide formation. The irregular voids in hollow CNOs are considered as evidence of the fluidity and instability of the liquid metal phase.
Kang et al. [93] partly agreed with the previous growth mechanism of CNOs but proposed a different perspective concerning hollow CNOs formation. As shown in Figure 22, they believe that the graphitic shells formed on the metal particles are not initially closed. When the graphitic shells become thick enough, the asymmetrical pressure forces the metal particle to escape from the core. Then, some graphitic shells may be joined with other carbon nanostructures to close the opening. They also indicate that CNOs produced in the CDM reaction have high purity and similar lattice properties to ideal graphite.

4.3.2. Influencing Factors and Related Experiments of CNOs

After examining the growth mechanism of the two types of CNOs, the yield of CNOs in the CDM process was not as good as expected. From the SEM images taken on the deactivated catalyst surface, most CNOs followed the first type of deposition (Figure 23), which means that the encapsulation of graphitic shells quickly deactivated the catalysts [94]. Even with lower yields, purified CNOs have similar properties to perfect graphite. Its wide range of applications and high economic value have motivated researchers to explore scaling up production of this unique carbon material.
Zhang et al. [95] first proved that high temperature was one of the necessary conditions for forming CNOs in the methane cracking process. They developed Fe-Cr alloy catalysts over a stainless-steel surface, which can synthesize CNOs in high selectivity. At reaction temperatures higher than 800 °C, more than 80% of carbon by-products were CNOs. However, at lower temperature, more thin-walled carbon nanotubes were observed on the catalysts. On this basis, Keller et al. [94] optimized a preparation method of Fe-based catalysts to improve the yield of CNOs. The spray-dried technology they used made the catalysts mechanically stable and highly porous to maximize carbon capacity. They tested the catalytic performance of Fe/Al2O3 at 850 °C with different methane flow rates and analyzed the carbon deposition morphology based on XRD technology. From the results, CNO was the main carbon by-products with few carbon fibres, and the maximum yield was around 13.53 gC/gFe.
Moreover, Shen et al. [38] prepared Ni-Cu/CNT by a polyol reduction method and observed CNO deposition at 700 °C. They also showed the deformation of catalyst particles in the core of CNOs is small, producing carbons uniformly nucleated on catalyst surfaces. In addition to Ni-Cu, Liang et al. [96] attempted to use Ni-Mg as the active metal phase in the CDM process. After testing the catalytic performance of Ni-Mg/Al2O3 samples with different metal loadings, they found that CNO formation is also related to particle size. The particle size of the Ni-Mg alloy was increased with the Mg proportion. Experimental data showed large particles favor the formation of carbon nanotubes and amorphous carbons, while small particles at high temperatures favor CNOs deposition.
Because CNO would encapsulate the active metal phase, Cornejo et al. [97] indicated that support-free catalysts are more suitable to produce CNOs in the CDM process since they can simplify the subsequent separation steps. A stainless steel catalyst Fe-Cr was treated with distilled water and then calcined in air to form metal oxides with cracking activity [97]:
Fe x Cr y + O 2 + H 2 O Fe x Cr y O z OH t Reduction Fe x Cr 2 x
Fe x Cr 2 x + CH 4 Fe 2 CrC + H 2
Because the mesh structure can provide a relatively high number of active sites on catalysts, the methane conversion rate remained at 80% for tens of hours. From TEM observation, most CNOs contained encapsulated alloy particles at the center. To ensure the purity of CNOs, subsequent oxidation and acid pickling steps were used to separate the catalysts from the outer graphitic shell, as shown in Figure 24. Another non-supported catalyst reported by Pudukudy et al. [41] consisted of 50% Ni-50% Fe alloy particles. In CDM experiments between 700–900 °C, CNOs were the dominant carbon deposition structure and co-existed with multi-layered graphene sheets. The maximum carbon yield obtained at 900 °C was approximately 8 gC/gcat with a high degree of graphitization. CNO has excellent biocompatibility and biosafety, which makes it valuable in the biomedical field. It is not only the ideal drug delivery carrier but also can be used to restore or improve the biological function of tissues [98]. CNOs also play an important role in supercapacitors that benefit from good volumetric capacitance (~63 F/cm−3) and high packing density (~0.89 g/cm−3) [99].

5. Catalyst Recovery Methods

Recovery of the catalysts’ activity online is the major challenge for continuous hydrogen production in the catalytic decomposition of methane (CDM). The activity of metal-based catalysts is mainly affected by coking, which means excessive carbon deposition blocks the catalyst’s active sites. Before catalyst deactivation, there is an equilibrium between carbon production rate and carbon diffusion rate through catalyst pores. When the reaction rate increases, the balance above is broken. Carbons exceeding solubility begin to deposit on the active sites and gradually reduce the methane conversion rate. Generally, catalysts with higher carbon diffusion capacities and lower carbon solubilities have more stable activity in the CDM process at high temperatures [19].
The process of activity recovery of specific catalysts consists of two steps: separation and regeneration. Separating catalyst particles and deposited carbons is necessary after each CDM cycle, which removes most of the carbons accumulated on the catalyst surface and restores most of the catalyst activity combined with the hydrogen activation process. However, simple separation steps cannot remove the carbon deposited inside catalyst particles/beads. These carbons accumulate with the number of CDM cycles and eventually destroy the catalyst structure or even break up the catalyst particles/beads. Therefore, after several CDM cycles, a regeneration process is required to eliminate carbon deposited in the catalyst particles, which ensures the stability and effective lifetime of catalysts.

5.1. Separation Methods

These methods are simple, fast, and always executed after each CDM cycle. The purpose is to roughly remove carbon deposits from catalyst particles and restore catalyst activity as much as possible in the next cycle.
One of the most common methods used in industry is physical shaking. By shaking or rolling the reactor, the carbon filaments grown from the catalyst surface detach and drop to the bottom of the reactor for extraction. Postels et al. [100] proposed use of a liquid-metal reactor to improve the carbon separation step in the CDM reaction. Due to the difference in densities, carbons accumulate above the liquid tin surface, which do not block the reactor and are easy to remove. Steinberg and Dong have supported this idea [101]. Through carbons skimmed off from the molten lead and copper surface in CDM experiments, they claimed such a method is of high scalability potential for commercialization.

5.2. Regeneration Methods

Besides the separation process, additional regeneration steps are required after a few CDM cycles to restore catalyst activity. There are two different catalyst regeneration methods commonly found in the literature: air regeneration and steam regeneration.
The air regeneration process can be summarized by the carbon oxidation equation below [11]:
C + O 2 CO 2 ,     Δ H 1073 K = 174.5   kJ / mol
Zhang and Amiridis [37] regenerated spent 16.4% Ni/SiO2 catalysts by the air oxidation method at 550 °C. They proved that the air oxidation method could regenerate the catalyst wholly and quickly, but the high operating temperature disintegrated catalysts into a fine powder. Rahman et al. [102] referred to similar results and attributed the catalyst activity losses to the destruction of the porous structure by internal carbon filament growth in the previous CDM cycle. Furthermore, Otsuka et al. [103] tested the air regeneration performance of Ni-based and Ni-Pd-based catalysts. They indicated that high operating temperatures enhanced catalyst circulation rates but could also cause sintering issues that reduced the specific surface area of catalysts.
Another method of catalyst regeneration is called steam regeneration, which provides a more uniform temperature distribution of the catalyst bed layer to avoid particle sintering. The detailed steps are as follows [11]:
C + H 2 O CO + H 2 ,     Δ H 1073 K = 135.9   kJ / mol
Zhang and Amiridis [37] also used the steam regeneration method to recover the activity of 16.4% Ni/SiO2 catalysts at 550 °C. The XRD results showed that regained catalysts kept the Ni metallic form, but carbon removal efficiency was slightly lower than air regeneration. Aiello et al. [104] tested the steam regeneration performance of 15% Ni/SiO2 at 650 °C and found no considerable loss in catalytic performance after 10 cycles. Although there remained small pockets of carbon, the structure of Ni did not change, since only trace amounts of NiO were detected.

6. Challenges and Perspectives of CDM Hydrogen Generation Method

Currently, the catalytic decomposition of methane (CDM) process faces two main obstacles: the high cost of hydrogen production, and unstable catalyst activity. Limited by immature regeneration methods, researchers are trying to improve the economic benefits of CDM by optimizing the structure and yield of carbon depositions. According to the experimental results described in this review, octopus-shaped carbon nanofibers (OCNFs) can achieve the highest carbon deposition yield in a single cycle (~600 gC/gcat). However, OCNFs are consistently formed at low temperatures, and are mainly composed of carbon black. If one is to synthesize high-value carbon nanotubes or graphitic carbons in the CDM reaction, higher reaction temperatures and specific catalysts are required. Since the excessive cracking rates at high temperatures are contrary to maintaining stable catalyst activity, some inert alloy elements (such as Cu) are included in the active metal phase to extend the catalysts’ lifetime.
Catalyst regeneration methods are also being constantly improved with good progress. As mentioned in the previous section, the air regeneration method has high efficiency and lower cost in removing carbon depositions, but it emits more CO/CO2 gases causing environmental stress. The steam regeneration method can generate additional hydrogen and avoid sintering issues, but it takes more time to complete. Both methods restore the catalyst activity by converting carbon deposits to COx, which loses the opportunity to use the carbon by-products with potential values to compensate for hydrogen production costs. In addition, although physical carbon removal methods (such as shaking or rotating the reactor) are helpful to extract the carbon by-products, they cannot solve the problem of carbon deposited inside the catalyst particles, which leads to a significant reduction in catalyst activity in subsequent cycles. Therefore, finding a valid catalyst regeneration method to guarantee continuous hydrogen generation in the CDM process has become a challenge in balancing cost and environmental impact.

7. Conclusions

In conclusion, catalytic decomposition of methane (CDM) is a promising method to produce high purity hydrogen without COx emission. The mainstream metal-based catalysts (Ni, Co, and Fe) are reviewed in this paper. The overall process involved two steps: methane cracking and carbon filament growth. The cracking step mechanism includes dissociative and non-dissociative adsorption of methane. In both, methane molecules undergo a series of dehydrogenation steps until the dissolved state carbon and hydrogen gas are formed. The main differences between the two mechanisms are whether the adsorbed methane can be observed, and the timing of the first C-H bond breaking. Subsequently, dissolved carbons diffuse through the surface and interior of the metallic phase driven by temperature and concentration gradients. Depending on the magnitude of interphase forces, two types of carbon filament growth mechanisms occur, namely, tip growth and base growth are observed. The catalysts that follow the base growth mechanism are more easily reactivated. Although their activity is relatively weak, carbon filaments easily fall off under strong interphase forces. Combining the base growth mechanism with physical carbon removal methods, it is possible to achieve continuous production of turquoise hydrogen with a promising future.
To compensate for the high hydrogen production cost of the CDM method, researchers are trying to maximize the potential economic benefits of carbon by-products. The deposited carbon produced in methane cracking is usually formed in a mixture. In addition to carbon filaments, it may form bamboo-shaped carbon nanotubes (BCNTs), octopus-shaped carbon nanofibers (OCNFs), and carbon nano-onions (CNOs) under specific conditions. After summarizing their formation mechanisms, yield, and application fields, it has been found that the economic value and output of carbon by-products have opposite trends. Carbon encapsulation is also an issue related to catalyst regeneration. Existing regeneration methods (using air and steam) inevitably convert carbon by-products into COx gas when recovering catalyst activity, which is counter to the claim of CDM being an CO2 free hydrogen production technology. If the CDM technology were able to overcome the above-mentioned issues, it would potentially be a bridge towards a hydrogen economy.

Author Contributions

Conceptualization, S.T. and S.H.C.; Methodology, S.T. and B.M.; Resources, S.T., B.M. and L.Z.; Writing—original draft preparation, S.T.; Visualization: B.M.; Writing—review and editing, S.T., B.M. and S.H.C.; Supervision, S.H.C. All authors have read and agreed to the published version of the manuscript.

Funding

This research was funded by Singapore Energy Centre, NTUitive (NTUitive is Nanyang Technological University’s innovation and enterprise company). And the APC was funded by the Key R &D Plan Project of Zhejiang Province (2021C01099).

Acknowledgments

The authors would like to extend their appreciation to Singapore Energy Centre, NTUitive (NTUitive is Nanyang Technological University’s innovation and enterprise company) and the Key R & D Plan Project of Zhejiang Province (2021C01099) for their generous funding support.

Conflicts of Interest

The authors declare no conflict of interest.

Abbreviations

CDMCatalyst decomposition of methane
SMRSteam gas reforming
CCSCarbon capture and sequestration technology
WGSWater-gas shifting units
HREELSHigh-resolution electron energy loss spectroscopy
XPSX-ray photoelectron spectroscopy
DFTDensity-functional theory
LEEDLow energy electron diffraction
AESAuger electron spectroscopy
EDSEnergy-dispersive X-ray spectroscopy
TPRTemperature-programmed reduction
CNTsCarbon nanotubes
BCNTsBamboo-shaped carbon nanotubes
OCNFsOctopus-shaped carbon nanofibers
CNOsCarbon nano-onions

Appendix A. Parametric Study between Various Hydrogen Generation Methods

Table A1. Summary table of parameters of various hydrogen production methods.
Steam Methane Reforming (SMR)Catalytic Decomposition of Methane (CDM)Autothermal Reforming (ATR)Dry Reforming of Methane (DRM)Partial Oxidation (POX)Coal GasificationWater ElectrolysisPhotovoltaics-Based Electrolysis
Technical matureIndustrializedLab stageIndustrializedLab stageIndustrializedIndustrializedLab stageLab stage
Energy efficiency65–75% [105]~55%40–45% [106]~60% [107]46.8% [108]70.4–87.1% (Dep on coal type) [109]~80% [110]42% (theoretical max); 8–14% (currently) [111]
Energy required for per mole hydrogen (kJ/mol)41.2137.4−18 to 68.72 [112]123.5−5.65Complex steps [113]286 [114]286 [114]
Reaction temperature (°C)700–1000500–800900–1100600–950 [115]550–1258 (non-catalysts); 300–800 (with catalysts) [116]≥700Room temperature or 700–1000 (for steam)25–65 [117]
Reaction Pressure (bar)3–251.01330–80 [118]~1.0138 [119]5–141.013 or high pressure (120–200)1.013
By-productsCO, CO2 & Sulfide (trace)Solid carbon, CO & CO2 (trace)CO & CO2Solid carbon, CO & CO2 (trace)Solid carbon, CO & CO2 (trace)coke, coal tar, sulfur and ammoniaNoneNone
CO2 emission (kg CO2/kg H2)7Can be negligible~3 [120]2.34 [121] 18–20 [122]Can be negligibleCan be negligible
Catalyst lifetimeStableRegeneration cycle requiredStableUnstableUnstable---
Cost ($/kg)2.08–2.27 [123]Depend on catalysts1.48 [124]Depend on catalystsExpensive (due to pure oxygen) [108]1.34–1.63 [123]410.36 [123]

References

  1. Delbeke, J.; Runge-Metzger, A.; Slingenberg, Y.; Werksman, J. The paris agreement. In Towards a Climate-Neutral Europe Curbing Trend; Routledge: London, UK, 2019; pp. 24–45. Available online: http://hdl.handle.net/1814/65859 (accessed on 28 February 2022).
  2. Nationally Determined Contributions (NDCs). United Nations Climate Change 2020. Available online: https://unfccc.int/process-and-meetings/the-paris-agreement/nationally-determined-contributions-ndcs/nationally-determined-contributions-ndcs (accessed on 21 December 2021).
  3. World Energy Council. World Energy Trilemma Index. 2021. Available online: https://www.worldenergy.org/transition-toolkit/world-energy-trilemma-index (accessed on 28 February 2022).
  4. World Energy Council. Energy Trilemma Index for Singapore. 2020. Available online: https://trilemma.worldenergy.org/#!/country-profile?country=Singapore&year=2021 (accessed on 21 December 2021).
  5. IEA. The Future of Hydrogen: Seizing Today’s Opportunities; OECD: Paris, France, 2019. [Google Scholar] [CrossRef]
  6. Kakoulaki, G.; Kougias, I.; Taylor, N.; Dolci, F.; Moya, J.; Jäger-Waldau, A. Green hydrogen in Europe—A regional assessment: Substituting existing production with electrolysis powered by renewables. Energy Convers. Manag. 2020, 228, 113649. [Google Scholar] [CrossRef]
  7. Howarth, R.W.; Jacobson, M.Z. How green is blue hydrogen? Energy Sci. Eng. 2021, 9, 1676–1687. [Google Scholar] [CrossRef]
  8. FSR. Between Green and Blue: A debate on Turquoise Hydrogen. In Florence School of Regulation; EUI: Florence, Italy, 2021; Available online: https://fsr.eui.eu/between-green-and-blue-a-debate-on-turquoise-hydrogen/ (accessed on 28 February 2022).
  9. Barelli, L.; Bidini, G.; Gallorini, F.; Servili, S. Hydrogen production through sorption-enhanced steam methane reforming and membrane technology: A review. Energy 2008, 33, 554–570. [Google Scholar] [CrossRef]
  10. Simpson, A.P.; Lutz, A.E. Exergy analysis of hydrogen production via steam methane reforming. Int. J. Hydrogen Energy 2007, 32, 4811–4820. [Google Scholar] [CrossRef]
  11. Amin, A.M.; Croiset, E.; Epling, W. Review of methane catalytic cracking for hydrogen production. Int. J. Hydrogen Energy 2011, 36, 2904–2935. [Google Scholar] [CrossRef]
  12. Song, C.; Liu, Q.; Ji, N.; Kansha, Y.; Tsutsumi, A. Optimization of steam methane reforming coupled with pressure swing adsorption hydrogen production process by heat integration. Appl. Energy 2015, 154, 392–401. [Google Scholar] [CrossRef]
  13. Sánchez-Bastardo, N.; Schlögl, R.; Ruland, H. Methane Pyrolysis for CO2-Free H2 Production: A Green Process to Overcome Renewable Energies Unsteadiness. Chem. Ing. Tech. 2020, 92, 1596–1609. [Google Scholar] [CrossRef]
  14. Chakraborty, A.; Saha, B.B.; Koyama, S.; Ng, K.C.; Yoon, S.H. Thermodynamic trends in the uptake capacity of porous adsorbents on methane and hydrogen. Appl. Phys. Lett. 2008, 92, 90–93. [Google Scholar] [CrossRef]
  15. Banu, A.; Bicer, Y. Review on COx-free hydrogen from methane cracking: Catalysts, solar energy integration and applications. Energy Convers. Manag. X 2021, 12, 100117. [Google Scholar] [CrossRef]
  16. Maag, G.; Zanganeh, G.; Steinfeld, A. Solar thermal cracking of methane in a particle-flow reactor for the co-production of hydrogen and carbon. Int. J. Hydrogen Energy 2009, 34, 7676–7685. [Google Scholar] [CrossRef]
  17. Lumbers, B.; Agar, D.W.; Gebel, J.; Platte, F. Mathematical modelling and simulation of the thermo-catalytic decomposition of methane for economically improved hydrogen production. Int. J. Hydrogen Energy 2022, 47, 4265–4283. [Google Scholar] [CrossRef]
  18. Hu, Y.; Zhang, J.; Shen, T.; Lu, Y.; Chen, K.; Tu, Z.; Lu, S.; Wang, D. A Low-Temperature Carbon Encapsulation Strategy for Stable and Poisoning-Tolerant Electrocatalysts. Small Methods 2021, 5, 2100937. [Google Scholar] [CrossRef] [PubMed]
  19. Msheik, M.; Rodat, S.; Abanades, S. Methane cracking for hydrogen production: A review of catalytic and molten media pyrolysis. Energies 2021, 14, 3107. [Google Scholar] [CrossRef]
  20. Soltani, R.; Rosen, M.A.; Dincer, I. Assessment of CO2 capture options from various points in steam methane reforming for hydrogen production. Int. J. Hydrogen Energy 2014, 39, 20266–20275. [Google Scholar] [CrossRef]
  21. Lee, M.B.; Yang, Q.Y.; Ceyer, S.T. Dynamics of the activated dissociative chemisorption of CH4 and implication for the pressure gap in catalysis: A molecular beam-high resolution electron energy loss study. J. Chem. Phys. 1987, 87, 2724–2741. [Google Scholar] [CrossRef]
  22. Fuhrmann, T.; Kinne, M.; Whelan, C.M.; Zhu, J.F.; Denecke, R.; Steinrück, H.P. Vibrationally resolved in situ XPS study of activated adsorption of methane on Pt(111). Chem. Phys. Lett. 2004, 390, 208–213. [Google Scholar] [CrossRef]
  23. Oakes, D.J.; Newell, H.E.; Rutten, F.J.M.; McCoustra, M.R.S.; Chesters, M.A. The chemistry of simple alkyl species on Pt(111) generated by hyperthermal collisions. J. Vac. Sci. Technol. A Vac. Surf. Film. 1996, 14, 1439–1447. [Google Scholar] [CrossRef]
  24. Salam, M.A.; Abdullah, B. Catalysis mechanism of Pd-promoted γ-alumina in the thermal decomposition of methane to hydrogen: A density functional theory study. Mater. Chem. Phys. 2017, 188, 18–23. [Google Scholar] [CrossRef]
  25. Zavarukhin, S.G.; Kuvshinov, G.G. The kinetic model of formation of nanofibrous carbon from CH4-H2 mixture over a high-loaded nickel catalyst with consideration for the catalyst deactivation. Appl. Catal. A Gen. 2004, 272, 219–227. [Google Scholar] [CrossRef]
  26. Borghei, M.; Karimzadeh, R.; Rashidi, A.; Izadi, N. Kinetics of methane decomposition to COx-free hydrogen and carbon nanofiber over Ni-Cu/MgO catalyst. Int. J. Hydrogen Energy 2010, 35, 9479–9488. [Google Scholar] [CrossRef]
  27. Ashik, U.P.M.; Daud, W.M.A.W.; Abbas, H.F. Production of greenhouse gas free hydrogen by thermocatalytic decomposition of methane—A review. Renew. Sustain. Energy Rev. 2015, 44, 221–256. [Google Scholar] [CrossRef] [Green Version]
  28. Grabke, H.J. Evidence on the surface concentration of carbon on gamma iron from the kinetics of the carburization in CH4-H2. Metall. Trans. 1970, 1, 2972–2975. [Google Scholar] [CrossRef]
  29. Grabke, H.J. Die Kinetik der Entkohlung und Aufkohlung. Ber. Bunsenges. Phys. Chem. 1965, 69, 409–414. [Google Scholar] [CrossRef]
  30. Tait, S.L.; Dohnálek, Z.; Campbell, C.T.; Kay, B.D. Methane adsorption and dissociation and oxygen adsorption and reaction with CO on Pd nanoparticles on MgO(1 0 0) and on Pd(1 1 1). Surf. Sci. 2005, 591, 90–107. [Google Scholar] [CrossRef]
  31. Hamza, A.V.; Steinruck, H.P.; Madix, R.J. The dynamics of the dissociative adsorption of methane on Pt(533). J. Chem. Phys. 1987, 118, 3334–3341. [Google Scholar] [CrossRef]
  32. Mullins, C.B.; Weinberg, W.H. Dynamics of the interaction of ethane with Ir(110)-(1×2). J. Vac. Sci. Technol. A Vac. Surf. Film. 1990, 8, 2458–2462. [Google Scholar] [CrossRef]
  33. Broclawik, E.; Haber, J.; Endou, A.; Stirling, A.; Yamauchi, R.; Kubo, M.; Miyamoto, A. Electronic structure and adsorption properties of precious metals and their oxides: Density functional calculations. J. Mol. Catal. A Chem. 1997, 119, 35–44. [Google Scholar] [CrossRef]
  34. Snoeck, J.W.; Froment, G.F.; Fowles, M. Kinetic study of the carbon filament formation by methane cracking on a nickel catalyst. J. Catal. 1997, 169, 250–262. [Google Scholar] [CrossRef]
  35. Demicheli, M.C.; Ponzi, E.N.; Ferretti, O.A.; Yeramian, A.A. Kinetics of carbon formation from CH4-H2 mixtures on nickel-alumina catalyst. Chem. Eng. J. 1991, 46, 129–136. [Google Scholar] [CrossRef]
  36. Reshetenko, T.V.; Avdeeva, L.; Ismagilov, Z.; Pushkarev, V.; Cherepanova, S.; Chuvilin, A.; Likholobov, V. Catalytic filamentous carbon: Structural and textural properties. Carbon N. Y. 2003, 41, 1605–1615. [Google Scholar] [CrossRef]
  37. Zhang, T.; Amiridis, M.D. Hydrogen production via the direct cracking of methane over silica-supported nickel catalysts. Appl. Catal. A Gen. 1998, 167, 161–172. [Google Scholar] [CrossRef]
  38. Shen, Y.; Lua, A.C. Synthesis of Ni and Ni-Cu supported on carbon nanotubes for hydrogen and carbon production by catalytic decomposition of methane. Appl. Catal. B Environ. 2015, 164, 61–69. [Google Scholar] [CrossRef]
  39. Takenaka, S.; Serizawa, M.; Otsuka, K. Formation of filamentous carbons over supported Fe catalysts through methane decomposition. J. Catal. 2004, 222, 520–531. [Google Scholar] [CrossRef]
  40. Takenaka, S.; Ishida, M.; Serizawa, M.; Tanabe, E.; Otsuka, K. Formation of carbon nanofibers and carbon nanotubes through methane decomposition over supported cobalt catalysts. J. Phys. Chem. B 2004, 108, 11464–11472. [Google Scholar] [CrossRef]
  41. Pudukudy, M.; Yaakob, Z. Methane decomposition over Ni, Co and Fe based monometallic catalysts supported on sol gel derived SiO2 microflakes. Chem. Eng. J. 2015, 262, 1009–1021. [Google Scholar] [CrossRef]
  42. Fakeeha, A.H.; Ibrahim, A.A.; Khan, W.U.; Seshan, K.; al Otaibi, R.L.; Al-Fatesh, A.S. Hydrogen production via catalytic methane decomposition over alumina supported iron catalyst. Arab. J. Chem. 2018, 11, 405–414. [Google Scholar] [CrossRef] [Green Version]
  43. Avdeeva, L.B.; Goncharova, O.; Kochubey, D.; Zaikovskii, V.; Plyasova, L.; Novgorodov, B.; Shaikhutdinov, S. Coprecipitated Ni-alumina and Ni-Cu-alumina catalysts of methane decomposition and carbon deposition. II. Evolution of the catalysts in reaction. Appl. Catal. A Gen. 1996, 141, 117–129. [Google Scholar] [CrossRef]
  44. Zhu, X.; Cheng, D.; Kuai, P. Catalytic decomposition of methane over Ni/Al2O3 catalysts: Effect of plasma treatment on carbon formation. Energy Fuels 2008, 22, 1480–1484. [Google Scholar] [CrossRef]
  45. Li, J.; Lu, G.; Li, K.; Wang, W. Active Nb2O5-supported nickel and nickel-copper catalysts for methane decomposition to hydrogen and filamentous carbon. J. Mol. Catal. A Chem. 2004, 221, 105–112. [Google Scholar] [CrossRef]
  46. Ermakova, M.A.; Ermakov, D.Y.; Kuvshinov, G.G.; Plyasova, L.M. New nickel catalysts for the formation of filamentous carbon in the reaction of methane decomposition. J. Catal. 1999, 187, 77–84. [Google Scholar] [CrossRef]
  47. Takenaka, S.; Kobayashi, S.; Ogihara, H.; Otsuka, K. Ni/SiO2 catalyst effective for methane decomposition into hydrogen and carbon nanofiber. J. Catal. 2003, 217, 79–87. [Google Scholar] [CrossRef]
  48. Takenaka, S.; Ogihara, H.; Yamanaka, I.; Otsuka, K. Decomposition of methane over supported-Ni catalysts: Effects of the supports on the catalytic lifetime. Appl. Catal. A Gen. 2001, 217, 101–110. [Google Scholar] [CrossRef]
  49. Avdeeva, L.B.; Kochubey, D.I.; Shaikhutdinov, S.K. Cobalt catalysts of methane decomposition: Accumulation of the filamentous carbon. Appl. Catal. A Gen. 1999, 177, 43–51. [Google Scholar] [CrossRef]
  50. Ashik, U.P.M.; Daud, W.M.A.W. Probing the differential methane decomposition behaviors of n-Ni/SiO2, n-Fe/SiO2 and n-Co/SiO2 catalysts prepared by co-precipitation cum modified Stöber method. RSC Adv. 2015, 5, 67227–67241. [Google Scholar] [CrossRef]
  51. Zhou, L.; Enakonda, L.R.; Saih, Y.; Loptain, S.; Gary, D.; Del-Gallo, P.; Basset, J.-M. Catalytic Methane Decomposition over Fe-Al2O3. ChemSusChem 2016, 9, 1243–1248. [Google Scholar] [CrossRef] [PubMed]
  52. Ermakova, M.A.; Ermakov, D.Y. Ni/SiO2 and Fe/SiO2 catalysts for production of hydrogen and filamentous carbon via methane decomposition. Catal. Today 2002, 77, 225–235. [Google Scholar] [CrossRef]
  53. Kumar, M. Carbon Nanotube Synthesis and Growth Mechanism. Intech 2016, i, 13. [Google Scholar]
  54. Frusteri, F.; Italiano, G.; Espro, C.; Cannilla, C.; Bonura, G. H2 production by methane decomposition: Catalytic and technological aspects. Int. J. Hydrogen Energy 2012, 37, 16367–16374. [Google Scholar] [CrossRef]
  55. Italiano, G.; Delia, A.; Espro, C.; Bonura, G.; Frusteri, F. Methane decomposition over Co thin layer supported catalysts to produce hydrogen for fuel cell. Int. J. Hydrogen Energy 2010, 35, 11568–11575. [Google Scholar] [CrossRef]
  56. Wang, I.W.; Kutteri, D.A.; Gao, B.; Tian, H.; Hu, J. Methane Pyrolysis for Carbon Nanotubes and COx-Free H2 over Transition-Metal Catalysts. Energy Fuels 2019, 33, 197–205. [Google Scholar] [CrossRef]
  57. Shanmugam, S.; Gedanken, A. Electrochemical properties of bamboo-shaped multiwalled carbon nanotubes generated by solid state pyrolysis. Electrochem. Commun. 2006, 8, 1099–1105. [Google Scholar] [CrossRef]
  58. Chen, J.; Li, Y.; Ma, Y.; Qin, Y.; Chang, L. Formation of bamboo-shaped carbon filaments and dependence of their morphology on catalyst composition and reaction conditions. Carbon N. Y. 2001, 39, 1467–1475. [Google Scholar] [CrossRef]
  59. Saito, Y. Nanoparticles and filled nanocapsules. Carbon N. Y. 1995, 33, 979–988. [Google Scholar] [CrossRef]
  60. Saito, Y.; Yoshikawa, T. Bamboo-shaped carbon tube filled partially with nickel. J. Cryst. Growth 1993, 134, 154–156. [Google Scholar] [CrossRef]
  61. Zhao, N.Q.; He, C.; Ding, J.; Zou, T.; Qiao, Z.; Shi, C.; Du, X.; Li, J.; Li, Y. Bamboo-shaped carbon nanotubes produced by catalytic decomposition of methane over nickel nanoparticles supported on aluminum. J. Alloys Compd. 2007, 428, 79–83. [Google Scholar] [CrossRef]
  62. Lin, M.; Tan, J.P.Y.; Boothroyd, C.; Loh, K.P.; Tok, E.S.; Foo, Y.L. Dynamical observation of bamboo-like carbon nanotube growth. Nano Lett. 2007, 7, 2234–2238. [Google Scholar] [CrossRef]
  63. Lv, R.; Zou, L.; Gui, X.; Kang, F.; Zhu, Y.; Zhu, H.; Wei, J.; Gu, J.; Wang, K.; Wu, D. High-yield bamboo-shaped carbon nanotubes from cresol for electrochemical application. Chem. Commun. 2008, 17, 2046–2048. [Google Scholar] [CrossRef]
  64. González, I.; de Jesus, J.; Cañizales, E. Bamboo-shaped carbon nanotubes generated by methane thermal decomposition using Ni nanoparticles synthesized in water-oil emulsions. Micron 2011, 42, 819–825. [Google Scholar] [CrossRef]
  65. Saraswat, S.K.; Pant, K.K. Synthesis of hydrogen and carbon nanotubes over copper promoted Ni/SiO2 catalyst by thermocatalytic decomposition of methane. J. Nat. Gas Sci. Eng. 2013, 13, 52–59. [Google Scholar] [CrossRef]
  66. Li, Y.; Zhang, B.; Xie, X.; Liu, J.; Xu, Y.; Shen, W. Novel Ni catalysts for methane decomposition to hydrogen and carbon nanofibers. J. Catal. 2006, 238, 412–424. [Google Scholar] [CrossRef]
  67. Li, J.; Dong, L.; Xiong, L.; Yang, Y.; Du, Y.; Zhao, L.; Wang, H.; Peng, S. High-loaded Ni[sbnd]Cu[sbnd]SiO2 catalysts for methane decomposition to prepare hydrogen and carbon filaments. Int. J. Hydrogen Energy 2016, 41, 12038–12048. [Google Scholar] [CrossRef]
  68. Chen, J.; Li, Y.; Li, Z.; Zhang, X. Production of COx-free hydrogen and nanocarbon by direct decomposition of undiluted methane on Ni-Cu-alumina catalysts. Appl. Catal. A Gen. 2004, 269, 179–186. [Google Scholar] [CrossRef]
  69. Zhou, L.; Enakonda, L.R.; Harb, M.; Saih, Y.; Tapia, A.A.; Ould-Chikh, S.; Hazemann, J.-L.; Li, J.; Wei, N.; Gary, D.; et al. Fe catalysts for methane decomposition to produce hydrogen and carbon nano materials. Appl. Catal. B Environ. 2017, 208, 44–59. [Google Scholar] [CrossRef] [Green Version]
  70. Zhou, L.; Harb, M.; Enakonda, L.R.; Almana, N.; Hedhili, M.N.; Basset, J.M. Reverse microemulsion prepared Ni-Pt catalysts for methane cracking to produce CO:X-free hydrogen. RSC Adv. 2017, 7, 43546–43550. [Google Scholar] [CrossRef] [Green Version]
  71. Jia, Z.; Kou, K.; Qin, M.; Wu, H.; Puleo, F.; Liotta, L.F. Controllable and large-scale synthesis of carbon nanostructures: A review on bamboo-like Nanotubes. Catalysts 2017, 7, 256. [Google Scholar] [CrossRef] [Green Version]
  72. Ermakova, M.A.; Ermakov, D.Y.; Cherepanova, S.V.; Plyasova, L.M. Synthesis of ultradispersed nickel particles by reduction of high-loaded NiO-SiO2 systems prepared by heterophase sol-gel method. J. Phys. Chem. B 2002, 106, 11922–11928. [Google Scholar] [CrossRef]
  73. Monthioux, M.; Noé, L.; Dussault, L.; Dupin, J.-C.; Latorre, N.; Ubieto, T.; Romeo, E.; Royo, C.; Monzón, A.; Guimon, C. Texturising and structurising mechanisms of carbon nanofilaments during growth. J. Mater. Chem. 2007, 17, 4611–4618. [Google Scholar] [CrossRef]
  74. Muradov, N.; Chen, Z.; Smith, F. Fossil hydrogen with reduced CO2 emission: Modeling thermocatalytic decomposition of methane in a fluidized bed of carbon particles. Int. J. Hydrogen Energy 2005, 30, 1149–1158. [Google Scholar] [CrossRef]
  75. Alstrup, I. A new model explaining carbon filament growth on nickel, iron, and NiCu alloy catalysts. J. Catal. 1988, 109, 241–251. [Google Scholar] [CrossRef]
  76. Li, Y.; Li, D.; Wang, G. Methane decomposition to COx-free hydrogen and nano-carbon material on group 8–10 base metal catalysts: A review. Catal. Today 2011, 162, 1–48. [Google Scholar] [CrossRef]
  77. Dupuis, A.C. The catalyst in the CCVD of carbon nanotubes-a review. Prog. Mater. Sci. 2005, 50, 929–961. [Google Scholar] [CrossRef]
  78. Schouten, F.C.; Gijzeman, O.L.J.; Bootsma, G.A. Interaction of methane with Ni(111) and Ni(100); diffusion of carbon into nickel through the (100) surface; An aes-leed study. Surf. Sci. 1979, 87, 1–12. [Google Scholar] [CrossRef]
  79. Schouten, F.C.; Kaleveld, E.W.; Bootsma, G.A. AES-LEED-ellipsometry study of the kinetics of the interaction of methane with Ni(110). Surf. Sci. 1977, 63, 460–474. [Google Scholar] [CrossRef]
  80. Ponec, G.B.V. Catalysis by Metals and Alloys, 1st ed.; Elsevier: Amsterdam, The Netherlands, 1995; Available online: https://www.elsevier.com/books/catalysis-by-metals-and-alloys/ponec/978-0-444-89796-1 (accessed on 28 February 2022).
  81. Li, D.; Chen, J.; Li, Y. Evidence of composition deviation of metal particles of a Ni-Cu/Al2O3 catalyst during methane decomposition to COx-free hydrogen. Int. J. Hydrogen Energy 2009, 34, 299–307. [Google Scholar] [CrossRef]
  82. Pham-Huu, C.; Vieira, R.; Louis, B.; Carvalho, A.; Amadou, J.; Dintzer, T.; LeDoux, M.J. About the octopus-like growth mechanism of carbon nanofibers over graphite supported nickel catalyst. J. Catal. 2006, 240, 194–202. [Google Scholar] [CrossRef]
  83. Reshetenko, T.V.; Avdeeva, L.B.; Ismagilov, Z.R.; Chuvilin, A.L.; Ushakov, V.A. Carbon capacious Ni-Cu-Al2O3 catalysts for high-temperature methane decomposition. Appl. Catal. A Gen. 2003, 247, 51–63. [Google Scholar] [CrossRef]
  84. Takenaka, S.; Shigeta, Y.; Tanabe, E.; Otsuka, K. Methane decomposition into hydrogen and carbon nanofibers over supported Pd-Ni catalysts. J. Catal. 2003, 220, 468–477. [Google Scholar] [CrossRef]
  85. Wang, H.; Baker, R.T.K. Decomposition of methane over a Ni-Cu-MgO catalyst to produce hydrogen and carbon nanofibers. J. Phys. Chem. B 2004, 108, 20273–20277. [Google Scholar] [CrossRef]
  86. Ermakova, M.A.; Ermakov, D.Y.; Chuvilin, A.L.; Kuvshinov, G.G. Decomposition of methane over iron catalysts at the range of moderate temperatures: The influence of structure of the catalytic systems and the reaction conditions on the yield of carbon and morphology of carbon filaments. J. Catal. 2001, 201, 183–197. [Google Scholar] [CrossRef]
  87. Chesnokov, V.V.; Buyanov, R.A.; Mishakov, I.V.; Zaikovskii, V.I. Effect of zinc added to the Co/Al2O3 catalyst on the formation of carbon nanofilaments from methane and butadiene-1,3. Kinet. Catal. 2006, 47, 445–450. [Google Scholar] [CrossRef]
  88. Boretti, A. A perspective on the production of hydrogen from solar-driven thermal decomposition of methane. Int. J. Hydrogen Energy 2021, 46, 34509–34514. [Google Scholar] [CrossRef]
  89. Wang, M.J.; Gray, C.A.; Reznek, S.R.; Mahmud, K.; Kutsovsky, Y. Carbon Black. Transport 2004, 4, 21–24. [Google Scholar]
  90. Iijima, S. Direct Observation of the Tetrahedral Bonding in Graphitized Carbon Black By. J. Cryst. Growth 1980, 50, 675–683. [Google Scholar] [CrossRef]
  91. Ugarte, D. Curling and closure of graphitic networks under electron-beam irradiation. Nature 1992, 359, 707–709. [Google Scholar] [CrossRef]
  92. He, C.; Zhao, N.; Shi, C.; Du, X.; Li, J. Carbon nanotubes and onions from methane decomposition using Ni/Al catalysts. Mater. Chem. Phys. 2006, 97, 109–115. [Google Scholar] [CrossRef]
  93. Kang, J.L.; Li, J.; Du, X.; Shi, C.; Zhao, N.; Cui, L.; Nash, P. Synthesis and growth mechanism of metal filled carbon nanostructures by CVD using Ni/Y catalyst supported on copper. J. Alloys Compd. 2008, 456, 290–296. [Google Scholar] [CrossRef]
  94. Keller, M.; Matsumura, A.; Sharma, A. Spray-dried Fe/Al2O3 as a carbon carrier for COx-free hydrogen production via methane cracking in a fluidized bed process. Chem. Eng. J. 2020, 398, 125612. [Google Scholar] [CrossRef]
  95. Zhang, W.; Gao, L.; Zhang, M.; Cui, J.; Li, Y.; Gao, L.; Zhang, S. Methane catalytic cracking to make hydrogen and graphitic nano carbons (Nanotubes, Microfibers, Microballs, Onions) with zero emission. Synth. React. Inorg. Met. Nano-Met. Chem. 2014, 44, 1166–1174. [Google Scholar] [CrossRef]
  96. Liang, W.; Yan, H.; Chen, C.; Lin, D.; Tan, K.; Feng, X.; Liu, Y.; Chen, X.; Yang, C.; Shan, H. Revealing the Effect of Nickel Particle Size Decomposition Reaction. Catalysts 2020, 10, 890. [Google Scholar] [CrossRef]
  97. Cornejo, A.; Zhang, W.; Gao, L.; Varsani, R.R.; Saunders, M.; Iyer, K.S.; Raston, C.L.; Chua, H.T. Generating hydrogen gas from methane with carbon captured as pure spheroidal nanomaterials. Chem.-A Eur. J. 2011, 17, 9188–9192. [Google Scholar] [CrossRef]
  98. Ahlawat, J.; Asil, S.M.; Barroso, G.G.; Nurunnabi, M.; Narayan, M. Application of carbon nano onions in the biomedical field: Recent advances and challenges. Biomater. Sci. 2021, 9, 626–644. [Google Scholar] [CrossRef] [PubMed]
  99. Jung, S.; Myung, Y.S.; Das, G.S.; Bhatnagar, A.; Park, J.-W.; Tripathi, K.M.; Kim, T. Carbon nano-onions from waste oil for application in energy storage devices. New J. Chem. 2020, 44, 7369–7375. [Google Scholar] [CrossRef]
  100. Postels, S.; Abánades, A.; von der Assen, N.; Rathnam, R.K.; Stückrad, S.; Bardow, A. Life cycle assessment of hydrogen production by thermal cracking of methane based on liquid-metal technology. Int. J. Hydrogen Energy 2016, 41, 23204–23212. [Google Scholar] [CrossRef]
  101. Steinberg, M.; Dong, Y. Method for Convertng Natural Gas and Carbon Doxde to Methanoland Reducing Co, Emissions. U.S. Patent 5,767,165, 16 June 1998. Available online: https://patents.google.com/patent/US5767165A/en (accessed on 28 February 2022).
  102. Rahman, M.S.; Croiset, E.; Hudgins, R.R. Catalytic decomposition of methane for hydrogen production. Top. Catal. 2006, 37, 137–145. [Google Scholar] [CrossRef]
  103. Otsuka, K.; Takenaka, S.; Ohtsuki, H. Production of pure hydrogen by cyclic decomposition of methane and oxidative elimination of carbon nanofibers on supported-Ni-based catalysts. Appl. Catal. A Gen. 2004, 273, 113–124. [Google Scholar] [CrossRef]
  104. Aiello, R.; Fiscus, J.E.; Loye, H.C.Z.; Amiridis, M.D. Hydrogen production via the direct cracking of methane over Ni/SiO2: Catalyst deactivation and regeneration. Appl. Catal. A Gen. 2000, 192, 227–234. [Google Scholar] [CrossRef]
  105. Cai, L.; He, T.; Xiang, Y.; Guan, Y. Study on the reaction pathways of steam methane reforming for H2 production. Energy 2020, 207, 118296. [Google Scholar] [CrossRef]
  106. De Smet, C.R.H.; Berger, R.J.; Slaa, J.C.; Marin, G.B. Kinetic modelling of the partial oxidation of methane to syn-gas at high temperatures. Stud. Surf. Sci. Catal. 1998, 119, 825–829. [Google Scholar] [CrossRef]
  107. Snoeckx, R.; Zeng, Y.X.; Tu, X.; Bogaerts, A. Plasma-based dry reforming: Improving the conversion and energy efficiency in a dielectric barrier discharge. RSC Adv. 2015, 5, 29799–29808. [Google Scholar] [CrossRef]
  108. Dias, P.; Lopes, T.; Andrade, L.; Mendes, A. Temperature effect on water splitting using a Si-doped hematite photoanode. J. Power Sources 2014, 272, 567–580. [Google Scholar] [CrossRef] [Green Version]
  109. Ju, Y.; Lee, C.H. Evaluation of the energy efficiency of the shell coal gasification process by coal type. Energy Convers. Manag. 2017, 143, 123–136. [Google Scholar] [CrossRef]
  110. Nikolic, V.M.; Tasic, G.S.; Maksic, A.D.; Saponjic, D.P.; Miulovic, S.M.; Kaninski, M.P.M. Raising efficiency of hydrogen generation from alkaline water electrolysis—Energy saving. Int. J. Hydrogen Energy 2010, 35, 12369–12373. [Google Scholar] [CrossRef]
  111. Hydrogen and Fuel Cell Technologies Office DOE Technical Targets for Hydrogen Production from Electrolysis. In Energy Efficiency & Renewable Energy; EERE: Washington, DC, USA, 2020. Available online: https://www.energy.gov/eere/fuelcells/doe-technical-targets-hydrogen-production-electrolysis (accessed on 28 February 2022).
  112. Voitic, G.; Pichler, B.; Basile, A.; Malli, K.; Bock, S.; Hacker, V. Chapter 10—Hydrogen Production. 2018. Available online: https://www.sciencedirect.com/science/article/pii/B9780128114599000104?via%3Dihub#! (accessed on 28 February 2022).
  113. Mishra, A.; Gautam, S.; Sharma, T. Effect of operating parameters on coal gasification. Int. J. Coal Sci. Technol. 2018, 5, 113–125. [Google Scholar] [CrossRef] [Green Version]
  114. Wang, H.; Li, W.; Liu, T.; Liu, X.; Hu, X. Thermodynamic analysis and optimization of photovoltaic/thermal hybrid hydrogen generation system based on complementary combination of photovoltaic cells and proton exchange membrane electrolyzer. Energy Convers. Manag. 2019, 183, 97–108. [Google Scholar] [CrossRef]
  115. Zhang, Z.; Verykios, X.E. Carbon dioxide reforming of methane to synthesis gas over Ni/La2O3 catalysts. Appl. Catal. A Gen. 1996, 138, 109–133. [Google Scholar] [CrossRef]
  116. Konnov, A.A.; Zhu, J.N.; Bromly, J.H.; Zhang, D.K. Noncatalytic partial oxidation of methane into syngas over a wide temperature range. Combust. Sci. Technol. 2004, 176, 1093–1116. [Google Scholar] [CrossRef]
  117. Colli, A.N.; Girault, H.H.; Battistel, A. Non-precious electrodes for practical alkaline water electrolysis. Materials 2019, 12, 1336. [Google Scholar] [CrossRef] [Green Version]
  118. Copeland, R.; Gershanovich, Y.; Windecker, B. High Efficiency Syngas Generation; 2005; pp. 1–30. Available online: http://www.osti.gov/energycitations/product.biblio.jsp?osti_id=840258 (accessed on 28 February 2022).
  119. Mantripragada, H.C.; Veser, G. Chemical Looping Partial Oxidation of Methane for Co-Production of Syngas and Electricity: Process Modeling and Systems Analysis. Energy Technol. 2020, 8, 1900580. [Google Scholar] [CrossRef]
  120. Salemme, L.; Menna, L.; Simeone, M. Analysis of the energy efficiency of innovative ATR-based PEM fuel cell system with hydrogen membrane separation. Int. J. Hydrogen Energy 2009, 34, 6384–6392. [Google Scholar] [CrossRef]
  121. Er-rbib, H.; Bouallou, C.; Werkoff, F. Dry reforming of methane—Review of feasibility studies. Chem. Eng. Trans. 2012, 29, 163–168. [Google Scholar] [CrossRef]
  122. Irfan, M.F.; Usman, M.R.; Kusakabe, K. Coal gasification in CO2 atmosphere and its kinetics since 1948: A brief review. Energy 2011, 36, 12–40. [Google Scholar] [CrossRef]
  123. Kayfeci, M.; Keçebaş, A.; Bayat, M. Solar Hydrogen Production | ScienceDirect. 2019. Available online: https://www.sciencedirect.com/book/9780128148532/solar-hydrogen-production (accessed on 28 February 2022).
  124. Kalamaras, C.M.; Efstathiou, A.M. Hydrogen Production Technologies: Current State and Future Developments. Conf. Pap. Energy 2013, 2013, 690627. [Google Scholar] [CrossRef] [Green Version]
Figure 1. Three stages of hydrogen production.
Energies 15 02573 g001
Figure 2. The general process of steam methane reforming [9].
Energies 15 02573 g002
Figure 3. The general process of catalytic decomposition of methane to produce hydrogen [15]. 1—Fluidized bed reactor, 2—Heater, 3—Gas separation unit, 4—Grinder.
Energies 15 02573 g003
Figure 4. Schematic diagram of the methane dissociative adsorption mechanism model.
Energies 15 02573 g004
Figure 5. (a) HREEL spectrum after CH4 decomposition on Ni (111) surface [21]. (b) Spectra collected on Pt (111) surface to a methane molecular beam (T = 1073 K, seeding ratio: 5% CH4 in He) [22].
Energies 15 02573 g005
Figure 6. DFT model of progressive catalytic methane cracking on Ni/Al2O3 (001) surface (I means the concentration of vacant sites.) [24].
Energies 15 02573 g006
Figure 7. Schematic diagram of the methane non-dissociative absorption mechanism model.
Energies 15 02573 g007
Figure 8. (a) Initial dissociative adsorption probability for C1-C4 alkane as a function of translational energy on the Ir(110) surface at 970 K [31]. (b) Initial dissociative sticking probability vs. surface temperature of methane on the Ir(110) surface [31].
Energies 15 02573 g008
Figure 9. The optimum state of adsorbed methane on Pd2 catalyst surface (bridge model) with related bond energy data [33].
Energies 15 02573 g009
Figure 10. Schematic diagram of the “tip-growth” mechanism of carbon filament [11].
Energies 15 02573 g010
Figure 11. (a) FESEM image of carbon fibers deposited over Ni/SiO2 [41]; (b) FESEM image of carbon fibers formed over Fe/Al2O3 [42].
Energies 15 02573 g011
Figure 12. (a) Carbon filaments followed the “tip growth” mechanism, in which catalyst is enclosed at the tip of the carbon filament; (b) Carbon filaments followed the “base growth” mechanism, in which catalyst remains at the bottom of the growing carbon [53].
Energies 15 02573 g012
Figure 13. (A) SEM image of the “base growth” mechanism for low-loaded Co-based catalyst. (B) SEM image “tip growth” mechanism for high-loaded Co-based catalyst [54].
Energies 15 02573 g013
Figure 14. Typical bamboo-shaped carbon nanotubes from the CDM process under SEM [58].
Energies 15 02573 g014
Figure 15. Pushing growth mechanism of BCNTs formation [59].
Energies 15 02573 g015
Figure 16. (a) TEM images of BCNTs with complete knots. (b) TEM images of BNCTs with incomplete knots [62].
Energies 15 02573 g016
Figure 17. (af) A series of TEM images showing the formation BCNTs with incomplete knots within a 6 s interval [62].
Energies 15 02573 g017
Figure 18. Typical octopus-shaped carbon nanofibers from the CDM process under SEM [73].
Energies 15 02573 g018
Figure 19. Schematic diagram of OCNFs’ formation during methane cracking process [81]. (A) Adsorption of methane molecules on catalyst particles; (B) The formation of nuclei and hydrogen release. (C) OCNFs’ growing from one metal particle.
Energies 15 02573 g019
Figure 20. (A) Octopus-shaped carbon filaments (OCNFs) deposited on the catalyst. (B) The central zoomed catalyst particle observed by SEM [82].
Energies 15 02573 g020
Figure 21. Schematic diagram of the growth mechanism of CNOs. (A) CNOs contain metal particle core. (B) CNOs with an empty core [92].
Energies 15 02573 g021
Figure 22. Schematic diagram of another growth mechanism of CNOs. (1) CNOs with the metal core. (2) CNOs with an empty core [93].
Energies 15 02573 g022
Figure 23. Carbon nano onions deposited on the deactivated catalyst surface in the CDM process [94].
Energies 15 02573 g023
Figure 24. Formation and purification model steps of CNOs [97].
Energies 15 02573 g024
Publisher’s Note: MDPI stays neutral with regard to jurisdictional claims in published maps and institutional affiliations.

