
Phase Change Cooling of a Metal Hydride Reactor for Rapid Hydrogen Absorption

Abstract
:1. Introduction
2. System Configuration
Reactor Specifications
3. Mathematical Modeling
- The thermal and physical properties of the metal hydride are constant within the operating temperature and pressure range.
- There is no pressure ramp at the beginning of the simulations. Pressure is instantaneously brought to 280 bar and remains constant during the reaction to simulate a charging station that has a fixed pressure.
- Heat transfer occurs only in the heat exchanger within the reactor. There is no convection or radiation at the outer shell of the reactor (it is insulated).
- Contact resistance between the metal hydride and the heat exchanger fins/tubes is assumed to be negligible since the volume changes associated with cycling are ignored. This study aims to optimize the heat exchanger and does not account for contact resistance because it can be reduced using catalysts, material additions [23].
4. H2 Adsorption and Heat Transfer Simulations
5. Pumping Power Calculation
6. Conclusions
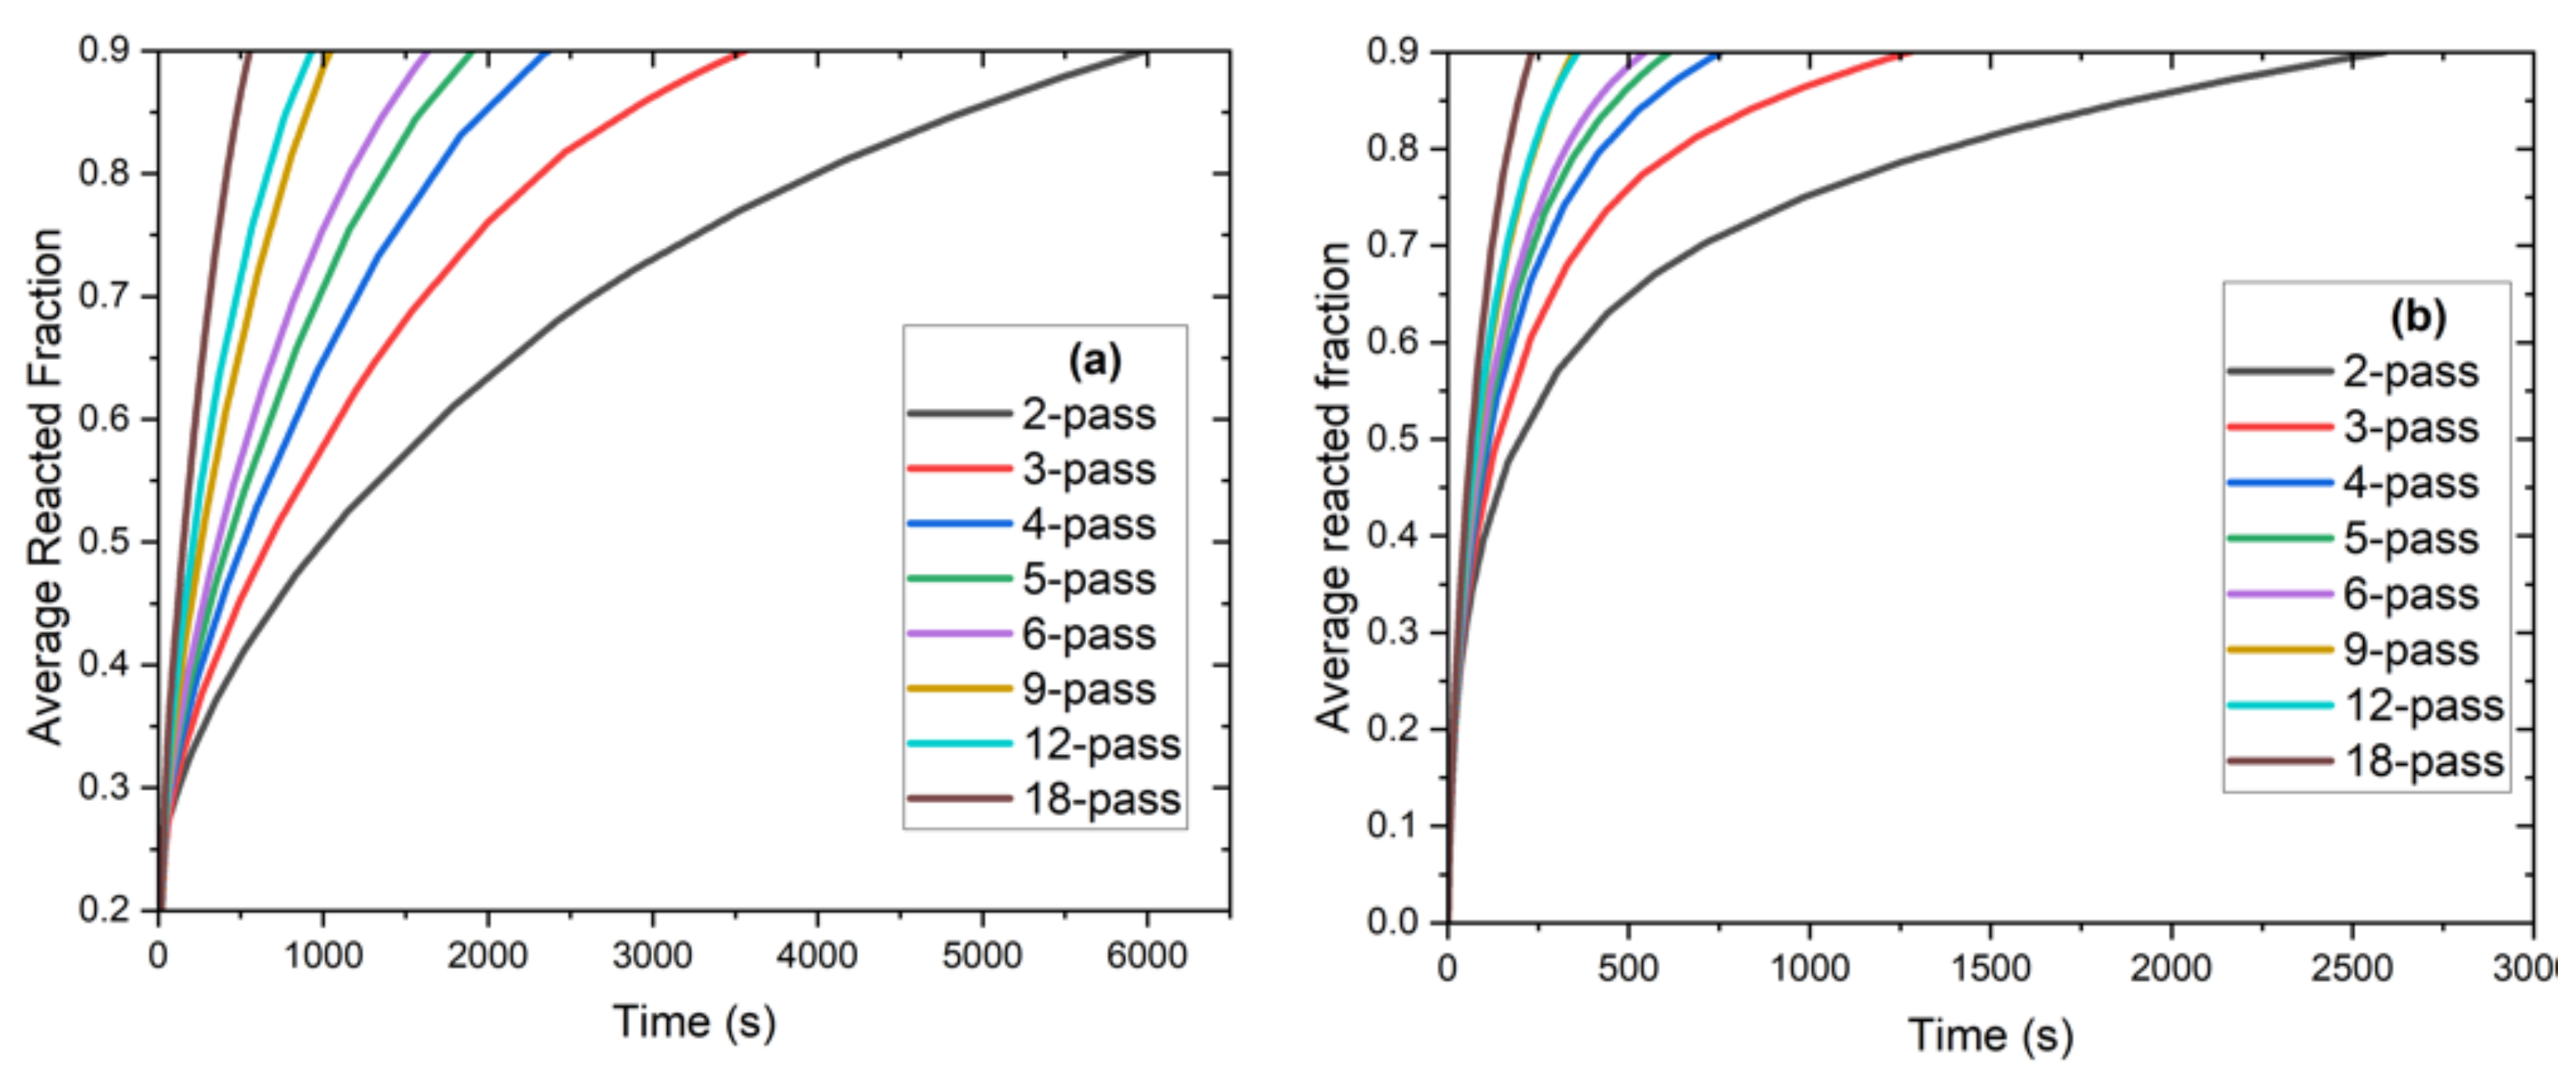
- An increased charging rate was observed in the finned tube configuration compared to the tube-only configurations due to the reduced average distance to the heat exchange tubes. Furthermore, the stagnated charging rate was observed at a higher average reacted fraction.
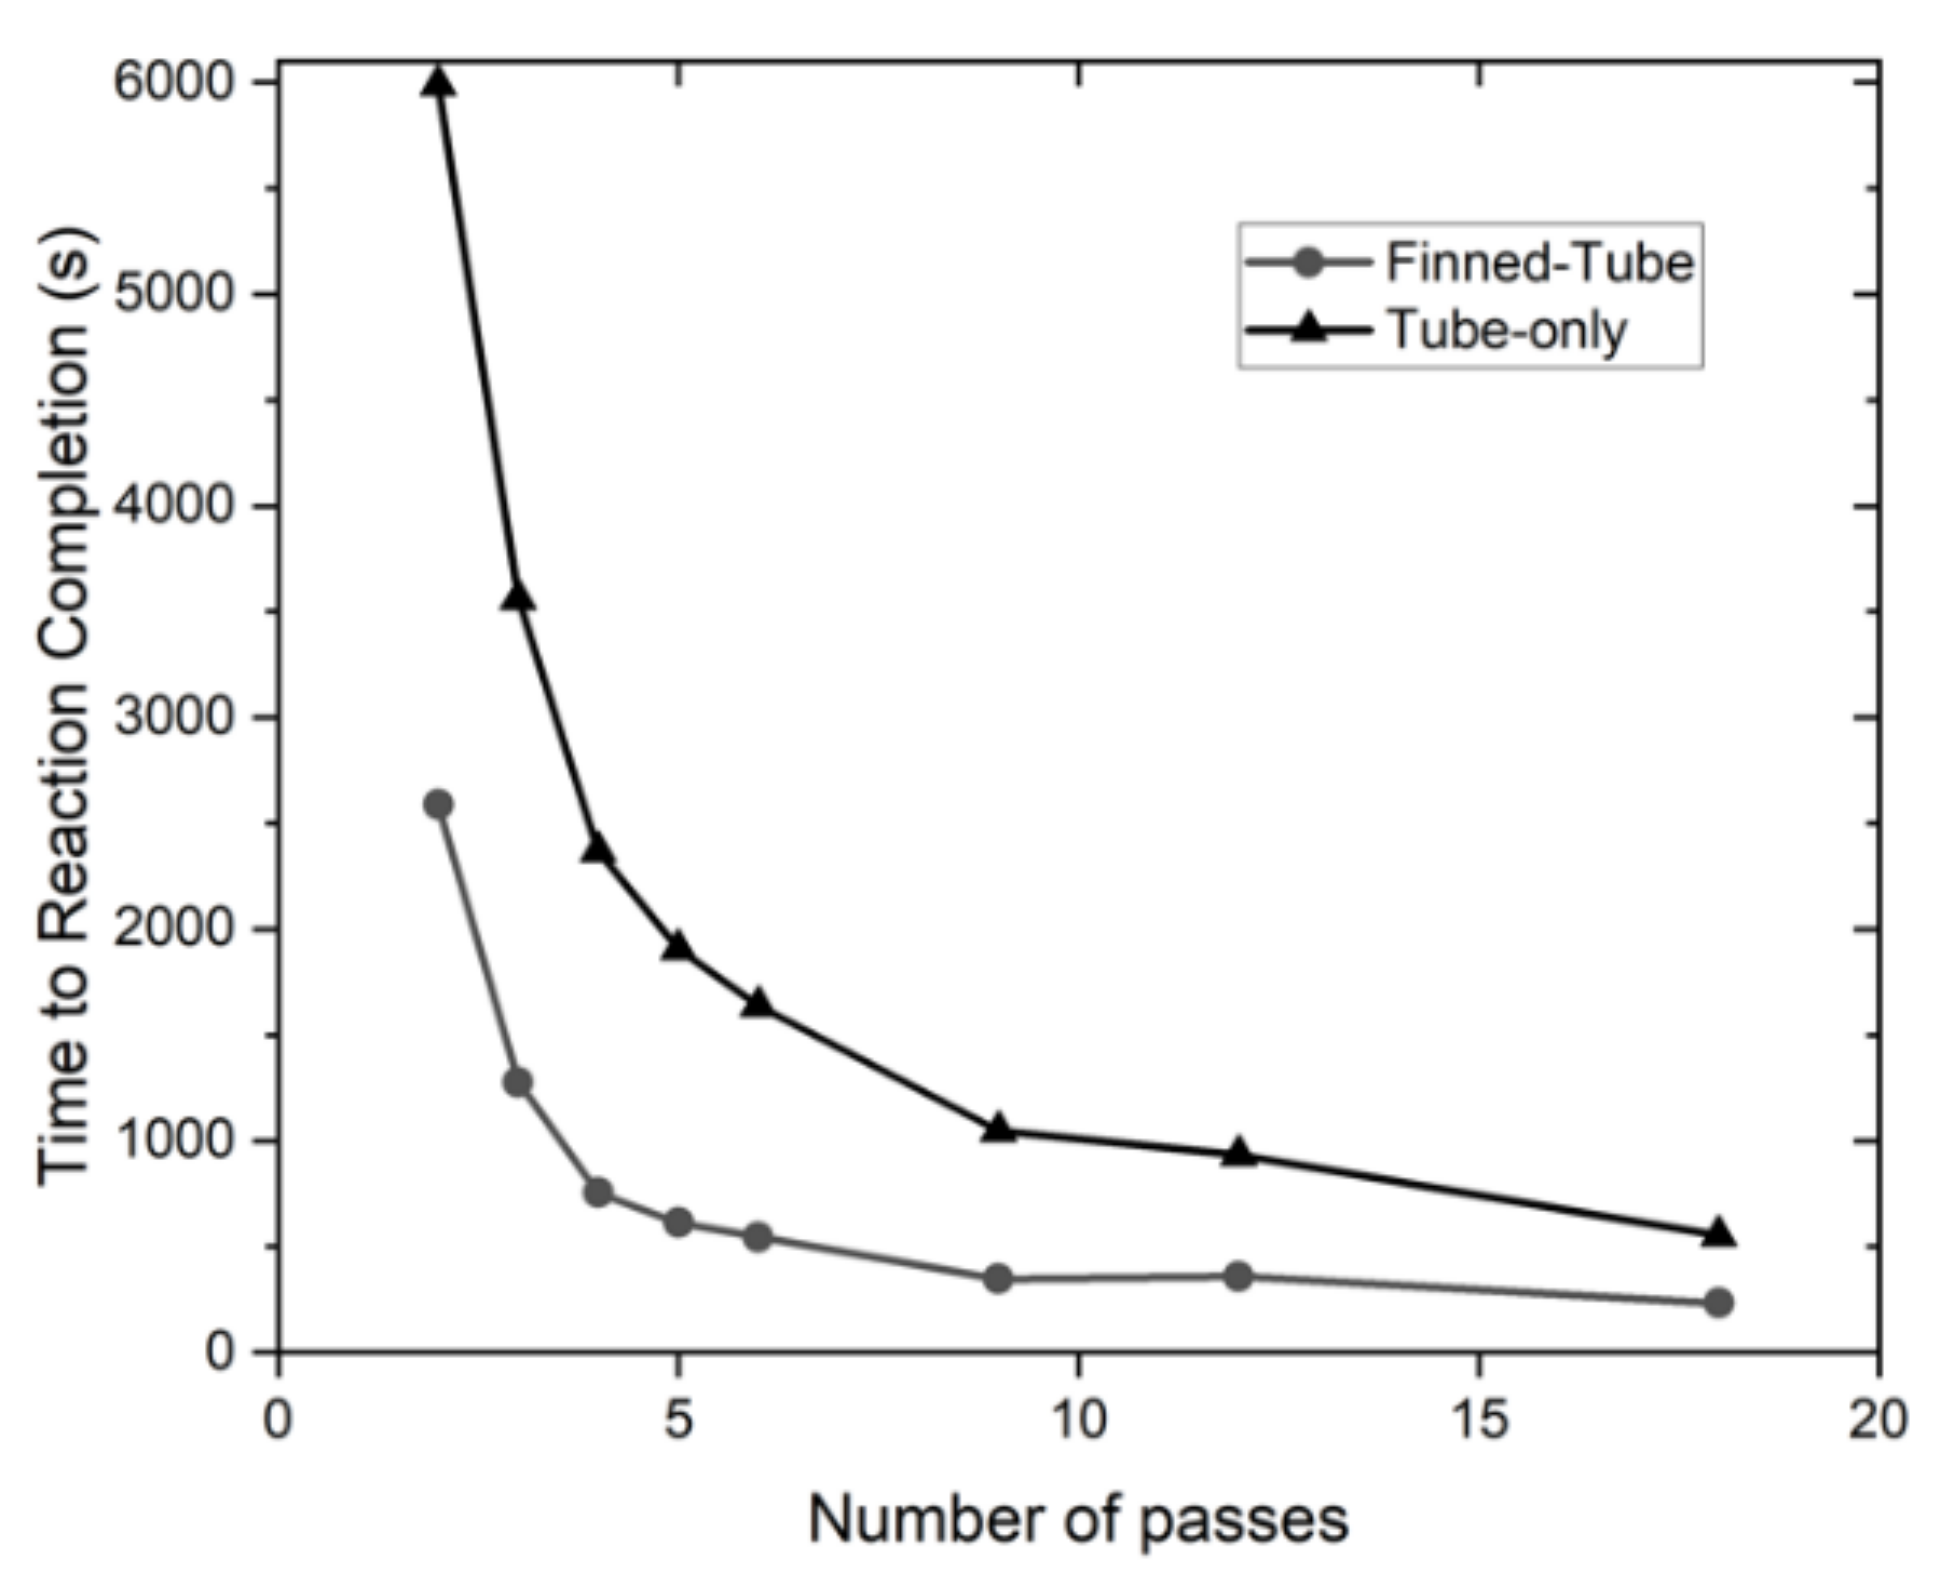
- From Figure 8, it is evident that as the number of passes increases, the charge time decreases rapidly until the 5-pass heat exchanger; additionally, a further decrease in the charge time becomes less substantial with additional tubes.
- A significant decrease in charging time was achieved by adding fins that amount to 56% to 68% lower charging time compared to the tube-only configurations; the results show 6-, 9,- and 12-pass heat exchangers (finned tube configuration) to record less than 10 min of charging time. The 9-pass configuration has a charge time of roughly 6 min. Further, adding more tubes with fins decreases the charge time due to the reduced distance between the hydride and the heat exchanger.
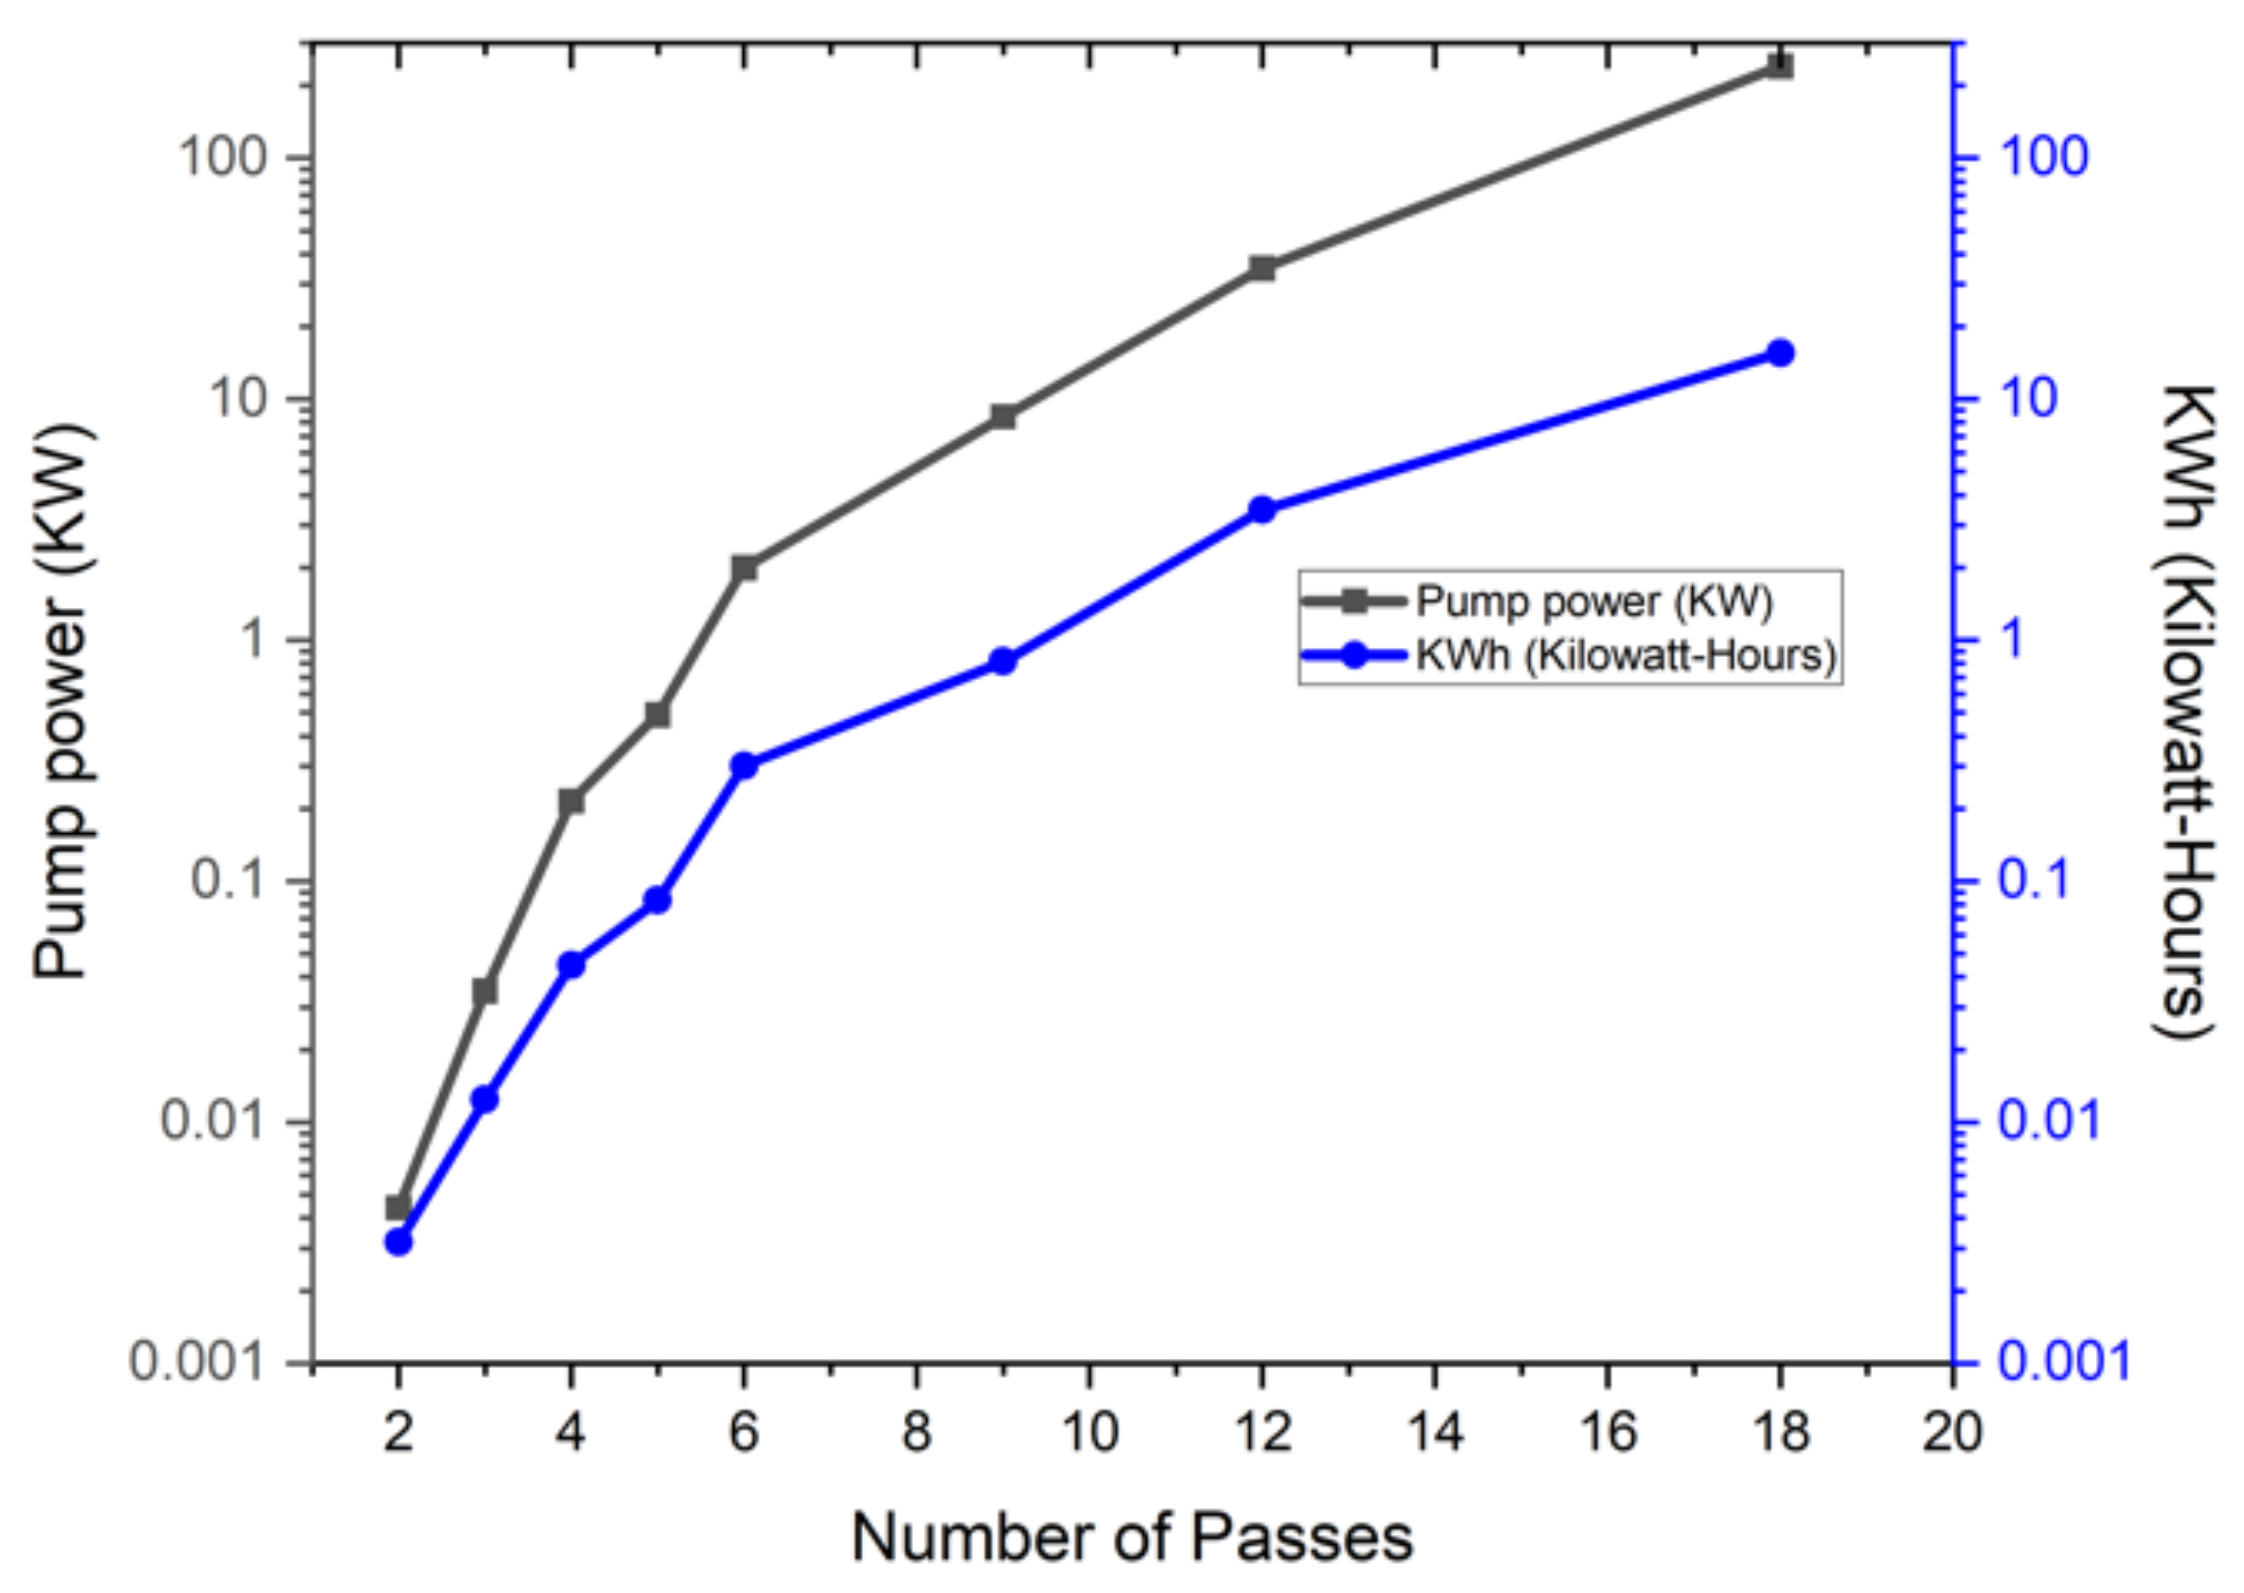
- From the pumping power calculations, the energy requirement above 9 passes were unreasonably high for a hydrogen fueling application. Maintaining a lower energy requirement is beneficial for the cost and durability of the system components.
Author Contributions
Funding
Institutional Review Board Statement
Informed Consent Statement
Conflicts of Interest
Nomenclature
| A | Area (m2) |
| C | Pressure gradient multiplier coefficient |
| Ca | Hydriding constant (1/s) |
| cp | Specific heat at constant pressure (J/kg-K) |
| D | Reactor diameter (m) |
| Ea | Activation energy for hydriding reaction (J/mol-H2) |
| Ff | Fraction of reaction completionFriction factor |
| G | Mass flux (kg/m2-s) |
| h | Heat transfer coefficient (W/m2-K) |
| i | Index for heat transfer tubes |
| k | Thermal conductivity (W/m K) |
| K | Resistance Coefficient |
| L | Reactor length (m) |
| m | Mass (kg) |
| Mass flow rate (kg/s) | |
| MW | Molecular weight (g/mol) |
| n | Total for index of heat transfer tubes |
| P | Pressure (bar) |
| Peq | Equilibrium pressure (Pa) |
| Po | Atmospheric pressure (Pa) |
| Heat generation rate (W/m3) | |
| R | Universal gas constant (J/mol-K) |
| Re | Reynold’s number |
| r1 | Inner radius of heat exchange tube (m) |
| r2 | Outer radius of heat exchange tube (m) |
| T | Temperature (°C or K) |
| x, y, z | Coordinate axes |
| t | Time (s) |
| X | Lockhart–Martinelli factor |
| Longitudinal coordinate of tubes | |
| VHE-R | Volume ratio of heat exchanger to reactor volume |
| ΔHr | Reaction enthalpy (J/mol-H2) |
| ΔS | Reaction entropy (J/mol-H2) |
| Greek symbols | |
| ε | Pipe roughness (m) |
| ρ | Density (kg/m3) |
| ν | Specific volume (m3/kg) |
| φ | Porosity of metal hydride powder |
| ψ | Pressure gradient multiplier |
| Subscripts | |
| Al | Aluminum |
| eff | Effective |
| H2 | Hydrogen |
| HE | Heat exchanger |
| i | Index for heat transfer tubes |
| MH | Metal hydride |
| R | Reactor |
References
- Pickering, L.; Lototskyy, M.V.; Davids, M.W.; Sita, C.; Linkov, V. Induction melted AB2-type metal hydrides for hydrogen storage and compression applications. Mater. Today Proc. 2018, 5, 10470–10478. [Google Scholar] [CrossRef]
- Tarasov, B.P.; Fursikov, P.V.; Volodin, A.A.; Bocharnikov, M.S.; Shimkus, Y.Y.; Kashin, A.M.; Yartys, V.A.; Chidziva, S.; Pasupathi, S.; Lototskyy, M.V. Metal hydride hydrogen storage and compression systems for energy storage technologies. Int. J. Hydrog. Energy 2021, 46, 13647–13657. [Google Scholar] [CrossRef]
- Abe, J.O.; APopoola, P.I.; Ajenifuja, E.; Popoola, O.M. Hydrogen energy, economy and storage: Review and recommendation. Int. J. Hydrog. Energy 2019, 44, 15072–15086. [Google Scholar] [CrossRef]
- Office_of_Energy_Efficiency_ and _Renewable_Energy. Hydrogen and Fuel Cell Technologies Office Multi-Year Research, Development, and Demonstration Plan; Office of Energy Efficiency and Renewable Energy: Washington, DC, USA, 2014.
- Muthukumar, P.; Singhal, A.; Bansal, G. Thermal modeling and performance analysis of industrial-scale metal hydride based hydrogen storage container. Int. J. Hydrog. Energy 2012, 37, 14351–14364. [Google Scholar] [CrossRef]
- Nyamsi, S.N.; Yang, F.; Zhang, Z. An optimization study on the finned tube heat exchanger used in hydride hydrogen storage system–analytical method and numerical simulation. Int. J. Hydrog. Energy 2012, 37, 16078–16092. [Google Scholar] [CrossRef]
- Garrison, S.L.; Hardy, B.J.; Gorbounov, M.B.; Tamburello, D.A.; Corgnale, C.; Mosher, D.A.; Anton, D.L. Optimization of internal heat exchangers for hydrogen storage tanks utilizing metal hydrides. Int. J. Hydrog. Energy 2012, 37, 2850–2861. [Google Scholar] [CrossRef] [Green Version]
- Nam, J.; Ko, J.; Ju, H. Three-dimensional modeling and simulation of hydrogen absorption in metal hydride hydrogen storage vessels. Appl. Energy 2012, 89, 164–175. [Google Scholar] [CrossRef]
- Bhouri, M.; Goyette, J.; Hardy, B.J.; Anton, D.L. Honeycomb metallic structure for improving heat exchange in hydrogen storage system. Int. J. Hydrog. Energy 2011, 36, 6723–6738. [Google Scholar] [CrossRef]
- Dhaou, H.; Souahlia, A.; Mellouli, S.; Askri, F.; Jemni, A.; Nasrallah, S.B. Experimental study of a metal hydride vessel based on a finned spiral heat exchanger. Int. J. Hydrog. Energy 2010, 35, 1674–1680. [Google Scholar] [CrossRef]
- Visaria, M.; Mudawar, I. Coiled-tube heat exchanger for high-pressure metal hydride hydrogen storage systems–Part 2. Computational model. Int. J. Heat Mass Transf. 2012, 55, 1796–1806. [Google Scholar] [CrossRef]
- Visaria, M.; Mudawar, I. Coiled-tube heat exchanger for High-Pressure Metal Hydride hydrogen storage systems–Part 1. Experimental study. Int. J. Heat Mass Transf. 2012, 55, 1782–1795. [Google Scholar] [CrossRef]
- COMSOL. Multiphysics, Version 5.12016; COMSOL: Stockholm, Sweden, 2015. [Google Scholar]
- Jain, I.; Lal, C.; Jain, A. Hydrogen storage in Mg: A most promising material. Int. J. Hydrog. Energy 2010, 35, 5133–5144. [Google Scholar] [CrossRef]
- Rusman, N.; Dahari, M. A review on the current progress of metal hydrides material for solid-state hydrogen storage applications. Int. J. Hydrog. Energy 2016, 41, 12108–12126. [Google Scholar] [CrossRef]
- Sakintuna, B.; Lamari-Darkrim, F.; Hirscher, M. Metal hydride materials for solid hydrogen storage: A review. Int. J. Hydrog. Energy 2007, 32, 1121–1140. [Google Scholar] [CrossRef]
- Jain, I.; Jain, P.; Jain, A. Novel hydrogen storage materials: A review of lightweight complex hydrides. J. Alloy. Compd. 2010, 503, 303–339. [Google Scholar] [CrossRef]
- Flueckiger, S.; Voskuilen, T.; Pourpoint, T.; Fisher, T.S.; Zheng, Y. In situ characterization of metal hydride thermal transport properties. Int. J. Hydrog. Energy 2010, 35, 614–621. [Google Scholar] [CrossRef]
- Pourpoint, T.L.; Velagapudi, V.; Mudawar, I.; Zheng, Y.; Fisher, T.S. Active cooling of a metal hydride system for hydrogen storage. Int. J. Heat Mass Transf. 2010, 53, 1326–1332. [Google Scholar] [CrossRef]
- Visaria, M.; Mudawar, I.; Pourpoint, T.; Kumar, S. Study of heat transfer and kinetics parameters influencing the design of heat exchangers for hydrogen storage in high-pressure metal hydrides. Int. J. Heat Mass Transf. 2010, 53, 2229–2239. [Google Scholar] [CrossRef]
- Voskuilen, T.; Zheng, Y.; Pourpoint, T. Development of a Sievert apparatus for characterization of high pressure hydrogen sorption materials. Int. J. Hydrog. Energy 2010, 35, 10387–10395. [Google Scholar] [CrossRef]
- Voskuilen, T.G.; Pourpoint, T.L. Phase field modeling of hydrogen transport and reaction in metal hydrides. Int. J. Hydrog. Energy 2013, 38, 7363–7375. [Google Scholar] [CrossRef]
- Liu, Y.; Li, H.-W.; Huang, Z. Editorial: Metal Hydride-Based Energy Storage and Conversion Materials. Front. Chem. 2020, 8, 675. [Google Scholar] [CrossRef] [PubMed]
- Dalkilic, A.; Celen, A.; Çebi, A.; Wongwises, S. Empirical correlations for the determination of R134a’s convective heat transfer coefficient in horizontal and vertical evaporators having smooth and corrugated tubes. Int. Commun. Heat Mass Transf. 2016, 76, 85–97. [Google Scholar] [CrossRef]
- Fang, X. A new correlation of flow boiling heat transfer coefficients based on R134a data. Int. J. Heat Mass Transf. 2013, 66, 279–283. [Google Scholar] [CrossRef]
- Grauso, S.; Mastrullo, R.; Mauro, A.; Thome, J.; Vanoli, G.P. Flow pattern map, heat transfer and pressure drops during evaporation of R-1234ze (E) and R134a in a horizontal, circular smooth tube: Experiments and assessment of predictive methods. Int. J. Refrig. 2013, 36, 478–491. [Google Scholar] [CrossRef]
- Kaew-On, J.; Wongwises, S. New proposed two-phase multiplier and evaporation heat transfer coefficient correlations for R134a flowing at low mass flux in a multiport minichannel. Int. Commun. Heat Mass Transf. 2012, 39, 853–860. [Google Scholar] [CrossRef]
- Kundu, A.; Kumar, R.; Gupta, A. Heat transfer characteristics and flow pattern during two-phase flow boiling of R134a and R407C in a horizontal smooth tube. Exp. Therm. Fluid Sci. 2014, 57, 344–352. [Google Scholar] [CrossRef]
- Suda, S.; Kobayashi, N.; Yoshida, K. Reaction kinetics of metal hydrides and their mixtures. J. Less Common Met. 1980, 73, 119–126. [Google Scholar] [CrossRef]
- Visaria, M.; Mudawar, I.; Pourpoint, T. Enhanced heat exchanger design for hydrogen storage using high-pressure metal hydride: Part 1. Design methodology and computational results. Int. J. Heat Mass Transf. 2011, 54, 413–423. [Google Scholar] [CrossRef]
- Wang, Y.-W.; Lin, C.-C. Locating road-vehicle refueling stations. Transp. Res. Part E: Logist. Transp. Rev. 2009, 45, 821–829. [Google Scholar] [CrossRef]
- Singal, L.; Sham, R.; Kumar, S. Single and two phase pressure drop in fluid flow: A review. Int. J. Latest Trends Eng. Technol. 2015, 6, 28–33. [Google Scholar]
- Lockhart, R.W. Proposed correlation of data for isothermal two-phase, two-component flow in pipes. Chem. Eng. Prog. 1949, 45, 39–48. [Google Scholar]
- MATLAB; Version R2016b; MathWorks: Natick, MA, USA, 2016.
- Santos-Ruiz, I.; López-Estrada, F.-R.; Puig, V.; Valencia-Palomo, G. Simultaneous Optimal Estimation of Roughness and Minor Loss Coefficients in a Pipeline. Math. Comput. Appl. 2020, 25, 56. [Google Scholar] [CrossRef]


| Variable | Value (Units) | Variable | Value (Units) |
|---|---|---|---|
| AHE | 0.001767 (m2) | MWH2 | 2.0159 (g/mol) |
| AMH | 0.015904 (m2) | Po | 101.3 (kPa) |
| Ca | 150 (1/s) [20] | P | 280 (bar) [10] |
| cp,MH | 750 (J/kg K) [11] | R | 8.314 (J/mol K) |
| D | 0.15 (m) | wt% | 0.013 [21] |
| Ea | 20,700 (J/mol H2) [29] | ΔHr | −14,390 (J/mol H2) [21] |
| kMH | 0.75 (W/m K) [11] | ΔS | −91.3 (J/mol H2) [21] |
| kAl | 167 (W/m K) | ρMH | 2200 (kg/m3) [10] |
| L | 0.61 (m) | VHE-R | 0.1 |
| mH2 | 0.25 (kg) | φ | 0.6 [10] |
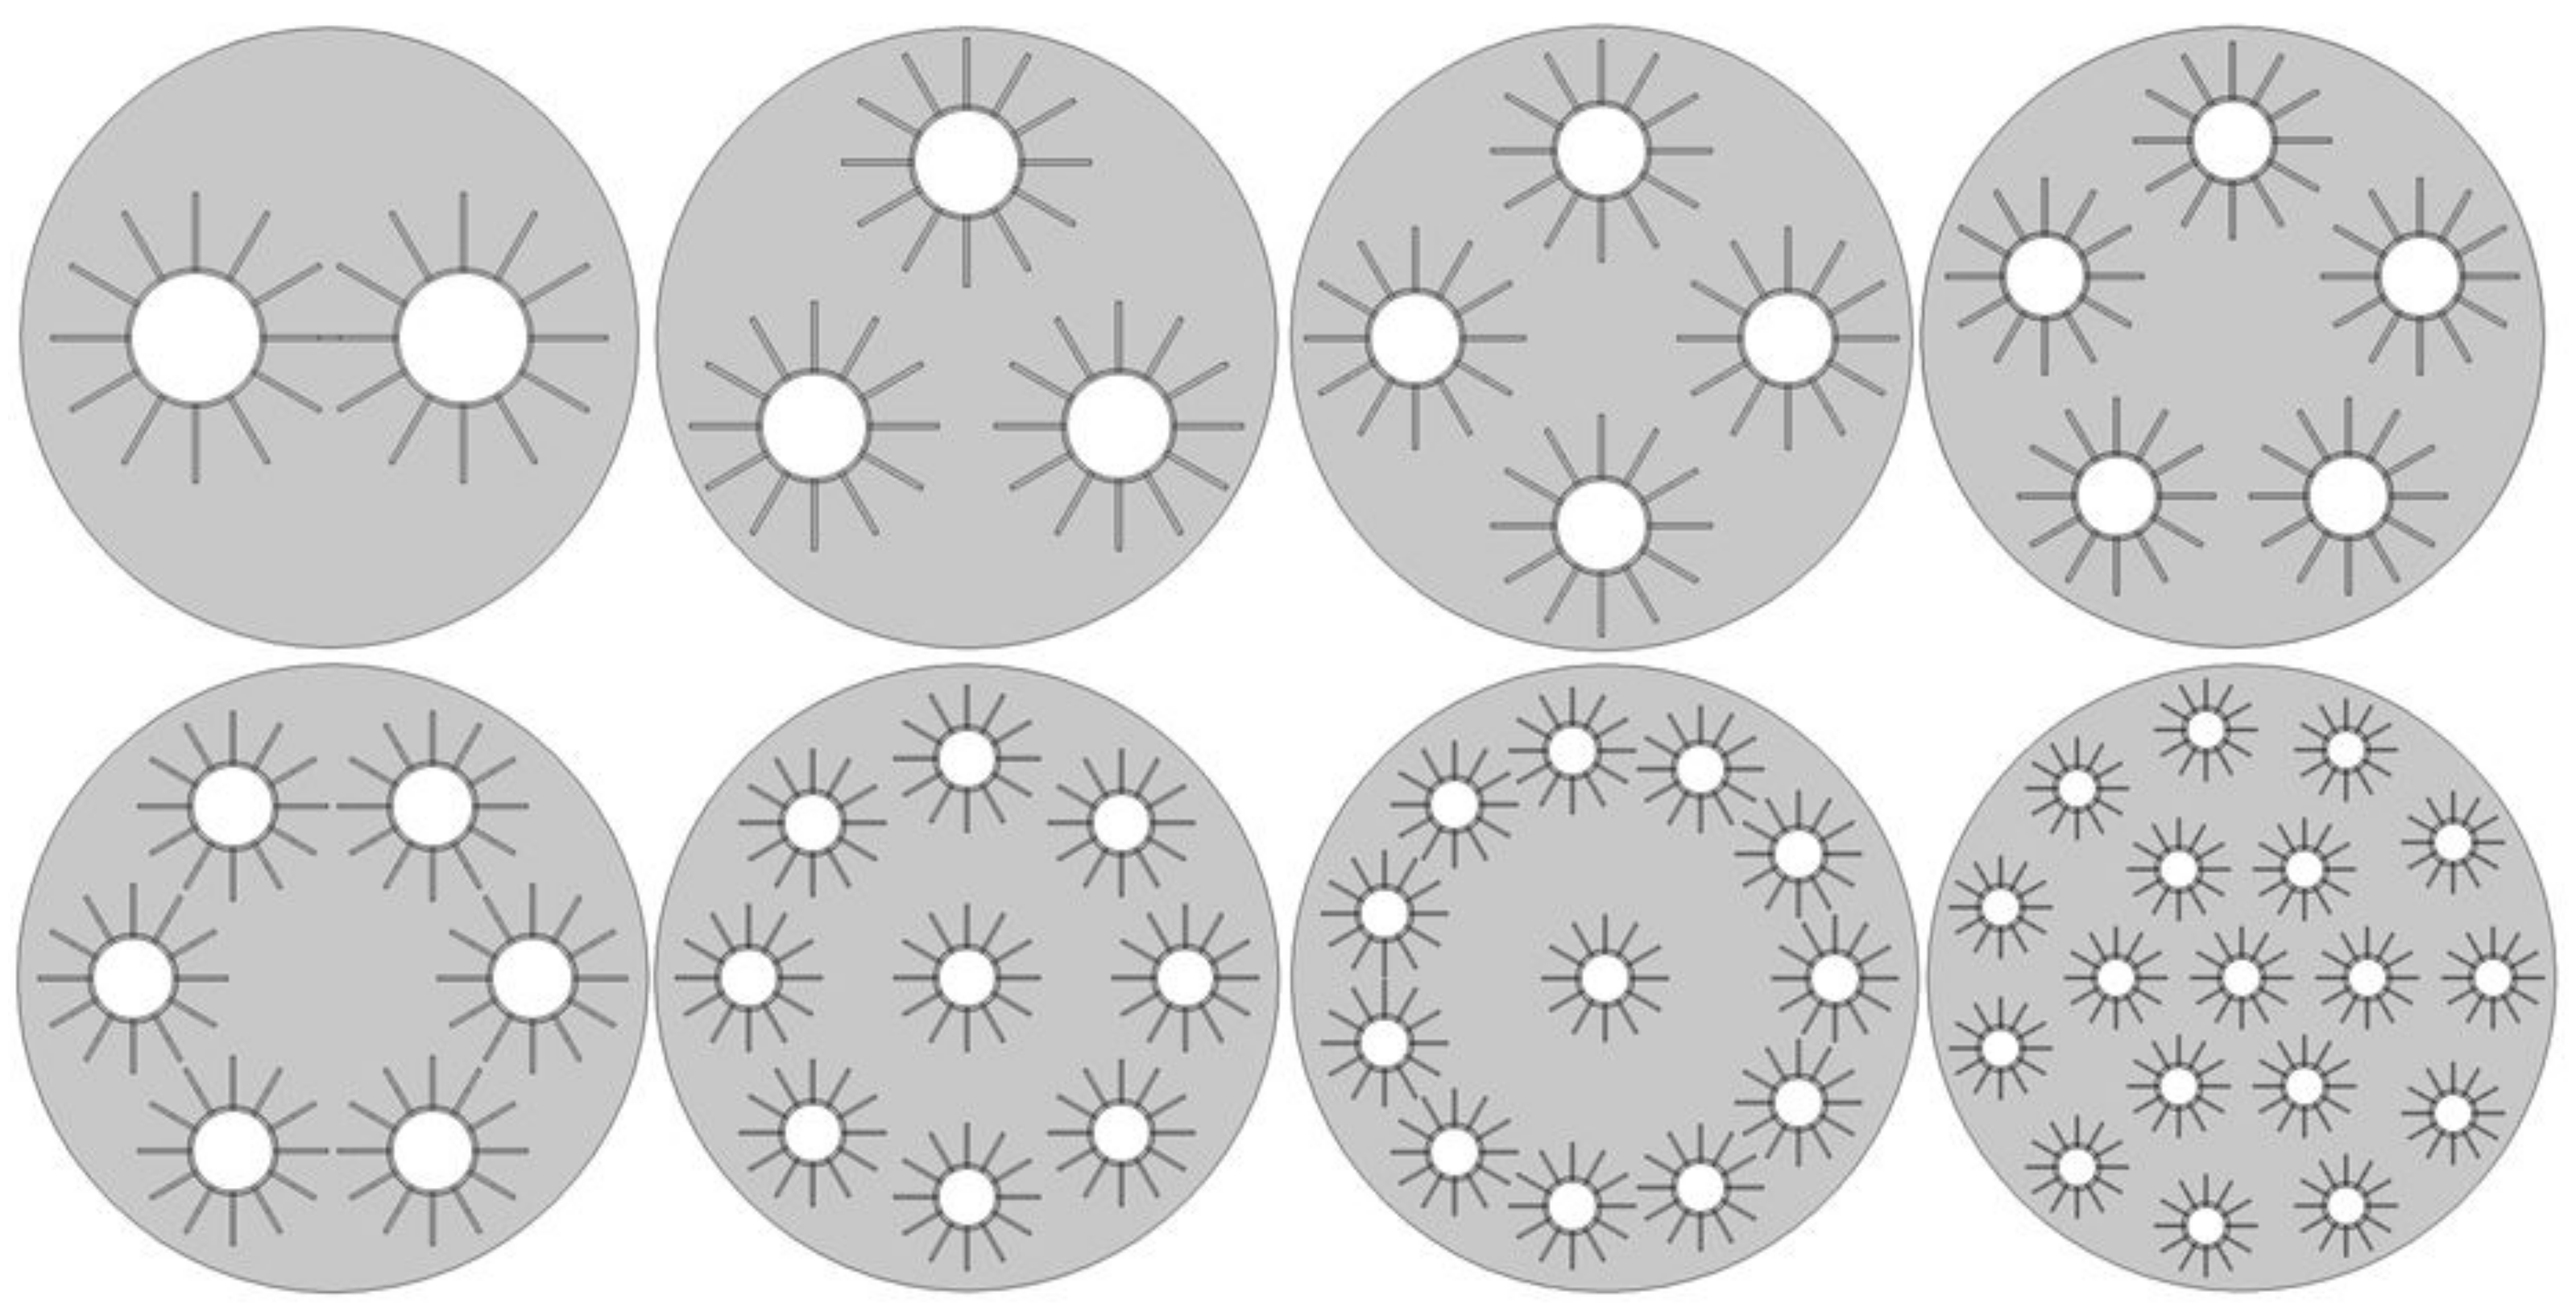
| Number of Passes | 2 | 3 | 4 | 5 | 6 | 9 | 12 | 18 |
|---|---|---|---|---|---|---|---|---|
| Outer Radius of Tube (mm) | 16.77 | 13.69 | 11.86 | 10.61 | 9.68 | 7.91 | 6.85 | 5.59 |
| Tube Spacing Diameter (mm) | 65 | 85 | 90 | 95 | 95 | 105 | 110 | 120 (60) |
| Fin Length | 9.12 | 17.81 | 14.73 | 13.09 | 12.00 | 9.59 | 8.15 | 6.54 |
| Fin Width | 1.63 | 1.10 | 1.00 | 0.90 | 0.82 | 0.68 | 0.60 | 0.50 |
Publisher’s Note: MDPI stays neutral with regard to jurisdictional claims in published maps and institutional affiliations. |
© 2022 by the authors. Licensee MDPI, Basel, Switzerland. This article is an open access article distributed under the terms and conditions of the Creative Commons Attribution (CC BY) license (https://creativecommons.org/licenses/by/4.0/).
Share and Cite
Keith, M.D.; Kukkapalli, V.K.; Kim, S. Phase Change Cooling of a Metal Hydride Reactor for Rapid Hydrogen Absorption. Energies 2022, 15, 2490. https://doi.org/10.3390/en15072490
Keith MD, Kukkapalli VK, Kim S. Phase Change Cooling of a Metal Hydride Reactor for Rapid Hydrogen Absorption. Energies. 2022; 15(7):2490. https://doi.org/10.3390/en15072490
Chicago/Turabian StyleKeith, Matthew Duncan, Vamsi Krishna Kukkapalli, and Sunwoo Kim. 2022. "Phase Change Cooling of a Metal Hydride Reactor for Rapid Hydrogen Absorption" Energies 15, no. 7: 2490. https://doi.org/10.3390/en15072490
APA StyleKeith, M. D., Kukkapalli, V. K., & Kim, S. (2022). Phase Change Cooling of a Metal Hydride Reactor for Rapid Hydrogen Absorption. Energies, 15(7), 2490. https://doi.org/10.3390/en15072490