Article

Life Cycle Assessment and Energy Balance of a Polygeneration Plant Fed with Lignocellulosic Biomass of Cynara cardunculus L.

by
Ramoon Barros Lovate Temporim
1,*,
Gianluca Cavalaglio
2,
Alessandro Petrozzi
1,
Valentina Coccia
3,
Paola Iodice
2,
Andrea Nicolini
3 and
Franco Cotana
3
1
CIRIAF—Interuniversity Research Centre on Pollution and Environment “Mauro Felli”, Via G. Duranti, 06125 Perugia, Italy
2
Centro Direzionale Isola F2, Pegaso Telematic University, 80143 Naples, Italy
3
Department of Engineering, UNIPG—University of Perugia, Via G. Duranti, 06125 Perugia, Italy
*
Author to whom correspondence should be addressed.
Energies 2022, 15(7), 2397; https://doi.org/10.3390/en15072397
Submission received: 23 February 2022 / Revised: 22 March 2022 / Accepted: 23 March 2022 / Published: 24 March 2022
(This article belongs to the Special Issue Life Cycle Thinking for a Sustainable Built Environment)

Abstract

:
This article aims to present an evaluation of the environmental performance of a combustion polygeneration plant fed with lignocellulosic material from cardoon (Cynara cardunculus L.) through the technique of Life Cycle Assessment (LCA). The system boundaries encompassed macro-phases of crop production, transportation, and polygeneration processes that were able to produce 100 kW of electricity, a residual thermal energy recovery system and district heating and cooling with 270 kW of heating, and a 140 kW of cooling. The LCA was performed using Cumulative Energy Demand and ReCiPe Life Cycle Impact Assessment methods through midpoint and endpoint indicators. From 2000 h/year, 165.92 GJ of electricity and 667.23 GJ of primary energy were consumed, and 32.82 tCO2eq were emitted. The rates of Greenhouse Gas (GHG) and energy demand per MJ produced were 0.08 MJSE/MJPD, 0.30 MJPE/MJPD, and 0.01 kgCO2eq/MJPD. According to the ReCiPe method, the impact categories with the highest impact loads were Terrestrial ecotoxicity (2.44%), Freshwater ecotoxicity (32.21%), Marine ecotoxicity (50.10%), Human carcinogenic toxicity (8.75%), and Human non-carcinogenic toxicity (4.76%). Comparing the same energy outputs produced by Italian power and gas grids, the proposed polygeneration plant was able to reduce primary energy demand and GHG emissions by 80 and 81%, respectively, in addition to reducing the emissions of the five main categories of impacts by between 25 and 73%.

1. Introduction

This paper refers to the activities developed within the PRIN (BIO-CHEAPER) Project—Research Projects of Relevant National Interest—Biomass Circular Holistic Economy Approach to Energy Equipment. This project aims to achieve increased energy efficiency and reduced emissions of pollutants along supply chains for biomass, including cardoon. It comprises the study of potential technological improvements to increase the energy efficiency of small-scale systems that can be used in polygeneration plants, including investigations on laboratory, simulation, industrial symbiosis tests, and LCA of biomass-to-energy supply chains [1].
Currently, the consumption of fossil sources has been the major cause of the emission of polluting agents. Fossil reserves are limited and non-renewable, with their replacement thus being essential. Policies focused on the principles of sustainability led to the development of alternatives, such as the use of renewable energies including biofuels, hydrogen, wind energy, solar energy, and bioenergy [2,3,4,5,6].
Consonant with current PRIN project and energy issues, the study and implementation of alternative energy sources with a high level of sustainability is increasingly necessary as a path to the energy transition. The ideal characteristics are energy sources with high production yield, low contaminating components, low energy input, low cost, and low need for nutrients [5,7]. In this circumstance, bioenergy from energy crops has gained prominence, showing great potential as a sustainable resource for energy production [3,8]. The production of green energy from non-food crops and residual biomass such as lignocellulosic materials appear to be an interesting option given its relative ease of obtaining and great productive potential [9].
A relevant aspect of lignocellulosic biomass is its contribution to the reducing of GHG emissions. The production of energy using biomass occurs by emitting CO2, which is reabsorbed in the regrowth cycles of the plants during the cultivation phase. Furthermore, another advantage of biomass over other renewable sources is that it is programmable and storable, reducing the potential for fluctuations in energy supply [6,9,10,11,12].
A culture that stands out in that regard is Cynara cardunculus L. or cardoon. It is a spontaneous crop that can be cultivated on marginal land as it grows in areas with low edaphoclimatic characteristics and without irrigation. Therefore, without major investments in management, the cardoon performs as a resistant crop, incurring fewer environmental impacts. This plant has characteristics such as perennial life form, annual growth cycle, vigorous regrowth, attractive flowers for bees, and adaptation to water stress. In this regard, it is a plant that is well adapted to be grown on the Mediterranean region’s drylands and semi-arid environments, such as in Portugal, Spain, Greece, Italy, France, and other countries with similar edaphoclimatic characteristics [5,6]. Particularly, Italy has great potential for introducing this crop, having about 3 million hectares of marginal land that could be partially used to cultivate cardoon [1].
The lignocellulosic biomass can be used directly or indirectly to produce different energy sources, such as chemicals, biofuels, biomaterials, heating, cooling, electricity, et cetera. Different techniques and transformation mechanisms can be used [3,6,13].
Due to its easy implementation, combustion is one of the most used methods to produce energy from lignocellulosic biomass. On a larger scale, solid biomass can be burned in ovens or boilers, producing heat used directly in heating systems or electricity. However, the energy conversion efficiency is not optimal in these cases, causing large energy losses during the combustion process and fume exhaustion. In this context, strategies can reuse the residual heat that would potentially be lost, reintroducing it through loops into the same system or other systems requiring lower temperatures for their operation, such as with polygeneration plants [6,9,12,13,14].
The term polygeneration describes the integration of multiple outputs in a single unity, as an energy system simultaneously providing several products such as electricity, heating, cooling, and chemical products in a decentralized way. Polygeneration presents advantages such as the reducing of GHG, a reliable energy supply, economic savings, and reduced grid losses [12,14,15]. However, polygeneration systems present the challenge of selecting the most adapted technology to be included in polygeneration plants. There are different possibilities, such as internal combustion engines, micro-turbines, and fuel cells, among others [16].
Regarding electric power production, gas turbines have been of great interest for several reasons such as the compactness and simplicity of the machines, reliability, reduced investment costs, speed of construction, and high conversion rates. Particularly, traditional power plants integrated with gas turbines present a conversion efficiency that varies from 16 to 33% [17,18,19,20]. This means that up to 84% of primary energy is lost as heat. On the other hand, in a polygeneration plant, the heat produced is recovered for other uses. However, one of the most recognized limitations of technology is the need to use “clean” fuels such as natural gas. A solution to this technology limitation would be using an external fired gas turbine (EFGT) [15,17,21,22,23,24].
EFGTs offer the possibility of using air as a heat transfer fluid. The cycle of this type of turbine is based on a gas cycle where direct combustion is replaced by a heat exchanger [15,18,24]. In practice, the combustion process takes place outside the turbine and the produced exhaust gases are used to heat air through a heat exchanger. Then, the heated air is used in the expansion process in the turbine, producing power [15,18,23]. Moreover, this system makes it possible to use the joint production of electricity, heating, and cooling through a single fuel, allowing electricity to be produced through the turbine and the residual heat to be recovered and reused for other purposes [25].
Polygeneration systems comprise the integration of several units and installations, which provide several benefits, including increased environmental performance. In that regard, to assess this environmental performance, the Life Cycle Assessment (LCA) methodology was applied, as it is the most widespread methodology to investigate the environmental impacts of products and services in the energy production sector [5,14,26,27].

2. Materials and Methods

2.1. Life Cycle Assessment Methodology

The Life Cycle Assessment was developed under the requirements of ISO 14040:2006a [28] and 14044:2006b [29], allowing the assessment of environmental impacts through the compilation and evaluation of inputs (energy and material) and outputs (products, by-products, pollutants, and emissions) [30]. These frameworks, in line with the proposal of this paper, comprehend the steps of goal and scope definition, life cycle inventory analysis, life cycle impact assessment, and interpretation. The Life Cycle models were developed using the commercial software SimaPro V9.0.0.30 [31].

2.2. Goal and Scope Definition

Given this framework, within the PRIN (BIO-CHEAPER) project, this paper aims to present an LCA of the annual operations of a power, heating, and cooling polygeneration plant fuelled by the combustion of lignocellulosic material of Cynara cardunculus L. This study proposes to estimate the environmental impact loads, in particular, the primary energy demand, the GHG, and other 17 emissions related to ReCiPe’s impact categories, making a comparison with the production of the same amount of energy sources (power, heating, and cooling) using the Italian power and gas grids.

2.3. Functional Unit

The functional unit adopted was the primary energy demand and the 18 ReCiPe impact categories per annual polygeneration chain operations (2000 h), and per MJ of energy produced as output. Allocation was conducted based on the total energy in output from power, heating, and cooling.

2.4. System Boundaries

According to ISO 14040 and 14044, the system boundaries were defined in Figure 1. A cradle-to-gate approach, which comprehends the phases of cardoon production, transportation, and polygeneration, was considered.
The system boundaries were designed considering all the supply chains to provide the power sources. The agricultural production, transportation of raw material, and all necessary processing phases for the polygeneration of electricity, heating, and cooling. The time boundary was 1 year, totalling 2000 h of operations. The data used in this study cover the geographical area of Italy, in particular the regions of Sardinia and Central Italy where the experimentation was carried out.

2.5. Life Cycle Inventory

The inventory was developed based on the materials and process flows from the experimental study (Figure A1) and modelled on SimaPro using the databases Ecoinvent V3.1 [32] and Agri-footprint V1.0 [33]. The same databases were used to develop the model of the reference system, the Italian power and gas grids.

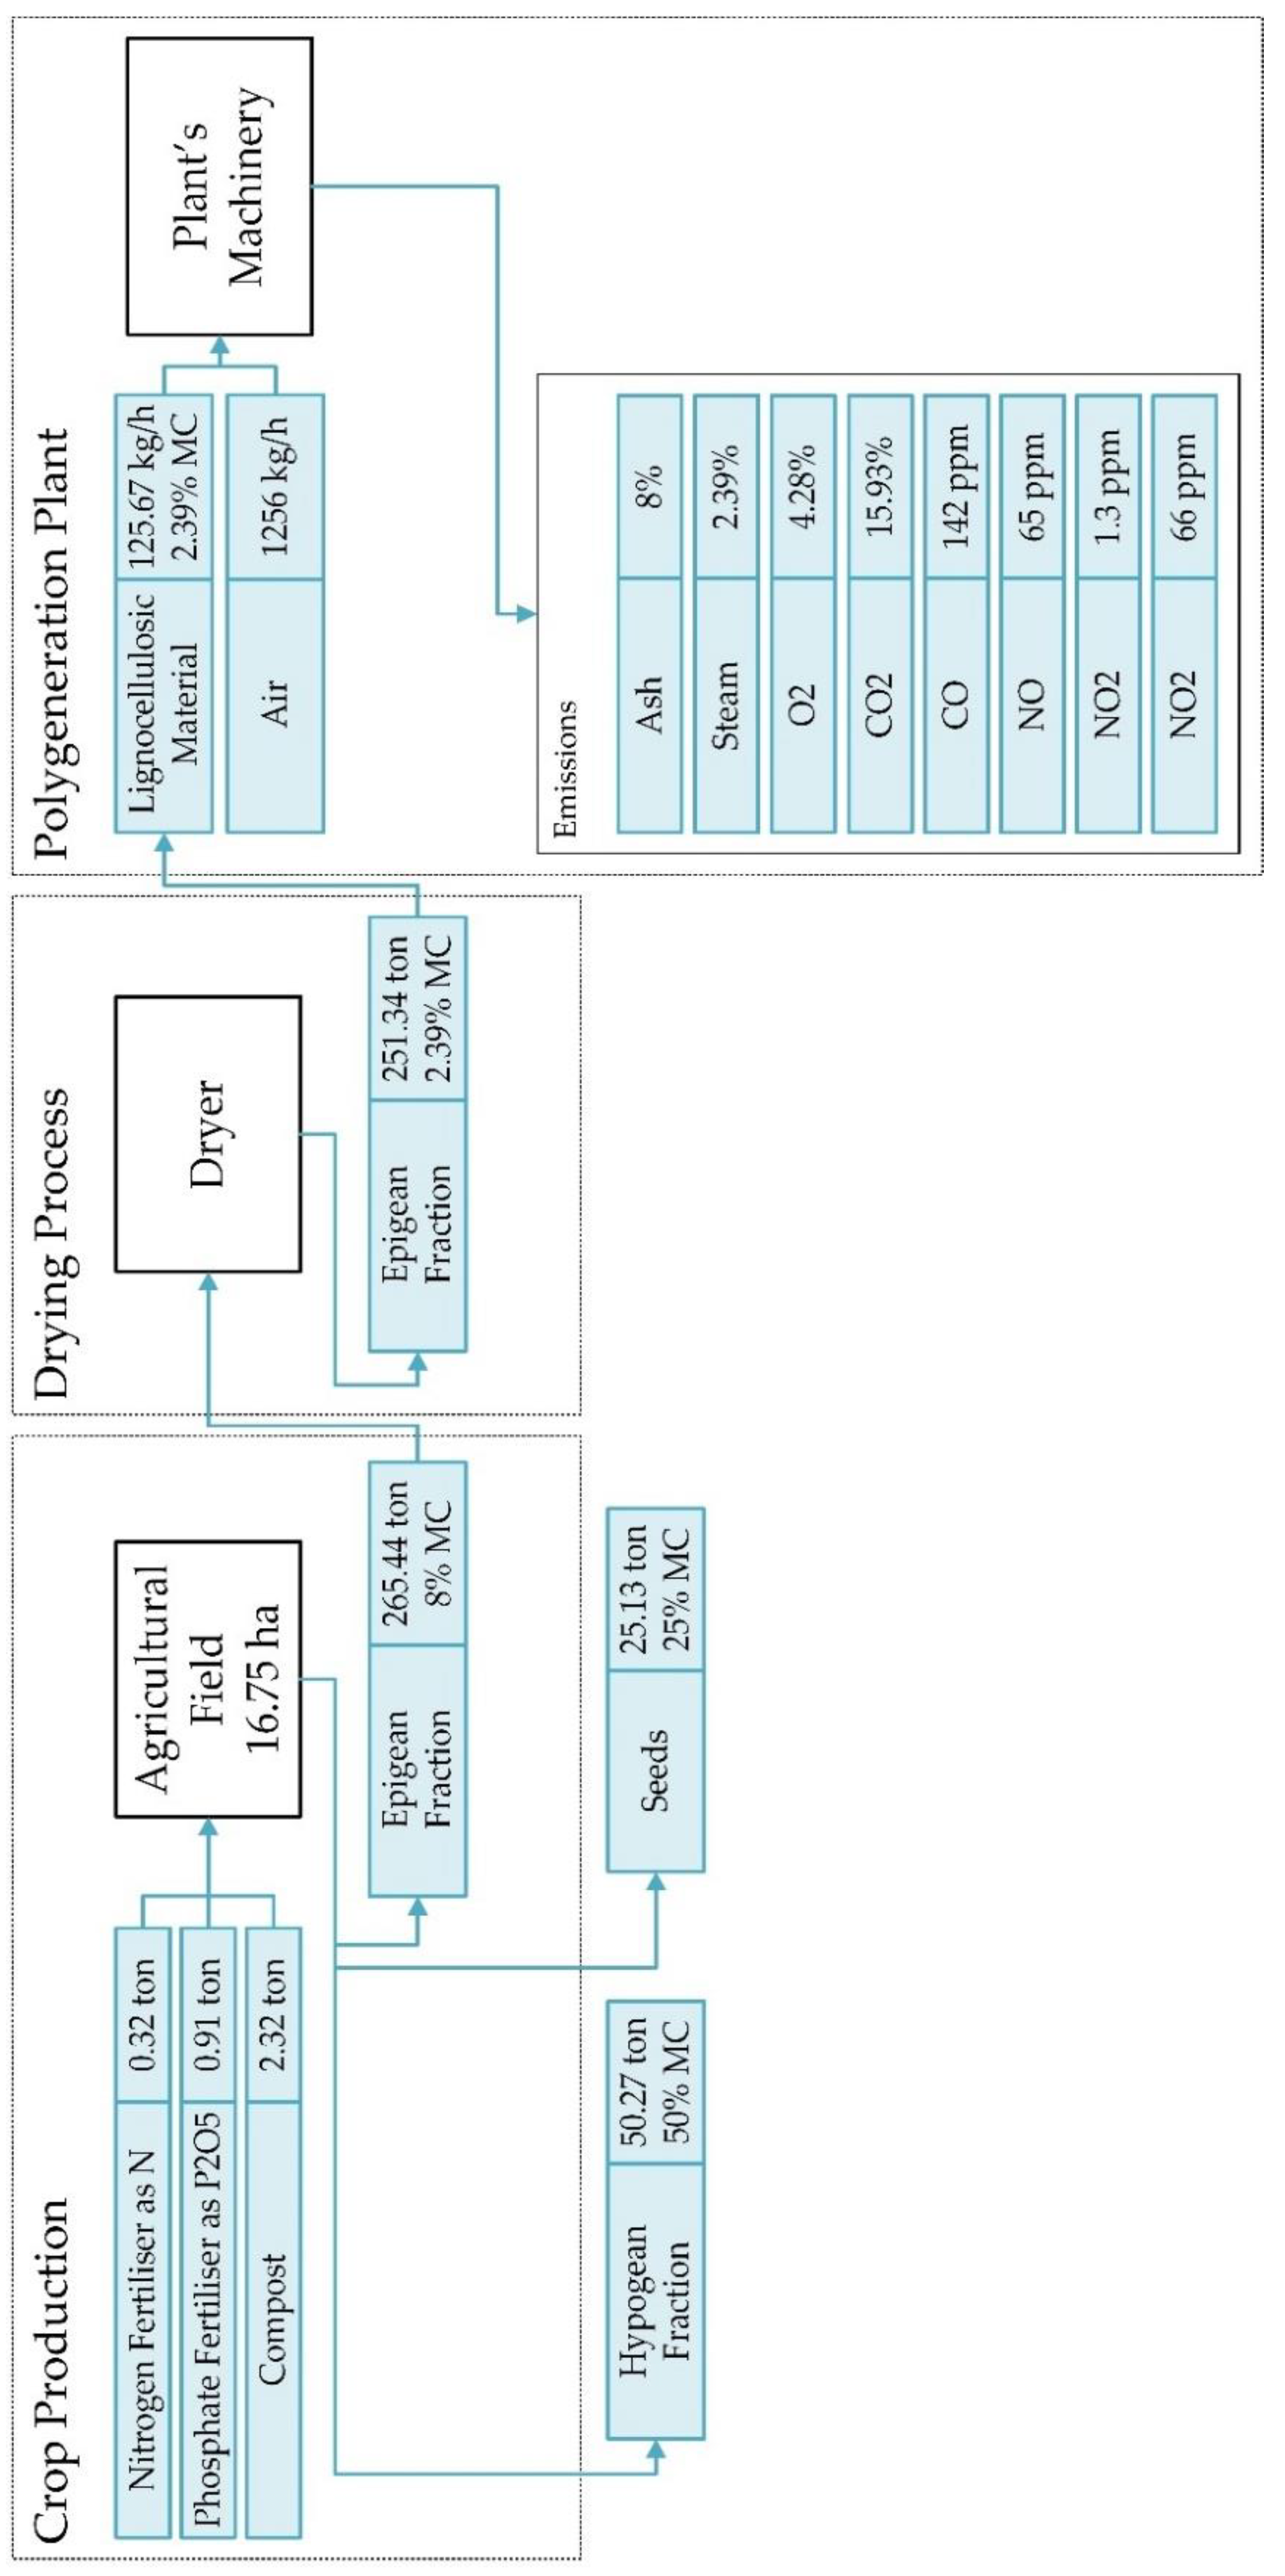
2.5.1. Cardoon Production and Transportation

The metadata used for the development of the cardoon production inventory were obtained from a production carried out in Porto Torres, Sardinia. Data related to production, the characterization of plant fractions, and quantities of inputs were obtained from the producer Novamont S.p.A. Data on the machinery and their use were hypothesized based on studies of the cardoon cultivation phase developed by Gominho et al. [9], Deligios et al. [34], and Angelini et al. [35]. The use of each machinery was defined based on the quantities of inputs applied, production harvested, and area cultivated by Novamont S.p.A.
The phase of cardoon production was carried out employing the minimum possible amounts of chemical fertilisers, favouring compost materials to nurture the crop. The cultivation was carried out without using any irrigation system since the consumption of water resources for bioenergy production is a concern. These systems are unsustainable as long as they consume the limited freshwater resources necessary for human use and other activities besides the demand for high energy sources. Furthermore, the application of pesticides was not used. These adoptions favoured the reducing of the load of environmental impacts in the cardoon cultivation phase [34]. In particular, the carbon emissions and removals from agricultural production were considered as a closed carbon cycle. Therefore, the GHG released by the biomass combustion was reabsorbed by the regrowth at cardoon cultivation, i.e., the net GHG emissions on balance were zero. The allocation of the crop production emissions was conducted based on the energy content of the cardoon fractions (seeds, epigean, and hypogeum fractions).
Before being transported to the polygeneration plant, the raw material undergoes a size reduction process through a chipper machine, obtaining chips with a regular shape of about 10x20x20 mm, thereby facilitating the combustion process and transportation. This material was deemed to be grown on fields 20 km from the polygeneration plant and transported to the polygeneration by road using trucks with a capacity of 30 ton.
The raw material was characterised at the University of Perugia, in the Biomass Research Centre’s laboratories, in terms of moisture content using a moister analyser (Mettler Toledo HB43-S) [36], in terms of Low Heating Value (LHV) through a calorimeter (LECO AC-350) [37], according to the ASTM D2015 standard method, and in terms of ash content with a thermogravimetric analyser (LECO TGA 701) [38], according to the ASTM D 3682-78 method.

2.5.2. Polygeneration Plant

The polygeneration phase comprises the stages of biomass storage, transport between machinery, combustion, heat exchange with the working fluid, expansion and production of electrical energy in the turbine, heat recovery in the secondary heat exchangers, and use of residual energy for the production of heating and cooling. The polygeneration facilities are structured as can be seen in Figure 2.
The raw material arrives, and it is unloaded from the truck into a hopper with a capacity of 8 m3 employing an overhead crane that transports big bags of up to 450 kg. In the hopper, the biomass is dried through a dehumidification process using a fluidised bed. The hopper is connected to the combustion chamber through a set of rakes and screw conveyors. At the bottom of the hopper, rakes move the chips by pushing them towards a feed chute in which the material is removed, employing a set of screw conveyors towards the combustion chamber.
The combustion chamber comprises a circular steel body filled with refractory cement, a diesel ignition, and a set of fans that keep the oxygen supply to maintain combustion under ideal conditions. The chamber has a biomass input of about 125 kg/h and an air input of about 1.256 kg/h. It allows the chamber to operate at 980 °C with a combustion efficiency of around 80%. At the bottom of the chamber, a set of rakes remove the ashes, which are used for fertilising agricultural fields. The exhaust gases from combustion leave the chamber and pass through the heat exchanger 1.
The heat exchanger 1 is made of INOX 430 and a highly efficient AISI 310 tubular beam with an efficiency of 90%. In this phase, the heat produced by the biomass combustion is transferred to the heat transfer fluid (air), which is sent to the expansion in the turbine. The heat is transferred to the air through a compressor ring connected to the heat exchanger 1. In the ring, the air is forced by fans circulating inside the heat exchanger until reaching the temperature of 950 °C. Once the appropriate thermodynamic conditions are reached, the air is deflected to the turbine to be expanded. A high-speed (70,000 rpm) single-shaft Turbec T100 turbine is used. The turbine can produce 100 kW of electricity.
The generator produces high-frequency electricity. Before current reaches the grid, it is converted to grid standards (400 VAC at 50 Hz). The high-frequency alternating current produced by the generator (500 VAC at 2333 Hz corresponding to 70,000 rpm of the motor shaft) is initially rectified into direct current and converted into three-phase alternating current (400 VAC at 50 Hz) via a static converter.
After the expansion phase, air leaves the turbine at 410 °C and passes through a secondary heat exchanger (heat exchanger 2), with an efficiency of 90%, that supplies the district heating and cooling system. The heat transfer fluid is released into the atmosphere at 152.4 °C. On the other hand, the exhaust gases produced by the combustion pass through a cyclone that removes PM10 and fly-ash particulate content, having an efficiency of 90–98% for particles above 10 μm. These gases leave the cyclone at approximately 413 °C and pass through another heat exchanger (heat exchanger 3) that supplies the district heating and cooling, and successively, are removed through an exhaust fan.
The heat transfer fluid used in district heating and cooling is water, which enters at 70 °C and leaves at 83 °C with a water flow of 2.48 kg/s. The recovered heat is used for the air conditioning of buildings in two different ways: in the winter period, the system works as a district heating with a power of 270 kW, and in the summer, the recovered power is converted into cooling through an absorption chiller with 140 kW output power.
In this study, the mechanical power demanded by the polygeneration plant’s machinery was supplied by a set of 17 electric engines. The technical data of the engine set for all equipment are shown in Table A2.

2.6. Life Cycle Impact Assessment

Two different methods were used to translate the life cycle inventory’s elementary flows into environmental impacts scores: Cumulative Energy Demand V1.11 [39], which involved translating these physical flows and interventions into primary energy demand indicators, in addition to analysing the use of non-renewables (fossil, nuclear, and biomass from primary forests) and renewable (biomass from agriculture, wind, solar, geothermal, and water) sources. ReCiPe V1.03 [40], at the midpoint level, since it is valid for the European region, translated results into 18 midpoint impact categories, including the GWP [41]. The results obtained in the characterization were normalized to report on the relative magnitude of each of the scores for the different impact categories, expressing them to a common set of reference impacts. The normalised impact profile of the polygeneration chain was expressed in the same metric. Additionally, the ReCiPe Endpoint (H/A) was used, showing results in terms of 3 endpoint areas of protection: “human health”, “ecosystems”, and “resources”.

2.7. Interpretation of the Results

The results were interpreted to meet the goals proposed in the definition of objective and scope. The interpretation was made considering the inventory analysis and the characterization and normalization of the impact assessment, respecting temporal, geographic, and technological assumptions.

3. Results

3.1. Raw Material Characterization

A total of 251 tons of lignocellulosic material was used to feed the polygeneration plant for 2000 h/year. The raw material was characterised with an LHV of 16.37 MJPE/kg, similar to Miscanthus and giant reed, and slightly higher than the energy content reported by other authors for cardoon [35,42,43,44]; the water content was 2.39% and the ash content was 8.8%, slightly higher than those found in other energy crops such as giant red and Miscanthus [45,46,47].

3.2. Secondary Energy Demand

The processes related to the polygeneration facilities demanded electricity from the Italian power grid. The entire plant is powered by electric engines ranging from 0.30 to 4.70 kW, consuming 165.92 GJSE (secondary energy) of electricity to maintain the machinery operations.

3.3. Output Energy

The polygeneration chain produced around 720 GJPD (produced energy) of electricity. With thermal energy recovery from the exhaust gases and expanded air from the turbine, it was possible to obtain 972 GJPD of heat and 504 GJPD of cooling using the district heating and cooling system.

3.4. Life Cycle Inventory Analysis

The inventory was established based on the necessary inputs of resources, material, products, and process for all phases of the polygeneration chain (cultivation, transportation, and polygeneration), as shown in Table 1.
The inputs for cardoon production were obtained in a real production field located in Porto Torres, Sardinia, under the yields and composition observed in other areas of Italy, such as in central Italy [35], where the polygeneration plant is located. Table 2 shows the metadata from the crop cultivation used to calculate the inventory of the crop production.

3.5. Life Cycle Impact Assessment

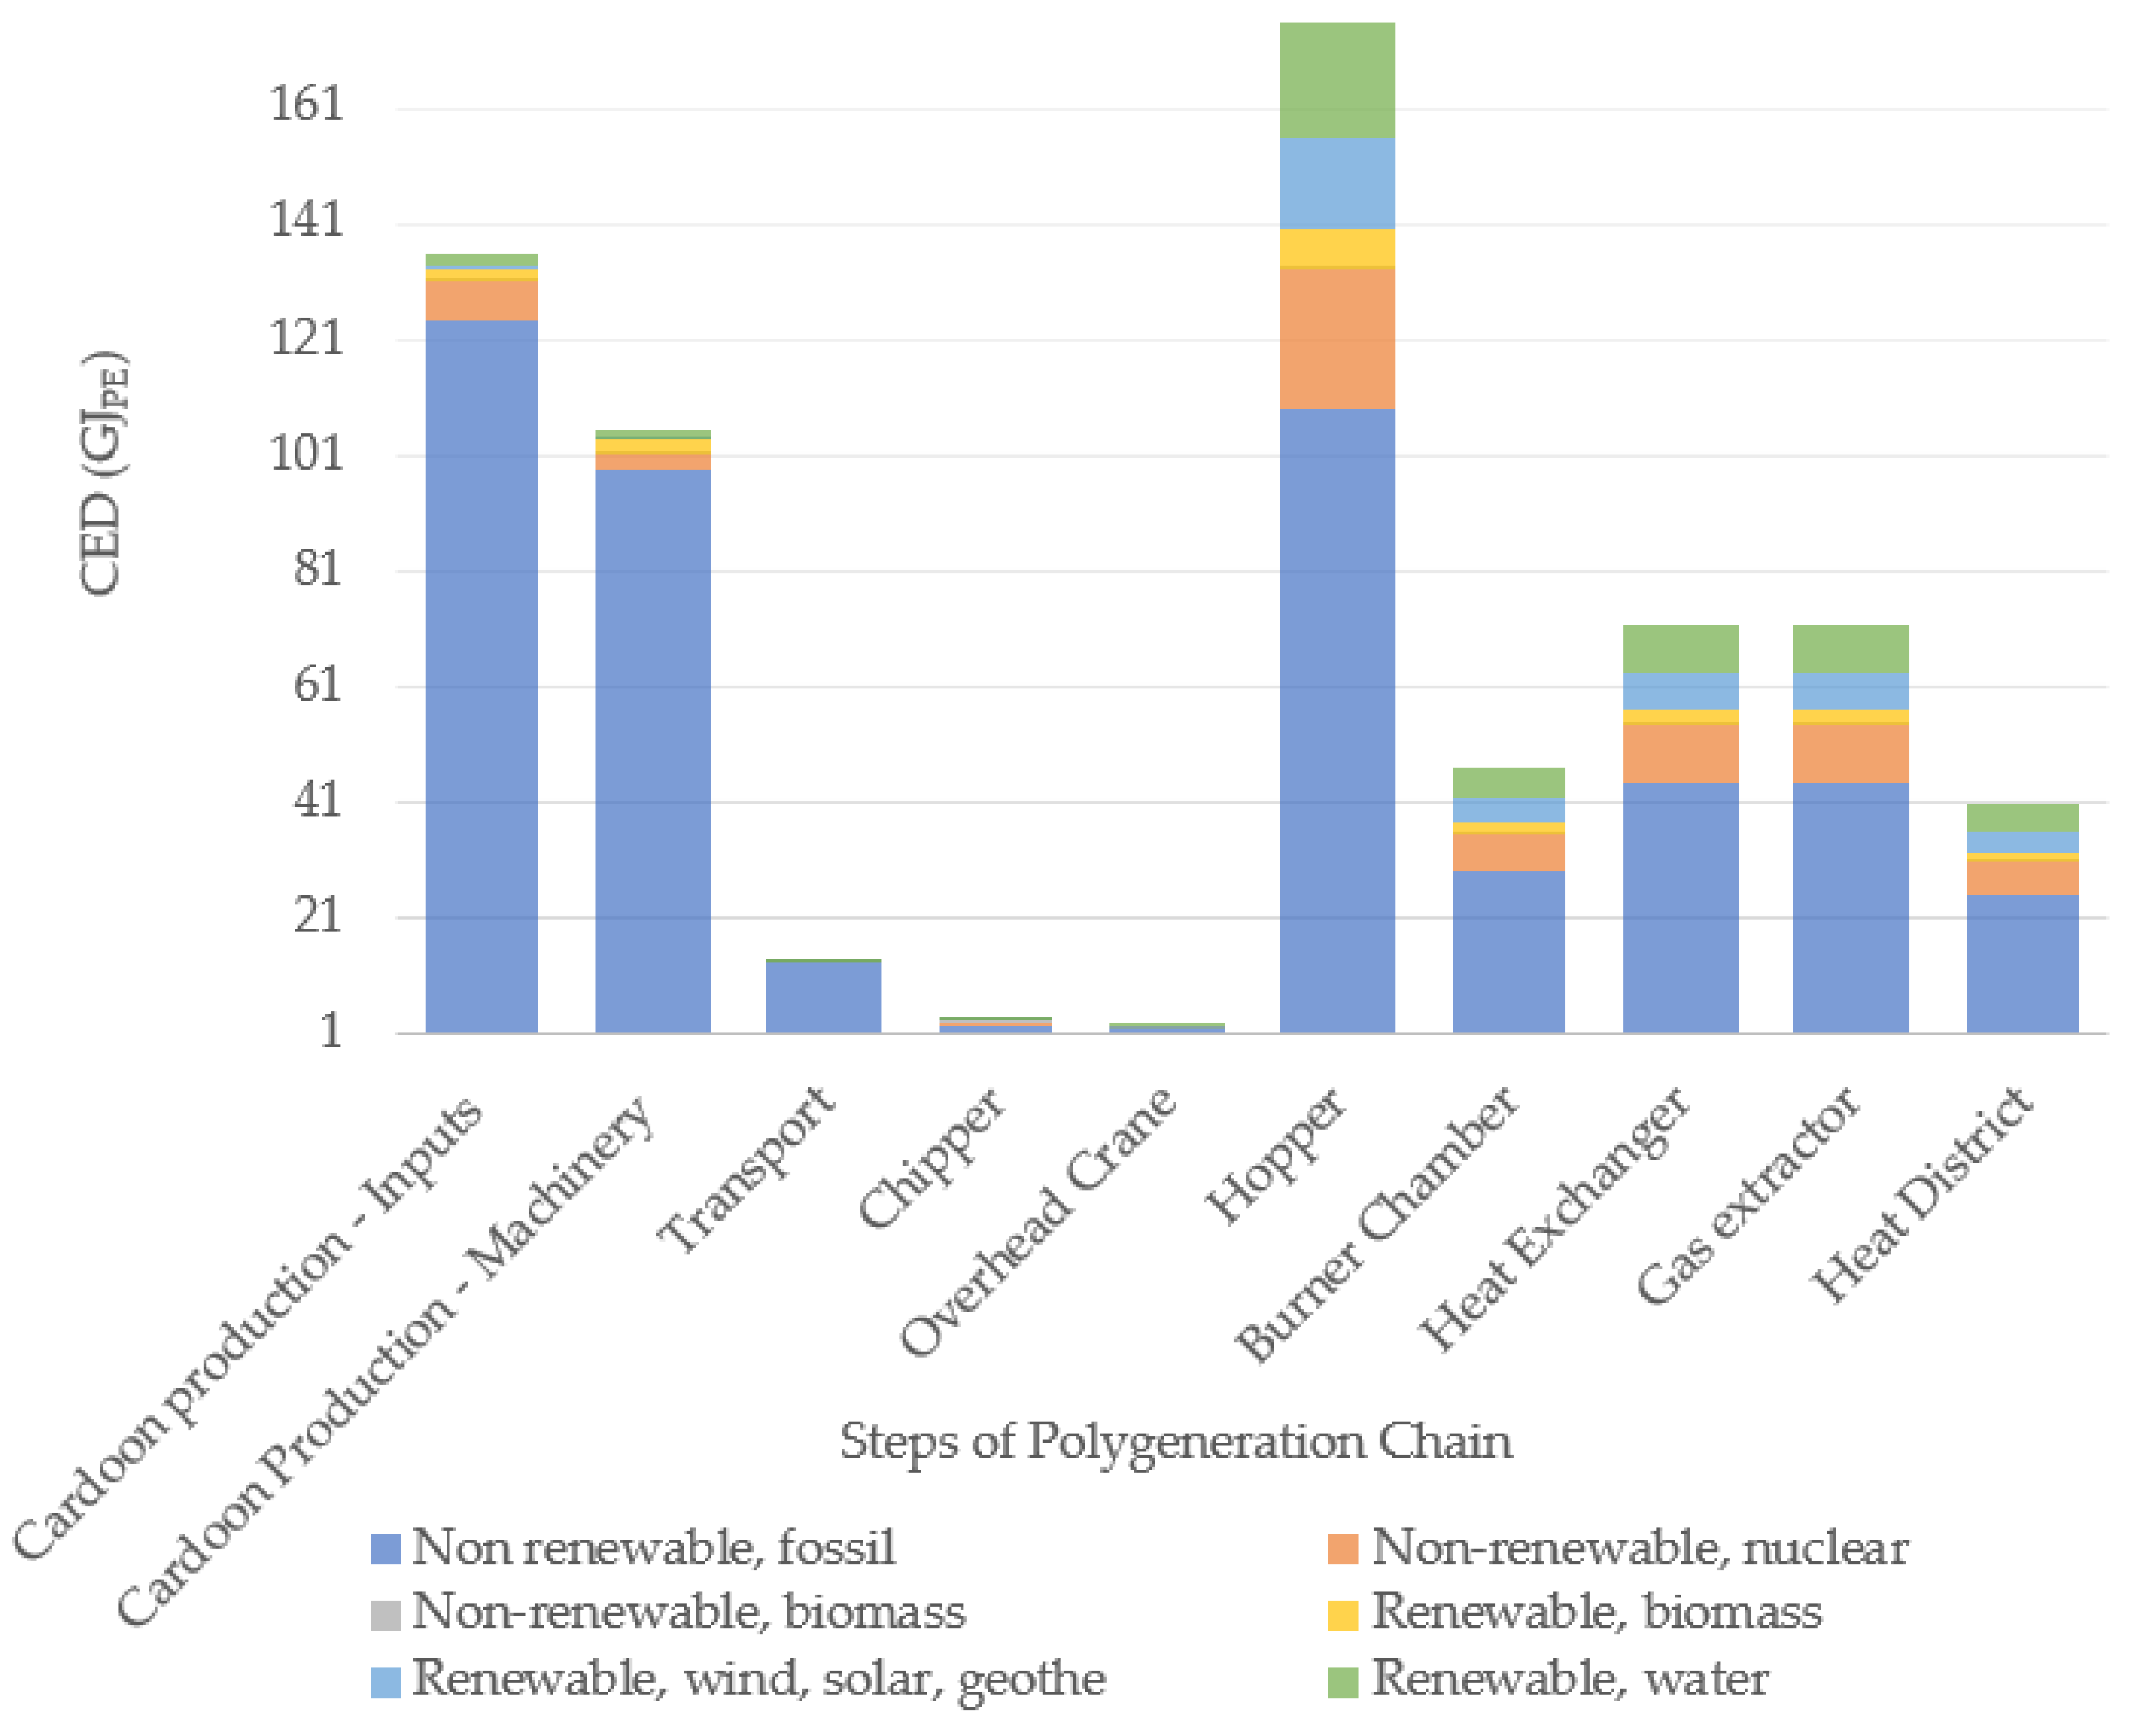
3.5.1. Cumulative Energy Demand

Based on the characterisation of the CED method, the primary energy demand needed from the cardoon production process for the conversion into electricity, heating, and cooling was determined, identifying the demands related to each phase of the production chain, as shown in Figure 3.
The annual primary energy demand for the entire polygeneration chain was 667.23 GJPE. To produce the same amount of electricity, heating, and cooling (720 GJPD, 972 GJPD, and 504 GJPD) using traditional Italian energy and gas grid sources, 3380.14 GJPE would be needed. From this total, approximately 1792.61 GJPE would be demanded by the power grid for the electric supply. Considering that the heat was produced through gas boilers consuming methane from the gas grid, a total consumption of 1173.07 GJPE would be required. To provide the same cooling, considering an electrical conditioner consuming energy from the power grid, 414.46 GJPE would be required.

3.5.2. ReCiPe—Midpoint–Normalisation

Applying the ReCiPe Midpoint method, it was possible to have a wider view of the environmental impacts based on 18 different impact categories (Table A1), and to enable the possibility of comparing the different impacts caused by polygeneration chain, the results were normalised. The midpoint indicator scores were put into perspective, relating them to a common unit, as shown in Figure 4.
As seen in Figure 4, about 98% of the total impact burden was caused by five impact categories: Terrestrial ecotoxicity, Freshwater ecotoxicity, Marine ecotoxicity, Human carcinogenic toxicity, and Human non-carcinogenic toxicity. The same pattern was observed when using the Italian power and gas grids.

3.5.3. ReCiPe—Midpoint–Characterisation

Table 3 shows the result of the characterization for the five impact categories individualised by the normalisation procedure, for both the polygeneration plant as well as the Italian energy and gas grid. The complete characterisation results with all 18 ReCiPe impact categories can be seen in Table A1.

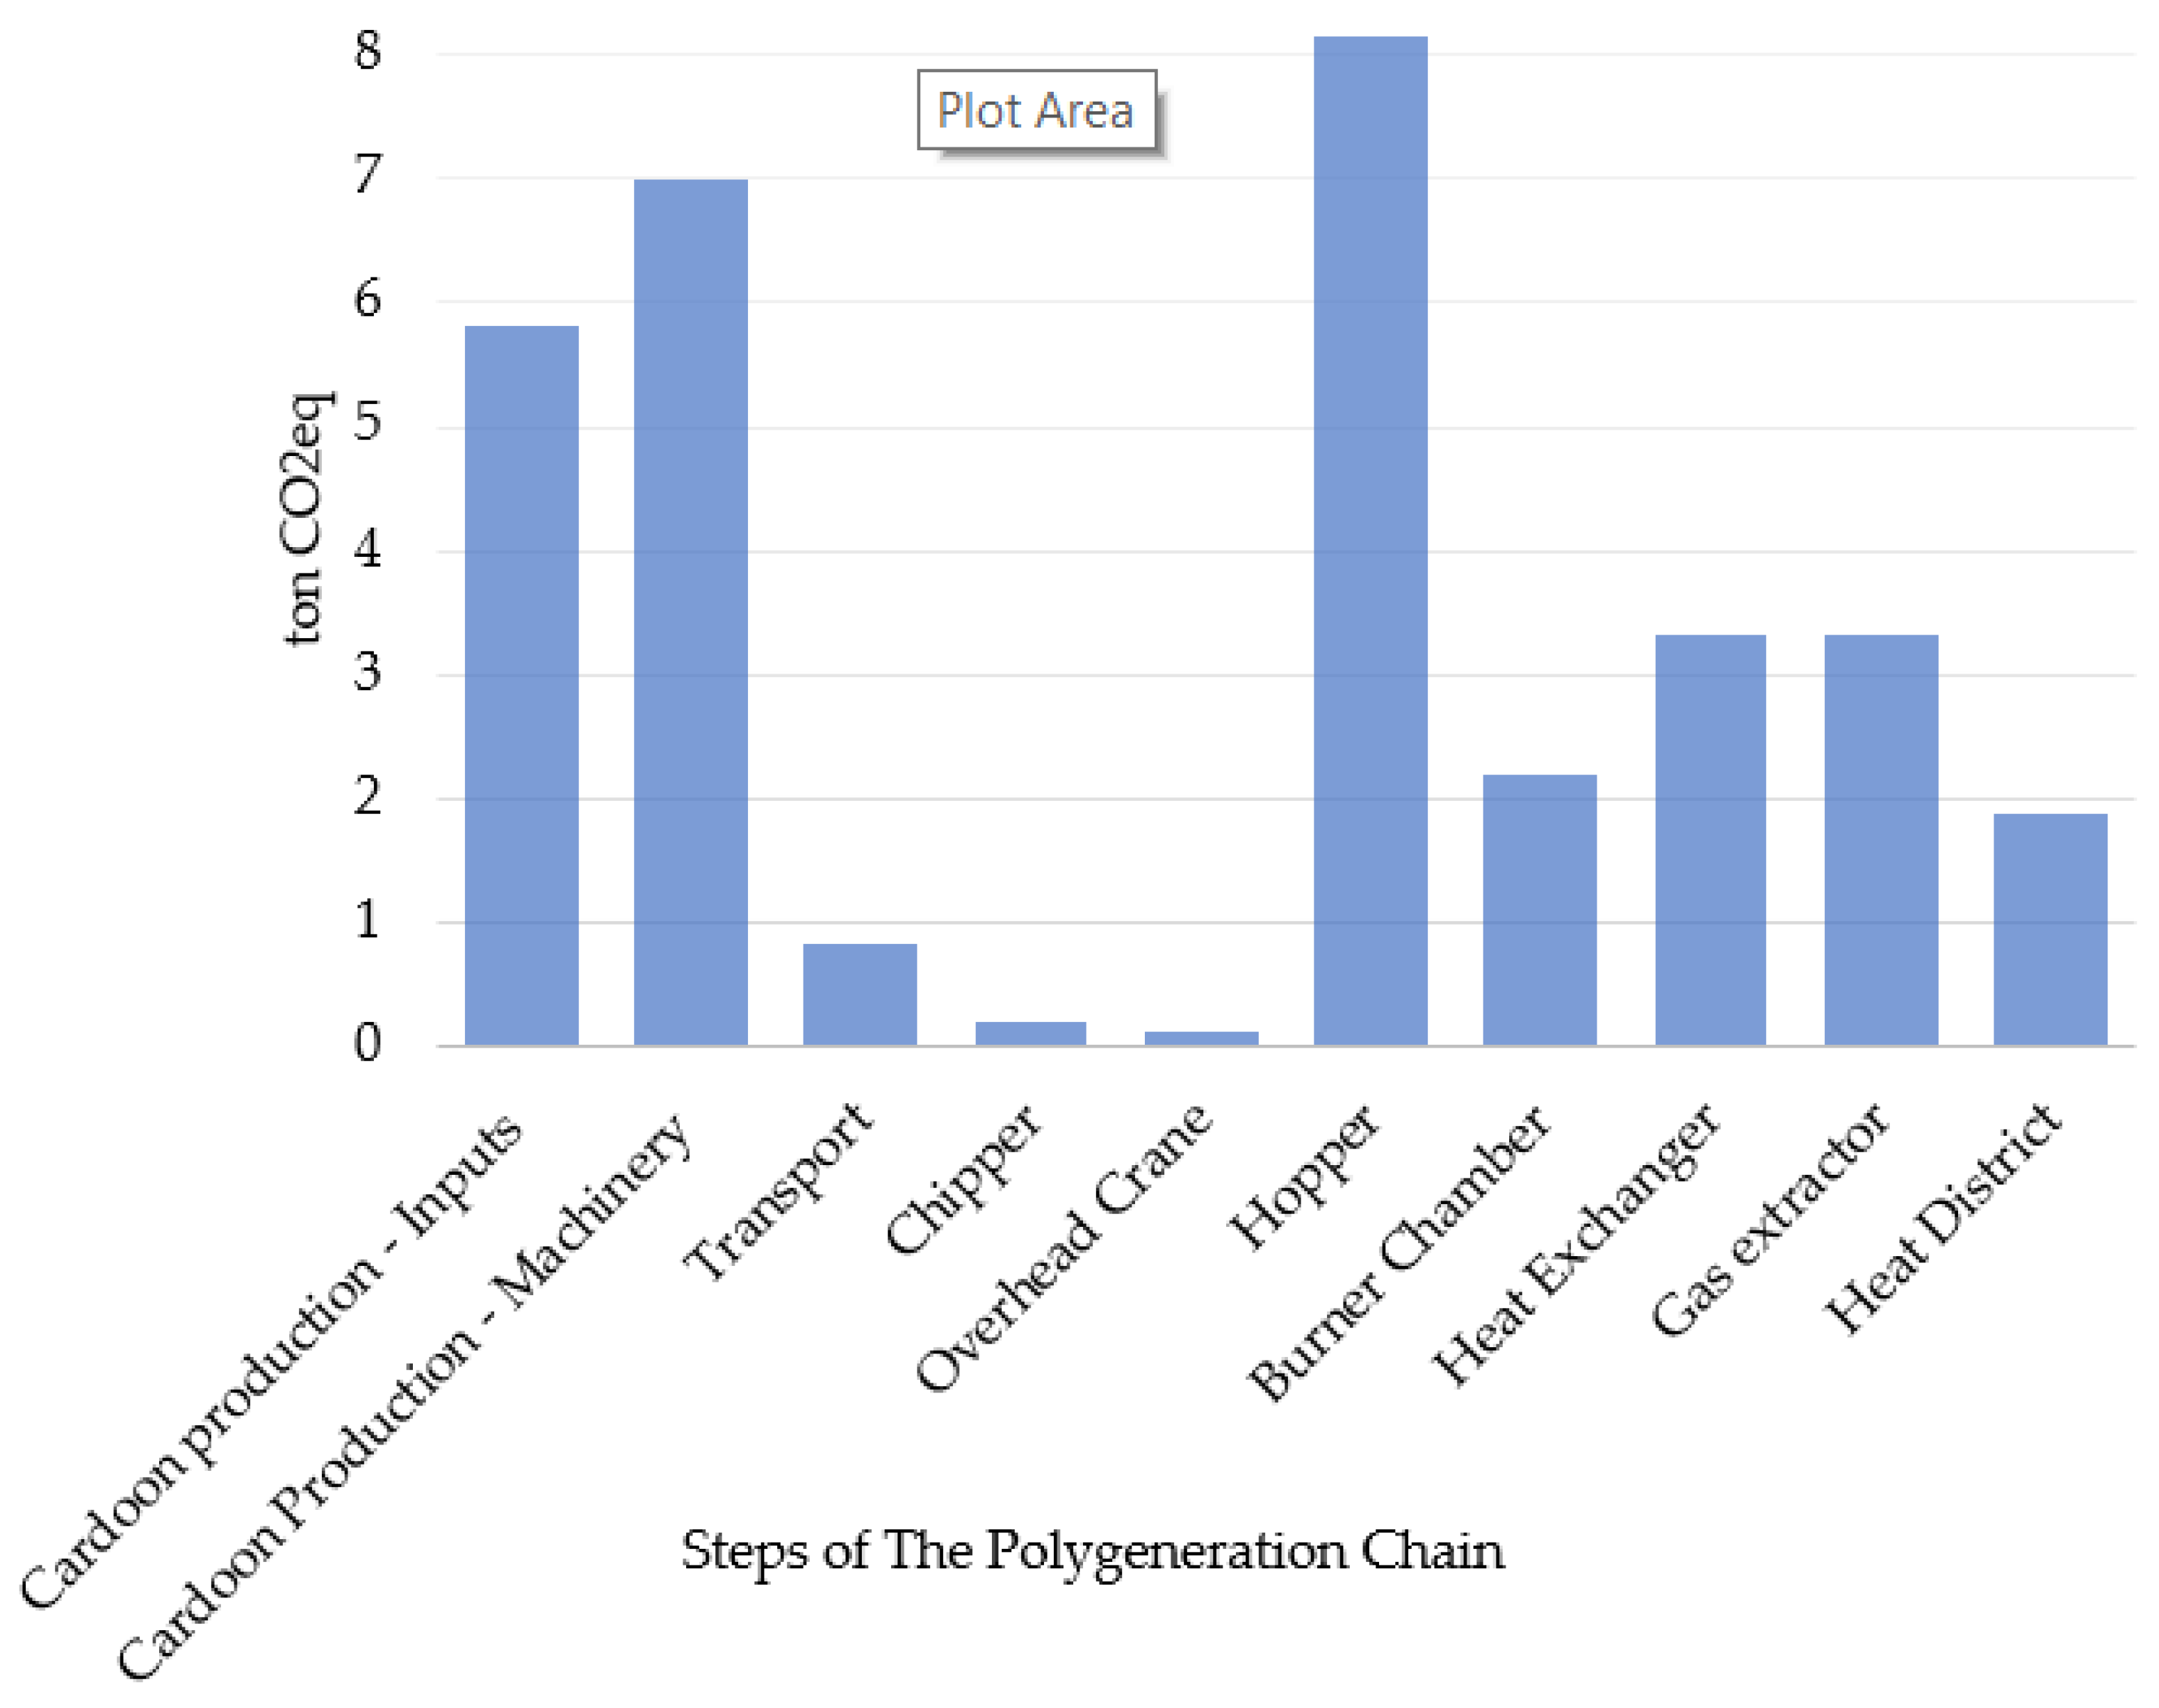
3.5.4. ReCiPe—Midpoint–Global Warming Potential

ReCiPe’s “Global Warming” impact category characterisation was calculated based on the IPCC GWP methodology, determining the GHG emissions in terms of CO2eq, as shown in Figure 5.
The whole polygeneration chain emitted around 32.82 tCO2eq/year. Considering the traditional power and gas grids supplying the sources for producing same amount of electricity, heating, and cooling, around 176.48 tCO2eq would be emitted.

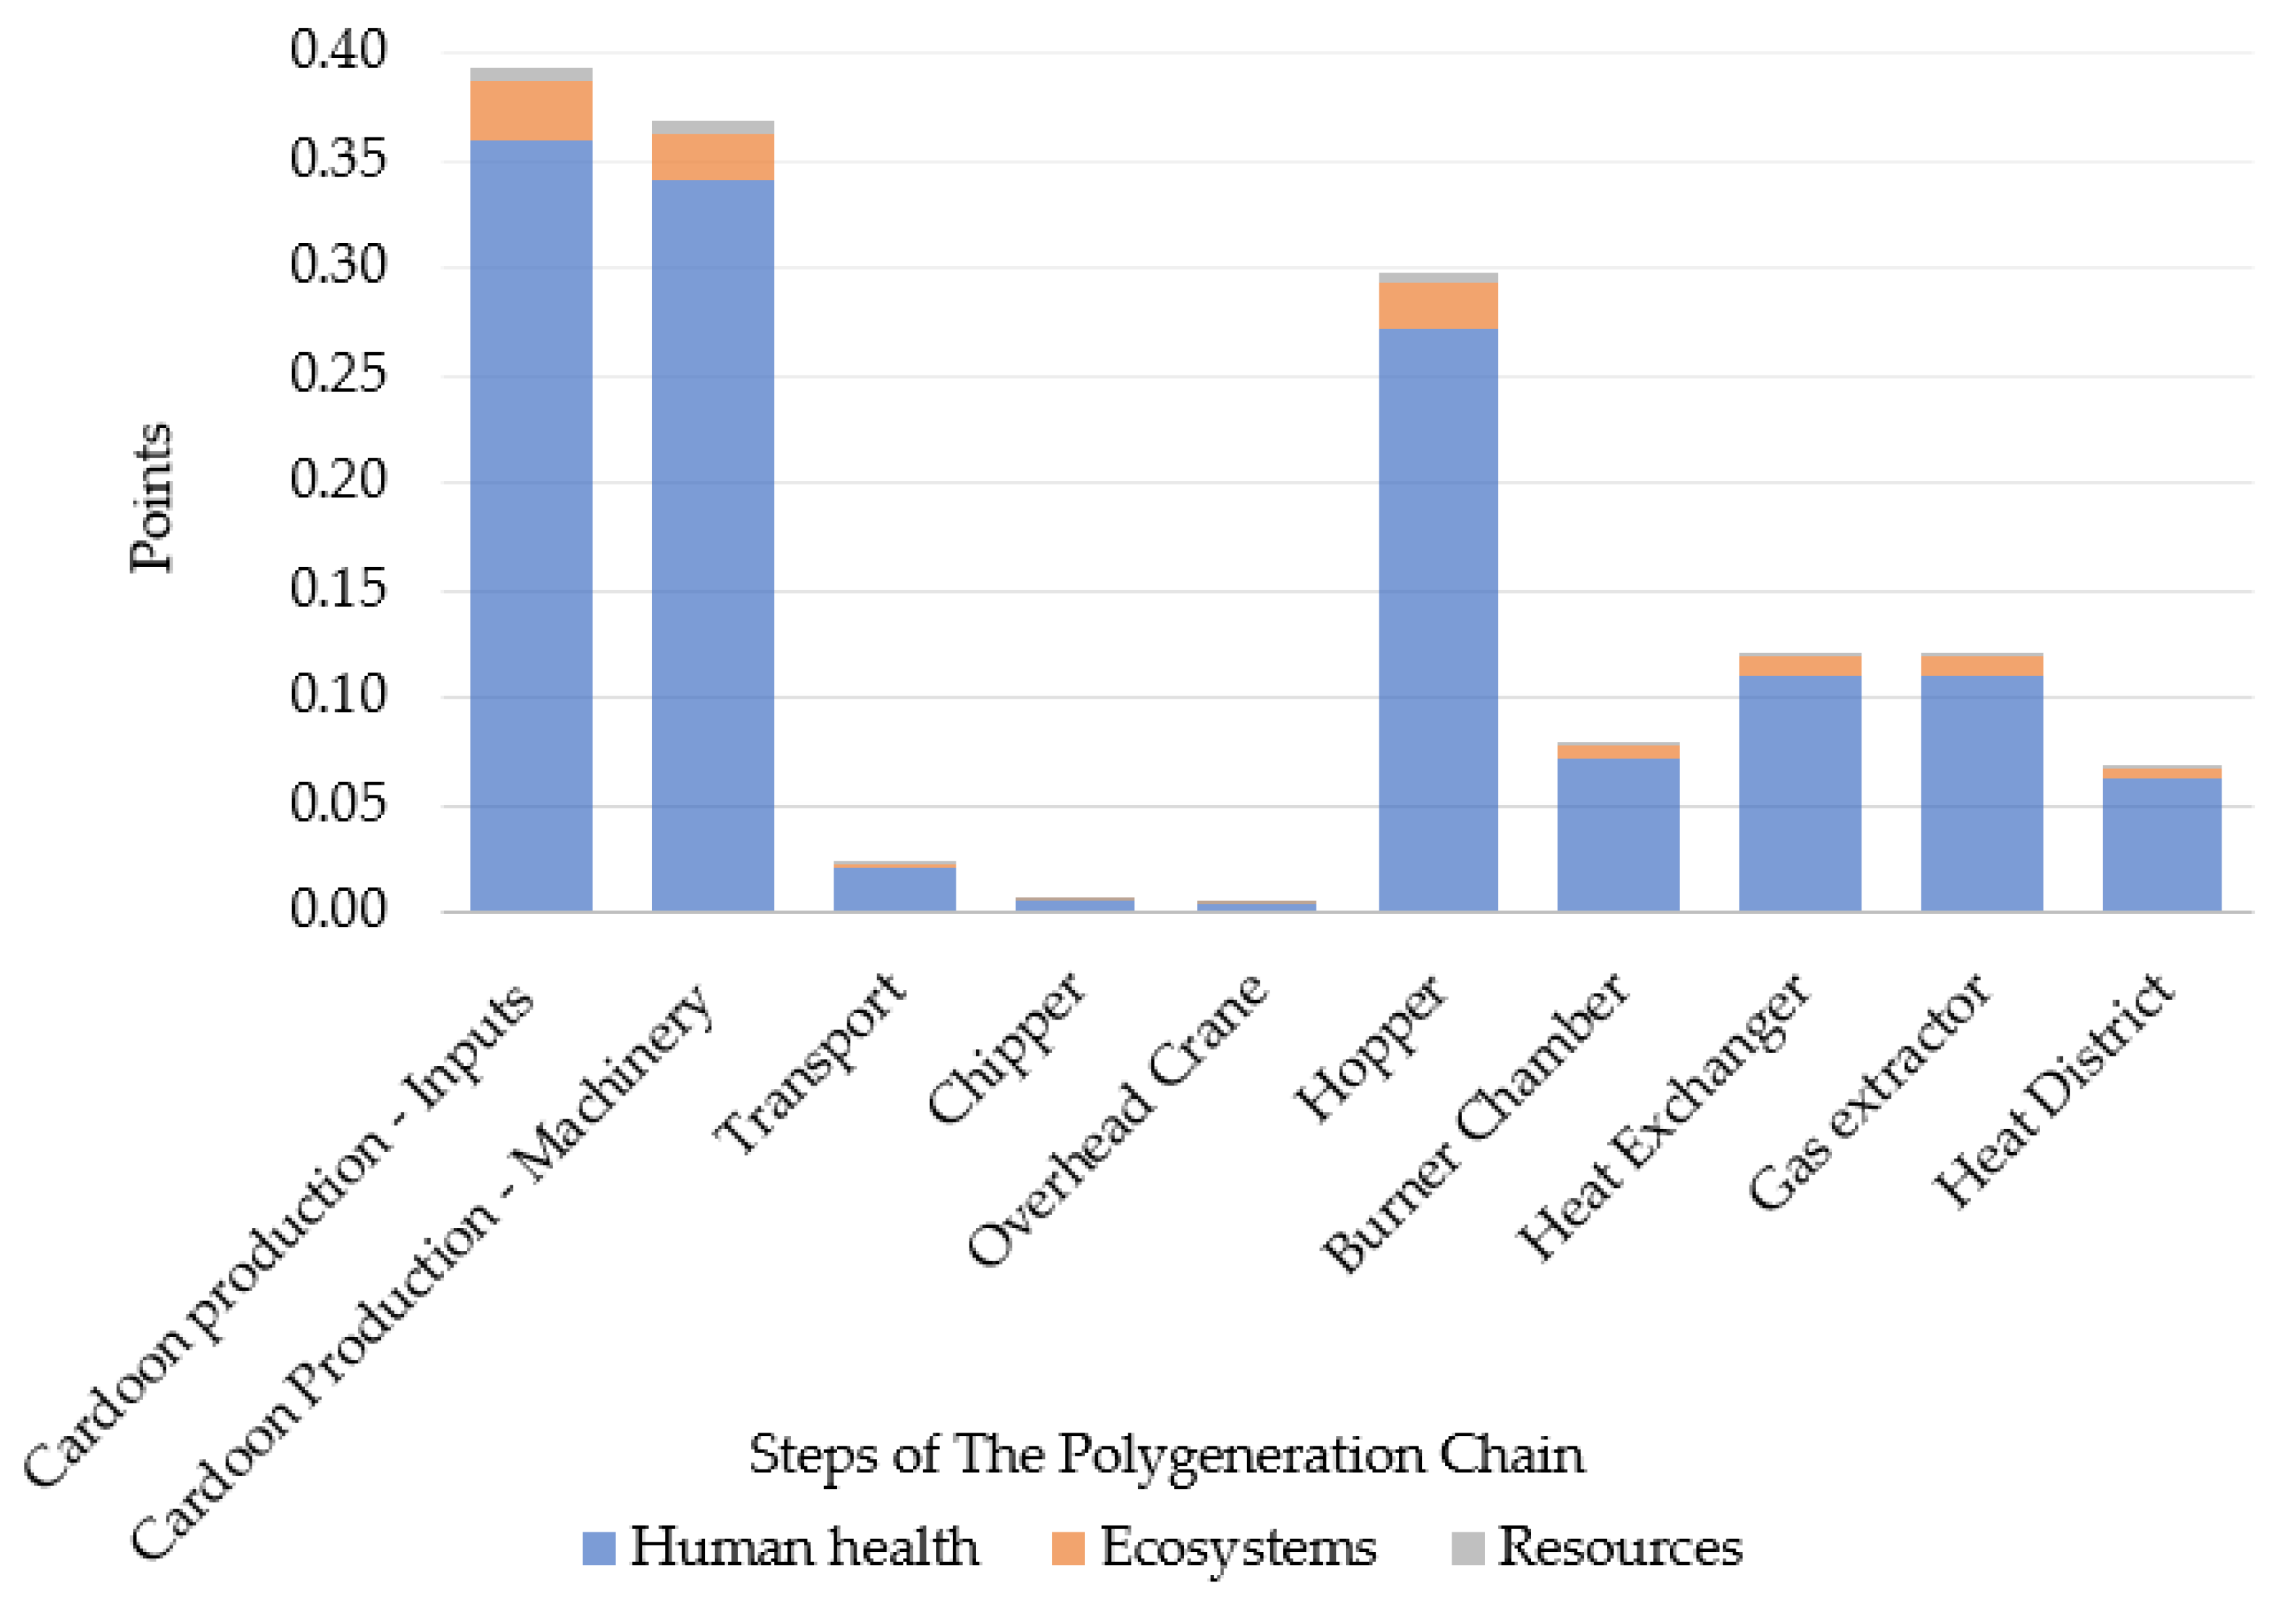
3.5.5. ReCiPe—Endpoint

Aiming at attaining a more comprehensive image of the environmental impacts, the ReCiPe Endpoint H/A was applied. Through this practice, it was possible to group all 18 impact categories into three protected areas, which are human health, ecosystems, and resources. The single-point endpoint results are shown in Figure 6.
The total score for the three categories was 1.49 points for the polygeneration chain. On the other hand, the score for the Italian grid was 5.31 points.

4. Discussion

4.1. Crop Production

The material flows and processes of the agricultural production inventory were fertilizers and machinery. Data related to fertilization are real data provided by the producer, and data linked to the use of machinery was hypothesised based on the necessary processes during the cardoon cultivation. As shown in Table 1 and Table 2, no irrigation systems or pesticides were used during cultivation, which allowed a better environmental performance at this stage. Even without using irrigation systems, the crop showed a yield of 18 t/ha, close to the maximum of 20 t/ha reported by other authors [35,43,48]. In addition, the rainfall conditions in the region where cardoon was grown met the minimum seasonal rainfall of around 500 mm. As reported by local studies, the Porto Torres region has a range of 400 to 600 mm of seasonal rainfall [34,49].
As assumed by the supplier, the use of marginal lands is adopted as good practice for surpassing the problems attributed to the energy crop production in areas adapted to food crop production, incurring fewer environmental impacts. This practice represents an economic opportunity for areas that could be abandoned because of their unfavourable characteristics [50]. In addition, production fields were considered to be located 20 km from the polygeneration plant, hypothesising as if production was conducted on the periphery of the polygeneration plant, pointing to the reducing of the transport-related impacts.

4.2. Efficiency and Secondary Energy Demands

From the biomass’s energy content (4114.98 GJPE), 720 GJSE of electricity was produced for 2000 h/year. Here, the conversion efficiency was about 17%. In fact, in an electric power plant, the conversion efficiency usually ranges between 16% and 33%, confirming the validity of the preliminary result of 17%. Nevertheless, in a polygeneration plant with residual heat recovery, the energy efficiency could improve, with a series of positive consequences such as primary energy savings, cost reduction, and superior environmental performance.
Indeed, with polygeneration, it was possible to improve the energy efficiency. Concerning the recovery of the residual heat from the exhaust gases and expanded air from the turbine, it was possible to produce 972 GJPD of heat and 504 GJPD of cooling using the district heating and cooling system. With the energy recovery, the conversion efficiency reached 53%. The total secondary energy demand was 165.92 GJSE, and the rate of energy production per secondary energy consumed was 13.23 MJPD/MJSE.

4.3. Life Cycle Interpretation

4.3.1. Cumulative Energy Demand

Regarding the polygeneration chain, 667.23 GJPE was consumed. The rate of energy production per energy consumed was 3.29 MJPD/MJPE. The most demanding macro-phase was the polygeneration plant operations, responsible for 62% of the primary energy consumption, followed by the cardoon production (36%) and transportation (2%). Observing the single processes, the primary energy demands required were Hopper (26%), Cardoon’s inputs production (20%), Cardoon’s machinery use (16%), Heat Exchanger and Gas Extractor (11% each), Combustion chamber (7%), District Heating and Cooling (6%), Transport (2%), and Chipper and Overhead crane (1%). In fact, the Hopper and Machinery phases are highly energy demanding. The Hopper phase is a phase of the polygeneration plant that uses more engines with a higher power, and the machinery used in the cultivation of cardoon requires large amounts of diesel. In particular, the cardoon’s product-inputs phase, which is characterized by the production and use of fertilisers, has this high contribution due to the high energy demand at the time of production of these products. The production of both nitrogenous and phosphorous fertilizers demands substantial energy inputs [51].
According to the Italian energy mix used in the development of the model, around 83% of all primary energy consumed was derived from non-renewable sources. Furthermore, 73% of the total consumed energy was derived from fossil resources and 10% from nuclear sources. The total amount consumed from renewable sources was around 17%. The renewable energy mix included 8% hydroelectric, 6% wind, solar and geothermal, and 3% biomass.
At all stages of the polygeneration chain, the highest consumption was from non-renewable resources. However, it was highlighted that the steps related to the polygeneration plant had greater use of renewable resources, about 20% of the primary energy consumed, reflecting the share of green electricity supplied by the Italian power grid. In the cardoon production and transport stages, over 93% of the primary energy demand was produced by fossil sources, particularly because of the use of machinery and transport powered by diesel.
Considering the use of Italian power and gas grids for producing the same amount of electricity, heating, and cooling (720 GJPD, 972 GJPD, and 504 GJPD) as in the polygeneration plant, 3380.14 GJPE would be demanded, with 84% being produced by fossil sources. Furthermore, 1792.61 GJPE would be needed to produce the same sum of electricity. Considering that the heat was produced by gas boilers consuming the methane from the gas grid, a total consumption of 1173.07 GJPE would be necessary. Furthermore, to provide the same cooling, considering an electric conditioner consuming energy from the power grid, 414.46 GJPE would be needed. In the case of the Italian power and gas grids, the rate of energy production per energy consumed would be negative 0.65 MJPD/MJSE. In this respect, using the polygeneration plant, it would be possible to save around 2712.92 GJPE, or 1.23 MJPE/MJPD, i.e., an 80% reduction in PE.

4.3.2. ReCiPe—Midpoint–Normalisation

The indicator scores for the 18 different midpoints’ impact categories are expressed in units that vary from category to category. Therefore, aiming to compare all 18 categories and, thus, avoid burden shifting, the process of normalization was applied, placing all these categories in perspective and putting all different impacts in a common scale. As seen in Figure 4, 98% of the impact load was concentrated in five impact categories, which included Terrestrial ecotoxicity (2.44%), Freshwater ecotoxicity (32.21%), Marine ecotoxicity (50.1%), Human carcinogenic toxicity (8.75%), and Human non-carcinogenic toxicity (4.76%).
The production of agricultural inputs, particularly fertilisers, was the main source of the emissions, typically contributing to emissions into all environmental fields: air, water, and soil. In fact, the fertilizers used (Table 1) are significant sources of Phosphorus and Nitrogen emissions in the form of phosphates (PO43−) and nitrates (NO3), which affect groundwater and surface water via runoff and leaching processes, resulting in impacts on nearby water bodies and ultimately oceans and seas, i.e., contributing most to the midpoints’ freshwater ecotoxicity and marine ecotoxicity [26]. Furthermore, phosphorus, in particular, is derived from phosphate rocks, a non-renewable resource [52].

4.3.3. ReCiPe—Midpoint–Characterisation

For all five major categories mentioned, except for Human carcinogenic toxicity, the macro-phase of cardoon production was the most impacting phase, responsible for 55% to 86% of emissions. All these emissions are mainly related to the use of fertilisers (nitrogen and phosphate). In fact, nitrogen fertilisers are among the main agricultural inputs with high energy demand and a source of GHG emissions during the cultivation phase [35,53]. As for the Human carcinogenic toxicity category, the polygeneration phase was responsible for 62% of emissions. The polygeneration chain presented a superior performance with a reduction of between 25 and 73% for all the main impact categories compared with Italian power and gas grids.

4.3.4. ReCiPe—Midpoint–Global Warming Potential

Regarding the GHG emissions, 32.82 tCO2eq/year were emitted. The rate of GHG emissions was 0.01 kgCO2eq/MJPD. According to Figure 4, the distribution pattern of emissions was similar to the distribution of CED. The macro-phase that emitted the most GHG was the operations of the polygeneration plant, accounting for 58%, followed by the cardoon production phase (36%), and the transportation phase (2%). Regarding the unitary phases, the share of energy demand was hopper (25%), machinery (21%), inputs (18%), heat exchanger and gas extractor (10% each), combustion chamber (7%), heat district (6%), transport (2%), and chipper and overhead crane (1%). A total of 176.48 tCO2eq would be emitted by traditional power and gas grids to produce the same power, heating, and cooling as in the polygeneration plant. Here, the rate of CO2eq emissions would be 0.08 kgCO2eq/MJPD. Employing the proposed polygeneration system, approximately 144 tCO2eq would be prevented from being emitted into the atmosphere using the proposed polygeneration plant, and about 0.07 kgCO2eq/MJPD, i.e., an avoidance of about 81%.

4.3.5. ReCiPe—Endpoint

Using the ReCiPe Endpoint H/A method, it was possible to group the impact load in the three different protection areas. As shown in Figure 5, all phases of the polygeneration chain had their impacts concentrated in the protection area of human health, responsible for 92% of the impact load, followed by Ecosystems (7%) and resources (2%). Considering the macro-phases of the polygeneration chain, cardoon production was responsible for approximately 51% of the impacts, followed by the processes in the polygeneration plant (47%), and the transportation (2%). Regarding unitary phases, the impacts were divided into inputs (26%), machinery (25%), hopper (20%), heat exchange and gas extractor (8% each), heat district and burn chamber phases (5% each), transport (2%), and chipper and overhead crane (1%). Comparing the performance of the polygeneration plant with the Italian grid, it was possible to observe a reduction of approximately 72% in the total of the three protection areas. Approximately 70% of the impact load was related to electricity production and distribution on the Italian grid.

5. Conclusions

Many theoretical studies and evaluations on polygeneration can be found in the literature. However, evaluations of experimental and prototype plants are not very abundant, showing the practical value of this work.
This paper aimed to evaluate the environmental performance of the proposed polygeneration plant fed with lignocellulosic biomass of cardoon (Cynara cardunculus L.), using an LCA, comparing it with the production of the same output sources using the Italian power and gas grids. This was assessed using primary and secondary energy consumption, energy efficiency conversion, GHG emissions, and analysing 17 other ReCiPe impact categories.
It was possible to verify significant advantages in using the proposed polygeneration system in this project. With residual heat recovery, it was possible to increase the conversion efficiency by 36% compared to a traditional combustion-powered electricity production plant. The rates of energy demand and emissions per energy produced were 0.08 MJSE/MJPD, 0.30 MJPE/MJPD, and 0.01 kgCO2eq/MJPD.
Considerable advantages in terms of energy demand and emissions were observed in the proposed plant compared to the traditional gas and power grids. In this system, it was possible to reduce the primary energy consumption and GHG emissions by 80 and 81%, respectively. It was possible to reduce the emissions by between 25 and 73% in the five major impact categories of the ReCiPe method.
There was also evidence of a low share of renewable energy sources in the supply of electricity from the Italian grid. Only 17% of the energy resources used (power and fuels) were produced by renewable sources.

Limitations and Future Perspectives

The combustion of biomass was tested in this study. Nevertheless, this structure has a hybrid chamber that can be used as a biomass gasifier as well. In this matter, one of the future perspectives is to carry out a study testing the benefits of this polygeneration plant running with the gasification process, comparing it to the combustion process.
This study is a partial analysis of the proposed polygeneration chain, from the production of cardoon to the delivery of the energy sources (power, heat, and cooling) at the “gate” of the polygeneration plant. In this regard, this study presented a limitation when supplying the generated electricity. Therefore, a future perspective is to perform a further LCA, expanding the system’s boundaries and including the infrastructures for energy transmission.
Finally, future perspectives are expected to involve comparing the proposed system with other cogeneration systems, testing the plant with other lignocellulosic biomass, implementing a sensitivity analysis of the main specific variables in the LCA results when using marginal biomass, and performing a cradle-to-grave carbon footprint analysis.

Author Contributions

Conceptualization, R.B.L.T., G.C., A.P., V.C., P.I. and A.N.; Supervision, G.C., A.N. and F.C.; Writing—original draft, R.B.L.T.; Writing—review and editing, R.B.L.T. All authors have read and agreed to the published version of the manuscript.

Funding

Project PRIN (BIO-CHEAPER): Biomass Circular Holistic Economy Approach to Energy equipment, Prot. 20175TXJER. MIUR.AOODGRIC.REGISTRO_PRIN2017.0000749.27-03-2018.

Acknowledgments

The authors acknowledge, in particular, the Fondazione Cassa di Risparmio di Perugia for the economic support in the context of the project “I.Ph.D@UNIPG-Sviluppo dell’Internazionalizazione del dottorato di ricerca: Sostegno della Fondazione Cassa di Risparmio di Perugia ai corsi internazionali di Dottorato UNIPG”.

Conflicts of Interest

The authors declare no conflict of interest.

Appendix A

Figure A1. Annual mass flows from crop production to the polygeneration phase, and emission rate. MC—moisture content.
Energies 15 02397 g0a1
Table A1. ReCiPe Midpoint—characterisation—polygeneration chain.
Impact CategoryUnitFertiliserMachineryTransportChipperOverhead CraneHoppersBurner ChamberHeat ExchangerGas ExtractorHeat DistrictTotal
Global warmingkgCO2eq5815.576985.08820.74186.77116.218163.912182.603332.213332.211882.7032,817.98
Stratospheric ozone depletionkgCFC11eq0.003.65 × 10−35.71 × 10−41.49 × 10−49.27 × 10−56.51 × 10−31.74 × 10−32.66 × 10−32.66 × 10−31.50 × 10−32.23 × 10⁻²
Ionizing radiationkBqCo-60eq62.6747.836.502.071.2990.4724.1936.9336.9320.86329.72
Ozone formation, Human healthkgNOxeq16.2467.801.230.380.2416.784.496.856.853.87124.72
Fine particulate matter formationkgPM2.5eq22.8419.560.740.290.1812.593.365.145.142.9072.74
Ozone formation, Terrestrial ecosystemskgNOxeq16.5868.891.300.390.2417.054.566.966.963.93126.85
Terrestrial acidificationkgSO2eq61.3537.311.550.900.5639.2810.5016.0316.039.06192.57
Freshwater eutrophicationkgPeq0.830.280.010.010.010.460.120.190.190.112.20
Marine eutrophicationkgNeq1.33 × 10−12.03 × 10−21.72 × 10−31.96 × 10−31.22 × 10−38.57 × 10−22.29 × 10−23.50 × 10−23.50 × 10−21.98 × 10−23.57 × 10−1
Terrestrial ecotoxicitykg1,4-DCB45,870.6421,347.5010,926.28427.68266.1018,693.864997.757630.157630.154311.03122,101.12
Freshwater ecotoxicitykg1,4-DCB33.703.411.880.060.042.520.671.031.030.5844.91
Marine ecotoxicitykg1,4-DCB86.0216.967.740.330.2014.283.825.835.833.29144.29
Human carcinogenic toxicitykg1,4-DCB51.5360.613.881.841.1480.4221.5032.8232.8218.55305.13
Human non-carcinogenic toxicitykg1,4-DCB2713.065097.37150.1810.906.78476.54127.40194.51194.51109.909081.15
Land usem2acropeq1274.94209.7034.748.435.25368.5798.54150.44150.4485.002386.05
Mineral resource scarcitykgCueq271.8045.521.520.420.2618.274.887.467.464.21361.80
Fossil resource scarcitykgoileq2722.502149.19285.0754.2433.752370.85633.84967.69967.69546.7510,731.55
Water consumptionm3404.4322.092.343.682.29160.6742.9665.5865.5837.05806.67
Table A2. ReCiPe Midpoint—characterisation—polygeneration chain.
Machine/EquipmentEnginePower (kW)MotRpmCos φΔV/γA/ΔγHz
Overhead CraneLifting43-0.82230/40014.1/8.1350
Translation0.373-0.67230/4002.2/1.2750
Sliding0.75 - 230/400-50
HopperRakes4314450.82230/40014.1/8.1350
Screw1.10314000.78230/4004.7/2.7050
Combustion ChamberFan0.25328200.77230/4001.4/0.850
Fan0.25328200.77230/4001.4/0.850
Rakes0.3738800.67230/4002.2/1.2750
Rakes0.5539000.72230/4002.85/1.6550
Screw0.25313500.72230/4004.45/0.8450
Pump0.17---230/400-50
Heat Exchanger & Compressor RingFan4329000.88230/40013.3/7.450
CycloneFan4329000.88230/40013.3/7.450
District Heating and CoolingPump2---230/400-50
Fan0.25328200.77230/4001.4/0.850

References

  1. Ministero dell’Istruzione, dell’Università e della Ricerca. PRIN (BIO-CHEAPER) Project—Research Projects of Relevant National Interest—Biomasses Circular Holistic Economy Approach to Energy Equipment; Ministero dell’Istruzione, dell’Università e della Ricerca: Roma, Italy, 2018.
  2. Srivastava, N.; Srivastava, M.; Mishra, P.K.; Upadhyay, S.N.; Ramteke, P.W.; Gupta, V.K. Sustainable Approaches for Biofuels Production Technologies; Springer: Cham, Switzerland, 2019. [Google Scholar]
  3. Clauser, N.M.; González, G.; Mendieta, C.M.; Kruyeniski, J.; Area, M.C.; Vallejos, M.E. Biomass Waste as Sustainable Raw Material for Energy and Fuels. Sustainability 2021, 13, 794. [Google Scholar] [CrossRef]
  4. Sridhar, A.; Ponnuchamy, M.; Senthil Kumar, P.; Kapoor, A.; Xiao, L. Progress in the Production of Hydrogen Energy from Food Waste: A Bibliometric Analysis. Int. J. Hydrogen Energy 2021, 14, 258. [Google Scholar] [CrossRef]
  5. Sridhar, A.; Kapoor, A.; Senthil Kumar, P.; Ponnuchamy, M.; Balasubramanian, S.; Prabhakar, S. Conversion of Food Waste to Energy: A Focus on Sustainability and Life Cycle Assessment. Fuel 2021, 302, 121069. [Google Scholar] [CrossRef]
  6. Haq, I.; Qaisar, K.; Nawaz, A.; Akram, F.; Mukhtar, H.; Zohu, X.; Xu, Y.; Mumtaz, M.; Rashid, U.; Ghani, W.; et al. Advances in Valorization of Lignocellulosic Biomass towards Energy Generation. Catalysts 2021, 11, 309. [Google Scholar] [CrossRef]
  7. McKendry, P. Energy Production from Biomass (Part 1): Overview of Biomass. Bioresour. Technol. 2002, 83, 37–46. [Google Scholar] [CrossRef]
  8. Mehmood, M.A.; Ibrahim, M.; Rashid, U.; Nawaz, M.; Ali, S.; Hussain, A.; Gull, M. Biomass Production for Bioenergy Using Marginal Lands. Sustain. Prod. Consum. 2017, 9, 3–21. [Google Scholar] [CrossRef]
  9. Gominho, J.; Curt, M.D.; Lourenço, A.; Fernández, J.; Pereira, H. Cynara cardunculus L. as a Biomass and Multi-Purpose Crop: A Review of 30 Years of Research. Biomass Bioenergy 2018, 109, 257–275. [Google Scholar] [CrossRef]
  10. Ottaiano, L.; di Mola, I.; Impagliazzo, A.; Cozzolino, E.; Masucci, F.; Mori, M.; Fagnano, M. Yields and Quality of Biomasses and Grain in Cynara cardunculus L. Grown in Southern Italy, as Affected by Genotype and Environmental Conditions. Ital. J. Agron. 2017, 12. [Google Scholar] [CrossRef] [Green Version]
  11. Wu, M.R.; Schott, D.L.; Lodewijks, G. Physical Properties of Solid Biomass. Biomass Bioenergy 2011, 35, 2093–2105. [Google Scholar] [CrossRef]
  12. El-Sattar, H.A.; Kamel, S.; Vera, D.; Jurado, F. Tri-Generation Biomass System Based on Externally Fired Gas Turbine, Organic Rankine Cycle and Absorption Chiller. J. Clean. Prod. 2020, 260, 121068. [Google Scholar] [CrossRef]
  13. Paraschiv, L.S.; Serban, A.; Paraschiv, S. Calculation of Combustion Air Required for Burning Solid Fuels (Coal/Biomass/Solid Waste) and Analysis of Flue Gas Composition. Energy Rep. 2020, 6, 36–45. [Google Scholar] [CrossRef]
  14. Ahmadi, P.; Dincer, I.; Rosen, M.A. Development and Assessment of an Integrated Biomass-Based Multi-Generation Energy System. Energy 2013, 56, 155–166. [Google Scholar] [CrossRef]
  15. Lak Kamari, M.; Maleki, A.; Alhuyi Nazari, M.; Sadeghi, M.; Rosen, M.A.; Pourfayaz, F. Assessment of a Biomass-Based Polygeneration Plant for Combined Power, Heat, Bioethanol and Biogas. Appl. Therm. Eng. 2021, 198, 117425. [Google Scholar] [CrossRef]
  16. Rubio-Maya, C.; Uche-Marcuello, J.; Martínez-Gracia, A.; Bayod-Rújula, A.A. Design Optimization of a Polygeneration Plant Fuelled by Natural Gas and Renewable Energy Sources. Appl. Energy 2011, 88, 449–457. [Google Scholar] [CrossRef]
  17. Al-attab, K.A.; Zainal, Z.A. Externally Fired Gas Turbine Technology: A Review. Appl. Energy 2015, 138, 474–487. [Google Scholar] [CrossRef]
  18. Kautz, M.; Hansen, U. The Externally-Fired Gas-Turbine (EFGT-Cycle) for Decentralized Use of Biomass. Appl. Energy 2007, 84, 795–805. [Google Scholar] [CrossRef]
  19. Cocco, D.; Deiana, P.; Cau, G. Performance Evaluation of Small Size Externally Fired Gas Turbine (EFGT) Power Plants Integrated with Direct Biomass Dryers. Energy 2006, 31, 1459–1471. [Google Scholar] [CrossRef]
  20. Popli, S.; Rodgers, P.; Eveloy, V. Gas Turbine Efficiency Enhancement Using Waste Heat Powered Absorption Chillers in the Oil and Gas Industry. Appl. Therm. Eng. 2013, 50, 918–931. [Google Scholar] [CrossRef]
  21. Liu, F.; Chen, G.; Yan, B.; Ma, W.; Cheng, Z.; Hou, L. Exergy Analysis of a New Lignocellulosic Biomass-Based Polygeneration System. Energy 2017, 140, 1087–1095. [Google Scholar] [CrossRef]
  22. Islas, J. The Gas Turbine. Technol. Forecast. Soc. Chang. 1999, 60, 129–148. [Google Scholar] [CrossRef]
  23. Ferreira, S.B.; Pilidis, P. Comparison of Externally Fired and Internal Combustion Gas Turbines Using Biomass Fuel. J. Energy Resour. Technol. 2001, 123, 291–296. [Google Scholar] [CrossRef]
  24. Roy, D.; Samanta, S.; Ghosh, S. Techno-Economic and Environmental Analyses of a Biomass Based System Employing Solid Oxide Fuel Cell, Externally Fired Gas Turbine and Organic Rankine Cycle. J. Clean. Prod. 2019, 225, 36–57. [Google Scholar] [CrossRef]
  25. Al-attab, K.A.; Zainal, Z.A. Performance of High-Temperature Heat Exchangers in Biomass Fuel Powered Externally Fired Gas Turbine Systems. Renew. Energy 2010, 35, 913–920. [Google Scholar] [CrossRef]
  26. Hauschild, M.Z.; Rosenbaum, R.K.; Olsen, S.I. (Eds.) Life Cycle Assessment—Theory and Practice; Springer International Publishing: Cham, Switzerland, 2018; ISBN 978-3-319-56474-6. [Google Scholar]
  27. Finnveden, G.; Hauschild, M.Z.; Ekvall, T.; Guinée, J.; Heijungs, R.; Hellweg, S.; Koehler, A.; Pennington, D.; Suh, S. Recent Developments in Life Cycle Assessment. J. Environ. Manag. 2009, 91, 1–21. [Google Scholar] [CrossRef] [PubMed]
  28. ISO. Environmental Management—Life Cycle Assessment—Principles and Framework (ISO 14040); International Organization for Standardization (ISO): Geneva, Switzerland, 2006. [Google Scholar]
  29. ISO. Environmental Management—Life Cycle Assessment—Requirements and Guidelines (ISO 14044); International Organization for Standardization (ISO): Geneva, Switzerland, 2006. [Google Scholar]
  30. Letcher, T. Comprehensive Renewable Energy, 1st ed.; Elsevier: Amsterdam, The Netherlands, 2012. [Google Scholar]
  31. Sustainability SimaPro. Available online: https://simapro.com/ (accessed on 22 February 2022).
  32. Wernet, G.; Bauer, C.; Steubing, B.; Reinhard, J.; Moreno-Ruiz, E.; Weidema, B. The Ecoinvent Database Version 3 (Part I): Overview and Methodology. Int. J. Life Cycle Assess. 2016, 21, 1218–1230. [Google Scholar] [CrossRef]
  33. Agri-Footprint. Block Sustainability. In Agri-Footprint—Understanding the Impact of Food; Agri-Footprint: Gouda, The Netherlands, 2016. [Google Scholar]
  34. Deligios, P.A.; Sulas, L.; Spissu, E.; Re, G.A.; Farci, R.; Ledda, L. Effect of Input Management on Yield and Energy Balance of Cardoon Crop Systems in Mediterranean Environment. Eur. J. Agron. 2017, 82, 173–181. [Google Scholar] [CrossRef]
  35. Angelini, L.G.; Ceccarini, L.; Nassi o Di Nasso, N.; Bonari, E. Long-Term Evaluation of Biomass Production and Quality of Two Cardoon (Cynara Cardunculus L.) Cultivars for Energy Use. Biomass Bioenergy 2009, 33, 810–816. [Google Scholar] [CrossRef]
  36. Mettler Toledo Instruments Moisture Analyzer HB43-S. Available online: https://www.mt.com/in/en/home/phased_out_products/Laboratory_Weighing_Solutions/moisture-analyzer/Advanced_Moisture/HB43-S.html (accessed on 22 February 2022).
  37. LECO Instruments Calorimeter AC-350. Available online: http://www.zycon.com/Literature/128173/62890/ac-350%20flyer%20203-968.pdf (accessed on 22 February 2022).
  38. LECO Instruments Thermogravimetric Analyzer TGA701. Available online: http://lecoperu.com/wp-content/uploads/2018/05/TGA701-ESPECIFICACIONES-ENG-28052018.pdf (accessed on 22 February 2022).
  39. Huijbregts, M.A.J.; Rombouts, L.J.A.; Hellweg, S.; Frischknecht, R.; Hendriks, A.J.; van de Meent, D.; Ragas, A.M.J.; Reijnders, L.; Struijs, J. Is Cumulative Fossil Energy Demand a Useful Indicator for the Environmental Performance of Products? Environ. Sci. Technol. 2006, 40, 641–648. [Google Scholar] [CrossRef] [Green Version]
  40. Goedkoop, M.; Heijungs, R.; Huijbregts, M.; Schryver, A.; Struijs, J.; Zelm, R. ReCiPE 2008: A Life Cycle Impact Assessment Method Which Comprises Harmonised Category Indicators at the Midpoint and the Endpoint Level; National Institute for Public Health and the Environment: Utrecht, The Netherlands, 2008.
  41. Krug, T.; Tanabe, K.; Srivastava, N.; Jamsranjav, B.; Fukuda, M.; Troxler, T. Revised Supplementary Methods and Good Practice Guidance Arising from the Kyoto Protocol; Intergovernmental Panel on Climate Change Switzerland: Cham, Switzerland, 2014. [Google Scholar]
  42. Fernández, J.; Curt, M.D.; Aguado, P.L. Industrial Applications of Cynara cardunculus L. for Energy and Other Uses. Ind. Crops Prod. 2006, 24, 222–229. [Google Scholar] [CrossRef]
  43. Curt, M.D.; Sánchez, G.; Fernández, J. The Potential of Cynara cardunculus L. for Seed Oil Production in a Perennial Cultivation System. Biomass Bioenergy 2002, 23, 33–46. [Google Scholar] [CrossRef]
  44. González, J.F.; González-García, C.M.; Ramiro, A.; González, J.; Sabio, E.; Gañán, J.; Rodríguez, M.A. Combustion Optimisation of Biomass Residue Pellets for Domestic Heating with a Mural Boiler. Biomass Bioenergy 2004, 27, 145–154. [Google Scholar] [CrossRef]
  45. Angelini, L.; Ceccarini, L.; Di Nasso, N.; Bonari, E. Differences in Biomass Yield, Chemical Characteristics and Energy Balance between Two Giant Reed (Arundo donax L.) Genotypes. In Proceedings of the 15th European Biomass Conference and Exhibition, Berlin, Germany, 7–11 May 2007; pp. 607–612. [Google Scholar]
  46. Lewandowski, I.; Kicherer, A. Combustion Quality of Biomass: Practical Relevance and Experiments to Modify the Biomass Quality of Miscanthus x Giganteus. Eur. J. Agron. 1997, 6, 163–177. [Google Scholar] [CrossRef]
  47. Nassi o Di Nasso, N.; Ceccarini, L.; Bonari, E.; Angelini, L.G. Comparison among Perennial Lignocellulosic Species for Energy Production and Efficiency in Central Italy. In Proceedings of the International Symposium on Methodologies for Integrated Analysis of Farm Production Systems; Farming Systems Design, Catania, Italy, 10 September 2007; pp. 45–46. [Google Scholar]
  48. Ceccarini, L.; Angelini, L.; Bonari, E. Caratteristiche Produttive e Valutazione Energetica della Biomassa di Miscanthus Sinensis Anderss, Arundo donax L. e Cynara cardunculus L. in Prove Condotte Nella Toscana Litoranea. In Proceedings of the Convegno Annuale Societa Italiana di Agronomia, Legnaro, Padova, 20–23 September 1999; p. 82. [Google Scholar]
  49. Caloiero, T.; Coscarelli, R.; Gaudio, R.; Leonardo, G.P. Precipitation Trend and Concentration in the Sardinia Region. Theor. Appl. Climatol. 2019, 137, 297–307. [Google Scholar] [CrossRef]
  50. Shortall, O.K. “Marginal Land” for Energy Crops: Exploring Definitions and Embedded Assumptions. Energy Policy 2013, 62, 19–27. [Google Scholar] [CrossRef]
  51. Swaminathan, B.; Sukalac, K.E. Technology Transfer and Mitigation of Climate Change: The Fertilizer Industry Perspective. In Proceedings of the IPCC Expert Meeting on Industrial Technology Development, Transfer and Diffusion, Tokyo, Japan, 21–23 September 2004. [Google Scholar]
  52. Cordell, D.; Drangert, J.-O.; White, S. The Story of Phosphorus: Global Food Security and Food for Thought. Glob. Environ. Chang. 2009, 19, 292–305. [Google Scholar] [CrossRef]
  53. Mantineo, M.; D’Agosta, G.M.; Copani, V.; Patanè, C.; Cosentino, S.L. Biomass Yield and Energy Balance of Three Perennial Crops for Energy Use in the Semi-Arid Mediterranean Environment. Field Crops Res. 2009, 114, 204–213. [Google Scholar] [CrossRef]
Figure 1. System boundaries—polygeneration chain. (Black—process steps/red—energy flows/blue—mass flows).
Energies 15 02397 g001
Figure 2. Polygeneration plant facilities: (A) polygeneration plant, (B) hopper, (C) screw conveyor, (D) combustion chamber, (E) combustion chamber interior, (F) combustion chamber rake engines, (G) compressor ring engine, (H) heat exchanger 1 tubular beam, (I) Turbec T100 turbine, and (J) cyclone.
Energies 15 02397 g002
Figure 3. Cumulative energy demand—characterisation—polygeneration chain.
Energies 15 02397 g003
Figure 4. ReCiPe midpoint—normalised—polygeneration chain.
Energies 15 02397 g004
Figure 5. Global warming potential—characterisation—polygeneration chain.
Energies 15 02397 g005
Figure 6. ReCiPe endpoint—single point—polygeneration chain.
Energies 15 02397 g006
Table 1. Life cycle inventory—polygeneration chain.
StepsMaterials/Energy/ProcessesAmount
Cardoon ProductionFertilizationCompost0.32 ton
Nitrogen fertilizer as N0.91 ton
Phosphate fertilizer as P2O52.32 ton
MachineryFertilizing, Tillage (harrowing and ploughing), Sowing, Combine harvesting, Swath, Baling, Bale loading15.80 ha/each
TransportTransport, freight, 32 ton, EURO65026.86 tkm
Polygeneration plantChipperElectricity1.61 GJSE
Overhead CraneElectricity1.01 GJSE
HopperElectricity70.56 GJSE
Combustion ChamberElectricity18.86 GJSE
Heat Exchanger & Compressor RingElectricity28.80 GJSE
CycloneElectricity28.80 GJSE
District Heating and CoolingElectricity16.27 GJSE
tkm—tonne-kilometer.
Table 2. Cardoon production—metadata.
Input/OutputValue
Seed production1.50 t/ha
Moisture at the harvesting8%
Oil content25%
Epigean fraction15 t/ha
Moisture epigean fraction15%
LHV epigean fraction16.37 MJPE/kg
Hypogeum fraction3 t/ha
Moisture hypogeum fraction50%
18:46 (diammonium phosphate)—N4.50 N
18:46 (diammonium phosphate)—p11.50 P
Chemical N57.50 kg
Biological N (from composts)20 kg
PE—Primary Energy.
Table 3. ReCiPe midpoint—characterisation—polygeneration chain and Italian grids.
Impact CategoryPolygeneration ChainItalian Power and Gas Grids
Terrestrial ecotoxicity (kg 1,4-DCB)122,101.12253,011.92
Freshwater ecotoxicity (kg 1,4-DCB)44.9170.93
Marine ecotoxicity (kg 1,4-DCB)144.29262.74
Human carcinogenic toxicity (kg 1,4-DCB)305.131133.36
Human non-carcinogenic toxicity (kg 1,4-DCB)9081.157289.68
Publisher’s Note: MDPI stays neutral with regard to jurisdictional claims in published maps and institutional affiliations.

