Article

An Electrothermal Model to Predict Thermal Characteristics of Lithium-Ion Battery under Overcharge Condition

by
Charles Mohamed Hamisi
1,2,
Pius Victor Chombo
1,2,
Yossapong Laoonual
2,3,* and
Somchai Wongwises
3,4
1
The Joint Graduate School of Energy and Environment (JGSEE), King Mongkut’s University of Technology Thonburi (KMUTT), Bang Mod, Thung Kru, Bangkok 10140, Thailand
2
Mobility & Vehicle Technology Research Center (MOVE), King Mongkut’s University of Technology Thonburi (KMUTT), Bang Mod, Thung Kru, Bangkok 10140, Thailand
3
Department of Mechanical Engineering, Faculty of Engineering, King Mongkut’s University of Technology Thonburi (KMUTT), Bang Mod, Thung Kru, Bangkok 10140, Thailand
4
National Science and Technology Development Agency (NSTDA), Pathum Thani 12120, Thailand
*
Author to whom correspondence should be addressed.
Energies 2022, 15(6), 2284; https://doi.org/10.3390/en15062284
Submission received: 10 February 2022 / Revised: 7 March 2022 / Accepted: 8 March 2022 / Published: 21 March 2022
(This article belongs to the Topic Safety of Lithium-Ion Batteries)

Abstract

:
Understanding the thermal characteristics of lithium-ion batteries (LIBs) under various operating situations is critical for improving battery safety. Although the application of LIBs in the real world is mostly transient, many previous models consider the phenomenon of the constant state. This study examines thermal behavior by developing a 2D electrothermal model to predict the thermal behavior of LIBs with overcharge abuse in high thermal conditions. The 18,650 cylindrical LiCoO2 graphite is investigated in a thermally controlled chamber at 35, 50, and 60 °C with a K-type thermocouple mounted on the LIB surface under charging rates of 1C, 2C, and 3C to acquire quantitative data regarding the thermal response of LIBs. Maximum critical temperatures are found at 62.6 to 78.9 °C, 66.4 to 83.5 °C, and 72.1 to 86.6 °C at 1C, 2C, and 3C, respectively. Comparing simulation analysis and experimental conditions, the highest relative error of 1.71% was obtained. It was found that relative errors increase as the charging rate increases. Moreover, increasing the charging current and surrounding temperature significantly increases the battery’s surface temperature. Furthermore, battery heat distribution appears almost uniform and tends to increase towards the positive terminal because cathode material is highly resistant. In addition, increasing the LIB heat transfer coefficient could positively improve the battery performance by eventually curbing the rise in battery temperature and reducing non-uniformity.

1. Introduction

The relatively high specific and volumetric energy density, lower self-discharge rate, and extended cycle lifetime are among the unique features making lithium-ion batteries (LIBs) a promising electrochemical energy storage unit for electric vehicle (EV) applications [1,2,3]. However, their energetic and combustible materials and temperature-sensitive behaviors present a safety concern when abused beyond their working limits [4]. Overcharging of LIBs due to charger failure or improper battery management system design has frequently resulted in accidents [5]. For instance, a Tesla Model S exploded in the supercharger in Norway [6], an Opel Ampera-e caught fire while charging in Germany [7], a G3 model caught fire while charging in China [8], an electric car in southern China exploded while charging [9], and another EV model exploded while charging in Dongguan, China [10]. All of these occurrences have heightened concerns regarding LIB safety. To enhance safety and avoid the catastrophic failure of LIB applications, such as those in electric vehicles, it is necessary to conduct further research on the thermal characteristics of LIBs during overcharge under high thermal fields.
The understanding of the internal heat generation rate and its phenomena of transportation within LIBs provides a foundation for a broader understanding of thermal behavior. Numerical modeling is a widely employed technique for exploring the theoretical knowledge of battery physics [11,12] from the atomic level to the heat transfer of the battery [13]. Thermal modeling is a useful tool for determining the thermal characteristics of LIBs when they are strained under various conditions. Ren et al. [14] created a model to predict the electrochemical and thermal behavior of a battery when it was overcharged by 0.33C, 0.5C, and 1C at 25 °C. They measured heat generation rates from various heat sources within the LIB and found that heat generated by the electrolyte and reactions between the electrolyte and lithium were the most dominant.
Park et al. [15] presented the thermal–electrochemical coupling model at an ambient temperature of 20 °C to examine the impact of active dissolution on the TR during overcharge. Zeng et al. [16] presented a model to characterize thermal and electrochemical behavior from normal charge to early overcharge at an ambient temperature of 30 °C. They revealed the domination of irreversible heat and the reaction of Li and Mn during the overcharge process. Zhu et al. [17] and Mao et al. [18] investigated the overcharge of a Li-ion battery at 30 °C and 25 °C, respectively, and both reported that the battery’s surface temperature and temperature rise are independent of C-rates. Manohar et al. [19] developed a coupled simplified electrochemical and thermal model of LIBs under the temperature of 25 °C. The constructed model was able to accurately forecast the voltage, capacity, and temperatures of the battery pack. However, the side reaction dominated the temperature rise and heat generation rate before the thermal runaway. Qi et al. [20] built an overcharge model of a LIB pack by coupling it with an electrochemical–thermal model. The pack consisted of three 10 Ah fully charged Li (Ni0.33Co0.33Mn0.33) O2 subjected to a surrounding temperature of 27 °C under a varying overcharge current. Their study analyzed the battery open-circuit voltage, onset time, and temperature of thermal runaway. Liu et al. [21] investigated the failure of LiFePO4 batteries in overdischarge circumstances at a temperature of 25 °C. They discovered that overcharging the battery caused it to lose its electrode surface, resulting in an increase in resistance. However, elevated temperature is another critical factor in the safety of LIBs. In real applications, the high temperature of the LIB could be caused by either the failure of the battery management system (BMS) or by elevated surrounding temperature, which in turn may trigger the failure of the LIB during the charging operation. In the above studies, the effect of extreme surrounding temperatures during the overcharging of the LIB is not taken into account.
In this study, a 2D electrothermal model is built to predict the thermal behavior of LIBs during overcharging at a high surrounding temperature. The prediction accuracy of the built model is verified through an experimental data set. The failure mechanism of the overcharged LIB is analyzed up to the activation of the current interrupt device (CID). The thermal behavior of the LIB was assessed at a charging current of 1C, 2C, 3C, and a predicted current rate of 4C and 5C at controlled surrounding temperatures of 35, 50, and 60 °C. The effect of the convection heat transfer (h) heat distribution and heat generated at each source was also examined.

2. Modeling of Thermal Behavior of LIB
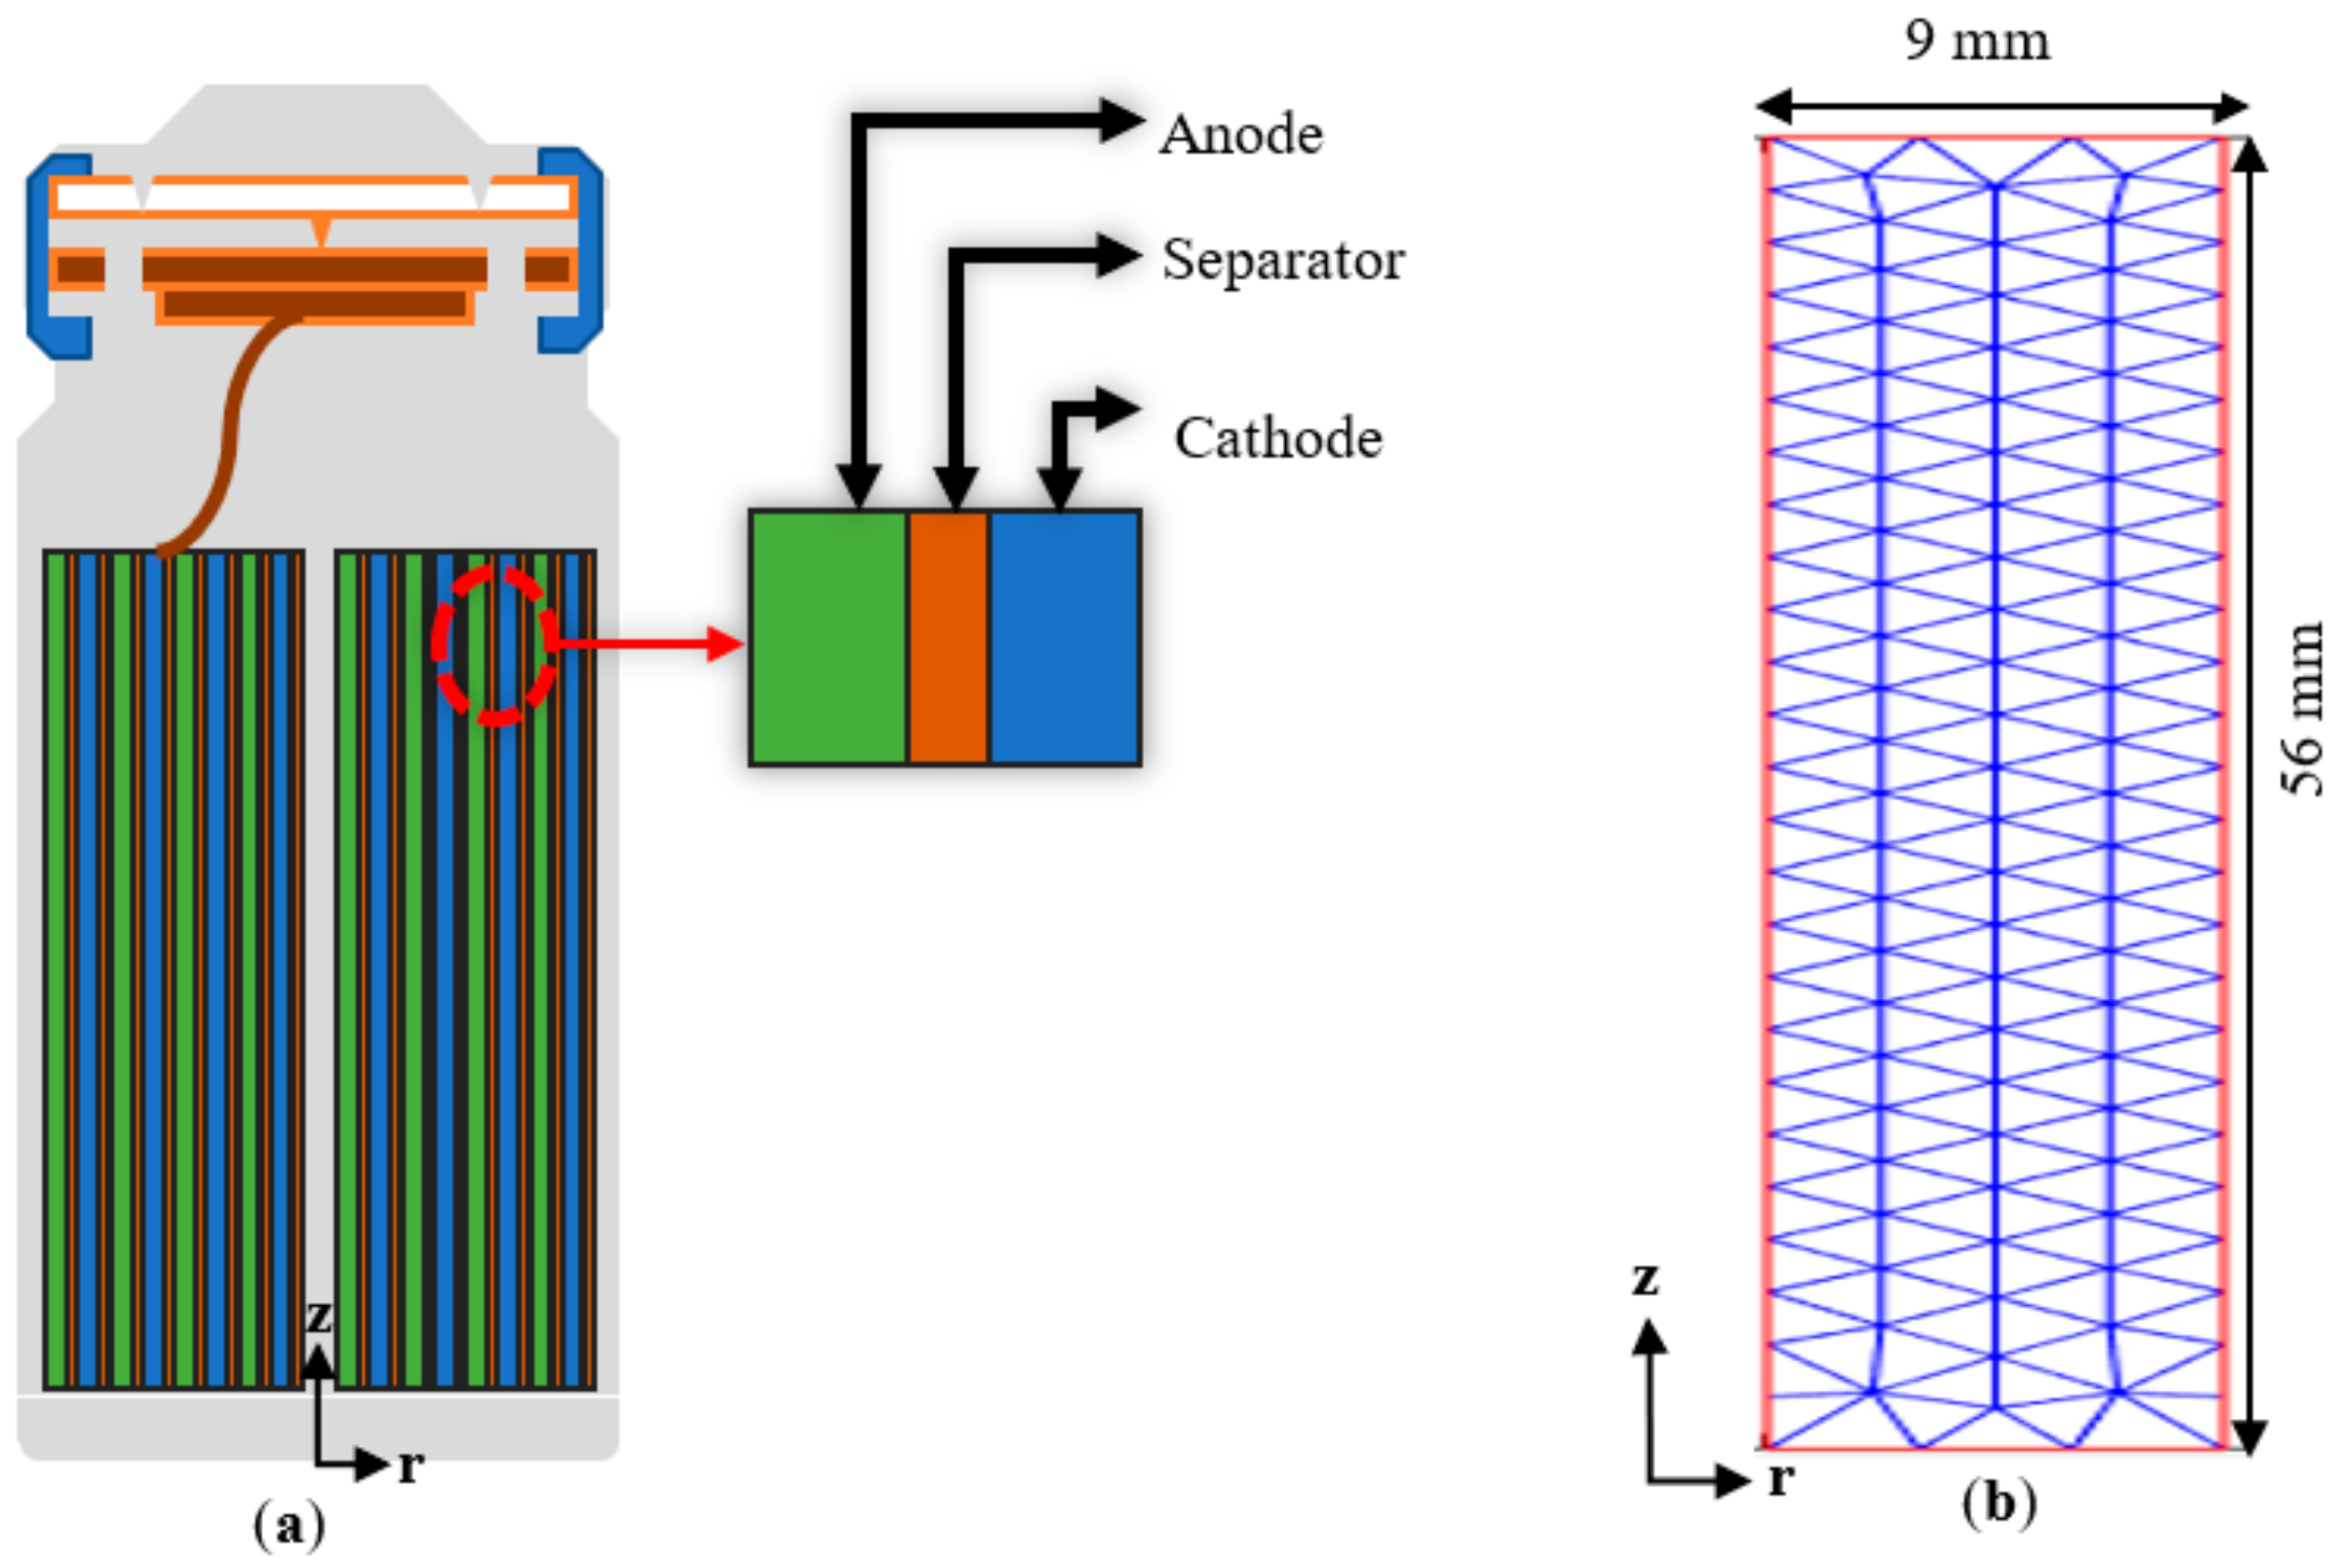
2.1. Physical Model

A cylindrical battery with a capacity of 2.6 Ah, 18,650 formats is considered in this study, and the detailed geometry of the LIB and mesh resolution in a half cycle is illustrated in Figure 1. It comprises a cathode, anode, separators, and current collectors. The chemical materials of the cathode, anode, and current collectors are LiCoO2, graphite, aluminum, and copper, respectively. Other components such as positive tabs, insulators, and steel are not considered [2] because they have minor effects on thermal generation and transport.
The thermal model of the battery is solved using a typical heat conduction equation. An electrothermal battery model is built to account for the battery surface temperature. As a result, Equation (1) represents the energy balance equation of the battery system.
ρ C p T t = k T + q g e n
Equation (1) can be further written as
ρ C p d T d t = k 1 r T r + 2 T r 2 + 2 T z 2 + 1 r 2 2 T θ 2 + q g e n
where ρ and Cp are battery density (kg/m3) and specific heat (J/kg·K), k is the whole battery thermal conductivity (W/m·K), T is the battery temperature (K), and t is the time (s). The subscripts z, r, and θ denote the properties along each of the radial directions, axial direction, and tangential direction, respectively. qgen is the heat generation rate (W/m3) which is a sum of heat due to electrochemical reactions and exothermic reactions.
The transient energy conservation equation and cylindrical coordinates make up the model. The heat generation is expected to be uniform in space but time-dependent because of the thinness of the utilized lithium-ion cylindrical battery. In both the radial and axial dimensions, the battery’s structure is considered as a homogenous solid with isotropic thermal conductivity. As a result, changes in temperature in the tangential direction are ignored [22]. Based on these assumptions, a cylindrical coordinate 2D battery heat transfer equation used for the calculation of battery temperature is presented in Equation (3).
ρ C p T t = k r 2 T r 2 + k r r T r + k z 2 T z 2 + q g e n
where ρ is the battery density (kg/m3), Cp is specific heat of the battery (J/kg·K), k is the battery thermal conductivity (W/m·K), T is the battery temperature (K), and t is the time (s). q g e n is the heat generation rates (W/m3). The explanations of boundary and initial conditions are given in Equations (4)–(8).
r = 0 , T t = 0 .
Initially, in the radial direction, there is no temperature rise at the lithium-ion battery core.
r = r 0 , k r T r = h r T T .
In the radial direction, the heat is transferred to the lithium-ion battery surface by conduction mode
z = 0 , T z = 0 .
Initially, there is no temperature rise at the lithium-ion battery core in the axial direction.
z = l , k z T z = h z T T .
In the axial direction, the heat is transferred to the lithium-ion battery surface by conduction mode
T r , z ; 0 = T 0 .
At t = 0 s, the LIB surface and ambient temperatures are equal.
In the boundary condition, the parameter r0 indicates a cylindrical battery cross-section radius (m), r indicates the cylindrical battery cross-section radial length in meters, l means the battery height in meters, h refers to the coefficient of heat exchange in W/m2·K, T0 is initial battery temperature (K) at time t = 0 s, T and T stand for surface battery temperature and ambient temperature, respectively (K). Equations (9)–(11) represent the battery’s total density, heat capacity, and thermal conductivity.
ρ = ρ i L i L b
C p = c p , i L i L b
k = L b L i k i
where i {anode, cathode, separator} indicates the index of the parameters corresponding to the anode, cathode, separator, and current collectors, Li is the thickness of anode, cathode, separator, and current collectors, whereas the Lb is the thickness of the whole battery. The term k is the thermal conductivity of the anode, cathode, separator, and current collectors. The thermophysical properties of the battery are shown in Table 1.

2.2. Heat Generation

Various sources in the battery contribute to heat generation. Generally, heat comes from two sources, namely heat generated from electrochemical and exothermic reactions. Thus, the second term on the right side of Equation (1) can be broken down as shown in Equation (12). Qele-ch is the heat generation due to electrochemical reactions, which comprises heat due to Joule heating (irreversible effect) and is influenced by the battery’s internal resistance and reversible entropic heat (generated as a result of Li+ intercalation/de-intercalation at the electrode–electrolyte interphase) as seen in Equations (12)–(15).
q g e n = Q e l e c h + Q e x o t h
Q e l e c h = Q j o u l e + Q e n t r o p y
Q j o u l e = i E o c E
Q e n t r o p y = i T d E o c d T
where Q j o u l e is calculated from the charging current and the open-circuit potential of the battery, Eoc, and battery voltage E (V); Q e n t r o p y accounts for the reversible heat generation rate with T as a battery temperature (K) and d E o c d T as an entropic heat coefficient (mV/K). The value d E o c d T can be neglected when the battery is overcharged, and the state of charge is above 1 [14].
The heat generation rate caused by the exothermic reactions can be expressed in Equation (16) which comprises the heat generation rate due to the decomposition of the solid electrolyte interphase (SEI) layer, anode, cathode, and electrolyte. To compute the individual heat generation rate, Equation (17) is employed, where the subscript x represents the SEI layer, anode, cathode, and electrolyte.
Q e x o t h = Q S E I + Q a n + Q c a t h + Q e l e c t
Q x = Δ H x m x A x exp E a , x R T ( t ) c x .
From Equation (17), ΔHx is the enthalpy change of the chemical reaction x; mx is the mass of battery reactant; Ax is the frequency factor; Ea,x is the energy activation; R is the universal gas constant (8.314 J/mol·K) [11]; cx is the reactor concentration. The parameter values of ΔHx mx Ax Ea,x, and c x for each reaction are shown in Table 2.
The solid electrolyte interphase (SEI) layer decomposes at high temperatures (65 to 120 °C) [23]. The heat created by the breakdown reaction raises the temperature of the battery, generating a chain reaction and thermal runaway. The kinetic equation’s reaction rate is depicted below.
Q S E I = Δ H S E I m S E I A S E I exp E a , S E I R T ( t ) c S E I .
At a temperature of roughly 120 °C, the SEI decomposes to a substantial extent and fails to prevent the negative electrode from reacting with the electrolyte, resulting in a reaction between intercalated lithium and the electrolyte inside the negative electrode. This response will also result in the formation of additional SEI, which will slow the process down. The reaction rate is computed as follows.
Q a n = Δ H a n . m a n . A a n . exp E a , a n R T ( t ) . c a n .
The positive electrode material decomposes separately at higher temperatures of 170 °C. It could also react with electrolytes, releasing oxygen and increasing heat output. The kinetic equation’s response is as follows.
Q c a t h = Δ H c a t h . m c a t h . A c a t h . exp E a , c a t h R T ( t ) . c c a t h .
Exothermal interactions between the positive electrode material and polyvinylidene fluoride (PVDF) continue when the electrolyte begins to degrade. Due to the internal short circuit and heat venting caused by the three reactions, the temperature of the battery rapidly rises. High temperatures trigger the reaction of the kinetic equation but the maximum temperature in this study was not greater than 90 °C; so, only QSEI is taken into account in this exothermic reaction.
Q e l e c t = Δ H e l e c t . m e l e c t . A e l e c t . exp E a , e l e c t R T ( t ) . c e l e c t .

2.3. Numerical Simulation Process

A partial differential equation (PDE) based commercial software, Matlab R2020a, is used to solve the electrothermal model presented in this study. The applied charging currents 1C, 2C, 3C and predicted charging currents of 4C and 5C with surrounding temperatures of 35, 50, and 60 °C are used as the model’s input parameters. The output of the model is the battery surface temperature distribution. The model is set to stop at a condition similar to the first failure incident (CID opening) depending on the charging current and temperature. The results of the predicted thermal behavior are compared with those from the experiment. For the final step, the relative error method was employed to validate the prediction accuracy of the model.

3. Experiment for Model Validation

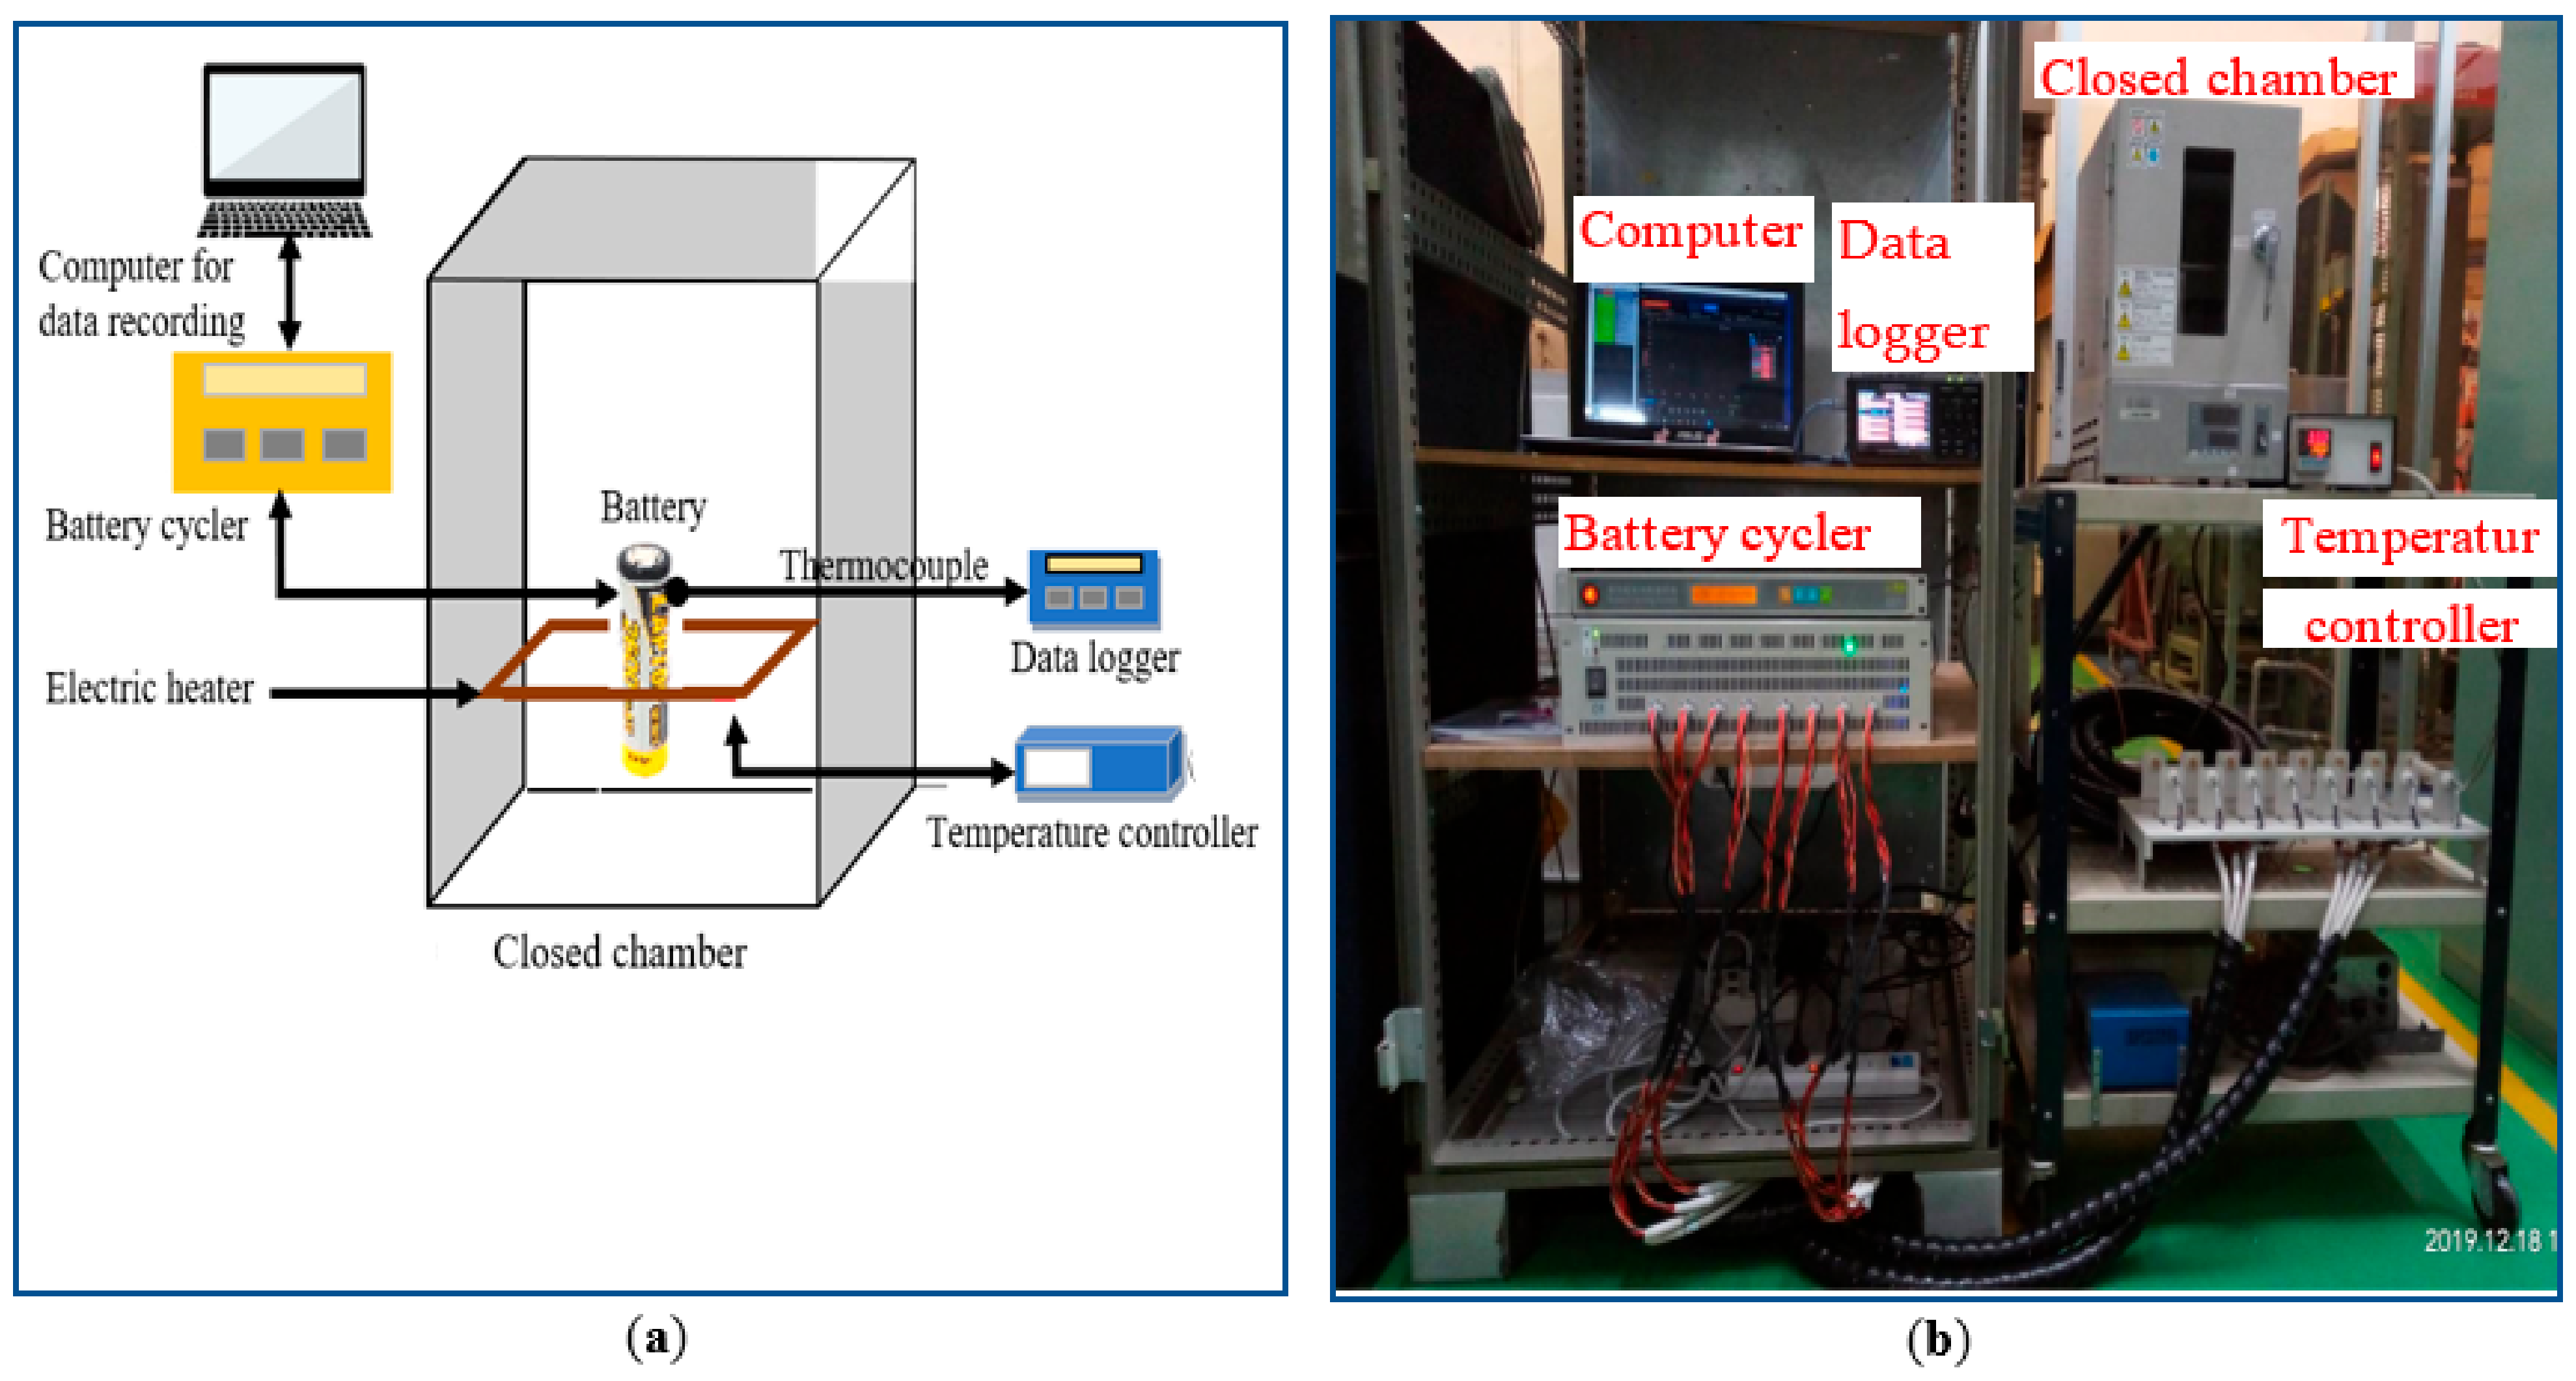
3.1. Experimental Setup

A commercial off-the-shelf cylindrical lithium-ion battery with a 2.6 Ah nominal capacity, 18,650 forma, lithium cobalt oxide (LiCoO2) coated on the aluminum sheet, termed as a positive current collector, and a graphite anode coated on the copper sheet, known as a negative current collector, and electrolyte were employed for overcharge tests. A battery cycler with an in-built electronic load controller and data acquisition system was used to pre-cycle the battery as recommended by the manufacturer. The standard current charging of 0.52 A, as shown in Table 3, was set to first charge the battery to its charging cut-off voltage of 4.2 V in constant current constant voltage (CC/CV) mode. All pre-cycling tests were performed at ambient temperature. Then, the batteries were stored in a cold environment of 25 °C for 24 h to stabilize their voltages.
The overcharge tests involved current rates of 1C, 2C, and 3C with a maximum voltage of 5 V. A battery was placed inside a thermal chamber capable of containing explosion fumes. The battery surface temperature was measured using one K-type thermocouple with accuracy to 1.1 °C attached near the cathode and a GL220 data logger collected second-by-second temperature data. The experimental setup with the thermocouple locations on the battery under test and testing equipment is depicted in Figure 2. The controlled temperatures of 35, 50, and 60 °C were set by heating the chamber and keeping it steady for about 30 min while holding the tested battery inside the chamber. The charging currents of 1C, 2C, and 3C at the fully charged state were then employed to overcharge until the first failure (activation of current interrupt device—CID) occurred. This physically separates the cathode from the circuit, and as a result, the current stops flowing through the battery to protect the battery against explosion. At this point, gases are released, and the temperature starts to decrease.

3.2. Observation of Battery Surface Temperature

The overcharging experiment was carried out under three different surrounding temperature conditions: normal surrounding temperature (35 °C) and high surrounding temperatures (50 and 60 °C). We overcharged the battery by different currents of 1C, 2C, and 3C at each surrounding temperature. The measured temperature curves under 1C charging rate at 35 °C are shown in Figure 3. Three overcharge stages were identified from the surface of the battery. The first stage (I) is heat accumulation, mainly caused by Joule heating and entropy change. At this stage, the battery surface temperature increased at a relatively low rate, approximately 0.17 °C/s. The surface temperature grew to 49.8 °C within the first 1700 s. There was neither an obvious side reaction nor gases evolving inside the battery. As a result, there was a small increase in surface temperature.
The second stage (II) is fast heat accumulation, where the battery temperature starts to increase more rapidly as the Joule effect and exothermic reactions predominantly cause the heat. In the meantime, a large amount of gas is produced and pressurizes the space between the current interrupting device (CID) and the safety vent disc. The observed temperature profile in Figure 3 shows that the battery surface temperature rises to nearly 62.6 °C in less than 550 s. The increasing rate of surface temperature is much higher (0.27 °C/s). The third stage (III) is a critical surface temperature for battery failure, where the battery is unable to accept further charge due to the activation of the internal safety device (CID). As a result, the battery surface temperature begins to gradually cool to ambient temperature.
In addition, as illustrated in Figure 4a–c, the rising temperature at 1C, 2C, 3C and projected rising temperature at 4C and 5C with a surrounding temperature of 35, 50, and 60 °C were observed. At 35 °C, the rising temperature amounted to 49.8, 54.6, and 58.3 °C, respectively, with overload rates of 1C, 2C, and 3C. As shown in Figure 4a, the predicted temperature rises at 4C and 5C were 61.1 and 64.8 °C, respectively. Moreover, at high surrounding temperatures of 50 and 60 °C, as shown in Figure 4b,c, the rising temperatures were 56.3, 61.8, 65.3 °C, and 69.6, 71.9, 75.1°C, respectively. Furthermore, at 4C and 5C at 50 and 60 °C, the predicted rising temperature based on empirical equations as shown in Figure 4b,c is 64.5, 66.7 °C, and 77.7, 80.5 °C, respectively. This demonstrates that, due to the Joule effect, increased surge currents raise the surface temperature of the battery. As a result, the extra current contributes significantly to the battery surface temperature.
In the simulation, as a condition of the integration between the first and second stage equation, the rising temperature was used. In contrast, Figure 5 shows the critical temperature for battery failure, where the battery was unable to accept further charge due to the activation of the internal safety device (CID). As a result, maximum critical temperature occurs at 62.6 to 78.9 °C, 66.4 to 83.5 °C, and 72.1 to 86.6 °C at 1C, 2C, and 3C, respectively, where the battery surface temperature began to gradually cool to ambient temperature. Furthermore, if the battery does not have an internal safety device (CID), the battery will explode due the current continuing to flow through it.

4. Results and Discussions

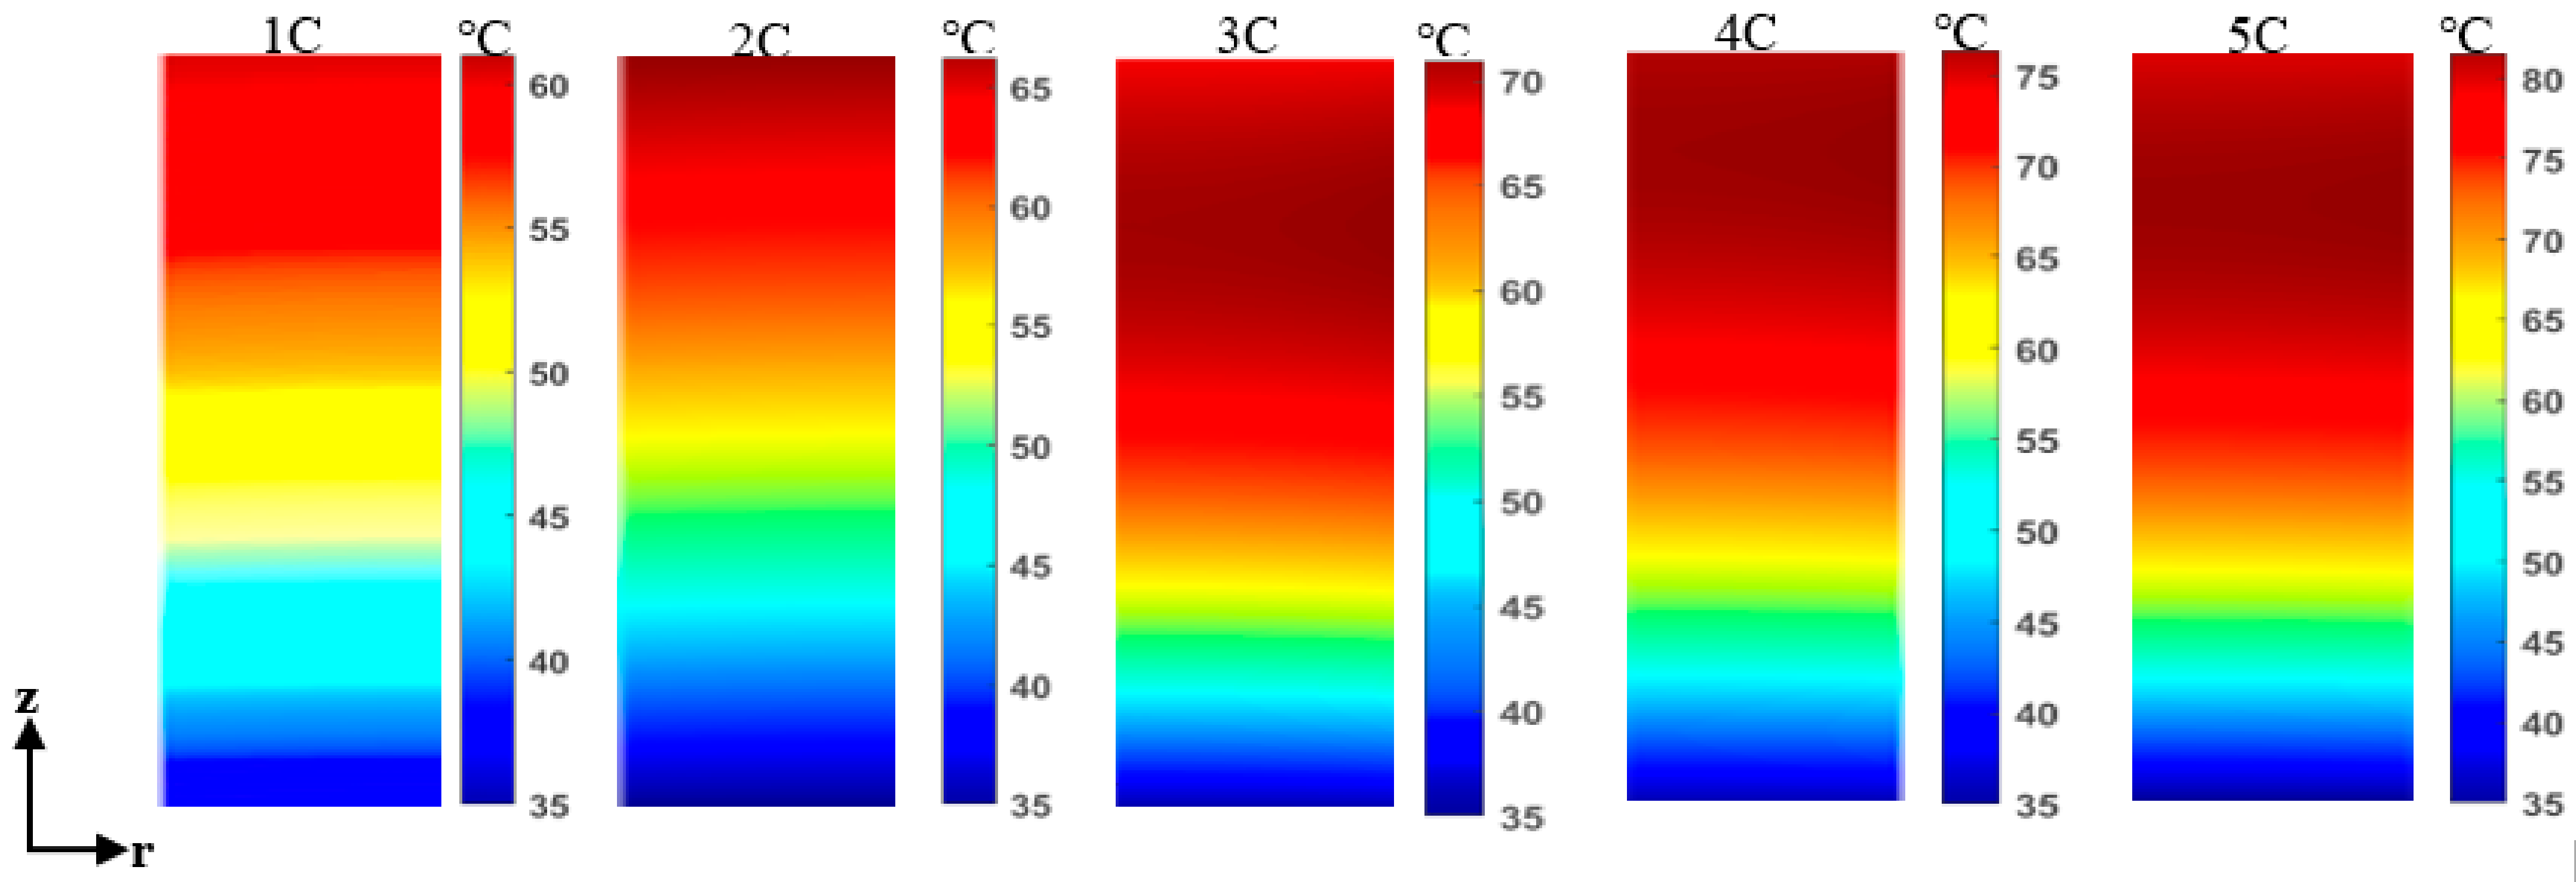
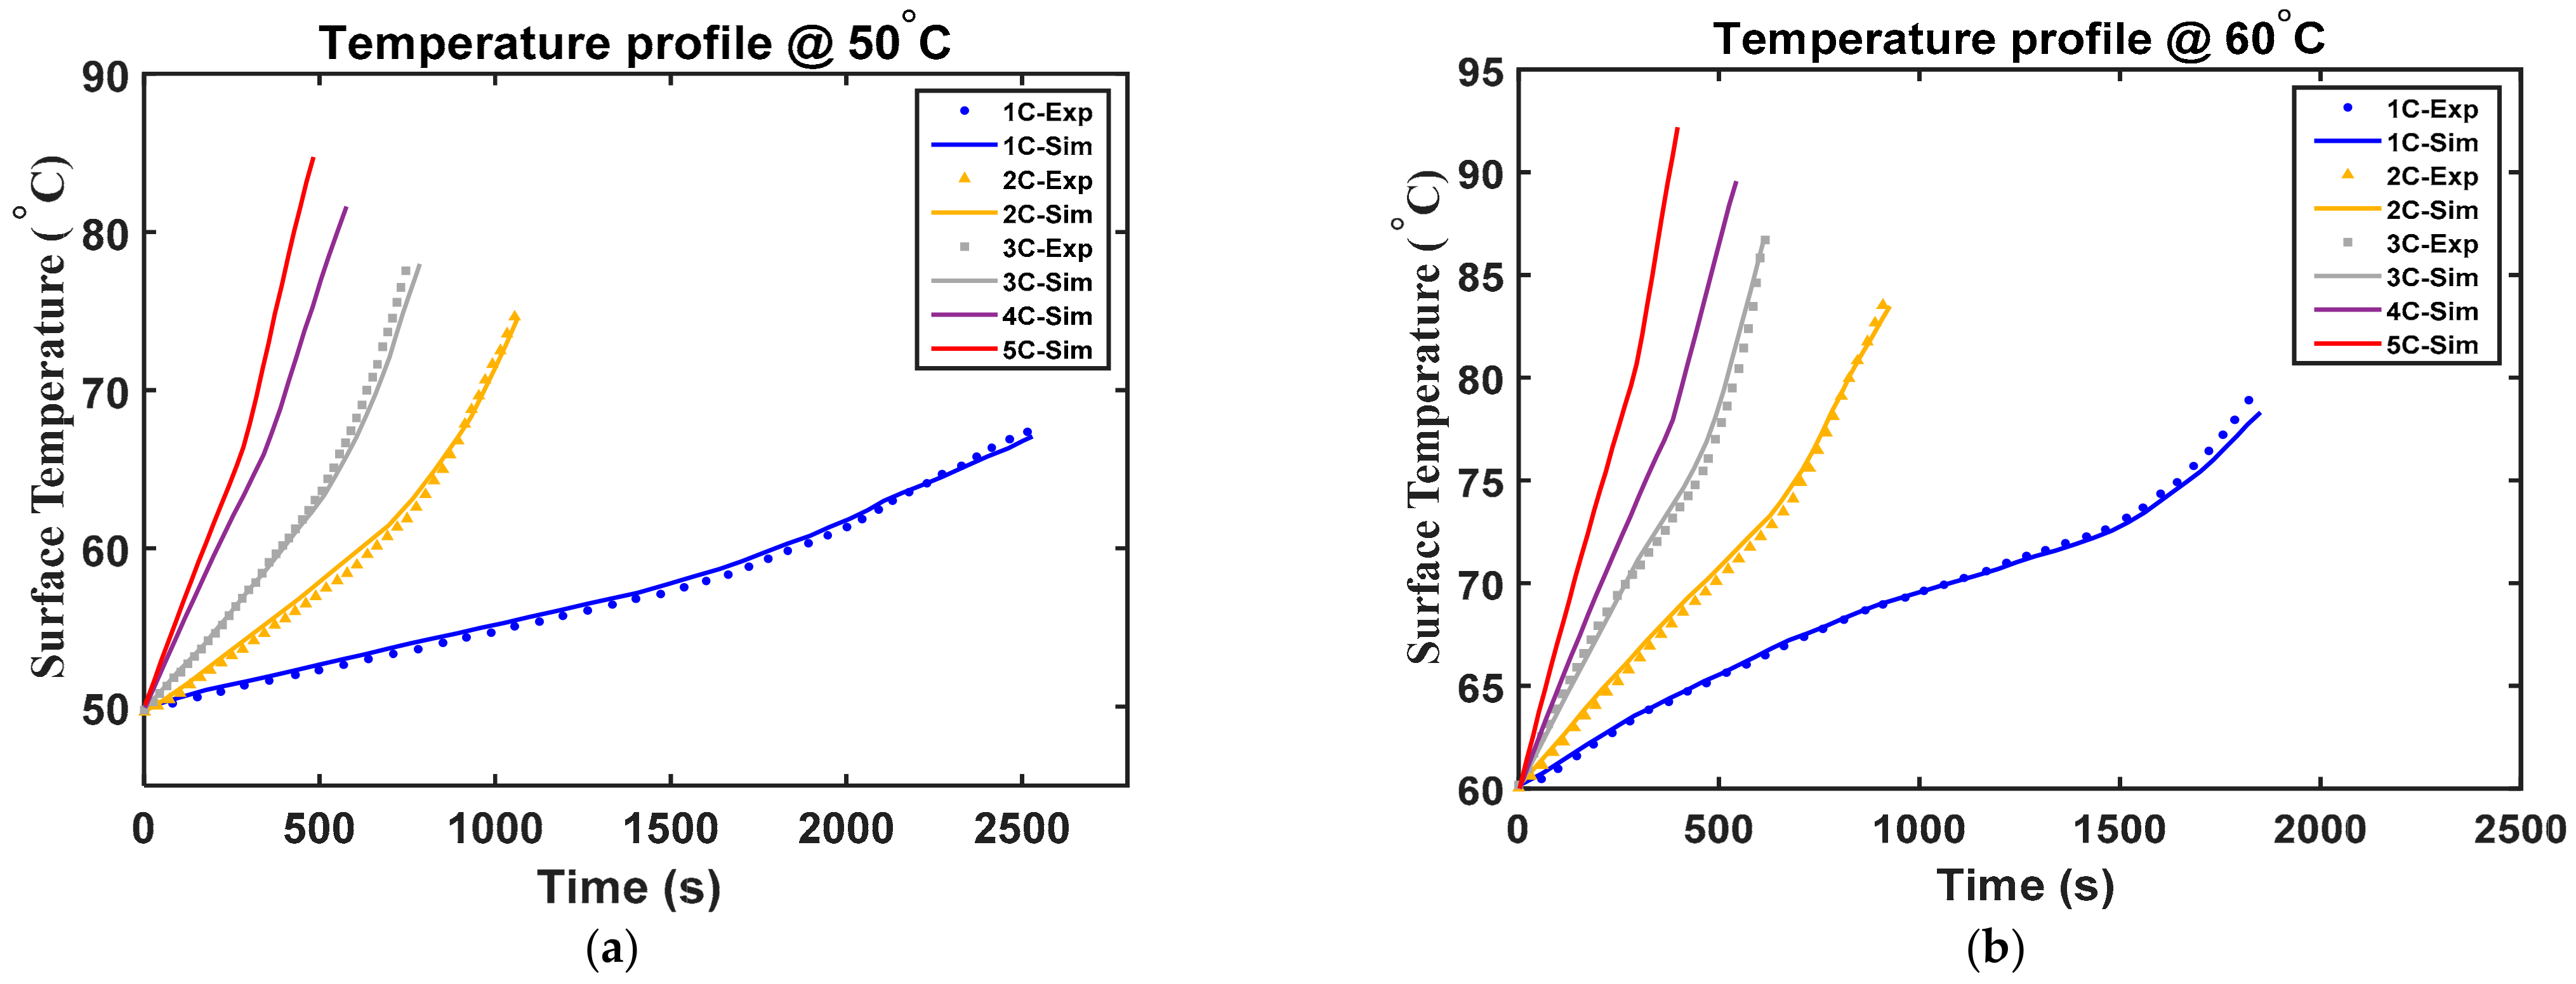
4.1. Thermal Behavior of Overcharged LIB at a Different Charging Current

Figure 6 shows the battery profile under the charging rates of 1C, 2C, 3C, and battery temperature forecast charged by 4C and 5C at an initial surrounding temperature of 35 °C. The simulated and test results seem to be closely coordinated. The average surface temperature of 62.6, 67.1, and 72.8 °C, at overload rates of 1C, 2C, and 3C, respectively, exceeded the surrounding temperature of 35 °C. In addition, the temperature profile prediction was carried out at charging currents of 4C and 5C and reached maximum surface temperatures of 77.6 and 82.6 °C. This shows that increasing surge currents increase the battery surface temperature, mainly due to the Joule effect. Thus, the excess current contributes substantially to the temperature. In addition, as shown in Figure 6, the developed model fits the experimental results well, especially in the early heating process. However, in the fast-heating stage, the model results showed a significant deviation, especially for 3C. This phenomenon agrees with those observed in [24]. This divergence is due to the significant influence of the positive thickness of the electrode and the increase in the solid electrolyte interface (SEI) resistance [16].
Furthermore, heat distribution in 2D was evaluated at a surrounding temperature of 35 °C with 1C, 2C, and 3C charging rates. However, the battery simulation also took place at 4C and 5C in order to determine the thermal response of the batteries. As shown in Figure 7, the thermal distribution results in various charging currents, where the battery surface temperature is virtually uniform and tends to grow towards the positive terminal. The highest temperature differential on the battery’s surface is roughly 10 °C, indicating that as the charging current increases, the battery’s surface temperature rises.

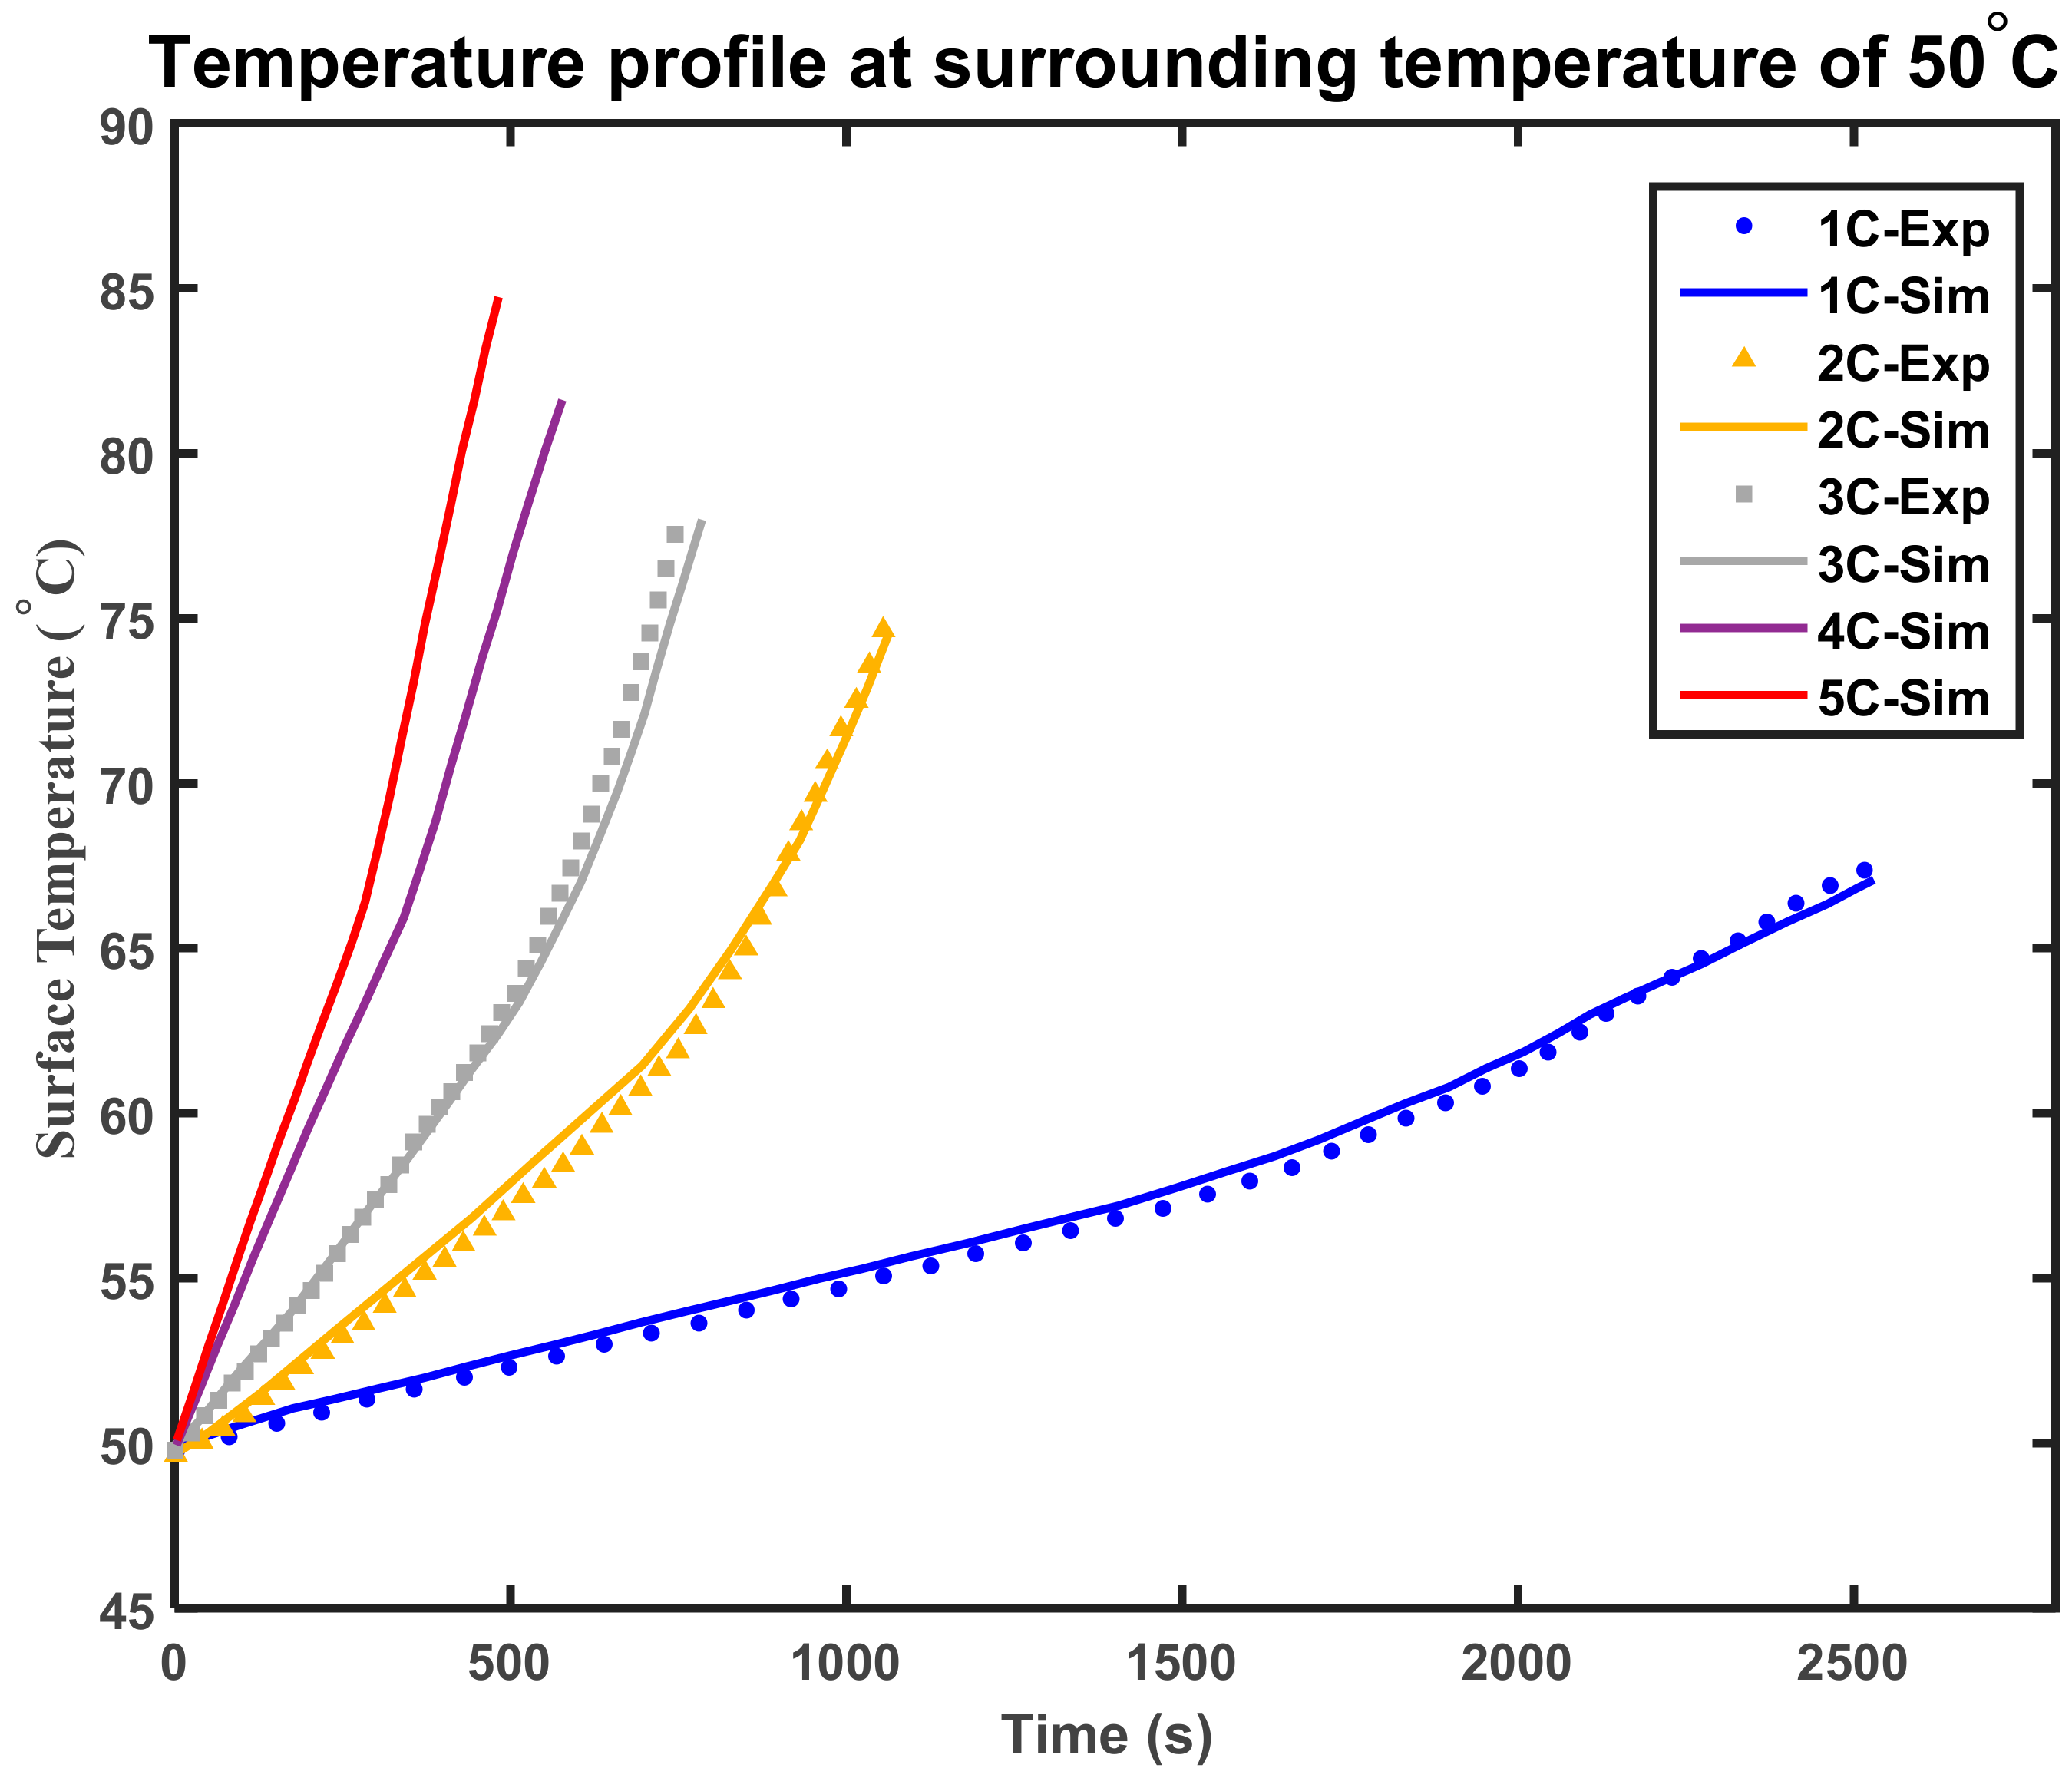
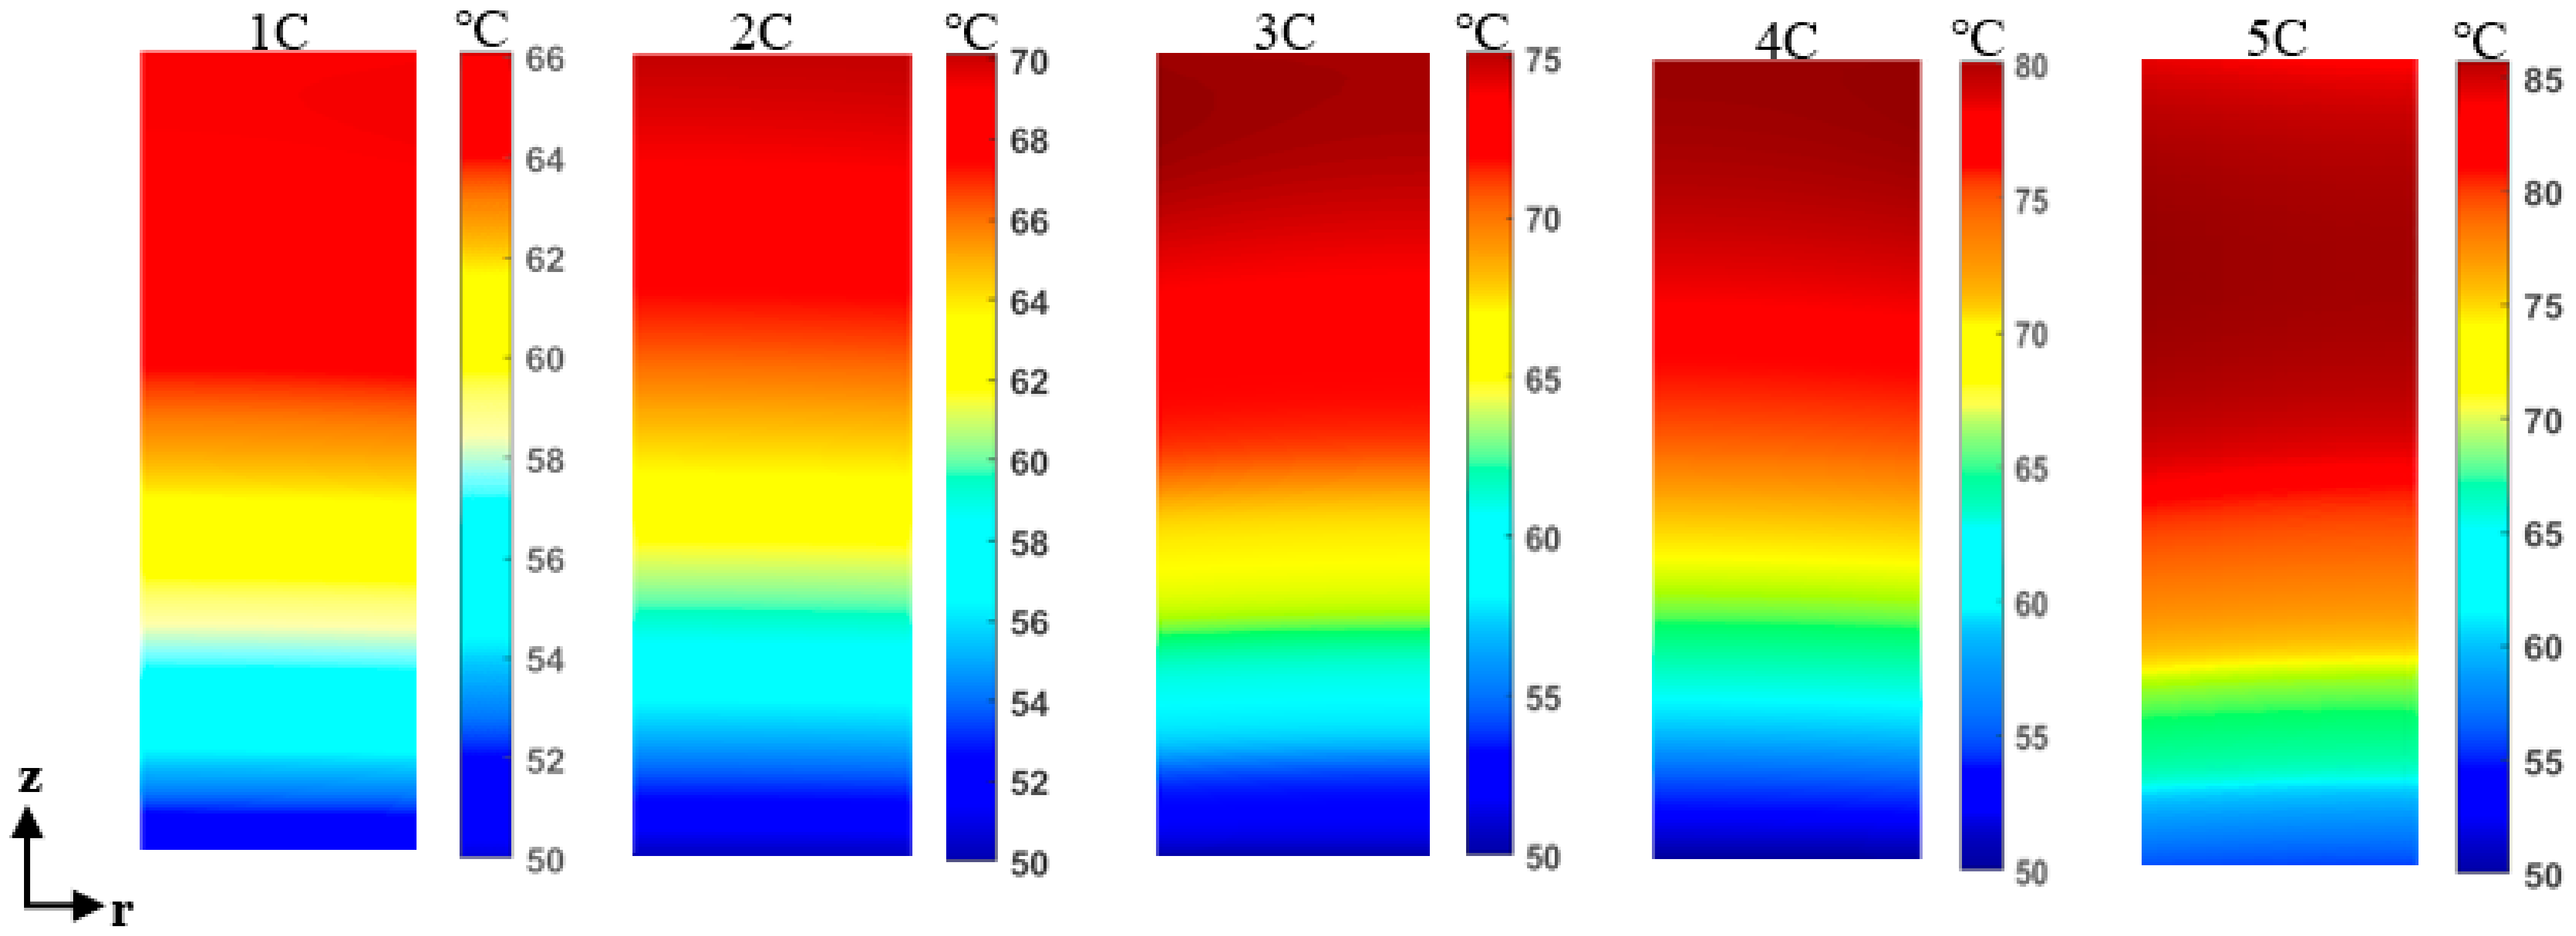
4.2. Thermal Behavior of Overcharged LIB at High Surrounding Temperature

The effects on the average surface temperature of the battery due to overcharging at a high surrounding temperature of 50 and 60 °C with current rates of 1C, 2C, and 3C and predicted current rates of 4C and 5C are discussed in this section. Figure 8a,b show a similar trend between the expected and experimental results of the battery surface temperature. It can be found that the maximum battery surface temperature at 50 °C is lower than that at 60 °C in both C-rates. The temperature profile prediction was also made at 4C and 5C overload currents and reached a surface temperature of 81.6 and 84.7 °C at 50 °C, and 89.6 and 92.2 °C at 60 °C, respectively. It seems that the higher surface temperature of the battery at a higher surrounding temperature [11] appears to be caused by overlithiation, which reduces the internal resistance of the battery. Thus, the lower internal resistance could hasten the chemical reaction and elevate the interior and surface temperatures. Moreover, heat generation intensity is exacerbated by the temperature degradation of materials in the battery such as the decomposition of SEI, typically occurring at temperatures from 70 to 90 °C as emphasized in [25,26]. For that reason, overcharge at a high surrounding temperature is prone to hastening the battery’s chemical reaction, which elevates the battery’s internal and surface temperatures. In addition, the higher internal temperature could lead to the degradation of the battery materials and permanent failure of the battery.
Furthermore, the maximum heat distributions of the Li-ion battery in radial–axial coordinates at high surrounding temperatures of 50 and 60 °C with charging currents of 1C, 2C, and 3C and predicted current rates of 4C and 5C are shown in Figure 9 and Figure 10. It appears that the battery surface temperature remains relatively constant and tends to grow towards the positive terminal due to the high resistance of positive materials. The highest temperature difference with different current rates on the battery’s surface is around 19 °C, proving that a high ambient temperature has a considerable impact on the temperature of the battery. It seems that the battery surface temperature rises faster at a higher rate of charge, and the temperature profile with the charge time changes, which could be attributed to an internal heat generation.

4.3. Effect of Heat Transfer Coefficient on Battery Surface Temperature

Figure 11 depicts the effect of the convective heat transfer coefficient (h) on the LIB’s surface temperature when overcharged by 1C. To observe the impact of heat transfer on the environment, the h was set at 0 W/m2·K is heat insulation, and 4 to 10 W/m2·K is natural convection. By employing the natural convection (h = 10 W/m2·K), the surface temperature declined from 83.1 to 60.1 °C. Thus, it is clearly observed that increasing the h reduces the battery surface temperature.

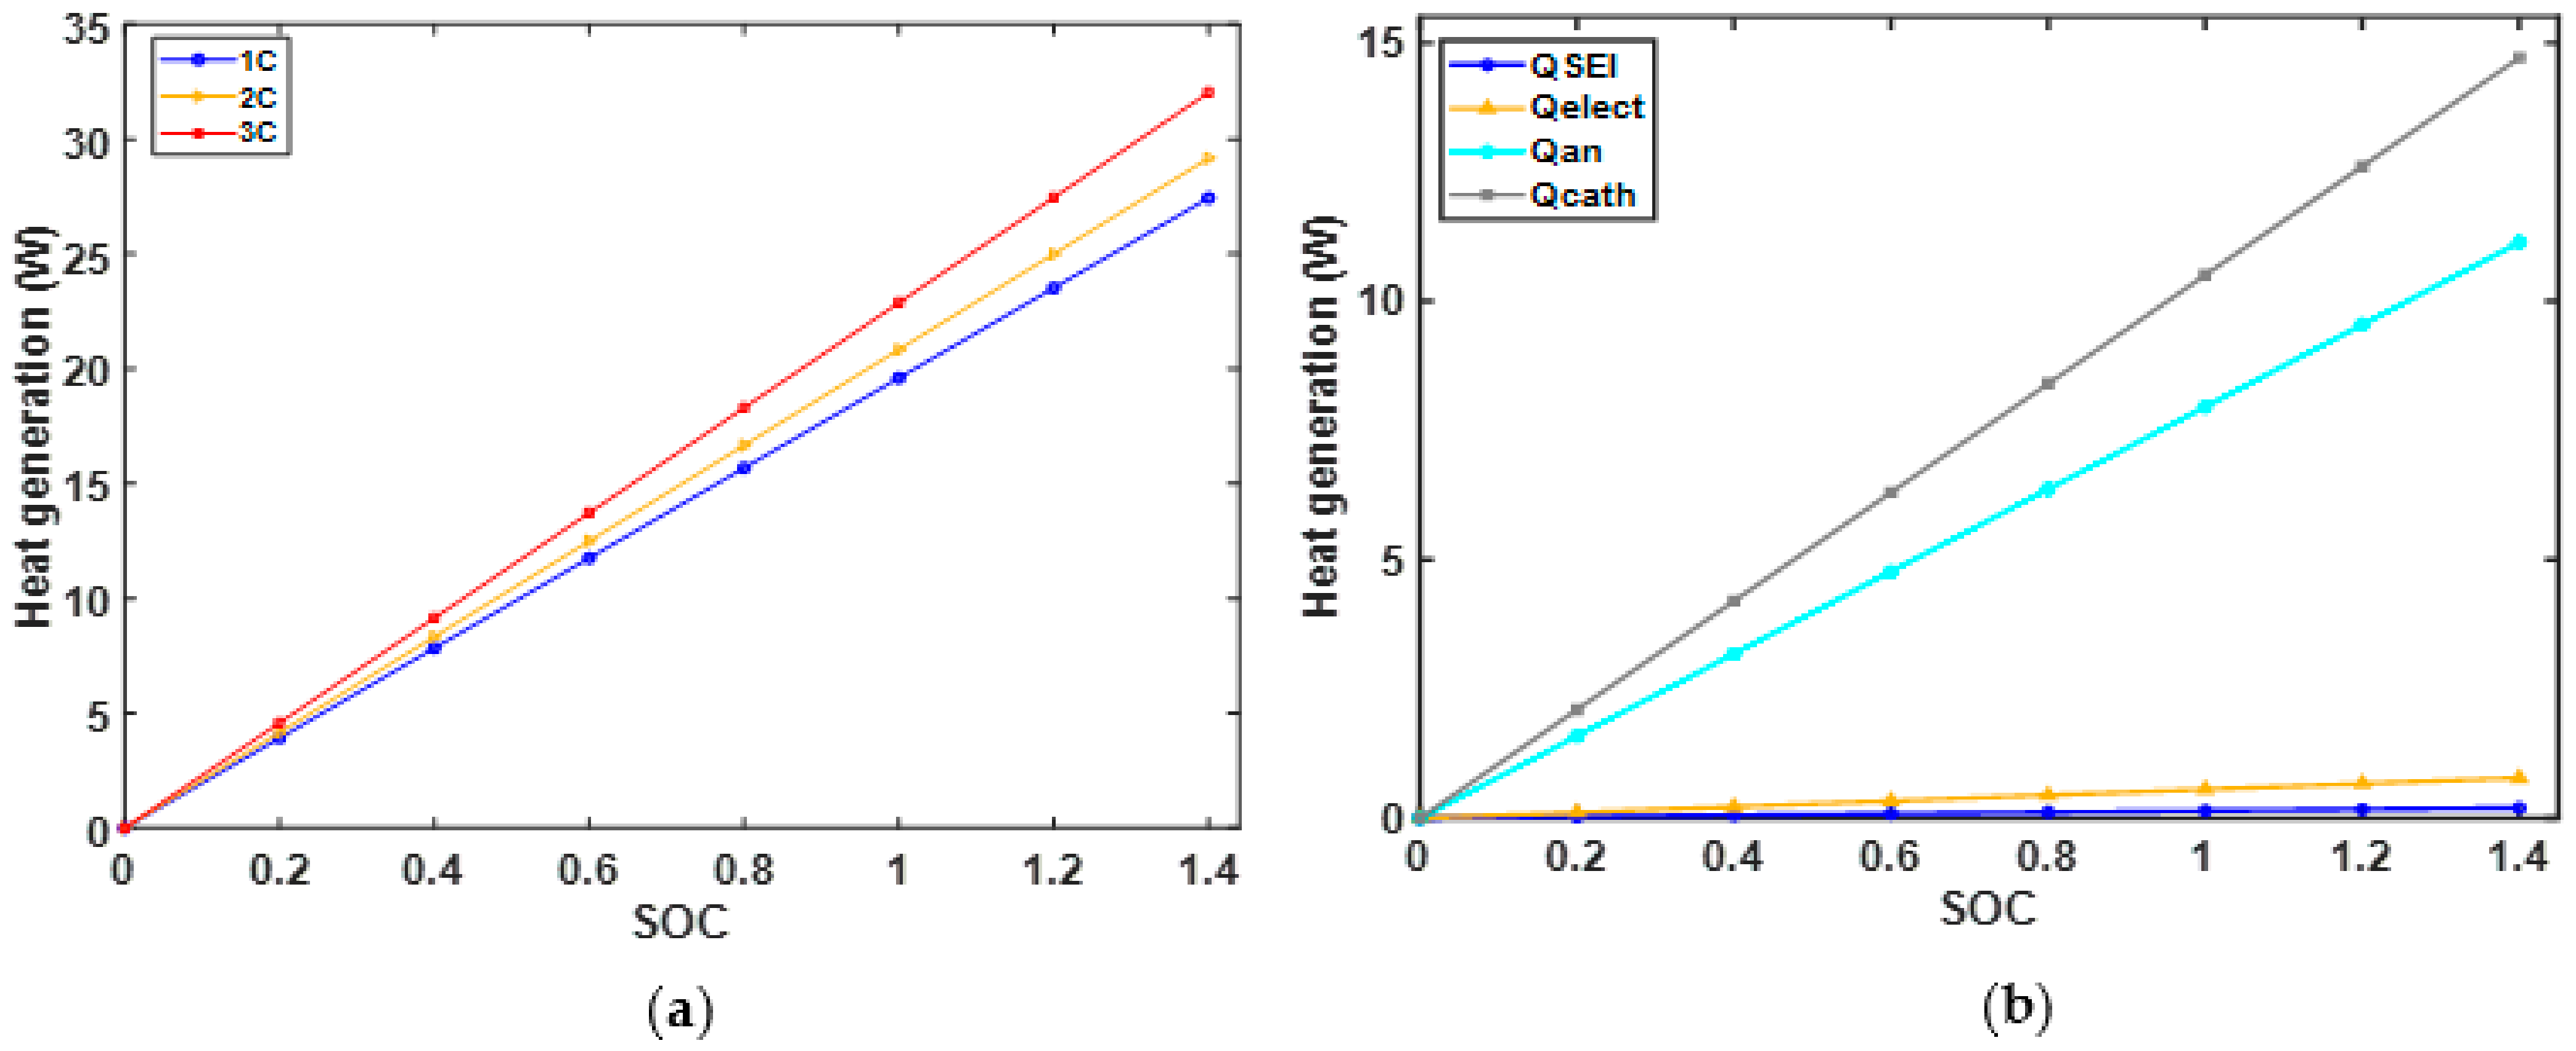
4.4. Analysis of Heat Generation Rates of Battery Overcharged at the Various Current Rate

This section compares the overall heat generation and heat generation rate of each heat source as expected by modeling at various current rates. Figure 12a illustrates the total heat generation rate projected by the modeling at different C-rates of 1C, 2C, and 3C. As shown in Figure 12a, by increasing the charging currents, the total heat generation rate increases, mainly because of increasing the Joule heat. On the other hand, a large amount of heat appears to have been generated at 3C. In addition, the heat generation rate for each heat source at 1C is illustrated in Figure 12b. It seems that the two dominant heat sources in the charging process appear to be cathode and anode heat sources.

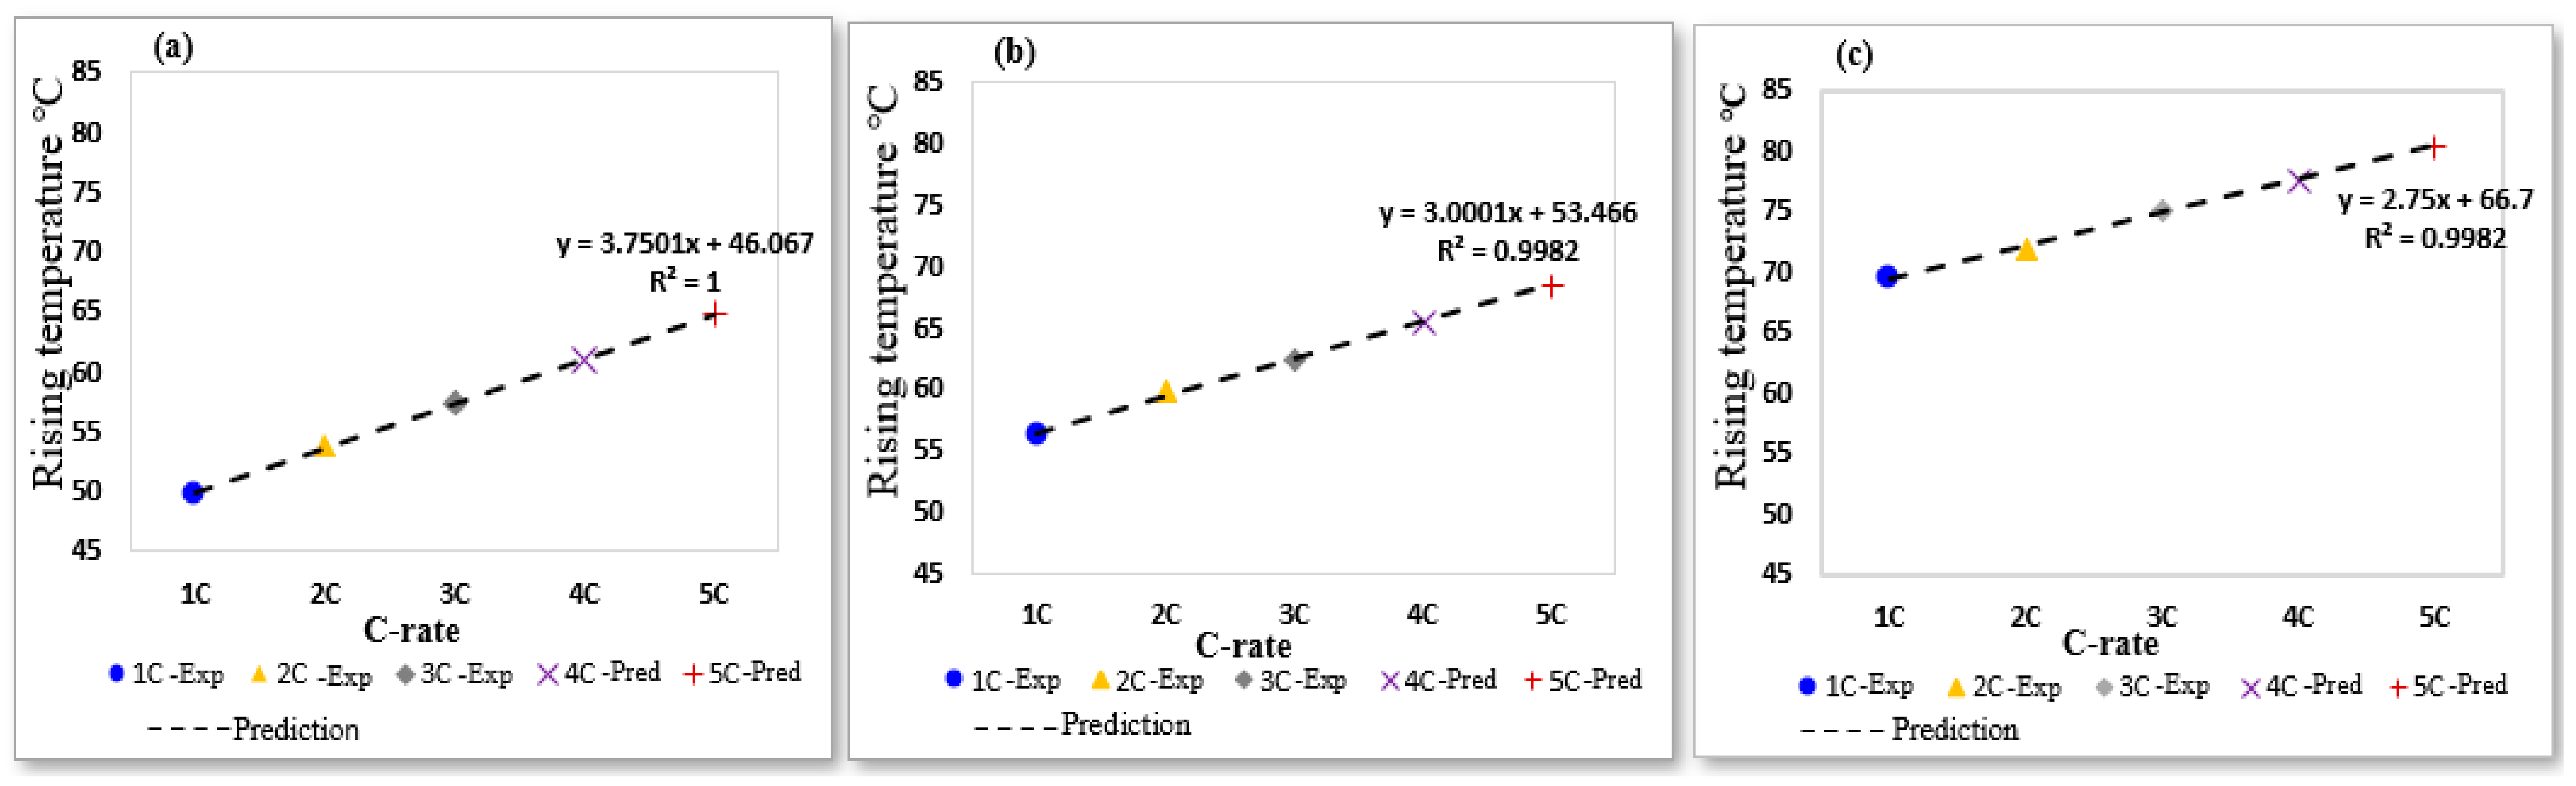
4.5. Model Validation

A systematic experiment was conducted to validate the presented model at surrounding temperatures of 35, 50, and 60 °C with different C-rates of 1C, 2C, and 3C abused at the fully charged state. Referring to the stages explained in Section 3.2, the battery surface temperature at Stage I in the developed model was calculated using the Joule effect and the entropy heat equation, whereas for Stage II, the battery surface temperature was calculated from the exothermic reaction equation. The validation was based on relative error using Equation (22). Through this approach, the differences between the errors of the predicted and experimental values were determined, thereby evaluating the accuracy of the model.
Relative   error = T s T e T e × 100 %
where Ts and Te are simulated temperature and measured temperature respectively.
In contrast, Figure 13 shows that the maximum relative error at the normal temperature (35 °C) was 1.64, 1.71, and 1.61% at 1C, 2C, and 3C, respectively. In addition, the maximum relative errors of the model at a higher temperature of 50 and 60 °C are 0.87% to 1.14% and 0.42% to 1.33%, respectively. As shown in Figure 13, increasing the current rates from 1C to 3C increases the maximum relative errors. At these surrounding temperatures and charging currents, the maximum relative error is below 10%. Therefore, the low magnitudes of the relative errors indicate better performance of the model in predicting the LIB thermal model.

5. Conclusions

In this study, a 2D electrothermal model for a 18,650 LiCoO2 battery is proposed to predict the thermal behavior during charging conditions at different surrounding temperatures. Overcharge tests at various charging currents of 1C, 2C, and 3C were conducted in thermally controlled environments of 35, 50, and 60 °C to verify the model. Furthermore, the model was used to predict the battery surface temperature at 4C and 5C to determine the thermal response of the batteries. Good agreement between the predicted and experimental results of the battery surface temperature was obtained and the maximum relative error of 1.71% was achieved. Results reveal that increasing the overcharge current sharply increases the battery surface temperature, i.e., at the predicted 5C, triggering the exothermic reactions inside the battery. Similarly, the surrounding temperature contributed to an increase of 11.40 and 19.70 °C at 2C and 3C, respectively. As revealed from the analyses, the surrounding temperature plays a more prominent role in elevating the battery surface temperature. It was also discovered that relative error increases when overcharge currents increase. Furthermore, the battery heat distribution appears almost uniform and tends to increase towards the positive terminal because the cathode material is highly resistant. In addition, when the convective heat transfer coefficient rises, the temperature of the battery falls and becomes more uniform. The rate of total heat generation increases as the overcharge currents grow, owing to an increase in Joule heat.

Author Contributions

C.M.H., P.V.C. and Y.L. prepared the concept; C.M.H. prepared the modeling, experimental setup, and collected data. C.M.H. and Y.L. analyzed data and wrote the manuscript; Y.L. and S.W. reviewed the manuscript. All authors have read and agreed to the published version of the manuscript.

Funding

National Science and Technology Development Agency (NSTDA).

Institutional Review Board Statement

Not applicable.

Informed Consent Statement

Not applicable.

Data Availability Statement

Not applicable.

Acknowledgments

The authors would like to express their gratitude to The Joint Graduate School of Energy and Environment, King Mongkut’s University of Technology Thonburi, and Center for Energy Technology and Environment, Ministry of Higher Education, Science, Research, and Innovation, Thailand for their support. The fourth author acknowledges the support provided by the National Science and Technology Development Agency (NSTDA) under the Research Chair Grant, and Thailand Science Research and Innovation (TSRI) under the Fundamental Fund 2022.

Conflicts of Interest

The authors declare no conflict of interest.

Nomenclature

Aan-soanode–solvent decomposition frequency factor (s−1)
Aca-socathode–solvent decomposition frequency factor (s−1)
Aeelectrolyte decomposition frequency factor (s−1)
ASEISEI decomposition frequency factor (s−1)
canamount of lithium within the anode (dimensionless)
ceamount of lithium within the electrolyte (dimensionless)
cSEIamount of lithium containing meta-stable species in the SEI (dimensionless)
Ea,an-soanode–solvent decomposition activation energy (J/mol)
Ea,ca-socathode–solvent decomposition activation energy (J/mol)
Ea,SEISEI decomposition activation energy (J/mol)
Han-soanode–solvent heat (J/kg)
Hca-socathode–solvent heat (J/kg)
Heelectrolyte decomposition heat (J/kg)
HSEISEI decomposition heat (J/kg)
mereaction order for ce
mSEIreaction order for SEI
Ran-soanode–solvent decomposition rate (s−1)
Rca-socathode–solvent decomposition rate (s−1)
Ea,-sothe anode decomposition activation energy (J/mol)
Reelectrolyte decomposition rate (s−1)
RSEISEI decomposition rate (s−1)
ΔHxenthalpy of the chemical reaction of layer x
Q ˙ c o n v heat rate dissipated due to convection (W)
Q ˙ e x o heat rate due to exothermic reaction (W)
Q ˙ e l c h heat rate due to electrochemical reaction (W)
Q ˙ r a d heat rate dissipated due to radiation (W)
PVDFpolyvinylidene fluoride
SEIsolid electrolyte interphase layer
Subscripts
xelectrochemical layers
0initial condition
rradial direction
zaxial direction
Greek symbols
ρdensity of air (kg/m3)
kthermal conductivity (W/m·K)
Cpspecific heat (J/kg·K)

References

  1. Victor Chombo, P.; Laoonual, Y. Investigation of the Thermal Hazard of Fault of Li-Ion Battery under External Heating. In Proceedings of the International Conference on Energy, Environment and Climate Change (International Conference on Utilities and Exhibition)-ICUE 2020, Bangkok, Thailand, 20–22 October 2020. [Google Scholar]
  2. Zhenpo, W.; Jun, M.A.; Lei, Z. Finite element thermal model and simulation for a cylindrical Li-ion battery. IEEE Access 2017, 5, 15372–15379. [Google Scholar] [CrossRef]
  3. Victor Chombo, P.; Laoonual, Y.; Wongwises, S. Lessons from the electric vehicle crashworthiness leading to battery fire. Energies 2021, 14, 4802. [Google Scholar] [CrossRef]
  4. Tang, X.; Wang, Y.; Zou, C.; Yao, K.; Xia, Y.; Gao, F. A novel framework for Lithium-ion battery modeling considering uncertainties of temperature and aging. Energy Convers. Manag. 2019, 180, 162–170. [Google Scholar] [CrossRef]
  5. Dongxu, O.; Liu, J.H.; Mingyi, C.; Jian, W. Investigation into the fire hazards of lithium-ion batteries under overcharging. Appl. Sci. 2017, 7, 1314. [Google Scholar] [CrossRef] [Green Version]
  6. Motor1.com. A Tesla Model S Burns to the Ground while at Charging Station in Norway. Available online: https://www./news/60408/tesla-model-s-burns-to-the-ground-while-at-charging-station/ (accessed on 25 February 2022).
  7. Benzinga.com. Opel Ampera-e EV Catches Fire while Charging in Germany. Available online: https://www.benzinga.com/tech/20/11/18206721/opel-ampera-e-ev-catches-fire-while-charging-in-germany-video#:~:text=An%20Opel%20Ampera%2De%20caught,shows%20firefighters%20battling%20the%20blaze (accessed on 25 February 2022).
  8. Gizmochina.com. Xpeng Car Catches Fire in a Charging Station in China. Available online: https://www.gizmochina.com/2021/04/15/xpeng-car-catch-fire-charging-station-in-china/ (accessed on 25 February 2022).
  9. Rushlane.com. Electric Car in Southern China Explodes While Charging. Available online: https://www.rushlane.com/electric-car-explodes-while-charging-12374231.html (accessed on 25 February 2022).
  10. Insideevs.com. Electric Car Fire and Explosion at a Charging Station. Available online: https://insideevs.com/news/423581/severe-electric-car-fire-explosion-charging/ (accessed on 25 February 2022).
  11. Jiang, F.; Peng, P.; Sun, Y. Thermal analyses of LiFePO4/graphite battery discharge process. J. Power Sources 2013, 243, 181–194. [Google Scholar] [CrossRef]
  12. Mahshid, N.; Farschad, T. A computationally efficient model for performance prediction of lithium-ion batteries. Sustain. Energy Technol. Assess. 2021, 43, 100938. [Google Scholar] [CrossRef]
  13. Melcher, A.; Ziebert, C.; Rohde, M.; Seifert, H.J. Modeling, and simulation of the thermal runaway behavior of cylindrical li-ion cells-computing of critical parameters. Energies 2016, 9, 292. [Google Scholar] [CrossRef] [Green Version]
  14. Ren, D.; Feng, X.; Languang, L.; Ouyang, M.; Zheng, S.; Li, J.; He, X. An electrochemical-thermal coupled overcharge-to-thermal-runaway model for lithium-ion battery. J. Power Sources 2017, 364, 328–340. [Google Scholar] [CrossRef]
  15. Park, Y.; Kim, N.H.; Baek, S.; Kim, J.M.; Cheol, G.; Kim, M.S.; Man, S.; Eom, Y.; Choi, H.C.; Jung, Y.M. Characterization of the passivating layer on Li[Ni0.31 Co0.32Mn0.28 Al0.09]O2 cathode in the overcharge state. J. Mol. Struct. 2010, 974, 139–143. [Google Scholar] [CrossRef]
  16. Zeng, G.; Bai, Z.; Huang, P.; Wang, Q. Thermal safety study of Li-ion batteries under limited overcharge abuse based on coupled electrochemical thermal model. Int. J. Energy Res. 2020, 44, 1–19. [Google Scholar] [CrossRef]
  17. Zhu, X.; Wang, Z.; Wang, Y.; Wang, H.; Wang, C.; Tong, L.; Yi, M. Overcharge investigation of large-format lithium-ion pouch cells with Li(Ni0.6Co0.2Mn0.2)O2 cathode for electric vehicles thermal runaway features and safety management method. Energy 2019, 169, 868–880. [Google Scholar] [CrossRef]
  18. Mao, N.; Wang, Z.; Chung, Y.H.; Shu, C. Overcharge cycling effect on the thermal behavior, structure, and material of lithium-ion batteries. Appl. Therm. Eng. 2019, 163, 114147. [Google Scholar] [CrossRef]
  19. Manohar, G.; Taedong, G.; Anshul, K.; Shashishekar, P.; Sagar, B.; Rajkumar, S.; Daehyun, K.; Youngho, R. Fully coupled simplified electrochemical and thermal model for series-parallel configured battery pack. J. Energy Storage 2021, 36, 102424. [Google Scholar] [CrossRef]
  20. Qi, Y.; Zhu, C.; Gao, F.; Yang, K.; Jia, Q. Mathematical model for thermal behavior of lithium-ion battery pack under overcharge. Heat Mass Transf. 2018, 124, 552–563. [Google Scholar] [CrossRef]
  21. Liu, Y.; Liu, Q.; Li, Z.; Ren, Y.; Xie, J.; He, H.; Xu, F. Failure study of commercial LiFePO4 cells in over-discharge conditions using electrochemical impedance spectroscopy. J. Electrochem. Soc. 2014, 161, 620–632. [Google Scholar] [CrossRef]
  22. Samba, A.; Oma, N.; Gualous, H.; Van den Bossche, P.; Mierlo, J.; Boubekeur, V. Development of 2D thermal battery model for lithium-ion pouch cells. World Electr. Veh. J. 2013, 63, 629–637. [Google Scholar] [CrossRef] [Green Version]
  23. Victor Chombo, P.; Laoonual, Y. A review of safety strategies of Lithium-ion battery. J. Power Sources 2020, 478, 228649–228668. [Google Scholar] [CrossRef]
  24. Yang, X.; Hu, X.; Chen, Z.; Chen, Y. Effect of ambient dissipation condition on the thermal behavior of a lithium-ion battery using a 3D multi-partition model. Appl. Therm. Eng. 2020, 178, 115634. [Google Scholar] [CrossRef]
  25. Feng, X.; Sun, J.; Ouyang, M.; He, X.; Lu, L.; Han, X. Characterization of large-format lithium-ion battery exposed to extremely high temperature. J. Power Sources 2014, 272, 457–467. [Google Scholar] [CrossRef]
  26. Li, J.; Sun, D.; Jin, X.; Shi, W.; Sun, C. Lithium-ion battery overcharging thermal characteristics analysis and an impedance-based electro-thermal coupled model simulation. Appl. Energy 2019, 254, 113574. [Google Scholar] [CrossRef]
Figure 1. Structure of LIB (a) Geometry of the LIB in half cycle. (b) Mesh resolution of LIB.
Energies 15 02284 g001
Figure 2. Experimental apparatus (a) Schematic of the experimental apparatus (b) Photo of the experimental apparatus.
Energies 15 02284 g002
Figure 3. Three stages of the battery under 1C condition at 35 °C.
Energies 15 02284 g003
Figure 4. The rising temperature at 1C, 2C, 3C, and predicted rising temperature of 4C and 5C at (a) 35 °C (b) 50 °C, and (c) 60 °C.
Energies 15 02284 g004
Figure 5. The critical temperature of LIB at 1C, 2C, and 3C at 35, 50, and 60 °C.
Energies 15 02284 g005
Figure 6. Simulation and experimental results of LIB charged by 1C, 2C, 3C and predicted temperature results of 4C and 5C at surrounding temperature of 35 °C.
Energies 15 02284 g006
Figure 7. Simulated temperature distribution of LIB with 1C, 2C, 3C and predicted temperature distribution of 4C and 5C at surrounding temperature of 35 °C.
Energies 15 02284 g007
Figure 8. Simulation and experimental results of 1C, 2C, 3C and predicted results of the surface temperature of 4C and 5C at (a) 50 °C and (b) 60 °C.
Energies 15 02284 g008
Figure 9. Simulation temperature distribution of LIB at 1C, 2C, and 3C and predicted thermal distribution at 4C and 5C with a surrounding temperature of 50 °C.
Energies 15 02284 g009
Figure 10. Simulation temperature distribution of LIB at 1C, 2C, and 3C and predicted thermal distribution at 4C and 5C with a surrounding temperature of 60 °C.
Energies 15 02284 g010
Figure 11. Temperature profile under different heat transfer coefficients at 1C.
Energies 15 02284 g011
Figure 12. Heat generation rate (a) total heat source at 1C, 2C, and 3C (b) heat generation of each heat source at 1C.
Energies 15 02284 g012
Figure 13. Relative error at charging current of 1C, 2C, 3C at 35, 50, and 60 °C.
Energies 15 02284 g013
Table 1. Thermophysical parameters of battery layers. Reprinted with permission from Ref. [13]. Copyright 2016 MDPI.
Battery LayersMaterialThickness (μm)Density (kg/m3)Specific Heat (J/kg·K)Thermal
Conductivity (W/m·K)
CathodeLiCoO2552328.51269.21.58
Anodegraphite551347.331437.41.04
SeparatorPVDF301008.9819780.34
Positive current collectorCu108933385298.15
Negative current collectorAl72700875170
Table 2. Exothermic parameters.
Reaction ParameterAbbreviation Δ H x
(J/kg)
m x
(kg)
A x
(s−1)
Ε a , x
(J mol−1)
c x
(-)
Ref.
SEISEI2.57 × 1050.2191.667 × 10151.3508 × 1050.15[13]
Anodean1.714 × 1060.2192.5 × 10131.3508 × 1050.75[13]
Cathodecath3.14 × 1050.361986.667 × 10131.396 × 1050.04[14]
Electrolyteelectro1.55 ×1050.17085.14 × 10252.74 × 1051[13]
Table 3. Specifications of 2.6 Ah LCO battery.
ParticularValue
Nominal voltage (V)3.70
Discharge end voltage (V)3.00
Maximum charging voltage (V)4.2
Maximum capacity (Ah) @ 25.5 °C, discharge 0.52 A, 2.75 V2.60
Standard constant charging current (A)0.52
Maximum charging current (A)1.30
Internal impedance (Ω)0.06
Publisher’s Note: MDPI stays neutral with regard to jurisdictional claims in published maps and institutional affiliations.

