Article

Contribution of the 2010 Maule Megathrust Earthquake to the Heat Flow at the Peru-Chile Trench

1
Dipartimento di Fisica e Astronomia “Augusto Righi”, Alma Mater Studiorum Università di Bologna, Viale Carlo Berti Pichat 8, 40127 Bologna, Italy
2
Dipartimento di Scienze Pure e Applicate, Università di Urbino, Via Santa Chiara 27, 61029 Urbino, Italy
*
Author to whom correspondence should be addressed.
Energies 2022, 15(6), 2253; https://doi.org/10.3390/en15062253
Submission received: 28 January 2022 / Revised: 24 February 2022 / Accepted: 17 March 2022 / Published: 19 March 2022
(This article belongs to the Special Issue Geothermal Energy and Structural Geology)

Abstract

:
The 2010 Maule earthquake was a megathrust event that occurred along the Peru–Chile Trench. The earthquake source can be modelled as a fault with two asperities with different areas and strengths. By employing a discrete fault model, where asperities are the basic elements, the event can be described as a sequence of three dynamic modes involving simultaneous asperity slip. Interaction between asperities by mutual stress transfer plays a crucial role during fault slip. With a careful choice of values for the model parameters, the mode durations, the slip distribution, the seismic moment rate and the final moment calculated from the model are found to be consistent with the observed values. An important amount of frictional heat is produced by an event of this size and is calculated by summing up the contributions of each asperity. The seismic event produces a heat pulse propagating through the Earth’s crust and contributing to the average heat flow in the region. The calculated heat production is equal to about 2 × 10 17 J and the peak value of the heat pulse is equal to 6 × 10 3 mW m 2 or about 10 4 of the average surface heat flow density, with a characteristic diffusion time in the order of 10 6 a.

1. Introduction

The 2010 Maule earthquake was a magnitude 8.8 thrust earthquake that struck central Chile [1,2,3]. Its seismic moment was equal to 1.8 × 10 22 Nm, with a peak moment rate equal to about 3 × 10 20 Nm s 1 . The slip was concentrated in two regions of the fault surface, which we call asperity 1 and 2 respectively, situated north and south of the epicenter [1].
Asperity models are generally recognized as adequate representations of seismic sources. They assume that earthquakes result from the failure of a small number of patches characterized by high static friction, while the rest of the fault gives a minor contribution [4,5,6]. An asperity is usually defined as a region in which the slip exceeds, in a specified way, the slip averaged over the entire fault surface [7].
According to [1], the slip involved asperity 1 during the first part of the Maule event. Then the fault slip evolved more symmetrically, with simultaneous slip of the asperities. Finally, only asperity 2 was involved. The average slip amplitudes of the two asperities were equal to 15 m for asperity 1 and to 5 m for asperity 2. The event duration was about 160 s, but most of the seismic moment was produced within 110 s from the beginning of the event.
In the present paper, we model the source of the 2010 Maule earthquake with a discrete fault model, where asperities are the basic elements, and calculate the contribution of the event to the heat production along the Peru–Chile Trench.
Discrete fault models, focusing on the large-scale properties of faults, are powerful tools for investigating processes occurring during fault slip. Such models consider asperities as individual units of the fault, characterized by average values of friction, stress and slip [4,8,9]. Details of friction, stress and slip distributions on the fault are neglected, but this does not affect results such as the global heat production. Discrete models allow decomposition of fault slip into dynamical modes that highlight the role of asperities and their interactions.
A discrete model representing a fault with two asperities was initially presented by [10] and was further developed by [5,11,12,13] and others. Complete analytical solutions were given by [14,15] for the case of identical asperities and by [16,17] for asperities with different strengths. Ref. [18] considered the effect of stress perturbations from seismic events at neighbouring faults. The effect of wave radiation was introduced by [19,20,21].
A two-asperity fault has four dynamic modes: a sticking mode (mode 00), corresponding to stationary asperities, and three slipping modes, corresponding respectively to the motion of a single asperity (modes 10 and 01) and to simultaneous asperity motion (mode 11). Each seismic event originated by the fault is a sequence of slipping modes and can be described by a characteristic moment rate function.
The aim of the present paper is to reproduce the observed moment rate of the 2010 Maule earthquake and to calculate the frictional heat production associated with fault slip. The event was modelled as a sequence of modes 10-11-01 by [16] in the absence of radiation and considering two asperities with equal areas but different strengths.
We base the present paper on a more refined model developed by [22], who gave the solution for a fault with two asperities with different areas and strengths. The frictional heat generated by the seismic event is calculated and its propagation through the Earth’s crust is considered in order to evaluate its contribution to the surface heat flow in the region.
The absence of geothermal anomalies along fault zones is well known and has been termed “the heat flow paradox” [23]. If earthquakes have a low seismic efficiency, as suggested by most authors [24], the question arises of why a heat flow anomaly is not observed on large faults, since most of the released energy is dissipated as frictional heat [25]. The possibilities that dynamic friction becomes very low during fault slip and that some energy is consumed in breaking and powdering rock to produce fault gouge have been considered, but a more plausible alternative is that the flow of ground water is an important mechanism for the removal of locally generated heat [26].
Apart from these considerations, it is interesting to evaluate the contribution of a large earthquake on the basis of individual contributions of fault asperities that are involved in the event. We expect that the earthquake produces a heat pulse that is extremely diluted in time due to the low thermal diffusivity of rocks. Hence a small pulse amplitude is expected with respect to the average heat flow density measured at the Earth’s surface, in agreement with observation.

2. Fault Model

We consider a plane fault with two asperities that are disjoint subsets of the fault surface. Let A 1 and A 2 be the asperity areas and be the distance between the asperity centroids (Figure 1). The model is described in detail in [22,27].
The fault is placed in a shear zone subject to a uniform strain rate e ˙ due to the motion of two tectonic plates at relative velocity v. The shear zone is assumed to be a homogeneous and isotropic Poisson solid with rigidity μ .
The state of the fault at any time t is described by two variables x ( t ) and y ( t ) representing the slip deficits of asperity 1 and 2, respectively. The tangential forces applied to asperities can be written as:
f 1 = K 1 x K c ( x y ) ι 1 x ˙
f 2 = K 2 y K c ( y x ) ι 2 y ˙ ,
where
K 1 = 2 μ e ˙ A 1 v , K 2 = 2 μ e ˙ A 2 v , K c = μ A 1 A 2 s .
The quantity s is the shear traction (per unit seismic moment) that the slip of one asperity applies to the other, calculated at the asperity centroid. For a thrust fault,
s = 1 6 π 3 .
In the last terms of (1) and (2), ι 1 and ι 2 are impedances associated with the asperities and dots indicate differentiation with respect to t.
It is assumed that asperities 1 and 2 have static frictions f s 1 and f s 2 and dynamic frictions f d 1 and f d 2 , respectively. It is further assumed that masses μ 1 and μ 2 are associated with the asperities. On this basis, the following nondimensional variables and time are introduced:
X = K 1 x f s 1 , Y = K 1 y f s 1 , T = K 1 μ 1 t
and the following nondimensional parameters:
α = K c K 1 , β = f s 2 A 1 f s 1 A 2 = f d 2 A 1 f d 1 A 2 , γ = ι 1 K 1 μ 1
ϵ = f d 1 f s 1 = f d 2 f s 2 , ξ = A 2 A 1 .
It is assumed that masses μ 1 and μ 2 are proportional to the respective asperity areas A 1 and A 2 and that asperities have the same impedance per unit area, so that
μ 2 = ξ μ 1 , ι 2 = ξ ι 1 .
The evolution of the fault is a sequence of dynamic modes that depends on initial conditions: these are specified by a nondimensional variable p expressing the initial stress distribution on the fault. Each dynamic mode is the solution of a system of differential equations.
A merit of discrete fault models is that the evolution of the fault can be represented as an orbit in the state space X Y . The set of points corresponding to stationary asperities is called the sticking region: it is a quadrilateral Q in the plane X Y [21]. The orbit of the system in the sticking mode 00 is the line Y = X + p and the seismic event starts when the orbit intersects one of the sides of Q .
If m ( t ) is the seismic moment produced in a seismic event as a function of time, the nondimensional moment is
M = K 1 m f s 1 2 .
As a reference, we consider the seismic moment M 1 of a 1-mode event 10 in the absence of radiation, corresponding to a slip amplitude:
U = 2 1 ϵ 1 + α .
The moment rate of a generic event is then
M ˙ ( T ) = M 1 Δ X ˙ + Δ Y ˙ U ,
where Δ X ˙ and Δ Y ˙ are the slip rates of asperities 1 and 2, respectively, and dots indicate differentiation with respect to T. The final seismic moment is
M 0 = M 1 U 1 + U 2 U ,
where U 1 and U 2 are the final slip amplitudes of asperities 1 and 2, respectively.

3. The Moment Rate

The data concerning the 2010 Maule event are listed in Table 1 and the model parameters calculated from them are shown in Table 2. The lithosphere is considered a Poisson solid with an average rigidity μ = 35 GPa [28] and an average density ρ = 3 × 10 3 kg m 3 [29].
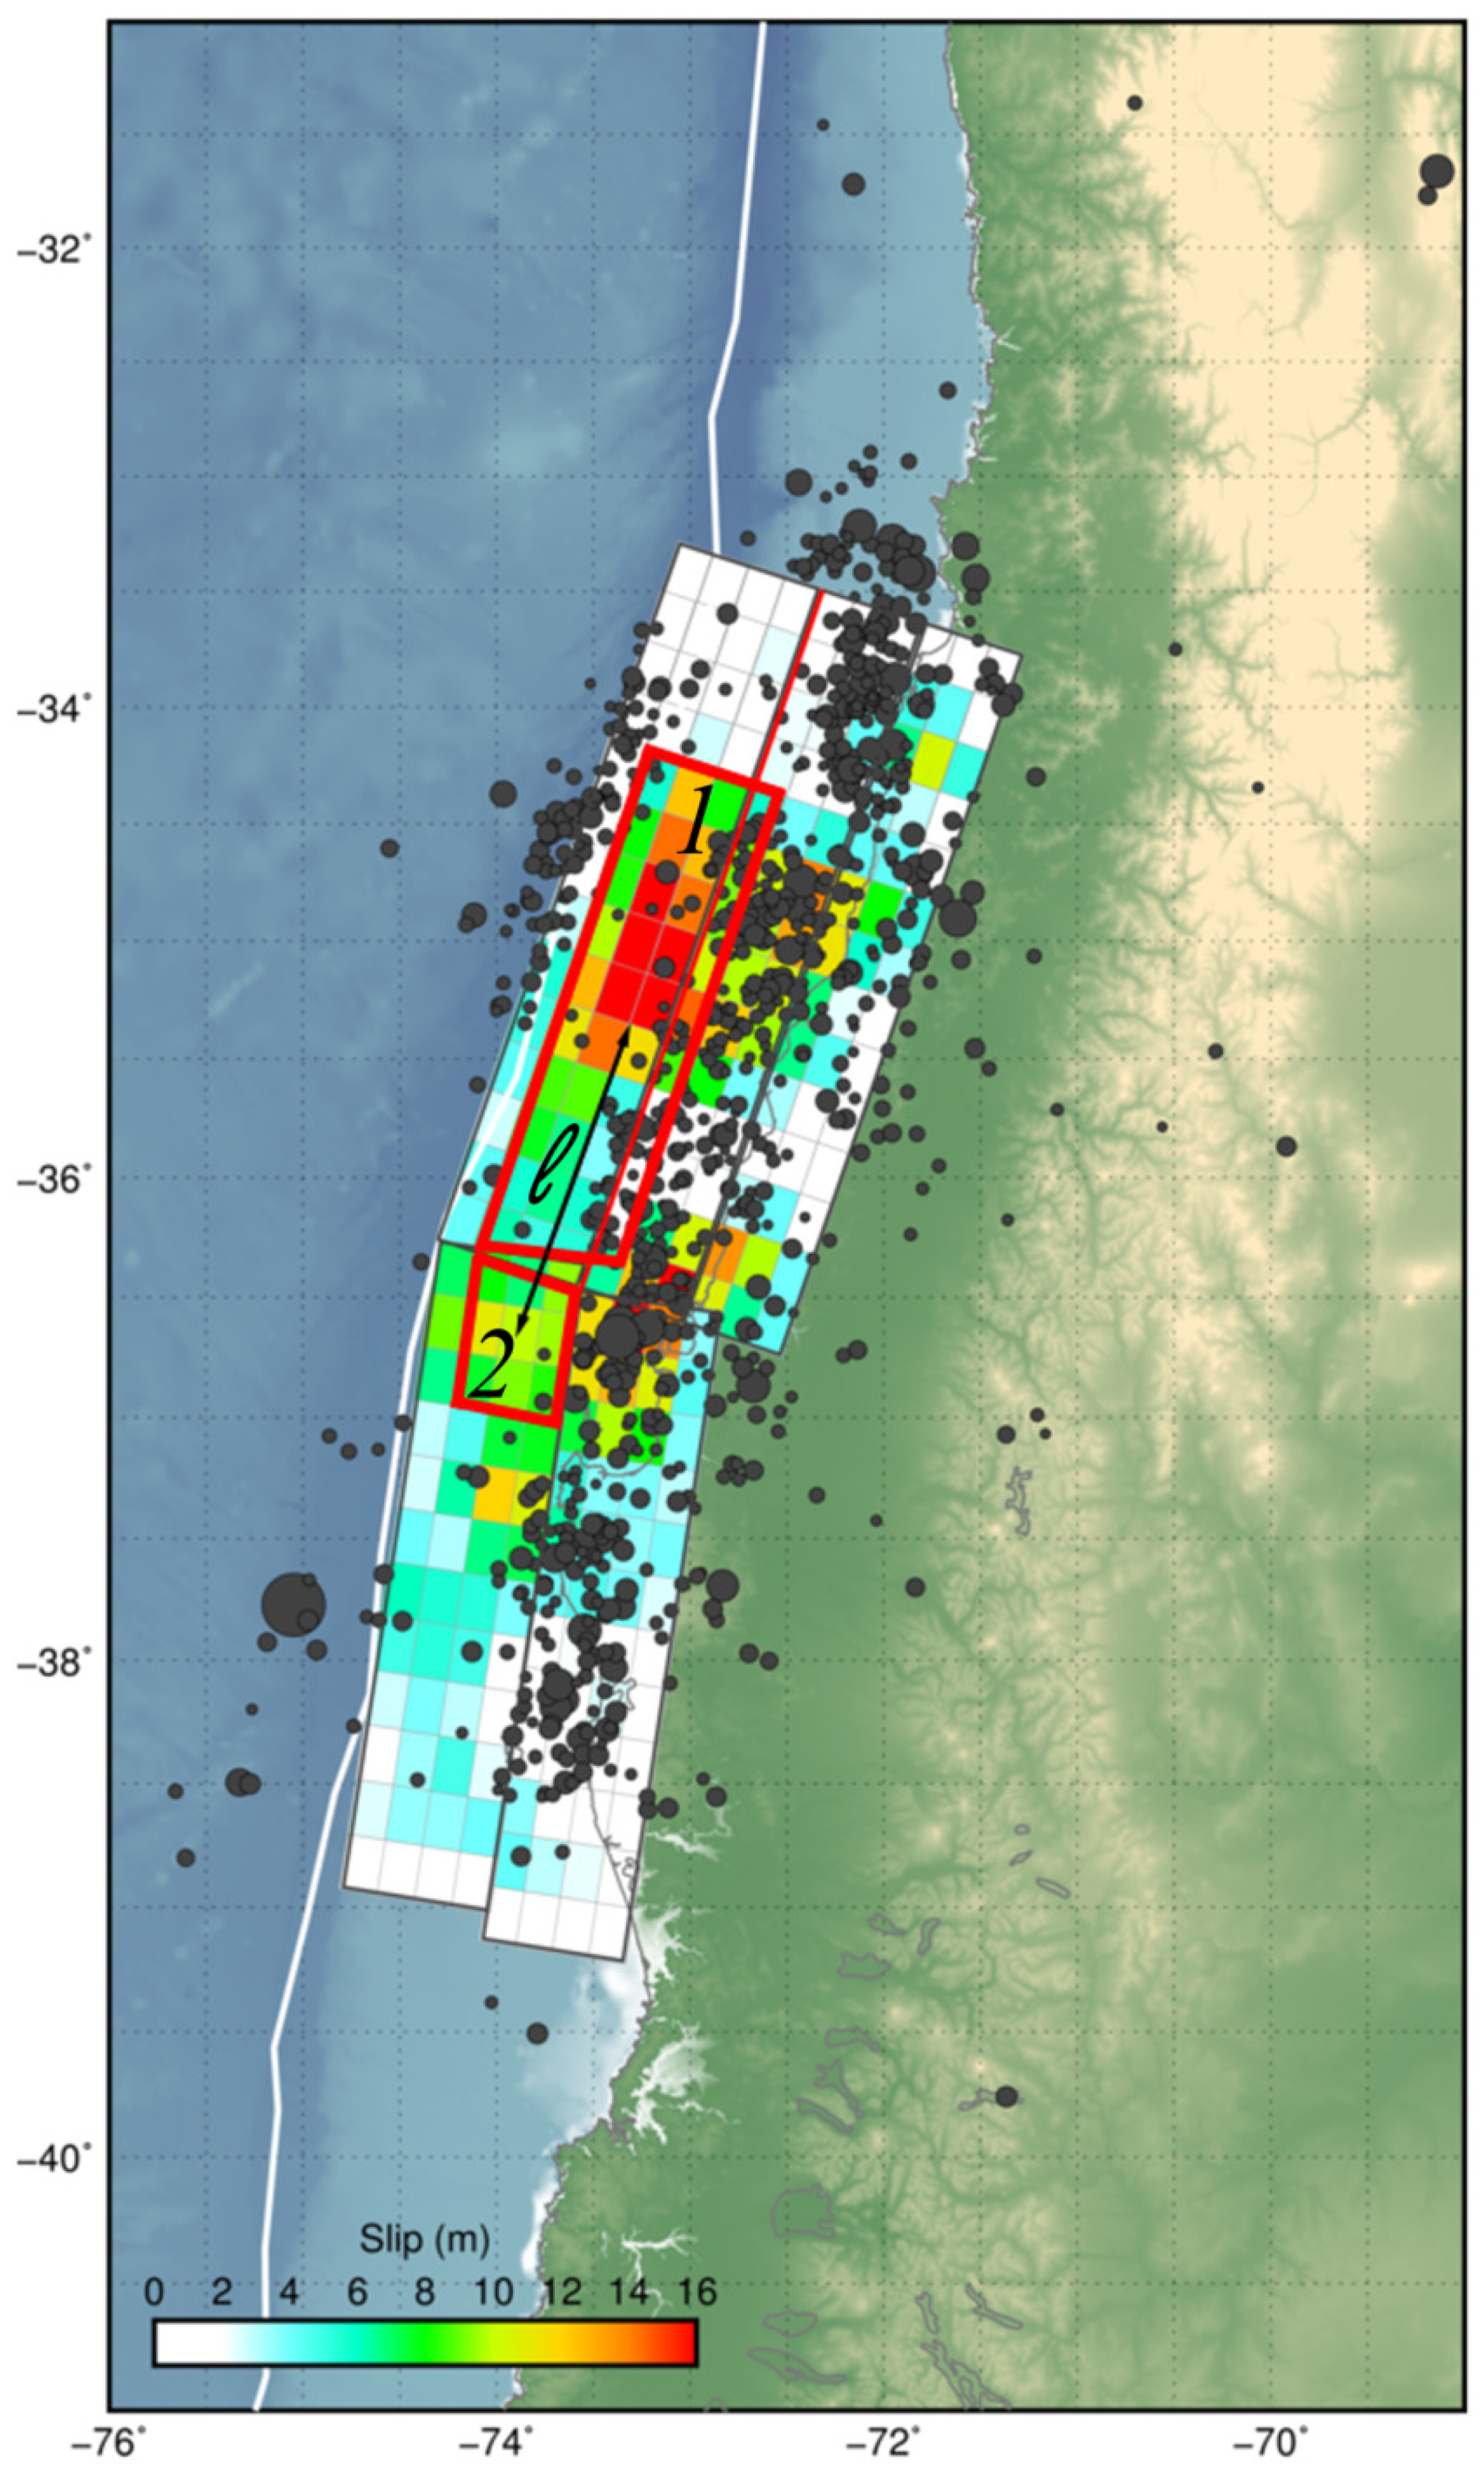
The asperity areas can be evaluated from the distribution of coseismic fault slip (Figure 2). Asperity areas are approximately A 1 = 14.4 × 10 3 km 2 and A 2 = 3.6 × 10 3 km 2 , with a distance = 140 km between asperity centroids. Accordingly, from (6) and (7) we obtain α = 0.06 and ξ = 0.25 .
The value of β is inferred from the ratio of the average slip amplitudes of asperity 2 and 1. Slip amplitudes were equal to 15 m for asperity 1 and to 5 m for asperity 2. Therefore we assume β = 0.33 .
The value of γ is chosen under the requirement that a good fit is obtained with the observed moment rate. The best value is γ = 0.3 , corresponding to a seismic efficiency of 6% [24]. Finally, we take a typical value ϵ = 0.7 for the ratio between dynamic and static frictions [5].
According to [1], the total event duration was Δ t = 160 s, with a maximum equal to 3 × 10 20 Nm s 1 between 70 and 90 s after the beginning of the event.
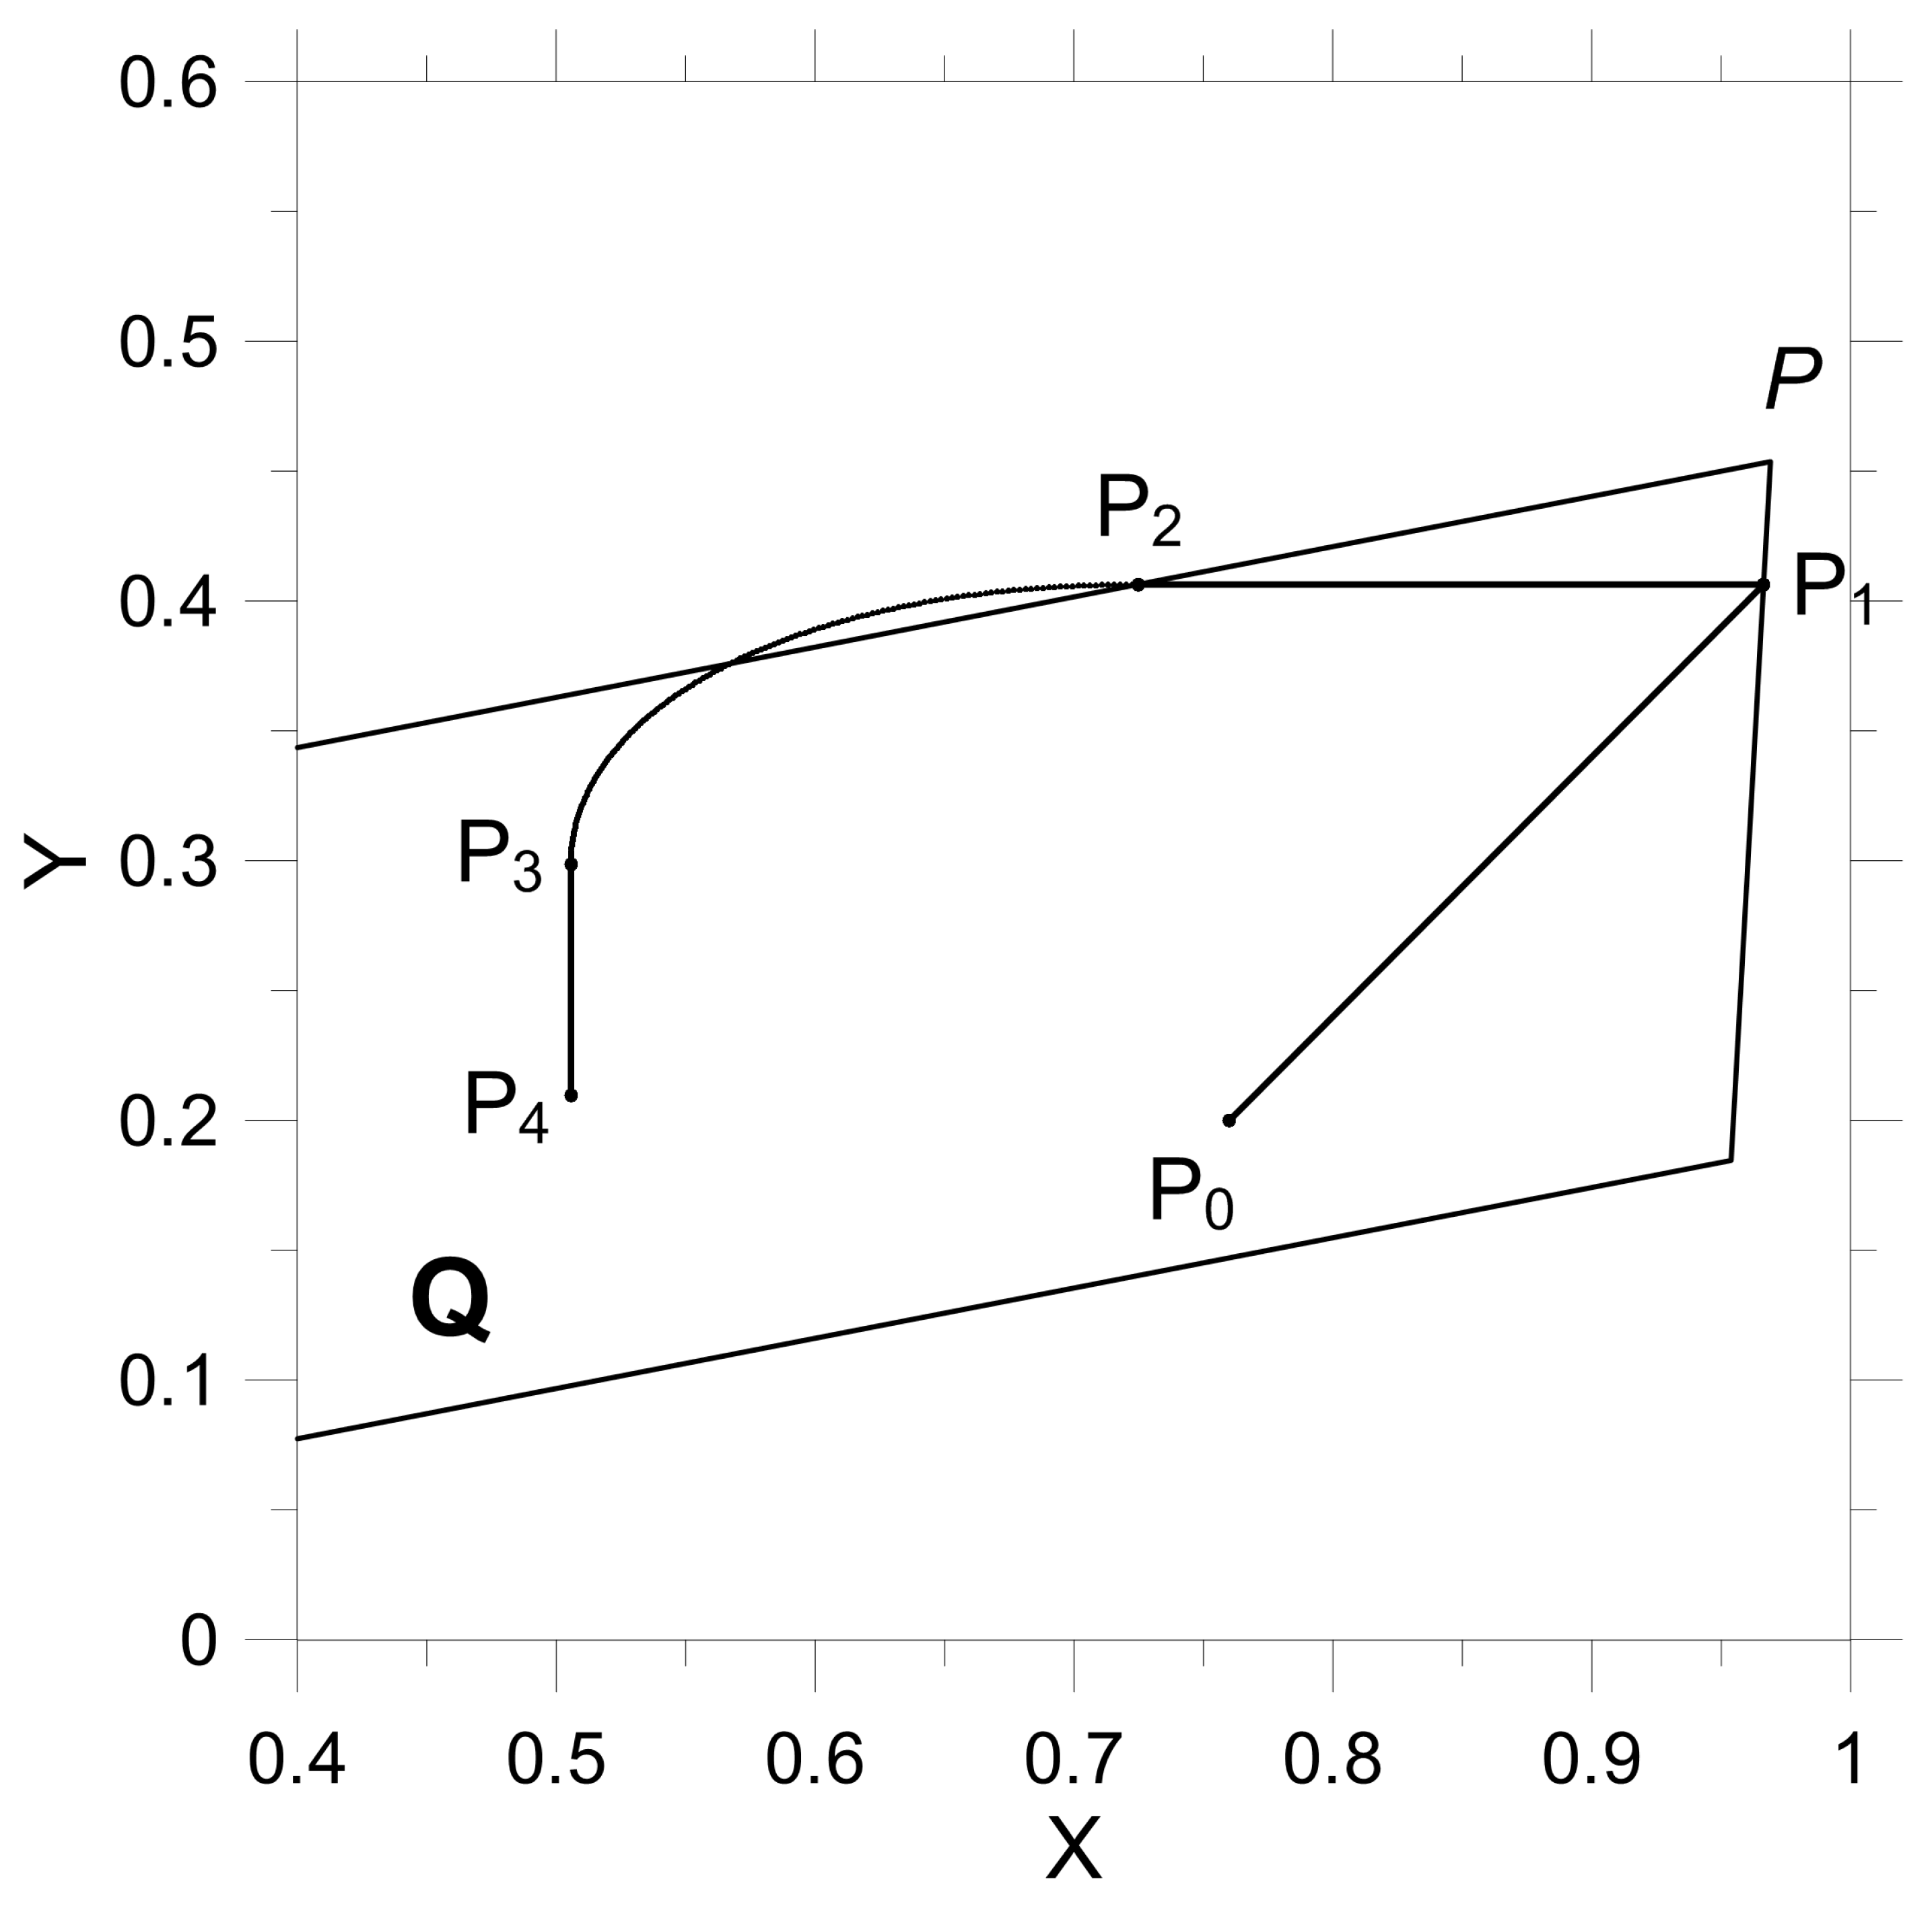
The value of p must guarantee that the event is a 3-mode sequence 10-11-01 and that its moment rate approximates the observed function. The initial condition satisfying these requirements is p = 0.56 , indicating an initially higher stress on asperity 1. Figure 3 shows the orbit representing the seismic event in the plane X Y . The event starts at point P 1 and terminates at P 4 .
The graph in Figure 3 is drawn from the solution of the equations of motion of asperities. The quadrilateral Q is the sticking region, that includes all the points representing the fault at rest. The position of point P 0 is determined by the initial conditions on the fault, expressed by the value of p.
The segment P 0 P 1 describes the fault evolution preceding the seismic event: during the interseismic interval, the slip deficits X and Y of the asperities increase linearly with time as a consequence of the constant strain rate e ˙ imposed to the fault by the motion of tectonic plates.
The increase in slip deficits implies an increase in shear stress on both asperities. Due to the strong stress inhomogeneity on the fault, the condition for failure is reached first on asperity 1, in spite of the fact that asperity 2 is much weaker ( β = 0.33 ). In the graph, the condition for slip of asperity 1 is attained when the orbit intersects the right side of Q at point P 1 . Here the seismic event begins.
The segment P 1 P 2 represents the slip of asperity 1 (mode 10) and the effect is a decrease in the slip deficit X. Since the slip deficit of asperities changes much faster during seismic events than during interseismic intervals, the slip deficit Y of asperity 2 can be considered constant during mode 10.
When the orbit reaches the upper side of Q at point P 2 , the condition for slip of asperity 2 is also attained and a phase of simultaneous slip takes place (mode 11). This phase is represented by a curve in the plane X Y , because both X and Y decrease during this slipping mode.
Simultaneous slip terminates at point P 3 , where asperity 1 stops. Afterwards, only asperity 2 continues to slip. This corresponds to a mode 01, represented in the graph by the segment P 3 P 4 . In this mode the slip deficit Y decreases, while X remains constant. At last, asperity 2 also stops at point P 4 and the seismic event terminates.
Afterwards, the fault enters another interseismic interval, in which the slip deficits X and Y begin increasing again, but starting from different initial conditions, that is with a different value of p. Hence the stress distribution on the fault at the end of the event is different from the initial one and the next event will be made of a different sequence of dynamic modes.
Formulae for the calculation of the dimensional moment rate m ˙ ( t ) and the final seismic moment m 0 for a 3-mode event with simultaneous asperity slip were given in [27].
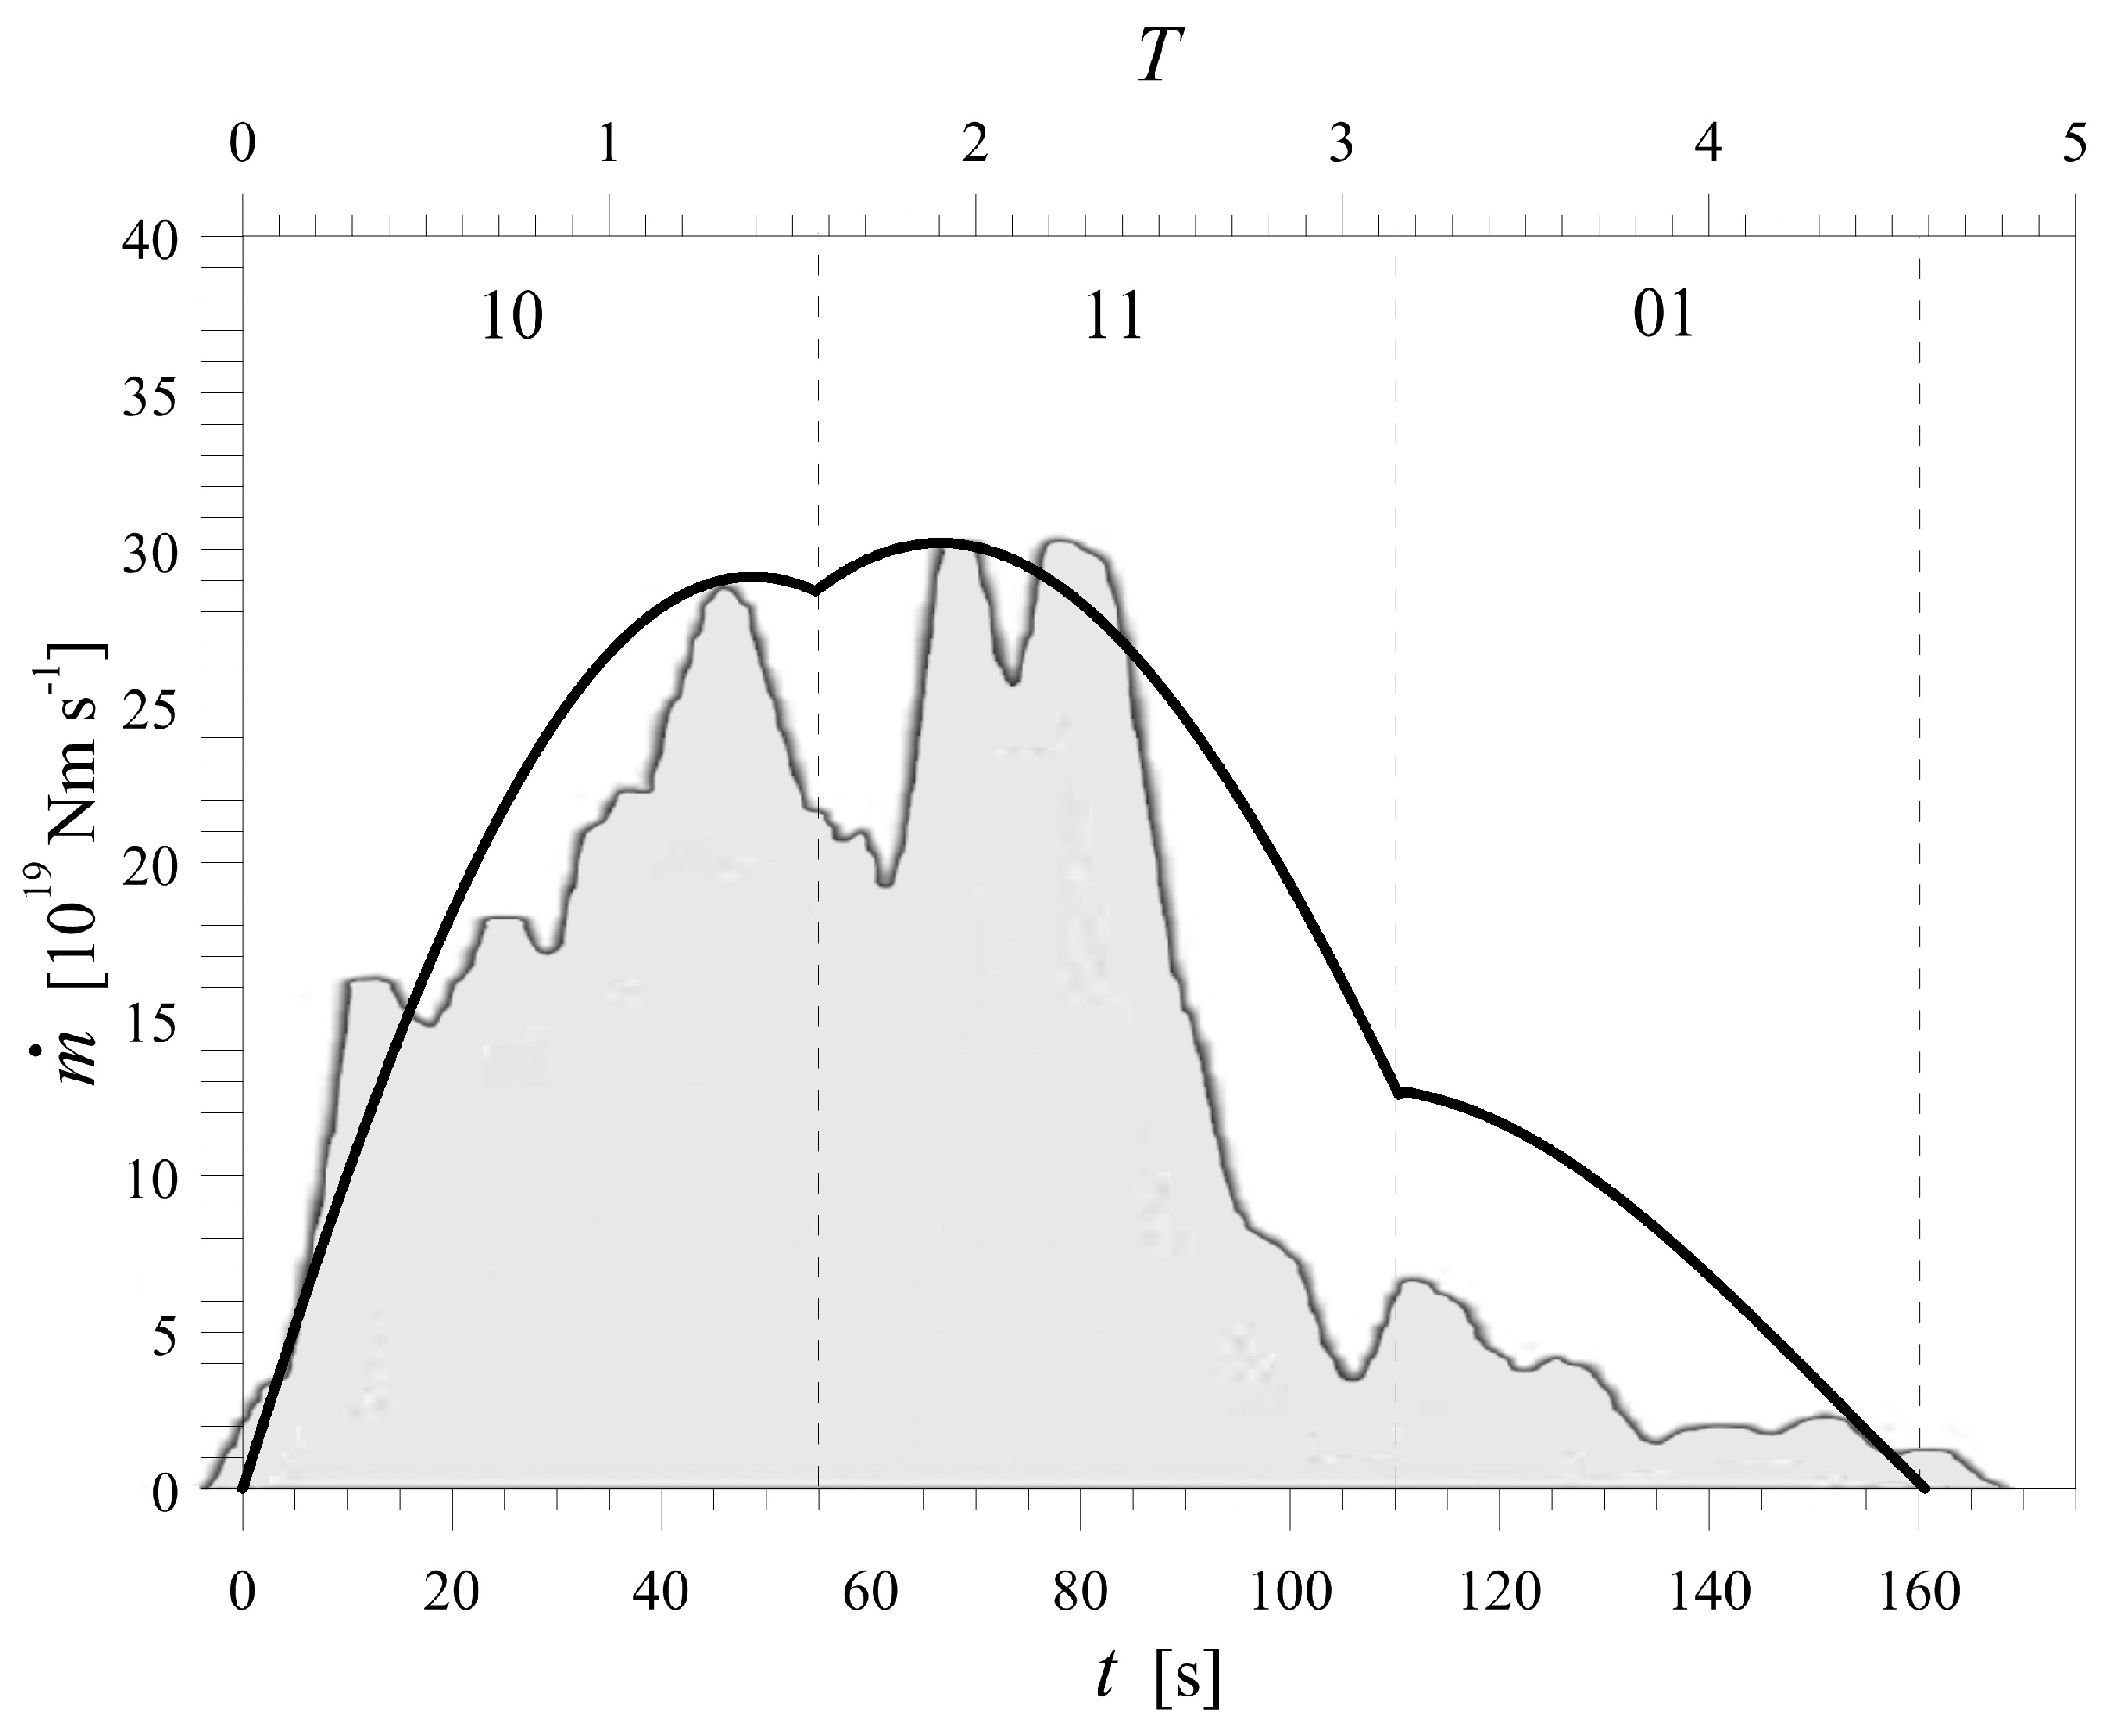
The moment rate m ˙ ( t ) calculated from the model is shown in Figure 4 together with the observed moment rate, as reported by [1]. The three modes 10, 11 and 01 have durations of 55, 55 and 50 s, respectively. The final seismic moment m 0 is calculated from (12), where U 1 = 0.46 and U 2 = 0.18 . In dimensional units, it is equal to 2.4 × 10 22 Nm, in good agreement with the observed value.
A comparison with [17] shows that consideration of different asperity areas and of wave radiation may sensibly affect fault dynamics. In fact, the present model yields results that are consistent with observations with a different initial stress distribution. This does not change the sequence of dynamic modes in the event, but changes the details of the moment rate function, entailing a different final stress distribution on the fault.
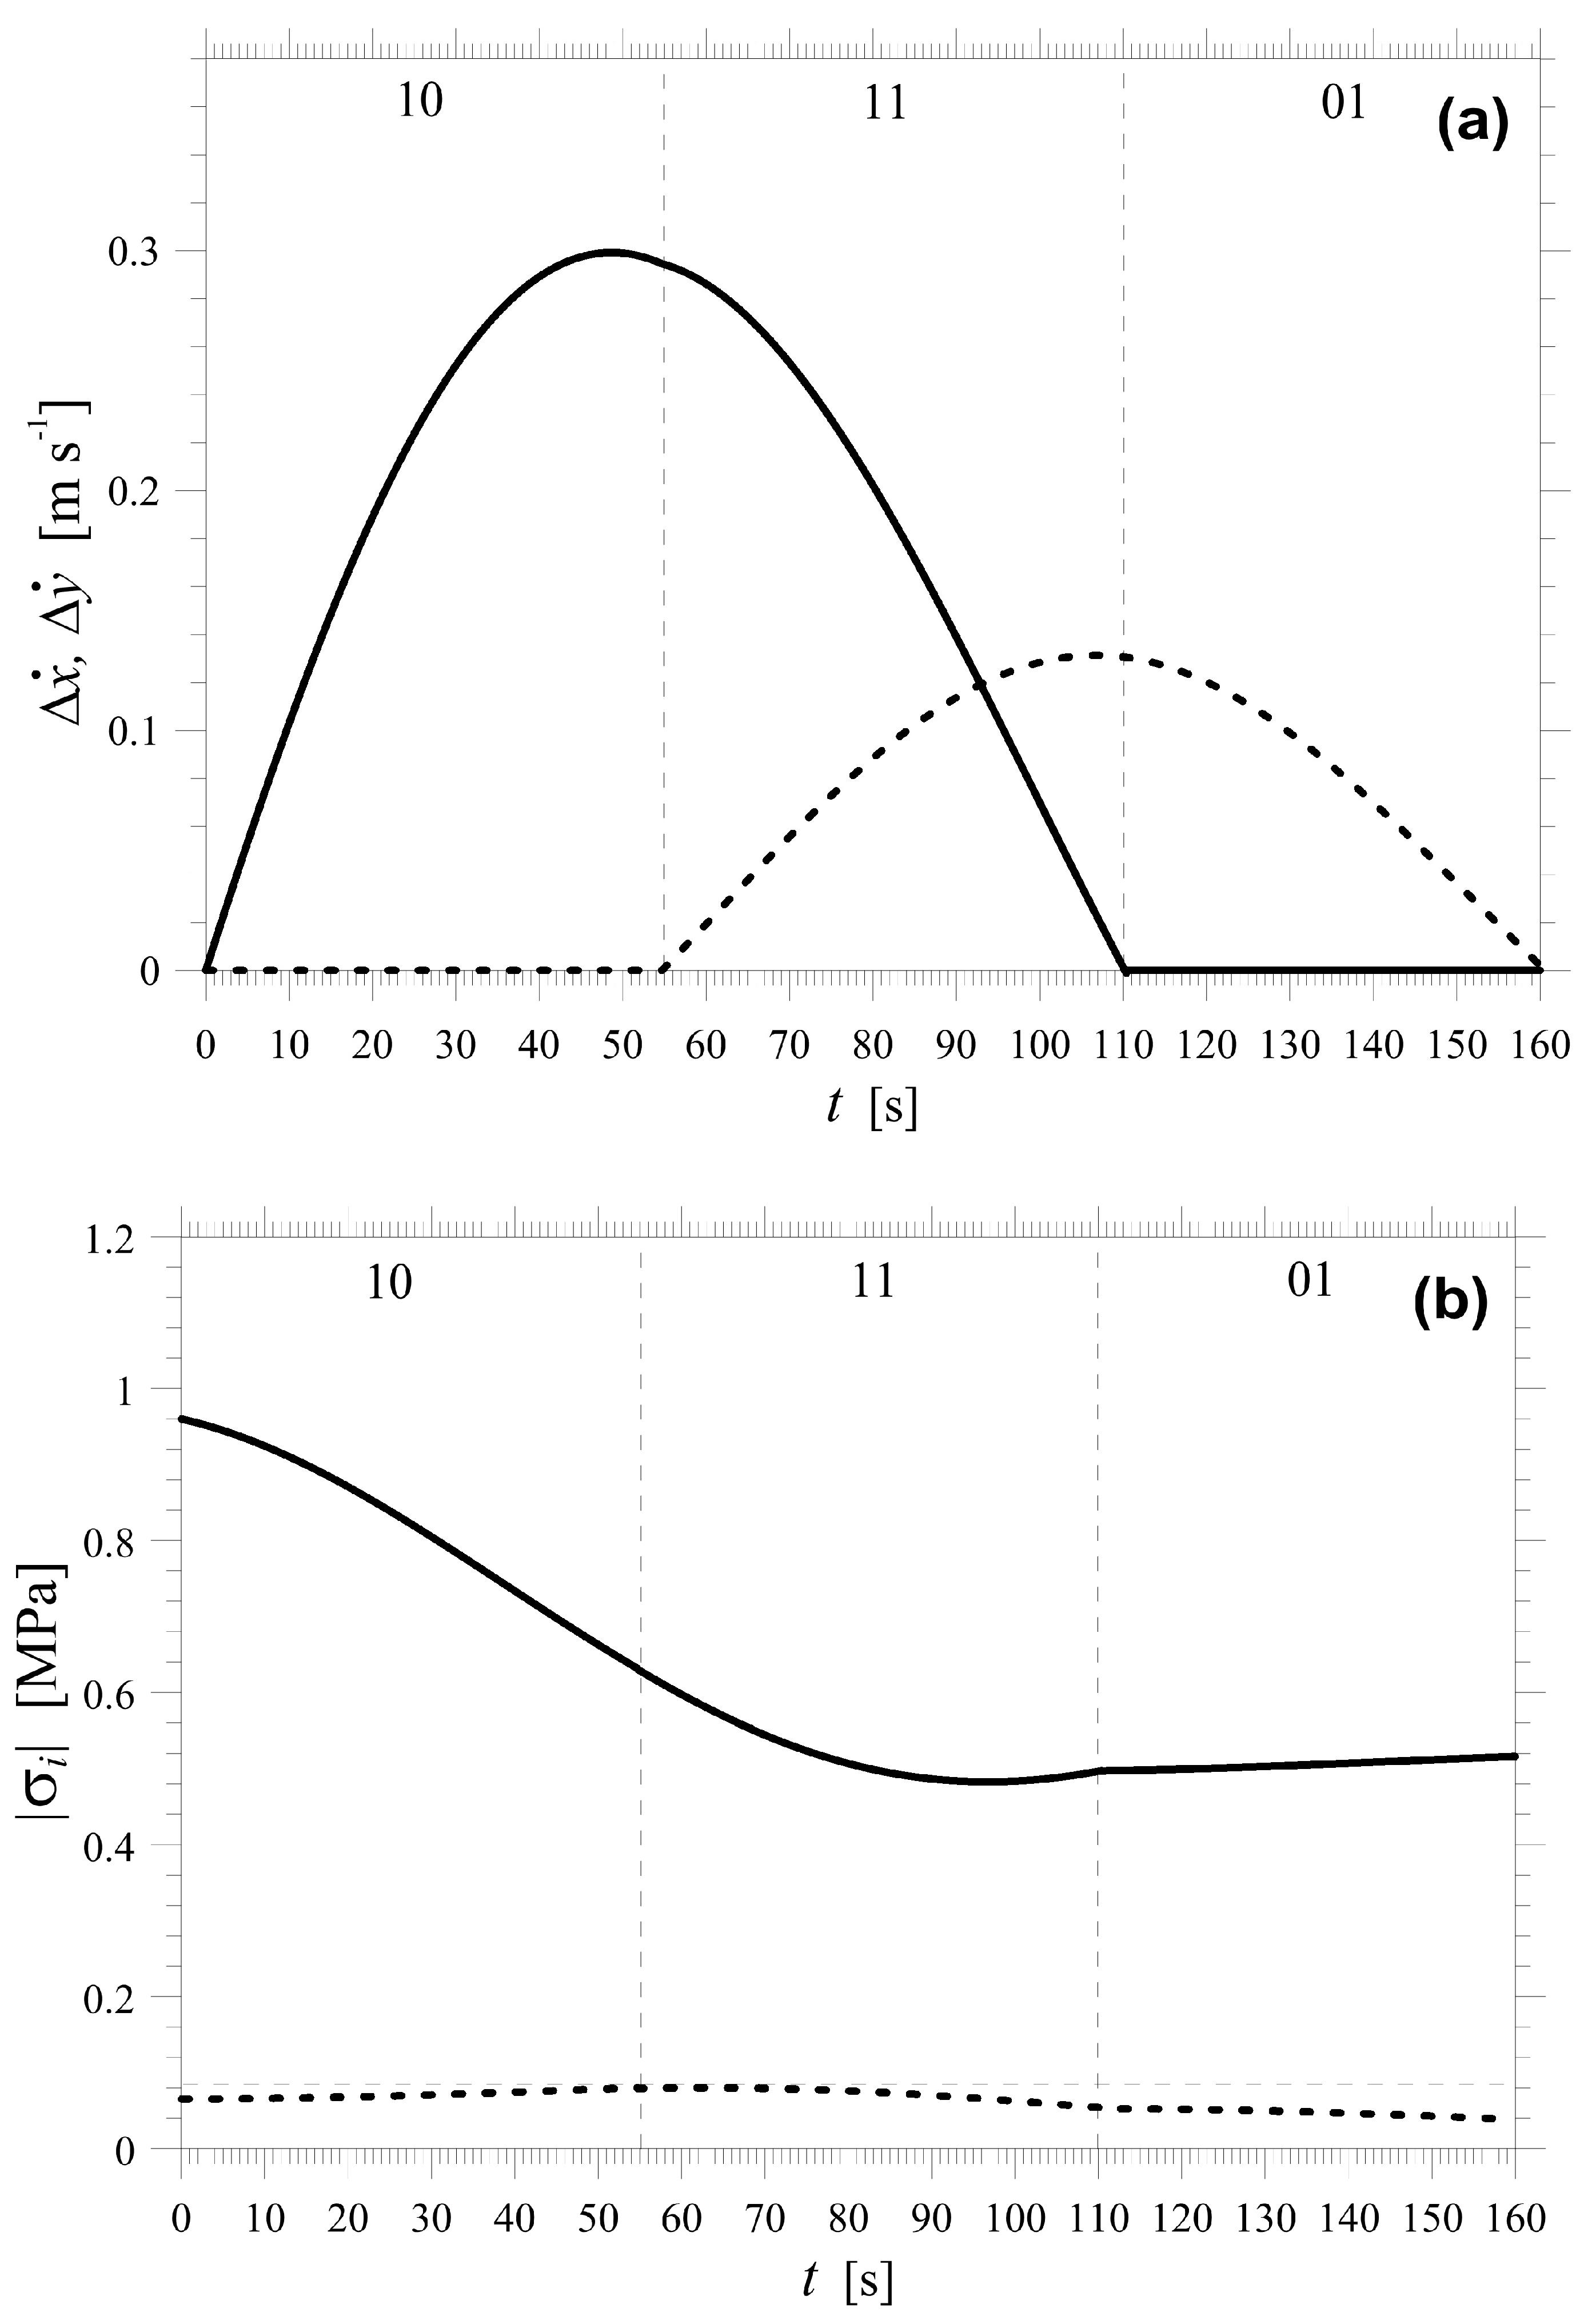
The moment rate is the result of a continuous stress transfer between asperities during fault slip. This process is shown in Figure 5, where slip rates and shear stresses on asperities are plotted as functions of time. Slip rate values are in the order of 10 cm s 1 for both asperities and the overlap between the two curves is evidence of simultaneous slip occurring in the central part of the event (Figure 5a). Shear stresses on the asperities oscillate during fault slip and their order of magnitude corresponds to the stress drop values obtained by [31] for Central–Southern Chile (Figure 5b).

4. Surface Heat Flow

According to [32], the heat flow density at the Earth’s surface in the Chilean region can be written as:
q s = q m S + σ v S + H U C h U C + H L C h L C ,
where q m is the heat flow density from the mantle; σ is the average frictional stress on the thrust fault; H U C and H L C are the radiogenic heat productivities in the upper and lower crust, respectively; h U C and h L C are the thicknesses of the upper and lower crust, respectively. The divisor S is [33]:
S = 1 + sin δ v u f χ ,
where δ is the dip angle of the fault, χ is the thermal diffusivity and
u f = x f 2 + z f 2 ,
where x f is the distance between epicenter and trench and z f is the hypocenter depth. The dip angle is calculated as
sin δ = z f u f
Upon substitution of data for the 2010 Maule earthquake (Table 1), the results are δ 10 and S 4 .
In order to evaluate the frictional stress σ in (13), we consider that the effective pressure at depth z f can be written as [34]:
p = ρ g z f ( 1 λ ) ,
where g is the acceleration of gravity and λ is the pore-fluid factor. If Δ σ is the horizontal tectonic stress, the compressive normal stress on the fault is [35]
σ n = p Δ σ sin δ
where Δ σ < 0 in a thrust regime. The last term in (18) can be neglected due to the small dip angle and the frictional stress is:
σ = κ s p ,
where κ s is the coefficient of static friction. Considering that λ is equal to 0.97 in Central-Southern Chile [36] and using the other data from Table 1, we obtain σ 17 MPa.
In conclusion, considering radiogenic productivities H U C = 1 μ W m 3 and H L C = 0.4   μ W m 3 [32] and thicknesses h U C = 15 km and h L C = 10 km, we obtain a surface heat flow density q s = 43 mW m 2 in the coastal range, a very similar value to that measured and corrected for latitude 33 S by [37]. The contribution of steady frictional heating is equal to 10 mW m 2 or about 23 % of q s .

5. Heat Pulse

According to [19], the nondimensional heat produced by a two-asperity fault during a seismic event is
Δ Q = ϵ ( U 1 + U 2 ) .
The corresponding dimensional quantity is
Δ q = f s 1 2 K 1 Δ Q .
In the global budget of heat flow generated at a plate boundary, an earthquake can be considered as a point-like and instantaneous event. If Δ q is the heat produced at time t = 0 by a seismic source located at x = x 0 , the temperature field Θ ( x , t ) in the surrounding medium can be calculated by solving the time-dependent heat equation
Θ t = χ 2 Θ + Δ q ρ c p δ ( x x 0 ) δ ( t ) ,
where c p is the specific heat capacity (per unit mass). The solution is [38]
Θ ( r , t ) = Δ q 8 ρ c p ( π χ t ) 3 / 2 e r 2 4 χ t
where
r = | x x 0 | .
The heat flow density is calculated as:
h ( r , t ) = κ Θ r
where κ is thermal conductivity. At distance z from the source, the flow density is then
h ( t ) = Δ q z 16 t ( π χ t ) 3 / 2 e z 2 4 χ t .
We introduce a nondimensional time
t = t τ
where τ is the characteristic diffusion time
τ = z 2 4 χ .
Then,
h ( t ) = Δ q 8 π 3 / 2 χ τ 2 ( t ) 5 / 2 e 1 t .
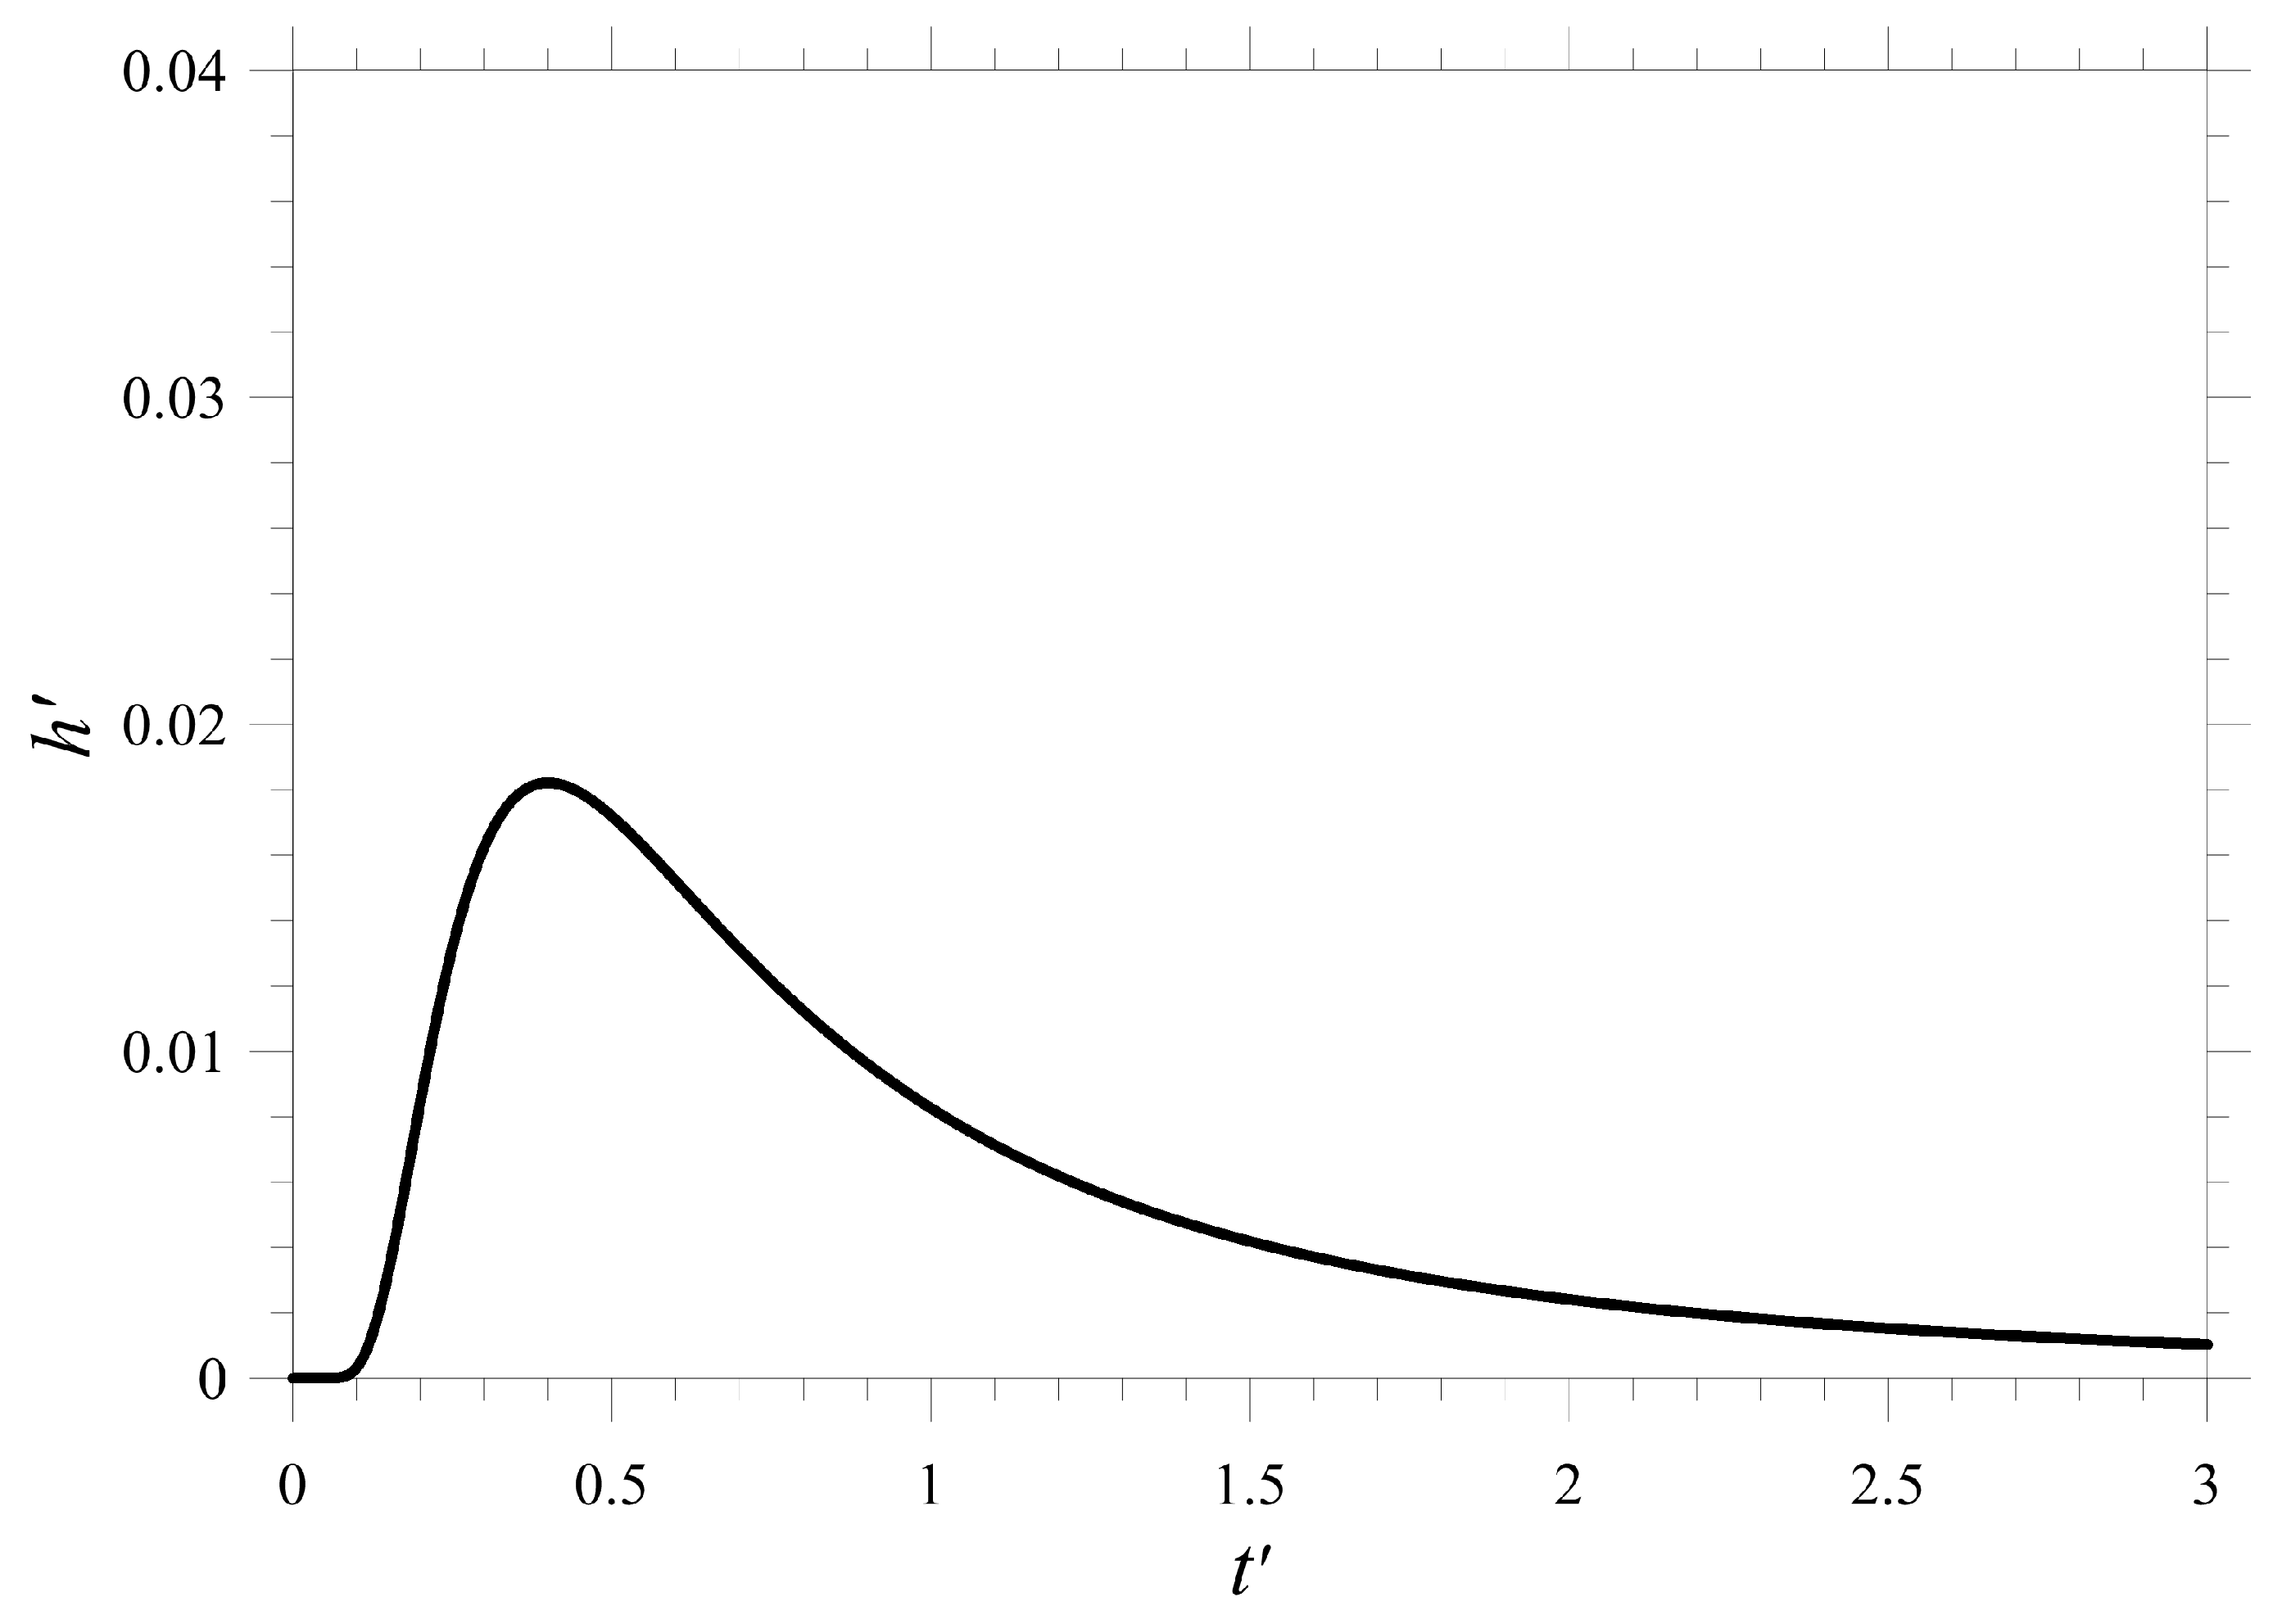
This can be approximately considered to be the contribution of the earthquake to surface heat flow. In Figure 6, we plot the nondimensional quantity
h = χ τ 2 Δ q h .
Then
h = ( t ) 5 / 2 e 1 t 8 π 3 / 2 .
The heat pulse reaches its maximum at time
t m a x = 2 5
and the maximum value is
h m a x = e 5 2 8 π 3 / 2 2 5 5 / 2
or about 0.018. The dimensional contribution to heat flow density can be evaluated as
h m a x = Δ q χ τ 2 h m a x
We can calculate the heat Δ q produced by the 2010 Maule earthquake using Equation (21). With
f s 1 = σ 1 A 1 ,
where we take σ 1 = 1 MPa (Figure 5b), we obtain Δ q 2 × 10 17 J. An estimate of the characteristic diffusion time is made from (28) by taking z = 10 km as representative of fault depth: it results in τ = 2.5 × 10 13 s. From (34), the maximum value of the heat pulse is h m a x 6 × 10 3 mW m 2 or about 10 3 of the average heat flow density due to steady frictional heating on the fault surface and about 10 4 of the average heat flow density measured at the Earth’s surface.

6. Conclusions

We considered the 2010 Maule earthquake, a megathrust event that occurred along the Peru–Chile Trench. The earthquake source was modelled as a fault with two asperities with different areas and strengths. Employing a discrete fault model, where asperities are the basic elements, it is possible to describe each event as a sequence of dynamic modes of the fault and to reproduce the observed moment rate.
On the basis of available data, the moment rate of the Maule earthquake can be ascribed to a sequence of three dynamic modes involving simultaneous asperity slip. The mode durations, the slip distribution, the moment rate and the final seismic moment are consistent with the observed values.
An important amount of heat is produced by an event of this size and it contributes to the average heat flow of the region. The frictional heat produced by fault slip has been calculated as the sum of the contributions of the two asperities. The heat diffusion equation has been solved, showing that heat propagates through the Earth’s crust as a very slow pulse. The maximum heat flow density associated with the pulse is equal to about 10 4 of the average surface heat flow density, thus confirming the absence of heat flow anomalies in connection with fault zones.

Author Contributions

Conceptualization, M.D. and S.S.; methodology, M.D. and S.S.; software, S.S.; validation, M.D. and S.S.; formal analysis, M.D. and S.S.; investigation, M.D. and S.S.; resources, M.D. and S.S.; data curation, M.D. and S.S.; writing—original draft preparation, M.D. and S.S.; writing—review and editing, M.D. and S.S.; visualization, M.D. and S.S.; supervision, M.D.; project administration, M.D.; funding acquisition, S.S. All authors have read and agreed to the published version of the manuscript.

Funding

This research received no external funding.

Institutional Review Board Statement

Not applicable.

Informed Consent Statement

Not applicable.

Data Availability Statement

Not applicable.

Acknowledgments

The authors are grateful to the Editor for his support and to three anonymous Reviewers for helpful and constructive comments on the first version of the paper.

Conflicts of Interest

The authors declare no conflict of interest.

References

  1. Delouis, B.; Nocquet, J.M.; Vallée, M. Slip distribution of the February 27, 2010 Mw = 8.8 Maule earthquake, central Chile, from static and high-rate GPS, InSAR, and broadband teleseismic data. Geophys. Res. Lett. 2010, 37, L17305. [Google Scholar] [CrossRef] [Green Version]
  2. Lay, T.; Ammon, C.J.; Kanamori, H.; Koper, K.D.; Sufri, O.; Hutko, A.R. Teleseismic inversion for rupture process of the 27 February 2010 Chile (Mw 8.8) earthquake. Geophys. Res. Lett. 2010, 37, L13301. [Google Scholar] [CrossRef] [Green Version]
  3. Vigny, C.; Socquet, A.; Peyrat, S.; Ruegg, J.C.; Métois, M.; Madariaga, R.; Morvan, S.; Lancieri, M.; Lacassin, R.; Campos, J.; et al. The 2010 Mw 8.8 Maule Megathrust Earthquake of Central Chile, Monitored by GPS. Science 2011, 332, 1417–1421. [Google Scholar] [CrossRef] [PubMed] [Green Version]
  4. Lay, T.; Kanamori, H.; Ruff, L. The asperity model and the nature of large subduction zone earthquakes. Earthq. Pred. Res. 1982, 1, 3–71. [Google Scholar]
  5. Scholz, C.H. The Mechanics of Earthquakes and Faulting, 3rd ed.; Cambridge University Press: Cambridge, UK, 2019; p. 512. [Google Scholar]
  6. Ruff, L.J. Asperity distributions and large earthquake occurrence in subduction zones. Tectonophysics 1992, 211, 61–83. [Google Scholar] [CrossRef] [Green Version]
  7. Somerville, P.; Irikura, K.; Graves, R.; Sawada, S.; Wald, D.; Abrahamson, N.; Kagawa, T.; Iwasaki, Y.; Smith, N.; Kowada, A. Characterizing crustal earthquake slip models for the prediction of strong ground motion. Seismol. Res. Lett. 1999, 70, 59–80. [Google Scholar] [CrossRef]
  8. Rice, J.R. Spatio-temporal complexity of slip on a fault. J. Geophys. Res. 1993, 98, 9885–9907. [Google Scholar] [CrossRef] [Green Version]
  9. Turcotte, D.L. Fractals and Chaos in Geology and Geophysics, 2nd ed.; Cambridge University Press: Cambridge, UK, 1997; p. 398. [Google Scholar]
  10. Nussbaum, J.; Ruina, A. A two degree-of-freedom earthquake model with static/dynamic friction. Pure Appl. Geophys. 1987, 125, 629–656. [Google Scholar] [CrossRef]
  11. Huang, J.; Turcotte, D.L. Are earthquakes an example of deterministic chaos? Geophys. Res. Lett. 1990, 17, 223–226. [Google Scholar] [CrossRef]
  12. Huang, J.; Turcotte, D.L. Chaotic seismic faulting with mass-spring model and velocity-weakening friction. Pure Appl. Geophys. 1992, 138, 569–589. [Google Scholar] [CrossRef]
  13. McCloskey, J.; Bean, C.J. Time and magnitude predictions in shocks due to chaotic fault interactions. Geophys. Res. Lett. 1992, 19, 119–122. [Google Scholar] [CrossRef]
  14. Dragoni, M.; Santini, S. Simulation of the long-term behaviour of a fault with two asperities. Nonlin. Proc. Geophys. 2010, 17, 777–784. [Google Scholar] [CrossRef] [Green Version]
  15. Dragoni, M.; Santini, S. Conditions for large earthquakes in a two-asperity fault model. Nonlin. Proc. Geophys. 2011, 18, 709–717. [Google Scholar] [CrossRef] [Green Version]
  16. Dragoni, M.; Santini, S. Long-term dynamics of a fault with two asperities of different strengths. Geophys. J. Int. 2012, 191, 1457–1467. [Google Scholar]
  17. Dragoni, M.; Santini, S. Source functions of a two-asperity fault model. Geophys. Res. Lett. 2014, 196, 1803–1812. [Google Scholar] [CrossRef] [Green Version]
  18. Dragoni, M.; Piombo, A. Effect of stress perturbations on the dynamics of a complex fault. Pure Appl. Geophys. 2015, 172, 2571–2583. [Google Scholar] [CrossRef]
  19. Dragoni, M.; Santini, S. A two-asperity fault model with wave radiation. Phys. Earth Planet. Int. 2015, 248, 83–93. [Google Scholar] [CrossRef]
  20. Dragoni, M.; Santini, S. Effects of fault heterogeneity on seismic energy and spectrum. Phys. Earth Planet. Int. 2017, 273, 11–22. [Google Scholar] [CrossRef]
  21. Dragoni, M.; Tallarico, A. Complex events in a fault model with interacting asperities. Phys. Earth Planet. Int. 2016, 257, 115–127. [Google Scholar] [CrossRef]
  22. Lorenzano, E.; Dragoni, M. A fault model with two asperities of different areas and strengths. Math. Geosci. 2018, 50, 697–724. [Google Scholar] [CrossRef]
  23. Shearer, P.M. Introduction to Seismology, 2nd ed.; Cambridge University Press: Cambridge, UK, 2009; p. 412. [Google Scholar]
  24. McGarr, A. On relating apparent stress to the stress causing earthquake fault slip. J. Geophys. Res. 1999, 104, 3003–3011. [Google Scholar] [CrossRef]
  25. Lachenbruch, A.H.; Sass, J.H. Heat flow and energetics of the San Andreas fault zone. J. Geophys. Res. 1980, 85, 6185–6222. [Google Scholar] [CrossRef] [Green Version]
  26. Stacey, F.D.; Davis, P.M. Physics of the Earth, 4th ed.; Cambridge University Press: Cambridge, UK, 2008; p. 532. [Google Scholar]
  27. Santini, S.; Dragoni, M. Moment rate of the 2018 Gulf of Alaska earthquake. Phys. Earth Planet. Int. 2020, 298, 106336. [Google Scholar] [CrossRef]
  28. Clouard, V.; Campos, J.; Lemoine, A.; Perez, A.; Kausel, E. Outer rise stress changes related to the subduction of the Juan Fernandez Ridge, central Chile. J. Geophys. Res. 2007, 112, B05305. [Google Scholar] [CrossRef] [Green Version]
  29. Maksymowicz, A.; Trehu, A.M.; Contreras-Reyes, E.; Ruiz, S. Density-depth model of the continental wedge at the maximum slip segment of the Maule Mw8.8 megathrust earthquake. Earth Planet. Sci. Lett. 2015, 409, 265–277. [Google Scholar] [CrossRef]
  30. United States Geological Survey, Finite Fault of the M 8.8–36 km WNW of Quirihue, Chile, Earthquake. Available online: https://earthquake.usgs.gov/earthquakes/eventpage/official20100227063411530_30/moment-tensor?source=us&code=pde20100227063411530_22_C_WCMT (accessed on 27 July 2021).
  31. Seno, T. Stress drop as a criterion to differentiate subduction zones where Mw 9 earthquakes can occur. Tectonophysics 2014, 621, 198–210. [Google Scholar] [CrossRef]
  32. Valdenegro, P.; Munoz, M.; Yanez, G.; Parada, M.A.; Morata, D. A model for thermal gradient and heat flow in central Chile: The role of thermal properties. J. S. Am. Earth Sci. 2019, 91, 88–101. [Google Scholar] [CrossRef]
  33. Molnar, P.; England, P. Temperatures, Heat Flux, and Frictional Stress Near Major Thrust Faults. J. Geophys. Res. 1990, 95, 4833–4856. [Google Scholar] [CrossRef]
  34. Sibson, R.H. Frictional constraints on thrust, wrench and normal faults. Nature 1974, 249, 542–544. [Google Scholar] [CrossRef]
  35. Turcotte, D.L.; Schubert, G. Geodynamics, 3rd ed.; Cambridge University Press: Cambridge, UK, 2014; p. 626. [Google Scholar]
  36. Seno, T. Determination of the pore fluid pressure ratio at seismogenic megathrusts in subduction zones: Implications for strength of asperities and Andean-type mountain building. J. Geophys. Res. 2009, 114, B05405. [Google Scholar] [CrossRef]
  37. Vllar-Munoz, L.; Behrmann, J.H.; Diaz-Naveas, J.; Klaeschen, D.; Karstens, J. Heat flow in the southern Chile forearc controlled by large-scale tectonic processes. Geo-Mar. Lett. 2014, 34, 185–198. [Google Scholar] [CrossRef]
  38. Luikov, A.V. Analytical Heat Diffusion Theory; Academic Press: New York, NY, USA, 1968; p. 685. [Google Scholar]
Figure 1. The fault model: a rectangular fault with two asperities with areas A 1 and A 2 respectively and distance between asperity centroids.
Energies 15 02253 g001
Figure 2. Map of the fault that originated the 2010 Maule earthquake, with the slip distribution retrieved by [30]. Asperities 1 and 2 are indicated.
Energies 15 02253 g002
Figure 3. Orbit in the state space X Y showing a 3-mode seismic event approximating the 2010 Maule earthquake, with the initial condition p = 0.56 . The event starts at point P 1 and terminates at point P 4 .
Energies 15 02253 g003
Figure 4. The moment rate m ˙ as a function of time, calculated for the 2010 Maule event (solid curve) superimposed to that retrieved from data by [1] (grey filled curve).
Energies 15 02253 g004
Figure 5. (a) Slip rates Δ x ˙ (solid curve) and Δ y ˙ (dashed curve) and (b) shear stresses σ 1 (solid curve) and σ 2 (dashed curve) as functions of time for asperity 1 and 2, respectively, calculated for the 2010 Maule event.
Energies 15 02253 g005
Figure 6. Heat pulse h produced by the seismic source as a function of time t (nondimensional units).
Energies 15 02253 g006
Table 1. Data of the 2010 Maule (Chile) earthquake.
A 1 = 14.4 × 10 3 km 2 ,Area of asperity 1
A 2 = 3.6 × 10 3 km 2 ,Area of asperity 2
e ˙ = 1.2 × 10 15 s 1 ,Tectonic strain rate
g = 10 m s 2 ,Acceleration of gravity
H L C = 0.4 μ W m 3 ,Heat productivity of the lower crust
H U C = 1 μ W m 3 ,Heat productivity of the upper crust
h L C = 10 km,Thickness of the lower crust
h U C = 15 km,Thickness of the upper crust
= 140 km,Distance between asperity centroids
q m = 60 mW m 2 ,Heat flow density from the mantle
u 1 = 15 m,Average slip of asperity 1
u 2 = 5 m,Average slip of asperity 2
v = 8 cm a 1 ,Relative plate velocity
x f = 125 km,Distance between epicenter and trench
z f = 23 km,Depth of the hypocenter
Δ t = 160 s,Duration of the event
κ s = 0.8 ,Coefficient of static friction
λ = 0.97 ,Pore fluid factor
μ = 35 GPa,Rigidity of the lithosphere
ρ = 3 × 10 3 kg m 3 ,Density of the lithosphere
χ = 10 6 m 2 s 1 ,Thermal diffusivity
Table 2. Values of model parameters.
α = 0.06 ,Coupling parameter between asperities
β = 0.33 ,Ratio between frictions of asperity 2 and 1
γ = 0.3 ,Impedance parameter
ϵ = 0.7 ,Ratio between dynamic and static frictions
ξ = 0.25 ,Ratio between asperity areas
Publisher’s Note: MDPI stays neutral with regard to jurisdictional claims in published maps and institutional affiliations.