
Minimum-Cost Fast-Charging Infrastructure Planning for Electric Vehicles along the Austrian High-Level Road Network


Abstract
:1. Introduction
2. Related Work
2.1. Climate Change Mitigation in the Passenger Transport Sector
2.2. Importance of Fast-Charging Infrastructure
2.3. Graph-Based Charging Infrastructure Allocation Optimization
2.4. Progress beyond State of the Art
- The required expansion of the charging infrastructure which is currently in place is modeled. Overall, this is rarely performed in case studies presented in the scientific literature proposing new charging infrastructure allocation models. However, this is a highly relevant application case as the existing charging infrastructure has to be further developed together with the growth of BEV fleets and other impact factors.
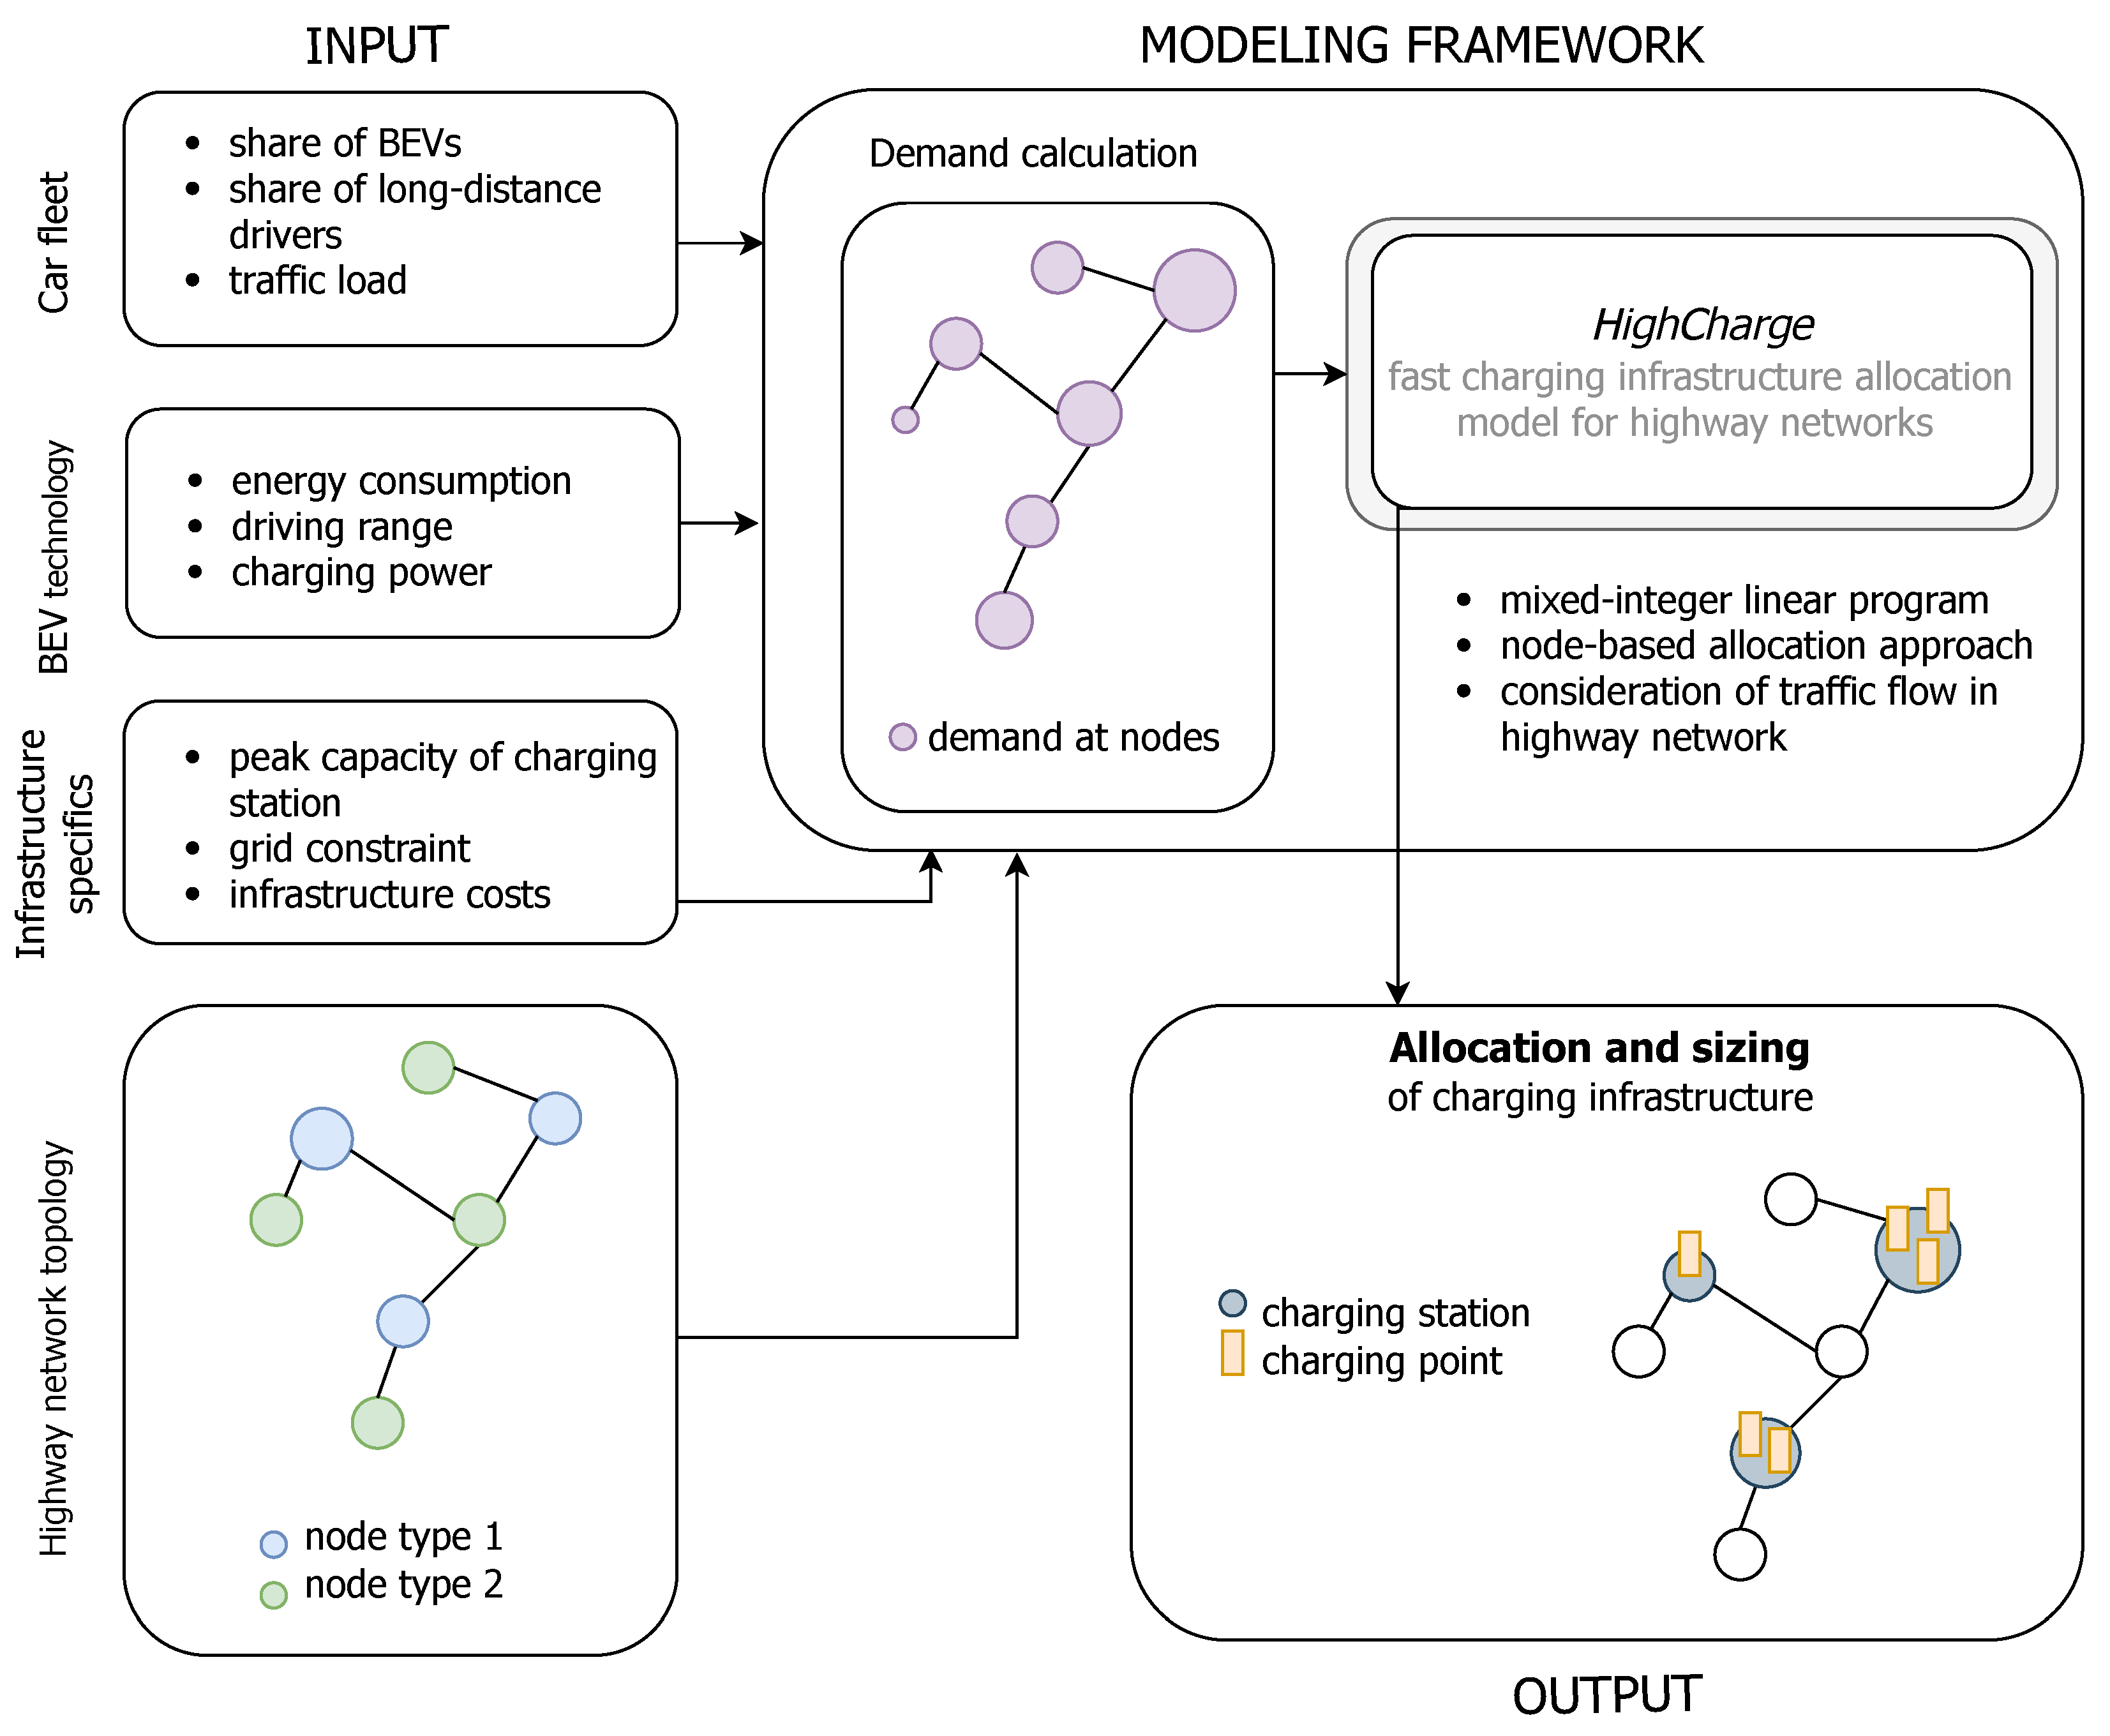
- The formulation of the proposed allocation model follows the node-based approach, which we extend to the application for highway networks. This was decided to benefit from the simplicity of the input data of this approach. The nodes represent potential positions for charging infrastructure, i.e., service areas. Given a typically high density of service areas, this model feature allows the introduction of the charging demand in high spatial granularity and based on the local traffic load and distance between service areas. Unlike in the original formulation of a node-based allocation approach, the demand assigned to a node is not evaluated based on the population density but on the energy demand stemming from the accumulated energy consumed by the driving BEV fleet along the highway section between two nodes. The demand of a node is shifted and can be covered by charging stations at other nodes. Within this shifting, traffic flow movement is simulated, by which we also aim to introduce the benefits offered by flow-based approaches.
- Comprehensive sensitivity analyses on the future share of BEVs, road traffic load, BEV driving range and charging capacity are conducted. It is foreseeable that the share of BEVs will increase, BEV technology will improve and the potential changes in mode split will affect road traffic load. Therefore, it is important to understand how these simultaneously occurring developments impact the requirements for fast-charging infrastructure.
3. Materials and Methods
3.1. Modeling Framework
- The costs of a charging station include, on the one hand, onsite preparations to enable the support of large capacities given by the charging points locally () and, on the other hand, hardware and construction costs associated with the installation of one singular charging point ().
- Service areas along highways are potential sites for charging stations. Areas that only offer parking places are not considered as potential sites due to limited space and infrastructure on site.
- The BEV fleet traveling along the highway network is treated as a homogeneous quantity, allowing to consider accumulated charging demand and translating this into the optimal sizing of a charging station. Based on this assumption, the technical parameters of an average BEV are assumed, such as average driving range (), energy consumption () and charging capacity ().
- All charging demands, , result from the energy consumption of BEVs driving along the highway and need to be compensated for in total by charging stations built along the highway network.
- Highway charging infrastructure is primarily used by long-distance drivers as BEV owners mostly charge at home or at work.
- A fast-charging infrastructure along a highway network is designed based on peak demands, including seasonal peak demand () and hourly peak demand during a day ().
3.1.1. Optimization Model
3.1.2. Charging Demand Calculation
3.2. Case Study, Scenarios and Input Data
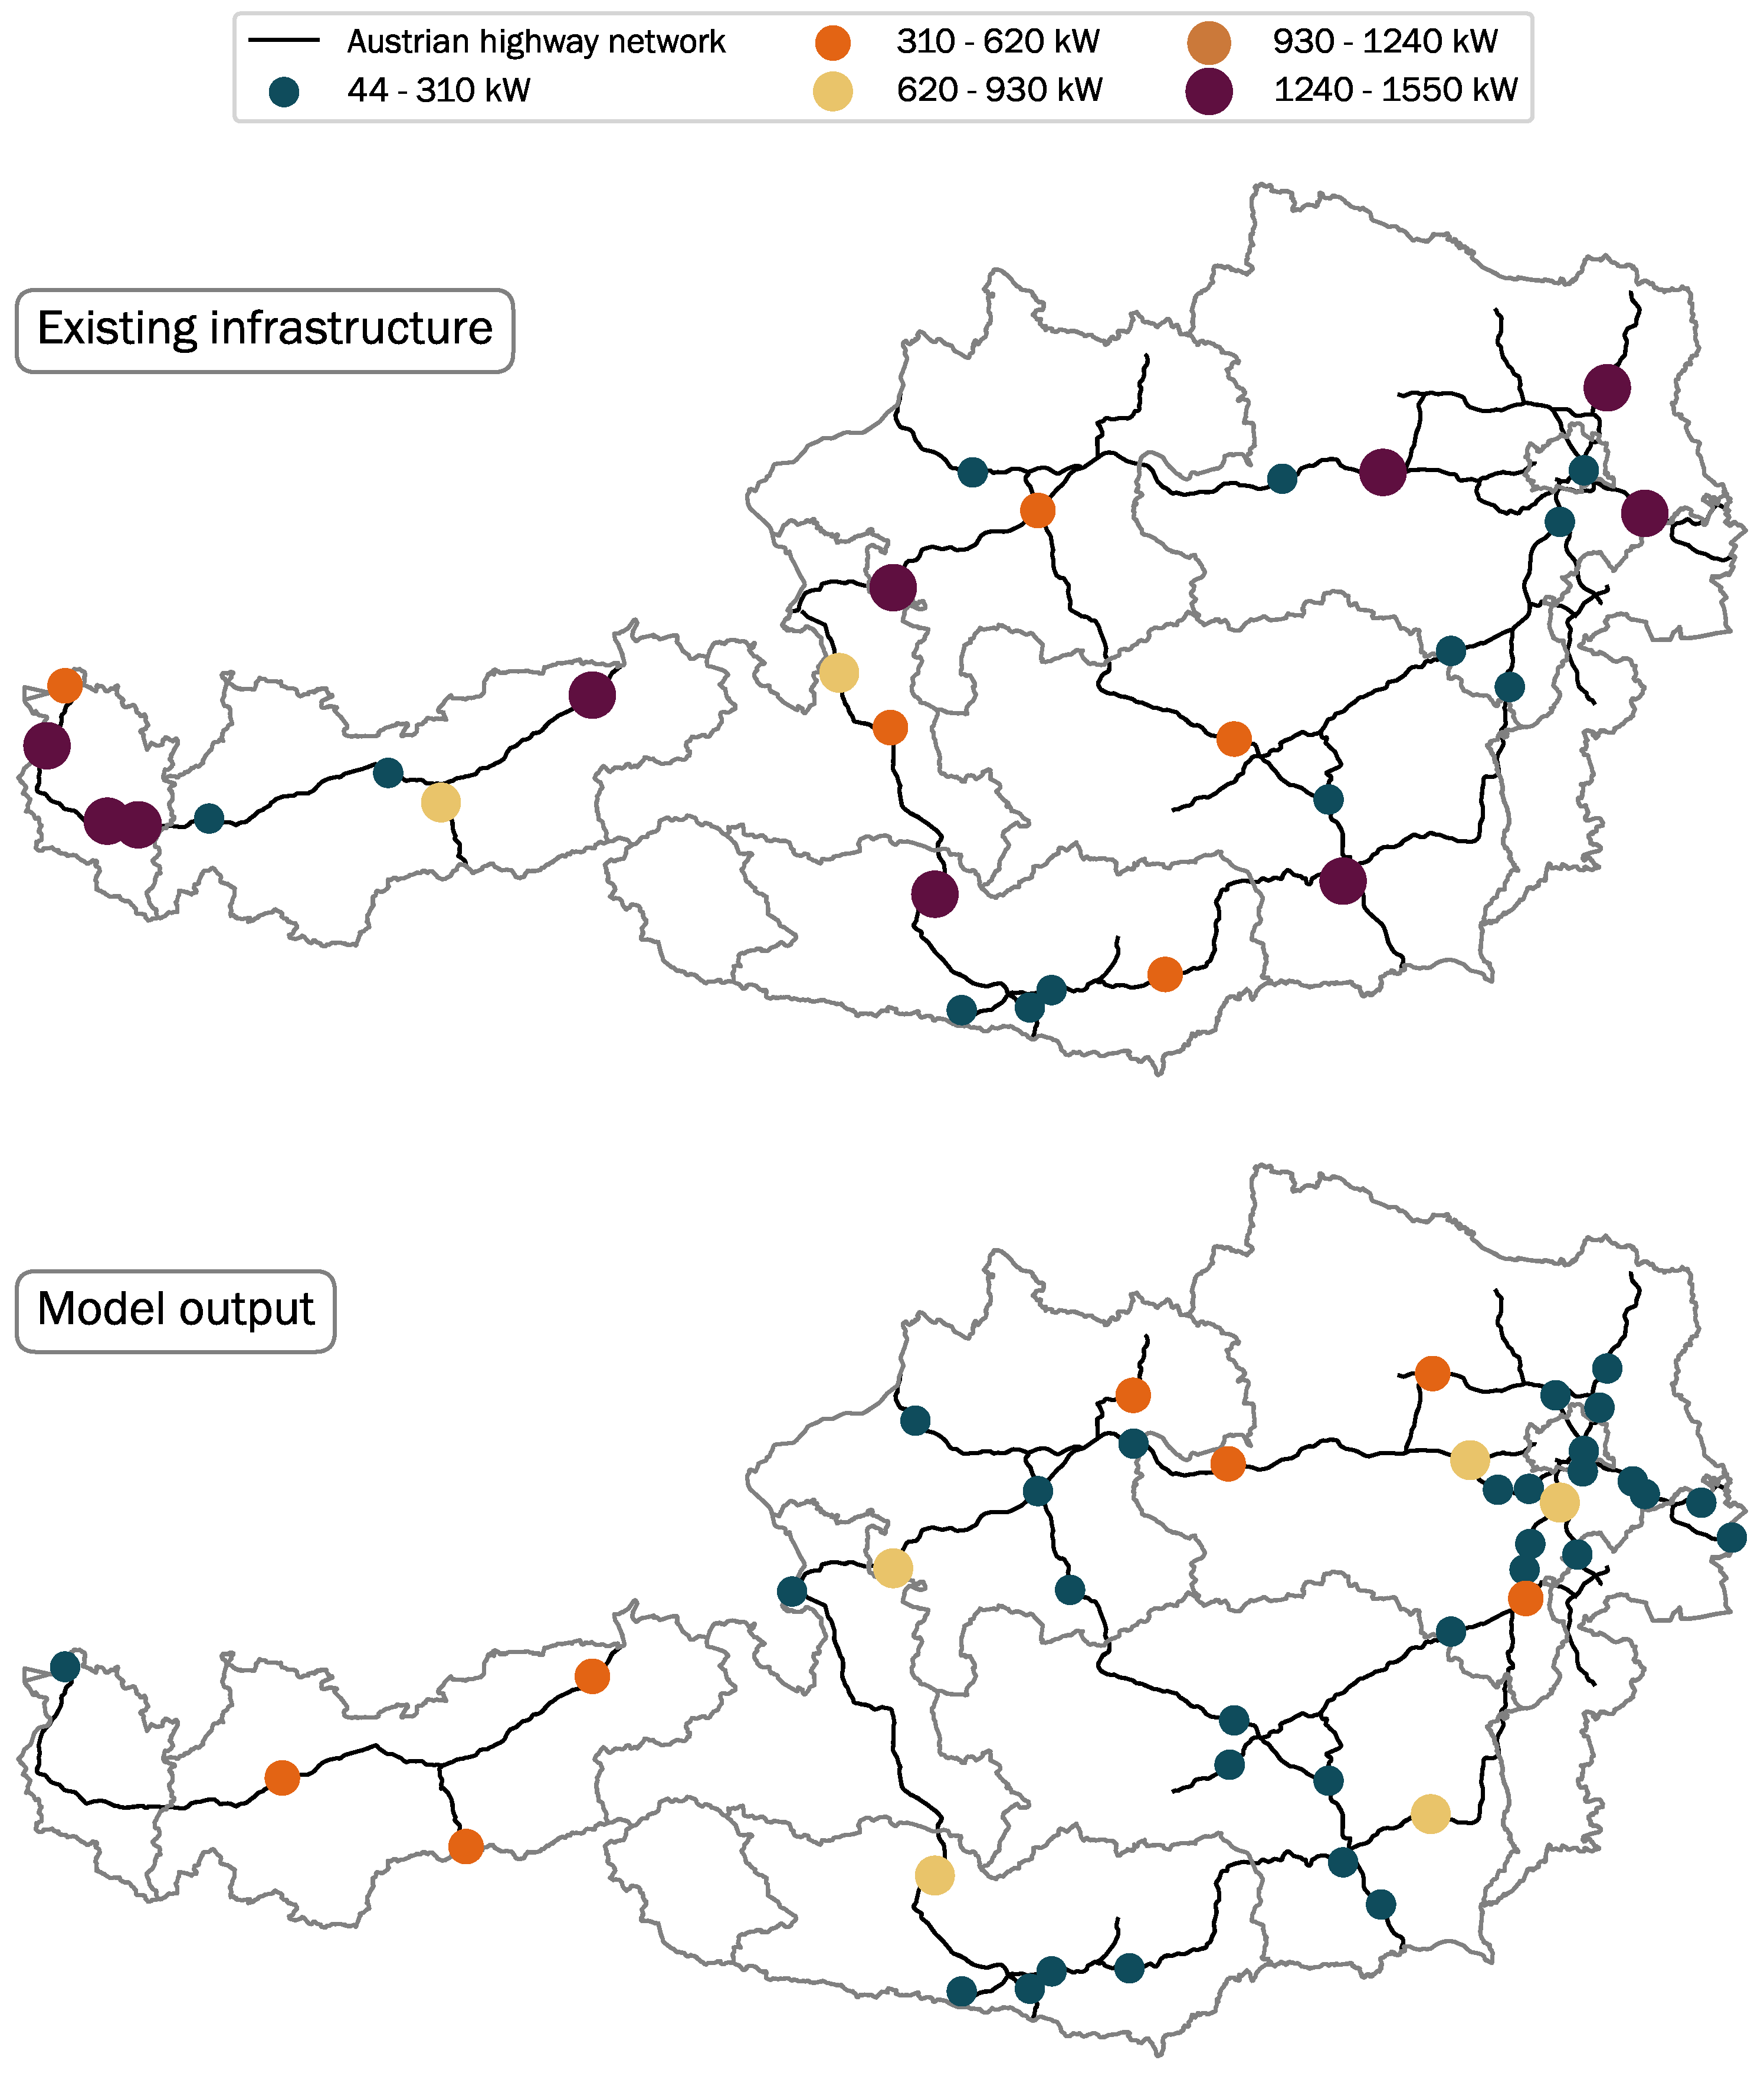
3.2.1. Austrian Case Study
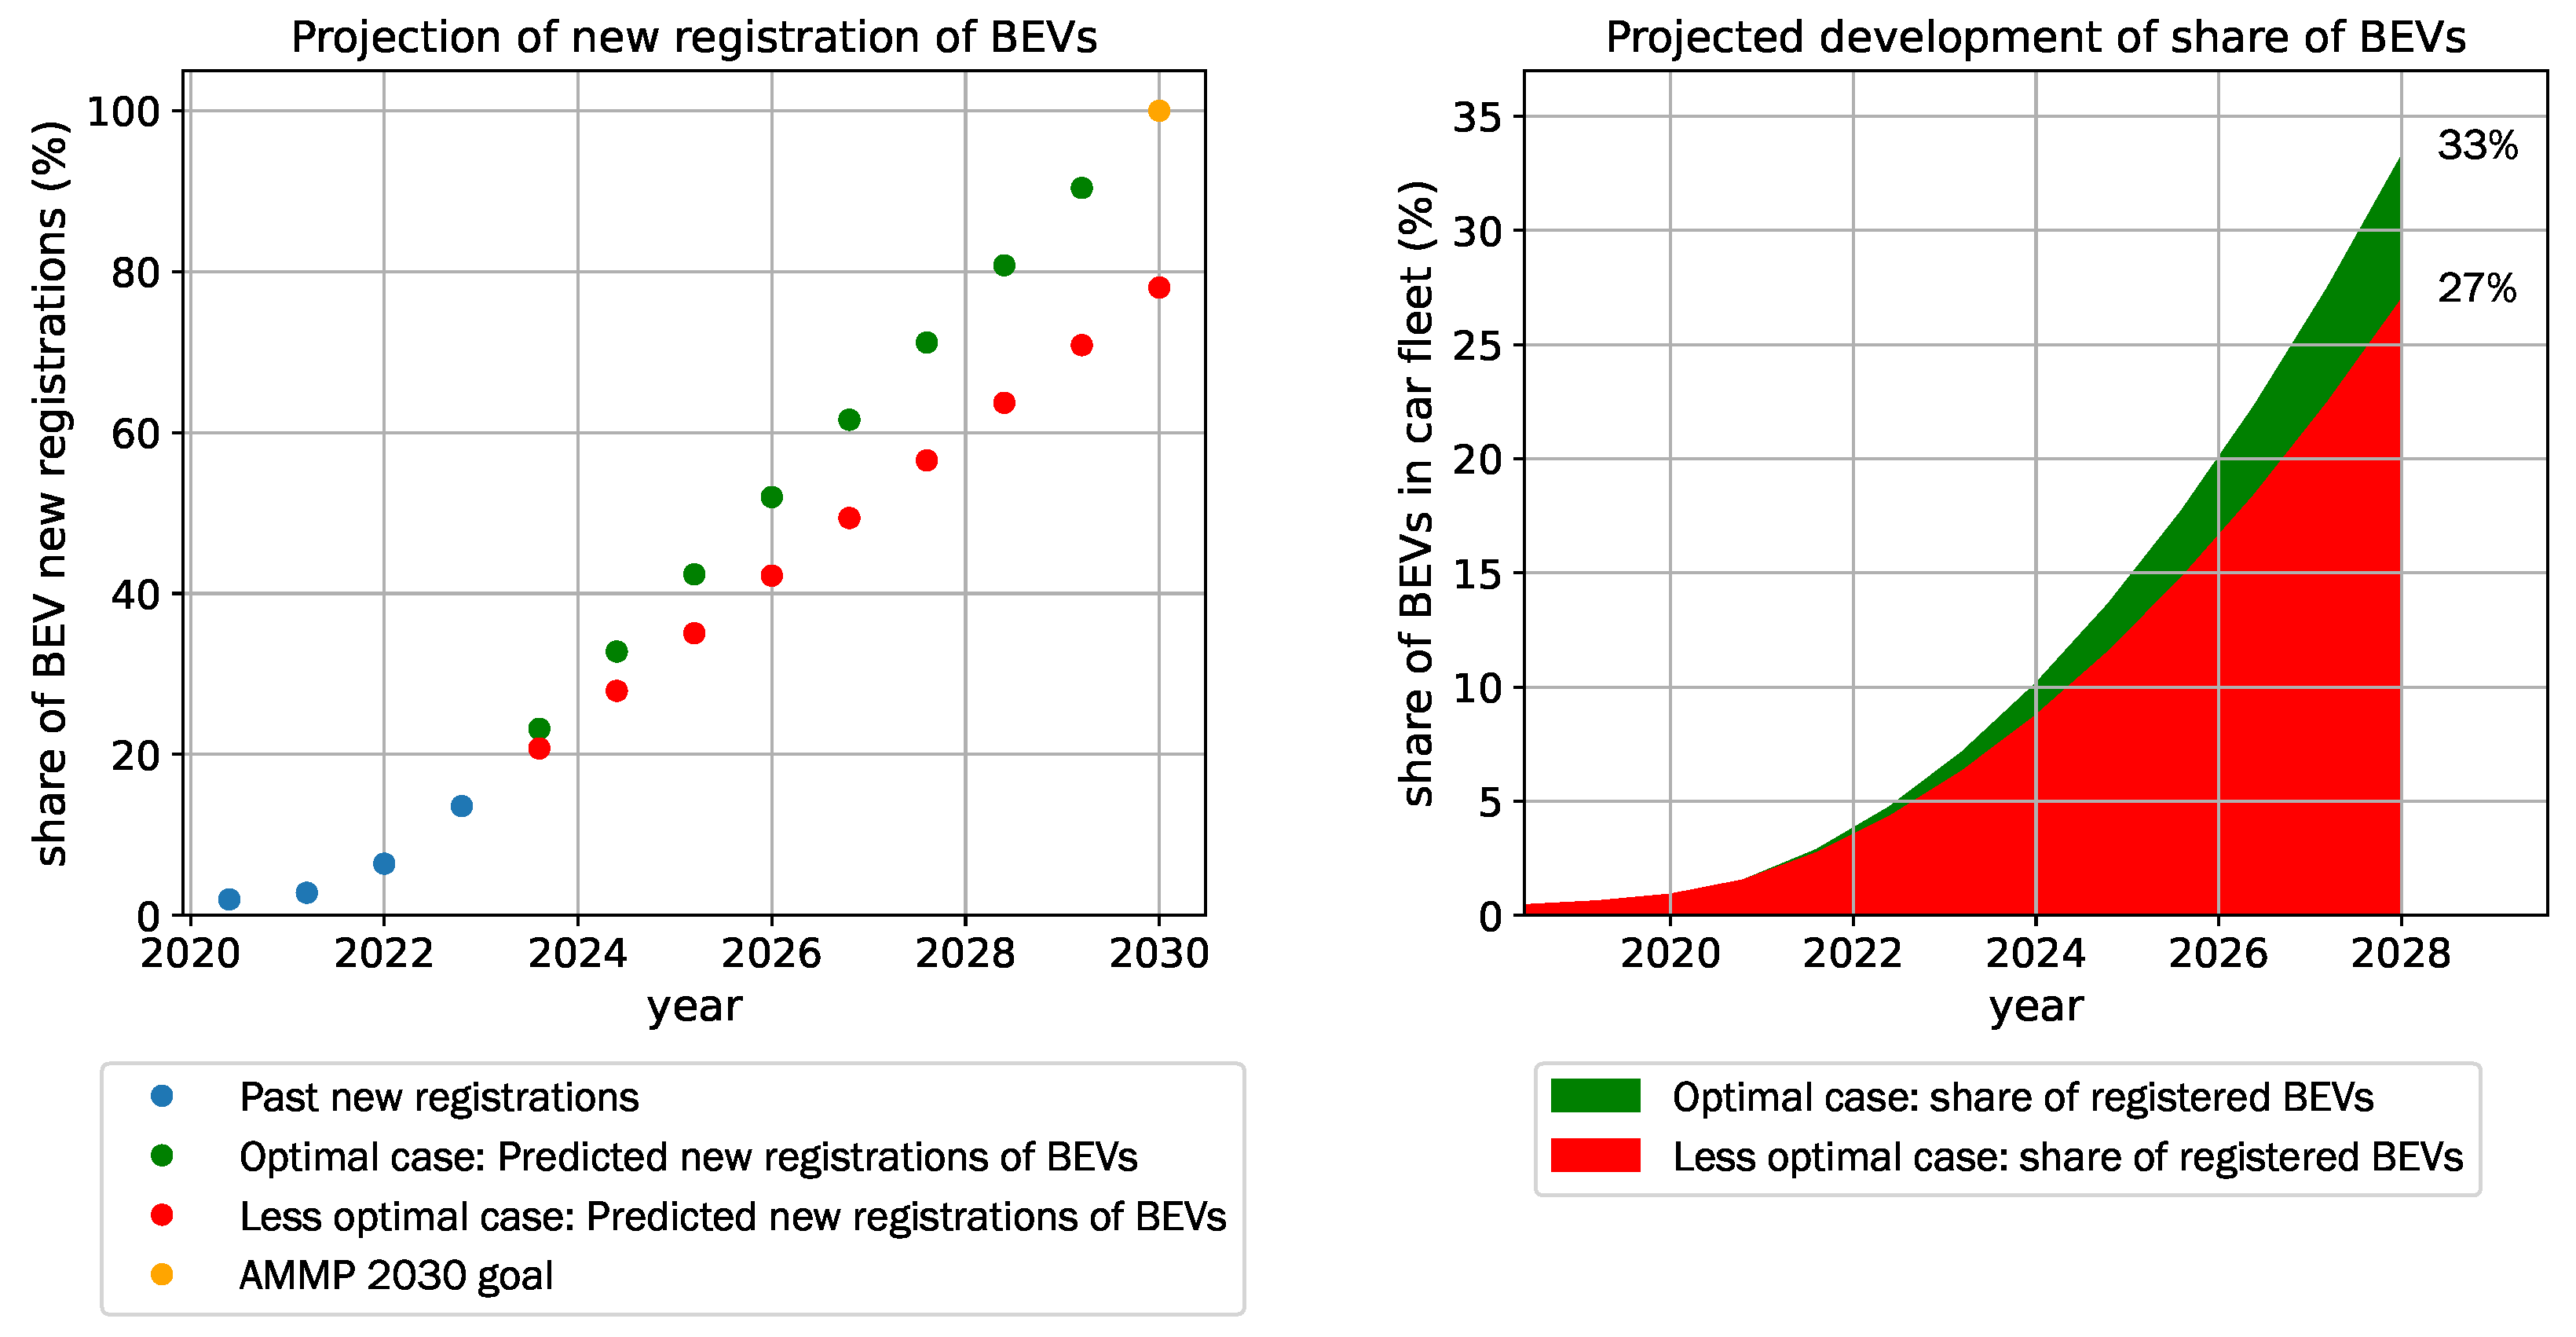
3.2.2. Future Scenarios
- Societal Commitment (SC): Within this scenario, politics are strongly intervening, which is met by wide-spread societal acceptance, triggering behavioral changes in the face of awareness of the necessity of climate change mitigation; while this scenario is characterized by a reduction in energy demand due to behavioral changes, societal engagement supporting circular economy and new market solutions, it is assumed that no significant technological breakthroughs appear. This translates in the transport sector to an increased modal shift to sharing concepts and public transport, which causes a significant decrease in individual passenger road transport.
- Techno Friendly (TF): This setting combines the appearance of major technological breakthroughs and strong societal engagement, which results in an increased top-down push effect in the application of new technologies that improve energy efficiency. Simultaneously, similarly as in the SC scenario, there is a strong social commitment driving an increased modal shift away from individual passenger car transport.
- Directed Transition (DT): Similarly as in the TF scenario, there is a strong active policy push supporting new technology options, while there are major technological developments, the social commitment to adopting such developments is missing. This results in the moderate growth of BEV share throughout the years and a decreased modal shift, but registered BEVs of the Austrian car fleet still show similar technological improvements as in the TF scenario.
- Gradual Development (GD): This scenario represents the projection of less ambitious climate change mitigation goals. It embodies the exertion of all three dimensions, namely, social engagement, technological breakthroughs and significant political interventions, only a weaker extent of each. Therefore, while BEV penetration will grow to some degree and technological improvements will appear, no changes in mobility patterns are expected for this pathway.
3.3. Model Validation and Limitations
3.4. Open-Source Programming Environment and Data Availability
4. Results
4.1. Expansion of Fast-Charging Infrastructure along Austrian Highway Network under Different Scenarios for 2030
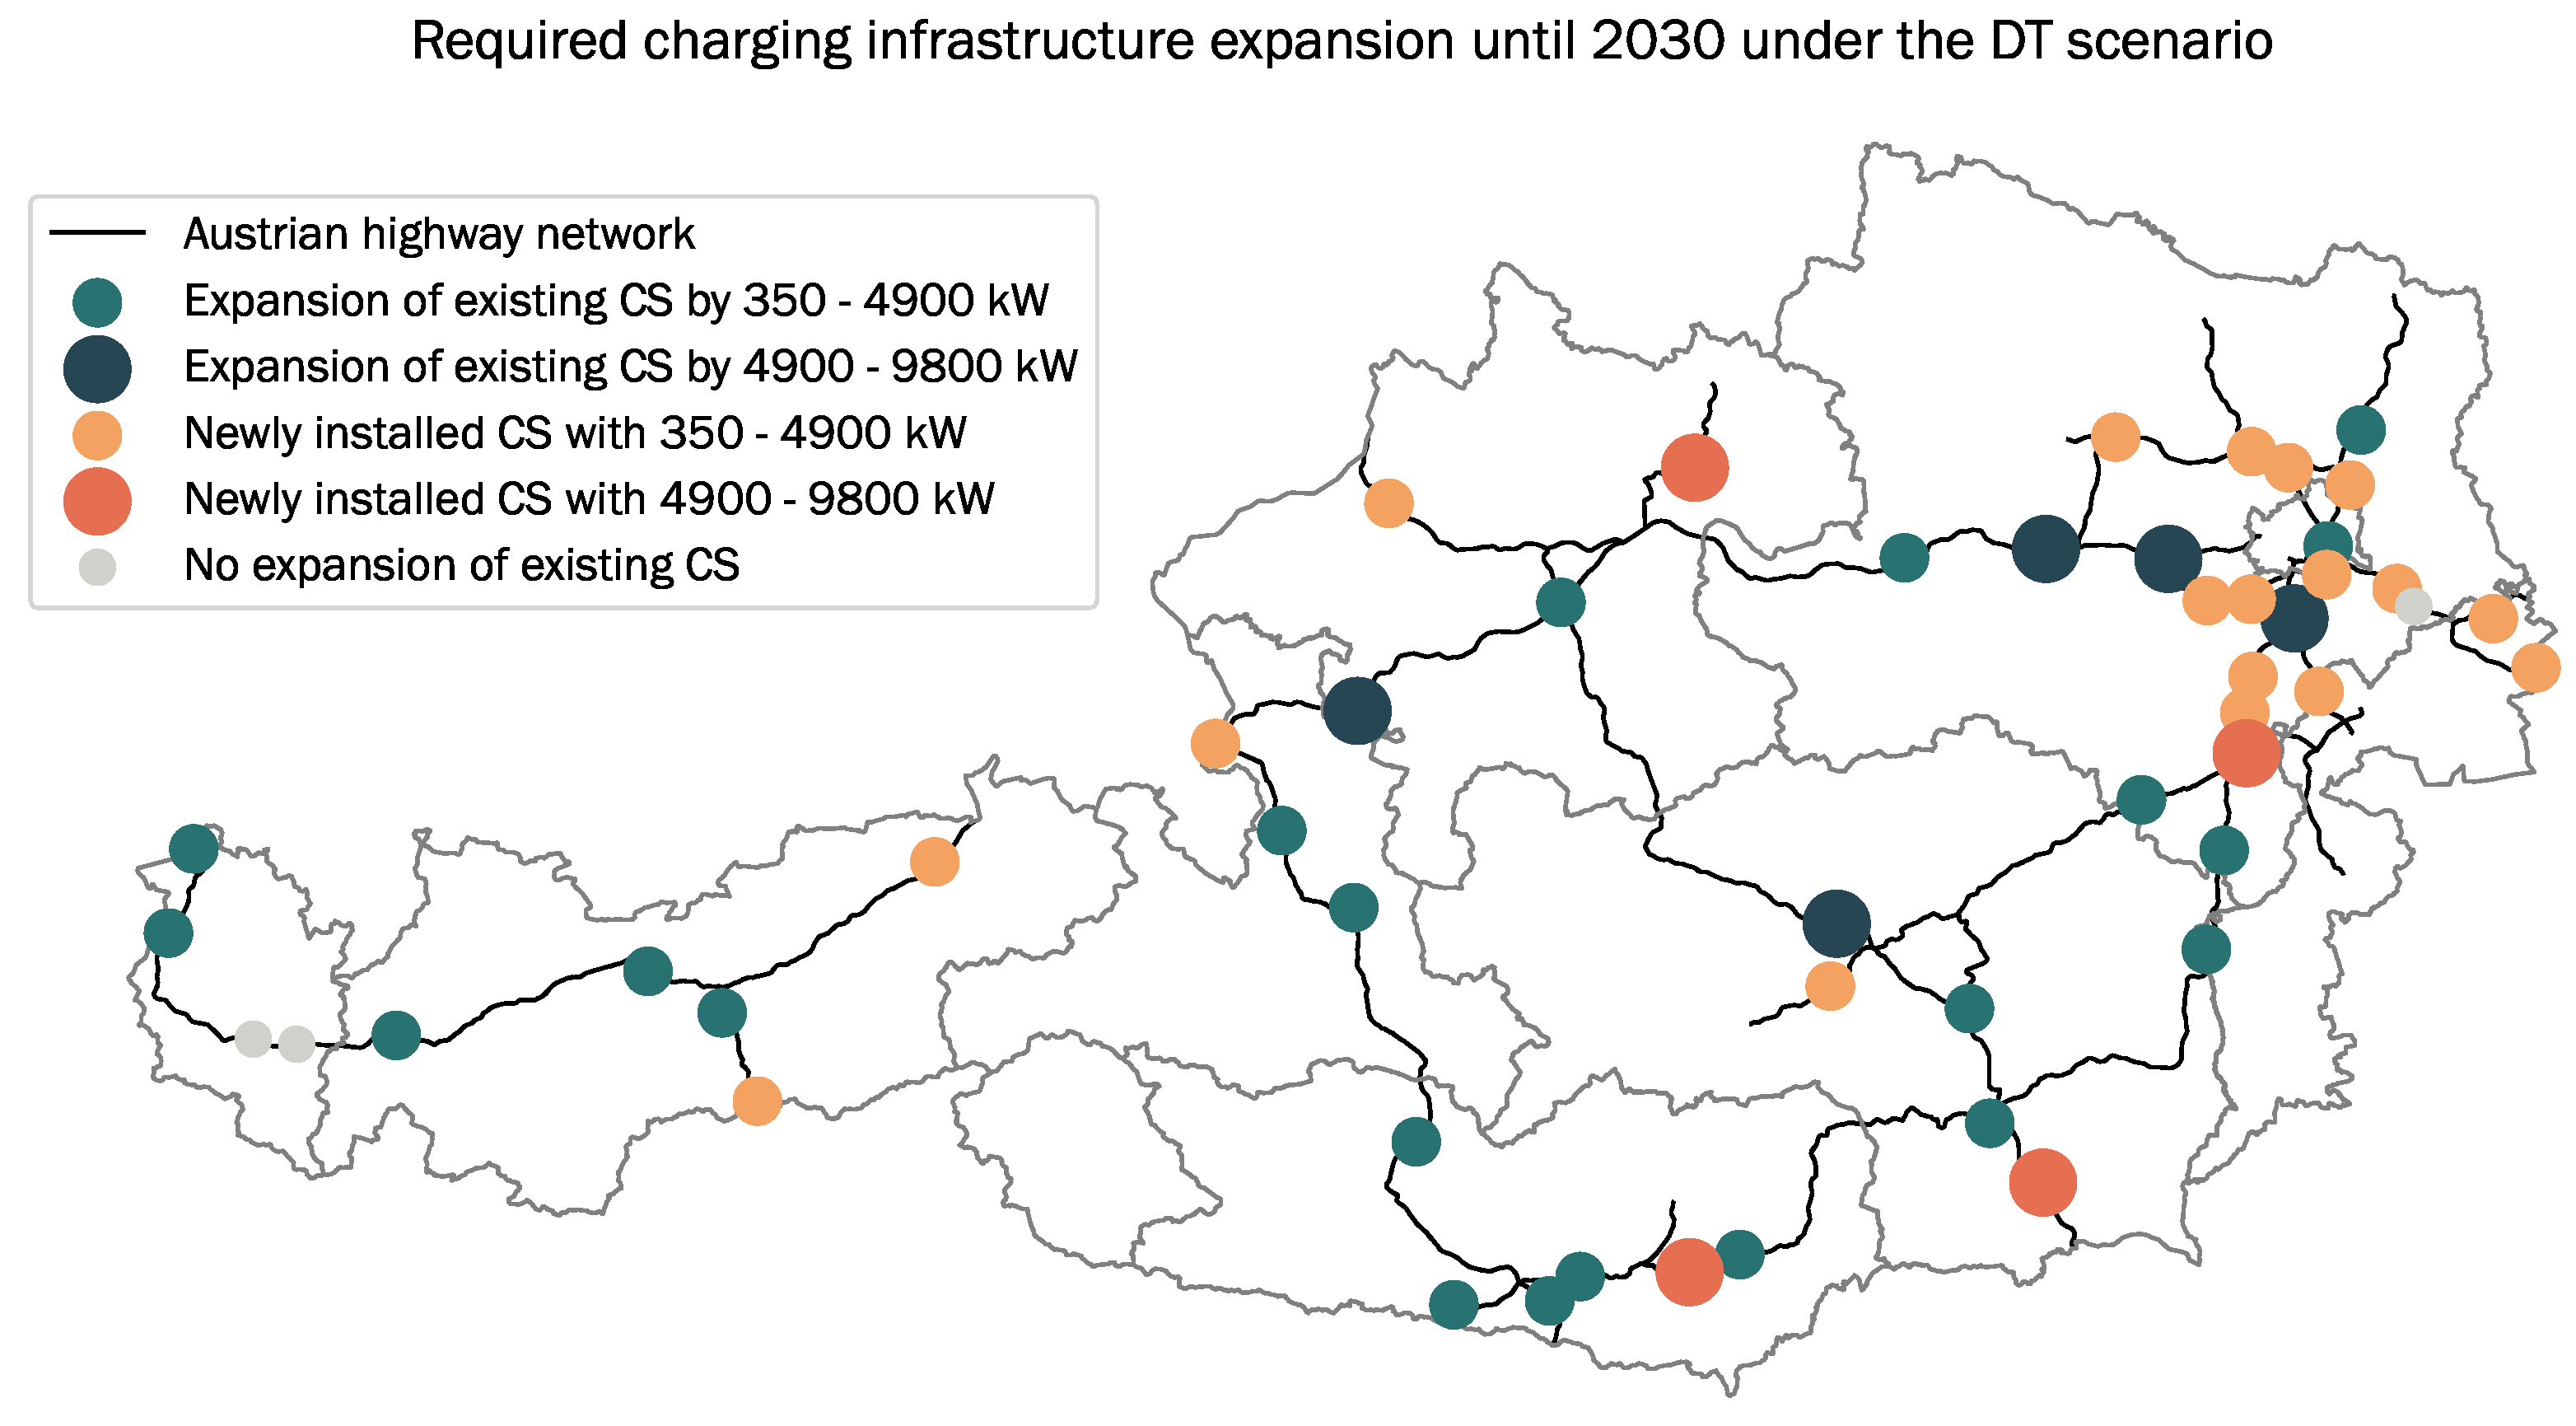
4.1.1. Austria’s Fast-Charging Infrastructure for 2030 under the Directed Transition Scenario
4.1.2. Comparison of the Results from Different Future Scenarios
- The expansion under the DT scenario, for which the input parameters were set based on the assumption of a strong presence of political incentives pushing technological developments, results in the lowest costs of charging infrastructure expansion (EUR 54 M).
- There is a relative difference of up to between the scenario causing the minimum expansion costs (DT) and the highest costs arising in the GD scenario, within which weaker climate change mitigation measures are assumed.
- The number of charging stations remains in a similar range for all scenarios, varying between 54 and 57. The specific infrastructure expansion costs per kW remain also very stable at around 368 EUR/kW.
- The specific costs per BEV range between 39 and 72 and are the lowest in the TF and DT scenarios. The common trait of these two scenarios is the presence of technological breakthroughs leading to higher driving ranges and charging capacity of BEVs.
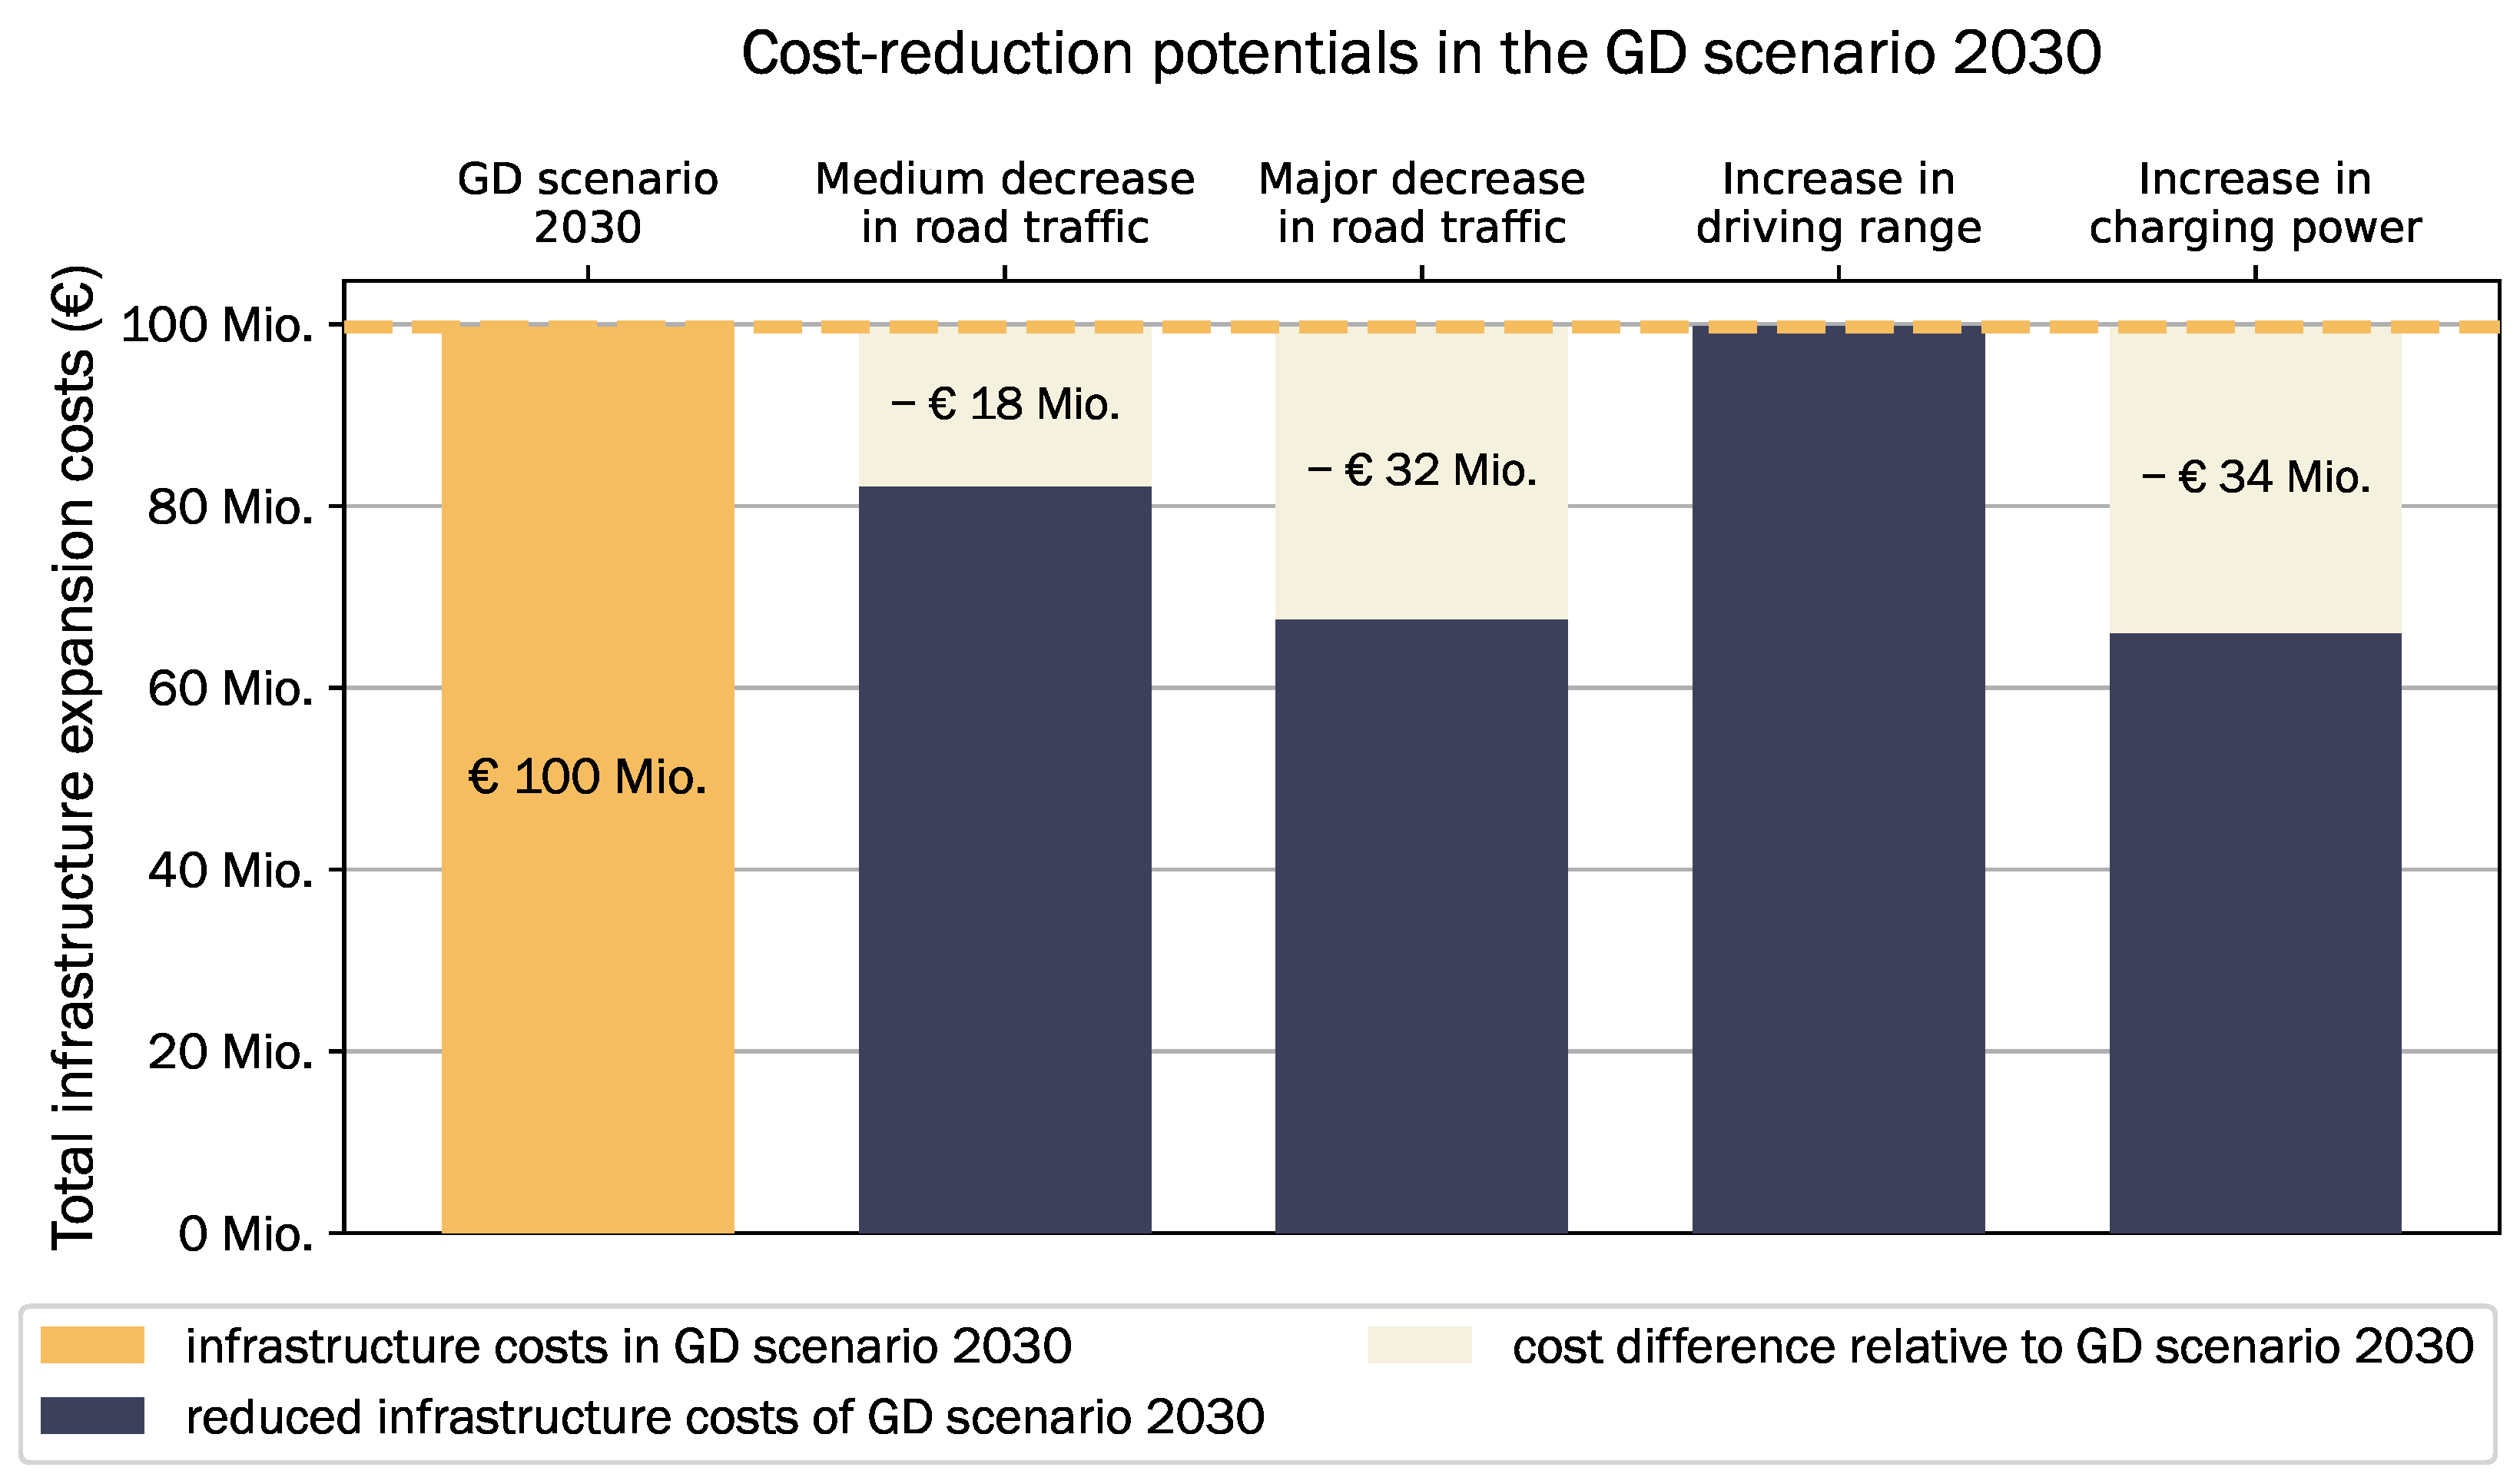
4.1.3. Cost-Reduction Potentials in the Gradual Development Scenario
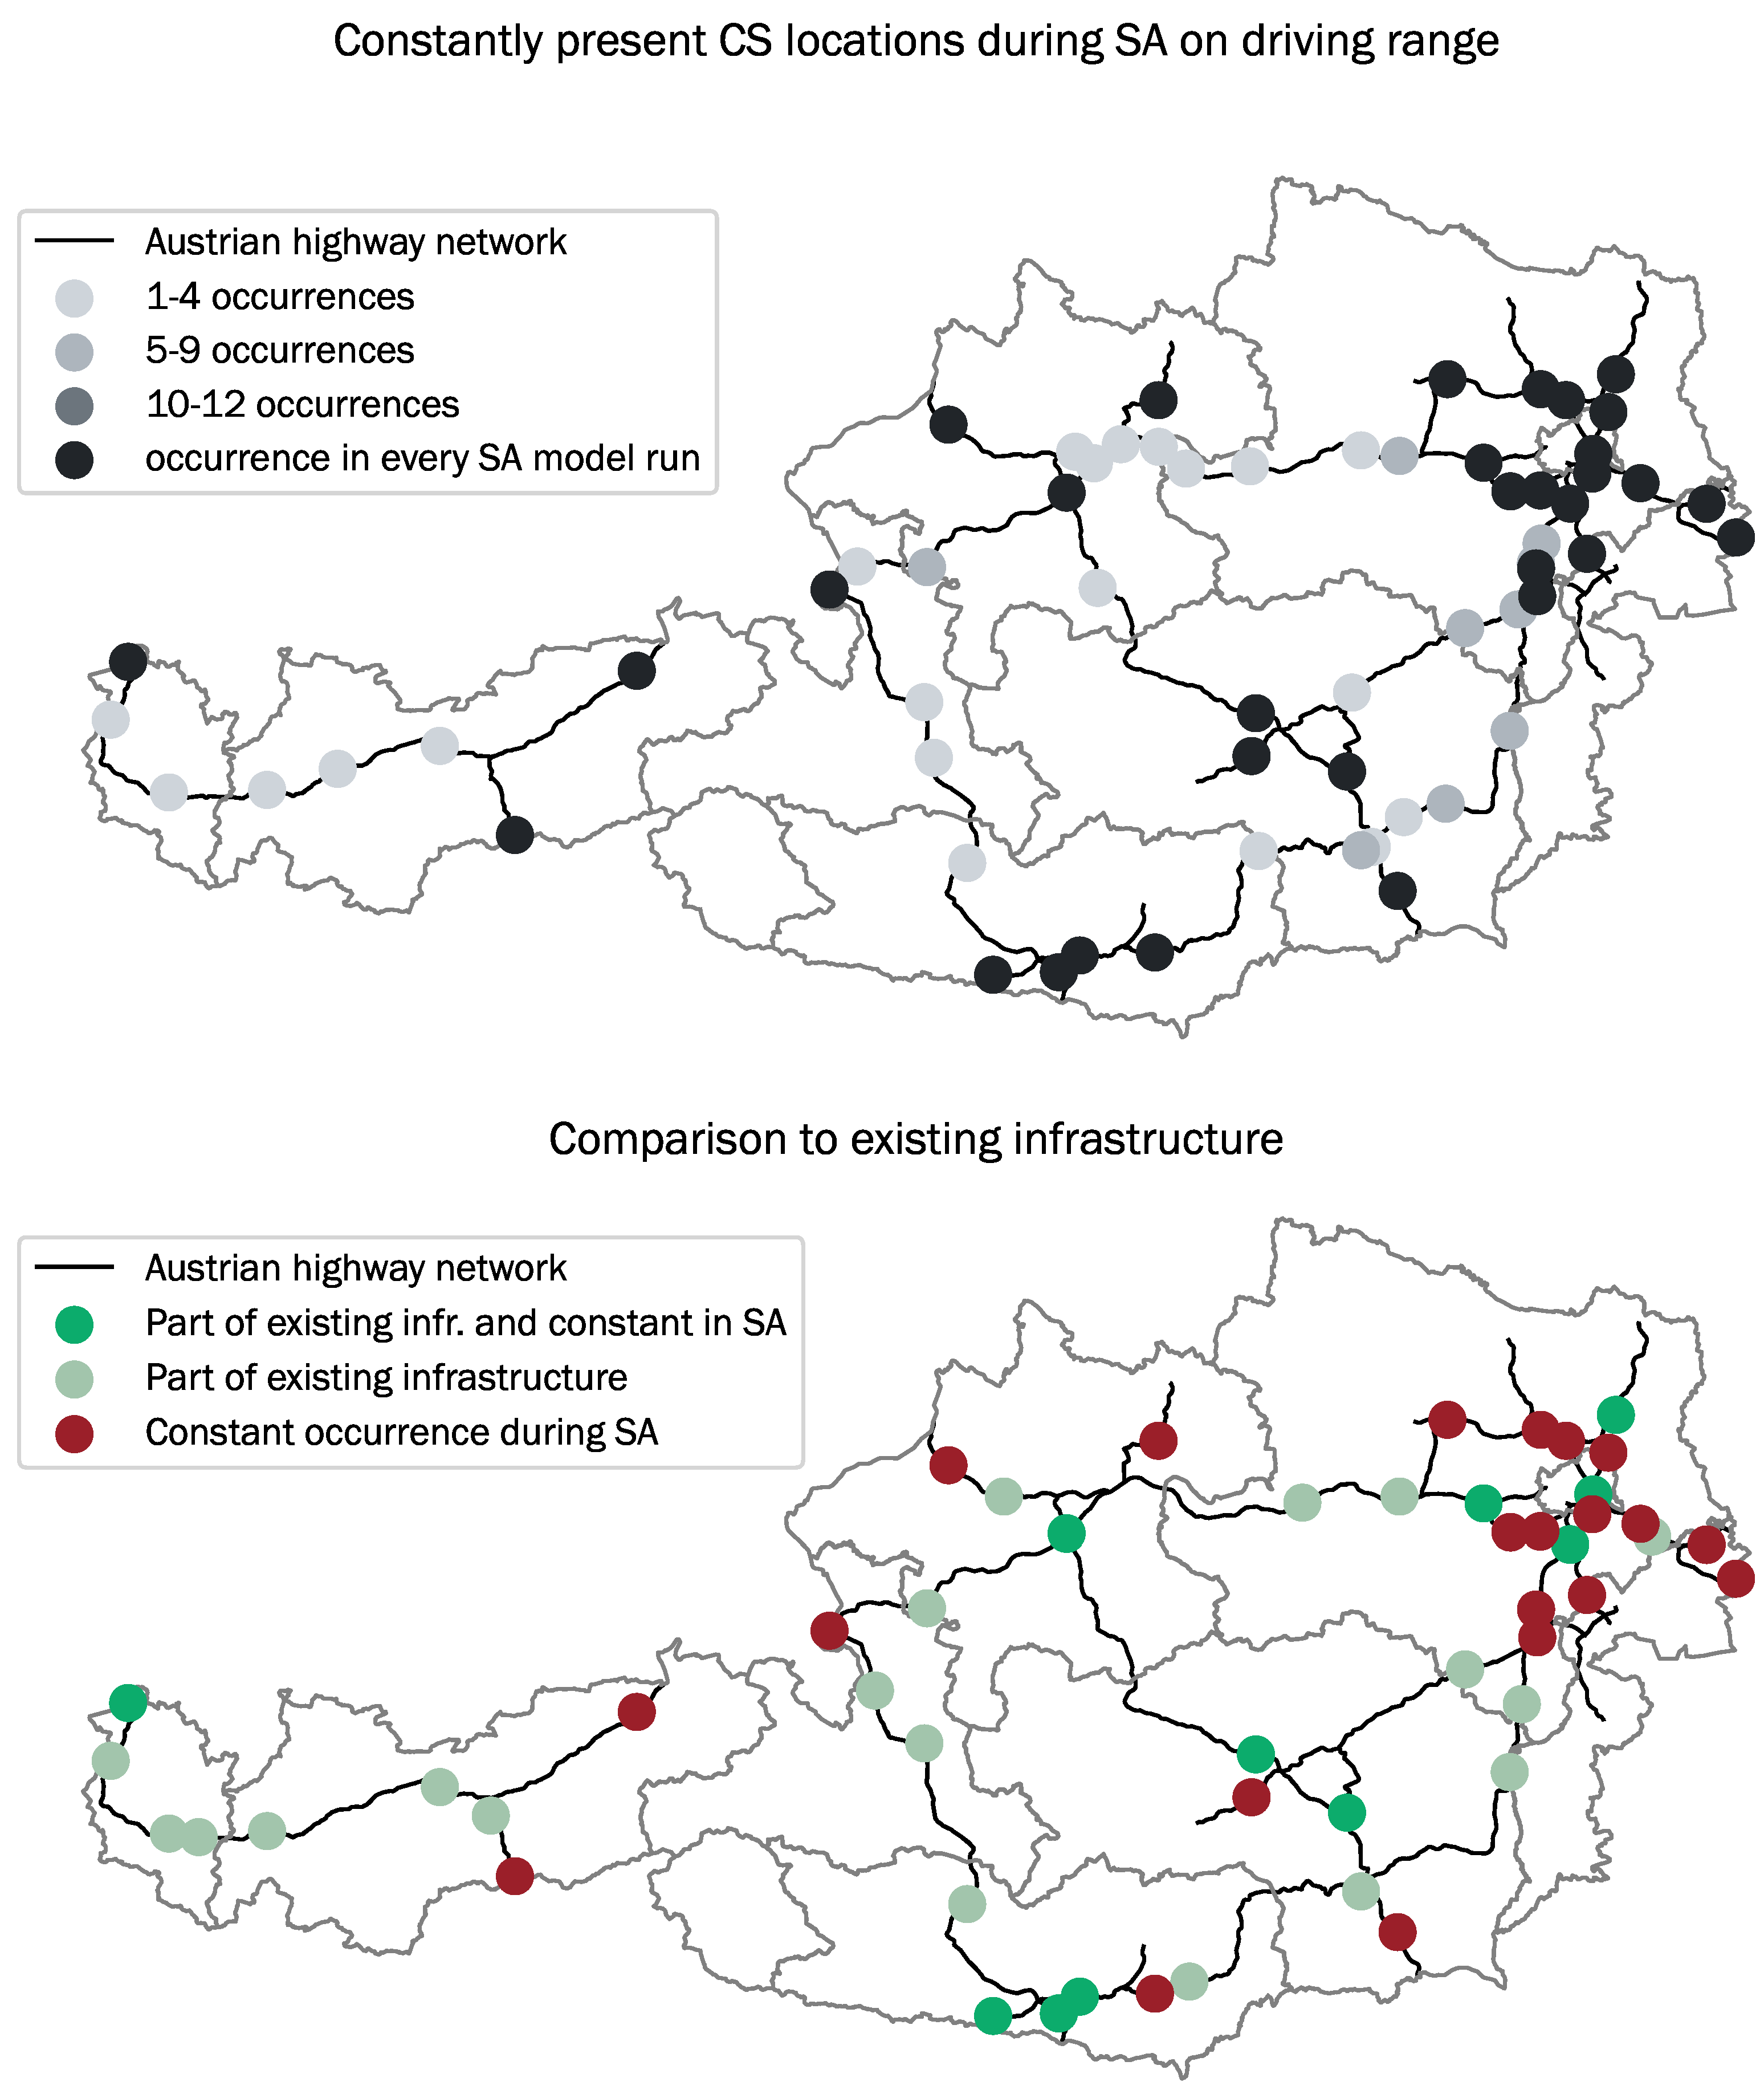
4.2. Sensitivity Analyses on the Requirements for Fast-Charging Infrastructure
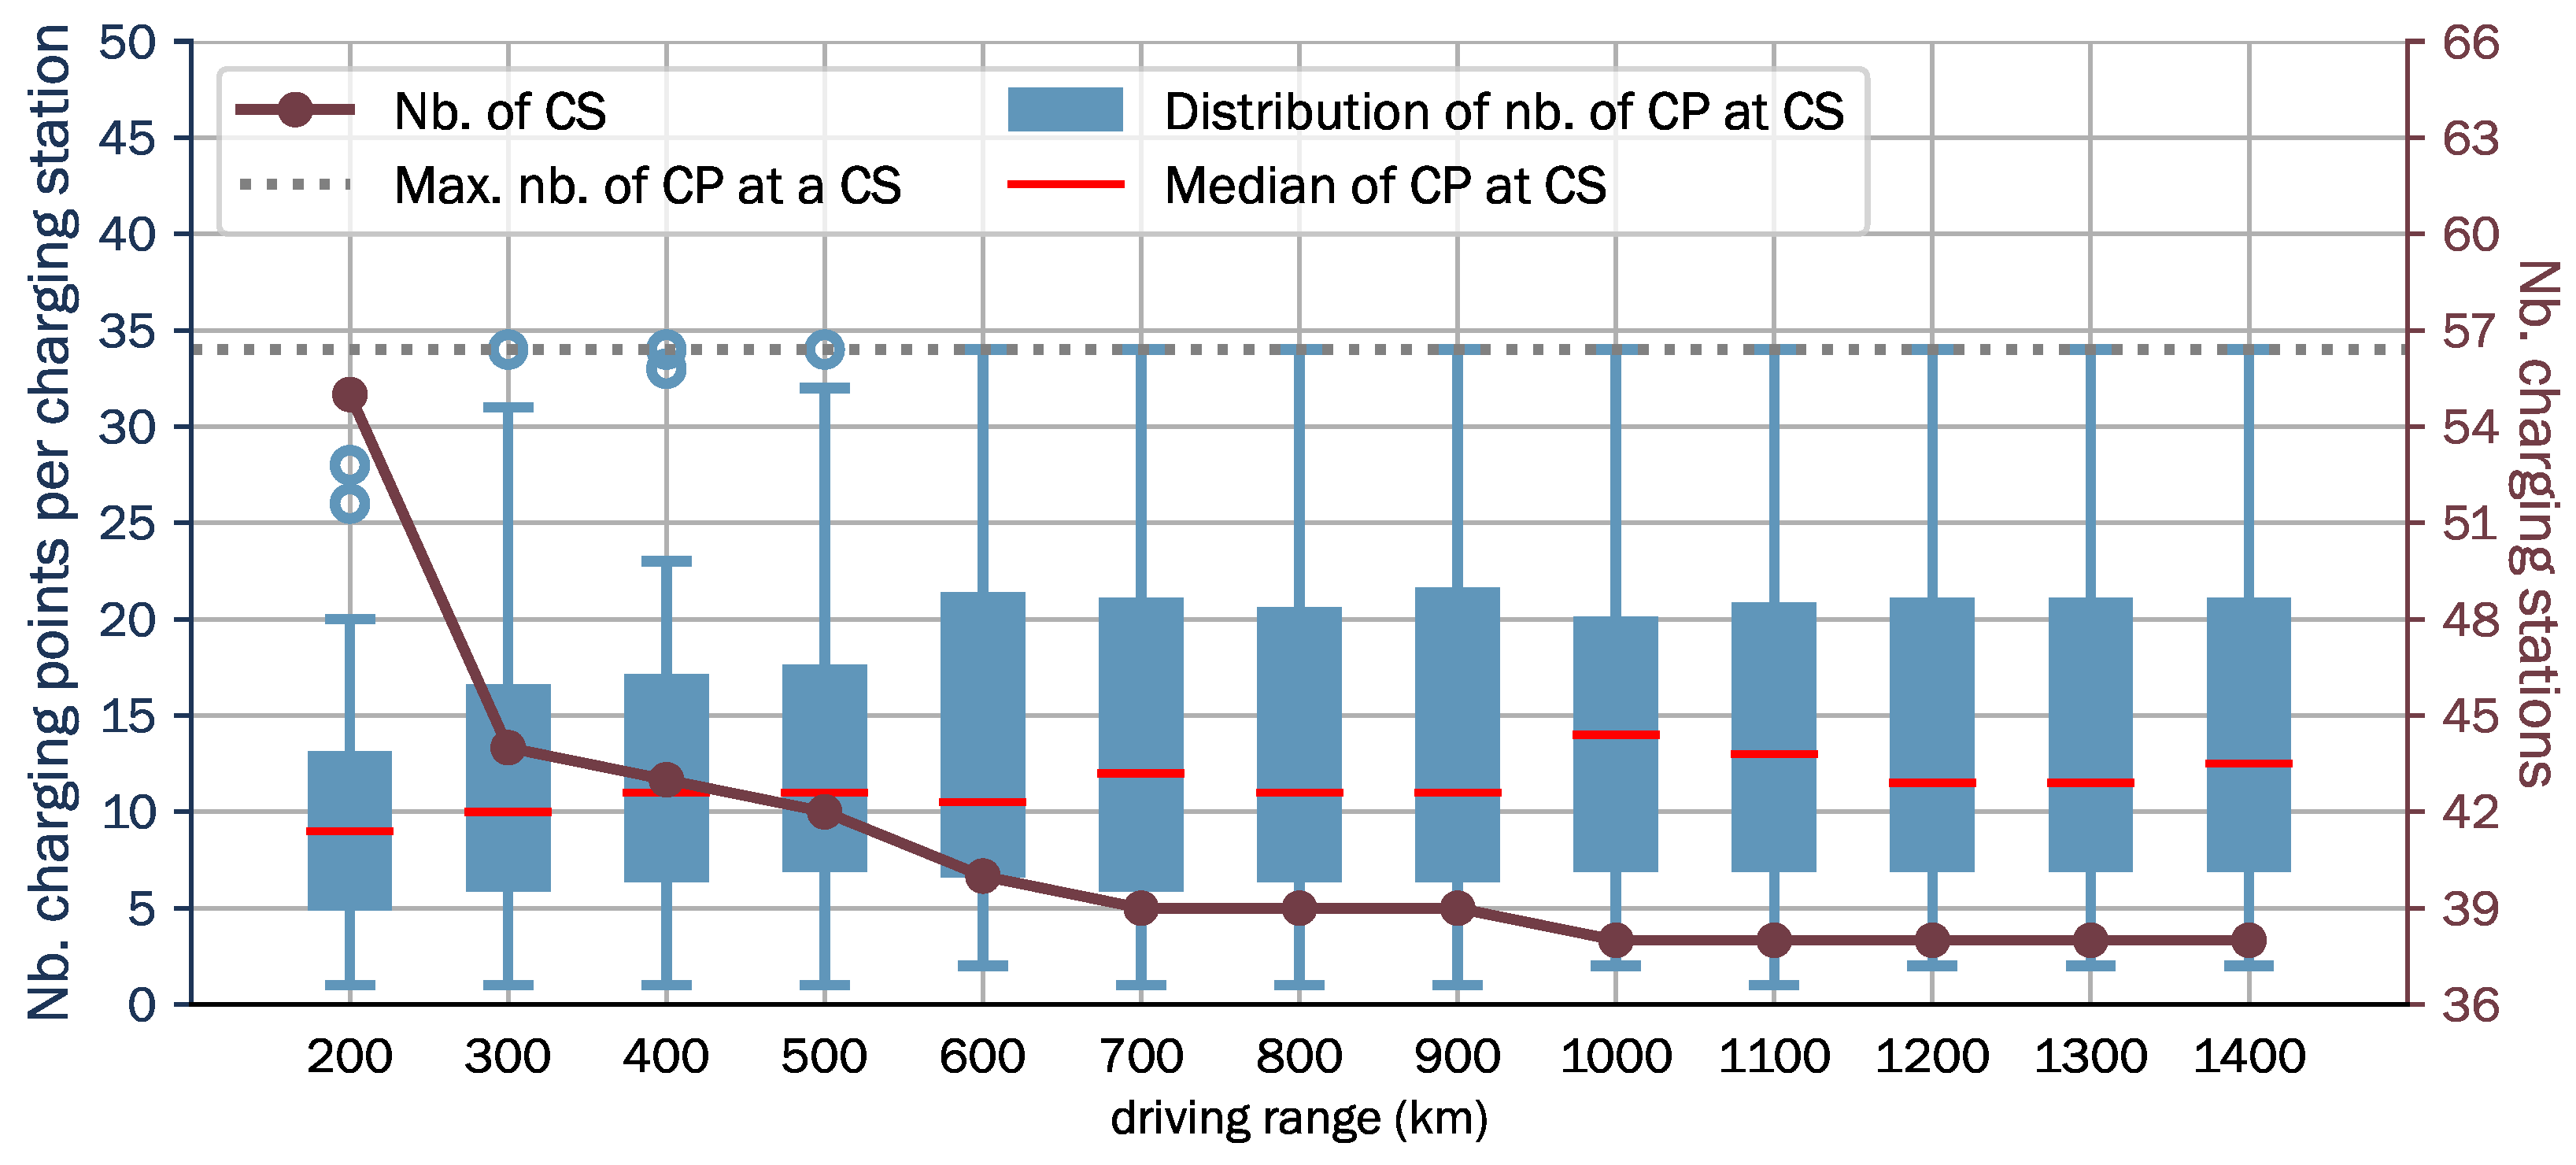
4.2.1. Increasing Driving Range in the Techno-Friendly Scenario
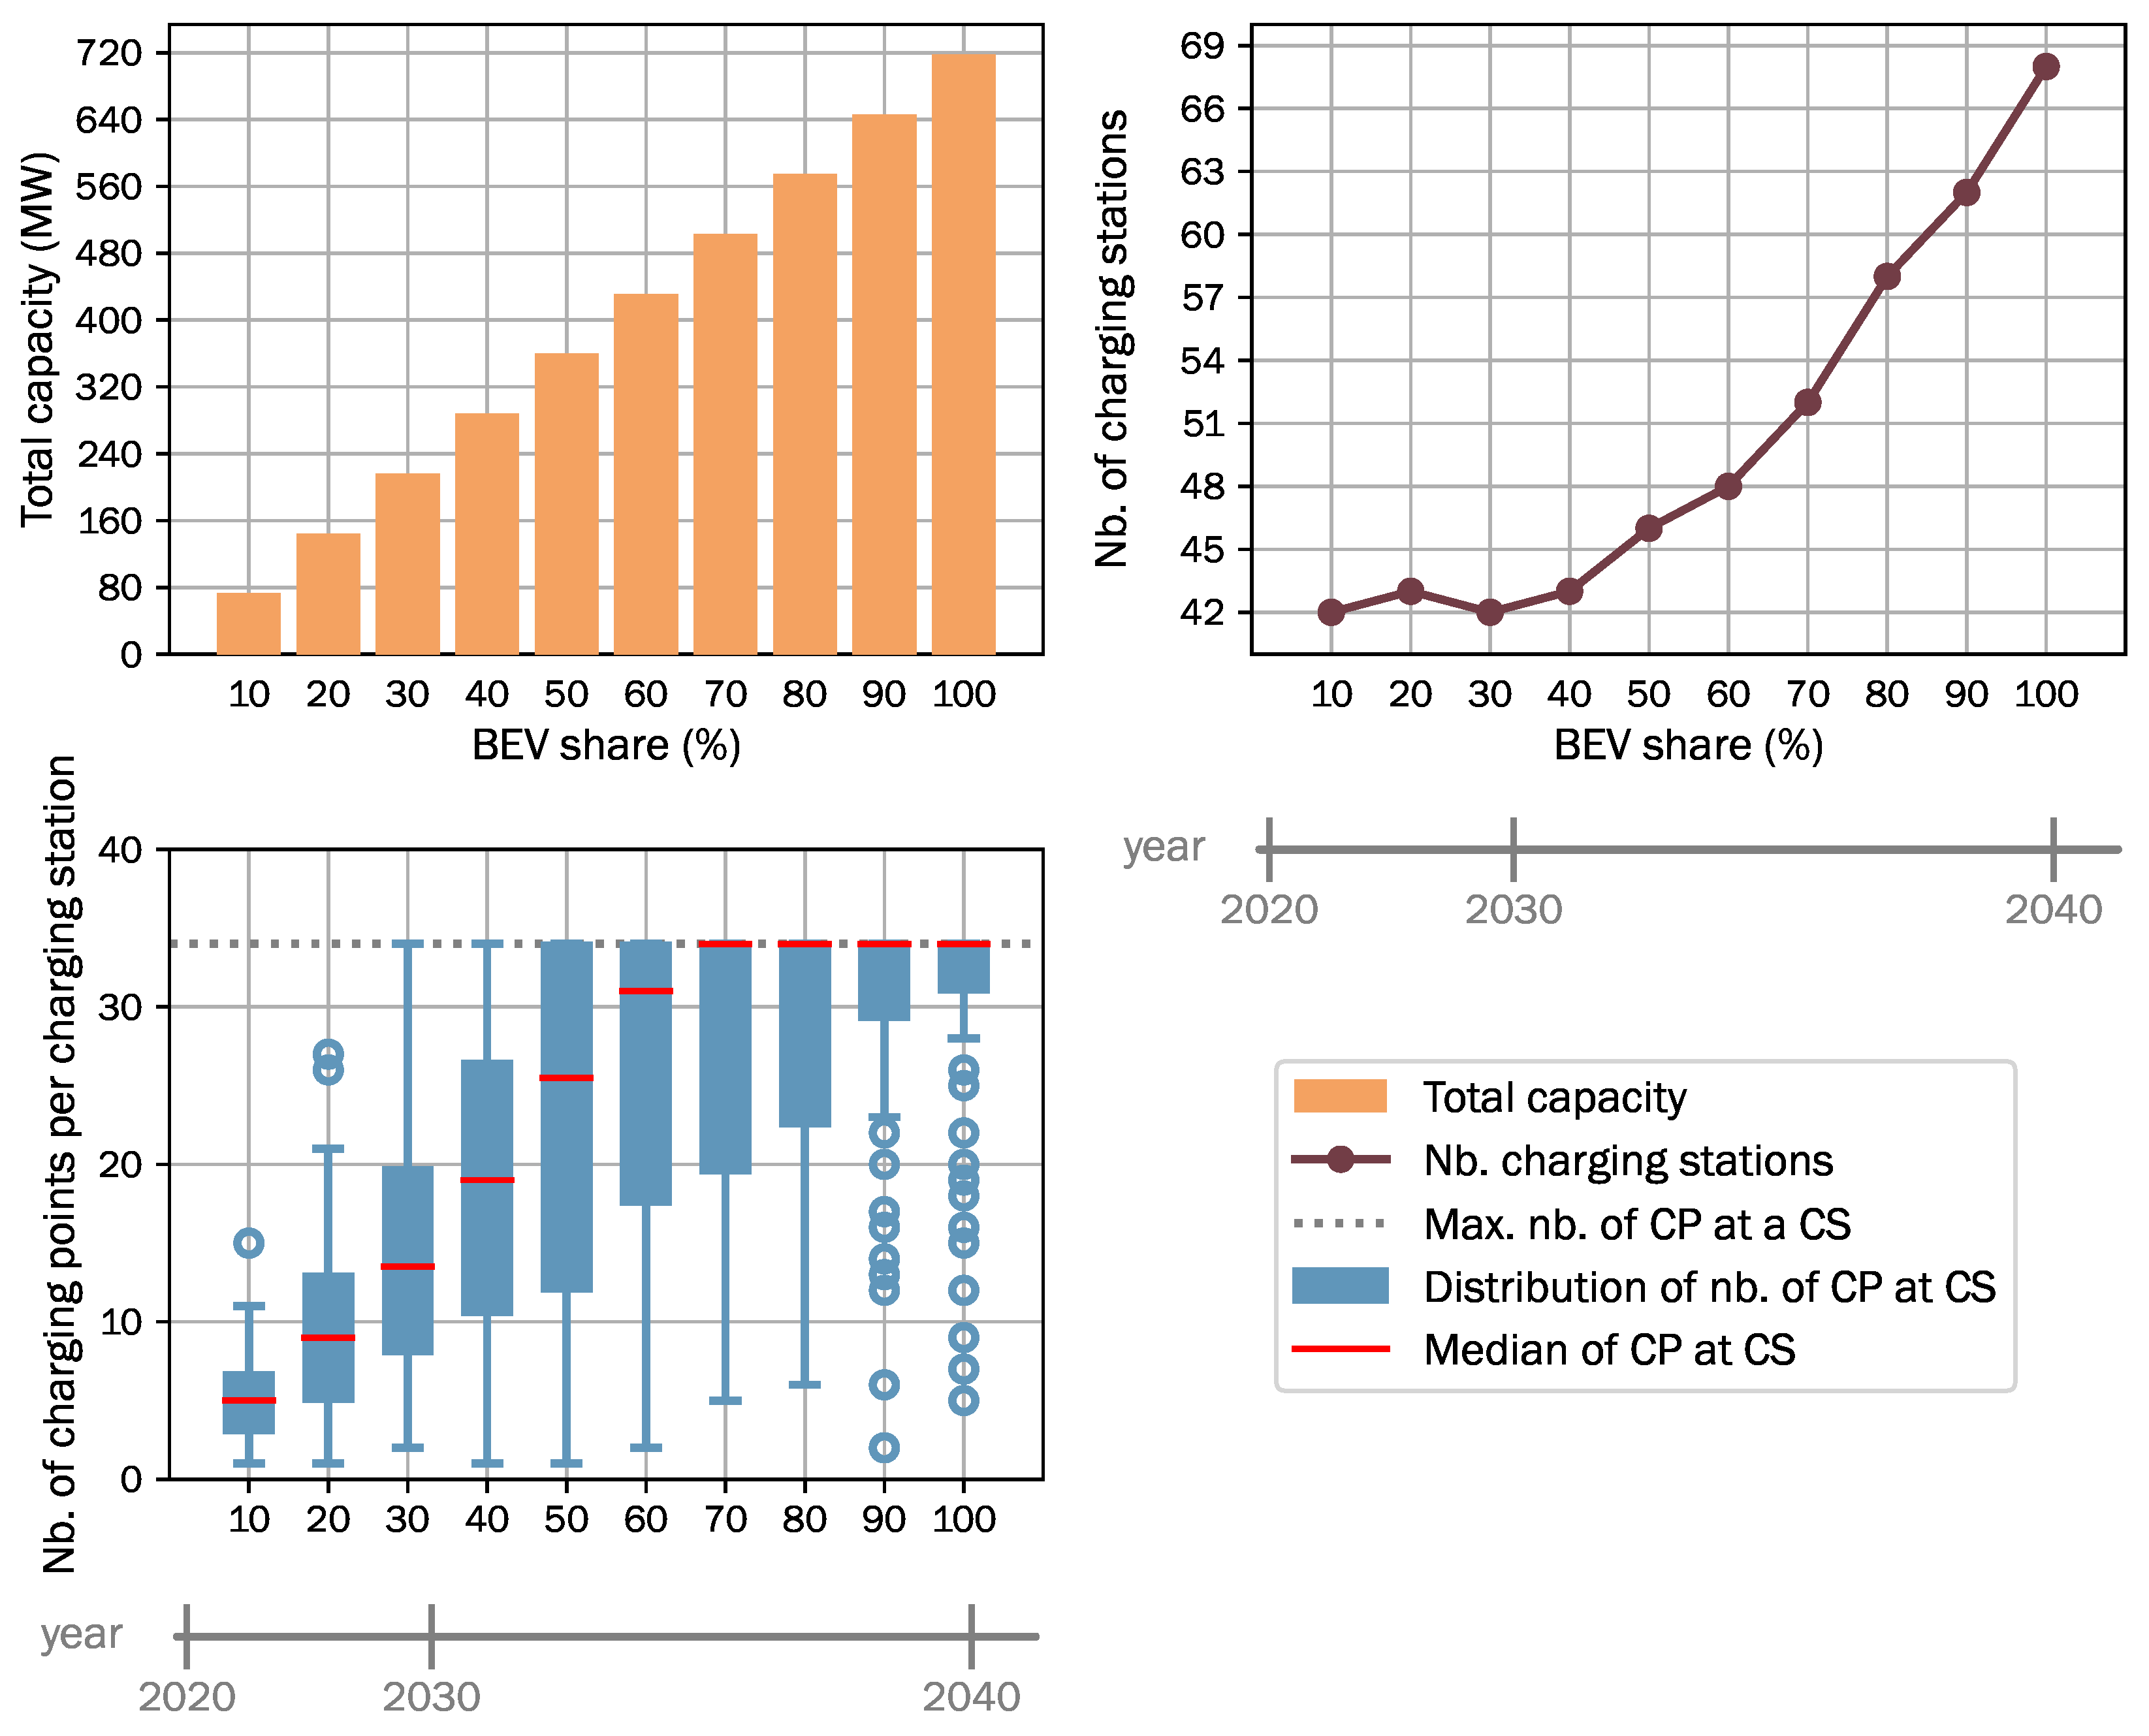
4.2.2. Increasing Share of BEVs in the Societal Commitment Scenario
5. Conclusions
Author Contributions
Funding
Institutional Review Board Statement
Informed Consent Statement
Data Availability Statement
Acknowledgments
Conflicts of Interest
Appendix A. Supplementary Details on Methodology and Materials
Appendix A.1. Determination of Average Technological Parameters for BEVs

| Car Model | Sales 2019 | Sales 2020 | Sales 2021 | (km) | at kW (kW) | Highway-Cold Weather (kWh/km) |
|---|---|---|---|---|---|---|
| Tesla Model 3 | 2342 | 2892 | 3304 | 380 | 110 | 0.23 |
| Renault Zoe | 944 | 2071 | 1778 | 310 | 41 | 0.22 |
| Kia Niro | 1125 | 421 | 924 | 370 | 77 | 0.24 |
| Hyundai Kona | 897 | 861 | - | 395 | 64 | 0.28 |
| Audi e-Tron | 364 | 782 | 1192 | 285 | 114 | 0.29 |
| BMW i3 | 1191 | 697 | - | 235 | 47 | 0.23 |
| VW e-Golf | 805 | 401 | - | 190 | 39 | 0.24 |
| VW Up! | - | 376 | - | 205 | 30 | 0.22 |
| Mazda MX-30 | - | 370 | - | 170 | 34 | 0.25 |
| Peugeot 208 | - | 355 | - | 285 | 78 | 0.23 |
| Hyundai Ioniq | 361 | - | - | 250 | 36 | 0.22 |
| Nissan Leaf | 557 | - | - | 225 | 40 | 0.23 |
| Tesla Model S | 389 | - | - | 560 | 110 | 0.23 |
| VW ID.3 | - | - | 2361 | 350 | 85 | 0.23 |
| VW ID.4 | - | - | 2361 | 400 | 103 | 0.27 |
| Skoda Enyaq | - | - | 2208 | 420 | 103 | 0.26 |
| Fiat 500 | - | - | 1356 | 235 | 67 | 0.23 |
| Seat Mii | - | - | 936 | 205 | 30 | 0.22 |
| Tesla Model Y | - | - | 921 | 435 | 108 | 0.24 |
| Weighted average values | 340 | 81 | 0.24 |
Appendix A.2. Details on the Projected Developments for 2030 under Different Scenarios

Appendix A.3. Details on Preparation for the Austrian Case Study
References
- IEA. Global EV Outlook 2020. 2020. Available online: https://www.iea.org/reports/global-ev-outlook-2020 (accessed on 20 February 2022).
- Moriarty, P.; Honnery, D. Low-mobility: The future of transport. Futures 2008, 40, 865–872. [Google Scholar] [CrossRef]
- Malmgren, I. Quantifying the Societal Benefits of Electric Vehicles. World Electr. Veh. J. 2016, 8, 996–1007. [Google Scholar] [CrossRef] [Green Version]
- Spöttle, M.; Jörling, K.; Schimmel, M.; Staats, M.; Grizzel, L.; Jerram, L.; Drier, W.; Gartner, J. Research for TRAN Committee-Charging Infrastructure for Electric Road Vehicles; European Parliament: Strasbourg, France, 2018. [Google Scholar]
- Norwegen—Verteilung der Antriebsarten. Available online: https://de.statista.com/statistik/daten/studie/695029/umfrage/marktanteil-von-elektrofahrzeugen-in-norwegen/ (accessed on 10 February 2022).
- United Nations Framework Convention on Climate Change. Paris Declaration on Electro-Mobility and Climate Change and Call to Action; United Nations: New York, NY, USA, 2015. [Google Scholar]
- BEO. E-Mobilität in Zahlen. 2022. Available online: https://www.beoe.at/statistik/ (accessed on 27 January 2022).
- BMK. Mobilitätsmasterplan 2030 Neuausrichtung des Mobilitätssektors. 2018. Available online: https://www.bmk.gv.at/themen/mobilitaet/mobilitaetsmasterplan/mmp2030.html (accessed on 14 February 2022).
- Coffman, M.; Bernstein, P.; Wee, S. Electric vehicles revisited: A review of factors that affect adoption. Transp. Rev. 2017, 37, 79–93. [Google Scholar] [CrossRef]
- Biresselioglu, M.E.; Demirbag Kaplan, M.; Yilmaz, B.K. Electric mobility in Europe: A comprehensive review of motivators and barriers in decision making processes. Transp. Res. Part A Policy Pract. 2018, 109, 1–13. [Google Scholar] [CrossRef]
- IRENA. Innovation Outlook: Smart Charging for Electric Vehicles; International Renewable Energy Agency: Abu Dhabi, United Arab Emirates, 2019. [Google Scholar]
- Thielmann, D.A.; Neef, D.C.; Hettesheimer, D.T.; Döscher, D.H.; Wietschel, D.M.; Tübke, D.J. Energiespeicher-Roadmap (Update 2017): Hochenergie-Batterien 2030+ und Perspektiven Zukünftiger Batterietechnologien; Fraunhofer ISI: Karlsruhe, Germany, 2017; p. 120. [Google Scholar]
- Neaimeh, M.; Salisbury, S.D.; Hill, G.A.; Blythe, P.T.; Scoffield, D.R.; Francfort, J.E. Analysing the usage and evidencing the importance of fast chargers for the adoption of battery electric vehicles. Energy Policy 2017, 108, 474–486. [Google Scholar] [CrossRef]
- European Parliament. Deployment of Alternative Fuels Infrastructure: Fit for 55 Package. 2021. Available online: https://www.europarl.europa.eu/RegData/etudes/BRIE/2021/698795/EPRS_BRI(2021)698795_EN.pdf (accessed on 20 February 2022).
- Sims, R.; Schaeffer, R.; Cruz-Núñez, X.; D’Agosto, M.; Dimitriu, D.; Figueroa Meza, M.J.; Fulton, L.; Kobayashi, S.; Lah, O.; McKinnon, A.; et al. Transport. In Climate Change 2014: Mitigation of Climate Change. Contribution of Working Group III to the Fifth Assessment Report of the Intergovernmental Panel on Climate Change; Cambridge University Press: New York, NY, USA, 2014. [Google Scholar]
- Edelenbosch, O.Y.; McCollum, D.L.; van Vuuren, D.P.; Bertram, C.; Carrara, S.; Daly, H.; Fujimori, S.; Kitous, A.; Kyle, P.; Ó Broin, E.; et al. Decomposing passenger transport futures: Comparing results of global integrated assessment models. Transp. Res. Part D Transp. Environ. 2017, 55, 281–293. [Google Scholar] [CrossRef] [Green Version]
- Milovanoff, A.; Balasubramanian, R.; Minet, L.; Cheah, L.; Posen, I.D.; MacLean, H.L. Greenhouse gas emission mitigation pathways for urban passenger land transport under ambitious climate targets. Environ. Sci. Technol. 2021, 55, 8236–8246. [Google Scholar] [CrossRef]
- Müller, M.; Reutter, P.O. Course change: Navigating urban passenger transport toward sustainability through modal shift. Int. J. Sustain. Transp. 2021, 1–25. [Google Scholar] [CrossRef]
- Priemus, H.; Nijkamp, P.; Banister, D. Mobility and spatial dynamics: An uneasy relationship. J. Transp. Geogr. 2001, 9, 167–171. [Google Scholar] [CrossRef]
- Briggs, M.; Webb, J.; Wilson, C. Automotive Modal Lock-in: The role of path dependence and large socio-economic regimes in market failure. Econ. Anal. Policy 2015, 45, 58–68. [Google Scholar] [CrossRef]
- Unruh, G.C. Understanding carbon lock-in. Energy Policy 2000, 28, 817–830. [Google Scholar] [CrossRef]
- Song, Y.; Preston, J.; Ogilvie, D. New walking and cycling infrastructure and modal shift in the UK: A quasi-experimental panel study. Transp. Res. Part A Policy Pract. 2017, 95, 320–333. [Google Scholar] [CrossRef] [PubMed]
- Hammadou, H.; Papaix, C. Policy packages for modal shift and CO2 reduction in Lille, France. Transp. Res. Part D Transp. Environ. 2015, 38, 105–116. [Google Scholar] [CrossRef]
- Da Silva, T.B.; Baptista, P.; Santos Silva, C.A.; Santos, L. Assessment of decarbonization alternatives for passenger transportation in Rio de Janeiro, Brazil. Transp. Res. Part D Transp. Environ. 2022, 103, 103161. [Google Scholar] [CrossRef]
- Heidrich, O.; Hill, G.A.; Neaimeh, M.; Huebner, Y.; Blythe, P.T.; Dawson, R.J. How do cities support electric vehicles and what difference does it make? Technol. Forecast. Soc. Chang. 2017, 123, 17–23. [Google Scholar] [CrossRef]
- Das, H.S.; Rahman, M.M.; Li, S.; Tan, C.W. Electric vehicles standards, charging infrastructure, and impact on grid integration: A technological review. Renew. Sustain. Energy Rev. 2020, 120, 109618. [Google Scholar] [CrossRef]
- Van Vliet, O.; Brouwer, A.S.; Kuramochi, T.; Van Den Broek, M.; Faaij, A. Energy use, cost and CO2 emissions of electric cars. J. Power Sources 2011, 196, 2298–2310. [Google Scholar] [CrossRef] [Green Version]
- Bauer, C.; Hofer, J.; Althaus, H.J.; Del Duce, A.; Simons, A. The environmental performance of current and future passenger vehicles: Life Cycle Assessment based on a novel scenario analysis framework. Appl. Energy 2015, 157, 871–883. [Google Scholar] [CrossRef]
- Ajanovic, A. The future of electric vehicles: Prospects and impediments. Wiley Interdiscip. Rev. Energy Environ. 2015, 4, 521–536. [Google Scholar] [CrossRef]
- Costa, L.; Moreau, V.; Thurm, B.; Yu, W.; Clora, F.; Baudry, G.; Warmuth, H.; Hezel, B.; Seydewitz, T.; Ranković, A.; et al. The decarbonisation of Europe powered by lifestyle changes. Environ. Res. Lett. 2021, 16, 044057. [Google Scholar] [CrossRef]
- Dillman, K.; Czepkiewicz, M.; Heinonen, J.; Fazeli, R.; Árnadóttir, Á.; Davíðsdóttir, B.; Shafiei, E. Decarbonization scenarios for Reykjavik’s passenger transport: The combined effects of behavioural changes and technological developments. Sustain. Cities Soc. 2021, 65, 102614. [Google Scholar] [CrossRef]
- Falvo, M.C.; Sbordone, D.; Bayram, I.S.; Devetsikiotis, M. EV charging stations and modes: International standards. In Proceedings of the 2014 International Symposium on Power Electronics, Electrical Drives, Automation and Motion, SPEEDAM 2014, Ischia, Italy, 18–20 June 2014; pp. 1134–1139. [Google Scholar] [CrossRef]
- Kotzur, L.; Nolting, L.; Hoffmann, M.; Groß, T.; Smolenko, A.; Priesmann, J.; Büsing, H.; Beer, R.; Kullmann, F.; Singh, B.; et al. A modeler’s guide to handle complexity in energy systems optimization. Adv. Appl. Energy 2021, 4, 100063. [Google Scholar] [CrossRef]
- Schulz, F.; Rode, J. Public charging infrastructure and electric vehicles in Norway. Energy Policy 2022, 160, 112660. [Google Scholar] [CrossRef]
- Árpád, S.; Sprei, F.; Gnann, T.; Plötz, P. How much charging infrastructure do electric vehicles need ? A review of the evidence and international comparison. Transp. Res. Part D Transp. Environ. 2019, 77, 224–242. [Google Scholar] [CrossRef]
- Illmann, U.; Kluge, J. Public charging infrastructure and the market diffusion of electric vehicles. Transp. Res. Part D Transp. Environ. 2020, 86, 102413. [Google Scholar] [CrossRef]
- Neubauer, J.; Wood, E. The impact of range anxiety and home, workplace, and public charging infrastructure on simulated battery electric vehicle lifetime utility. J. Power Sources 2014, 257, 12–20. [Google Scholar] [CrossRef]
- Engel, H.; Hensley, R.; Knupfer, S.; Sahdev, S. Charging Ahead: Electric-Vehicle Infrastructure; McKinsey & Company: Chicago, IL, USA, 2018; pp. 1–8. [Google Scholar]
- Globisch, J.; Plötz, P.; Dütschke, E.; Wietschel, M. Consumer preferences for public charging infrastructure for electric vehicles. Transp. Policy 2019, 81, 54–63. [Google Scholar] [CrossRef]
- Gebauer, F.; Vilimek, R.; Keinath, A.; Carbon, C.c. Technological Forecasting & Social Change Changing attitudes towards e-mobility by actively elaborating fast-charging technology. Technol. Forecast. Soc. Chang. 2016, 106, 31–36. [Google Scholar] [CrossRef]
- Philipsen, R.; Schmidt, T.; Heek, J.V.; Ziefle, M. Fast-charging station here, please! User criteria for electric vehicle fast-charging locations. Transp. Res. Part F Psychol. Behav. 2020, 40, 119–129. [Google Scholar] [CrossRef]
- Das Deutschlandnetz: Konzept der Ausschreibung von 1000 Schnellladestandorten auf Grundlage des Schnellladegesetzes. 2021. Available online: https://www.bmvi.de (accessed on 20 February 2022).
- Markkula, J.; Rautiainen, A.; Järventausta, P. The business case of electric vehicle quick charging—No more chicken or egg problem. In Proceedings of the 2013 World Electric Vehicle Symposium and Exhibition (EVS27), Barcelona, Spain, 17–20 November 2013; pp. 1–7. [Google Scholar] [CrossRef]
- Fernández, G.; Torres, J.; Cervero, D.; García, E.; Alonso, M.Á.; Almajano, J.; Machín, S.; Bludszuweit, H.; Sanz, J.F. EV charging infrastructure in a petrol station, lessons learned. In Proceedings of the 2018 International Symposium on Industrial Electronics, INDEL 2018—Proceedings, Banja Luka, Bosnia and Herzegovina, 1–3 November 2019. [Google Scholar] [CrossRef]
- Serradilla, J.; Wardle, J.; Blythe, P.; Gibbon, J. An evidence-based approach for investment in rapid-charging infrastructure. Energy Policy 2017, 106, 514–524. [Google Scholar] [CrossRef]
- Gusrialdi, A.; Qu, Z.; Simaan, M.A. Distributed Scheduling and Cooperative Control for Charging of Electric Vehicles at Highway Service Stations. IEEE Trans. Intell. Transp. Syst. 2017, 18, 2713–2727. [Google Scholar] [CrossRef]
- Chen, L.; Huang, X.; Chen, Z.; Jin, L. Study of a new quick-charging strategy for electric vehicles in highway charging stations. Energies 2016, 9, 744. [Google Scholar] [CrossRef] [Green Version]
- Dong, X.; Mu, Y.; Xu, X.; Jia, H.; Wu, J.; Yu, X.; Qi, Y. A charging pricing strategy of electric vehicle fast charging stations for the voltage control of electricity distribution networks. Appl. Energy 2018, 225, 857–868. [Google Scholar] [CrossRef]
- Jochem, P.; Szimba, E.; Reuter-Oppermann, M. How many fast-charging stations do we need along European highways? Transp. Res. Part D Transp. Environ. 2019, 73, 120–129. [Google Scholar] [CrossRef]
- Metais, M.O.; Jouini, O.; Perez, Y.; Berrada, J.; Suomalainen, E. Too much or not enough? Planning electric vehicle charging infrastructure: A review of modeling options. Renew. Sustain. Energy Rev. 2022, 153, 111719. [Google Scholar] [CrossRef]
- Pagany, R.; Ramirez Camargo, L.; Dorner, W. A review of spatial localization methodologies for the electric vehicle charging infrastructure. Int. J. Sustain. Transp. 2019, 13, 433–449. [Google Scholar] [CrossRef] [Green Version]
- Ghamami, M.; Zockaie, A.; Nie, Y.M. A general corridor model for designing plug-in electric vehicle charging infrastructure to support intercity travel. Transp. Res. Part C: Emerg. Technol. 2016, 68, 389–402. [Google Scholar] [CrossRef]
- Shareef, H.; Islam, M.M.; Mohamed, A. A review of the stage-of-the-art charging technologies, placement methodologies, and impacts of electric vehicles. Renew. Sustain. Energy Rev. 2016, 64, 403–420. [Google Scholar] [CrossRef]
- Worley, O.; Klabjan, D.; Sweda, T.M. Simultaneous vehicle routing and charging station siting for commercial Electric Vehicles. In Proceedings of the 2012 IEEE International Electric Vehicle Conference, Greenville, SC, USA, 4–8 March 2012; pp. 1–3. [Google Scholar] [CrossRef] [Green Version]
- Wang, Y.; Shi, J.; Wang, R.; Liu, Z.; Wang, L. Siting and sizing of fast charging stations in highway network with budget constraint. Appl. Energy 2018, 228, 1255–1271. [Google Scholar] [CrossRef]
- Yan, L. Optimal layout and scale of charging stations for electric vehicles. In Proceedings of the 2016 China International Conference on Electricity Distribution (CICED), Xi’an, China, 10–13 August 2016; pp. 1–5. [Google Scholar] [CrossRef]
- Napoli, G.; Polimeni, A.; Micari, S.; Andaloro, L.; Antonucci, V. Optimal allocation of electric vehicle charging stations in a highway network: Part 1. Methodology and test application. J. Energy Storage 2020, 27, 101102. [Google Scholar] [CrossRef]
- Csiszár, C.; Csonka, B.; Földes, D.; Wirth, E.; Lovas, T. Location optimisation method for fast-charging stations along national roads. J. Transp. Geogr. 2020, 88, 102833. [Google Scholar] [CrossRef]
- Kavianipour, M.; Fakhrmoosavi, F.; Shojaei, M.H.; Zockaie, A.; Ghamami, M.; Wang, J.; Jackson, R. Impacts of technology advancements on electric vehicle charging infrastructure configuration: A Michigan case study. Int. J. Sustain. Transp. 2021, 1–14. [Google Scholar] [CrossRef]
- Wang, C.; He, F.; Lin, X.; Shen, Z.-J.; Li, M. Designing locations and capacities for charging stations to support intercity travel of electric vehicles: An expanded network approach. Transp. Res. Part C 2019, 102, 210–232. [Google Scholar] [CrossRef]
- Baresch, M.; Moser, S. Allocation of e-car charging: Assessing the utilization of charging infrastructures by location. Transp. Res. Part A Policy Pract. 2019, 124, 388–395. [Google Scholar] [CrossRef]
- Gholamrezaei, M.; Ghorbanian, K. Rotated general regression neural network. In Proceedings of the IEEE International Conference on Neural Networks—Conference Proceedings, Orlando, FL, USA, 12–17 August 2007; Volume 2, pp. 1959–1964. [Google Scholar] [CrossRef]
- BMK. Österreich unterwegs 2013/2014. 2014. Available online: https://www.bmk.gv.at/themen/verkehrsplanung/statistik/oesterreich_unterwegs.html (accessed on 27 January 2022).
- Jochem, P.; Brendel, C.; Reuter-Oppermann, M.; Fichtner, W.; Nickel, S. Optimizing the allocation of fast charging infrastructure along the German autobahn. J. Bus. Econ. 2016, 86, 513–535. [Google Scholar] [CrossRef] [Green Version]
- Frei, A.; Kuhnimhof, T.G.; Axhausen, K.W. Long distance travel in Europe today: Experiences with a new survey. In Arbeitsberichte Verkehrs-und Raumplanung; ETH, Eidgenössische Technische Hochschule Zürich, IVT, Institut für Verkehrsplanung und Transportsysteme: Zürich, Switzerland, 2009. [Google Scholar]
- ASFINAG. Verkehrsentwicklung. 2022. Available online: https://www.asfinag.at/verkehr-sicherheit/verkehrszahlung/ (accessed on 27 January 2022).
- Tober, W.; Bruckmüller, T.; Fasthuber, D. Ladeinfrastruktur für Elektrofahrzeuge: Bedarf, Kosten und Auswirkungen auf Die Energieversorgung in Österreich bis 2030. Available online: https://oevk.at (accessed on 20 February 2022).
- Suarez, C.; Martinez, W. Fast and Ultra-Fast Charging for Battery Electric Vehicles—A Review. In Proceedings of the 2019 IEEE Energy Conversion Congress and Exposition, ECCE 2019, Baltimore, MD, USA, 29 September–3 October 2019; pp. 569–575. [Google Scholar] [CrossRef]
- OpenStreetMap Contributors. Planet Dump. 2017. Available online: https://www.openstreetmap.org (accessed on 20 February 2022).
- ASFINAG. Rastanlagensuche. 2021. Available online: https://www.asfinag.at/parken-rasten/rastanlagensuche/ (accessed on 27 January 2022).
- OpenEntrance. 2019. Available online: https://openentrance.eu/ (accessed on 18 January 2022).
- Auer, H.; del Granado, P.C.; Backe, S.; Pisciella, P.; Hainsch, K. Storylines for Low Carbon Futures of the European Energy System. Deliverbale 7.1. Available online: https://openentrance.eu/2019/11/30/storylines-low-carbon-futures/ (accessed on 20 February 2022).
- Hainsch, K.; Löffler, K.; Burandt, T.; Auer, H.; Crespo del Granado, P.; Pisciella, P.; Zwickl-Bernhard, S. Energy transition scenarios: What policies, societal attitudes, and technology developments will realize the EU Green Deal? Energy 2022, 239, 122067. [Google Scholar] [CrossRef]
- Thielmann, A.; Wietschel, M.; Funke, S.; Grimm, A.; Hettesheimer, T.; Langkau, S.; Loibl, A.; Moll, C.; Neef, C.; Plötz, P.; et al. Batterien für Elektroautos: Faktencheck und Handlungsbedarf. In Perspektiven—Policy Brief, No. 01 / 2020 (DE); Frauenhofer ISI: Karlsruhe, Germany, 2020; p. 36. [Google Scholar]
- Suomalainen, E.; Colet, F. A corridor-based approach to estimating the costs of electric vehicle charging infrastructure on highways. World Electr. Veh. J. 2019, 10, 68. [Google Scholar] [CrossRef] [Green Version]
- Baumgarte, F.; Kaiser, M.; Keller, R. Policy support measures for widespread expansion of fast charging infrastructure for electric vehicles. Energy Policy 2021, 156, 112372. [Google Scholar] [CrossRef]
- Genovese, A.; Ortenzi, F.; Villante, C. On the energy efficiency of quick DC vehicle battery charging. World Electr. Veh. J. 2015, 7, 570–576. [Google Scholar] [CrossRef] [Green Version]
- Ionity. Ionity Europe. 2022. Available online: https://ionity.eu/de (accessed on 14 February 2022).
- Hart, W.E.; Watson, J.P.; Woodruff, D.L. Pyomo: Modeling and solving mathematical programs in Python. Math. Program. Comput. 2011, 3, 219–260. [Google Scholar] [CrossRef]
- Meistverkaufte Elektroautos in Österreich nach Modell 2020. Available online: https://de.statista.com/statistik/daten/studie/575997/umfrage/meistverkaufte-elektrofahrzeuge-in-oesterreich-nach-modell/ (accessed on 14 February 2022).
- Hezel, P. Anzahl der monatlichen Neuzulassungen von Elektroautos in Österreich nach Modell von Januar bis November 2021. 2021. Available online: https://de.statista.com/statistik/daten/studie/993281/umfrage/pkw-neuzulassungen-mit-elektroantrieb-in-oesterreich-nach-modell/ (accessed on 18 January 2022).
- Database, E. EV Database—v4.3 2021. Available online: https://ev-database.org/ (accessed on 18 January 2022).
- Esri. ArcGIS Pro. 2021. Available online: https://www.esri.com/en-us/arcgis/products/arcgis-pro/resources (accessed on 20 February 2022).

| Indices | |
|---|---|
| node | |
| driving direction from which a node is accessible | |
| highway segment | |
| Decision variables | |
| charged energy at node (during peak hour) of energy demand from node during peak hour | |
| energy demand that stems from node , incoming to node during peak hour | |
| energy demand that stems from node , not covered and outgoing from node during peak hour | |
| binary variable if charging station is installed (1) or not (0) at node l | |
| number of charging points at node | |
| Input parameters | |
| Car fleet | |
| share of BEVs in total passenger car fleet | |
| share of cars traveling long distance | |
| share of daily car count traveling during peak hour | |
| maximum daily amount of cars passing by at node n driving in direction k during a year | |
| share of overall road traffic load compared with year of survey of traffic counts | |
| BEV technology | |
| average specific energy per km demand of BEVs in the car fleet | |
| average driving range of BEVs in the car fleet | |
| average charging capacity of BEVs in the car fleet | |
| Infrastructure specifics | |
| peak power level of a charging point | |
| maximum capacity installed at a charging station | |
| investment costs for installation of a charging station | |
| investment costs for installation of one charging point | |
| Derived parameters | |
| distance of the position of node n along segment s in direction k | |
| General Regression Neural Network function expressing peak daily traffic load dependent on the distance measured from a segment endpoint along a segment s in driving direction k | |
| average energy demand at node n in direction k during peak hour | |
| maximum distance between charging stations | |
| set of nodes accessible within the distance of in driving direction k from node n | |
| rationing parameter reflecting the split of energy demand flow at a junction node | |
| Base Case | |
|---|---|
| Input Parameter | Value |
| BEV share | |
| Share of traffic load during peak hour | |
| Share of long-distance drivers | |
| Share of overall traffic load compared with the survey year of traffic counts | |
| traffic count data | maximum recorded daily traffic counts 2019 |
| energy consumption of an average BEV in the car fleet | 0.24 kWh/km |
| driving range of an average BEV in the car fleet | 340 km |
| charging capacity of an average BEV | 81 kW |
| peak capacity of a charging point | 150 kW |
| maximum installed charging capacity at a charging station | 12 MW |
| investment costs for installation a charging station | EUR 40,000 |
| investment costs for installation of one charging point | EUR 67,000 |
| Projections for 2030 under Different Scenarios | ||||
|---|---|---|---|---|
| Model Parameters | Societal Commitment | Techno Friendly | Directed Transition | Gradual Development |
| 33 | 33 | 27 | 27 | |
| 69 | 83 | 83 | 100 | |
| (km) | 450 | 800 | 600 | 800 |
| (kW) | 200 | 315 | 315 | 200 |
| Input Parameters for Scenarios 2030 | ||||
|---|---|---|---|---|
| Model Parameters | Societal Commitment | Techno Friendly | Directed Transition | Gradual Development |
| 33 | 33 | 27 | 27 | |
| 69 | 83 | 83 | 100 | |
| (km) | 420 | 670 | 660 | 520 |
| (kW) | 166 | 248 | 243 | 164 |
| (kW) | 350 | 350 | 350 | 350 |
| (EUR) | 127,000 | 127,000 | 127,000 | 127,000 |
| Existing Infrastructure | Model Output | |
|---|---|---|
| Nb. charging stations | 31 | 43 |
| Nb. charging points with (AC) | 8 | - |
| Nb. charging points with (DC) | 72 | - |
| Nb. charging points with (DC) | 4 | - |
| Nb. charging points with (DC) | 22 | 98 |
| Nb. charging points with (DC) | 40 | - |
| Total capacity (MW) | 20.1 | 14.7 |
| Nb. of Charging Stations | Total Capacity | Specific Capacity Costs | Specific Costs per BEV | Total Expansion Costs | |
|---|---|---|---|---|---|
| DT scenario 2030 | 54 | 160 MW | EUR/kW 369 | EUR/BEV 39 | EUR 54 M |
| Scenarios 2030 | ||||
|---|---|---|---|---|
| Model Output | Societal Commitment | Techno Friendly | Directed Transition | Gradual Development |
| Nb. charging stations | 54 | 53 | 54 | 56 |
| Total capacity (MW) | 238 | 192 | 160 | 285 |
| Specific capacity costs (EUR /kW) | 368 | 368 | 369 | 367 |
| Specific costs per BEV (EUR/BEV) | 49 | 39 | 39 | 72 |
| Total infrastructure expansion costs (EUR) | 85 M | 68 M | 54 M | 100 M |
| Rel. change in costs to DT scenario | +57% | +26% | - | |
| Parameter Change | Description (Reference Scenario) | Altered Input Parameter | Value in GD Scenario | Updated Value |
|---|---|---|---|---|
| Medium decrease in road traffic | The overall road traffic load is subject to a reduction of (DT, TF). | 83% | ||
| Major decrease in road traffic | The overall road traffic load is subject to a reduction of (SC). | |||
| Increase in driving range | The driving range of BEVs being sold in 2030 is increased to 1000 km (DT, TF). | 520 km | 660 km | |
| Increase in charging power | The average charging capacity of BEVs sold in 2030 is projected to be 315 kW (DT, TF). | 164 kW | 243 kW |
| Cost-Reduction Measures | |||||
|---|---|---|---|---|---|
| GD Scenario 2030 | Medium Decrease in Road Traffic | Major Decrease in Road Traffic | Increase in Driving Range | Increase in Charging Power | |
| Nb. of charging stations | 54 | 54 | 54 | 55 | 54 |
| Total capacity (MW) | 285 | 238 | 197 | 286 | 139 |
| Total expansion costs (EUR) | 100 M | 82 M | 68 M | 100 M | 66 M |
| Rel. change | - | −18% | |||
| Driving Range (TF) | Share of BEV (SC) | |||||
|---|---|---|---|---|---|---|
| 200 km | 800 km | 1400 km | 10% | 50% | 100% | |
| Nb. of charging stations | 55 | 39 | 38 | 42 | 46 | 68 |
| Total capacity (MW) | 192 | 192 | 192 | 73 | 360 | 718 |
| Total investment costs (EUR) | 72 M | 71 M | 71 M | 28 M | 132 M | 263 M |
Publisher’s Note: MDPI stays neutral with regard to jurisdictional claims in published maps and institutional affiliations. |
© 2022 by the authors. Licensee MDPI, Basel, Switzerland. This article is an open access article distributed under the terms and conditions of the Creative Commons Attribution (CC BY) license (https://creativecommons.org/licenses/by/4.0/).
Share and Cite
Golab, A.; Zwickl-Bernhard, S.; Auer, H. Minimum-Cost Fast-Charging Infrastructure Planning for Electric Vehicles along the Austrian High-Level Road Network. Energies 2022, 15, 2147. https://doi.org/10.3390/en15062147
Golab A, Zwickl-Bernhard S, Auer H. Minimum-Cost Fast-Charging Infrastructure Planning for Electric Vehicles along the Austrian High-Level Road Network. Energies. 2022; 15(6):2147. https://doi.org/10.3390/en15062147
Chicago/Turabian StyleGolab, Antonia, Sebastian Zwickl-Bernhard, and Hans Auer. 2022. "Minimum-Cost Fast-Charging Infrastructure Planning for Electric Vehicles along the Austrian High-Level Road Network" Energies 15, no. 6: 2147. https://doi.org/10.3390/en15062147
APA StyleGolab, A., Zwickl-Bernhard, S., & Auer, H. (2022). Minimum-Cost Fast-Charging Infrastructure Planning for Electric Vehicles along the Austrian High-Level Road Network. Energies, 15(6), 2147. https://doi.org/10.3390/en15062147