
Potential Investigation of Membrane Energy Recovery Ventilators for the Management of Building Air-Conditioning Loads

 ,
,  ,
, 

 ,
,  ,
,
Abstract
:1. Introduction
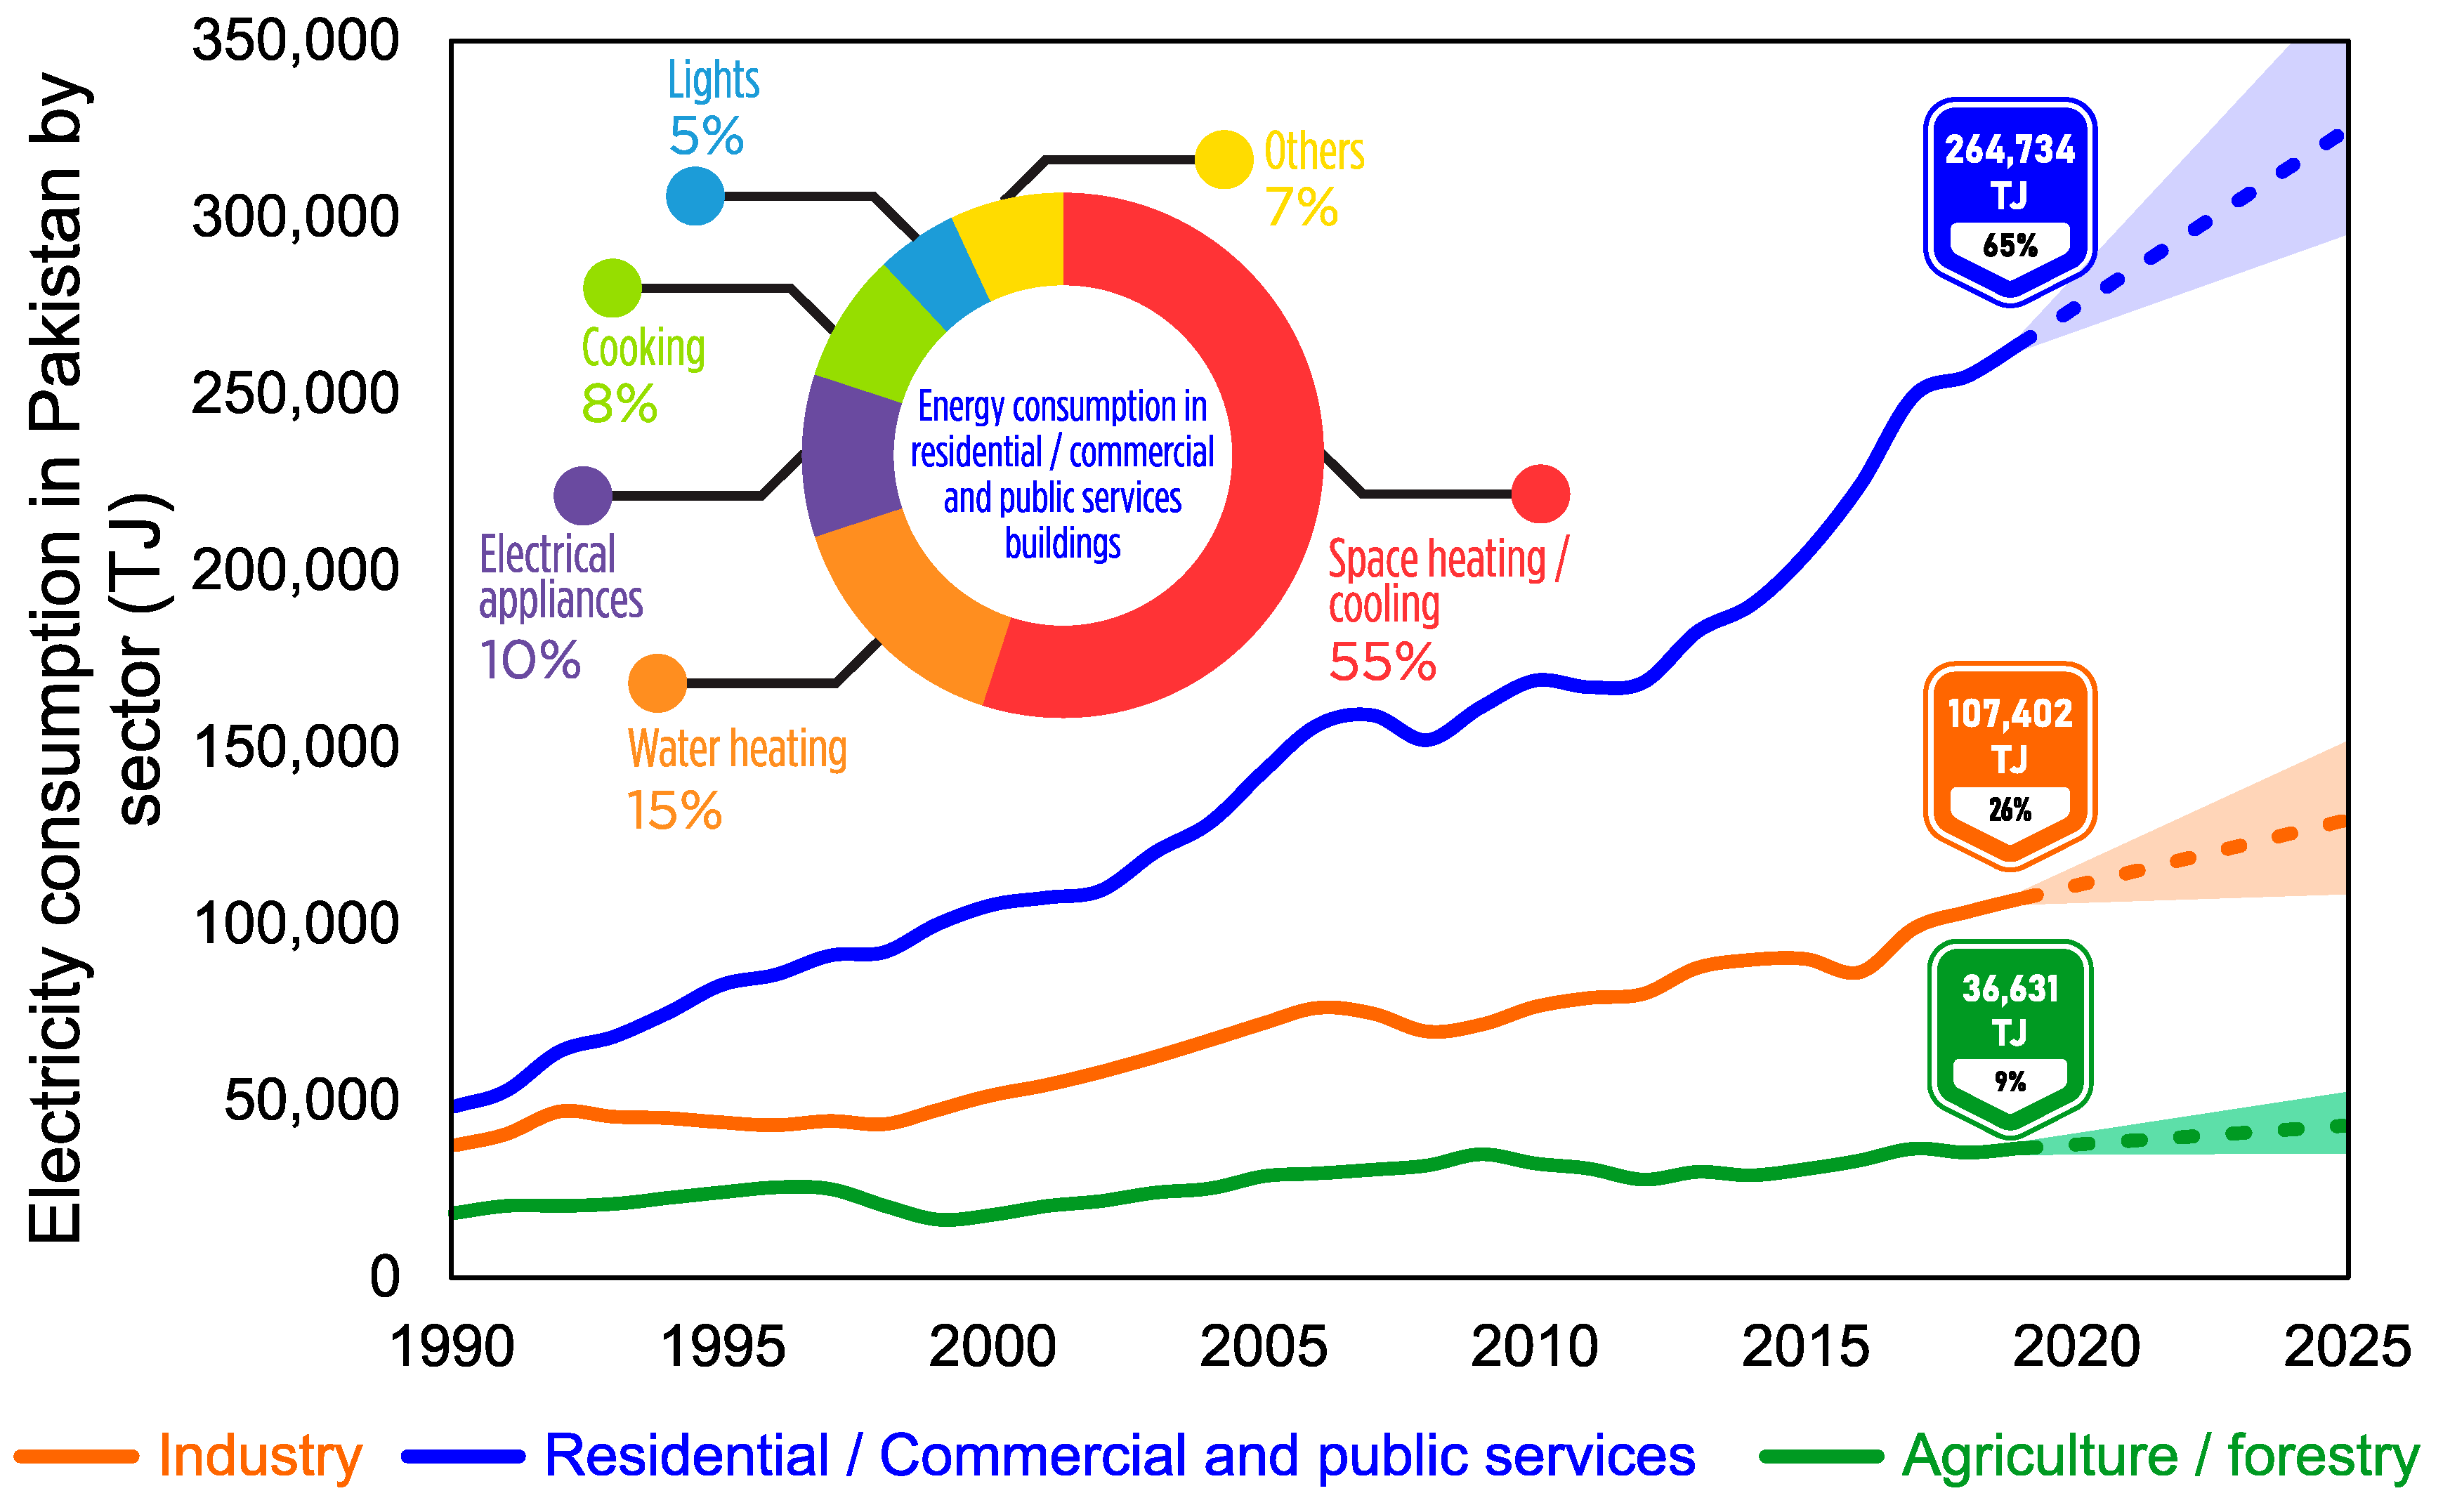
1.1. Background
1.2. Multi-Stage Air-Conditioning Systems
1.3. Membrane Energy Recovery Ventilators
2. Materials and Methods
2.1. Building Energy Simulation
- DEC system (Figure 3a). This system humidifies and simultaneously cools the outside air, increasing the humidity of the supply air in an isenthalpic manner.
- MEC system (Figure 3b). This system provides two streams of air, i.e., sensibly cooled air and humidified hot air. Ideally, this system can achieve below the wet bulb temperature, i.e., dewpoint temperature.
- VAC system (Figure 3c). This system is the conventional mechanical vapor compression system based on refrigerant cooling.
- MEC-VAC system (Figure 3d). This system essentially behaves like a hybrid of the MEC and the VAC systems. The MEC system pretreats the outside air (reducing its temperature) to reduce the cooling coil loads in the VAC system.
- Air-conditioning system with ERV and recirculation configuration (Figure 3). This configuration allows the energy from the stale exhaust air to be recovered and exchanged into the supply air before exhaust. Additionally, the recirculation mode is used in this configuration to divert/mix a portion of the outside air depending upon the thermal comfort requirements of the inside conditions.
- Air-conditioning system without ERV and recirculation configuration (Figure 3). This configuration does not allow any sensible/latent energy recovery from the stale air stream, essentially behaving like a simple air handling unit (AHU) consisting of the four proposed air-conditioning systems.
2.2. Performance Assessment Indicators
2.3. Human Thermal Comfort Indices
3. Results and Discussion
3.1. Design Parameters
3.2. Performance Profiles of the Systems
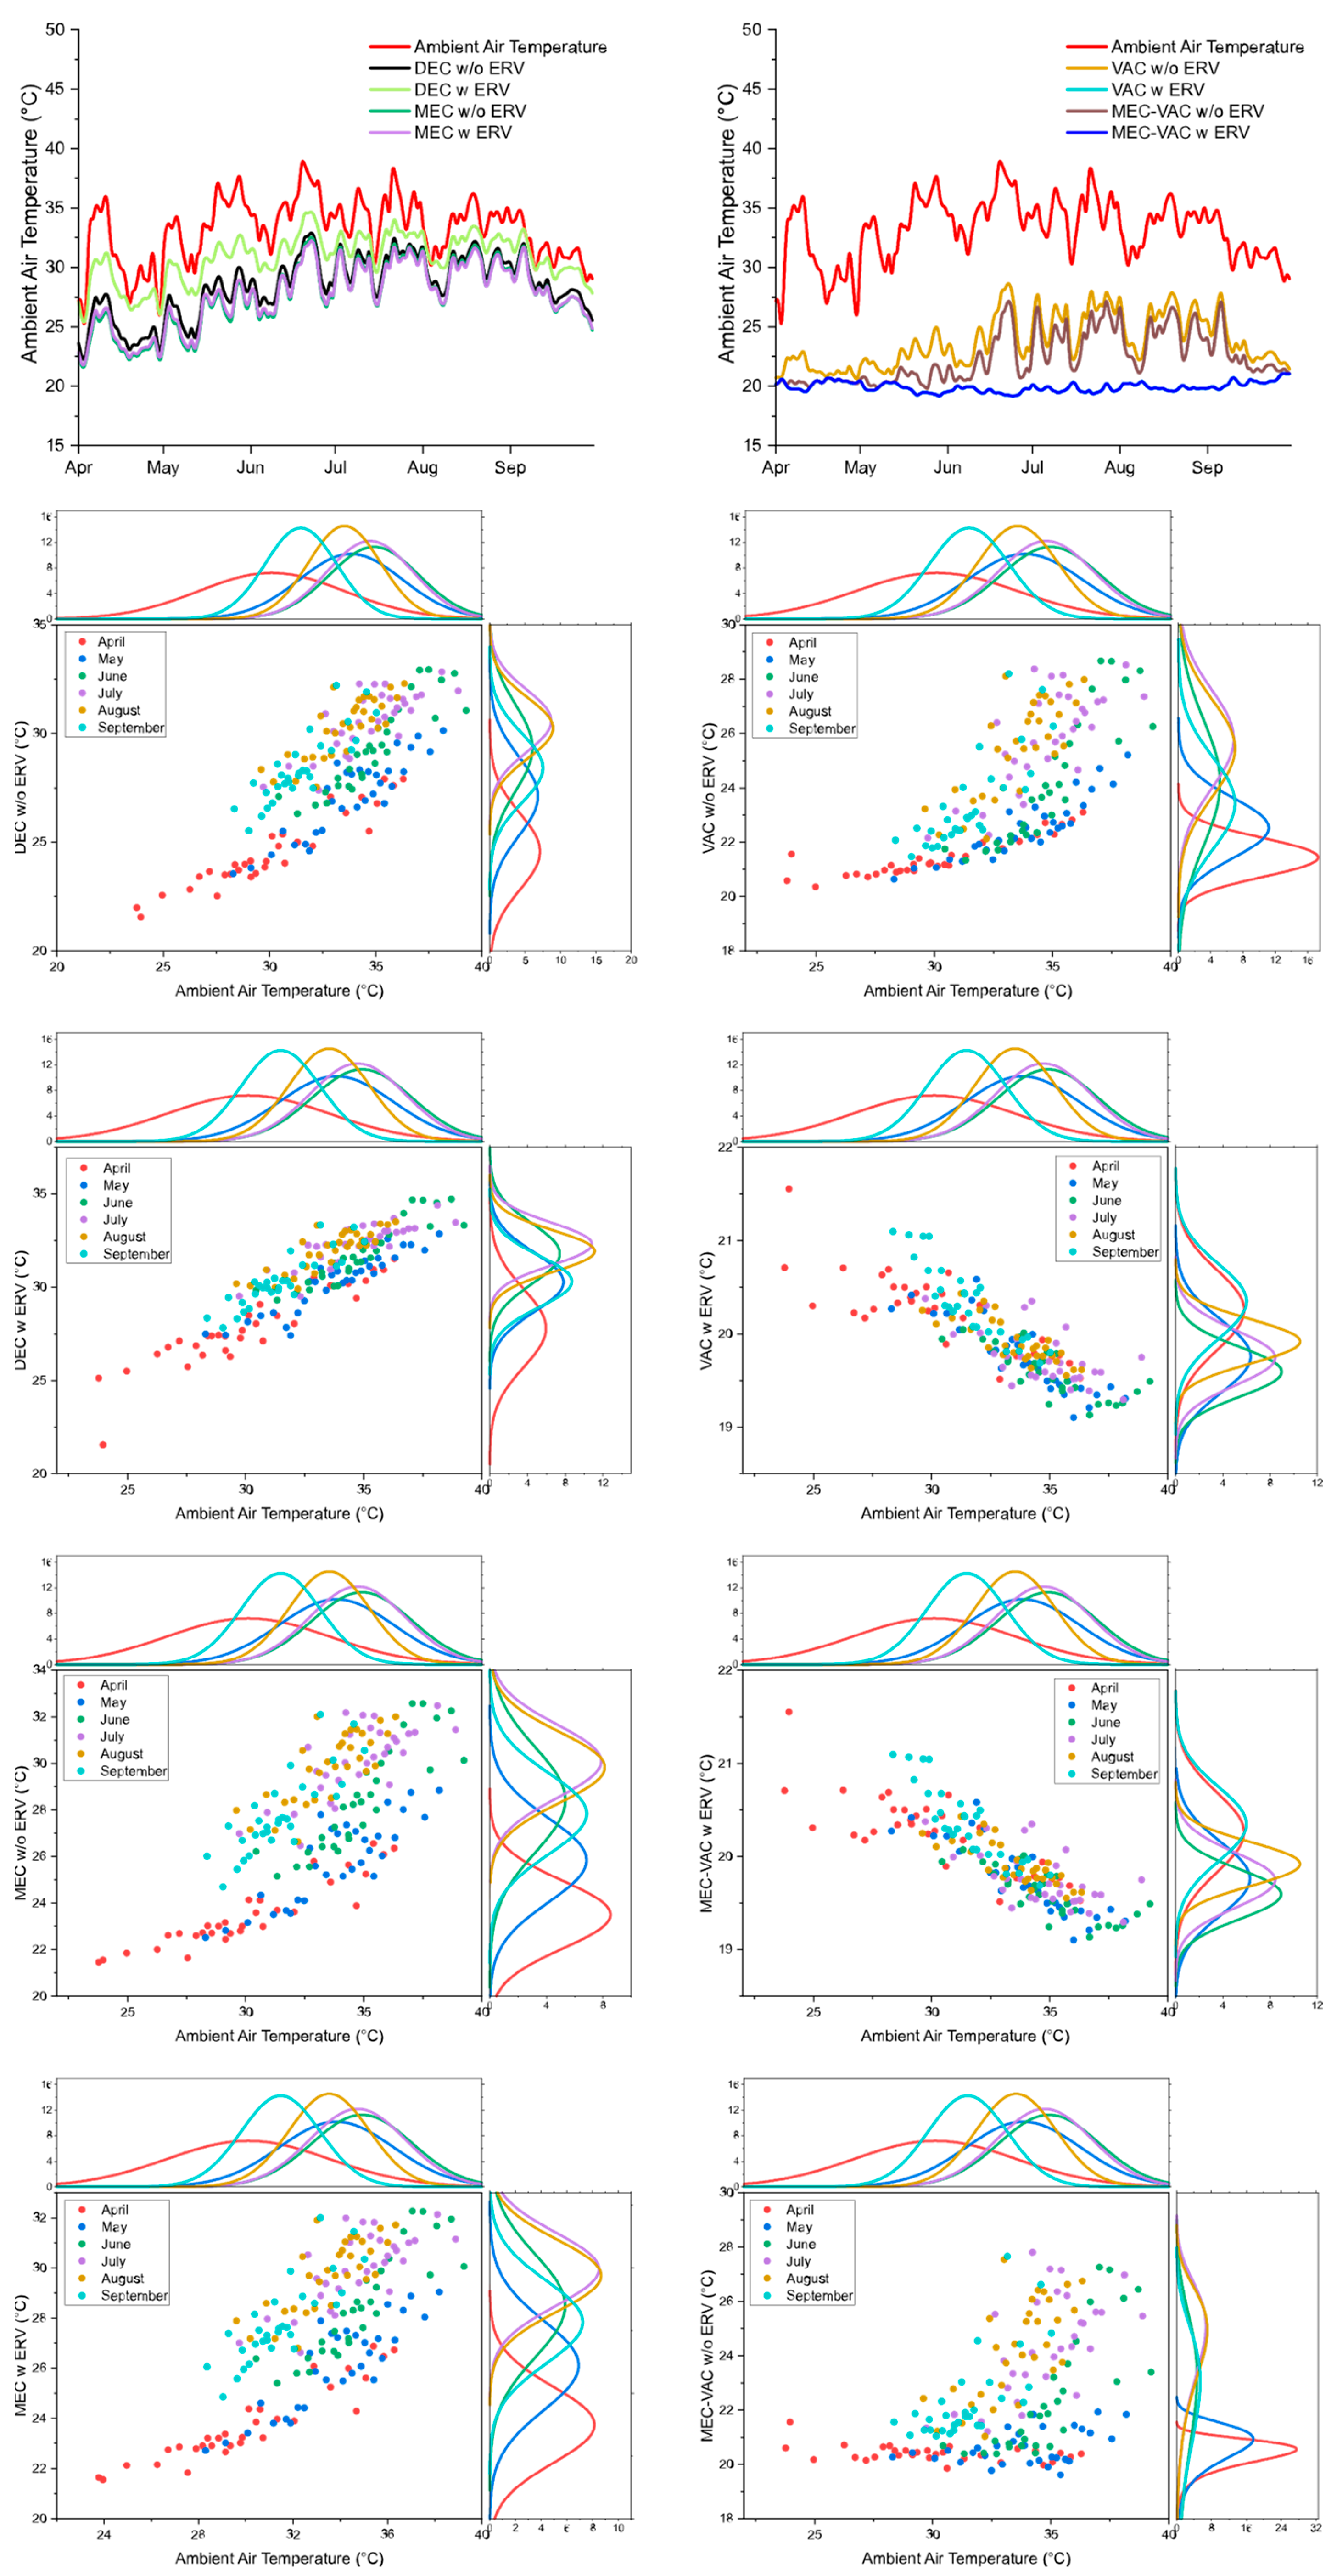
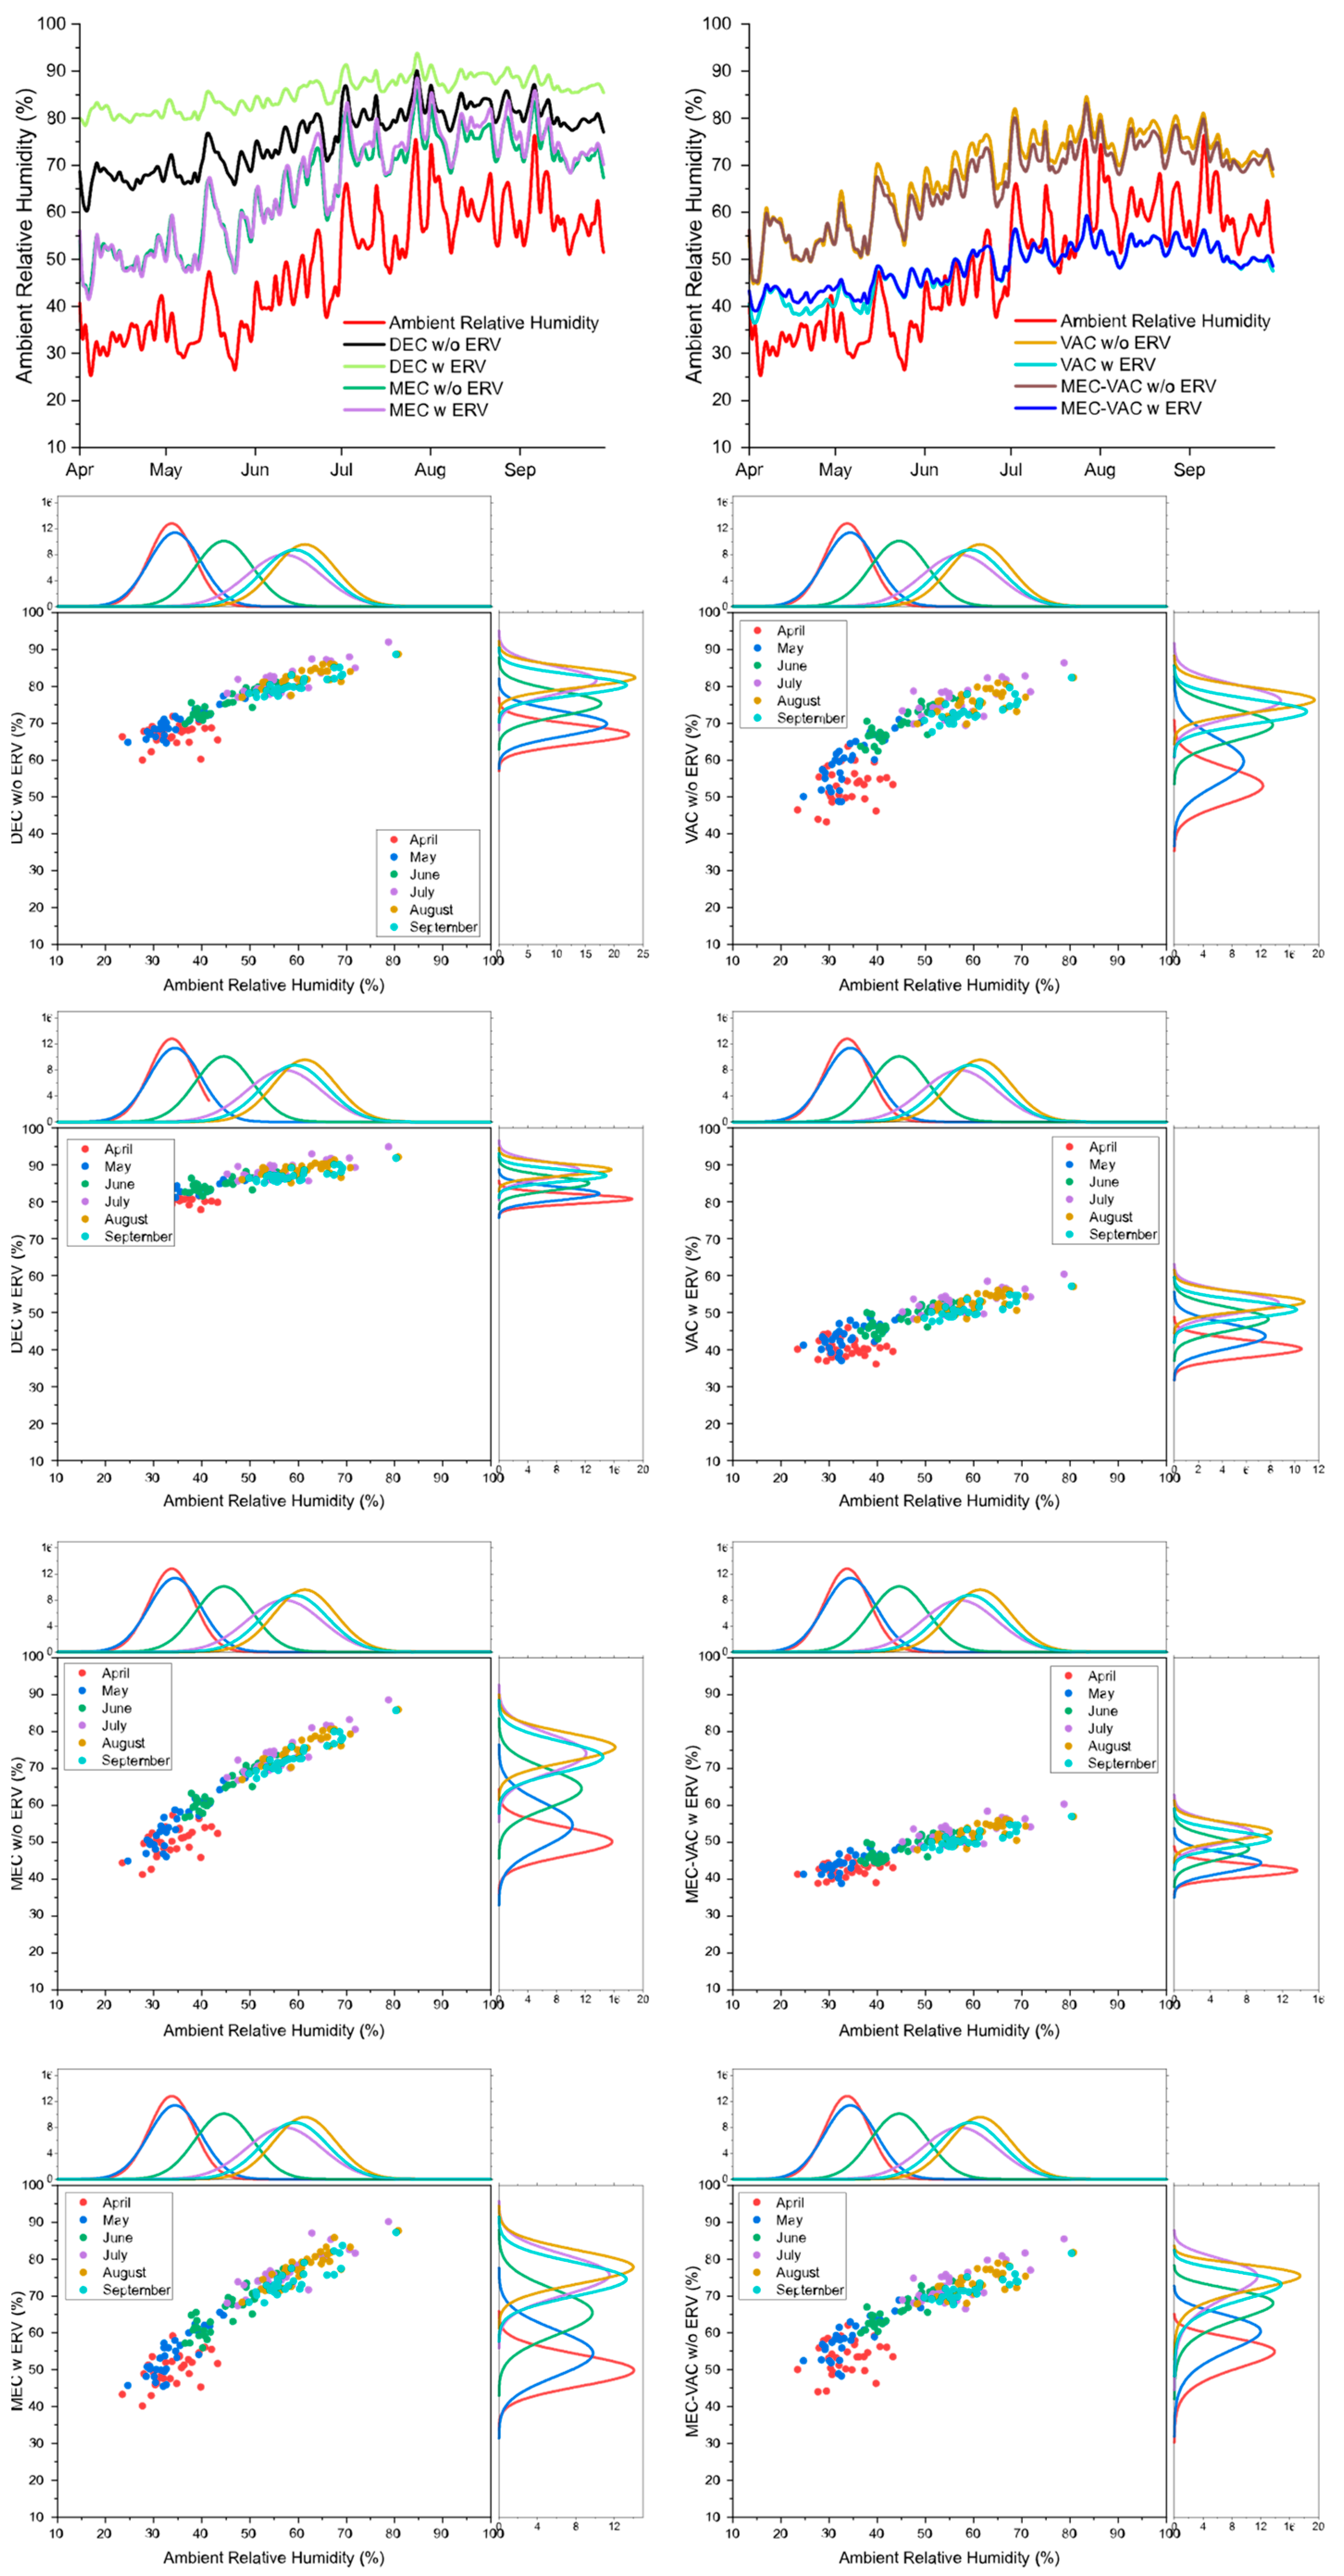
3.2.1. Temperature/Humidity
3.2.2. Mean Radiant Temperature
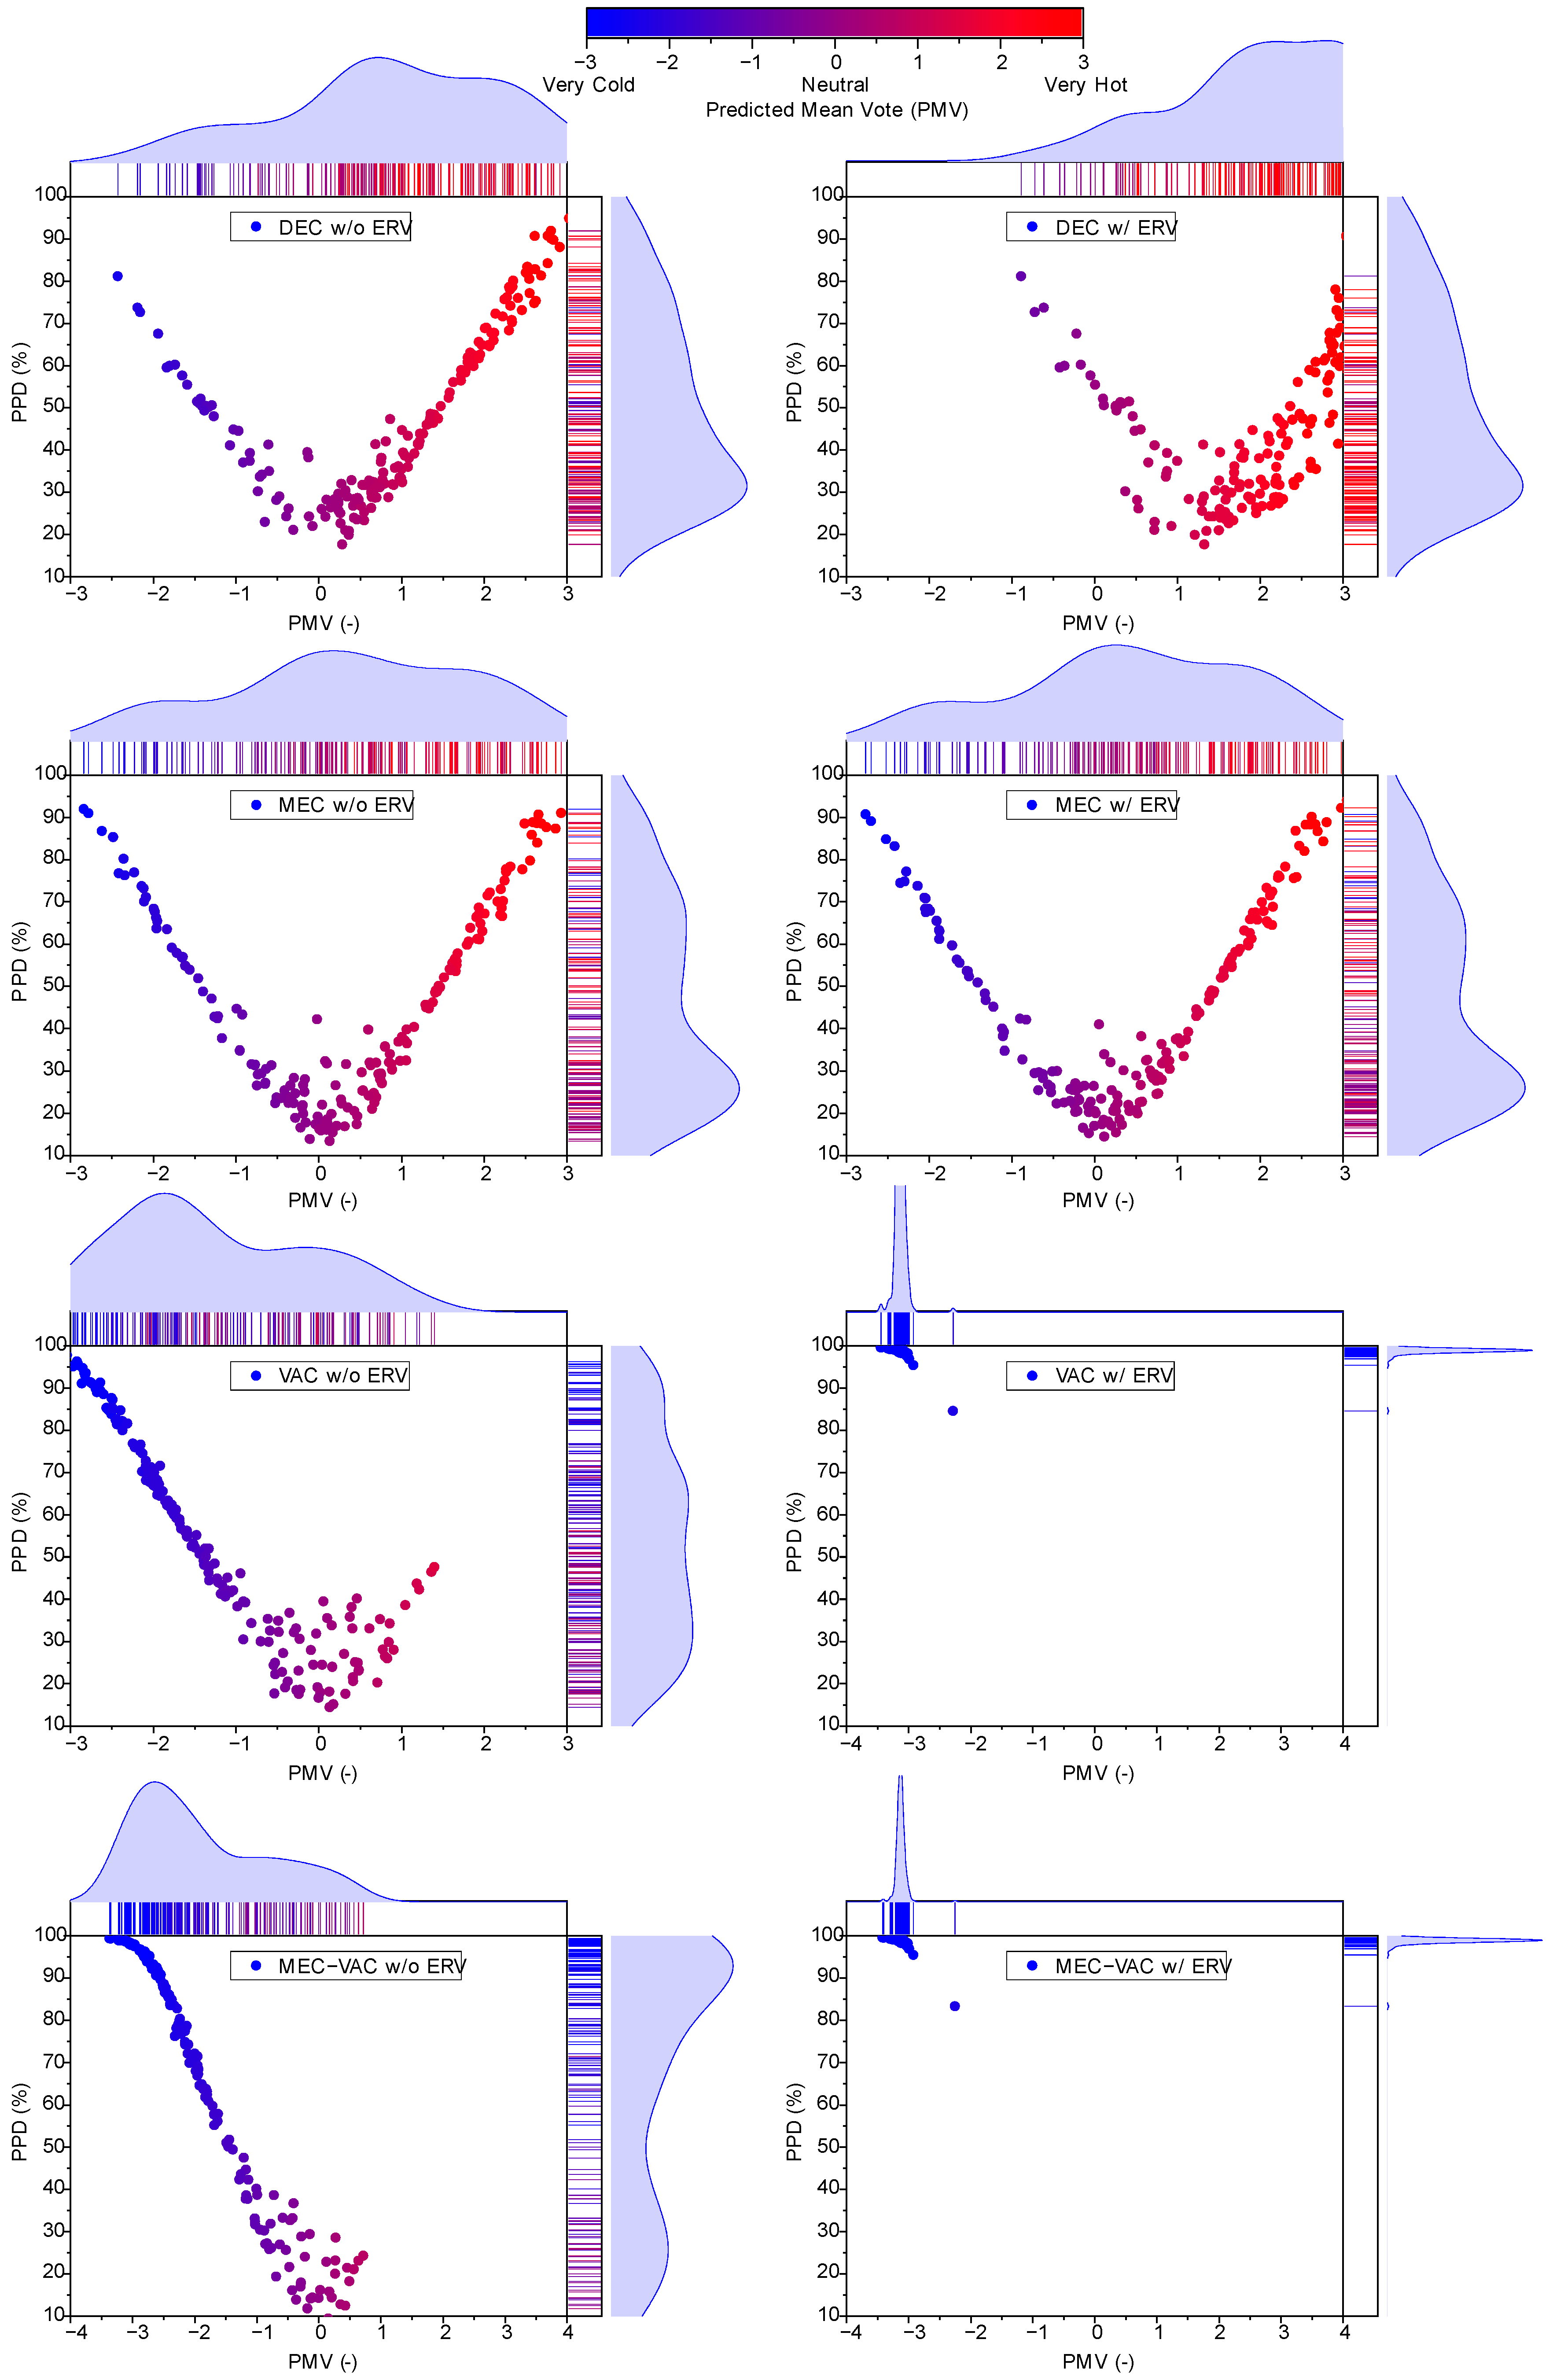
3.2.3. Human Thermal Comfort
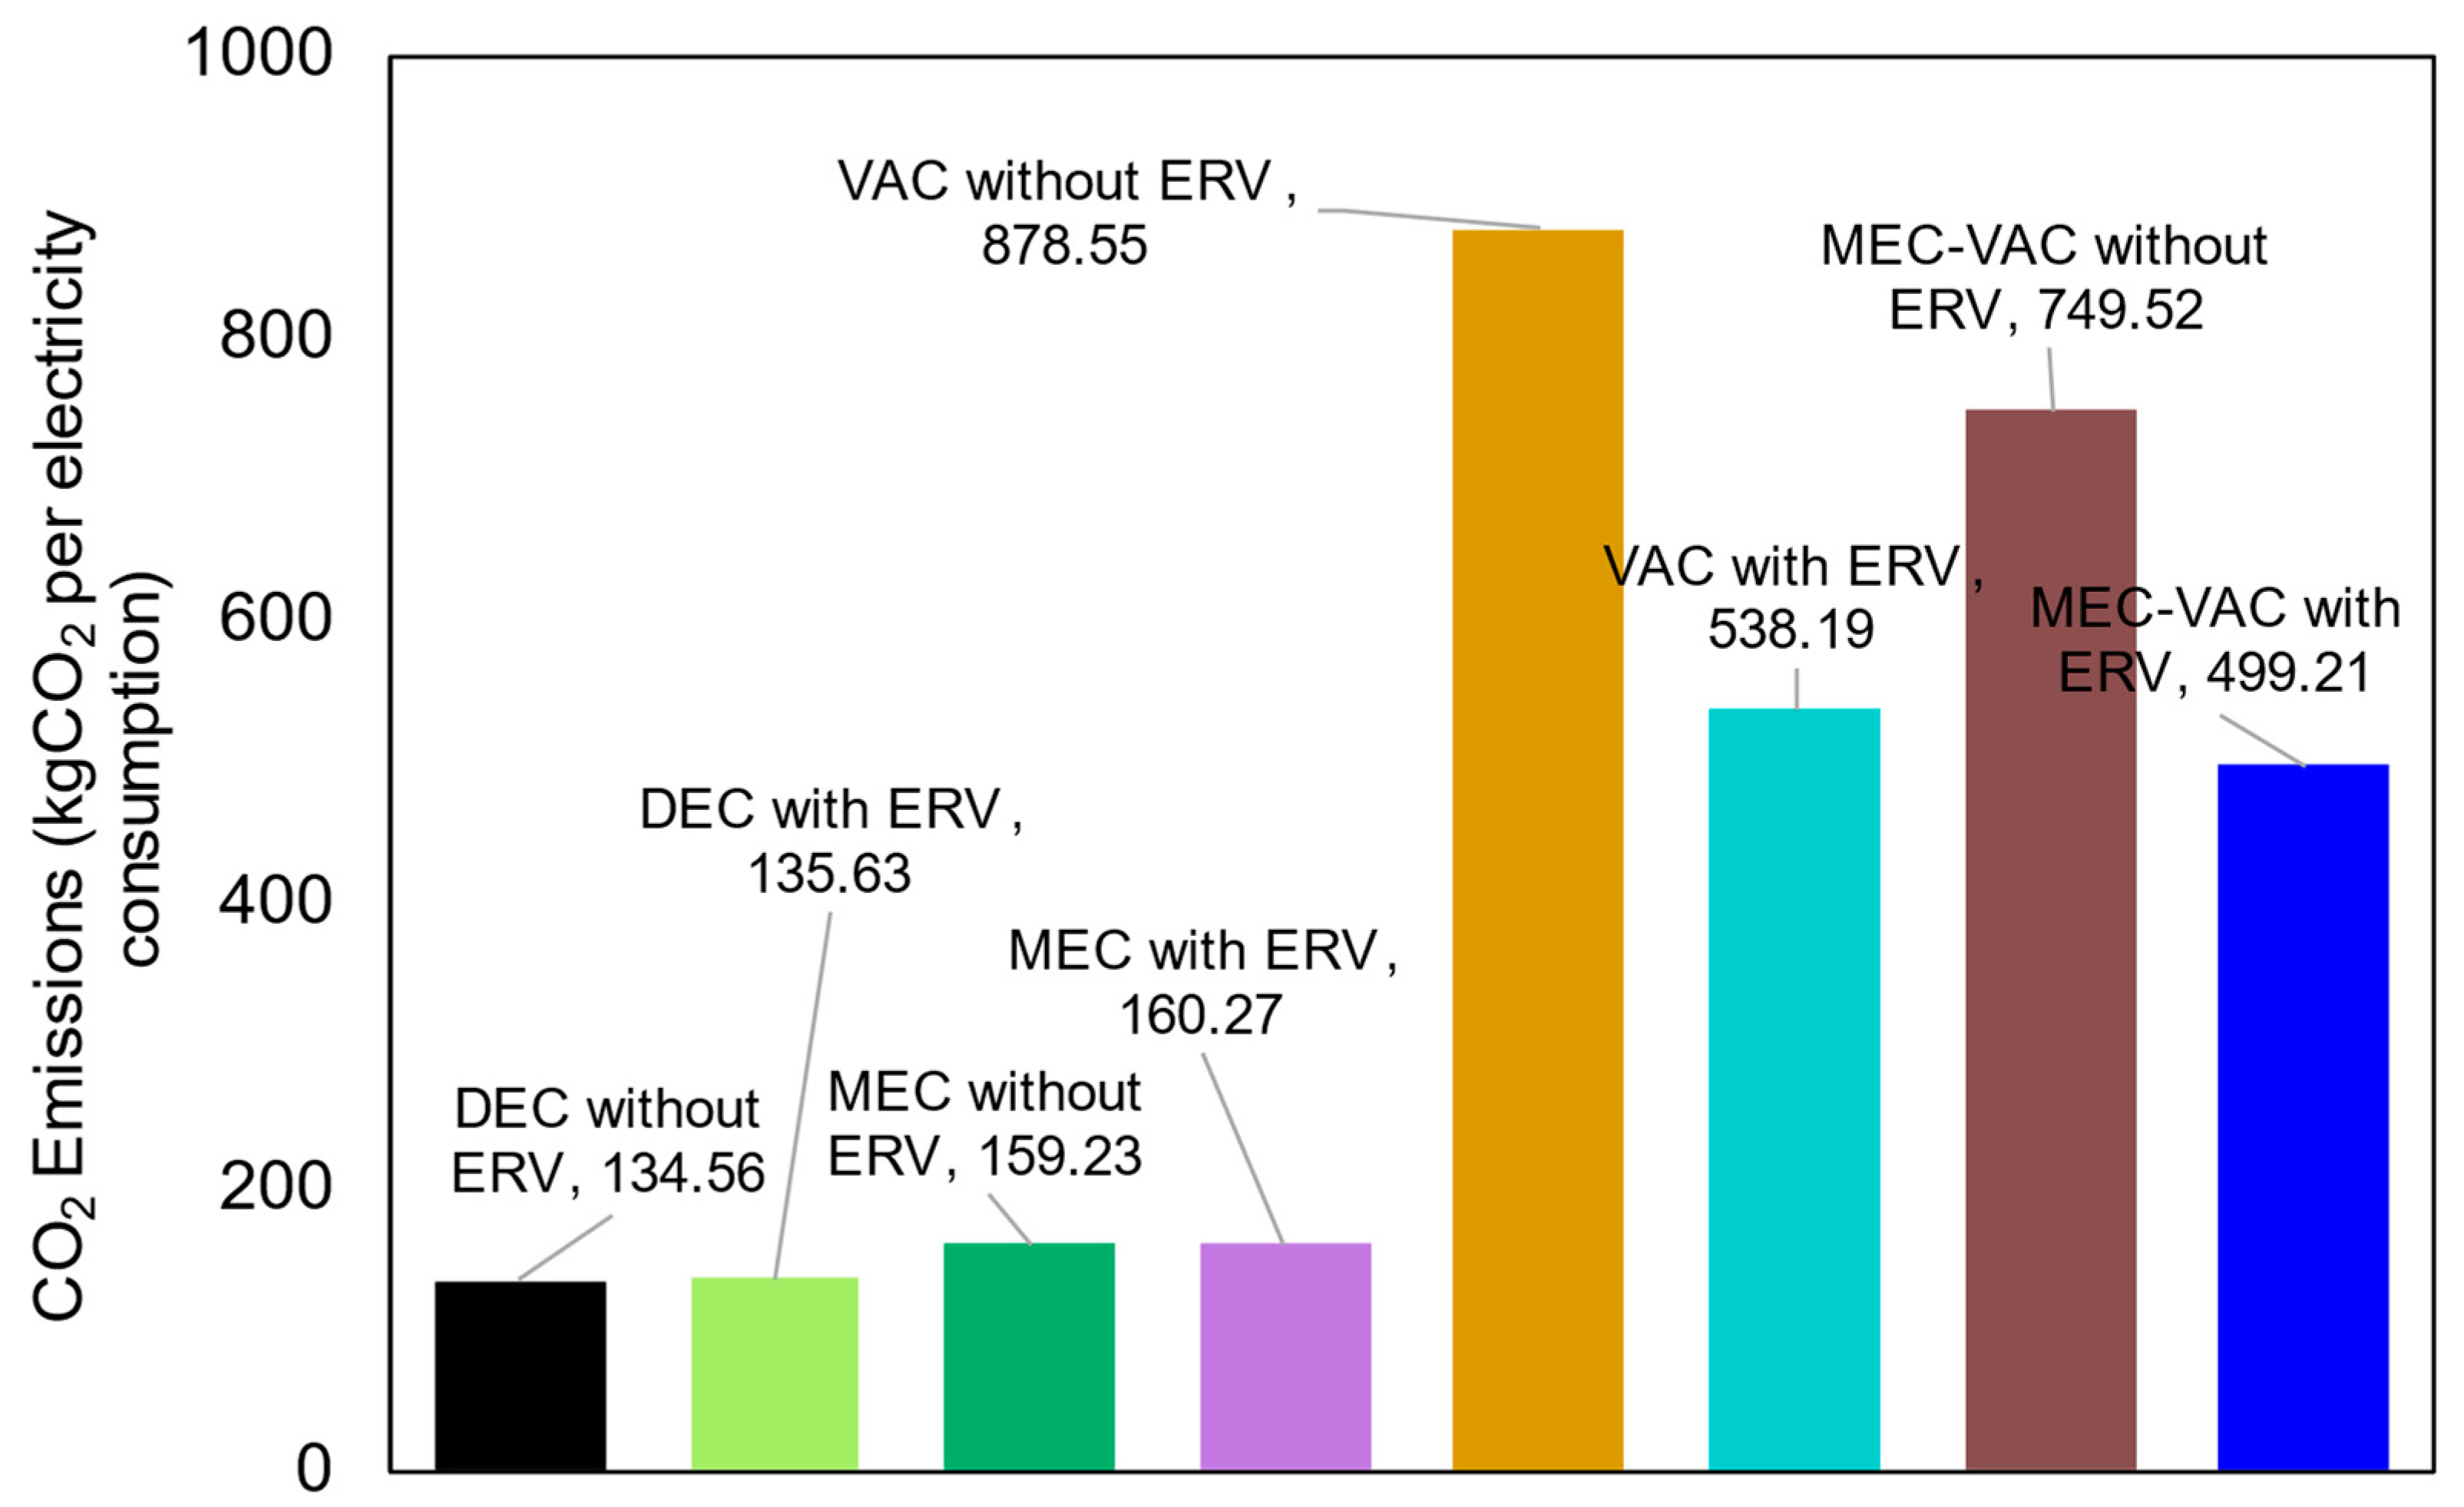
3.2.4. Carbon Dioxide Emissions
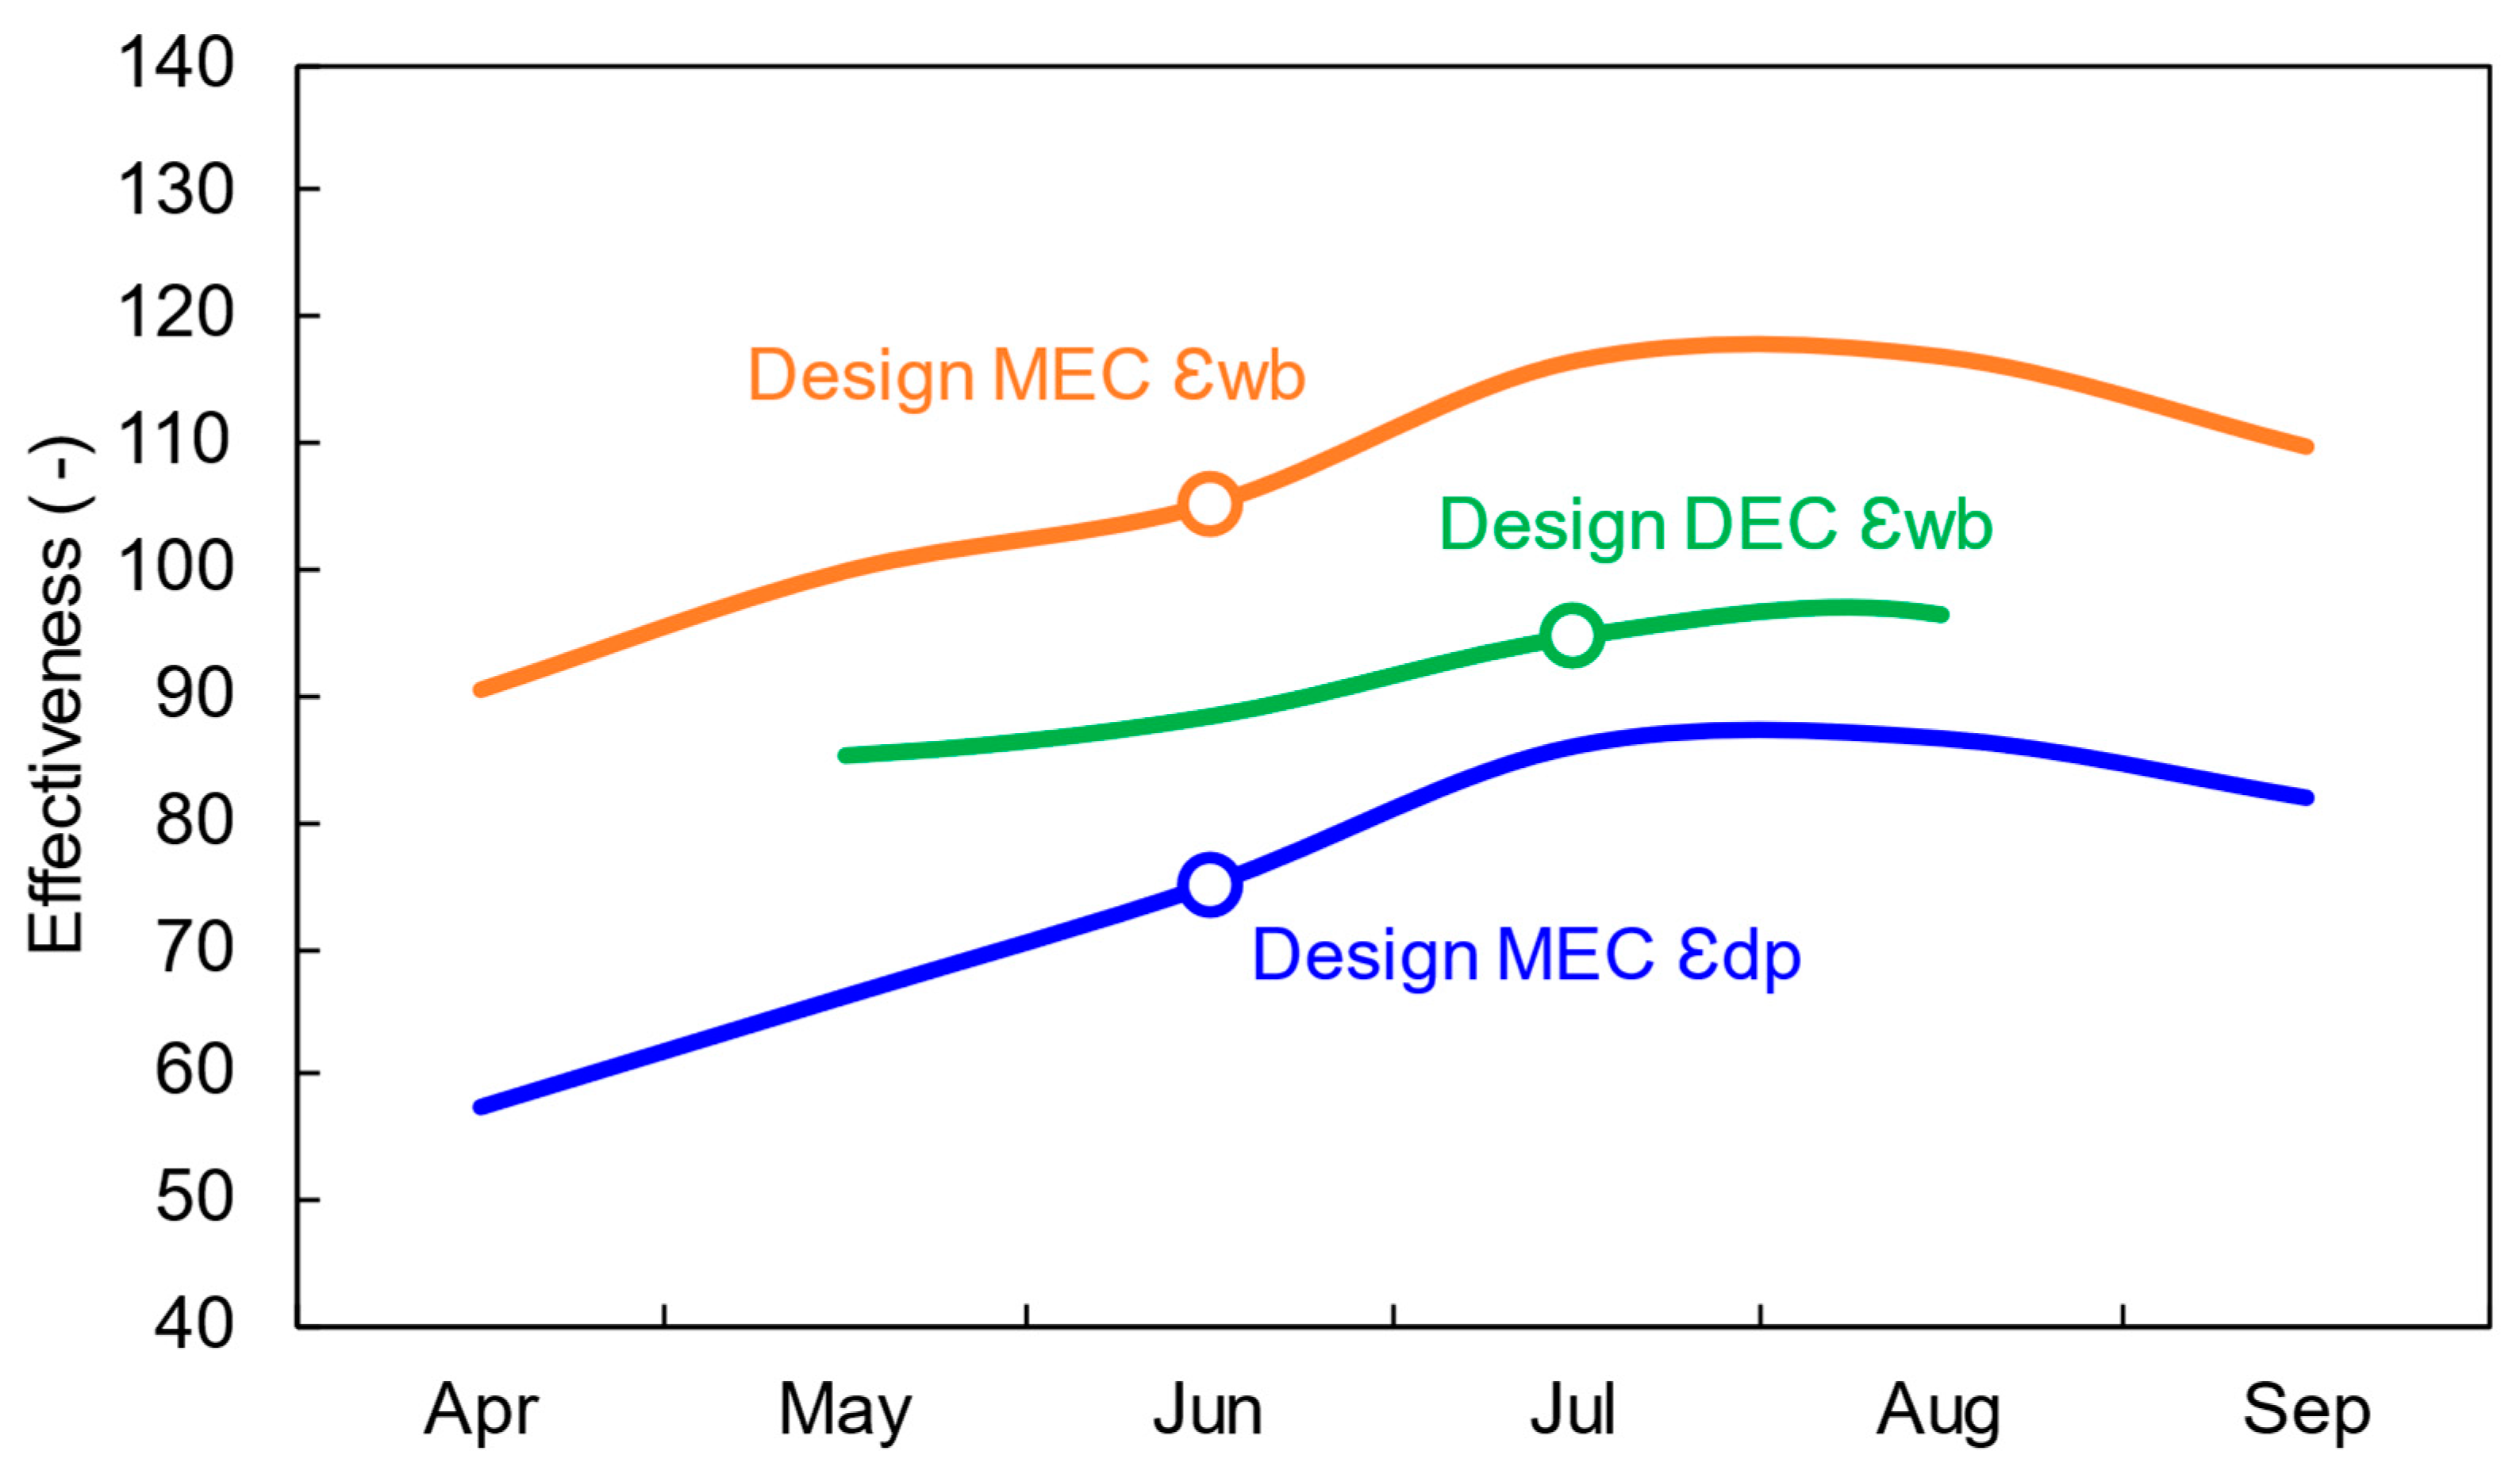
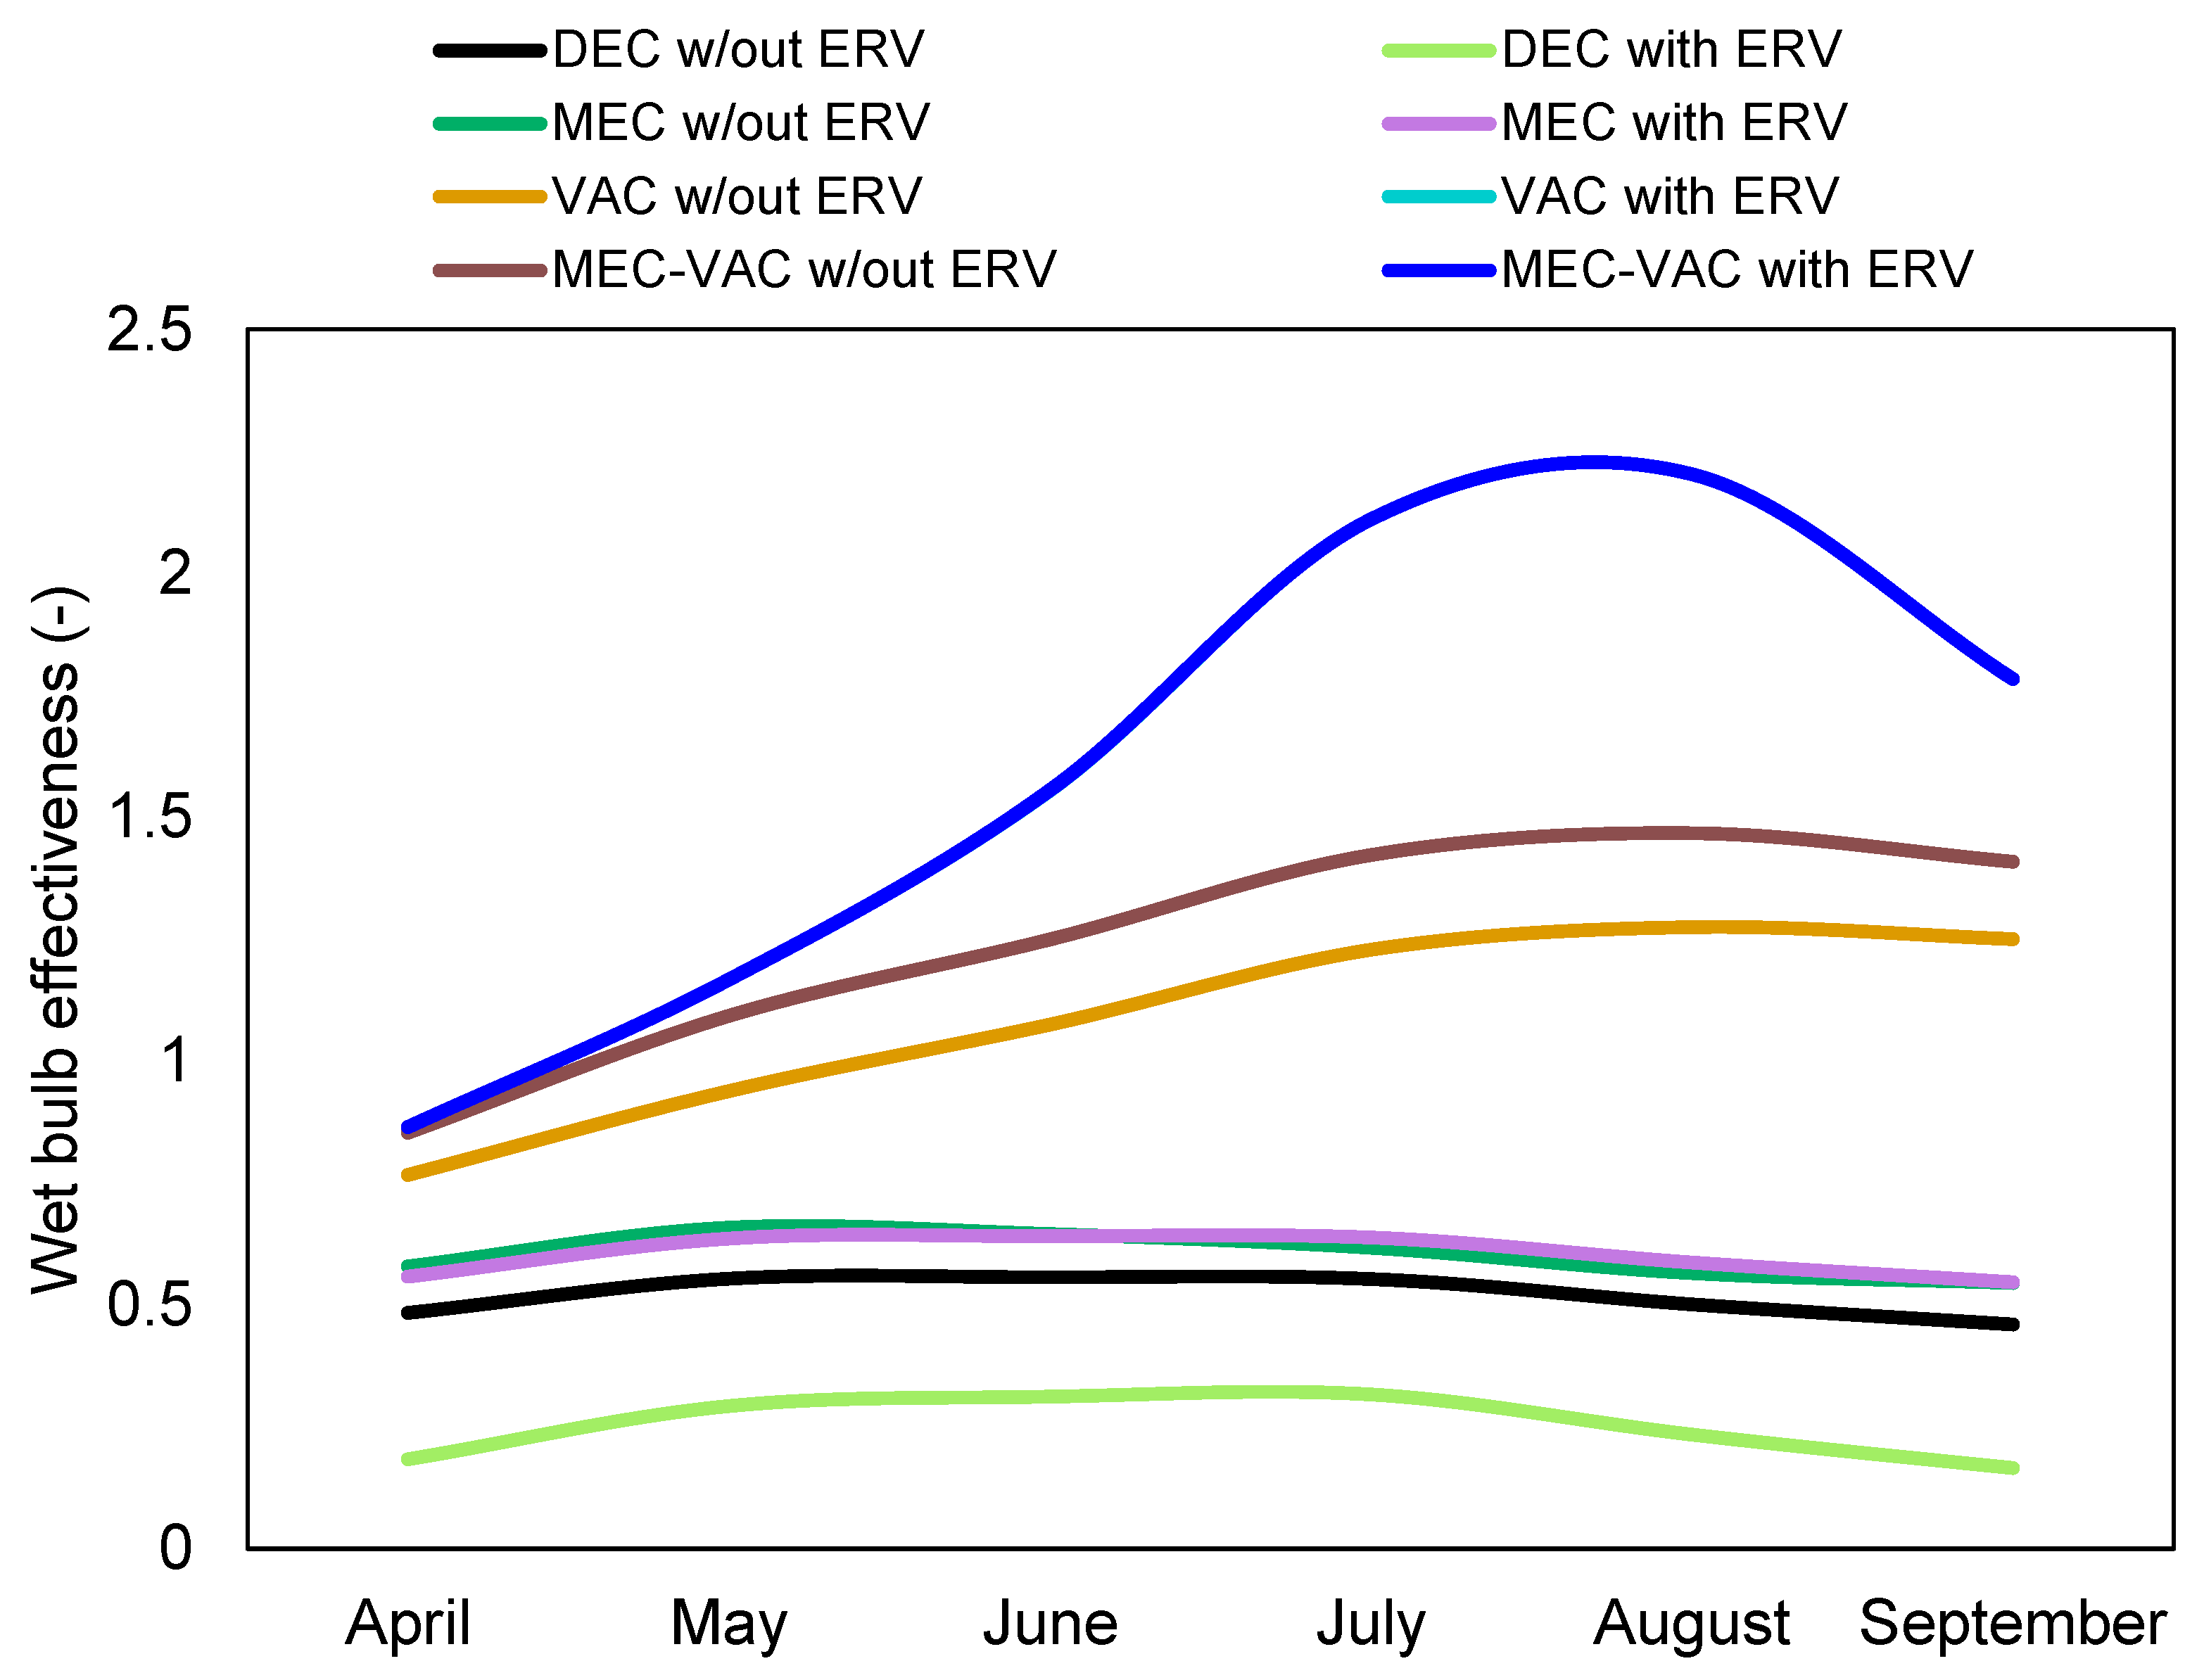
3.2.5. Wet Bulb Effectiveness
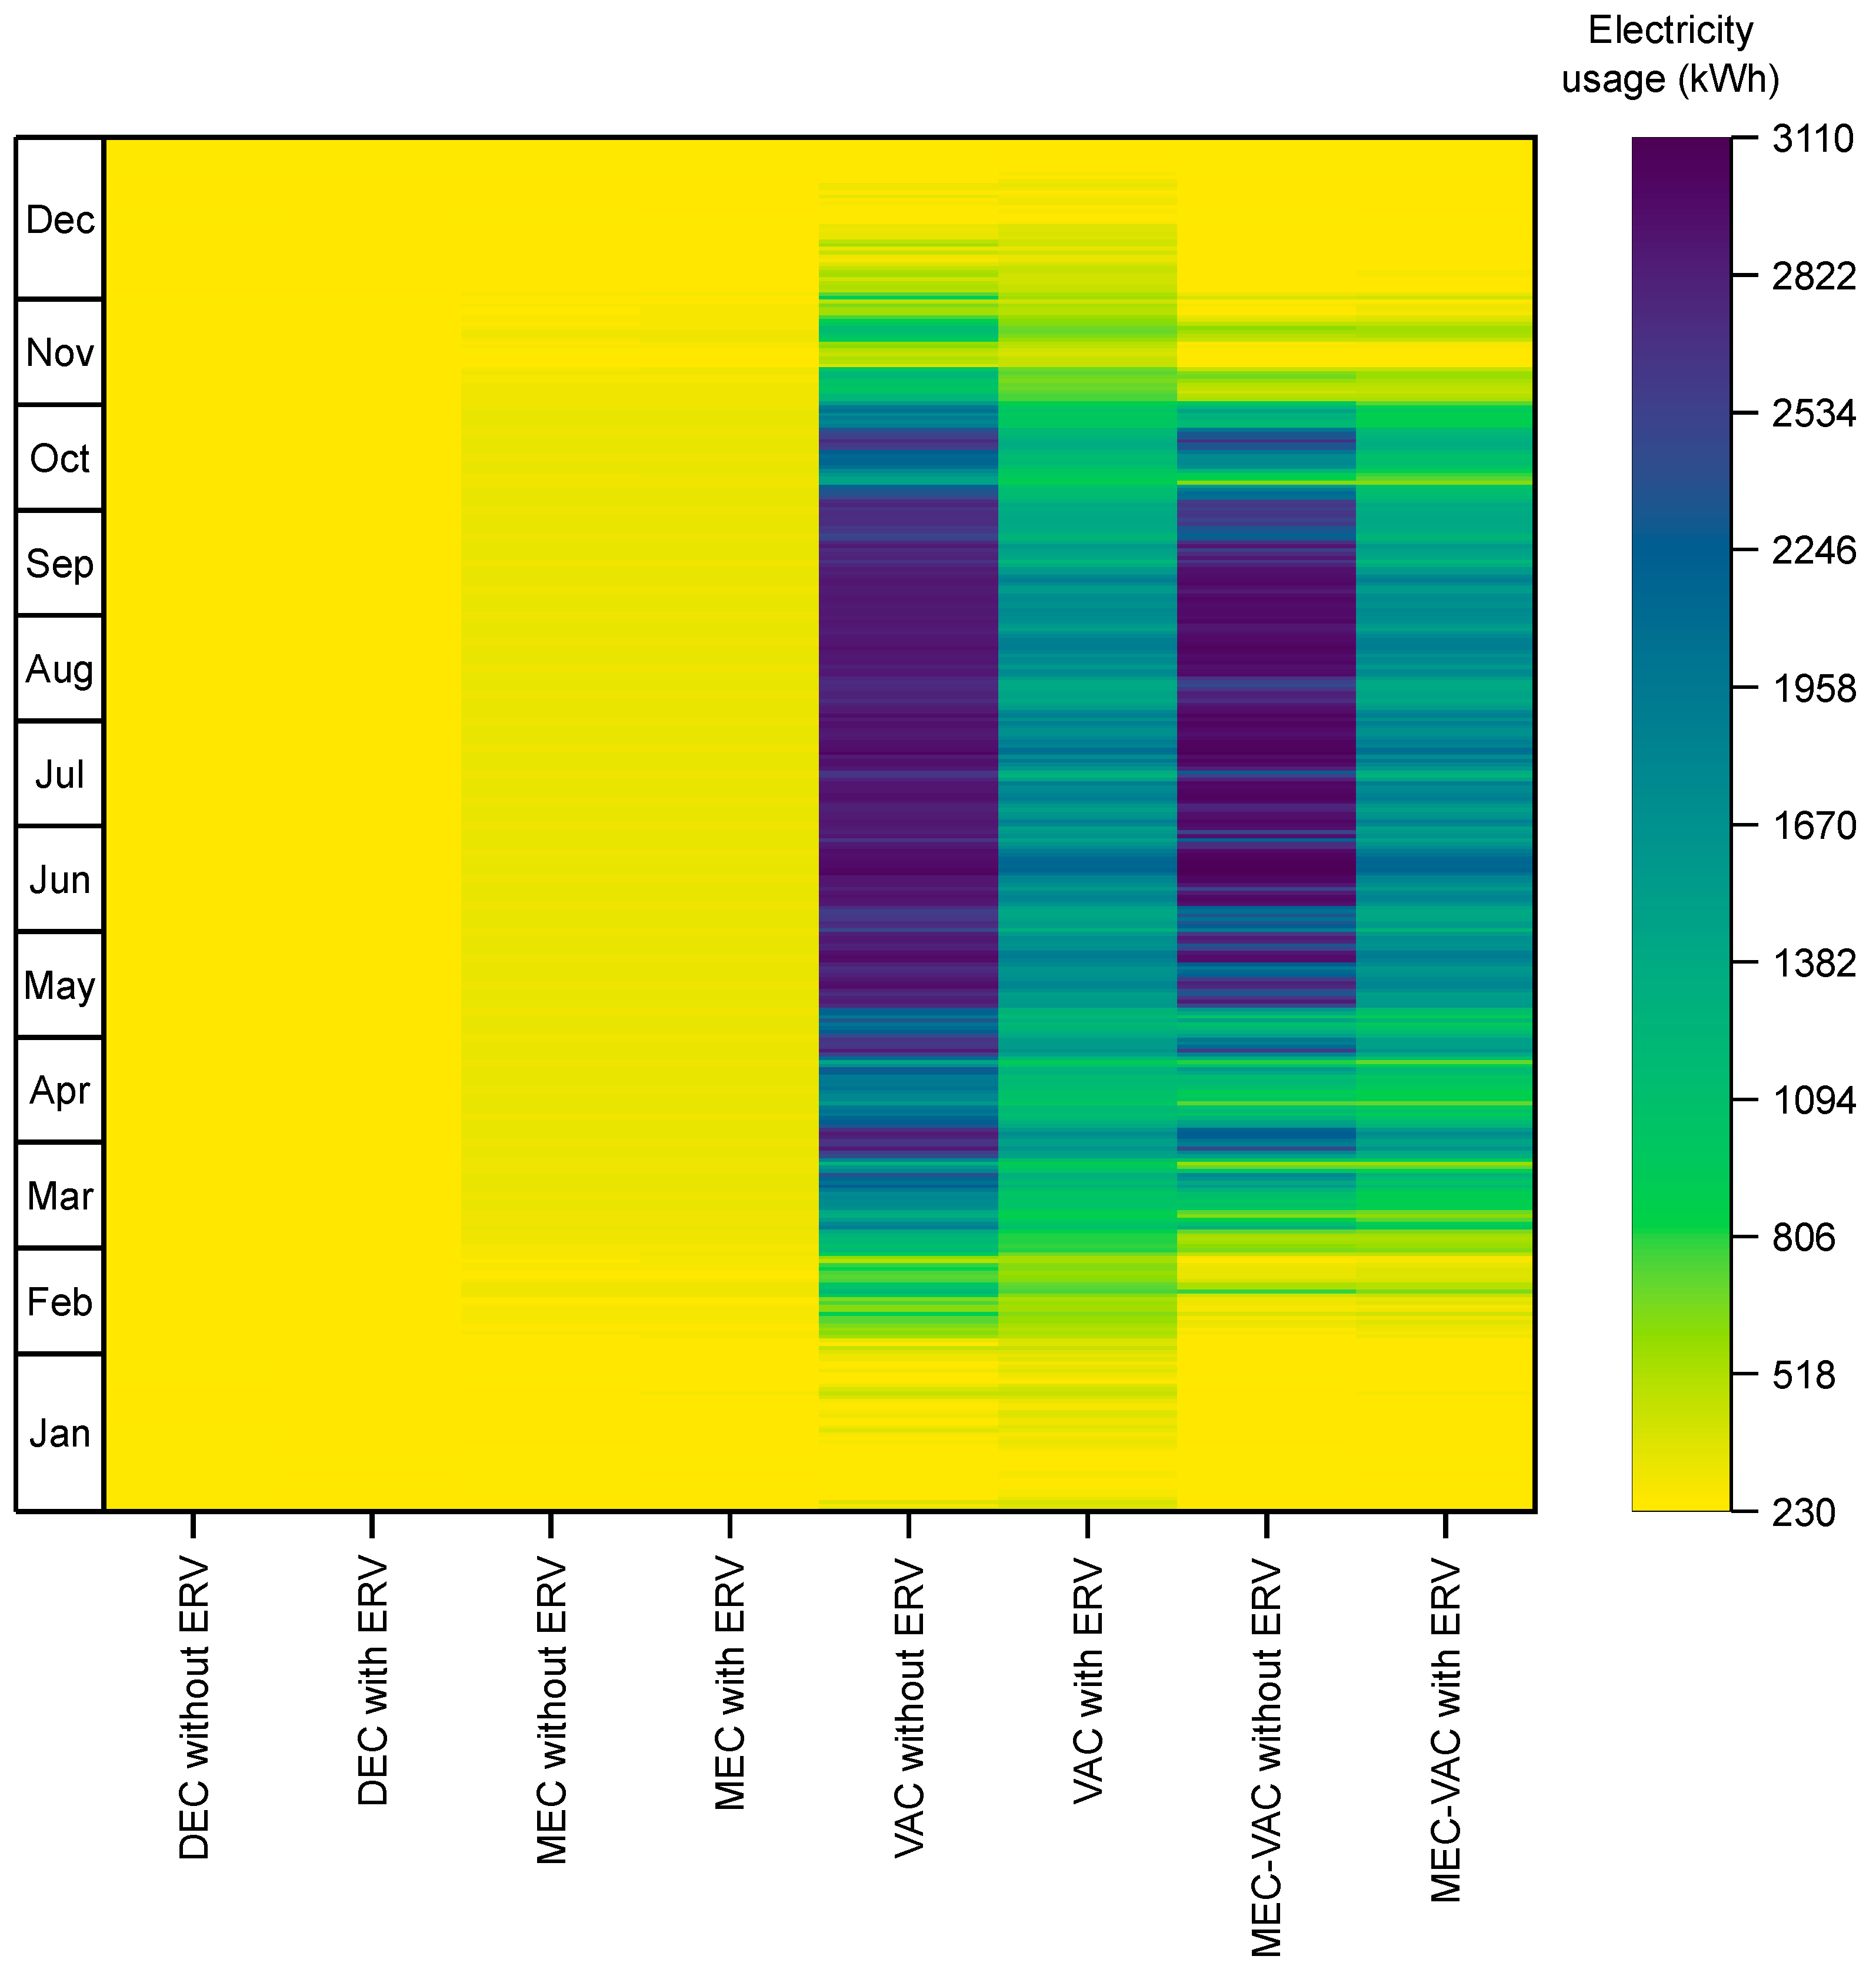
3.2.6. Electricity Consumption
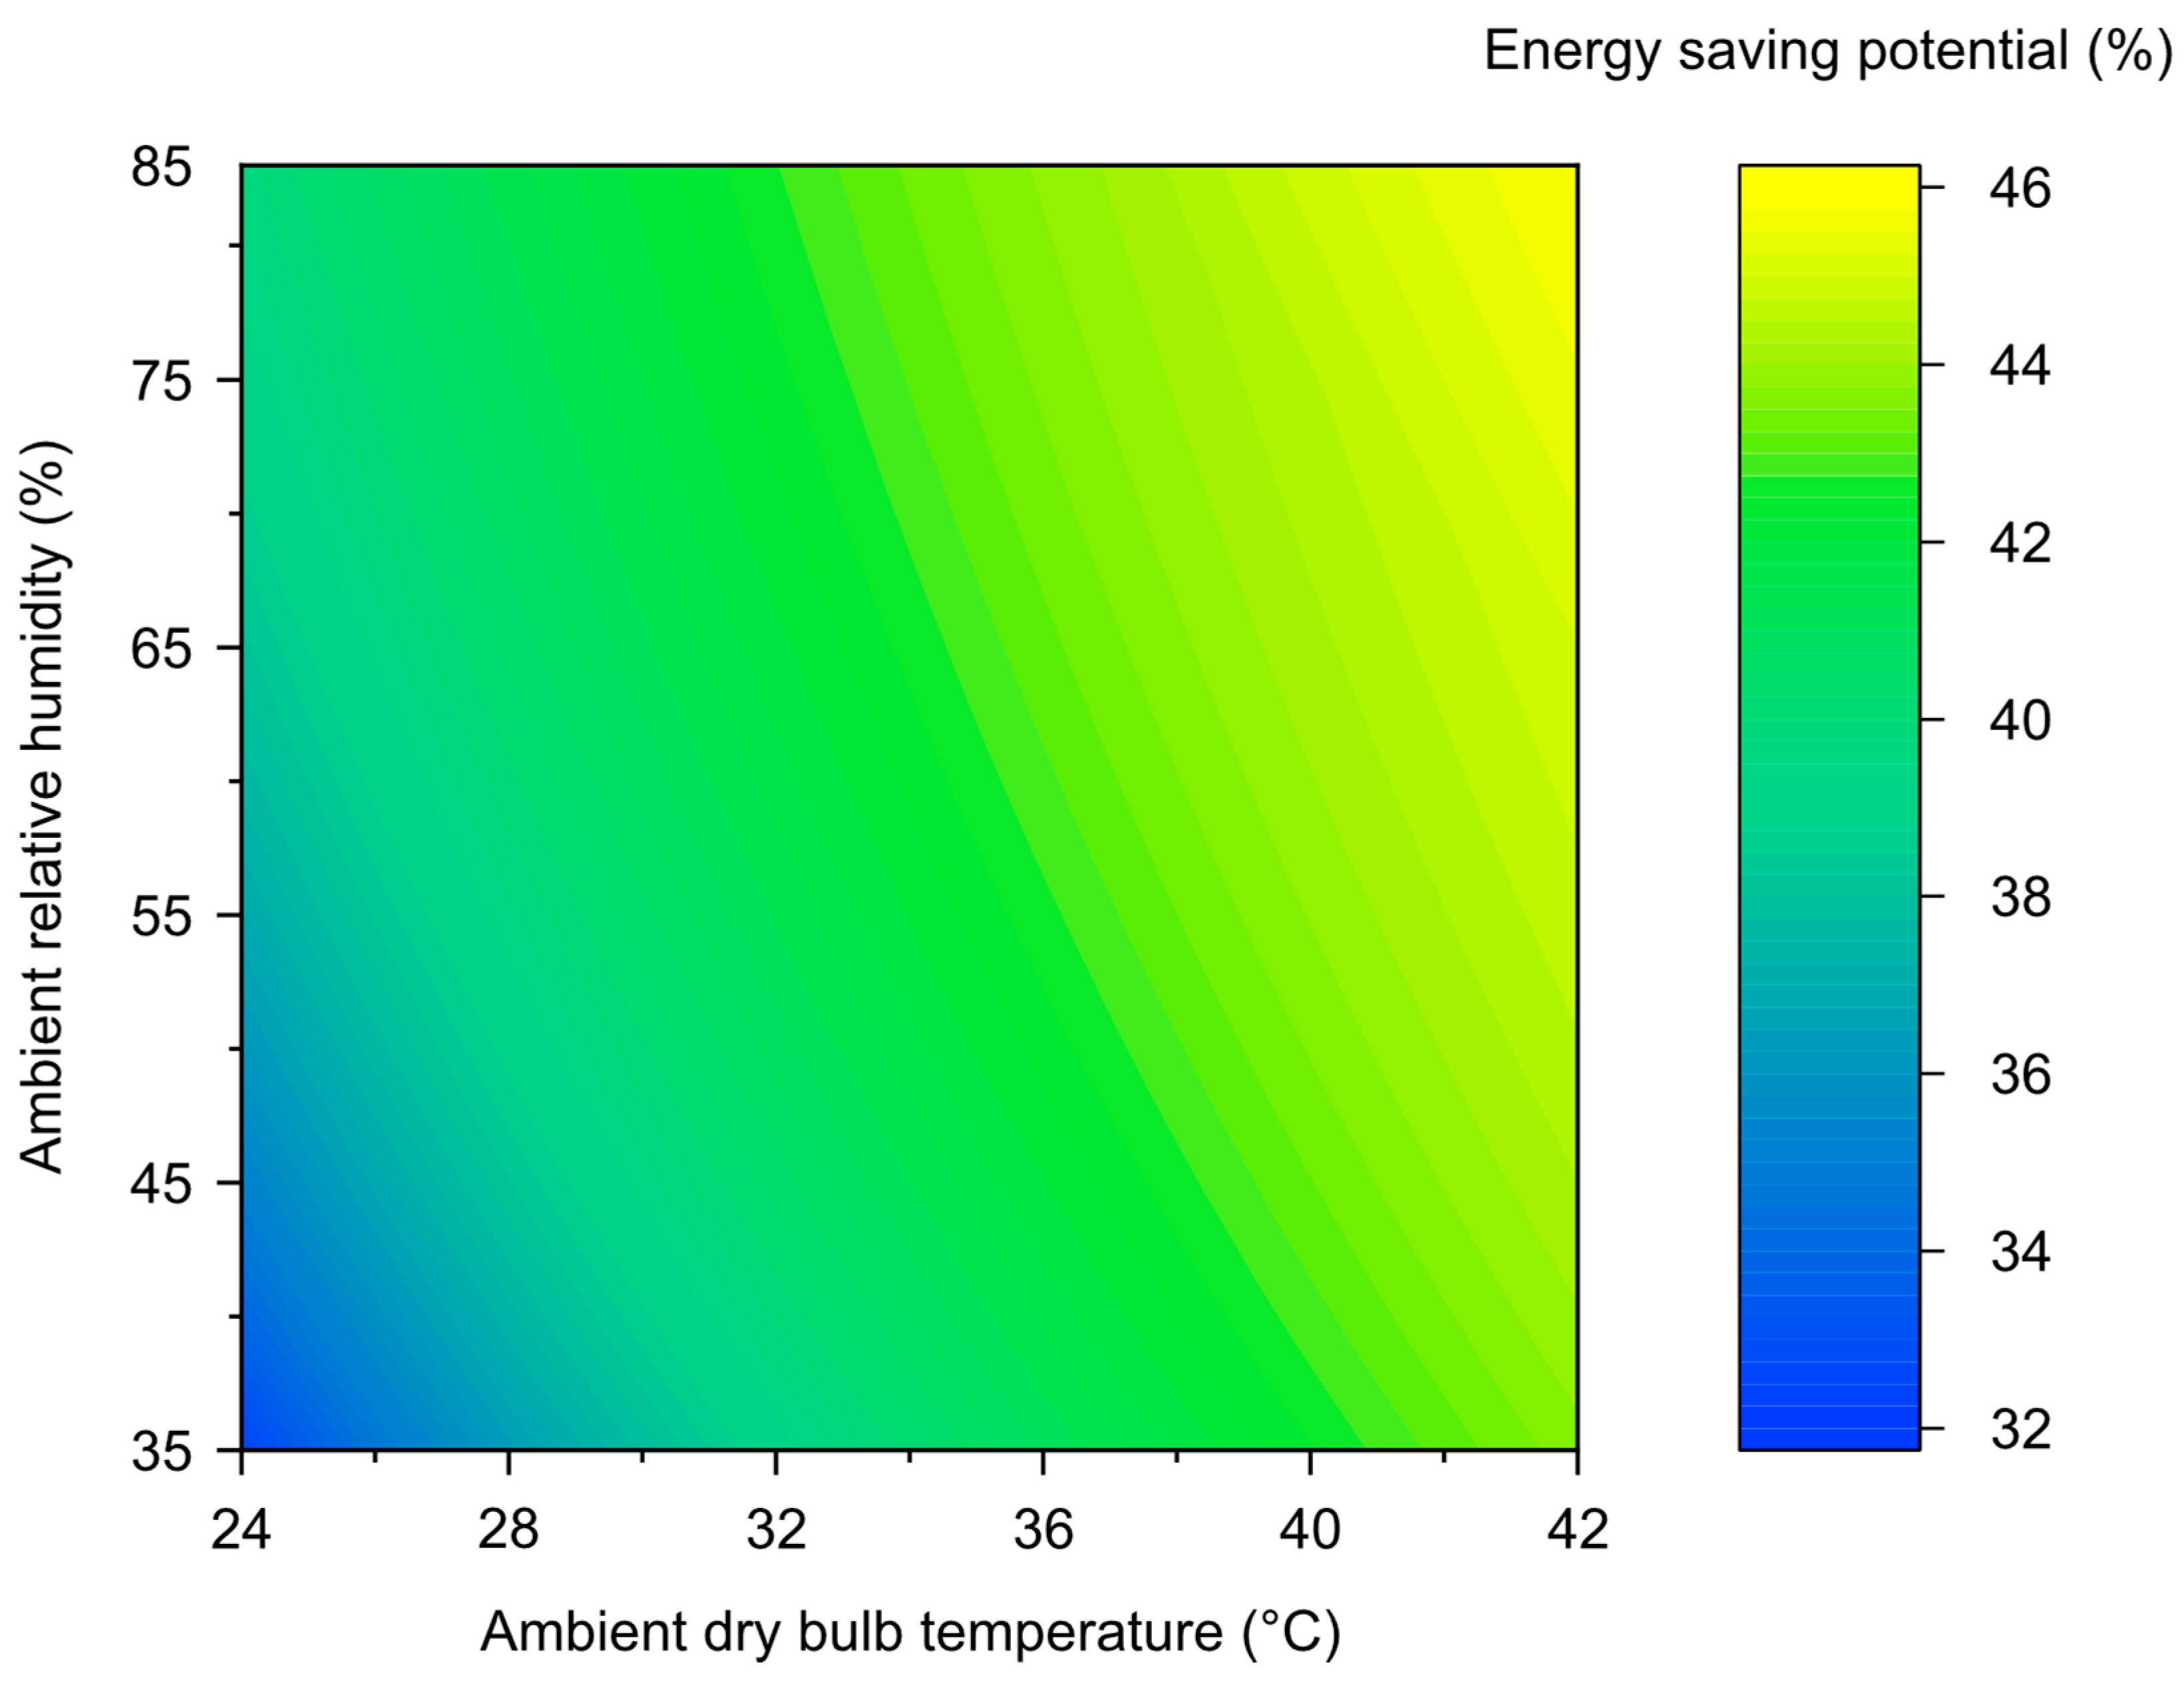
3.2.7. Energy Saving Potential
4. Conclusions
- The MEC-VAC system with the ERV and recirculation configuration provided a temperature gradient of 19.7 °C with average relative humidity of 49%, whereas other systems failed to compete in terms of the temperature gradient and relative humidity.
- All the systems except the MEC-VAC with the ERV and recirculation configuration failed to achieve the required mean radiant temperature, matching with their respective psychrometric performances.
- All the systems except the standalone evaporative cooling systems achieved slightly cool to extremely cool PMV with 20–98% PPD.
- The VAC with ERV and recirculation and MEC-VAC with ERV and recirculation systems achieved a maximum wet bulb effectiveness of 2.2 out of all the proposed systems.
- Among the studied systems, the standalone VAC system without the ERV and recirculation configuration resulted in the highest CO2 emissions, i.e., 878.5 kgCO2/kWh, whereas the MEC-VAC system with the ERV and recirculation configuration resulted in a relatively lower CO2 emission, i.e., 499.2 kgCO2/kWh.
Author Contributions
Funding
Institutional Review Board Statement
Informed Consent Statement
Data Availability Statement
Acknowledgments
Conflicts of Interest
References
- United Nations Environment Programme. 2021 Global Status Report for Buildings and Construction: Towards a Zero-Emission; United Nations Environment Programme: Nairobi, Kenya, 2021. [Google Scholar]
- International Energy Agency. World Energy Balances; International Energy Agency: Paris, France, 2021. [Google Scholar]
- European Commission. In Focus: Energy Efficiency in Buildings; European Commission: Brussels, Belgium, 2020.
- Beck, H.E.; Zimmermann, N.E.; McVicar, T.R.; Vergopolan, N.; Berg, A.; Wood, E.F. Present and Future Köppen-Geiger Climate Classification Maps at 1-Km Resolution. Sci. Data 2018, 5, 180214. [Google Scholar] [CrossRef] [PubMed] [Green Version]
- International Energy Agency Data and Statistics. Available online: https://www.iea.org/data-and-statistics (accessed on 12 December 2021).
- Noor, S.; Ashraf, H.; Sultan, M.; Khan, Z.M. Evaporative Cooling Options for Building Air-Conditioning: A Comprehensive Study for Climatic Conditions of Multan (Pakistan). Energies 2020, 13, 3061. [Google Scholar] [CrossRef]
- Harby, K.; Gebaly, D.R.; Koura, N.S.; Hassan, M.S. Performance Improvement of Vapor Compression Cooling Systems Using Evaporative Condenser: An Overview. Renew. Sustain. Energy Rev. 2016, 58, 347–360. [Google Scholar] [CrossRef]
- Ibrahim, N.I.; Al-Farayedhi, A.A.; Gandhidasan, P. Experimental Investigation of a Vapor Compression System with Condenser Air Pre-Cooling by Condensate. Appl. Therm. Eng. 2017, 110, 1255–1263. [Google Scholar] [CrossRef]
- Kojok, F.; Fardoun, F.; Younes, R.; Outbib, R. Hybrid Cooling Systems: A Review and an Optimized Selection Scheme. Renew. Sustain. Energy Rev. 2016, 65, 57–80. [Google Scholar] [CrossRef]
- Liu, Y.; Yang, X.; Li, J.; Zhao, X. Energy Savings of Hybrid Dew-Point Evaporative Cooler and Micro-Channel Separated Heat Pipe Cooling Systems for Computer Data Centers. Energy 2018, 163, 629–640. [Google Scholar] [CrossRef] [Green Version]
- Raza, H.M.U.; Ashraf, H.; Shahzad, K.; Sultan, M.; Miyazaki, T.; Usman, M.; Shamshiri, R.R.; Zhou, Y.; Ahmad, R. Investigating Applicability of Evaporative Cooling Systems for Thermal Comfort of Poultry Birds in Pakistan. Appl. Sci. 2020, 10, 4445. [Google Scholar] [CrossRef]
- Sultan, M.; Ashraf, H.; Miyazaki, T.; Shamshiri, R.R.; Hameed, I.A. Temperature and Humidity Control for the Next Generation Greenhouses: Overview of Desiccant and Evaporative Cooling Systems. In Next-Generation Greenhouses for Food Security; IntechOpen: London, UK, 2021. [Google Scholar]
- Noor, S.; Ashraf, H.; Sultan, M.; Miyazaki, T.; Mahmood, M.H.; Khan, Z.M. Investigation of Direct and Indirect Evaporative Cooling Options for Greenhouse Air Conditioning in Multan (Pakistan). In Proceedings of the International Exchange and Innovation Conference on Engineering & Sciences (IEICES), Fukuoka City, Japan, 22–23 October 2020; pp. 110–115. [Google Scholar]
- Noor, S.; Ashraf, H.; Hussain, G.; Sultan, M.; Miyazaki, T.; Shakoor, A.; Mahmood, M.H.; Riaz, M. Spatiotemporal Investigation of Evaporative Cooling Options for Greenhouse Air-Conditioning Application in Pakistan. Fresenius Environ. Bull. 2021, 30, 21. [Google Scholar]
- Ashraf, H.; Noor, S.; Sultan, M.; Khan, Z.M. Energy Saving Potential of Evaporative Cooling Systems Compared to Traditional Air Conditioners. In Proceedings of the International Conference on Mechanical Engineering—2020 (ICME-20), Lahore, Pakistan, 29–30 January 2020; UET: Lahore, Pakistan, 2020; pp. 75–81. [Google Scholar]
- Chun, L.; Gong, G.; Peng, P.; Wan, Y.; Chua, K.J.; Fang, X.; Li, W. Research on Thermodynamic Performance of a Novel Building Cooling System Integrating Dew Point Evaporative Cooling, Air-Carrying Energy Radiant Air Conditioning and Vacuum Membrane-Based Dehumidification (DAV-Cooling System). Energy Convers. Manag. 2021, 245, 114551. [Google Scholar] [CrossRef]
- Kowalski, P.; Kwiecień, D. Evaluation of Simple Evaporative Cooling Systems in an Industrial Building in Poland. J. Build. Eng. 2020, 32, 101555. [Google Scholar] [CrossRef]
- da Veiga, A.P.; Güths, S.; da Silva, A.K. Evaporative Cooling in Building Roofs: Theoretical Modeling and Experimental Validation (Part-1). Sol. Energy 2020, 207, 1122–1131. [Google Scholar] [CrossRef]
- da Veiga, A.P.; Güths, S.; da Silva, A.K. Evaporative Cooling in Building Roofs: Local Parametric and Global Analyses (Part-2). Sol. Energy 2020, 207, 1009–1020. [Google Scholar] [CrossRef]
- Tewari, P.; Mathur, S.; Mathur, J.; Kumar, S.; Loftness, V. Field Study on Indoor Thermal Comfort of Office Buildings Using Evaporative Cooling in the Composite Climate of India. Energy Build. 2019, 199, 145–163. [Google Scholar] [CrossRef]
- Kim, M.-H.; Jeong, J.-W. Cooling Performance of a 100% Outdoor Air System Integrated with Indirect and Direct Evaporative Coolers. Energy 2013, 52, 245–257. [Google Scholar] [CrossRef]
- Cui, X.; Chua, K.J.; Yang, W.M.; Ng, K.C.; Thu, K.; Nguyen, V.T. Studying the Performance of an Improved Dew-Point Evaporative Design for Cooling Application. Appl. Therm. Eng. 2014, 63, 624–633. [Google Scholar] [CrossRef]
- Velasco Gómez, E.; Tejero González, A.; Rey Martínez, F.J. Experimental Characterisation of an Indirect Evaporative Cooling Prototype in Two Operating Modes. Appl. Energy 2012, 97, 340–346. [Google Scholar] [CrossRef]
- Heidarinejad, G.; Moshari, S. Novel Modeling of an Indirect Evaporative Cooling System with Cross-Flow Configuration. Energy Build. 2015, 92, 351–362. [Google Scholar] [CrossRef]
- Cui, X.; Chua, K.J.; Yang, W.M. Numerical Simulation of a Novel Energy-Efficient Dew-Point Evaporative Air Cooler. Appl. Energy 2014, 136, 979–988. [Google Scholar] [CrossRef]
- Moshari, S.; Heidarinejad, G.; Fathipour, A. Numerical Investigation of Wet-Bulb Effectiveness and Water Consumption in One-and Two-Stage Indirect Evaporative Coolers. Energy Convers. Manag. 2016, 108, 309–321. [Google Scholar] [CrossRef]
- Cui, X.; Chua, K.J.; Islam, M.R.; Ng, K.C. Performance Evaluation of an Indirect Pre-Cooling Evaporative Heat Exchanger Operating in Hot and Humid Climate. Energy Convers. Manag. 2015, 102, 140–150. [Google Scholar] [CrossRef]
- Campisi, D.; Gitto, S.; Morea, D. An Evaluation of Energy and Economic Efficiency in Residential Buildings Sector: A Multi-Criteria Analisys on an Italian Case Study. Int. J. Energy Econ. Policy 2018, 8, 185–196. [Google Scholar]
- Obando, F.A.; Montoya, A.P.; Osorio, J.A.; Damasceno, F.A.; Norton, T. Evaporative Pad Cooling Model Validation in a Closed Dairy Cattle Building. Biosyst. Eng. 2020, 198, 147–162. [Google Scholar] [CrossRef]
- Badiei, A.; Akhlaghi, Y.G.; Zhao, X.; Li, J.; Yi, F.; Wang, Z. Can Whole Building Energy Models Outperform Numerical Models, When Forecasting Performance of Indirect Evaporative Cooling Systems? Energy Convers. Manag. 2020, 213, 112886. [Google Scholar] [CrossRef]
- Nada, S.A.; Elattar, H.F.; Mahmoud, M.A.; Fouda, A. Performance Enhancement and Heat and Mass Transfer Characteristics of Direct Evaporative Building Free Cooling Using Corrugated Cellulose Papers. Energy 2020, 211, 118678. [Google Scholar] [CrossRef]
- He, W.; Xilian, L.; Yuhui, S.; Min, Z.; Zhaolin, G. Research of Evaporative Cooling Experiment in Summer of Residential Buildings in Xi’an. Energy Procedia 2018, 152, 928–934. [Google Scholar] [CrossRef]
- Boukhanouf, R.; Amer, O.; Ibrahim, H.; Calautit, J. Design and Performance Analysis of a Regenerative Evaporative Cooler for Cooling of Buildings in Arid Climates. Build. Environ. 2018, 142, 1–10. [Google Scholar] [CrossRef]
- Zanchini, E.; Naldi, C. Energy Saving Obtainable by Applying a Commercially Available M-Cycle Evaporative Cooling System to the Air Conditioning of an Office Building in North Italy. Energy 2019, 179, 975–988. [Google Scholar] [CrossRef]
- Khandelwal, A.; Talukdar, P.; Jain, S. Energy Savings in a Building Using Regenerative Evaporative Cooling. Energy Build. 2011, 43, 581–591. [Google Scholar] [CrossRef]
- Ashraf, H.; Sultan, M.; Shamshiri, R.R.; Abbas, F.; Farooq, M.; Sajjad, U.; Md-Tahir, H.; Mahmood, M.H.; Ahmad, F.; Taseer, Y.R.; et al. Dynamic Evaluation of Desiccant Dehumidification Evaporative Cooling Options for Greenhouse Air-Conditioning Application in Multan (Pakistan). Energies 2021, 14, 1097. [Google Scholar] [CrossRef]
- Kottek, M.; Grieser, J.; Beck, C.; Rudolf, B.; Rubel, F. World Map of the Köppen-Geiger Climate Classification Updated. Meteorol. Zeitschrift 2006, 15, 259–263. [Google Scholar] [CrossRef]
- Gao, H.; Li, Z.; Qiu, S.; Yang, B.; Li, S.; Wen, Y. Energy Exchange Efficiency Prediction from Non-Linear Regression for Membrane-Based Energy-Recovery Ventilator Cores. Appl. Therm. Eng. 2021, 197, 117353. [Google Scholar] [CrossRef]
- Abadi, I.R.; Aminian, B.; Nasr, M.R.; Huizing, R.; Green, S.; Rogak, S. Experimental Investigation of Condensation in Energy Recovery Ventilators. Energy Build. 2022, 256, 111732. [Google Scholar] [CrossRef]
- Huang, S.; Li, W.; Lu, J.; Li, Y. Experimental Study on Two Type of Indirect Evaporative Cooling Heat Recovery Ventilator. Procedia Eng. 2017, 205, 4105–4110. [Google Scholar] [CrossRef]
- Chen, Y.; Luo, Y.; Yang, H. Fresh Air Pre-Cooling and Energy Recovery by Using Indirect Evaporative Cooling in Hot and Humid Region—A Case Study in Hong Kong. Energy Procedia 2014, 61, 126–130. [Google Scholar] [CrossRef] [Green Version]
- Qiu, S.; Li, S.; Wang, F.; Wen, Y.; Li, Z.; Li, Z.; Guo, J. An Energy Exchange Efficiency Prediction Approach Based on Multivariate Polynomial Regression for Membrane-Based Air-to-Air Energy Recovery Ventilator Core. Build. Environ. 2019, 149, 490–500. [Google Scholar] [CrossRef]
- Zhong, X.; Wu, W.; Ridley, I.A. Assessing the Energy and Indoor-PM2.5-Exposure Impacts of Control Strategies for Residential Energy Recovery Ventilators. J. Build. Eng. 2020, 29, 101137. [Google Scholar] [CrossRef]
- Rasouli, M.; Simonson, C.J.; Besant, R.W. Applicability and Optimum Control Strategy of Energy Recovery Ventilators in Different Climatic Conditions. Energy Build. 2010, 42, 1376–1385. [Google Scholar] [CrossRef]
- Zhou, Y.P.; Wu, J.Y.; Wang, R.Z. Performance of Energy Recovery Ventilator with Various Weathers and Temperature Set-Points. Energy Build. 2007, 39, 1202–1210. [Google Scholar] [CrossRef]
- Designbuilder Software Ltd. DesignBuilder 6.1; DesignBuilder: Gloucestershire, UK, 2021. [Google Scholar]
- U.S. Department of Energy (DOE); National Renewable Energy Laboratory (NREL). EnergyPlus 9.3; National Renewable Energy Laboratory (NREL): Golden, CO, USA, 2020.
- Sheldon, R.A. Fundamentals of Green Chemistry: Efficiency in Reaction Design. Chem. Soc. Rev. 2012, 41, 1437–1451. [Google Scholar] [CrossRef] [Green Version]
- Akbari, H.; Havenith, G.; Al-Sahhaf, A. A Database of Static Clothing Thermal Insulation and Vapor Permeability Values of Non-Western Ensembles for Use in ASHRAE Standard 55, ISO 7730, and ISO 9920: Discussion. ASHRAE Conf. 2015, 121, 215. [Google Scholar]
- Fanger, P.O. Thermal Comfort: Analysis and Applications in Environmental Engineering, 1st ed.; Danish Technical Press: Copenhagen, Denmark, 1970; ISBN 9780070199156. [Google Scholar]
- ISO 7730; Ergonomics of the Thermal Environment—Analytical Determination and Interpretation of Thermal Comfort Using Calculation of the PMV and PPD Indices and Local Thermal Comfort Criteria. International Standardization Organization: Geneva, Switzerland, 2005.
- CORE. Energy Recovery Solutions Core M-ERV250. Available online: https://core.life/en/resources/spec/m-erv250/ (accessed on 10 October 2021).
- Raza, H.M.U. Investigation of Evaporative Cooling Based Low-Cost Air-Conditioning Technologies for Pakistan. Ph.D. Thesis, Agricultural Engineering, Bahauddin Zakariya University, Multan, Pakistan, 2018. [Google Scholar]
- ASHRAE. ASHRAE Handbook—Fundamentals (SI); American Society of Heating, Refrigerating and Air-Conditioning Engineers: Atlanta, GA, USA, 2017. [Google Scholar]
- Yousuf, I.; Ghumman, A.R.; Hashmi, H.N.; Kamal, M.A. Carbon Emissions from Power Sector in Pakistan and Opportunities to Mitigate Those. Renew. Sustain. Energy Rev. 2014, 34, 71–77. [Google Scholar] [CrossRef]


| Building Construction Information | ||
|---|---|---|
| Type | Details | Properties |
| Wall 1st layer | Brickwork outer | 4 in |
| Wall 2nd layer | Cement | 0.5 in |
| Wall 3rd layer | Brickwork inner | 4 in |
| Wall 4th layer | Cement | 0.5 in |
| Flat roof Layer 1 | Concrete at R 0.0625/in | 0.5 in |
| Flat roof Layer 2 | Cement | 0.5 in |
| Floor 1st layer | Concrete aggregate at R 0.0625/in | 2 in |
| Floor 2nd layer | Cast concrete (dense) | 5 in |
| Window | Clear | 0.118 in |
| Dimensions | W H | 59.84 in 72.04 in |
| Sill height | 48.03 in | |
| Panels | 3 | |
| Frame: Aluminum (no insulation break) | ||
| Frame width | 1.5 in | |
| Area of the building | 3251.74 m2 | |
| Area of conditioned space | 847.5 m2 | |
| Zones in conditioned space | 24/47 (excluded zones include corridors, kitchen, and washrooms.) | |
| Lighting power density fractions | Visible Radiant | 0.2 0.7 |
| Population | Person population Metabolic factor | 0.295 persons/conditioned area 0.9 |
| Schedule | Workday schedule | On at: 08:00 Off at: 16:00 |
| Workdays/week | 5 | |
| Clothing | Winter Summer Typical Pakistani wear (Shalwar Kameez) [48,49] | 1.145 clo 0.775 clo |
| Fan | Total efficiency | 75% |
| Motor efficiency | 85% | |
| Fan pressure | 600 Pa | |
| Motor in air stream (draw through system) | Yes | |
| AHU information | ||
| ERV | Type Design Sensile effectiveness Design Latent effectiveness Silica-PE substrate Silica-PE substrate permeability (at 50 °C, 50% RH) Silica-PE substrate density Silica-PE substrate thickness Silica-PE thermal conductivity PU-PEO coating film PU-PEO coating permeability (at 50 °C, 50% RH) PU-PEO coating density PU-PEO coating thickness PU-PEO thermal conductivity | Counterflow 0.75 0.65 105 μm 6.2 × 10⁻¹⁰ mol·m/m2/s/Pa 600 kg/m3 105 × 10−6 m 0.44 W/m/k 1.8 × 10⁻¹¹ mol·m/m2/s/Pa 1210 kg/m3 2 × 10⁻⁶ m 0.159 W/m/k |
| VAC | VAC rated COP Coil type Condenser type Rated evaporator fan power per volume flow rate Operation | 3 Single speed Air cooled 773.3 W/m3/s On sensible load |
| DEC | Direct research special module Design wet bulb effectiveness Water pump power sizing factor | 0.90 90.0 W/m3/s |
| MEC | Indirect research special module Design wet bulb effectiveness Design dewpoint effectiveness Water pump power sizing factor | 1.06 0.75 90.0 W/m3/s |
| Recirculation Thermostat Humidistat | Varies in zones based on cooling load requirement | 0.64 (average) 24 °C 60% |
| Temperature Gradient (°C) | Relative Humidity (%) | MRT (°C) | PMV (-) | PPD (%) | CO2 Emissions (kgCO2/kWh) | WBE (-) | Electricity Consumption (kWh/day) | ||||||
|---|---|---|---|---|---|---|---|---|---|---|---|---|---|
| Max. | Avg. | Max. | Avg. | Max. | Avg. | Range | Avg. | Max. | Max. | Avg. | |||
| DEC w/o ERV | 9.2 | 4.7 | 92 | 76 | 36.1 | 32.3 | −2.43–3.43 | 17.6–96.7 | 50 | 134.5 | 0.55 | 281.6 | 266.5 |
| DEC w/ERV | 5.9 | 2.3 | 95 | 85 | 36.9 | 33.4 | −0.89–3.0 | 17.6–96.7 | 50 | 135.6 | 0.31 | 281.5 | 268.6 |
| MEC w/o ERV | 10.8 | 5.5 | 89 | 65 | 36.0 | 32.0 | −2.84–3.0 | 13.4–94.5 | 46.3 | 159.2 | 0.65 | 354.6 | 315.3 |
| MEC w/ERV | 10.4 | 5.4 | 90 | 66 | 35.8 | 32.5 | −2.77–3.0 | 14.4–94.0 | 45.7 | 160.2 | 0.64 | 354.6 | 317.4 |
| VAC w/o ERV | 13.4 | 9.3 | 86 | 68 | 34.2 | 30.2 | −3.0–1.39 | 14.4–98.8 | 54.0 | 878.5 | 1.27 | 3018.6 | 1739.7 |
| VAC w/ERV | 19.7 | 13.2 | 60 | 48 | 29.6 | 28.2 | −2.28–−3.0 | 84.6–99.5 | 98.7 | 538.1 | 2.2 | 2176.6 | 1065.7 |
| MEC-VAC w/o ERV | 16.6 | 10.7 | 86 | 68 | 33.5 | 29.5 | 0.71–−3.0 | 9.4–99.3 | 67.2 | 749.5 | 1.46 | 3106.7 | 1484.2 |
| MEC-VAC w/ERV | 19.8 | 13.2 | 60 | 48 | 31.9 | 29.6 | −2.2–−3.0 | 83.2–99.5 | 98.7 | 499.2 | 2.2 | 2176.6 | 988.5 |
Publisher’s Note: MDPI stays neutral with regard to jurisdictional claims in published maps and institutional affiliations. |
© 2022 by the authors. Licensee MDPI, Basel, Switzerland. This article is an open access article distributed under the terms and conditions of the Creative Commons Attribution (CC BY) license (https://creativecommons.org/licenses/by/4.0/).
Share and Cite
Ashraf, H.; Sultan, M.; Sajjad, U.; Shahzad, M.W.; Farooq, M.; Ibrahim, S.M.; Khan, M.U.; Jamil, M.A. Potential Investigation of Membrane Energy Recovery Ventilators for the Management of Building Air-Conditioning Loads. Energies 2022, 15, 2139. https://doi.org/10.3390/en15062139
Ashraf H, Sultan M, Sajjad U, Shahzad MW, Farooq M, Ibrahim SM, Khan MU, Jamil MA. Potential Investigation of Membrane Energy Recovery Ventilators for the Management of Building Air-Conditioning Loads. Energies. 2022; 15(6):2139. https://doi.org/10.3390/en15062139
Chicago/Turabian StyleAshraf, Hadeed, Muhammad Sultan, Uzair Sajjad, Muhammad Wakil Shahzad, Muhammad Farooq, Sobhy M. Ibrahim, Muhammad Usman Khan, and Muhammad Ahmad Jamil. 2022. "Potential Investigation of Membrane Energy Recovery Ventilators for the Management of Building Air-Conditioning Loads" Energies 15, no. 6: 2139. https://doi.org/10.3390/en15062139
APA StyleAshraf, H., Sultan, M., Sajjad, U., Shahzad, M. W., Farooq, M., Ibrahim, S. M., Khan, M. U., & Jamil, M. A. (2022). Potential Investigation of Membrane Energy Recovery Ventilators for the Management of Building Air-Conditioning Loads. Energies, 15(6), 2139. https://doi.org/10.3390/en15062139