
Thermal and Mechanical Characterisation of Sandwich Core Materials for Climatic Chamber Shells Subjected to High Temperatures


Abstract
:1. Introduction
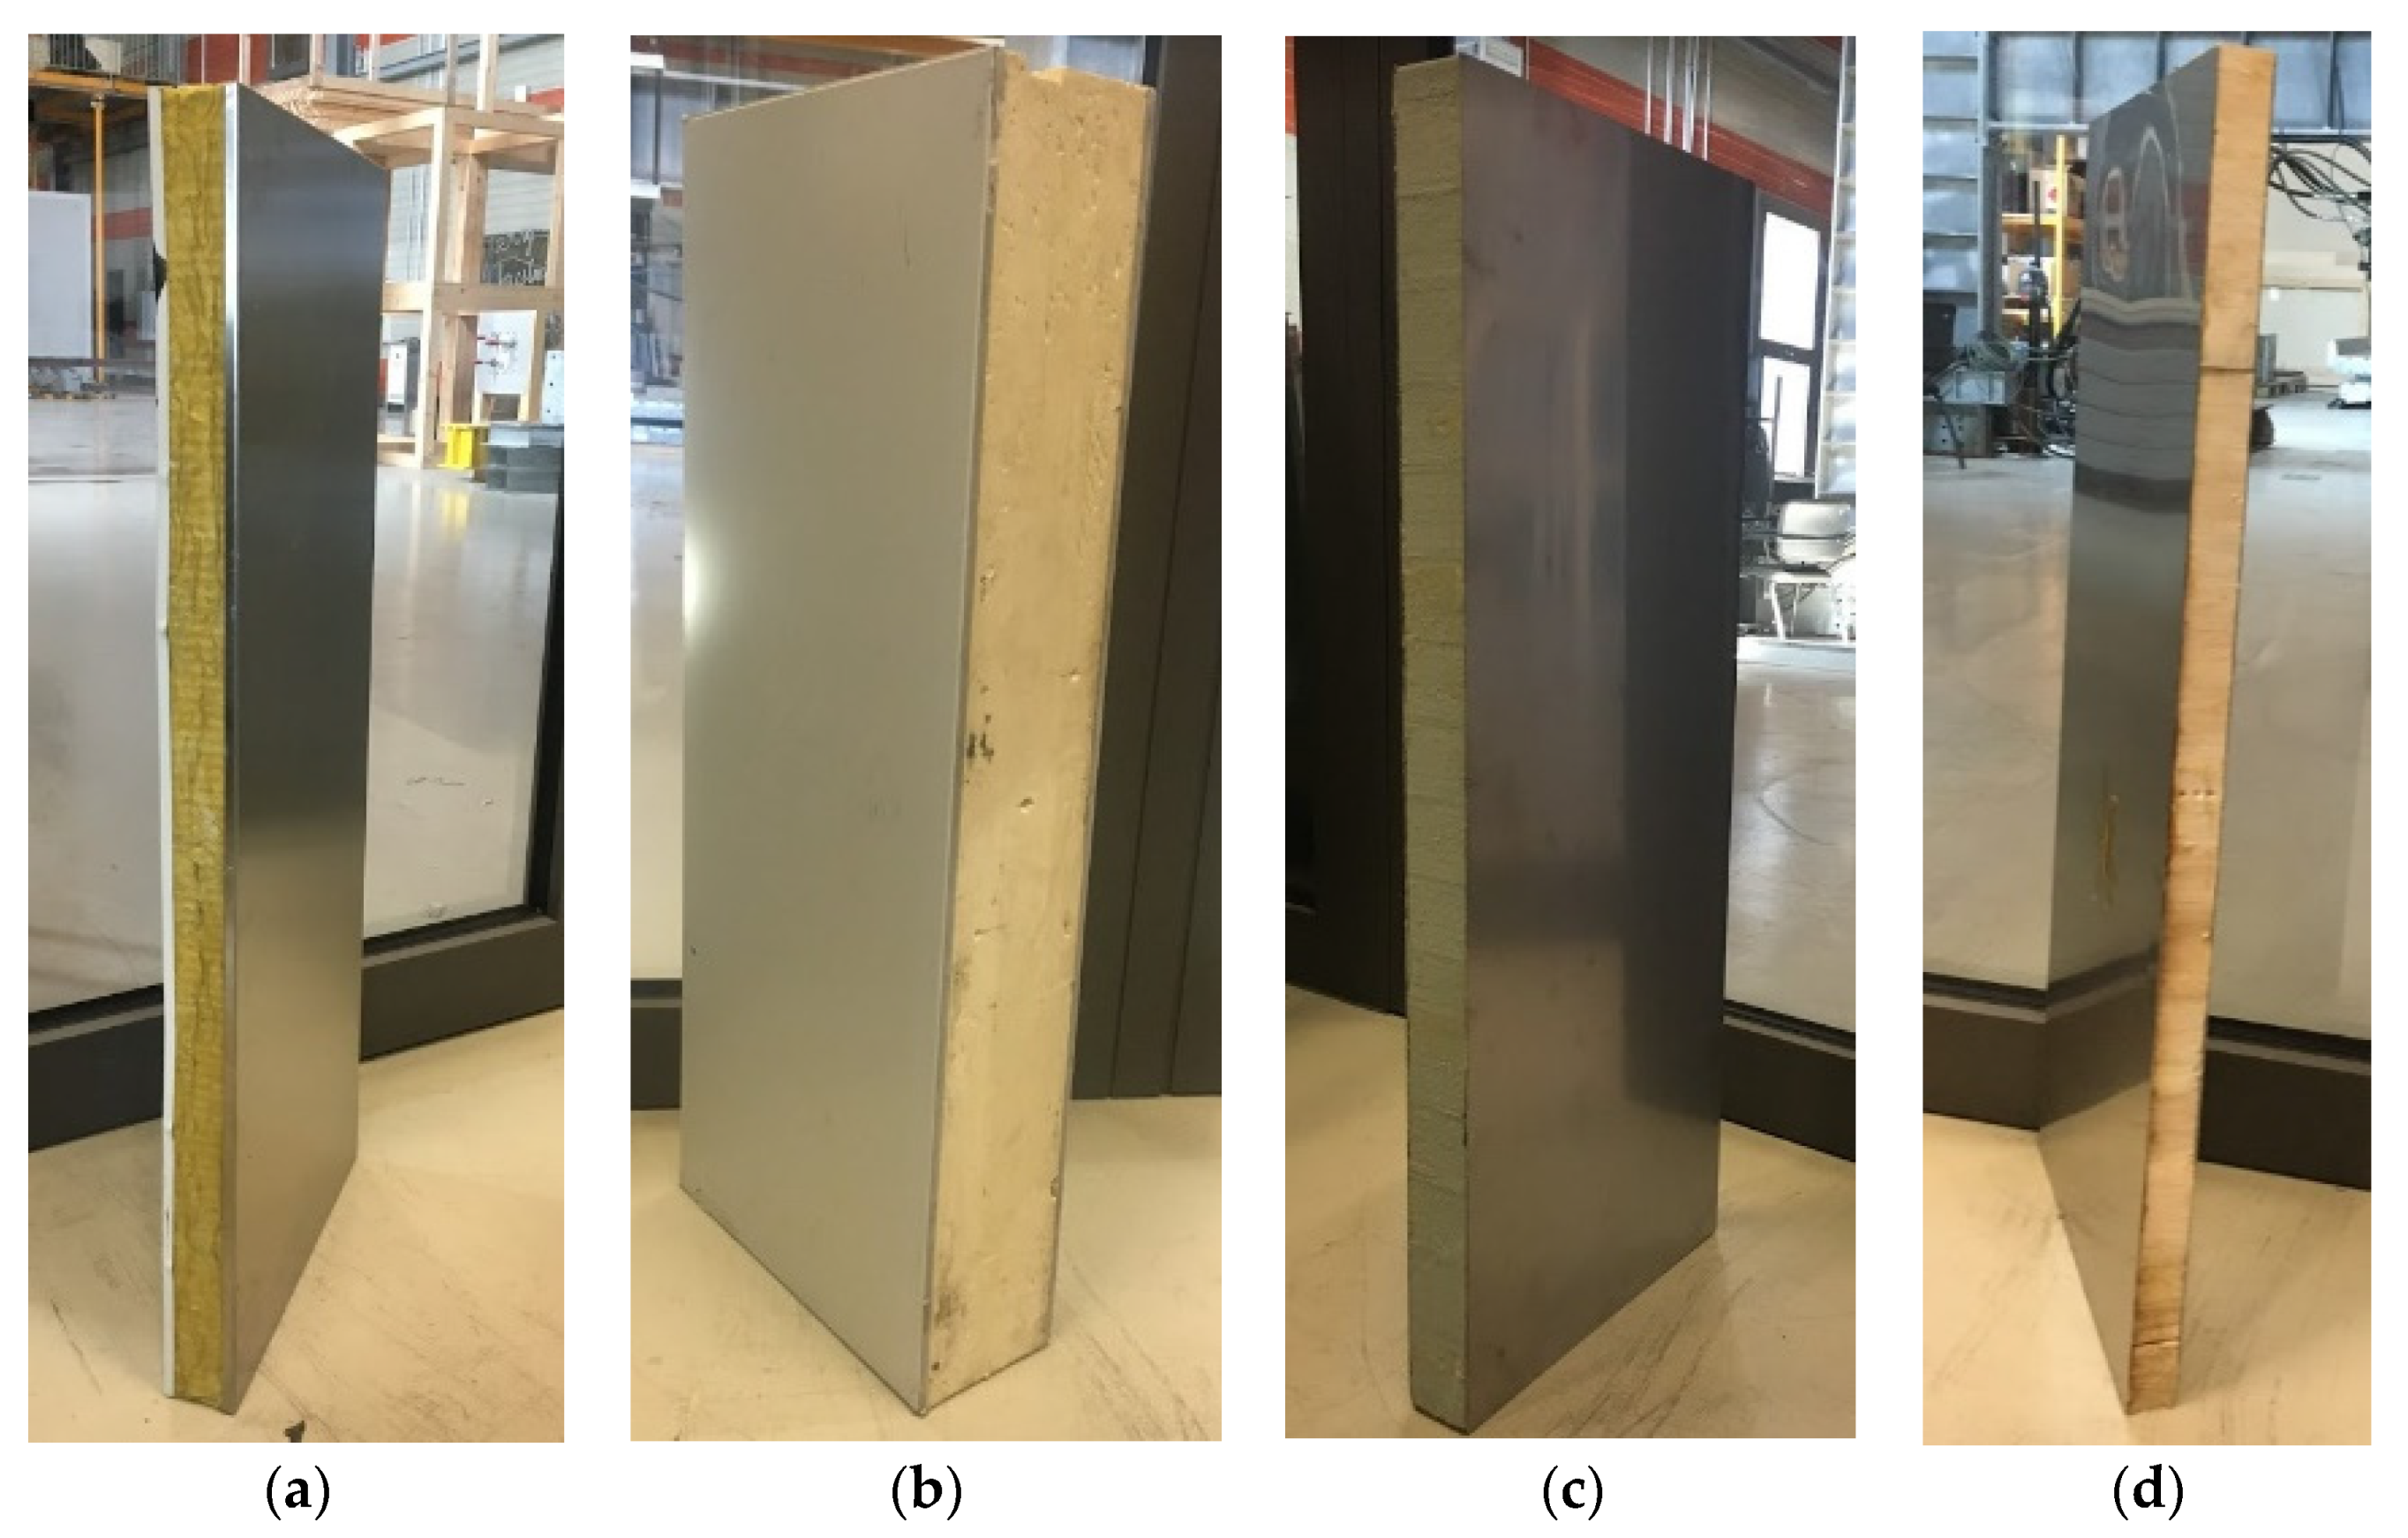
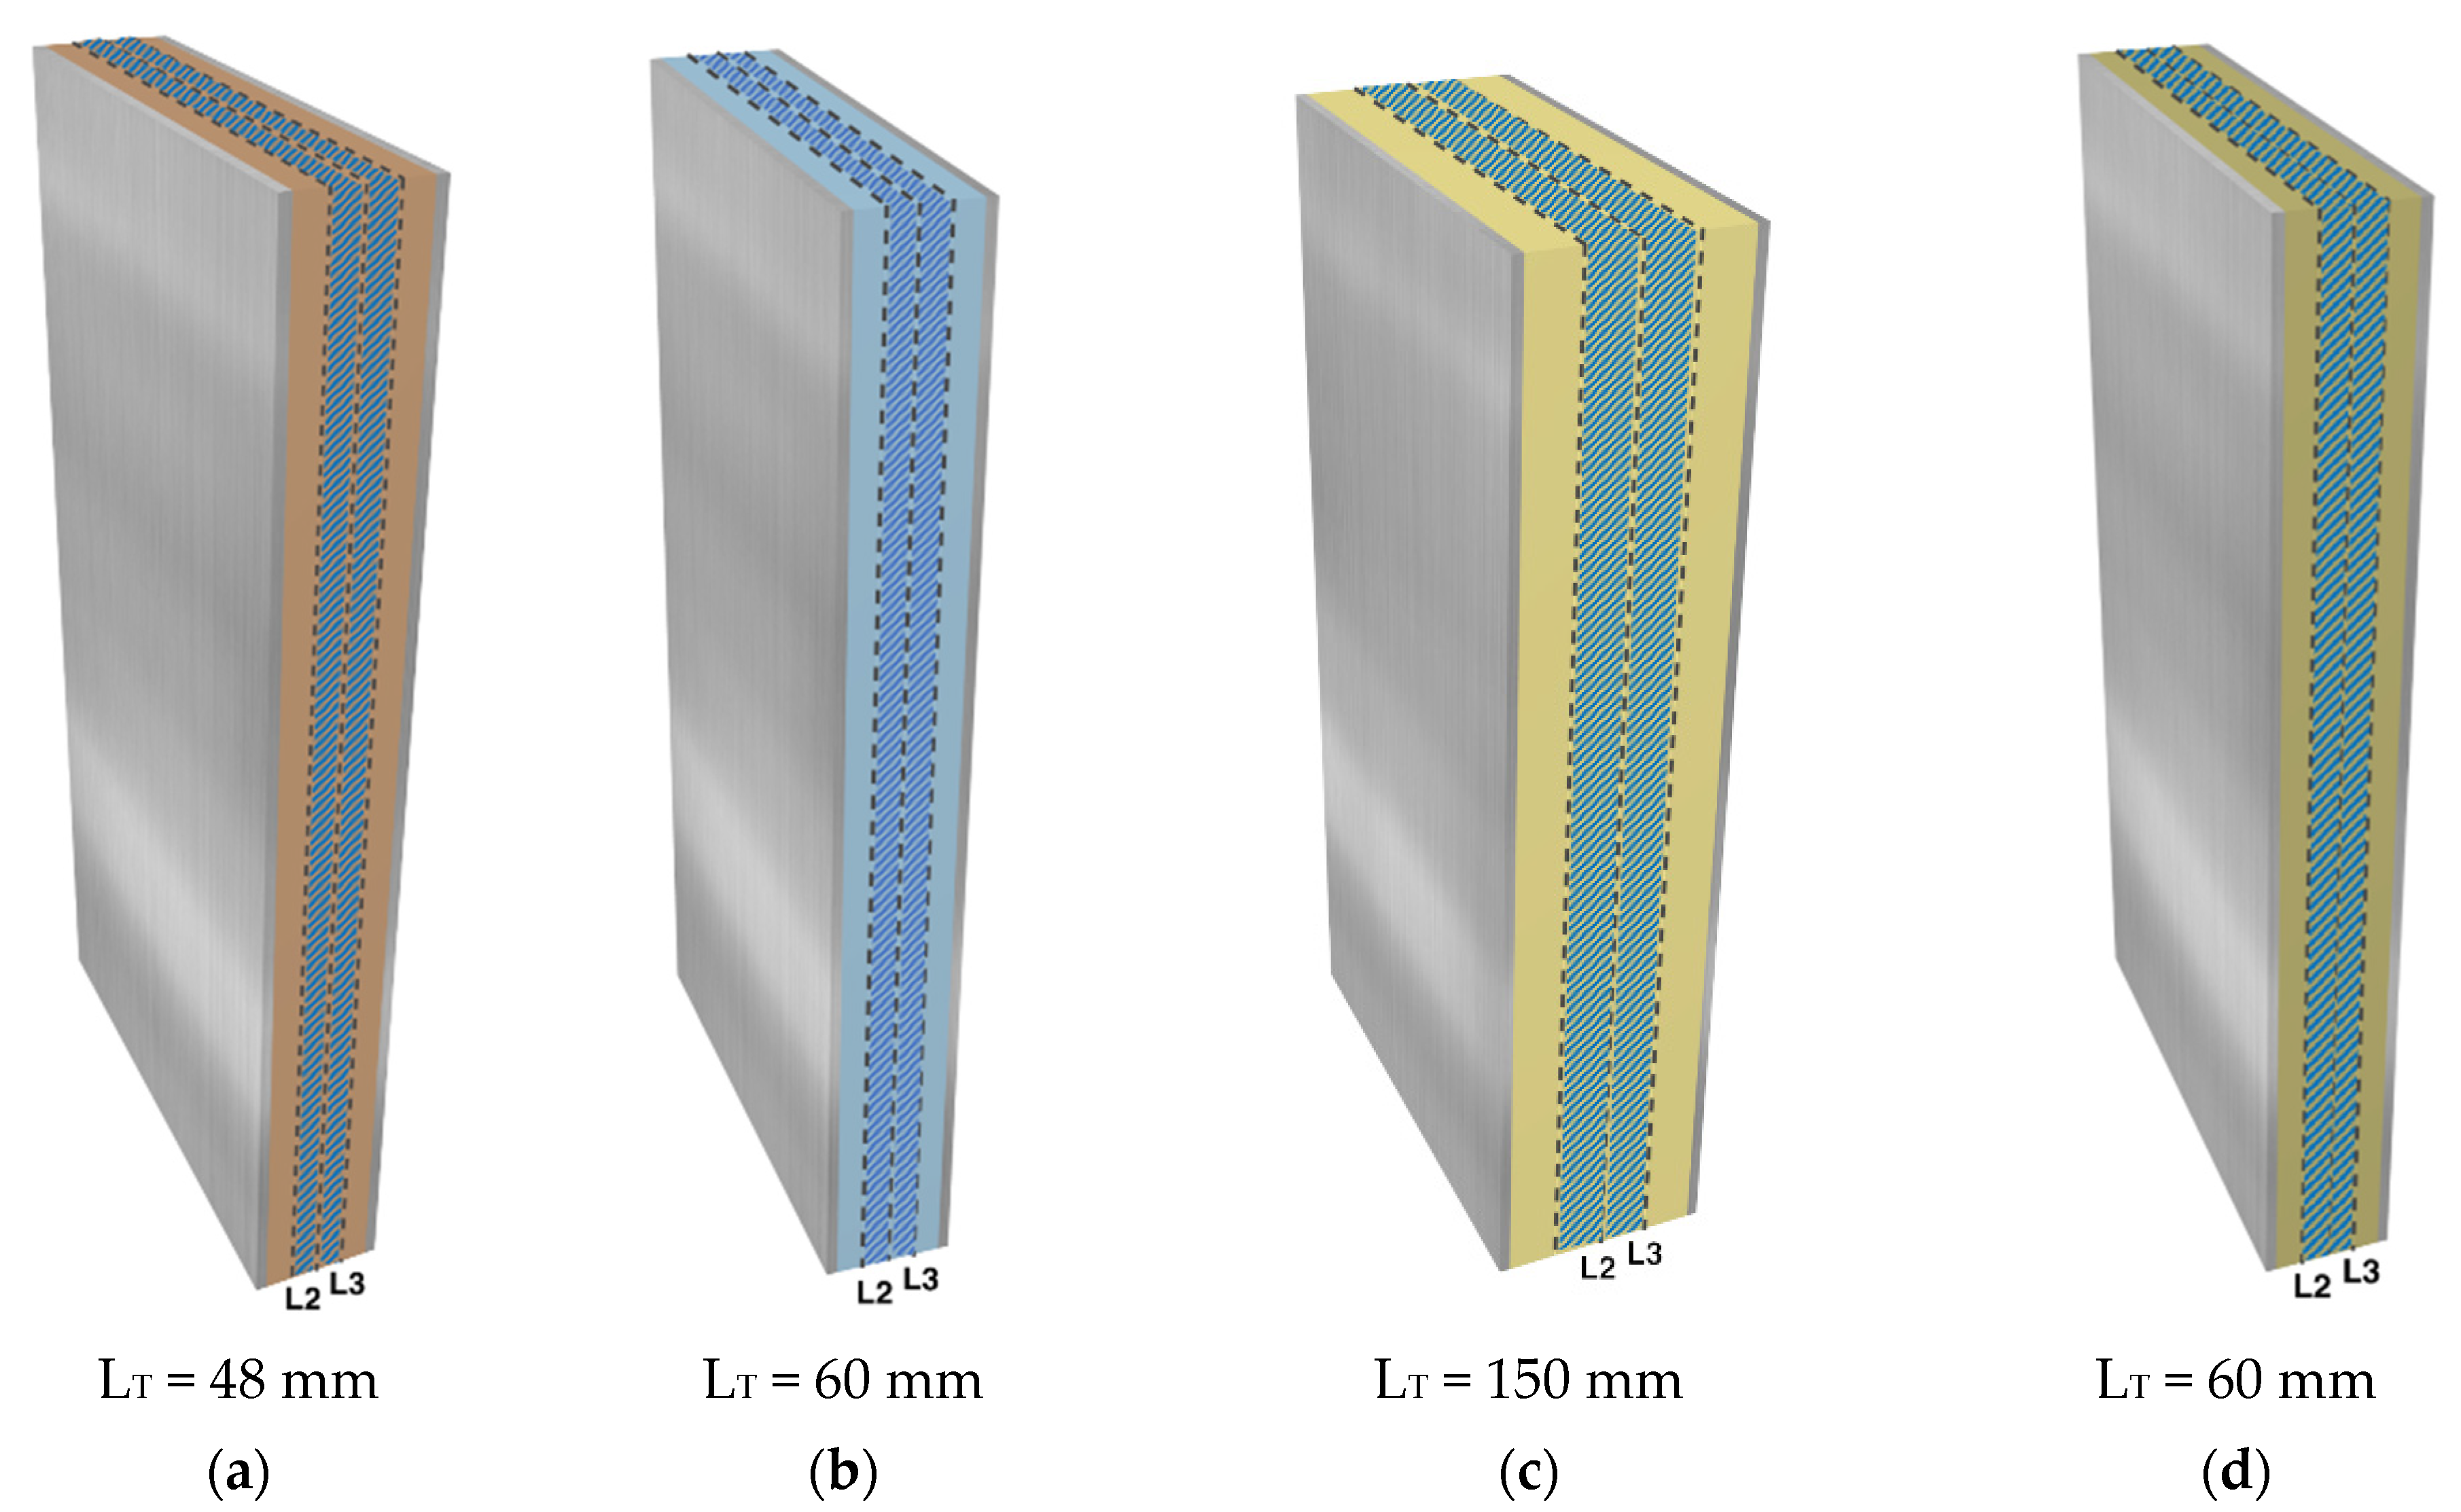
2. Materials
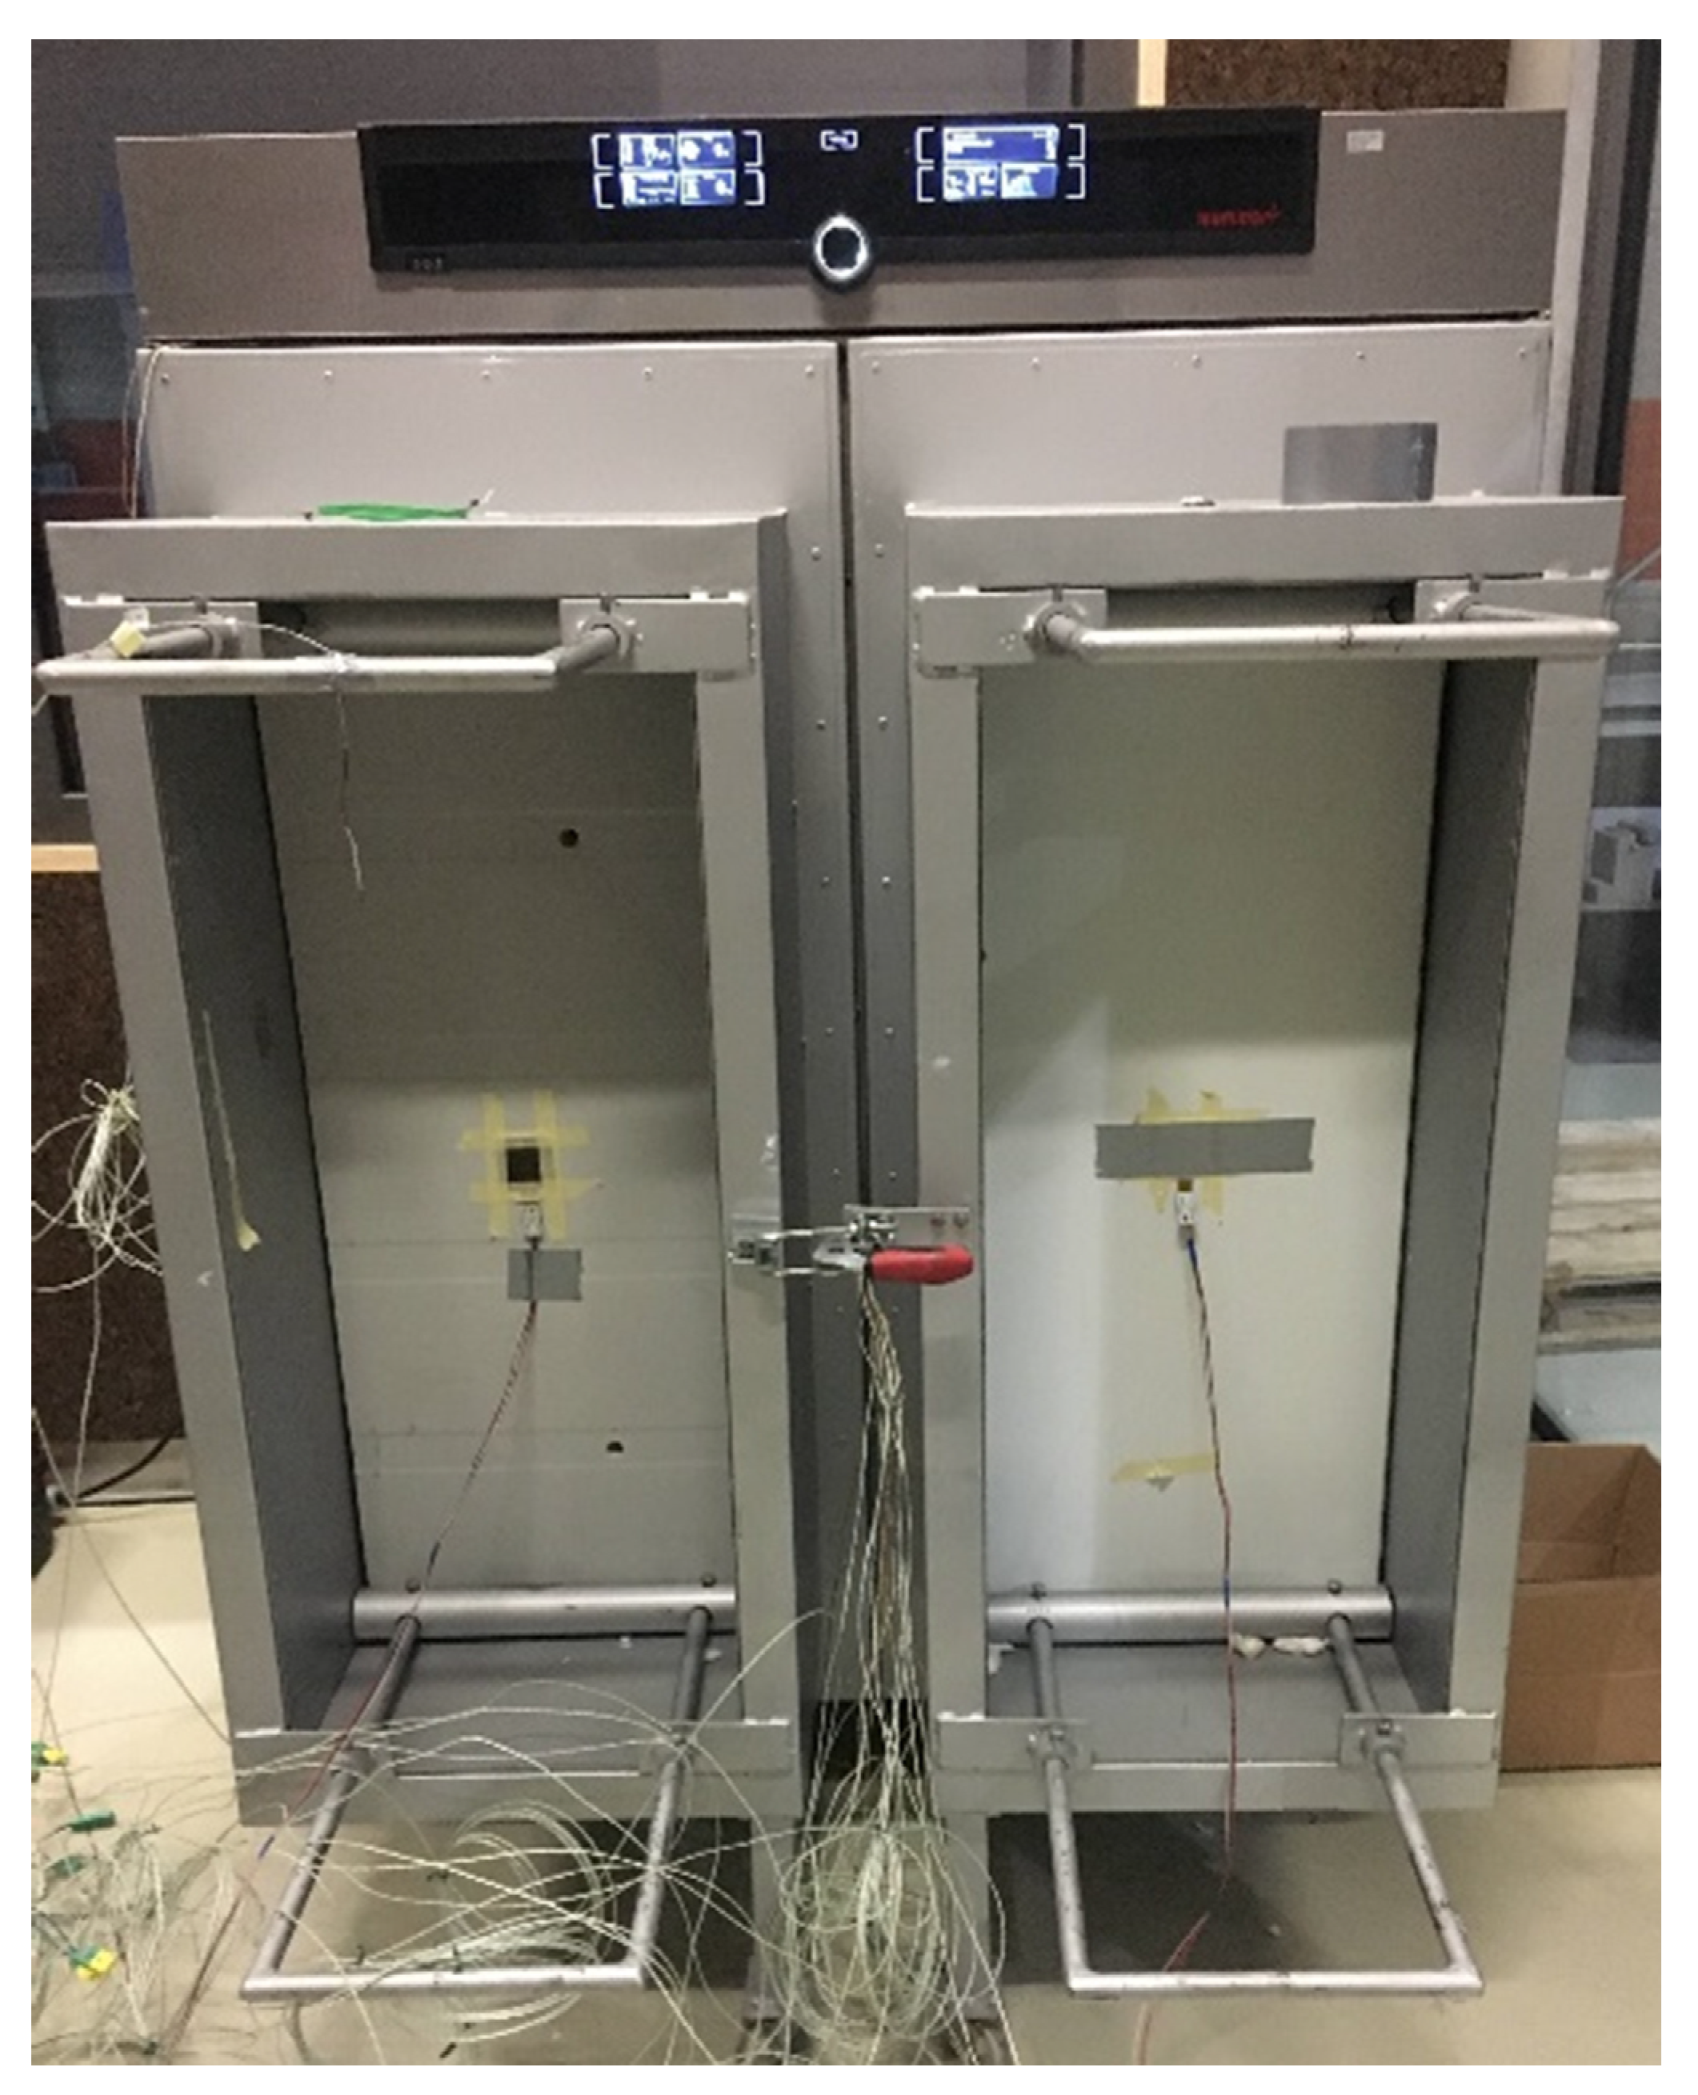
3. Methods
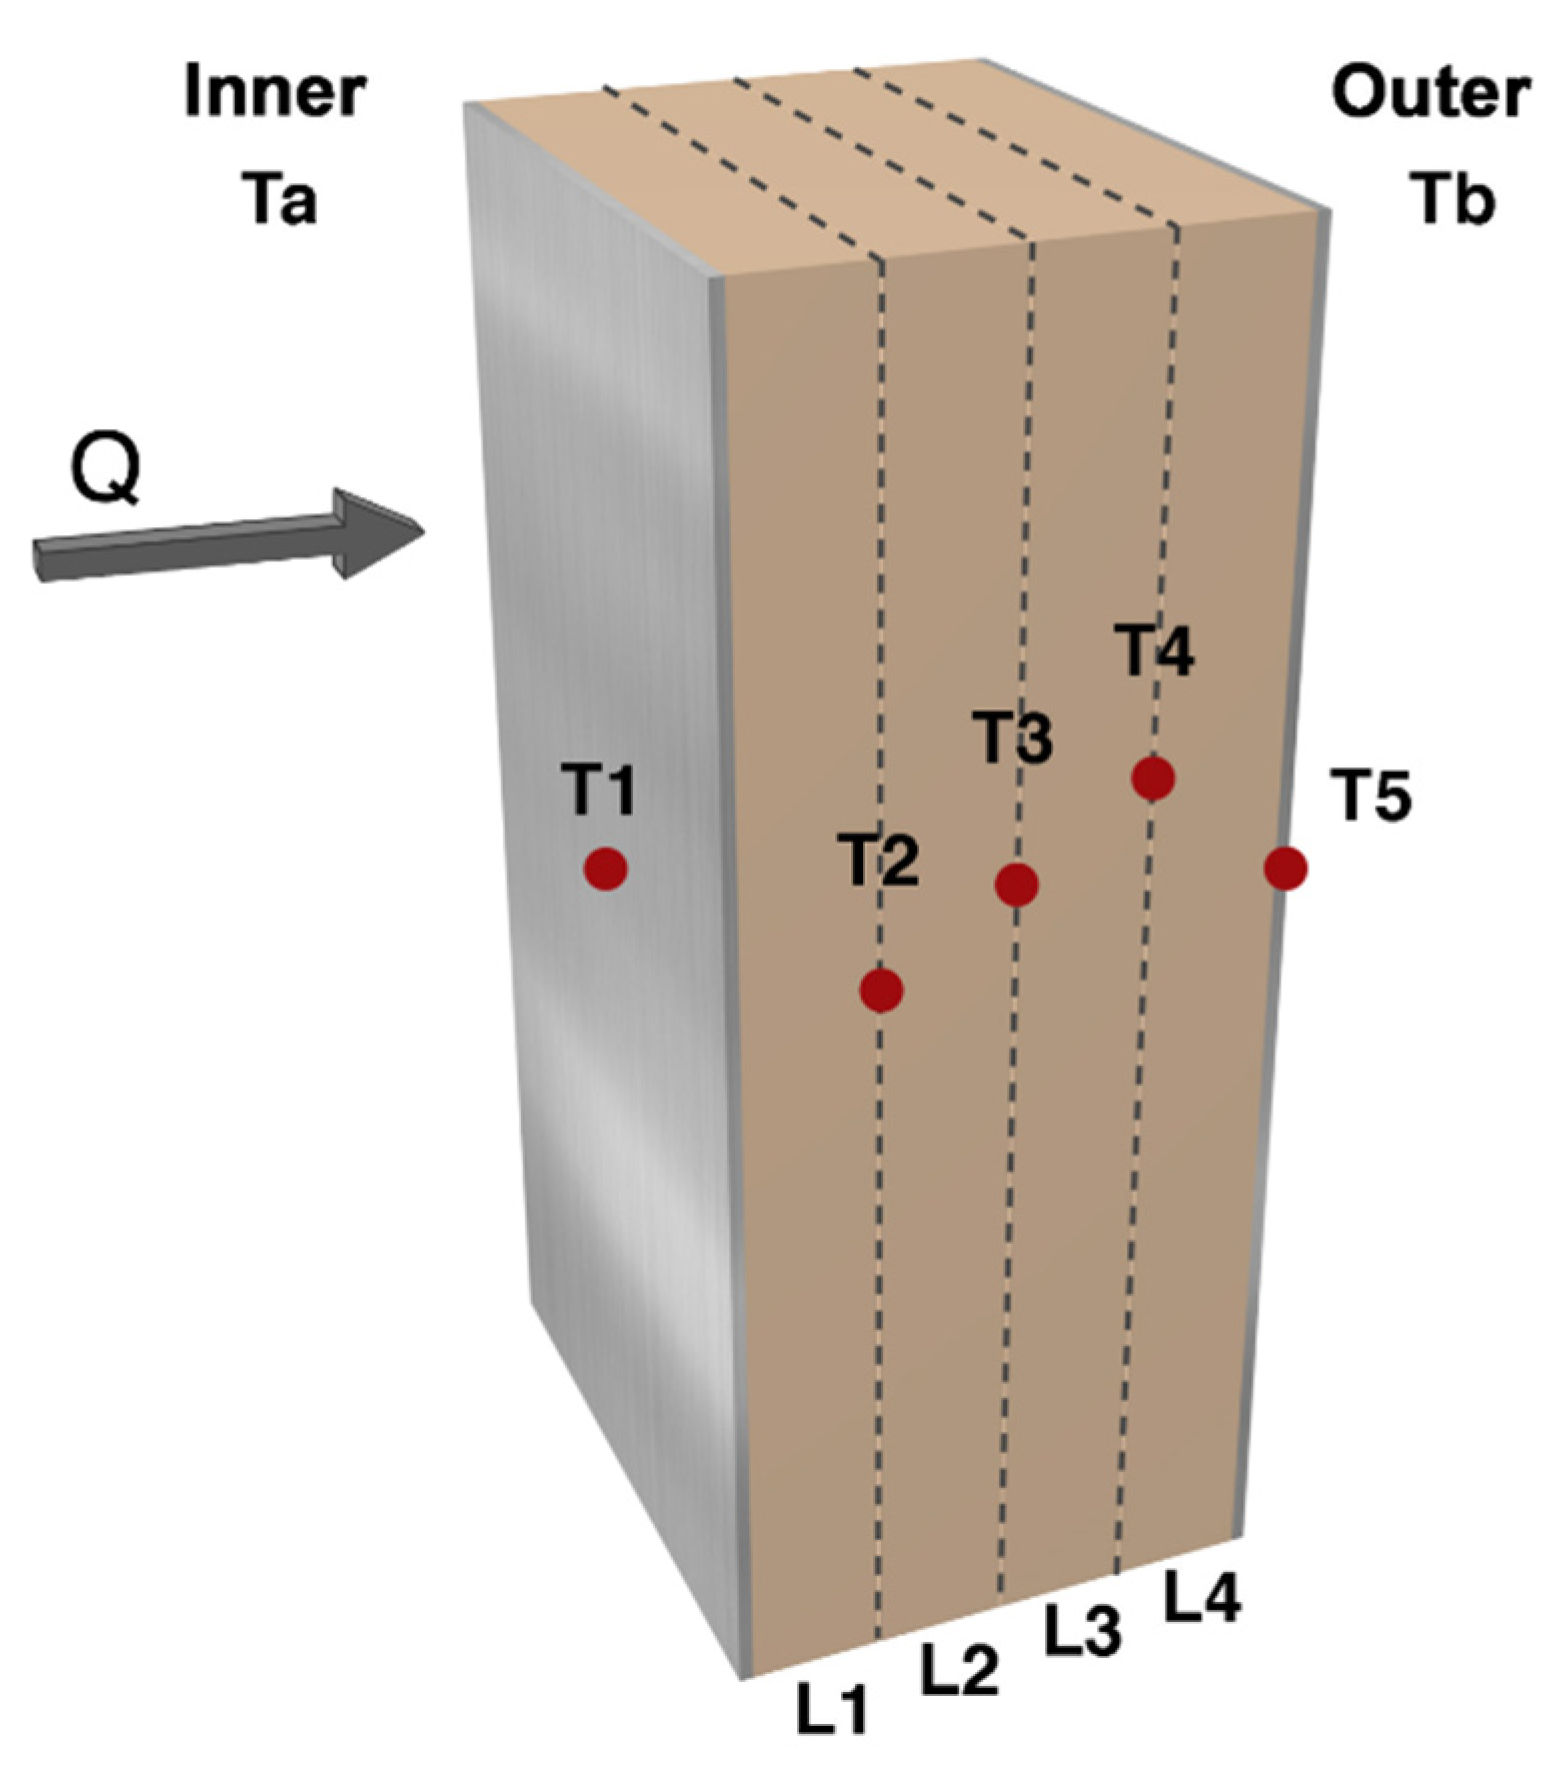
3.1. Thermal Characterisation
3.2. Young’s Modulus
- m—specimen mass (g);
- ff—resonance frequency in bending (Hz);
- w—width (mm);
- L—length (mm);
- t—thickness (mm);
4. Results
4.1. Thermal Characterisation
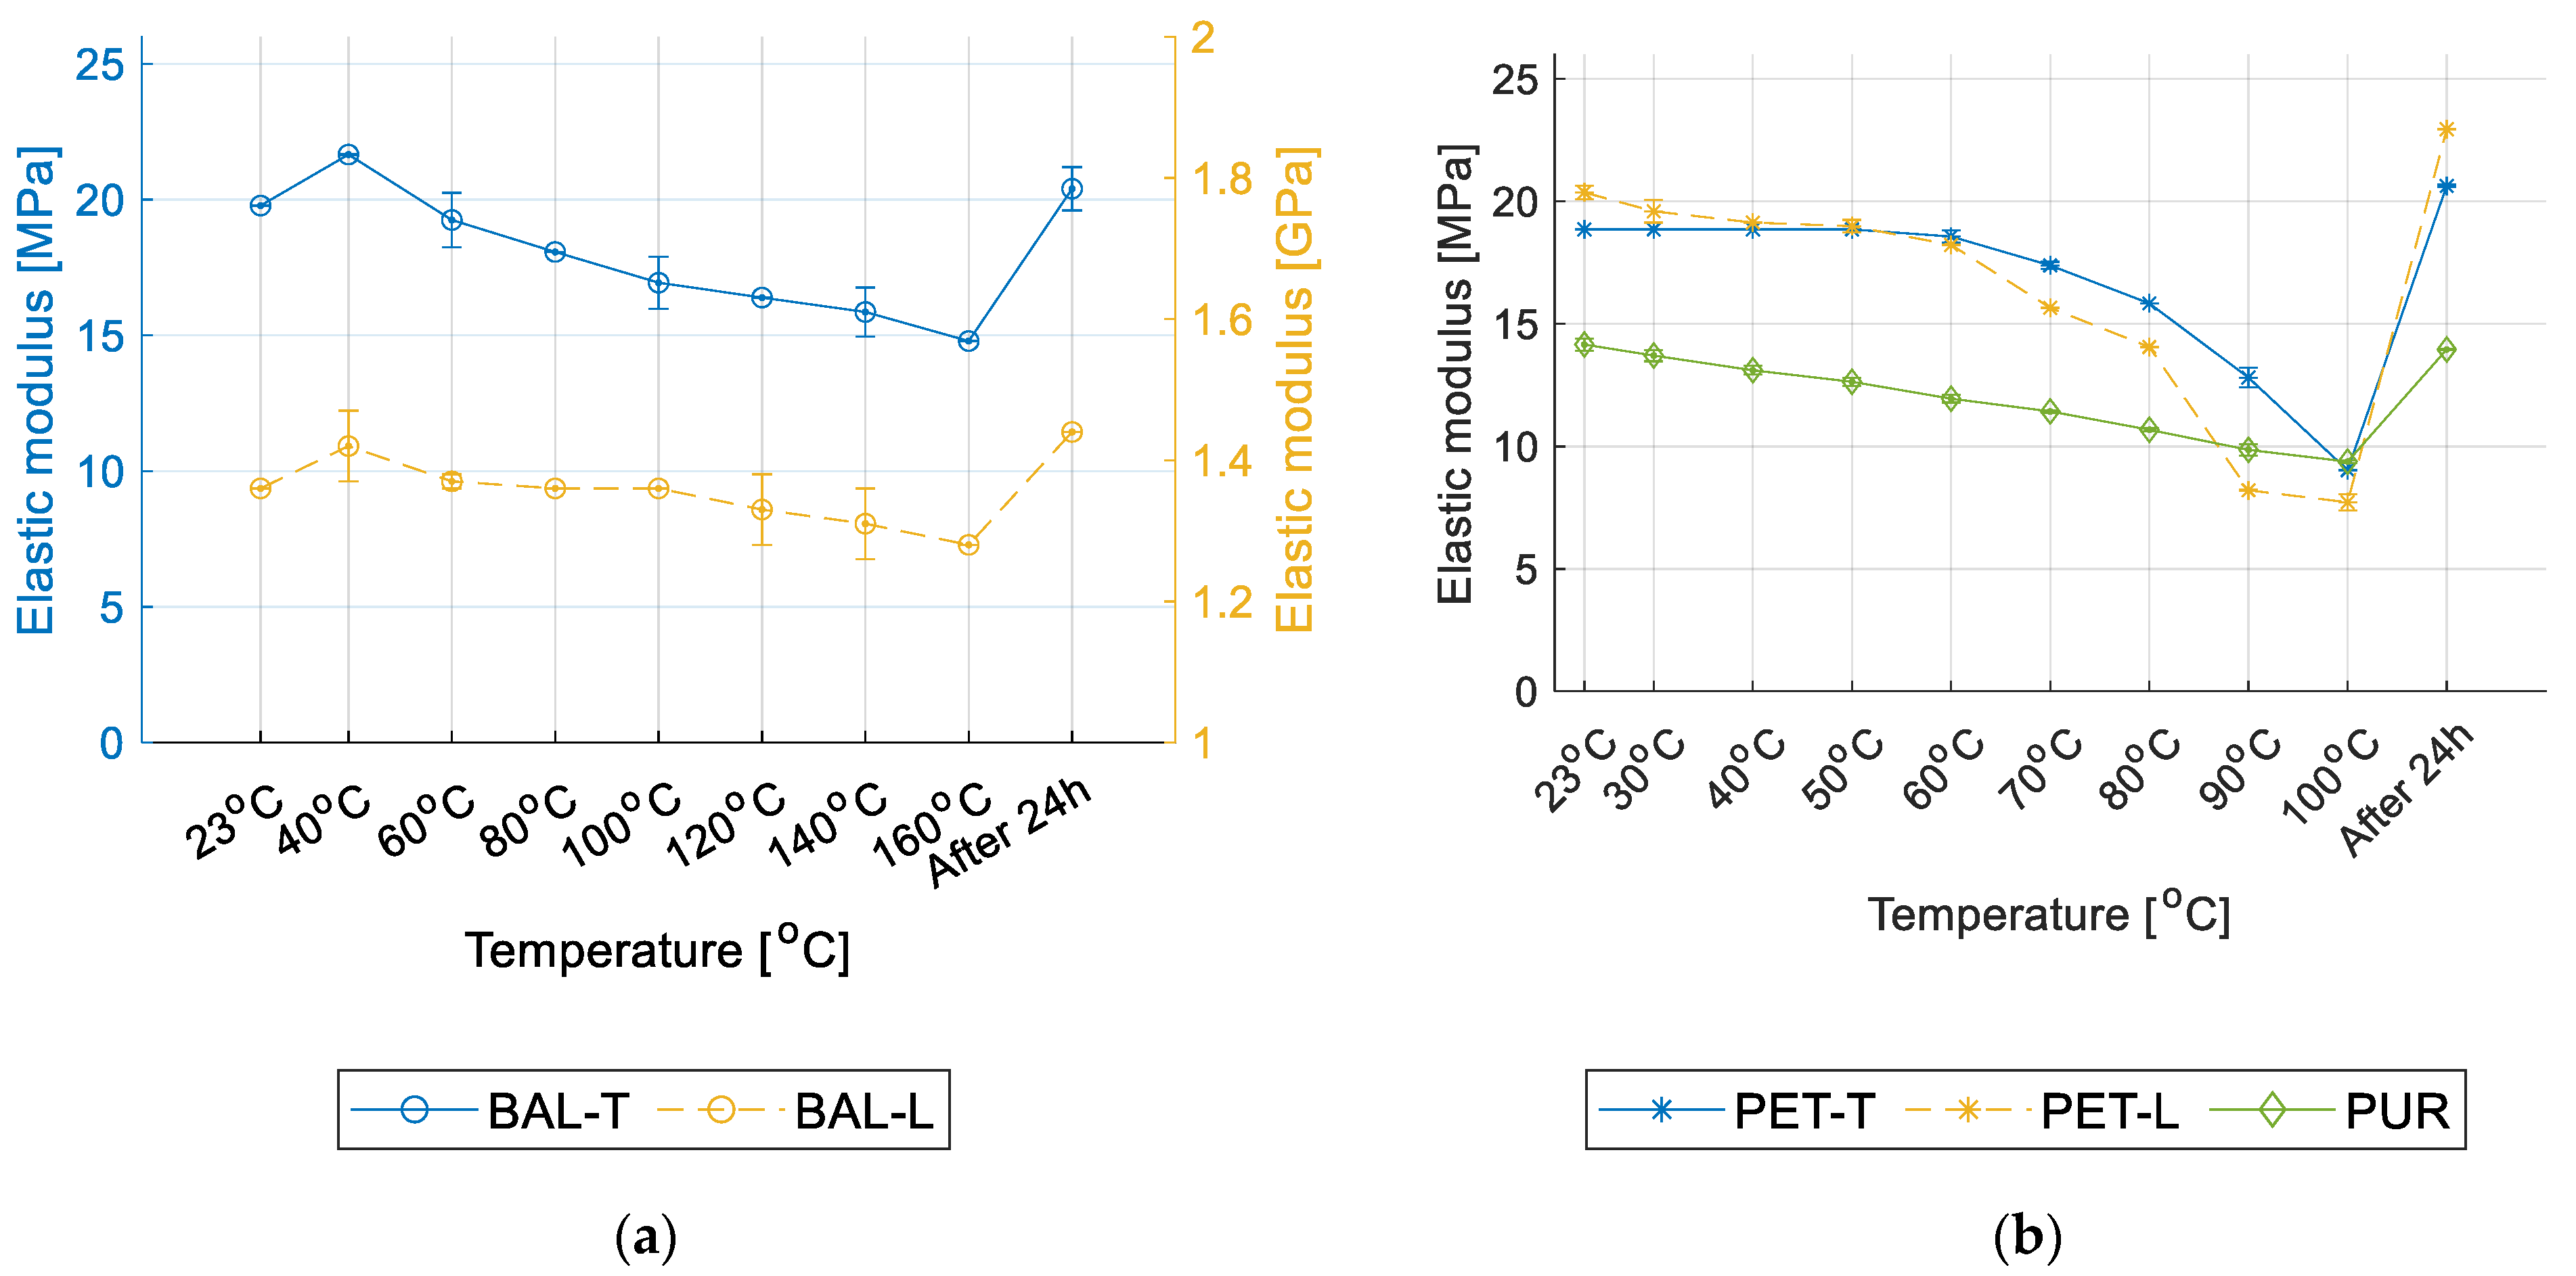
4.2. Young’s Modulus
5. Conclusions
Author Contributions
Funding
Institutional Review Board Statement
Informed Consent Statement
Data Availability Statement
Acknowledgments
Conflicts of Interest
References
- Naik, R.K.; Panda, S.K.; Racherla, V. A New Method for Joining Metal and Polymer Sheets in Sandwich Panels for Highly Improved Interface Strength. Compos. Struct. 2020, 251, 112661. [Google Scholar] [CrossRef]
- Keller, T.; Haas, C.; Vallée, T. Structural Concept, Design, and Experimental Verification of a Glass Fiber-Reinforced Polymer Sandwich Roof Structure. J. Compos. Constr. 2008, 12, 454–468. [Google Scholar] [CrossRef]
- Smardzewski, J. Wooden Sandwich Panels with Prismatic Core—Energy Absorbing Capabilities. Compos. Struct. 2019, 230, 111535. [Google Scholar] [CrossRef]
- Correia, J.R.; Garrido, M.; Gonilha, J.A.; Branco, F.A.; Reis, L.G. GFRP Sandwich Panels with PU Foam and PP Honeycomb Cores for Civil Engineering Structural Applications. Int. J. Struct. Integr. 2012, 3, 127–147. [Google Scholar] [CrossRef]
- de Freitas, S.T.; Kolstein, H.; Bijlaard, F. Sandwich System for Renovation of Orthotropic Steel Bridge Decks. J. Sandw. Struct. Mater. 2011, 13, 279–301. [Google Scholar] [CrossRef]
- Scislo, L.; Guinchard, M. Non-Invasive Measurements of Ultra-Ligtweight Composite Materials Using Laser Doppler Vibrometry System. In Proceedings of the 26 th International Congress on Sound and Vibration, Montreal, QC, Canada, 7–11 July 2019. [Google Scholar]
- Qiao, J.; Amirkhizi, A.V.; Schaaf, K.; Nemat-Nasser, S.; Wu, G. Dynamic Mechanical and Ultrasonic Properties of Polyurea. Mech. Mater. 2011, 43, 598–607. [Google Scholar] [CrossRef]
- Esmaeeli, R.; Farhad, S. Parameters Estimation of Generalized Maxwell Model for SBR and Carbon-Filled SBR Using a Direct High-Frequency DMA Measurement System. Mech. Mater. 2020, 146, 103369. [Google Scholar] [CrossRef]
- Ramorino, G.; Vetturi, D.; Cambiaghi, D.; Pegoretti, A.; Ricco, T. Developments in Dynamic Testing of Rubber Compounds: Assessment of Non-Linear Effects. Polym. Test. 2003, 22, 681–687. [Google Scholar] [CrossRef]
- Renaud, F.; Chevallier, G.; Dion, J.-L.; Lemaire, R. Viscoelasticity Measurement and Identification of Viscoelastic Parametric Models. In Biennial Conference on Mechanical Vibration and Noise, Parts A and B, 23rd ed.; ASMEDC: Washington, DC, USA, 2011; Volume 1, pp. 701–708. [Google Scholar] [CrossRef]
- Lord, J.D.; Morrell, R.M. Comparison of Static and Dynamic Methods for Measuring Stiffness of High Modulus Steels and Metal Composites. Can. Metall. Q. 2014, 53, 292–299. [Google Scholar] [CrossRef]
- Massara, N.; Boccaleri, E.; Milanesio, M.; Lopresti, M. IETeasy: An Open Source and Low-Cost Instrument for Impulse Excitation Technique, Applied to Materials Classification by Acoustical and Mechanical Properties Assessment. HardwareX 2021, 10, e00231. [Google Scholar] [CrossRef]
- Tognana, S.; Salgueiro, W.; Somoza, A.; Marzocca, A. Measurement of the Young’s Modulus in Particulate Epoxy Composites Using the Impulse Excitation Technique. Mater. Sci. Eng. A 2010, 527, 4619–4623. [Google Scholar] [CrossRef]
- Bahr, O.; Schaumann, P.; Bollen, B.; Bracke, J. Young’s Modulus and Poisson’s Ratio of Concrete at High Temperatures: Experimental Investigations. Mater. Des. 2013, 45, 421–429. [Google Scholar] [CrossRef]
- Zhang, J.; Nyilas, A.; Obst, B. New Technique for Measuring the Dynamic Young’s Modulus between 295 and 6 K. Cryogenics 1991, 31, 884–889. [Google Scholar] [CrossRef]
- Guan, C.; Liu, J.; Zhang, H.; Wang, X.; Zhou, L. Evaluation of Modulus of Elasticity and Modulus of Rupture of Full-Size Wood Composite Panels Supported on Two Nodal-Lines Using a Vibration Technique. Constr. Build. Mater. 2019, 218, 64–72. [Google Scholar] [CrossRef]
- ASTM E 1876-15; Standard Test Method for Dynamic Young’s Modulus, Shear Modulus, and Poisson’s Ratio by Im-Pulse Excitation of Vibration. ASTM: West Conshehoken, PE, USA, 2015.
- Zhang, S.; Dulieu-Barton, J.M.; Thomsen, O.T. The Effect of Temperature on the Failure Modes of Polymer Foam Cored Sandwich Structures. Compos. Struct. 2015, 121, 104–113. [Google Scholar] [CrossRef] [Green Version]
- Garrido, M.; Correia, J.R.; Keller, T. Effects of Elevated Temperature on the Shear Response of PET and PUR Foams Used in Composite Sandwich Panels. Constr. Build. Mater. 2015, 76, 150–157. [Google Scholar] [CrossRef]
- Vahedi, N.; Wu, C.; Vassilopoulos, A.P.; Keller, T. Thermomechanical Characterization of a Balsa-Wood-Veneer Structural Sandwich Core Material at Elevated Temperatures. Constr. Build. Mater. 2020, 230, 117037. [Google Scholar] [CrossRef]
- Khoukhi, M.; Fezzioui, N.; Draoui, B.; Salah, L. The Impact of Changes in Thermal Conductivity of Polystyrene Insulation Material under Different Operating Temperatures on the Heat Transfer through the Building Envelope. Appl. Therm. Eng. 2016, 105, 669–674. [Google Scholar] [CrossRef]
- Quintana, J.M.; Mower, T.M. Thermomechanical Behavior of Sandwich Panels with Graphitic-Foam Cores. Mater. Des. 2017, 135, 411–422. [Google Scholar] [CrossRef]
- Jelle, B.P. Traditional, State-of-the-Art and Future Thermal Building Insulation Materials and Solutions—Properties, Requirements and Possibilities. Energy Build. 2011, 43, 2549–2563. [Google Scholar] [CrossRef] [Green Version]
- Berardi, U. The Impact of Aging and Environmental Conditions on the Effective Thermal Conductivity of Several Foam Materials. Energy 2019, 182, 777–794. [Google Scholar] [CrossRef]
- Zhang, H.; Fang, W.-Z.; Li, Y.-M.; Tao, W.-Q. Experimental Study of the Thermal Conductivity of Polyurethane Foams. Appl. Therm. Eng. 2017, 115, 528–538. [Google Scholar] [CrossRef]
- Huang, P.; Chew, Y.M.J.; Chang, W.-S.; Ansell, M.P.; Lawrence, M.; Latif, E.; Shea, A.; Ormondroyd, G.; Du, H. Heat and Moisture Transfer Behaviour in Phyllostachys Edulis (Moso Bamboo) Based Panels. Constr. Build. Mater. 2018, 166, 35–49. [Google Scholar] [CrossRef]
- Asdrubali, F.; D’Alessandro, F.; Schiavoni, S. A Review of Unconventional Sustainable Building Insulation Materials. Sustain. Mater. Technol. 2015, 4, 1–17. [Google Scholar] [CrossRef]
- EN 1602; Thermal Insulating Products for Building Applications. Determination of the Apparent Density. BSI: London, UK, 2013.
- EN 823; Thermal Insulating Products for Building Applications. Determination of Thickness. BSI: London, UK, 2013.
- EN 12664; Thermal Performance of Building Materials and Products—Determination of Thermal Resistance by Means of Guarded Hot Plate and Heat Flow Meter Methods. Dry and Moist Products of Medium and Low Thermal Resistance. BSI: London, UK, 2001.
- EN 12667; Thermal Performance of Building Materials and Products. Determination of Thermal Resistance by Means of Guarded Hot Plate and Heat Flow Meter Methods. Products of High and Medium Thermal Resistance. BSI: London, UK, 2001.
- Simões, I.; Simões, N.; Tadeu, A. Thermal Delay Simulation in Multilayer Systems Using Analytical Solutions. Energy Build. 2012, 49, 631–639. [Google Scholar] [CrossRef]
- Sinha, A.; Morrell, J.J.; Clauson, M. Use of Acoustic Assessment to Detect Decay and Assess Condition of Wooden Guardrail Posts. For. Prod. J. 2015, 65, 314–319. [Google Scholar] [CrossRef]
- Dinckal, C. Analysis of Elastic Anisotropy of Wood Material for Engineering Applications. J. Innov. Res. Eng. Sci. 2011, 67–80. [Google Scholar]
- Paolino, D.S.; Geng, H.; Scattina, A.; Tridello, A.; Cavatorta, M.P.; Belingardi, G. Damaged Composite Laminates: Assessment of Residual Young’s Modulus through the Impulse Excitation Technique. Compos. Part B Eng. 2017, 128, 76–82. [Google Scholar] [CrossRef]
- Kucíková, L.; Šejnoha, M.; Janda, T.; Sýkora, J.; Padevět, P.; Marseglia, G. Mechanical Properties of Spruce Wood Extracted from GLT Beams Loaded by Fire. Sustainability 2021, 13, 5494. [Google Scholar] [CrossRef]
- Young, Z.; Zhou, H.; Wen, L. The Effect of Elevated Temperature on Bending Properties of NormalWood inside Chinese Larch Wood during Fire Events. BioResources 2015, 10, 2926–2935. [Google Scholar]


| Balsa Wood | Polyethylene Terephthalate Foam | Polyurethane Foam | Mineral Wool | |
|---|---|---|---|---|
 |  |  |  | |
| Description | Core material produced from select kiln-dried balsa wood in the ‘end-grain’ configuration | Structural lightweight PET foam boards made of 100% recycled PET | Rigid foam of PU | Rock wool panel made of basalt, slag, and briquet (recycled stone wool) |
| Density (kg/m3) ** | 174.6 ± 30.56 (Grain direction) * | 98.30 ± 0.46 | 41.2 ± 1.0 | 99.2 ± 0.56 |
| Thickness (mm) ** | 48 ± 1.05 | 60 ± 0.90 | 150 ± 0.85 | 60 ± 0.93 |
| Specimen | Balsa Longitudinal Direction (BAL-L) | Balsa Transversal Direction (BAL-T) | PUR (PUR) | PET Longitudinal Direction (PET-L) | PET Transversal Direction (PET-T) |
|---|---|---|---|---|---|
| m (g) | 0.8672 ± 0.017 | 0.9531 ± 0.011 | 0.6144 ± 0.036 | 1.1242 ± 0.014 | 1.123 ± 0.021 |
| L (mm) | 99.07 ± 1.00 | 99.36 ± 1.18 | 100.89 ± 0.41 | 101.59 ± 0.54 | 101.35 ± 0.73 |
| w (mm) | 25.17 ± 0.55 | 20.69 ± 1.52 | 24.82 ± 0.53 | 25.36 ± 0.8 | 25.44 ± 0.50 |
| t (mm) | 2.21 ± 0.13 | 4.73 ± 0.34 | 4.91 ± 0.103 | 4.99 ± 0.35 | 4.96 ± 0.45 |
| L/t | 45 ± 1.0 | 21 ± 1 | 21 ± 1 | 21 ± 1 | 21 ± 1 |
| T1 | 1.0034 ± 0.0003 | 1.0152 ± 0.0024 | 1.0158 ± 0.00063 | 1.0169 ± 0.0016 | 1.0173 ± 0.0022 |
| Density (kg/m3) | 156 ± 10 | 98 ± 1 | 50 ± 1 | 87 ± 1 | 88 ± 1 |
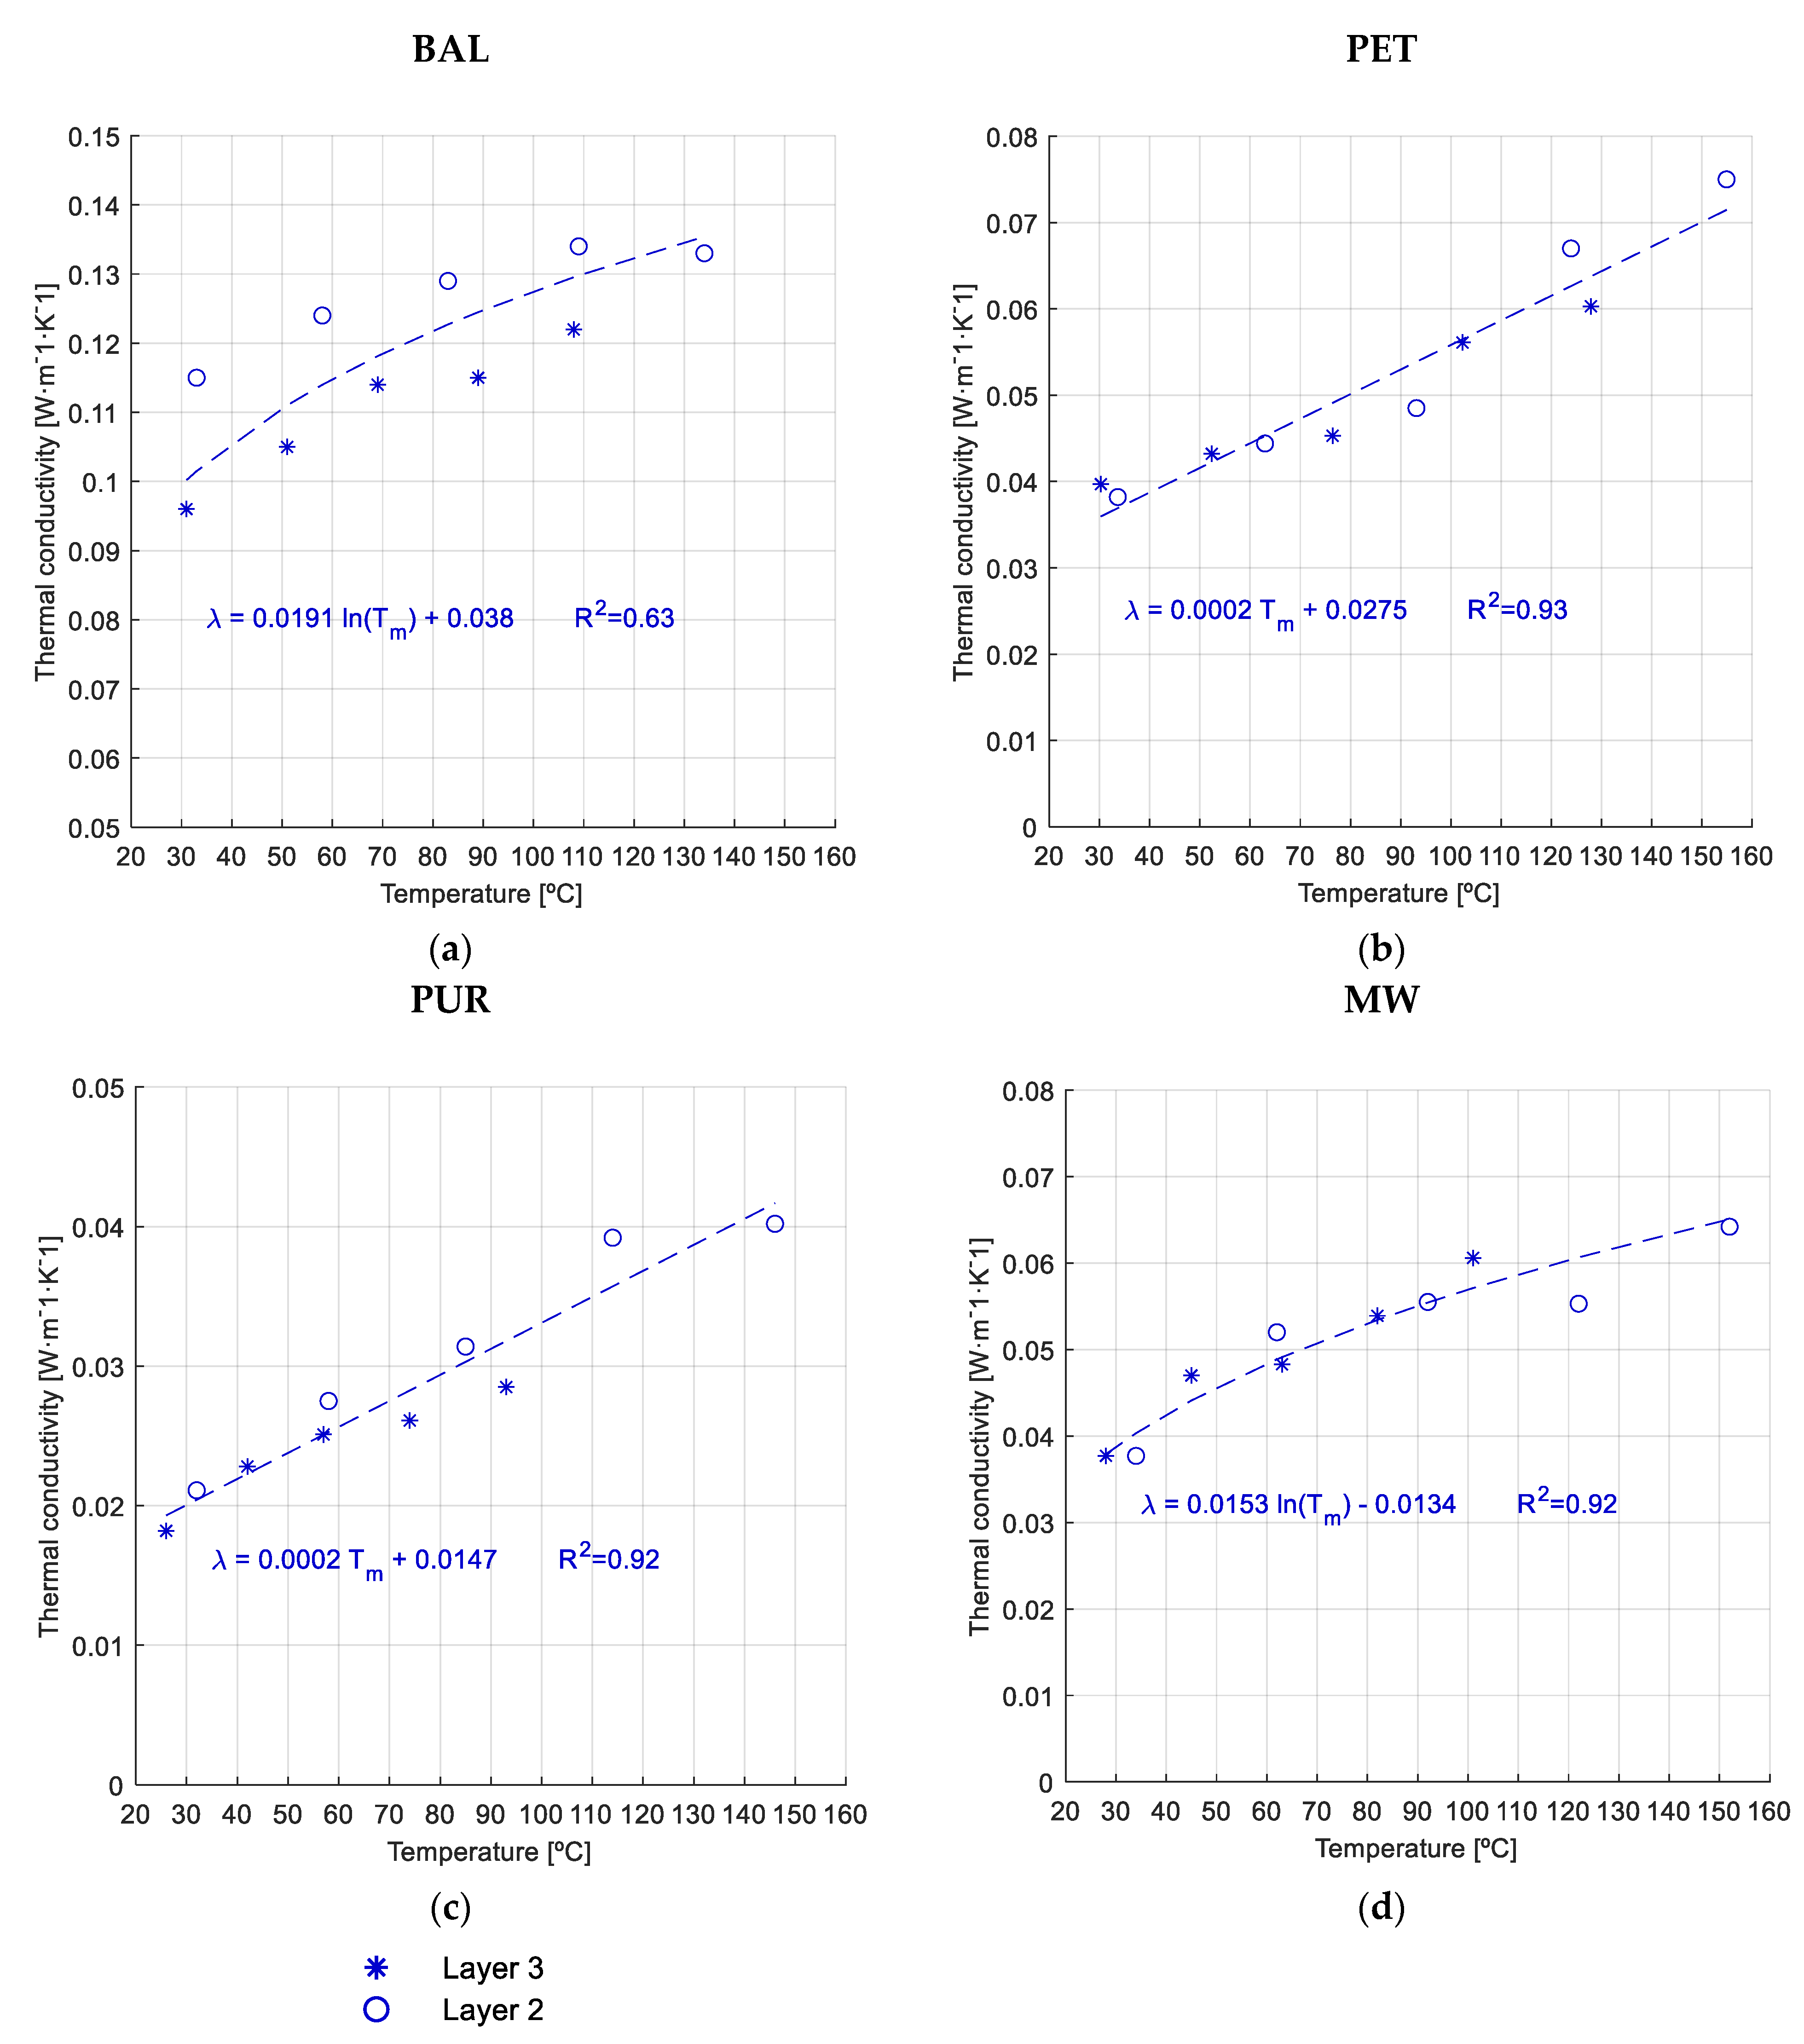
| BAL | PET | ||
| Tm (°C) | Tm (°C) | ||
| 33 ± 0.7 | 0.1146 ± 0.003 | 34 ± 1.2 | 0.0382 ± 0.004 |
| 58 ± 2.5 | 0.1237 ± 0.011 | 63 ± 2.3 | 0.0444 ± 0.006 |
| 83 ± 4.4 | 0.1291 ± 0.016 | 93 ± 5.2 | 0.0485 ± 0.006 |
| 109 ± 5.0 | 0.1342 ± 0.017 | 124 ± 6.1 | 0.0670 ± 0.011 |
| 134 ± 7.1 | 0.1327 ± 0.018 | 155 ± 6.3 | 0.0750 ± 0.012 |
| PUR | MW | ||
| Tm (°C) | Tm (°C) | ||
| 32 ± 2.1 | 0.0211 ± 0.001 | 34 ± 0.9 | 0.0378 ± 0.003 |
| 58 ± 3.2 | 0.0275 ± 0.005 | 62 ± 2.3 | 0.0520 ± 0.003 |
| 85 ± 2.9 | 0.0314 ± 0.008 | 92 ± 1.5 | 0.0555 ± 0.004 |
| 114 ± 4.5 | 0.0392 ± 0.013 | 122 ± 1.2 | 0.0553 ± 0.008 |
| 146 ± 6.3 | 0.0402 ± 0.014 | 152 ± 2.3 | 0.0642 ± 0.010 |
| BAL | PET | ||
| Tm (°C) | Tm (°C) | ||
| 31 ± 0.9 | 0.0963 ± 0.019 | 30 ± 2.6 | 0.0397 ± 0.002 |
| 51 ± 0.9 | 0.105 ± 0.016 | 52 ± 3.0 | 0.0432 ± 0.002 |
| 69 ± 1.2 | 0.1142 ± 0.026 | 76 ± 3.2 | 0.0453 ± 0.008 |
| 89 ± 2.4 | 0.115 ± 0.029 | 102 ± 5.9 | 0.0561 ± 0.014 |
| 108 ± 3.1 | 0.122 ± 0.035 | 128 ± 6.0 | 0.0603 ± 0.017 |
| PUR | MW | ||
| Tm (°C) | Tm (°C) | ||
| 26 ± 3.2 | 0.0182 ± 0.001 | 28 ± 01.3 | 0.0377 ± 0.002 |
| 42 ± 2.3 | 0.0228 ± 0.001 | 45 ± 3.2 | 0.0470 ± 0.002 |
| 57 ± 4.5 | 0.0251 ± 0.001 | 63 ± 4.2 | 0.0483 ± 0.003 |
| 74 ± 5.7 | 0.0261 ± 0.002 | 82 ± 5.3 | 0.0539 ± 0.005 |
| 93 ± 7.6 | 0.0285 ± 0.003 | 101 ± 7.2 | 0.0606 ± 0.007 |
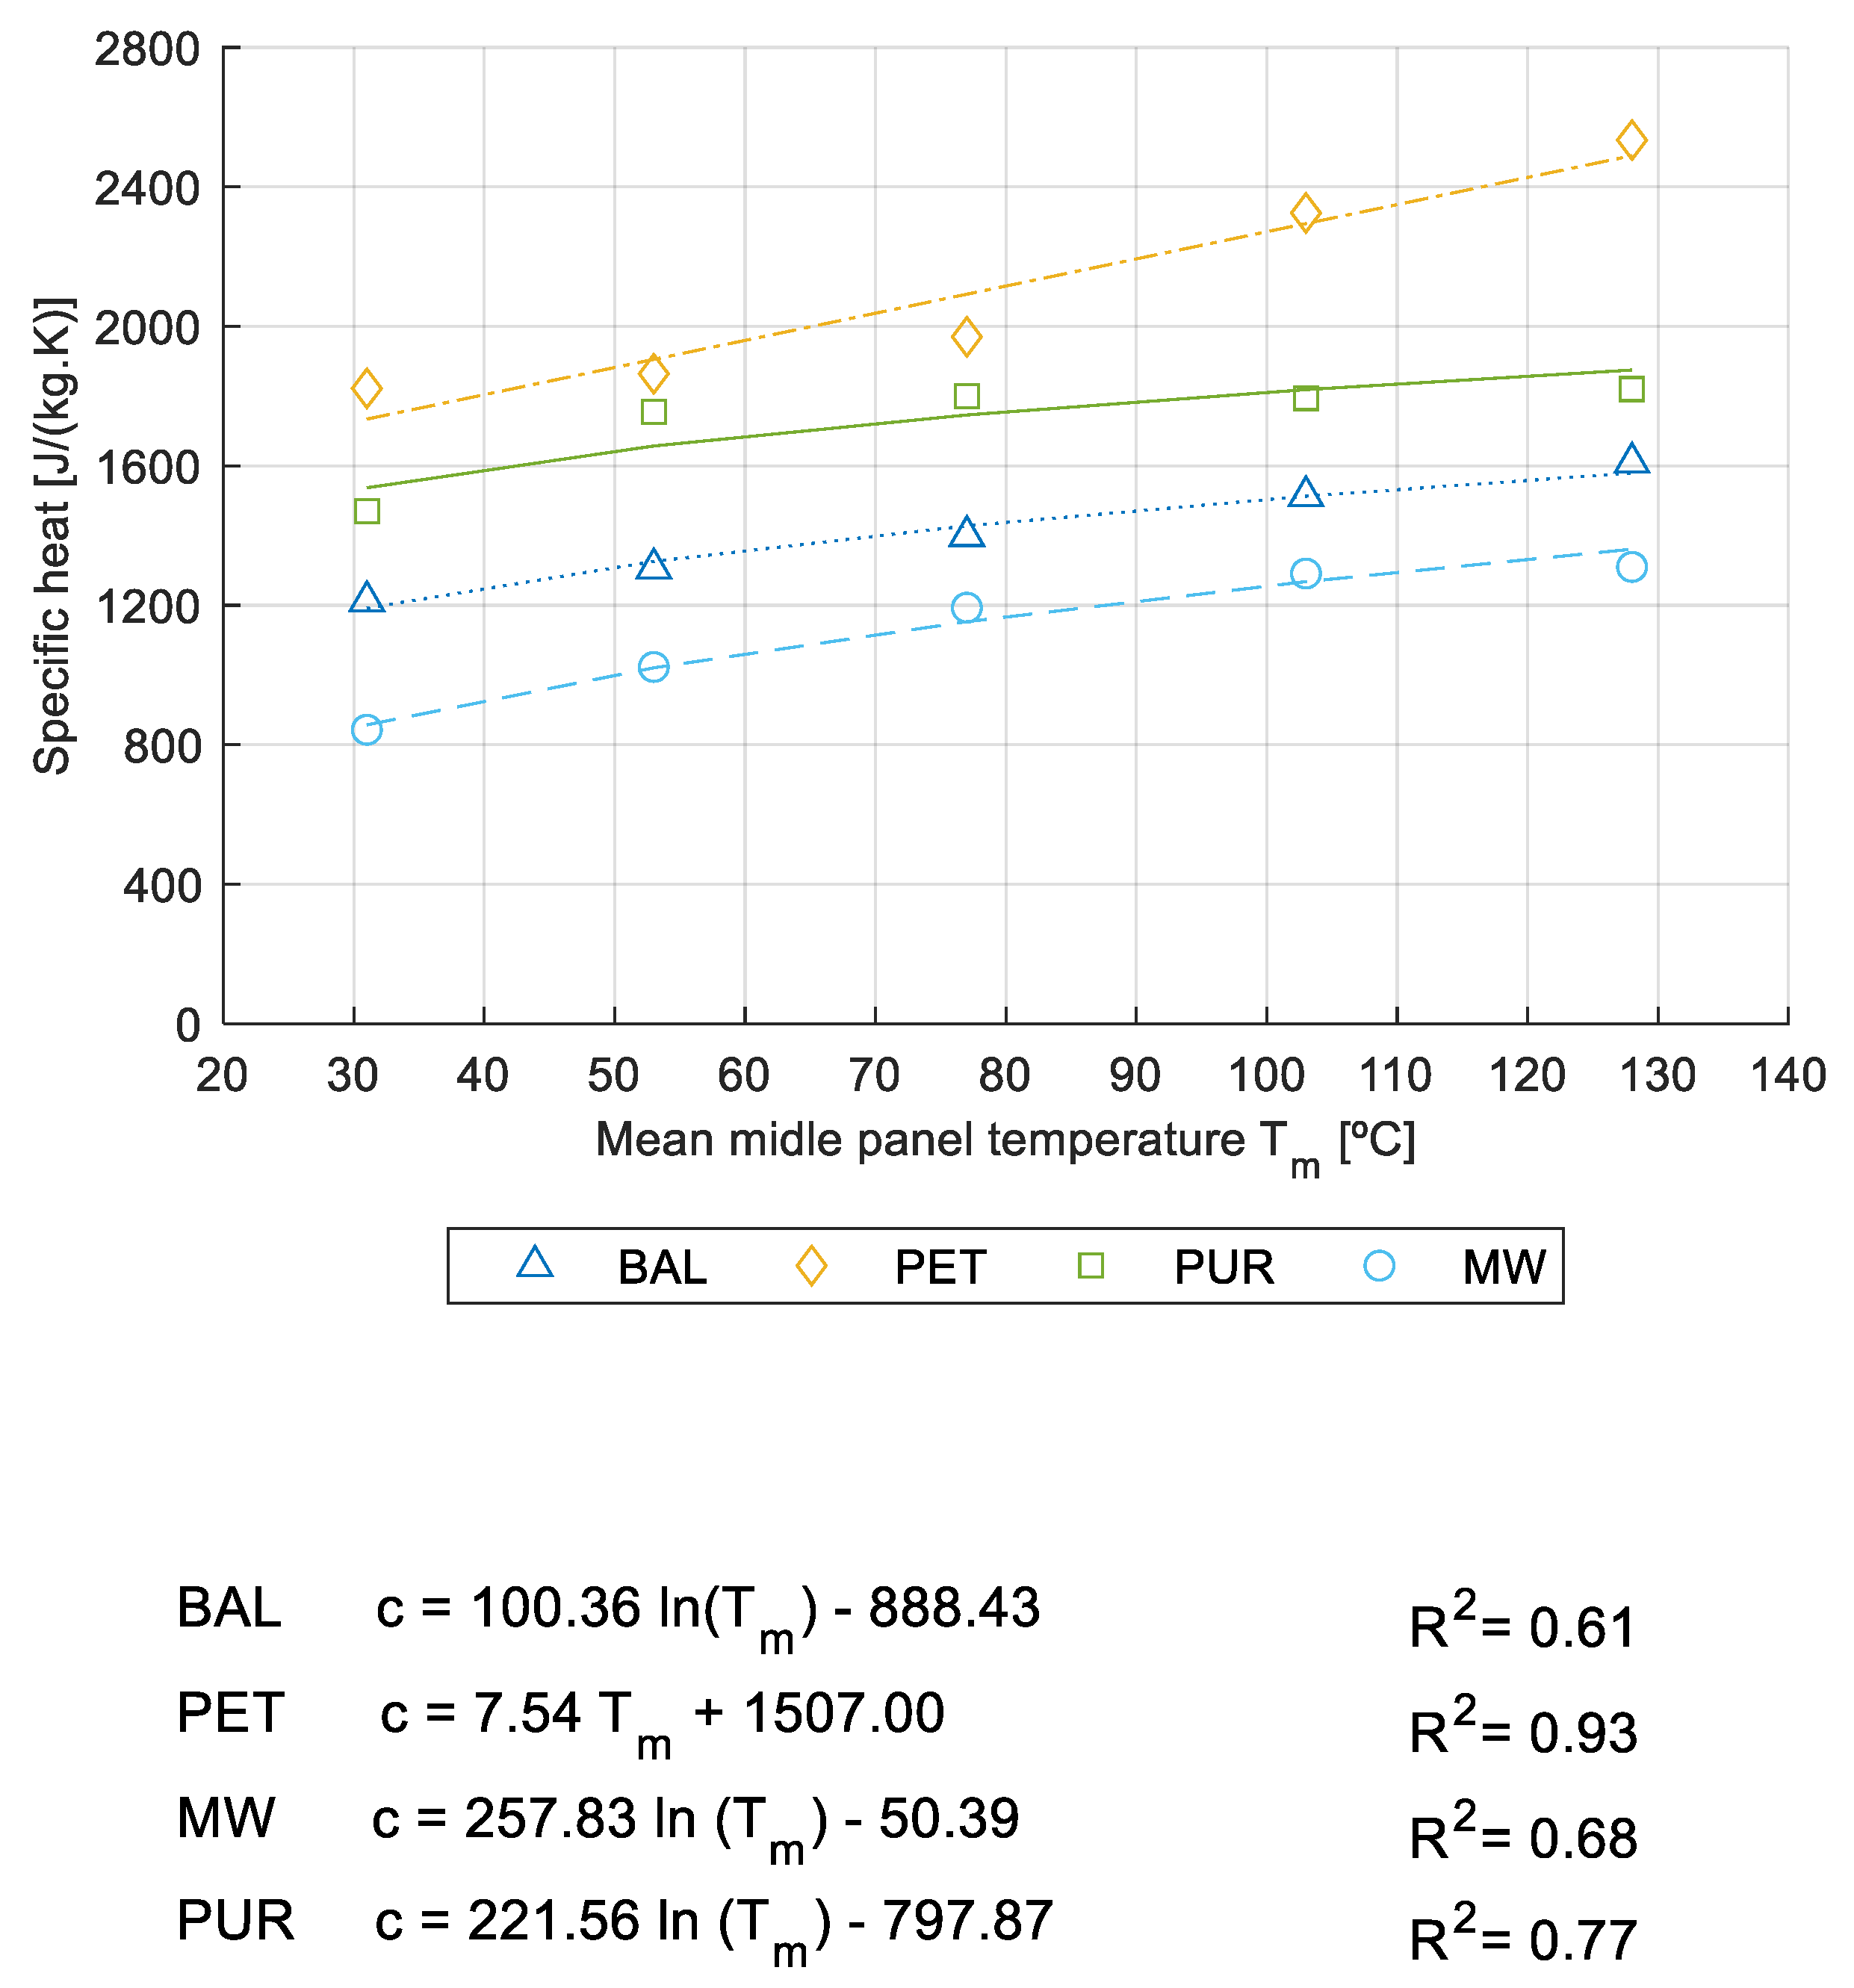
| BAL | PET | PUR | MW | |
|---|---|---|---|---|
| Apparent density (kg/m3) | 174.6 ± 30.56 | 98.30 ± 0.46 | 41.2 ± 1.0 | 99.2 ± 0.56 |
| Thermal conductivity | 0.1158 ± 0.0202 | 0.0396 ± 0.0014 | 0.019 ± 0.001 | 0.0366 ± 0.0016 |
| BAL | PET | ||
| Tm (°C) | c (J/(kg·K)) | Tm (°C) | c (J/(kg·K)) |
| 32 ± 1.4 | 1212 ± 2 | 30 ± 2.0 | 1822 ± 2 |
| 54 ± 2.9 | 1306 ± 11 | 52 ± 2.5 | 1864 ± 4 |
| 80 ± 3.3 | 1399 ± 7 | 77 ± 3.1 | 1970 ± 3 |
| 104 ± 2.7 | 1513 ± 4 | 105 ± 2.8 | 2325 ± 5 |
| 127 ± 2.1 | 1609 ± 10 | 130 ± 3.4 | 2534 ± 8 |
| PUR | MW | ||
| Tm (°C) | c (J/(kg·K)) | Tm (°C) | c (J/(kg·K)) |
| 29 ± 1.4 | 1470 ± 1 | 31 ± 1.5 | 843 ± 9 |
| 50 ± 2.9 | 1755 ± 3 | 54 ± 1.9 | 1023 ± 5 |
| 72 ± 3.3 | 1799 ± 5 | 78 ± 2.4 | 1193 ± 7 |
| 99 ± 2.7 | 1794 ± 2 | 104 ± 3.3 | 1291 ± 4 |
| 126 ± 3.1 | 1820 ± 2 | 129 ± 3.2 | 1310 ± 6 |
Publisher’s Note: MDPI stays neutral with regard to jurisdictional claims in published maps and institutional affiliations. |
© 2022 by the authors. Licensee MDPI, Basel, Switzerland. This article is an open access article distributed under the terms and conditions of the Creative Commons Attribution (CC BY) license (https://creativecommons.org/licenses/by/4.0/).
Share and Cite
Dias, S.; Tadeu, A.; Ramalho, A.; Brett, M.; Pedro, F. Thermal and Mechanical Characterisation of Sandwich Core Materials for Climatic Chamber Shells Subjected to High Temperatures. Energies 2022, 15, 2089. https://doi.org/10.3390/en15062089
Dias S, Tadeu A, Ramalho A, Brett M, Pedro F. Thermal and Mechanical Characterisation of Sandwich Core Materials for Climatic Chamber Shells Subjected to High Temperatures. Energies. 2022; 15(6):2089. https://doi.org/10.3390/en15062089
Chicago/Turabian StyleDias, Sara, António Tadeu, Amílcar Ramalho, Michael Brett, and Filipe Pedro. 2022. "Thermal and Mechanical Characterisation of Sandwich Core Materials for Climatic Chamber Shells Subjected to High Temperatures" Energies 15, no. 6: 2089. https://doi.org/10.3390/en15062089
APA StyleDias, S., Tadeu, A., Ramalho, A., Brett, M., & Pedro, F. (2022). Thermal and Mechanical Characterisation of Sandwich Core Materials for Climatic Chamber Shells Subjected to High Temperatures. Energies, 15(6), 2089. https://doi.org/10.3390/en15062089