
Optimal Design of a Hybrid Energy System for Economic and Environmental Sustainability of Onshore Oil and Gas Fields


Abstract
:1. Introduction
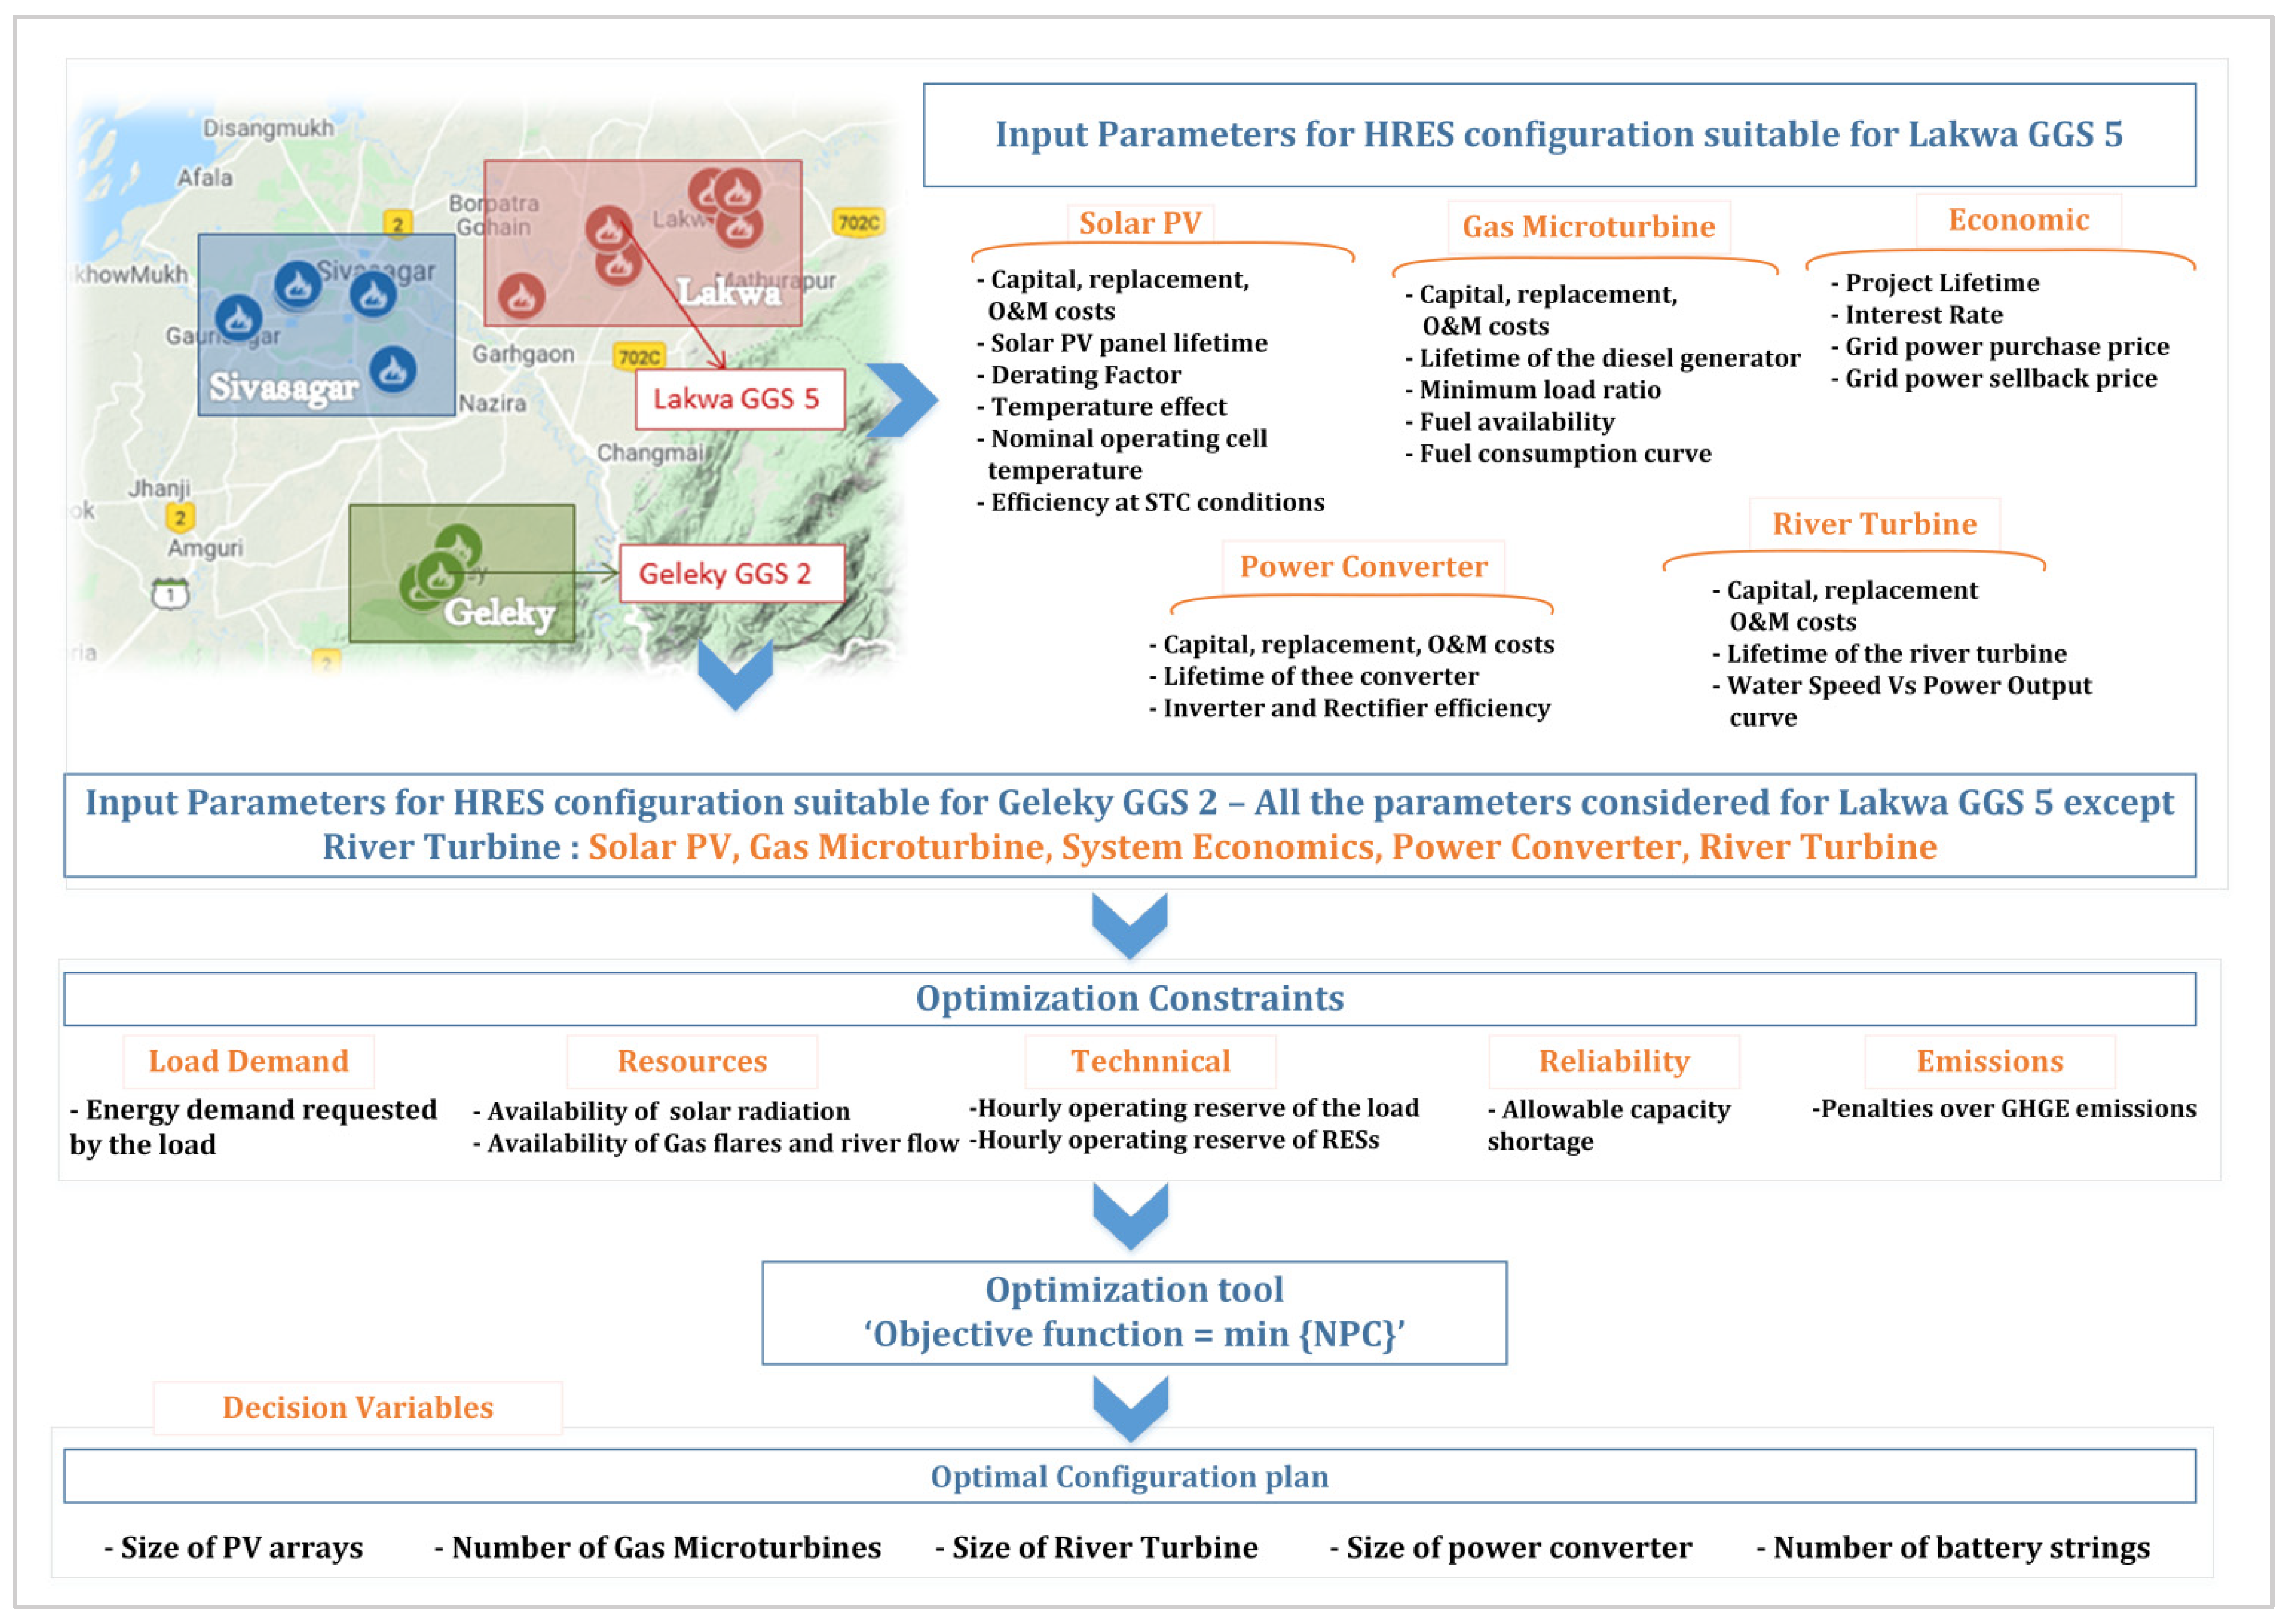
2. Model Development and Design Specifications of HES Components
- (1)
- Geleky GGS2: GMT, Solar PV and Battery Energy Storage System (BESS);
- (2)
- Lakwa GGS5: GMT, Solar PV, RT, and BESS.
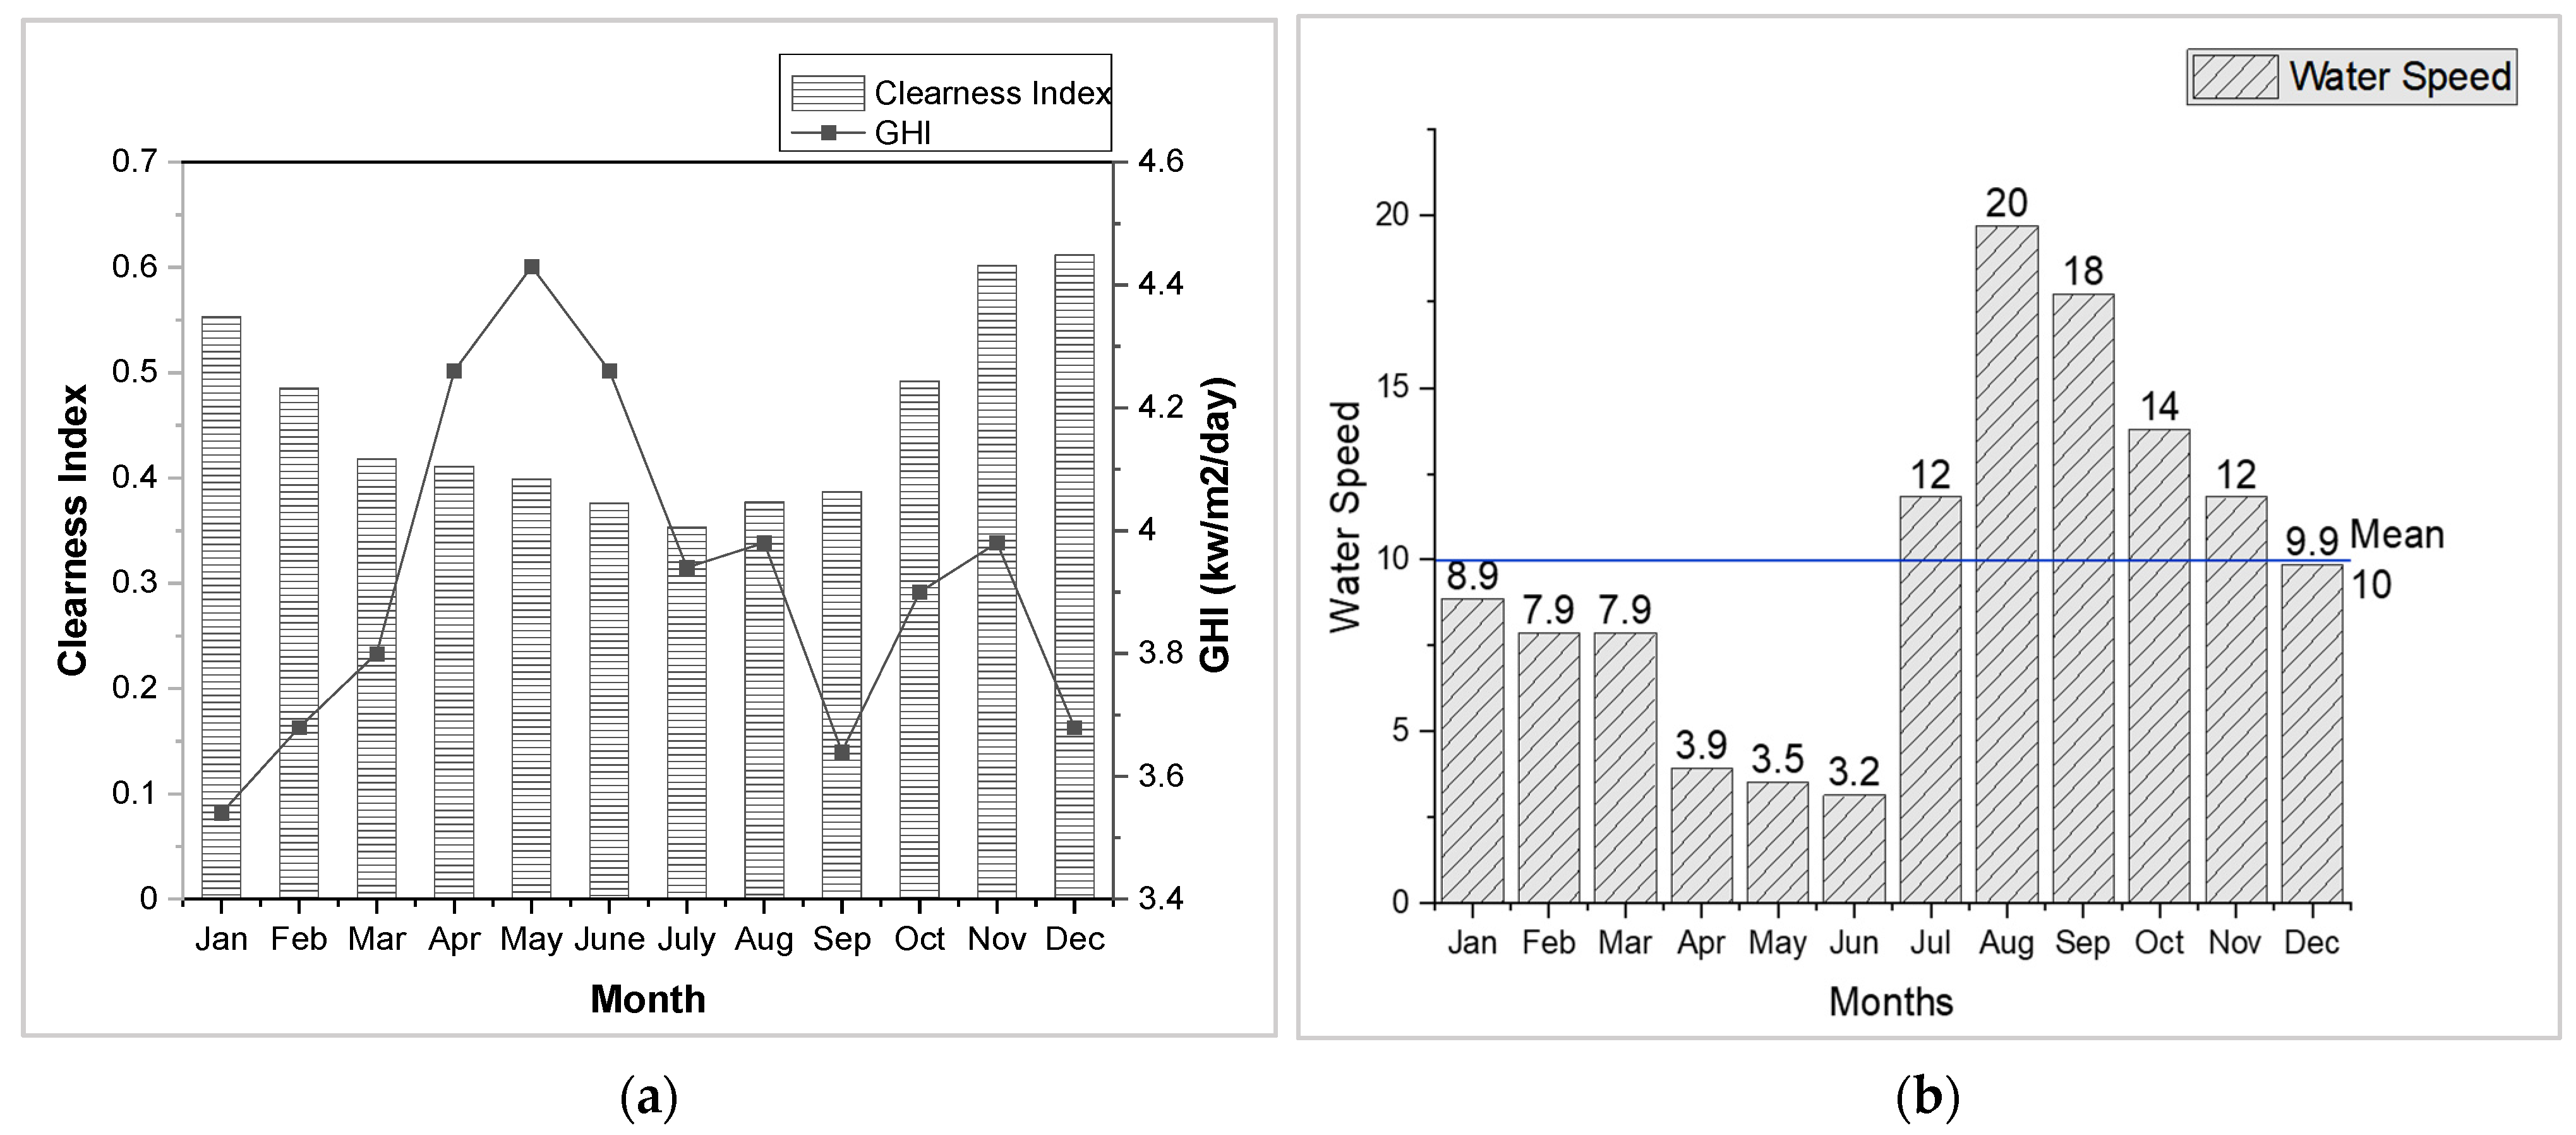
2.1. Solar Photovoltaic
Solar Irradiance
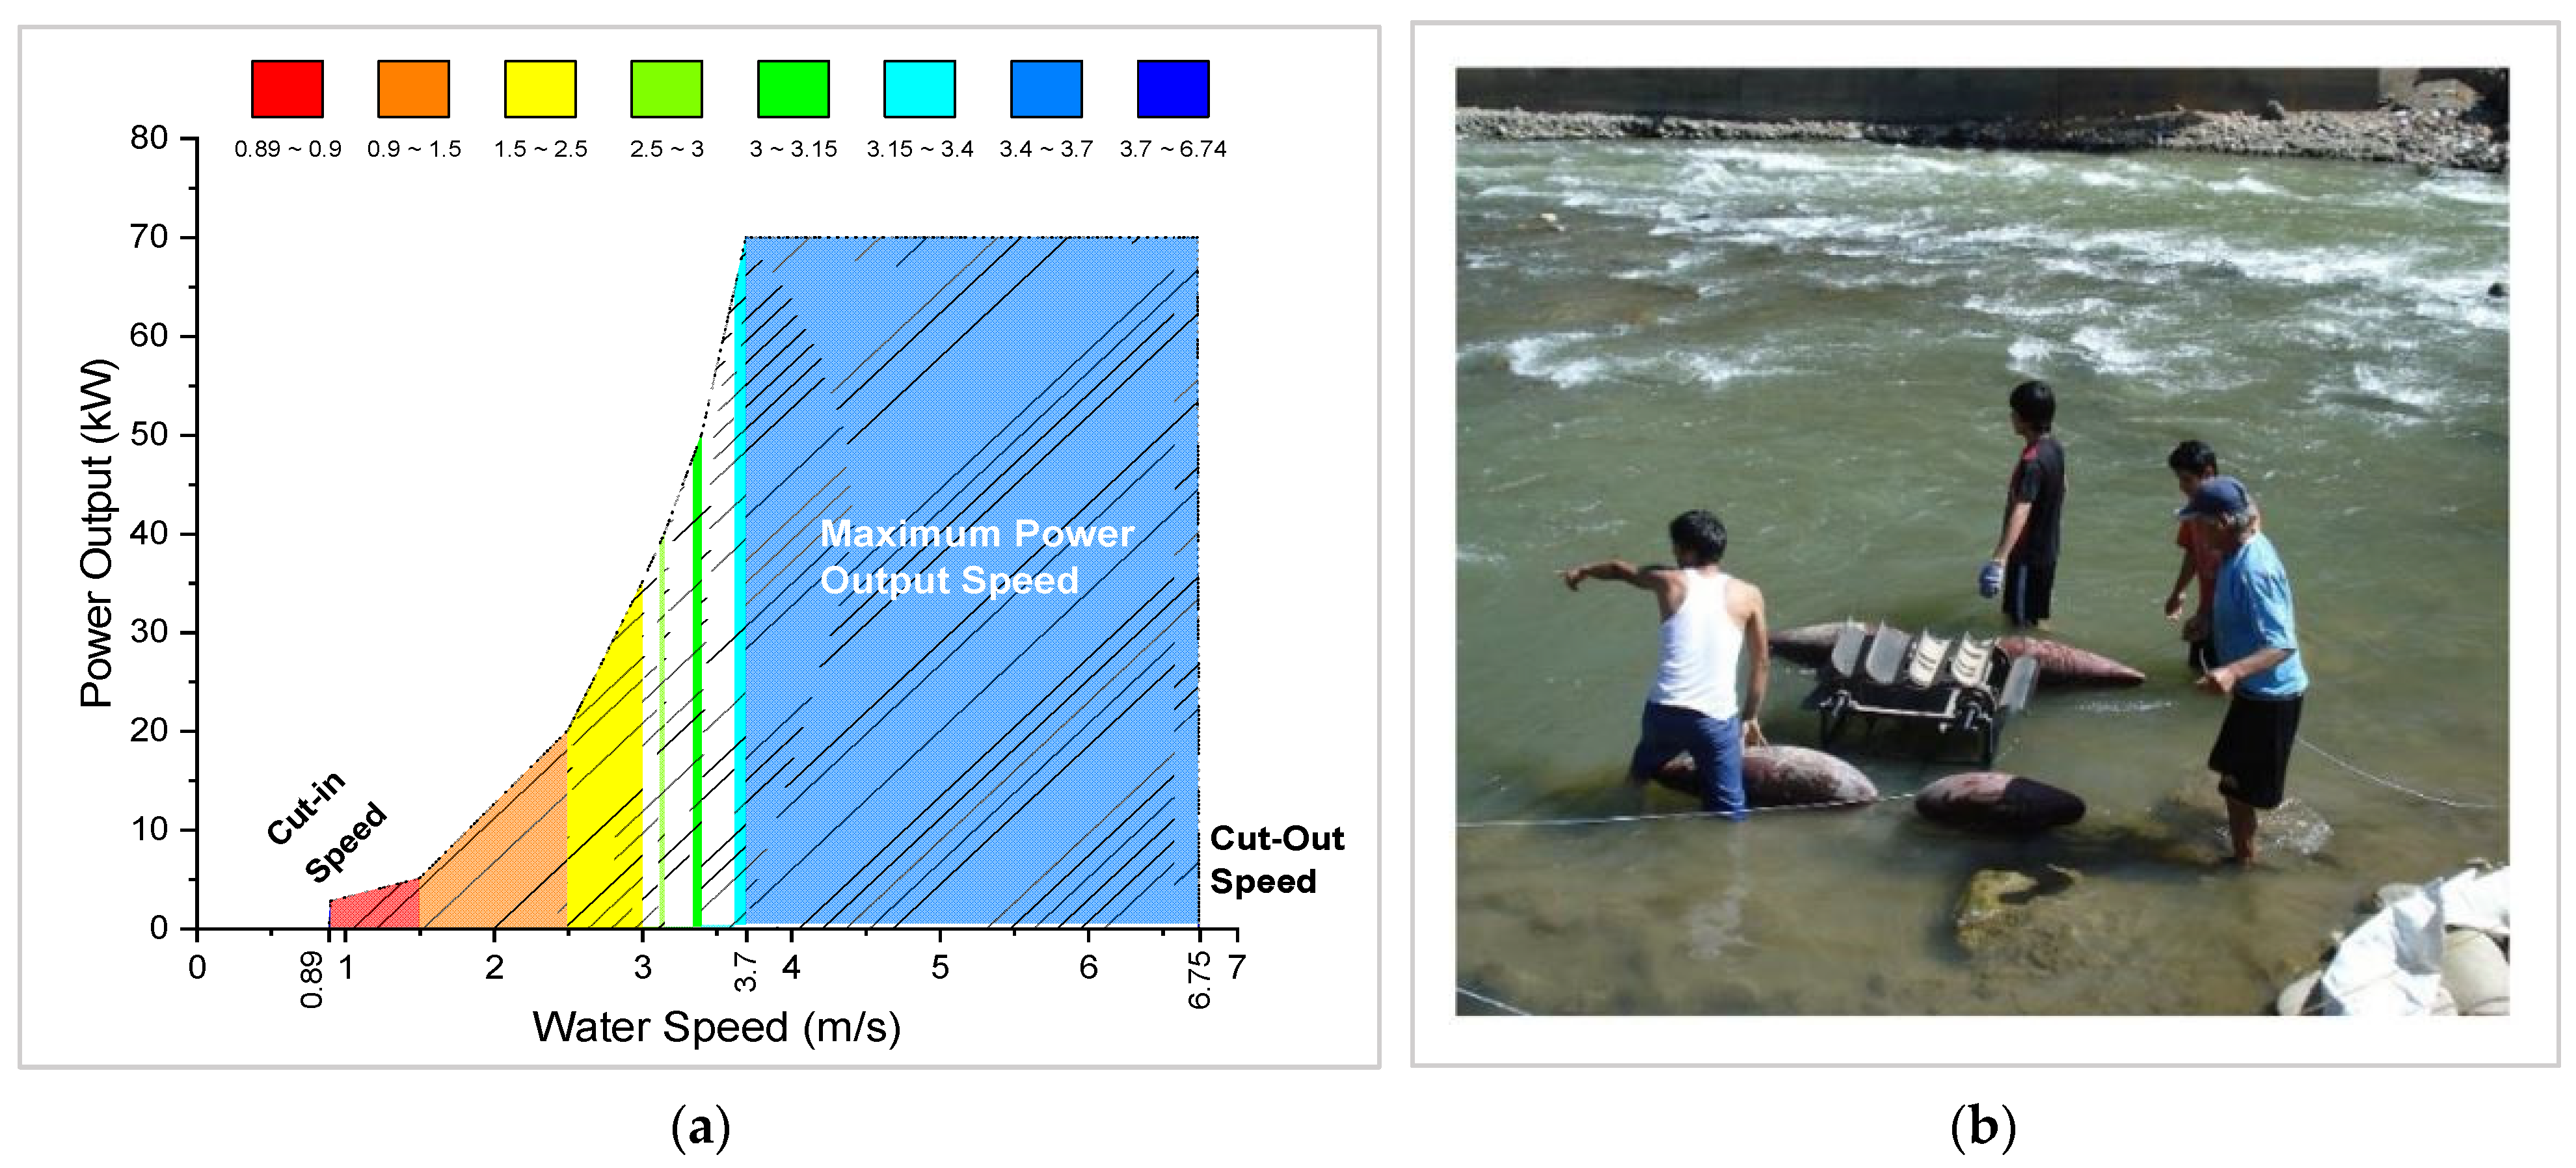
2.2. River Turbine
2.3. Converter
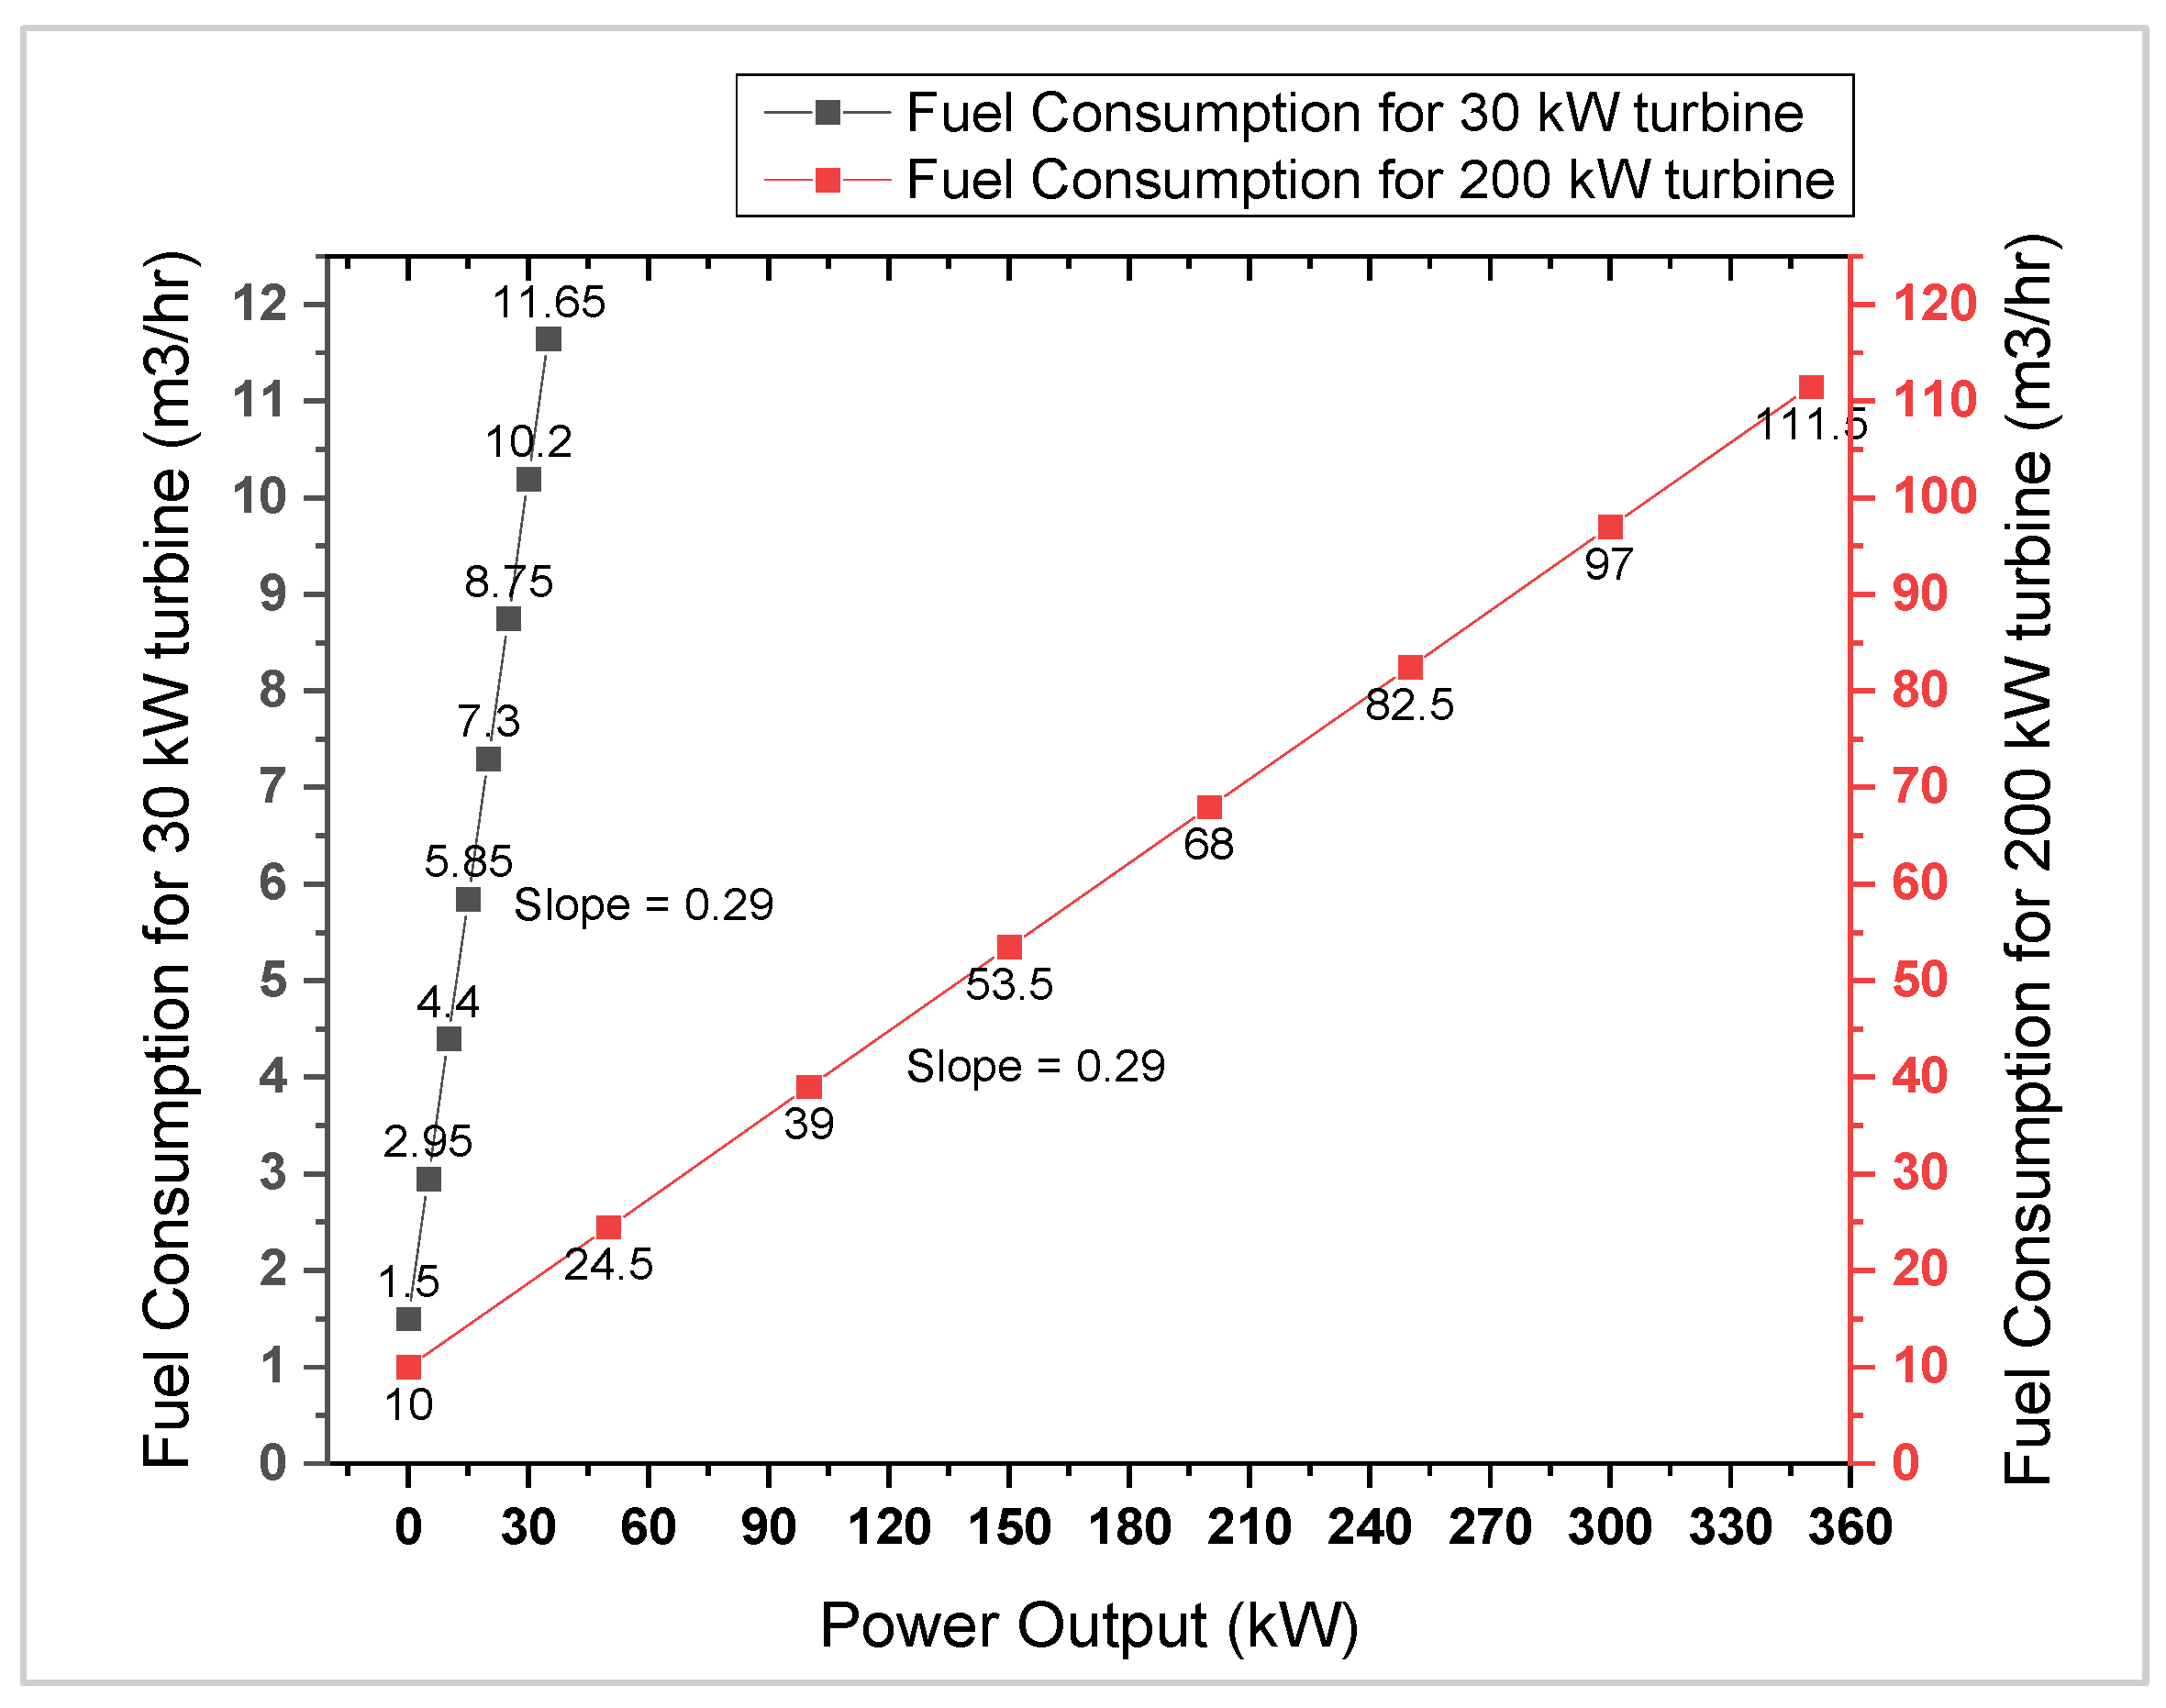
2.4. Gas Microturbine
2.5. Grid
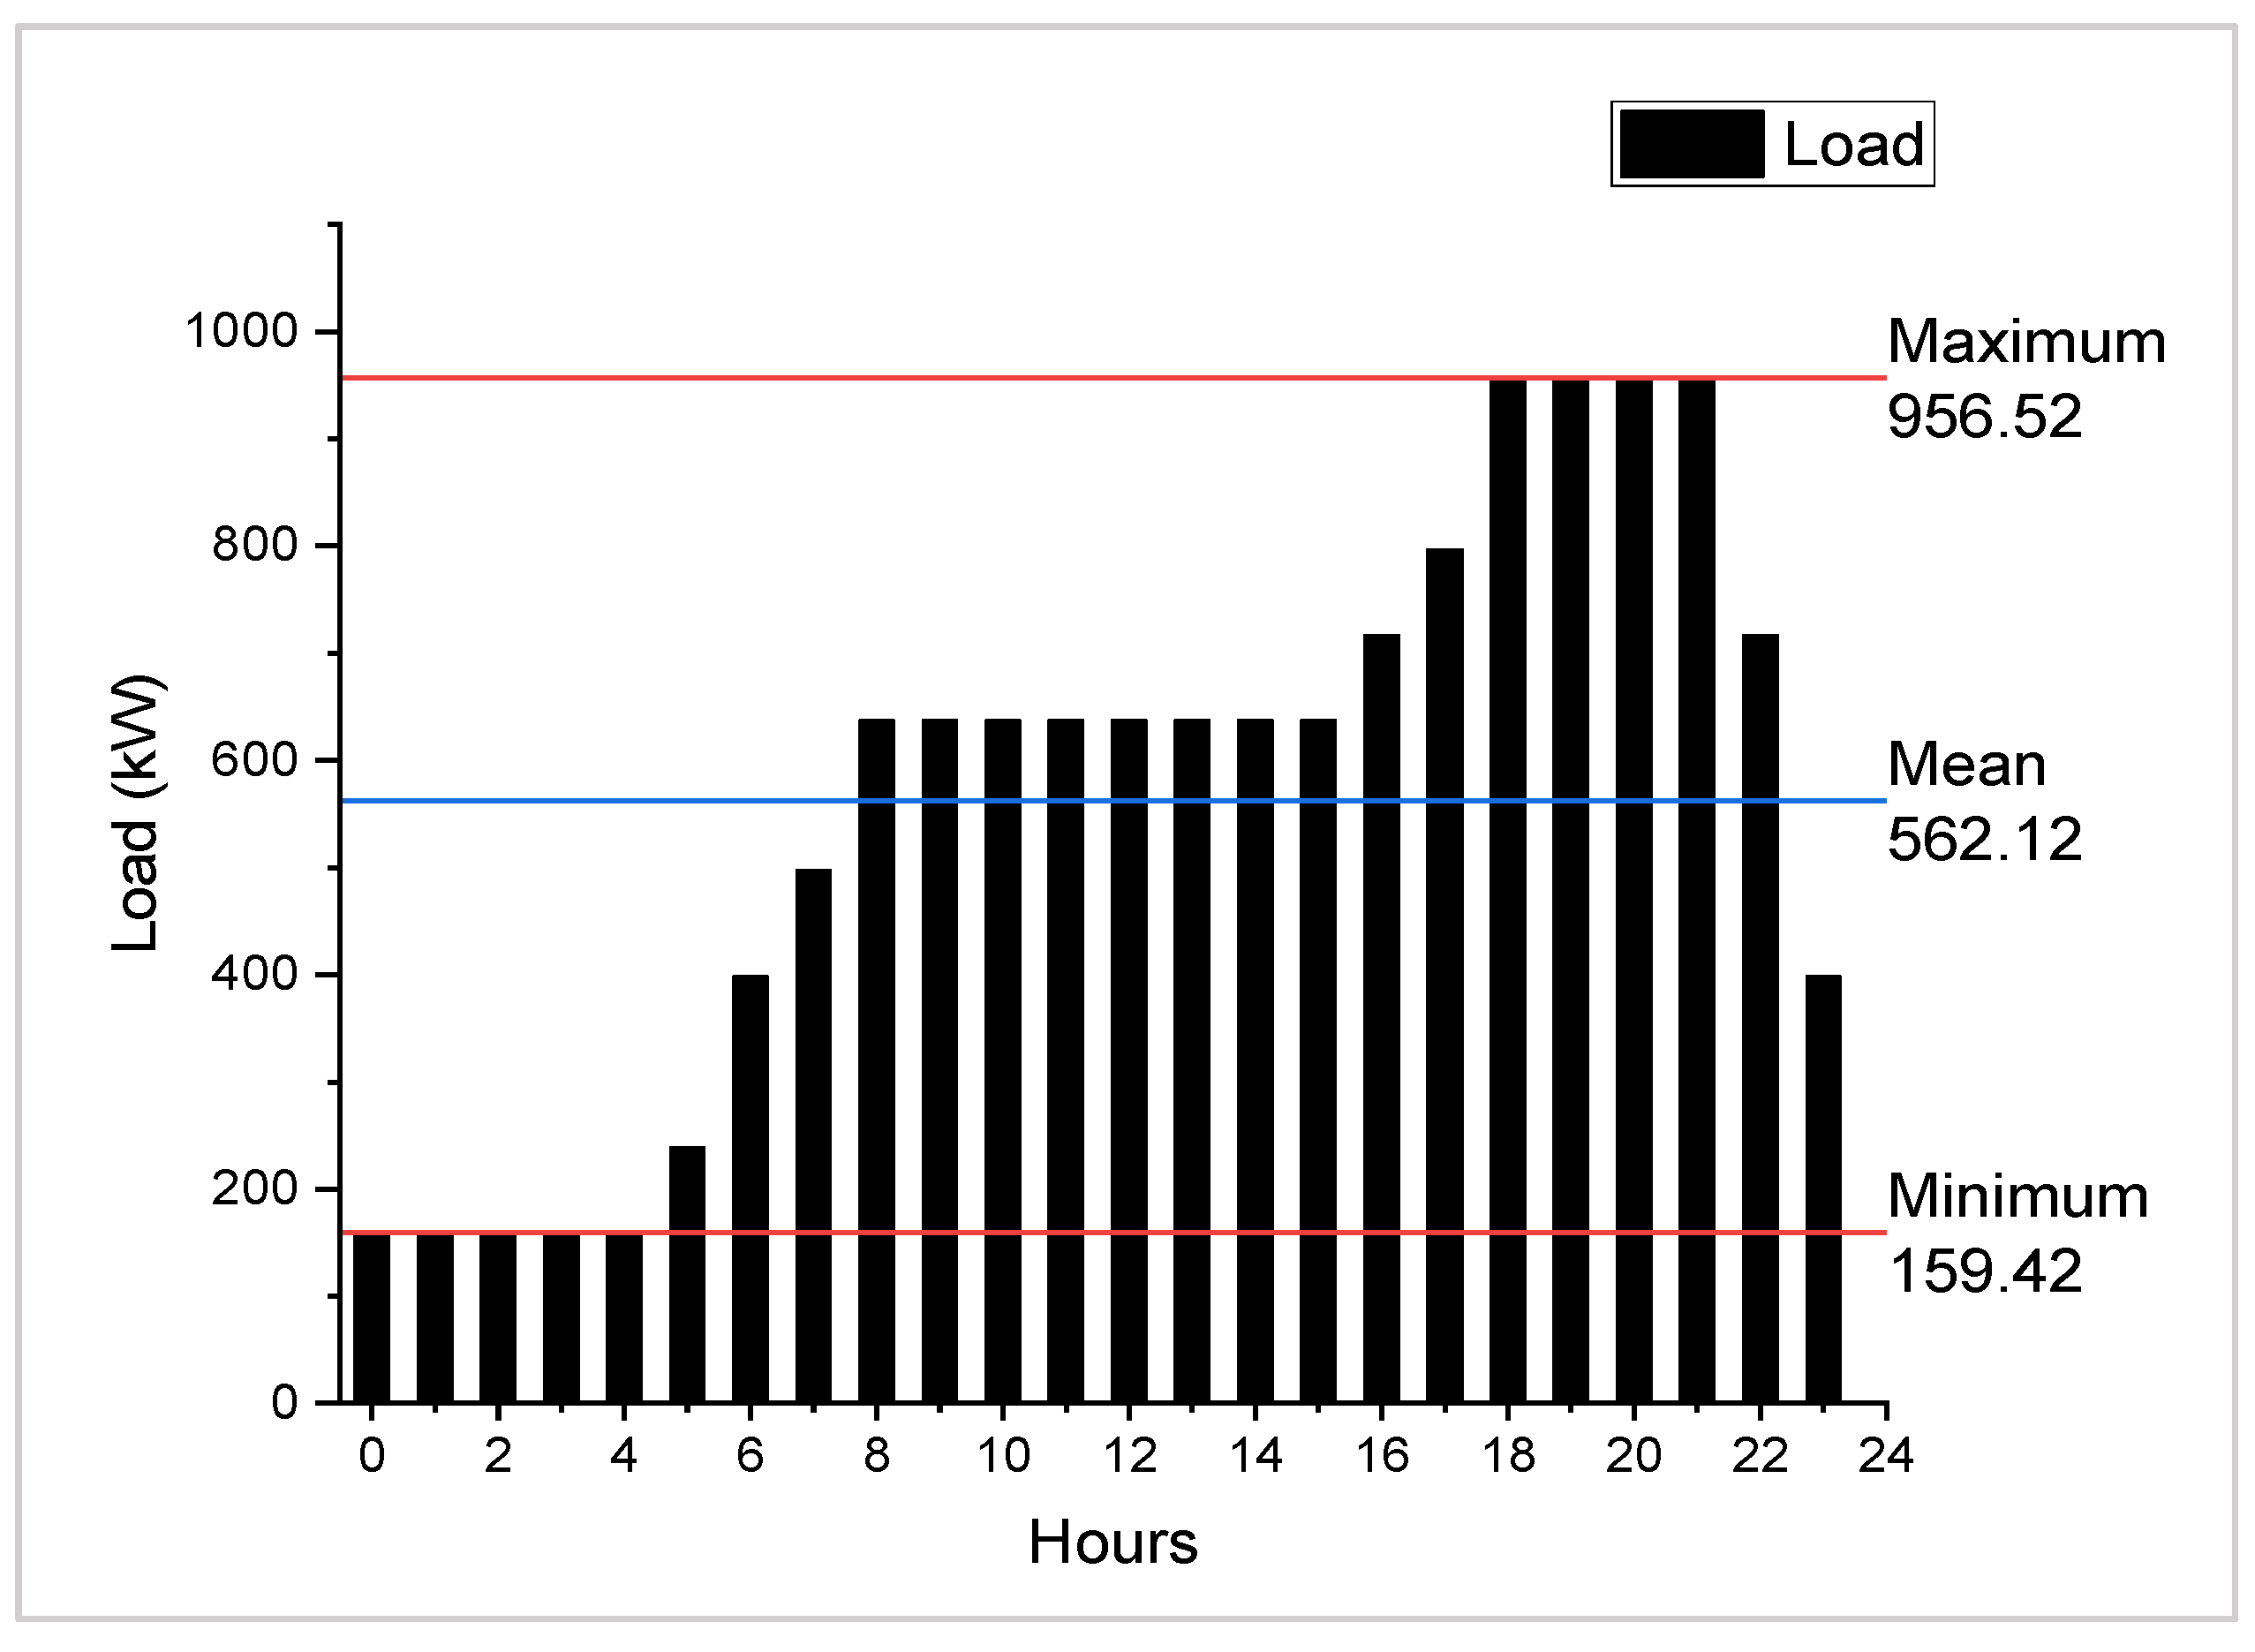
3. Load Demand Estimation
4. Economic Modelling and Objective Function
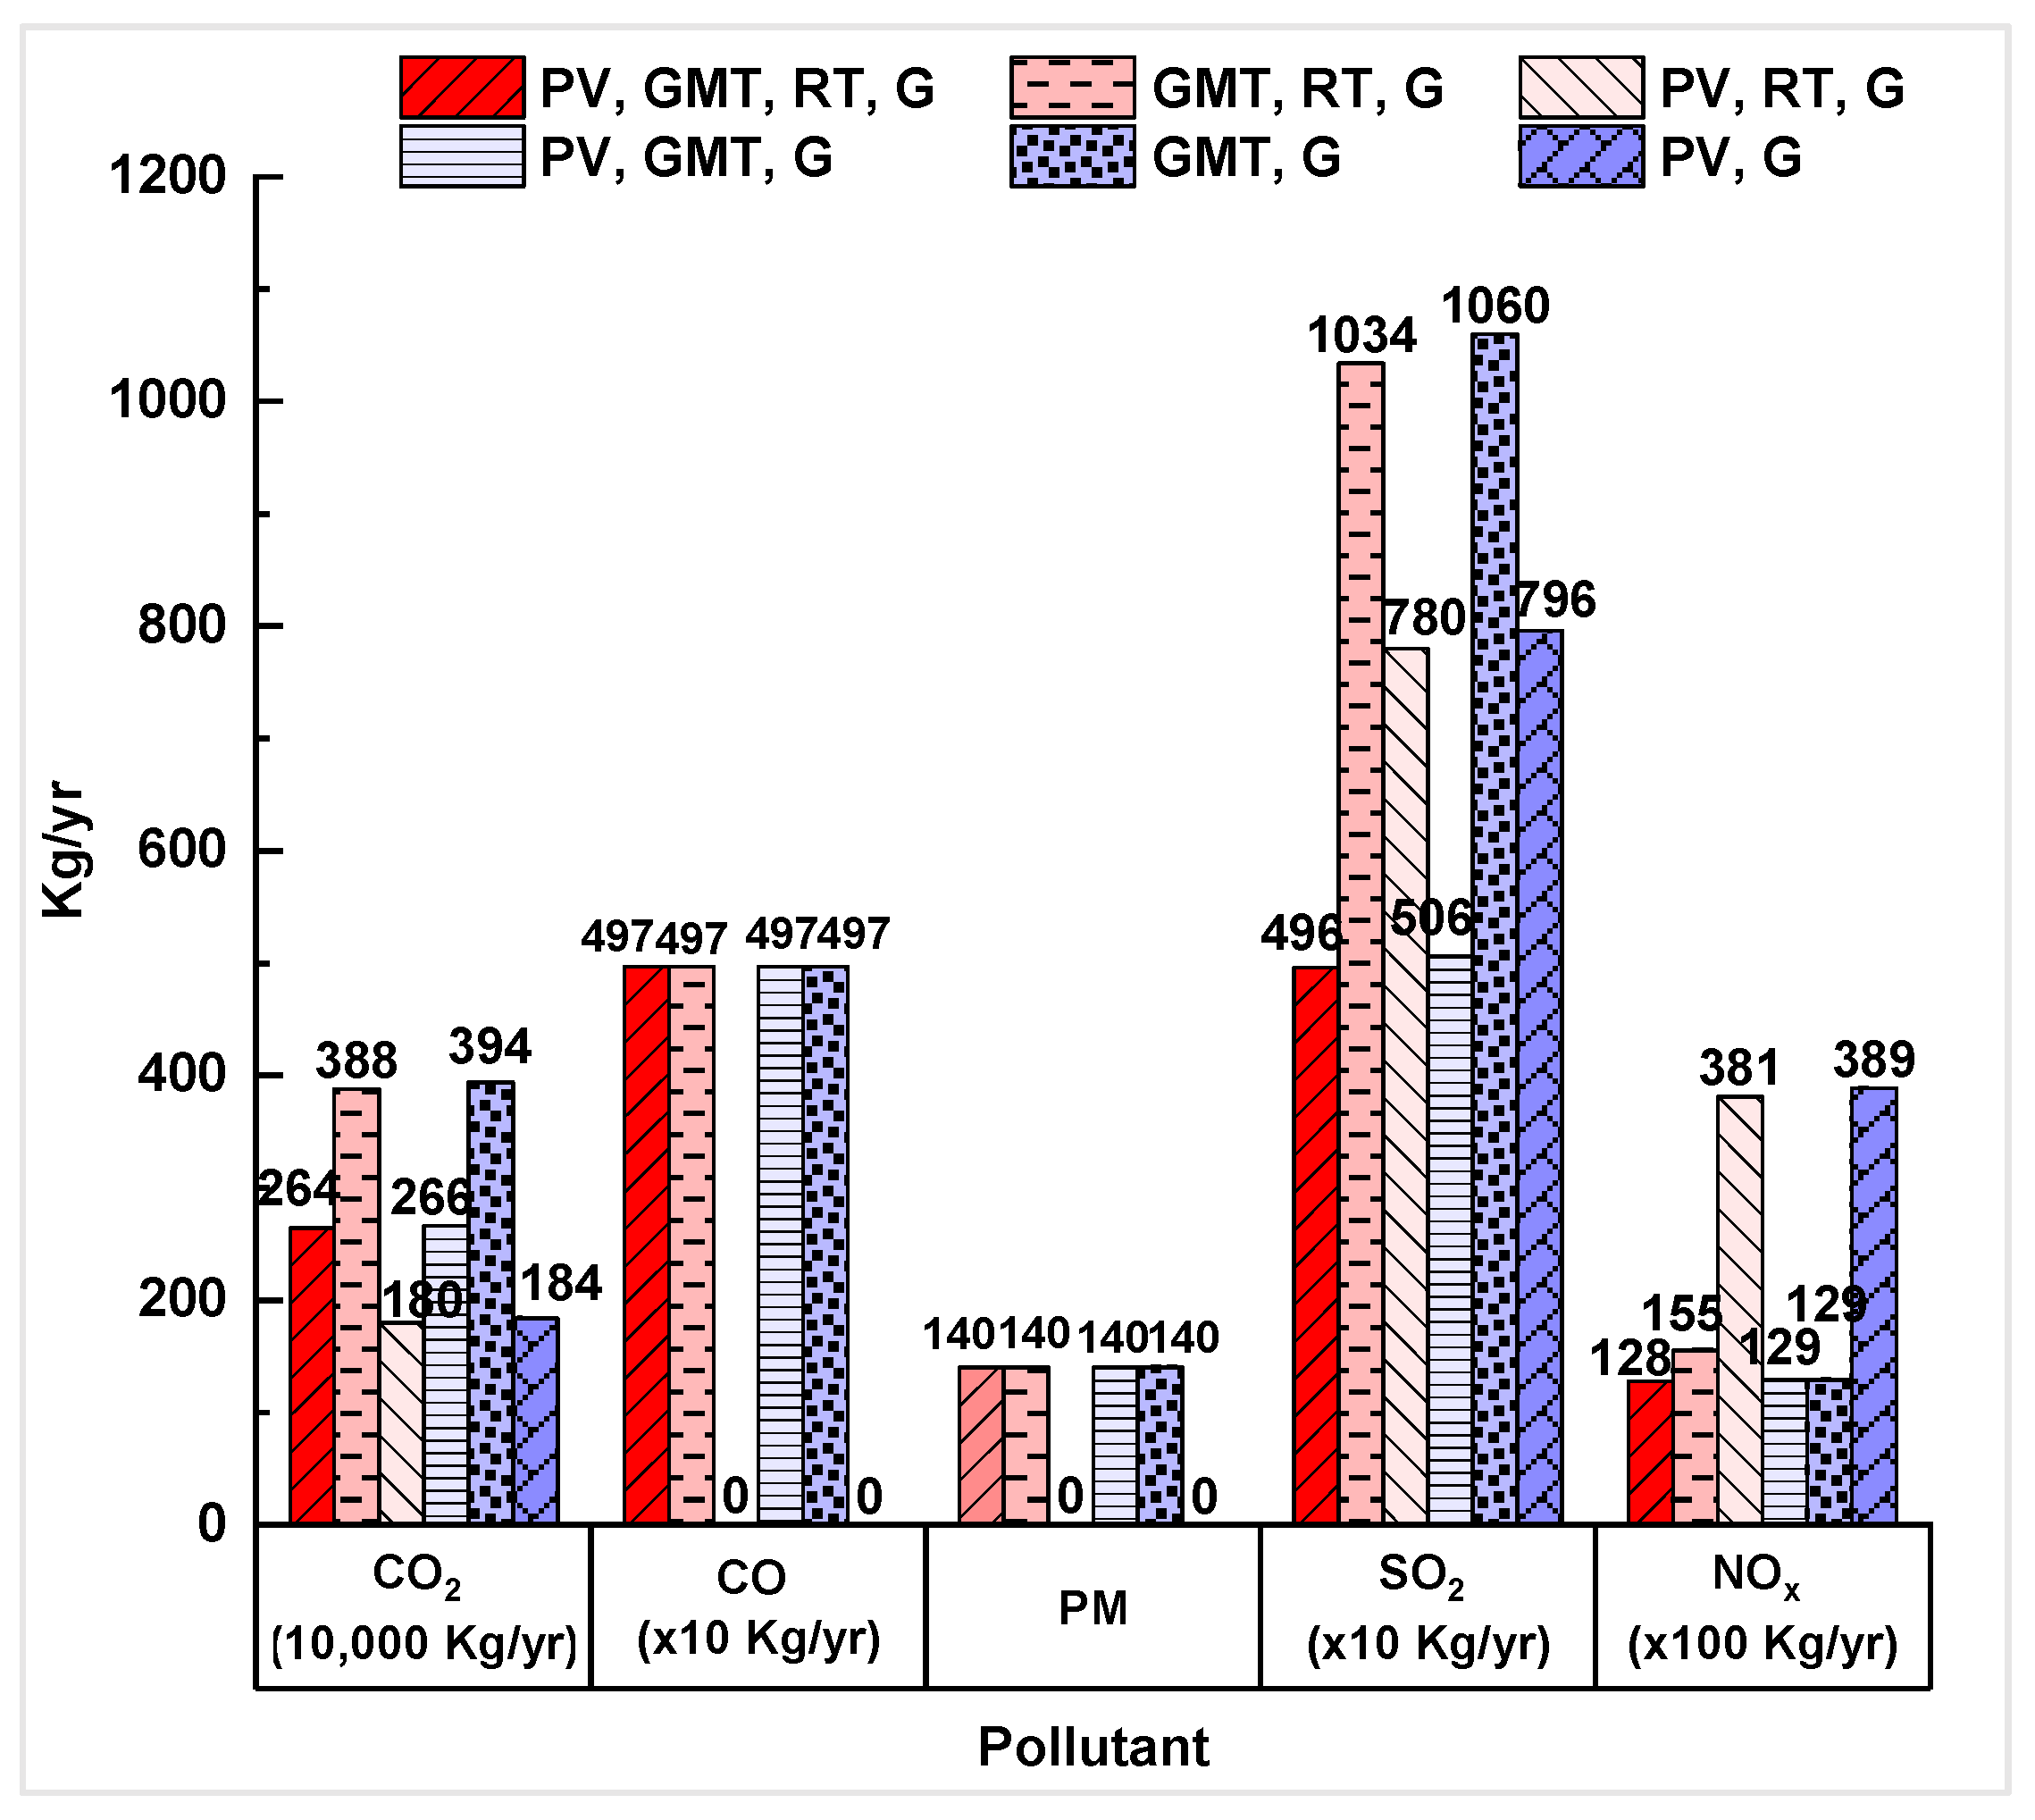
Environmental Suitability Indicators
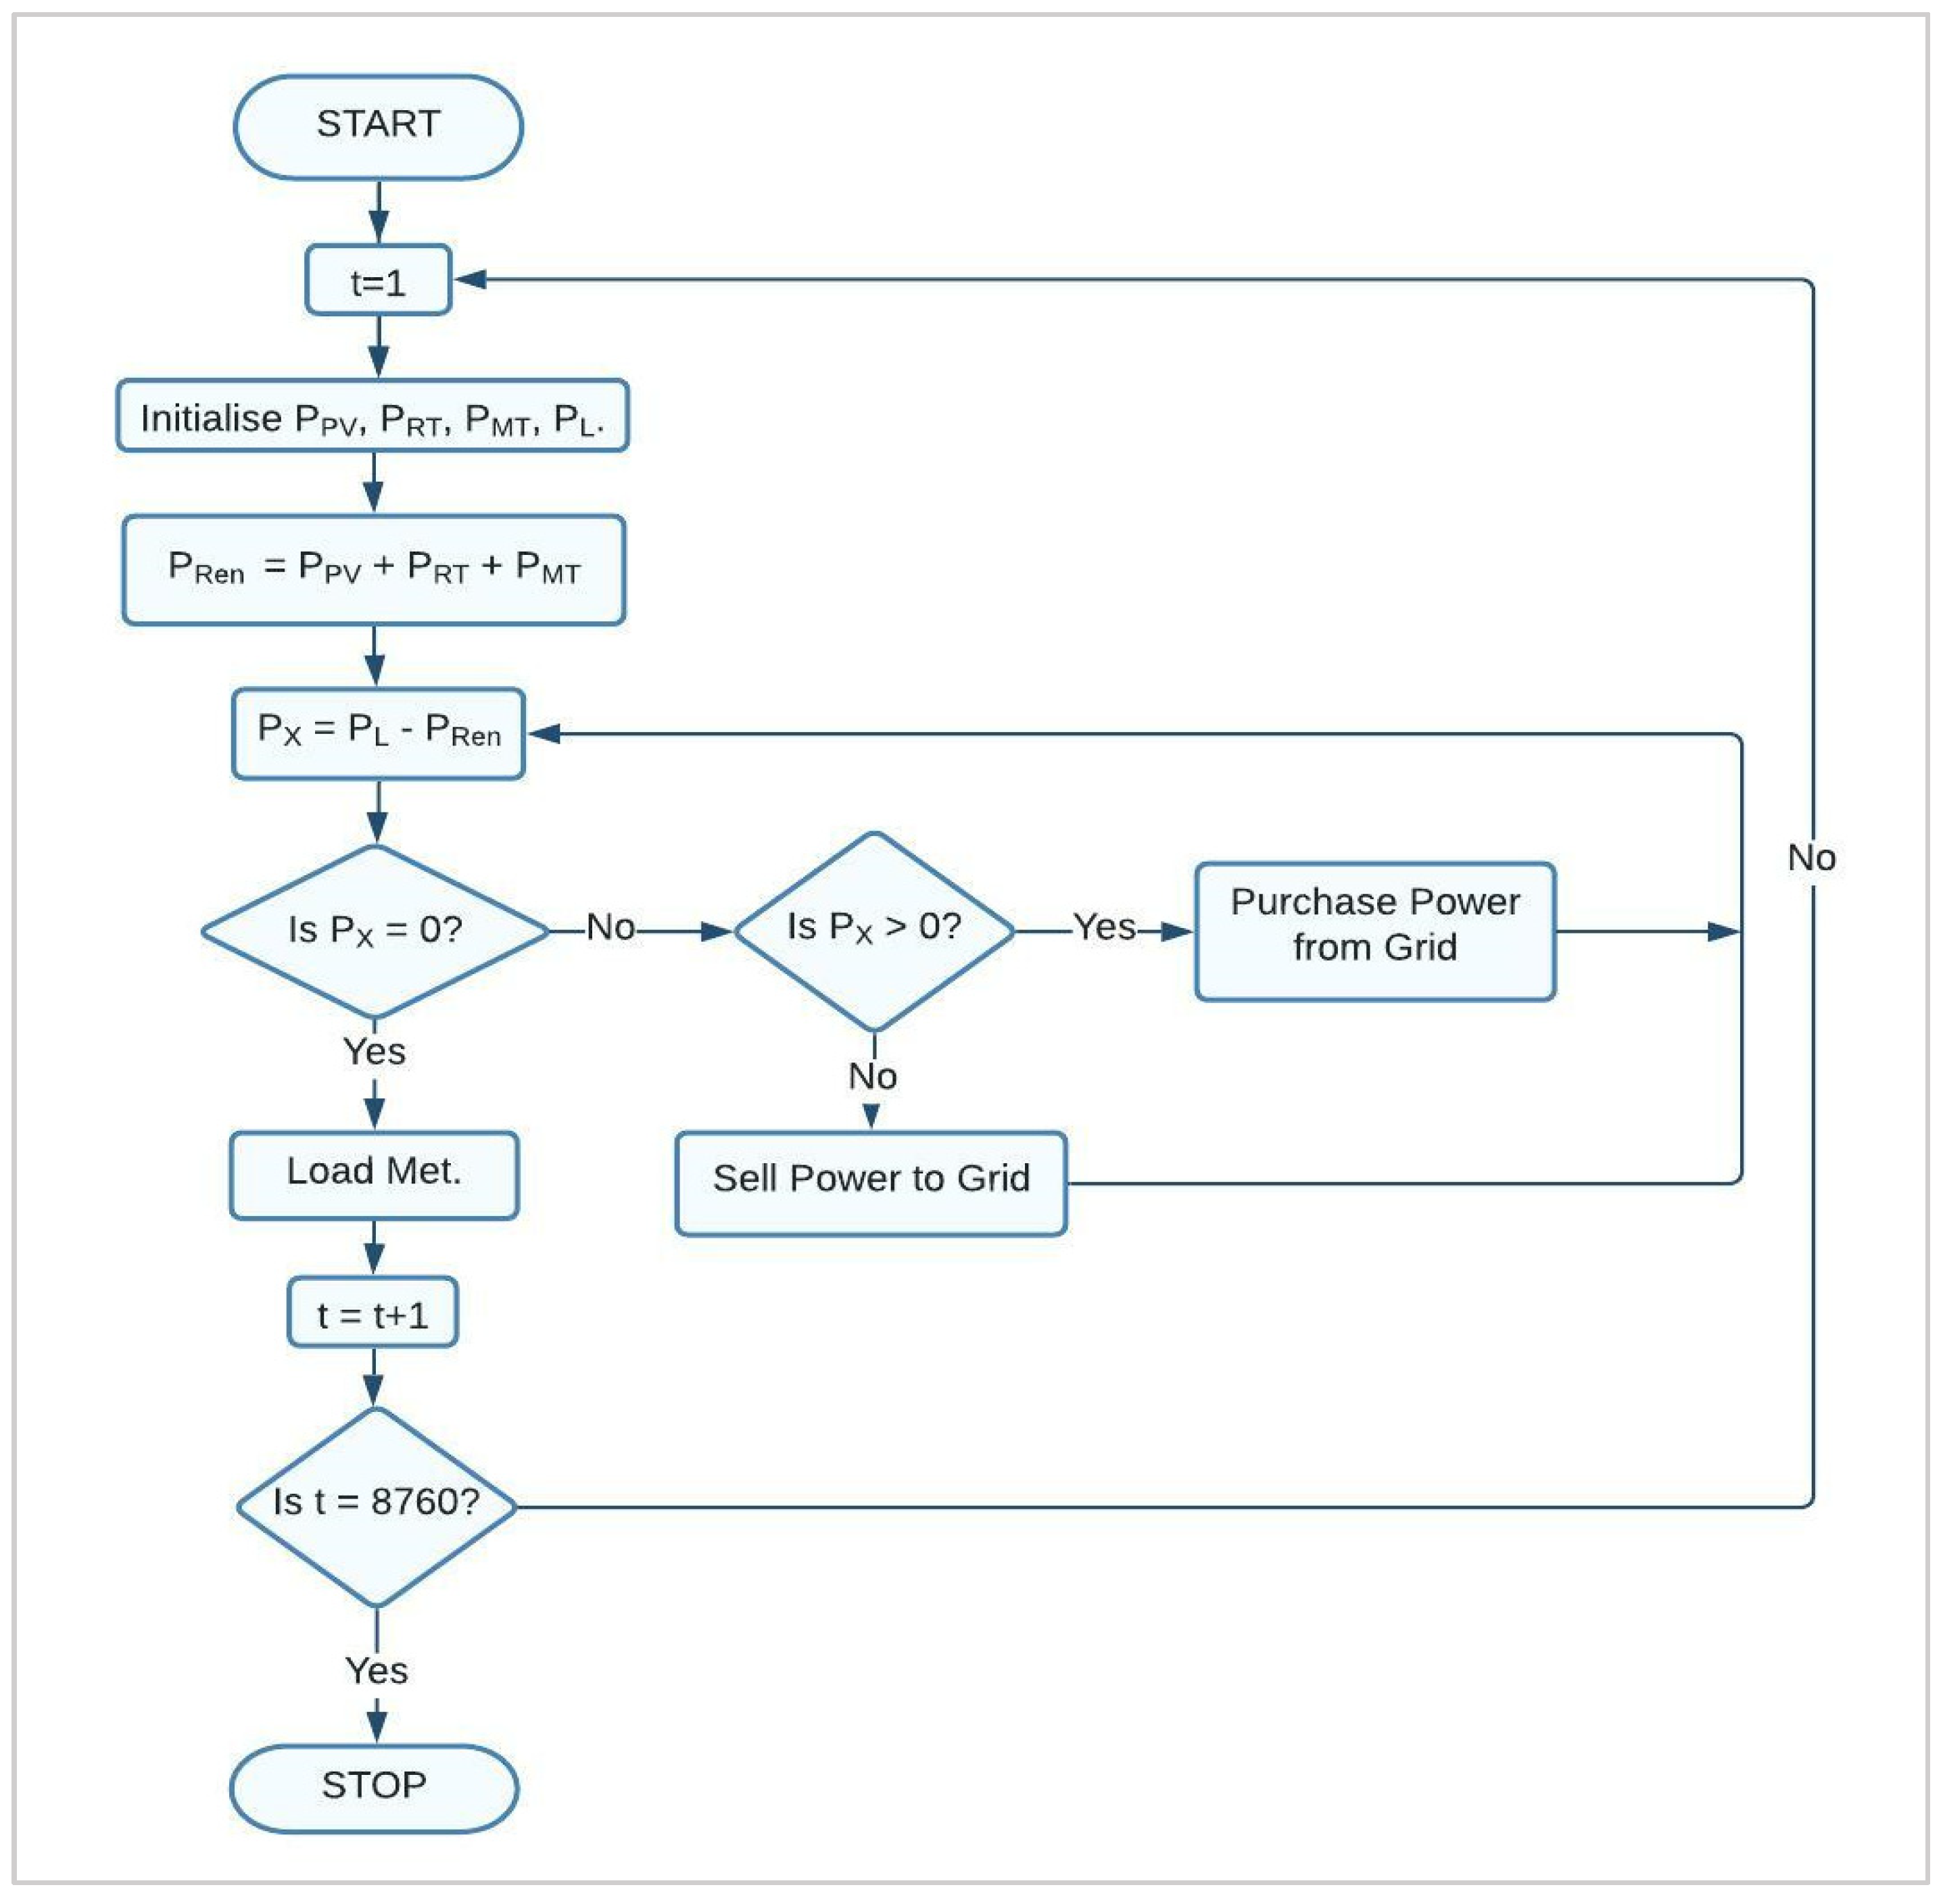
5. Dispatch Strategy
6. Optimization Constraints
- (1)
- Resource constraints: the selected study location has annual solar radiation of 3.14 kWh/m2/day [46], and annual average river flow of 3.152 m/s and 19.8 m/s in summers and winters, respectively.
- (2)
- Economic: the nominal discount rate determines the present lump sum value of future cash flows. A nominal discount rate of 8% was considered for the present study. Considering the scale of the current operational project in ONGC Nazira [39] and the availability of the natural gas reserves in the area [58], a project lifetime of 25 years was considered.
- (3)
- Technical: an operating reserve of 10% was selected as a percentage of the load. This accounts for abrupt changes in load patterns, and an active operating reserve of 50% was considered for solar photovoltaic to deal with the intermittent weather conditions.
- (4)
- Reliability: to ensure high levels of power supply reliability, the ‘caidi’ index—the average number of interruptions per year—was considered 0%.
- (5)
- Emission: currently, there is no law on emission penalties in Assam. Therefore, the emission penalties for CO2, nitrogen oxides, carbon monoxide, particulate matter, sulphur dioxides, were assumed to be zero.
7. Results and Discussion
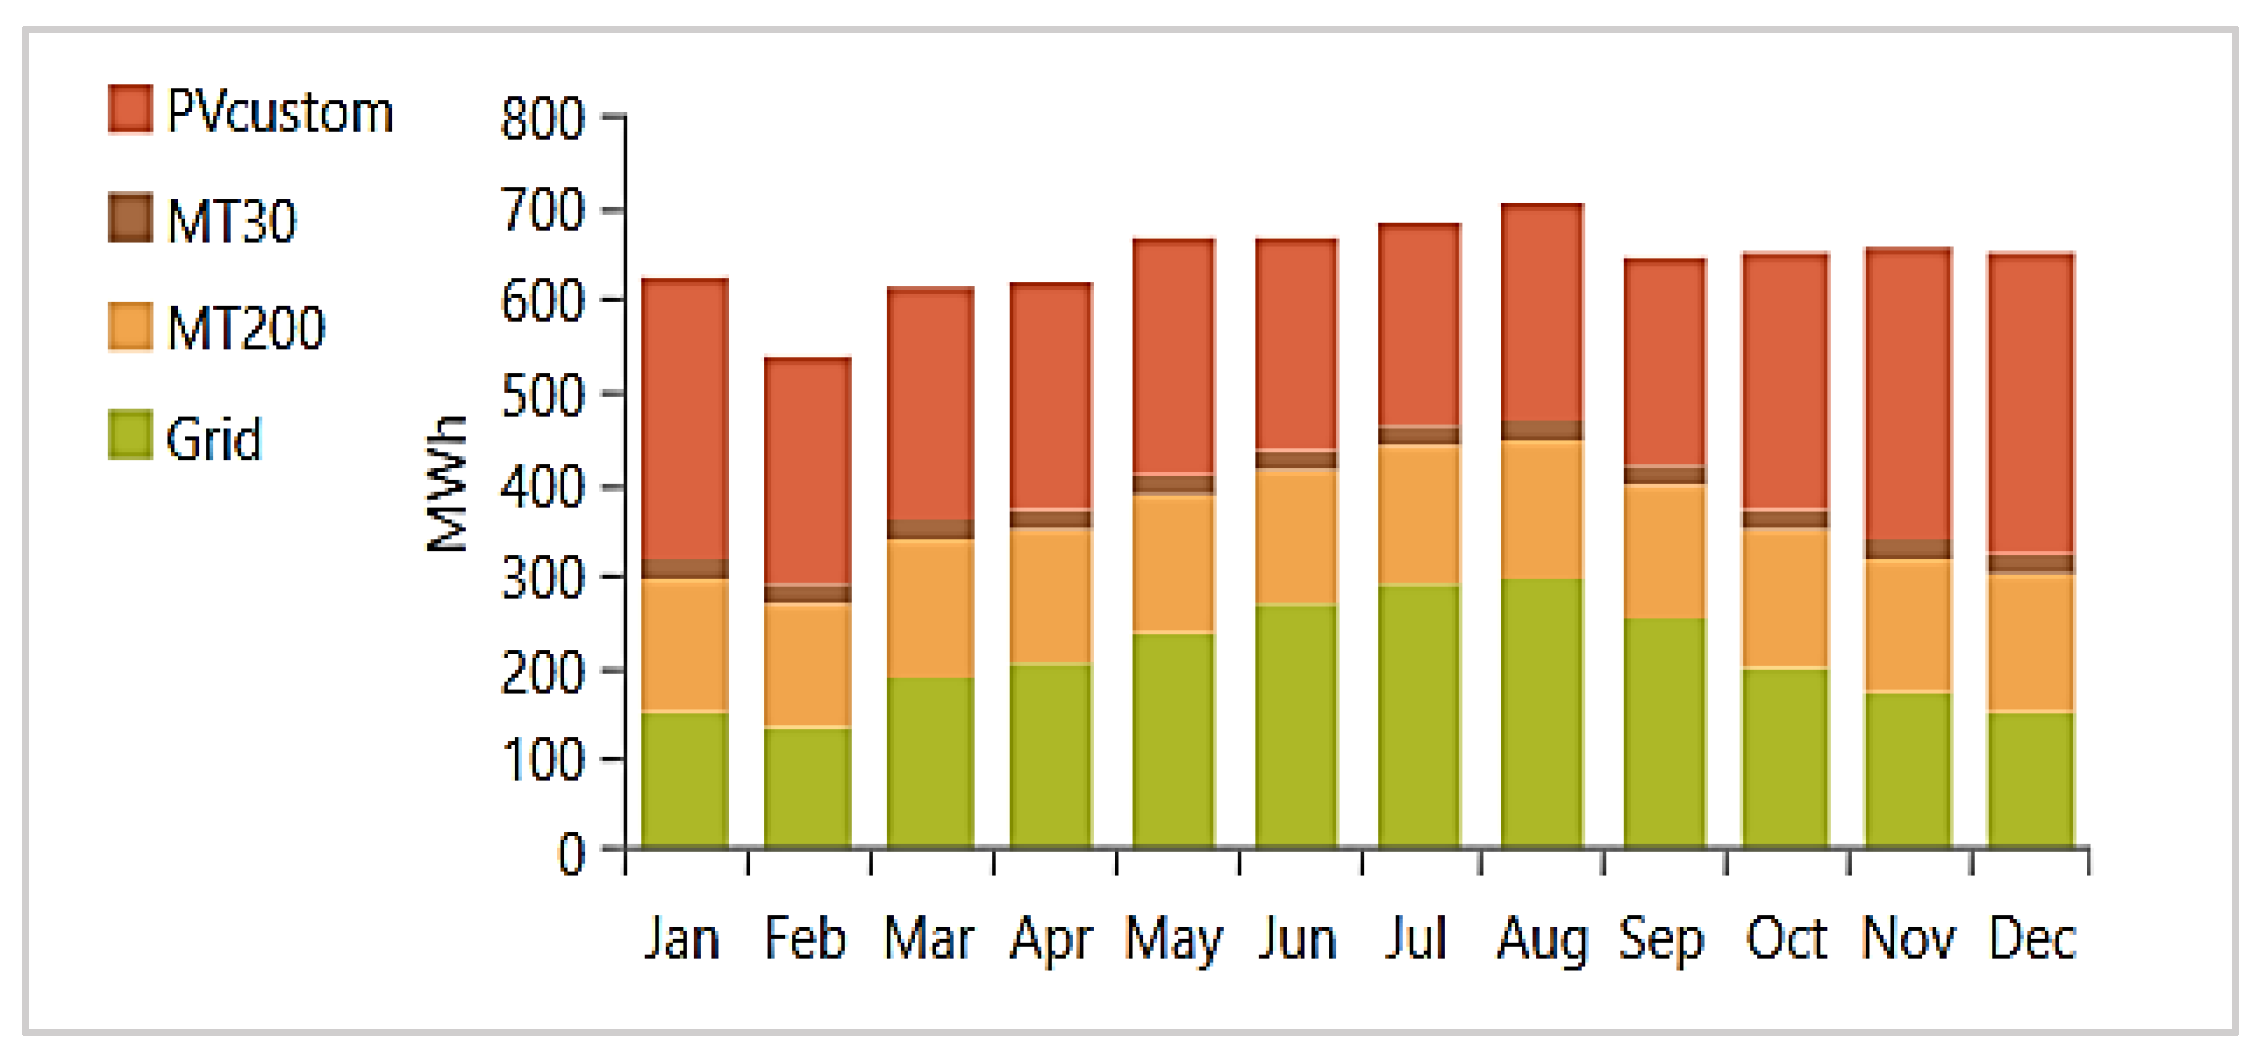
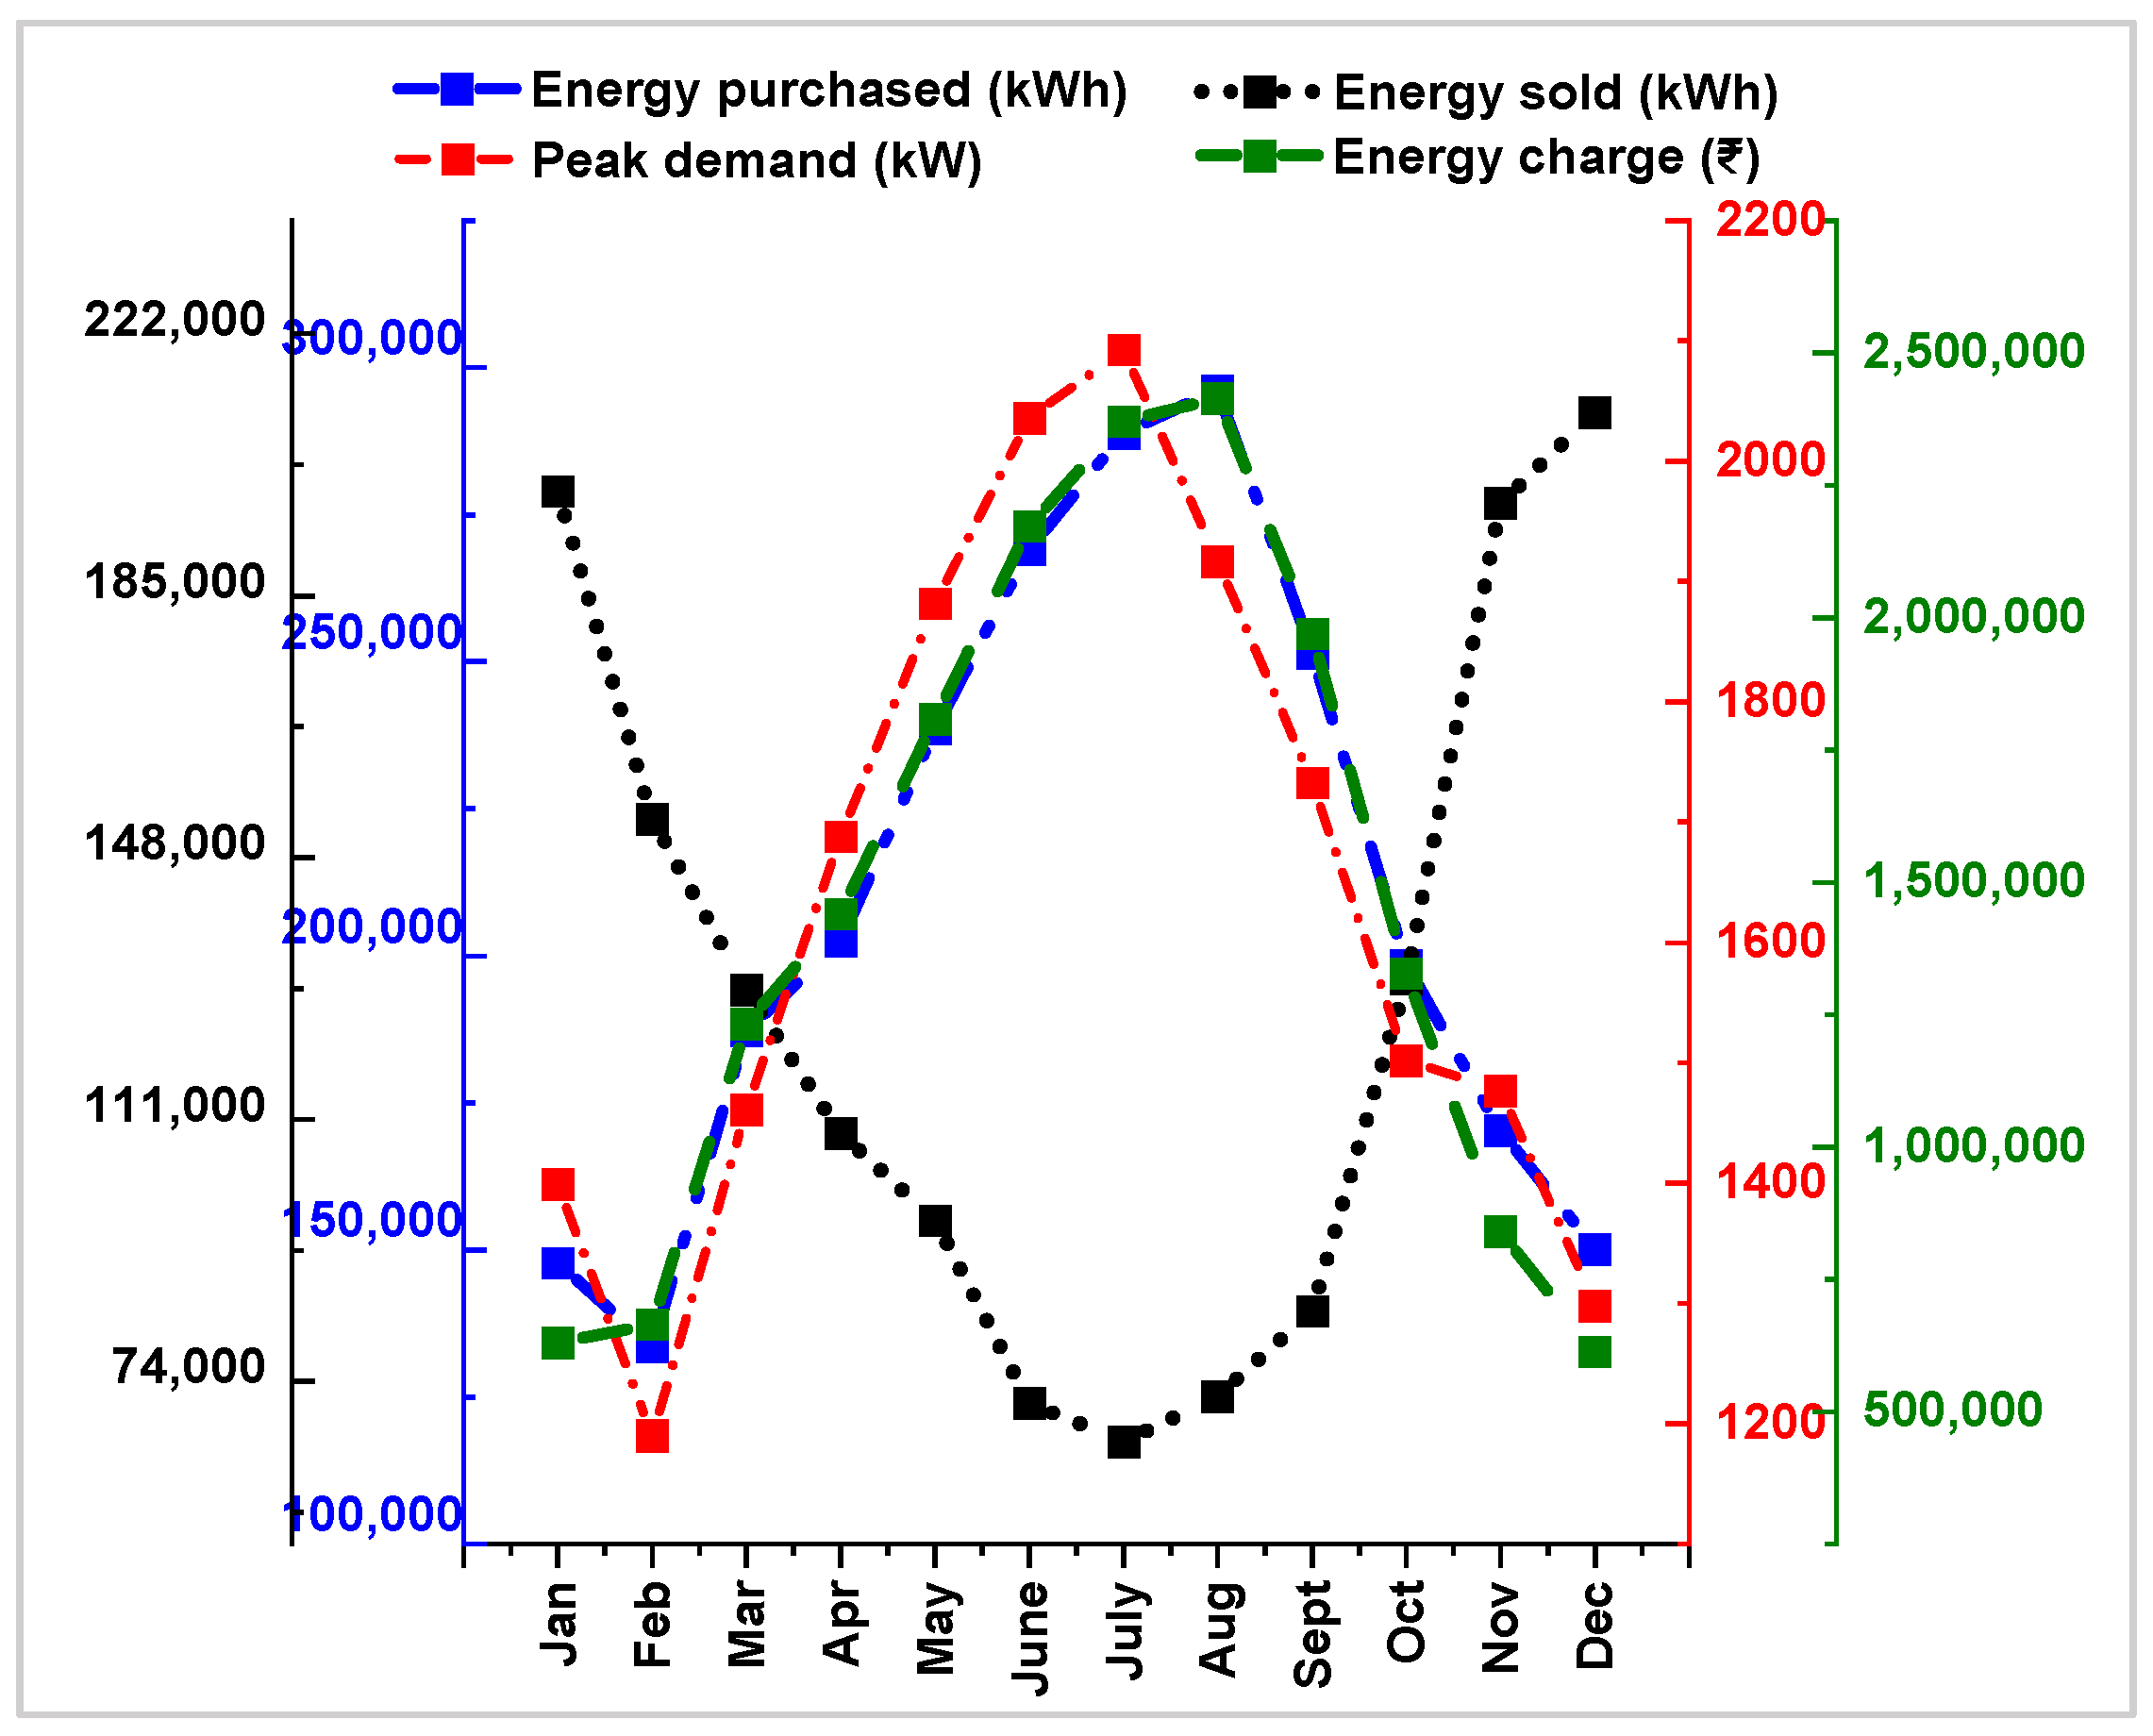
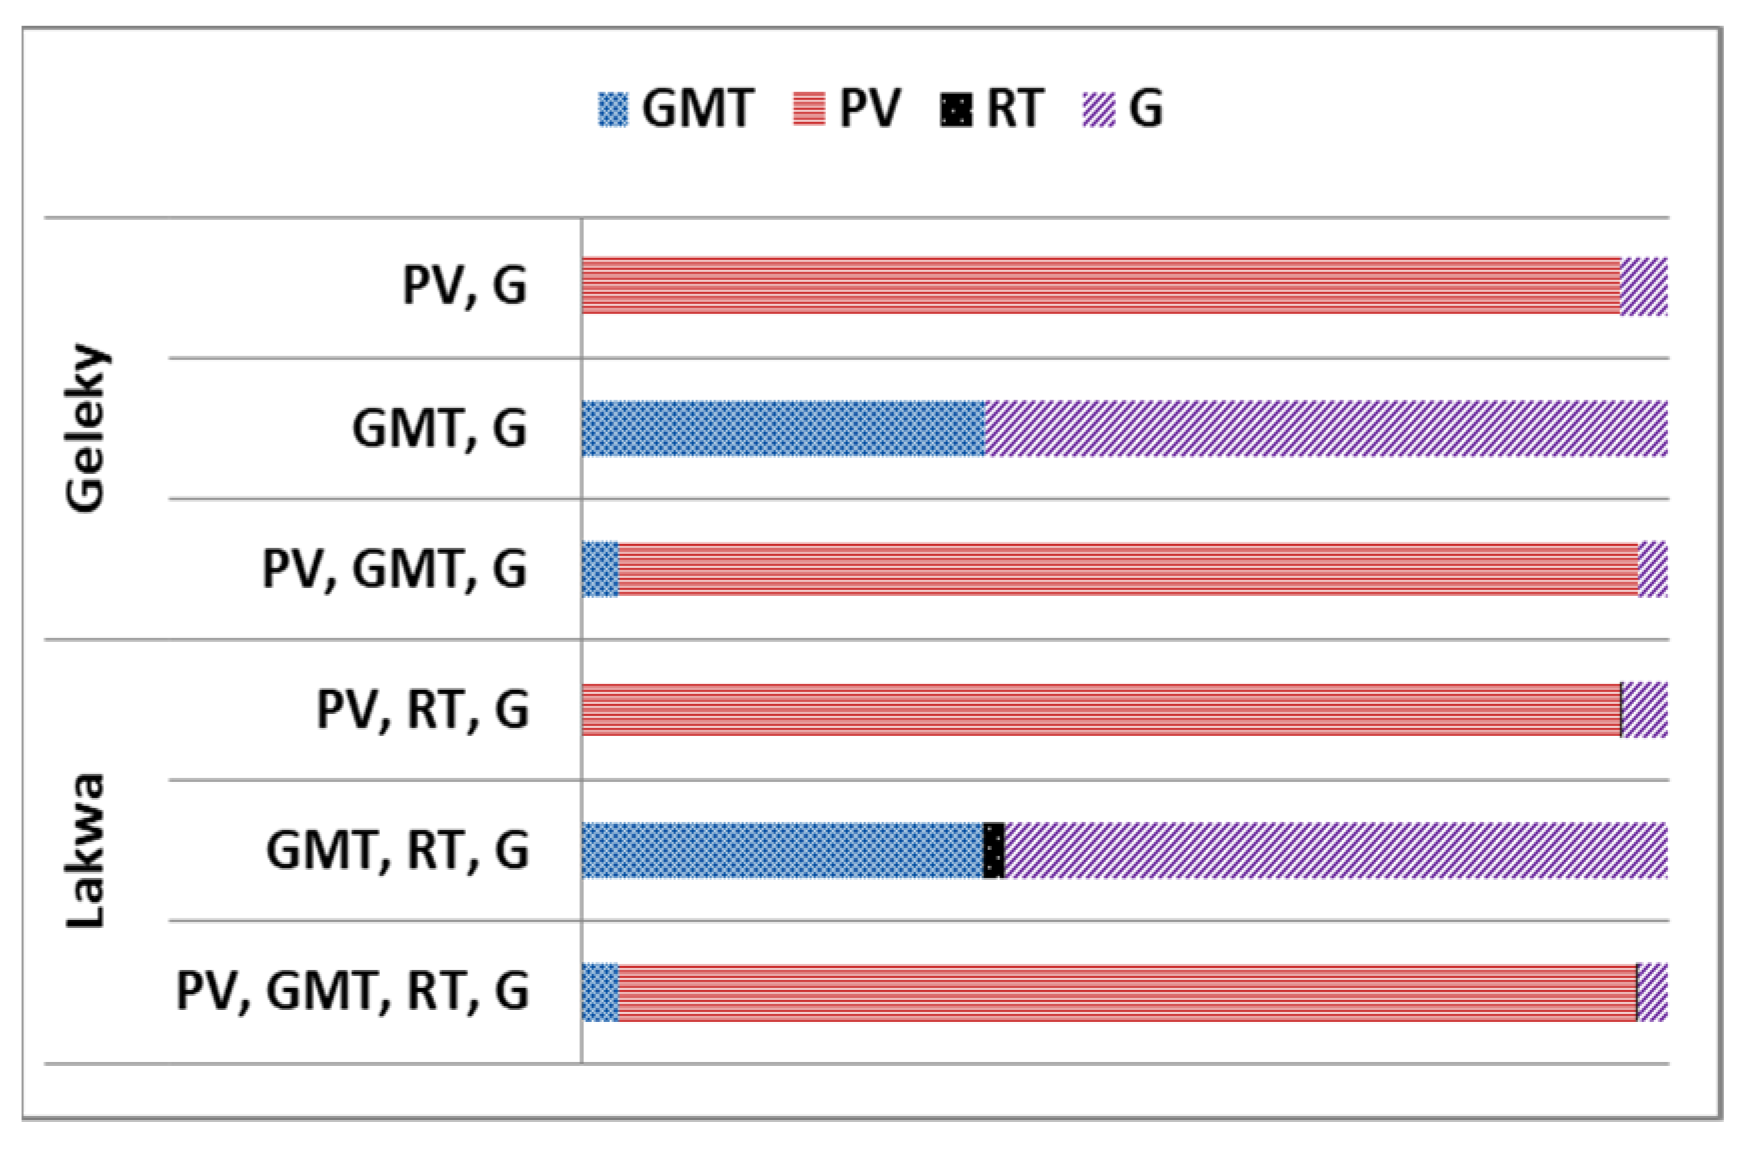
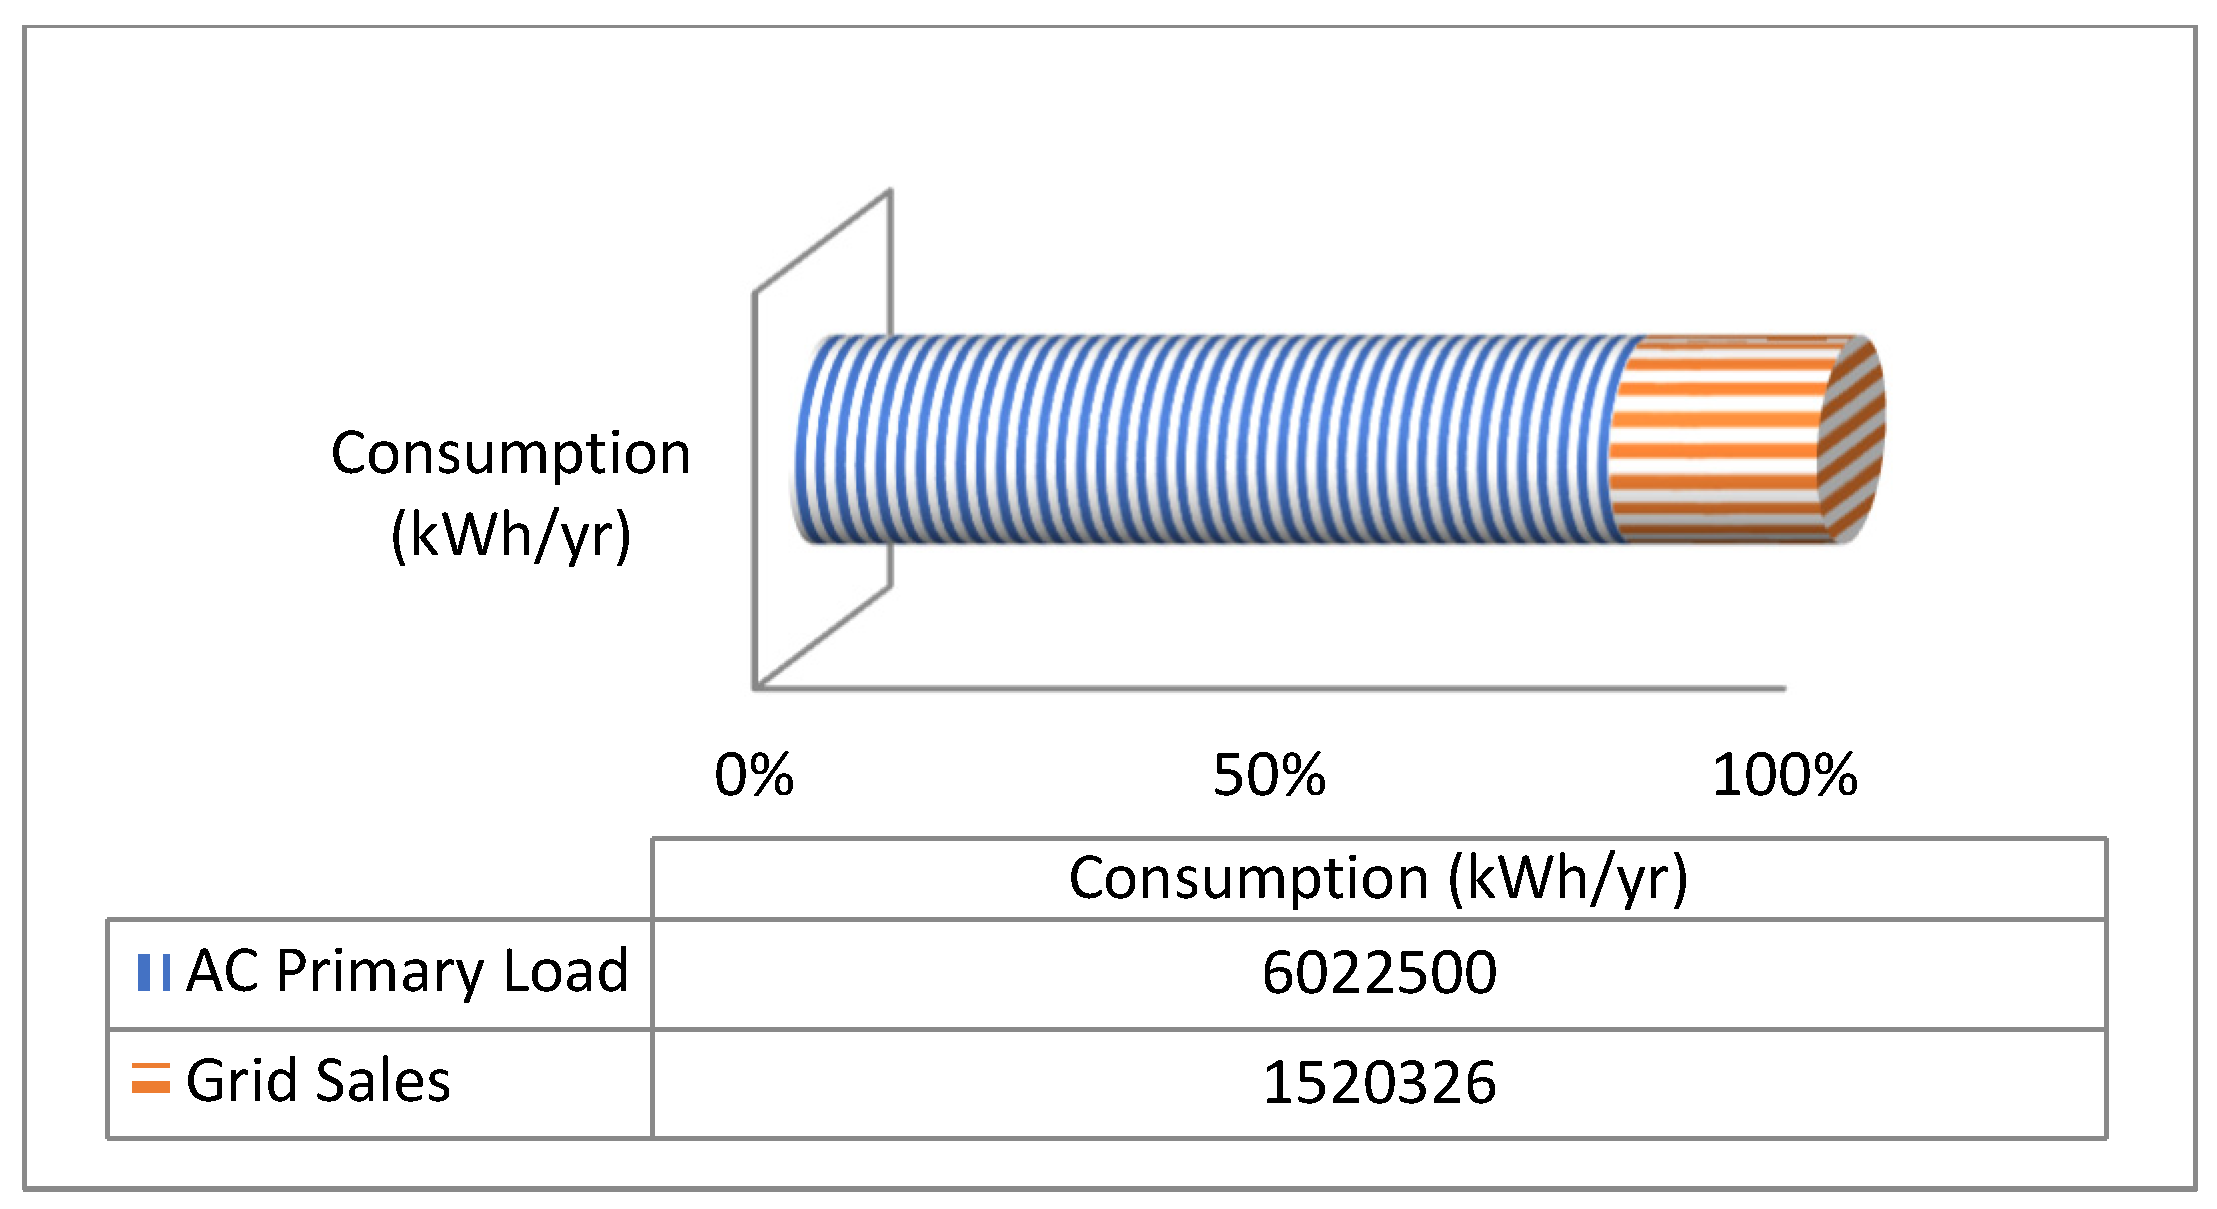
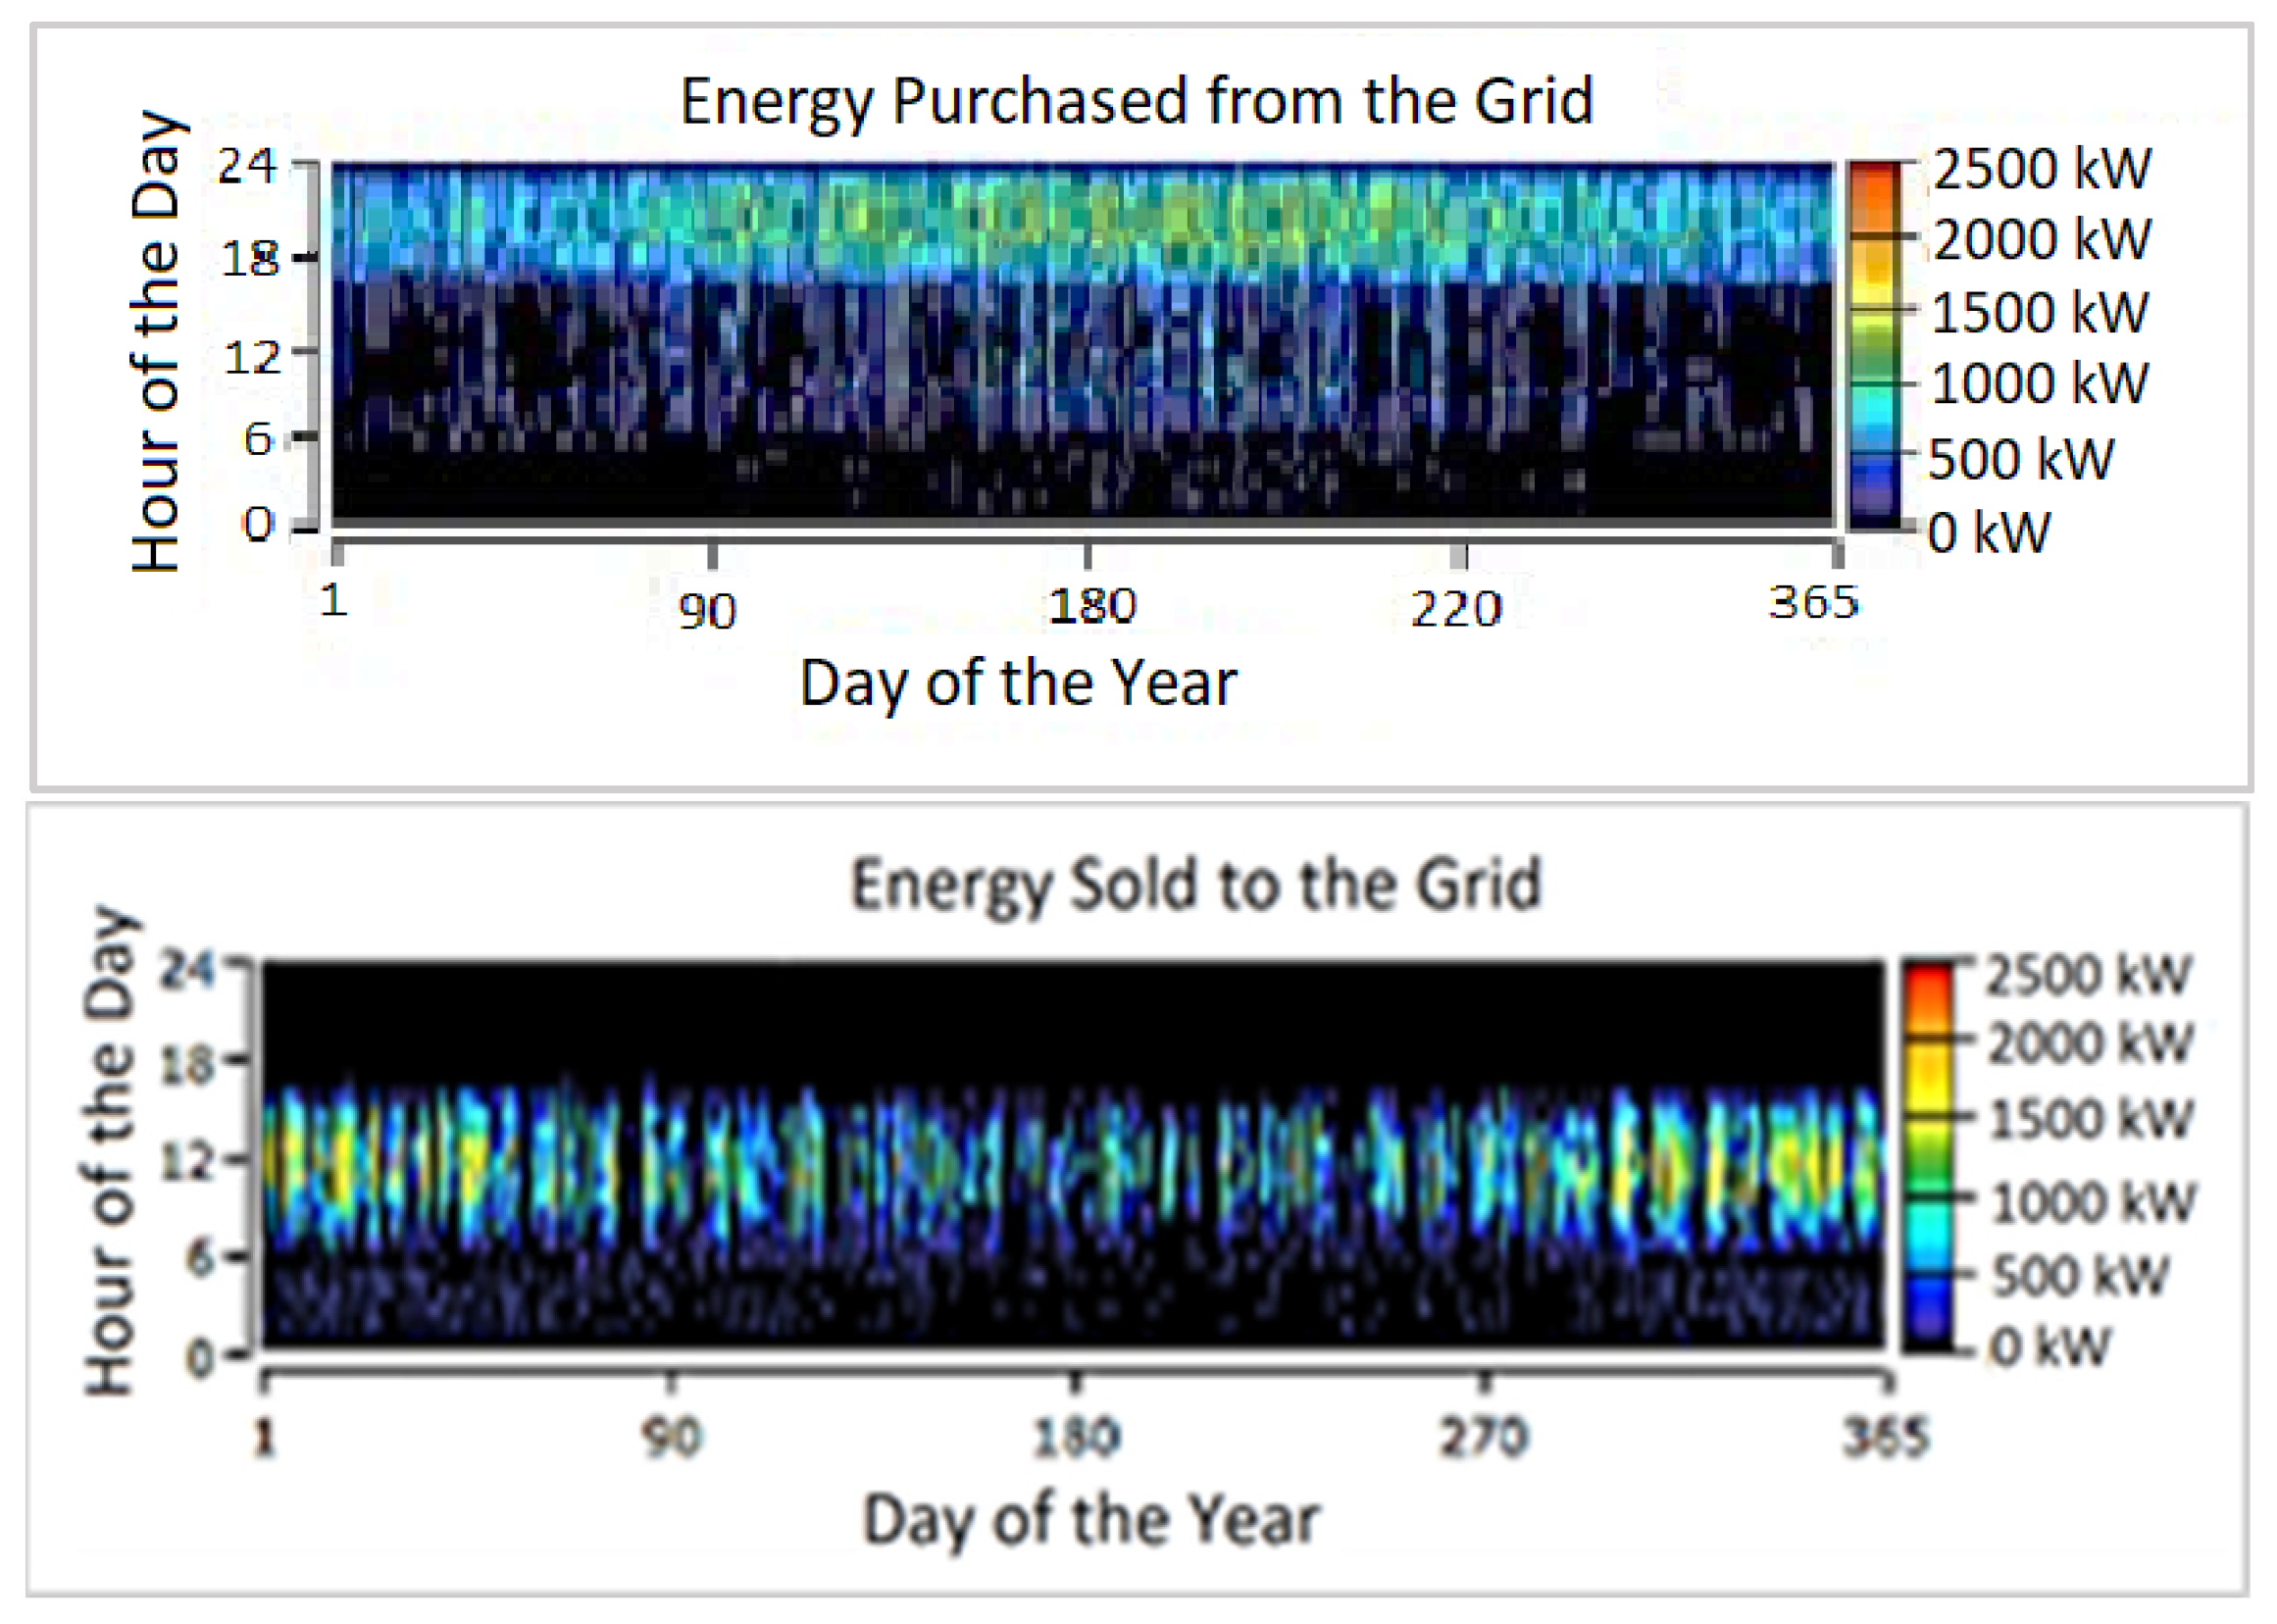
7.1. Production Analysis of the Most Optimal Solution (PV/GMT/G)
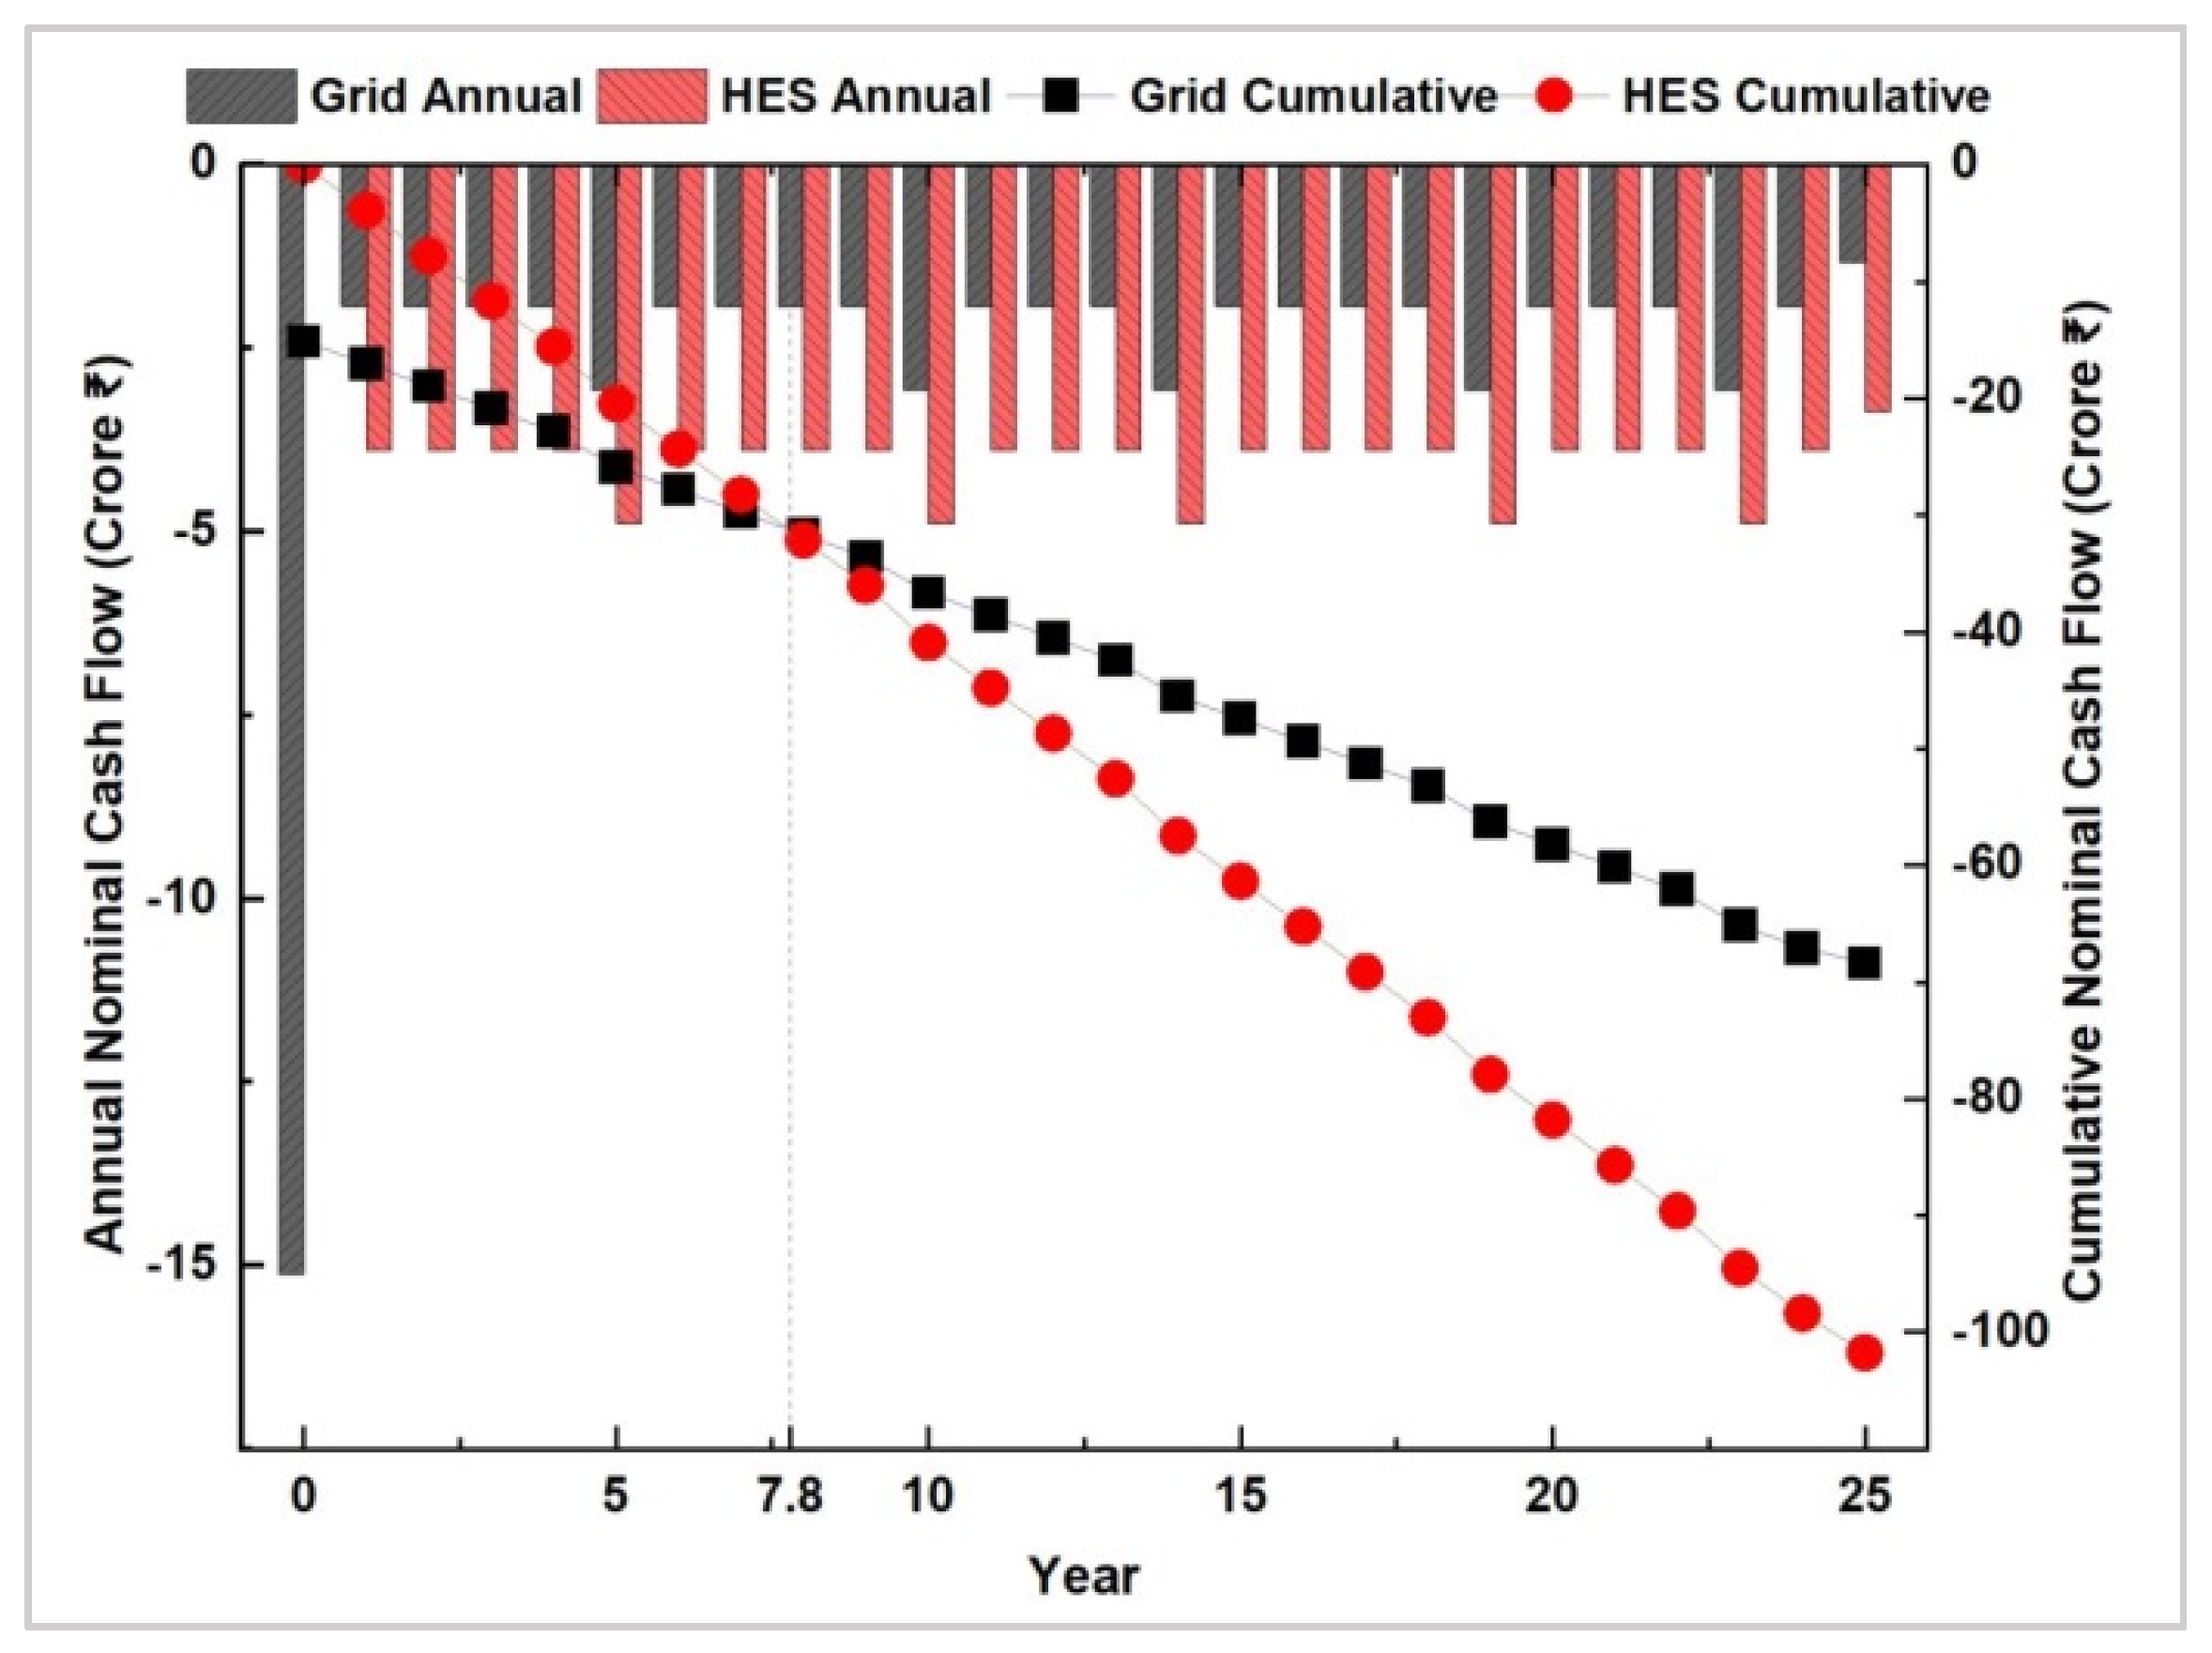
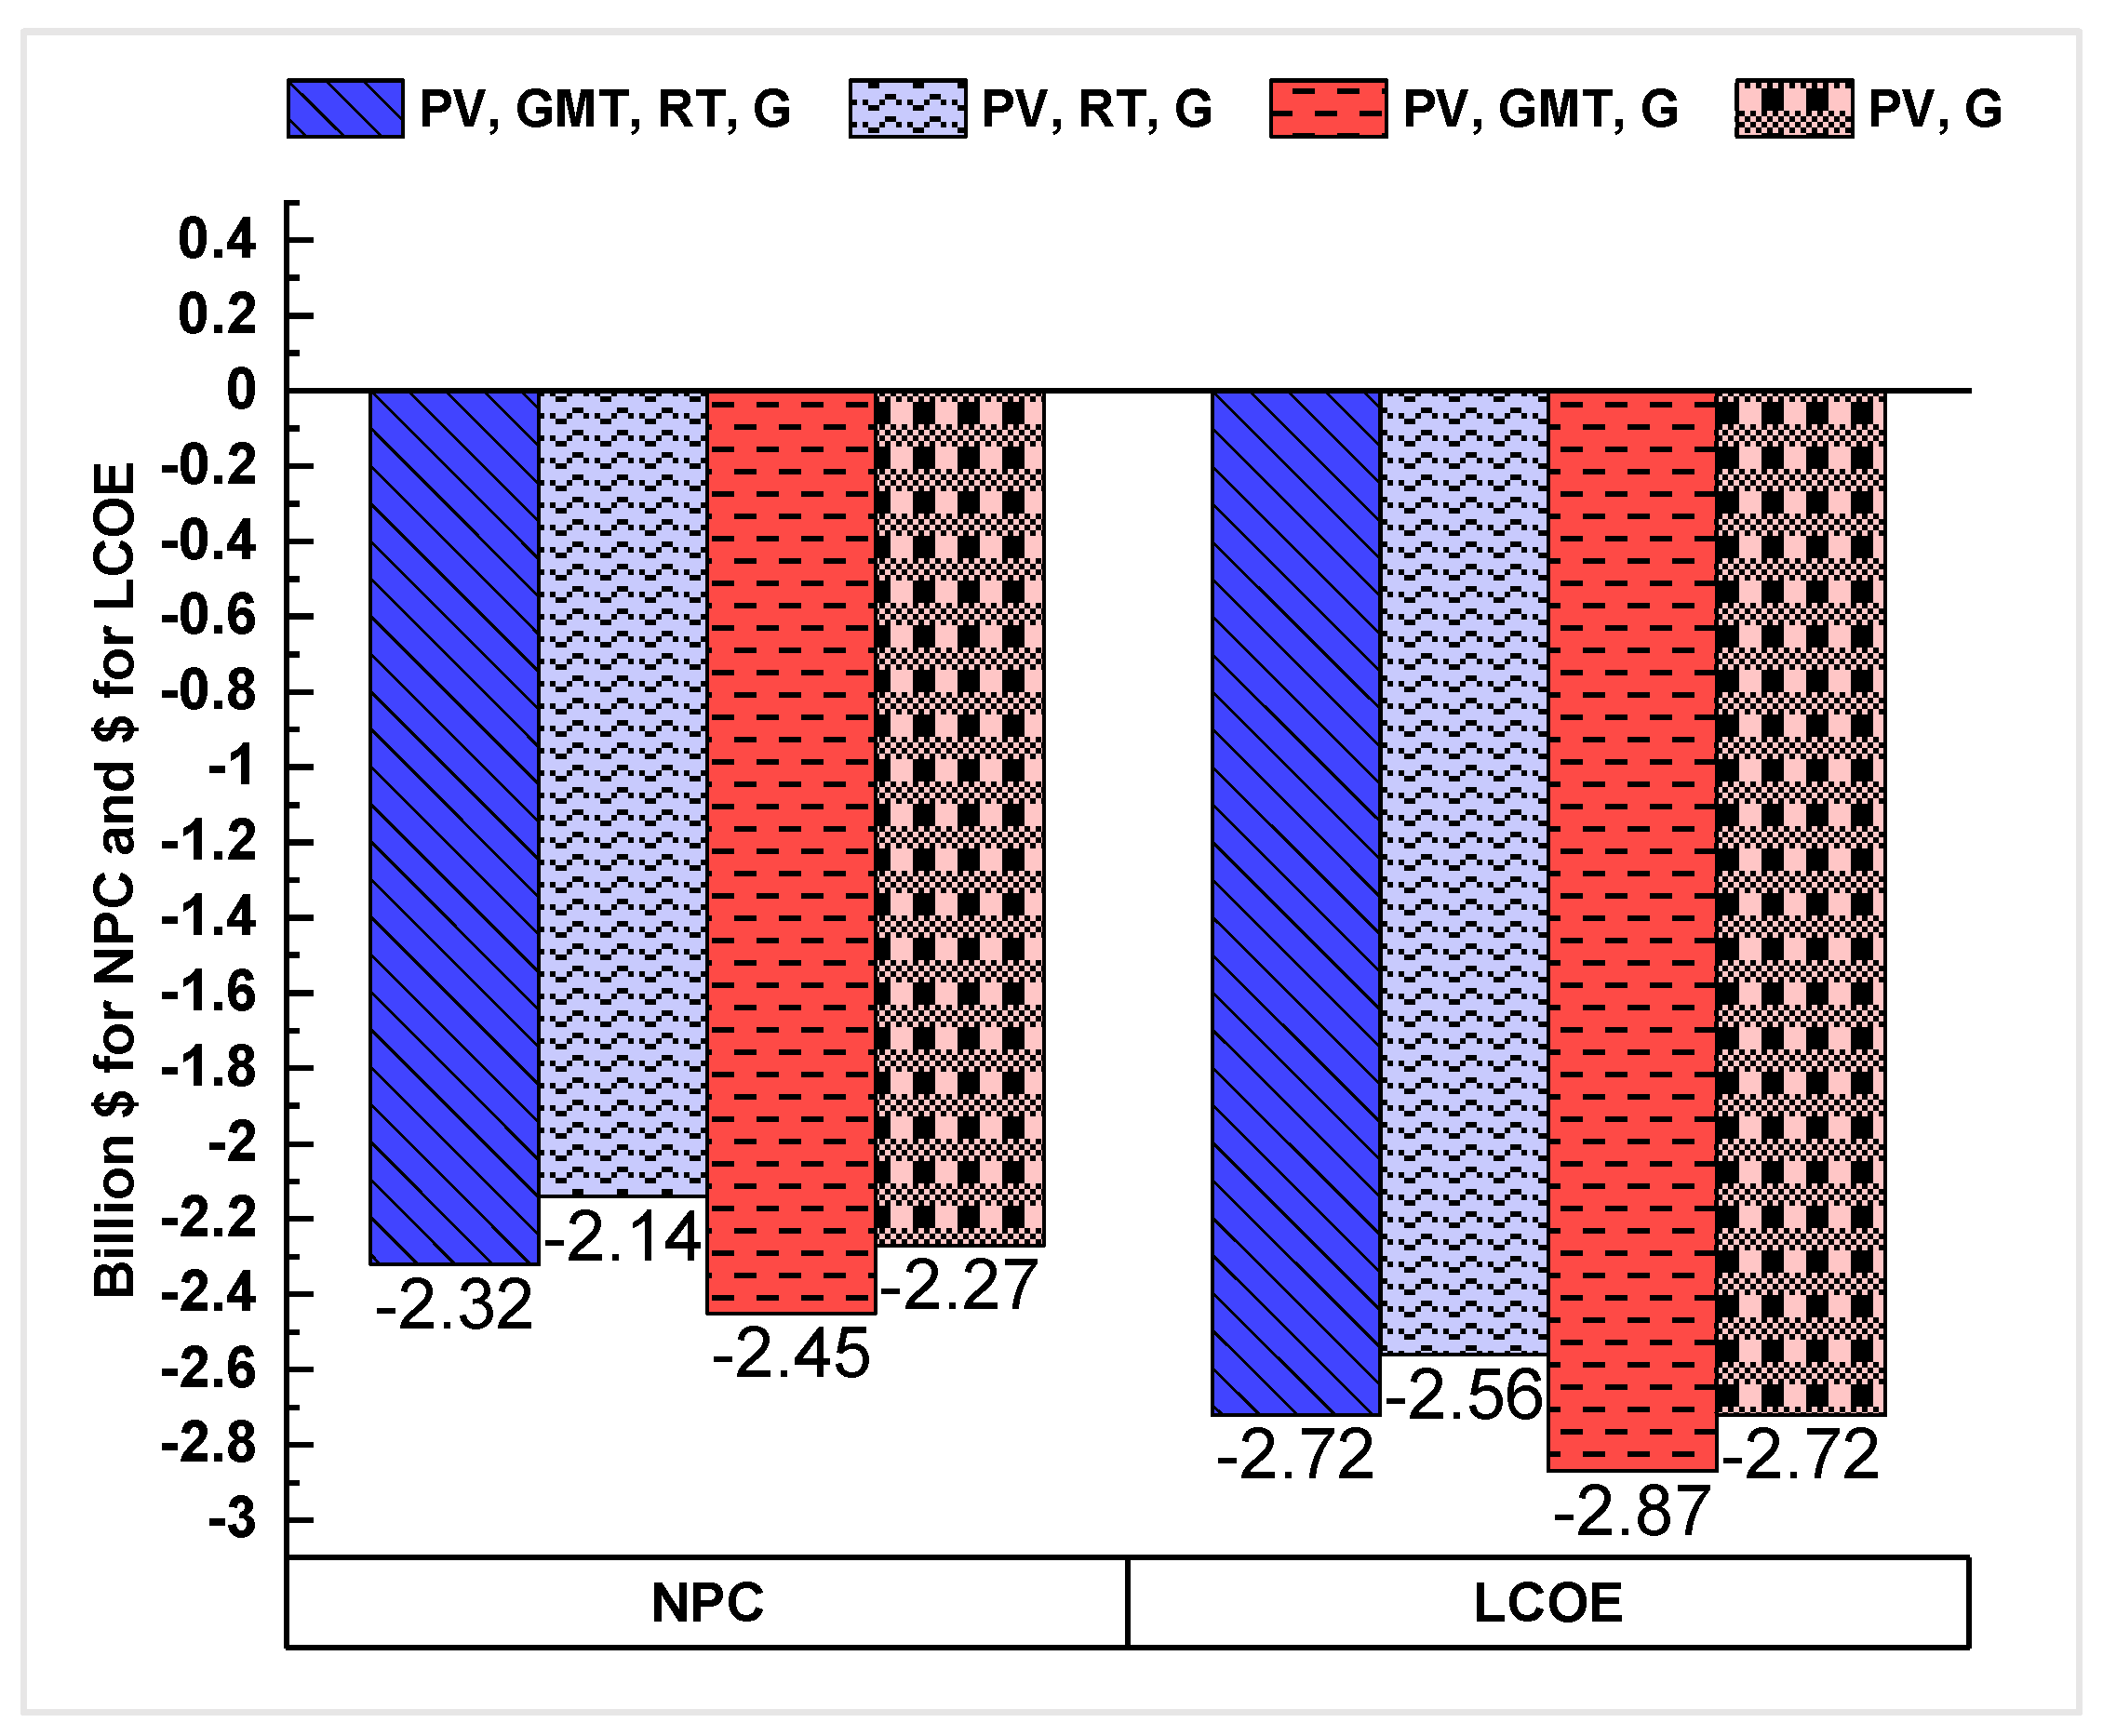
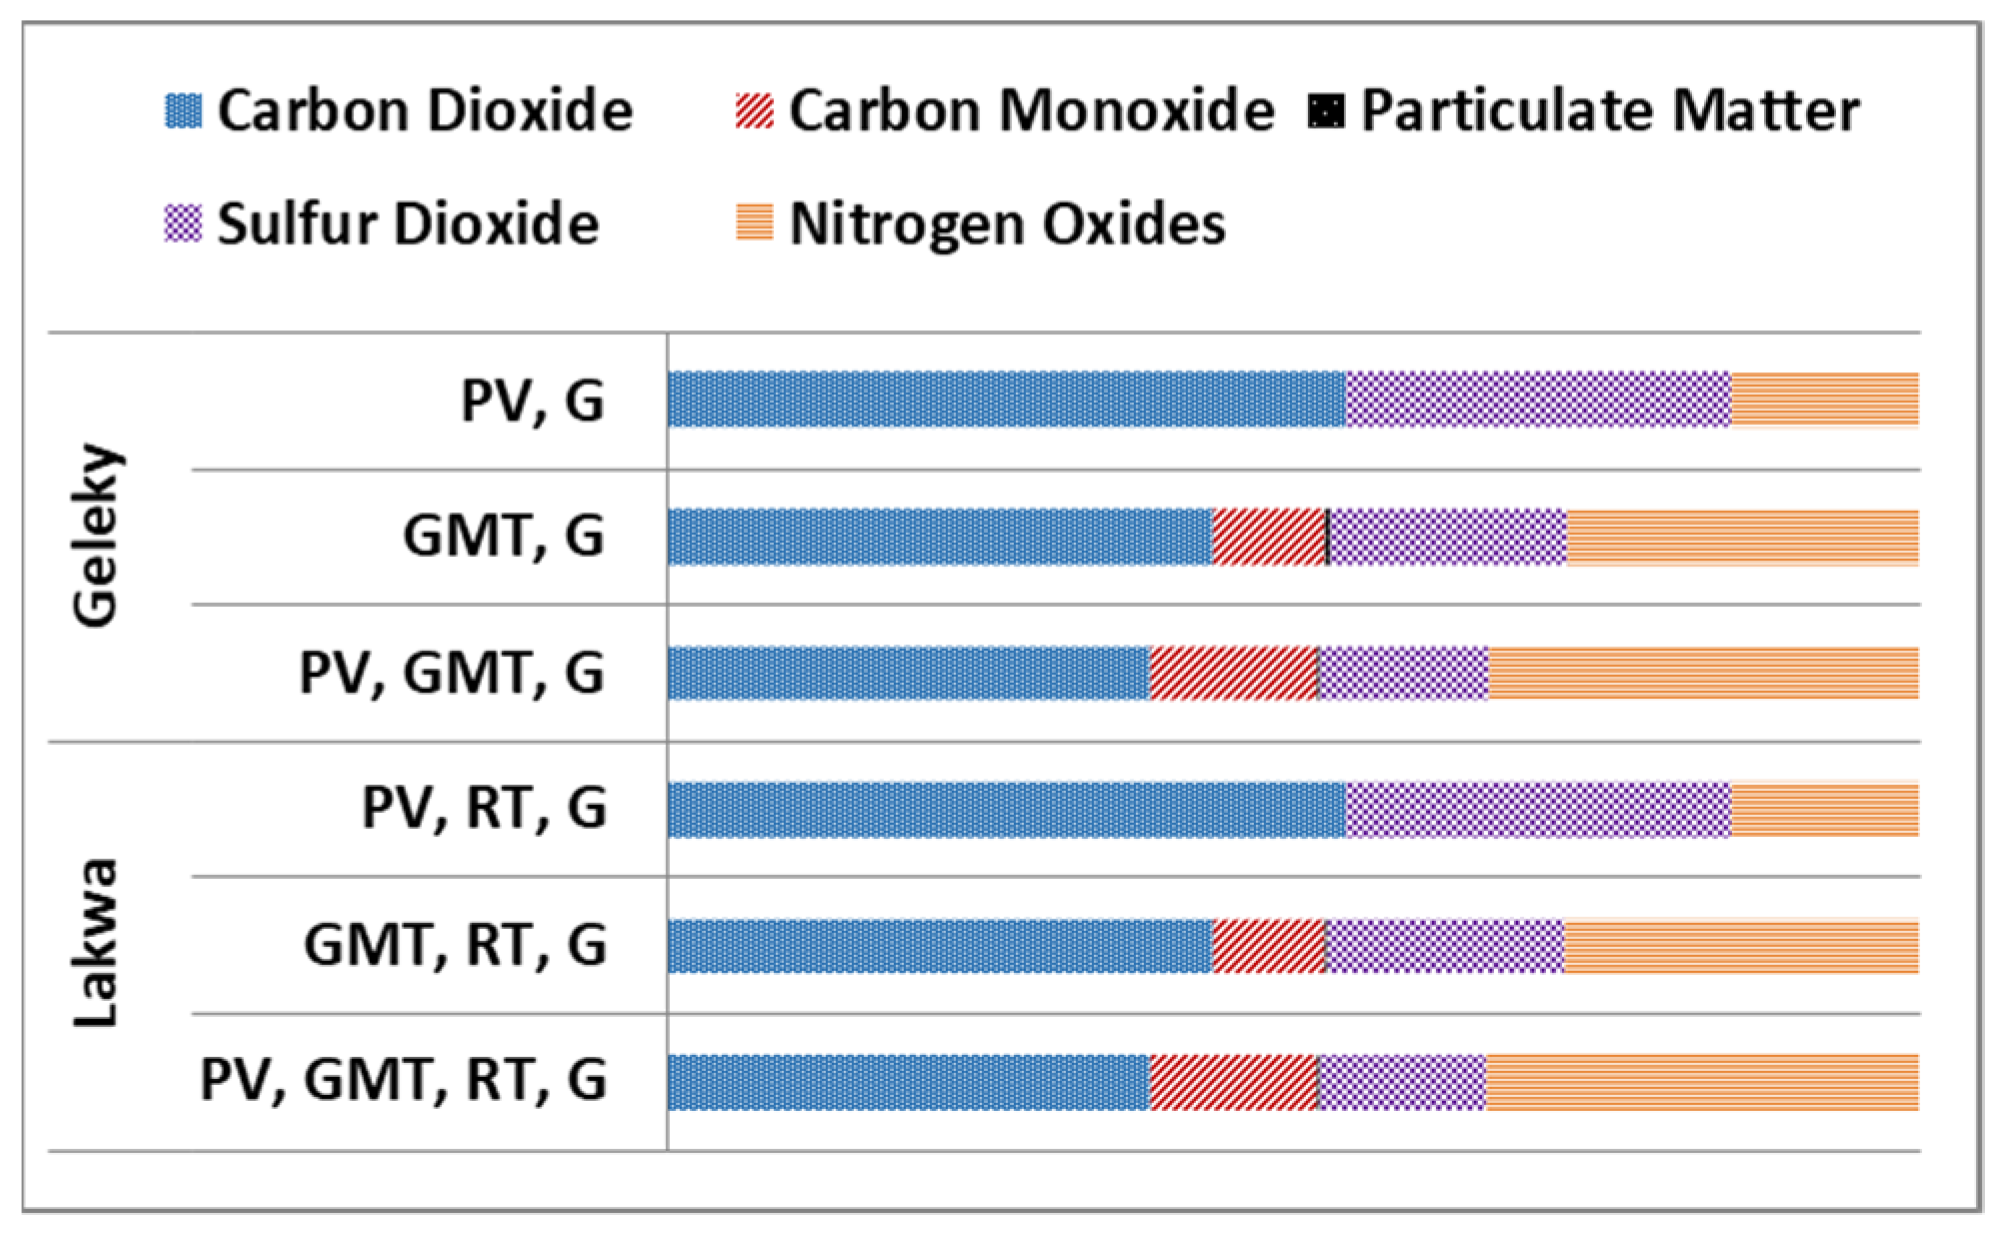
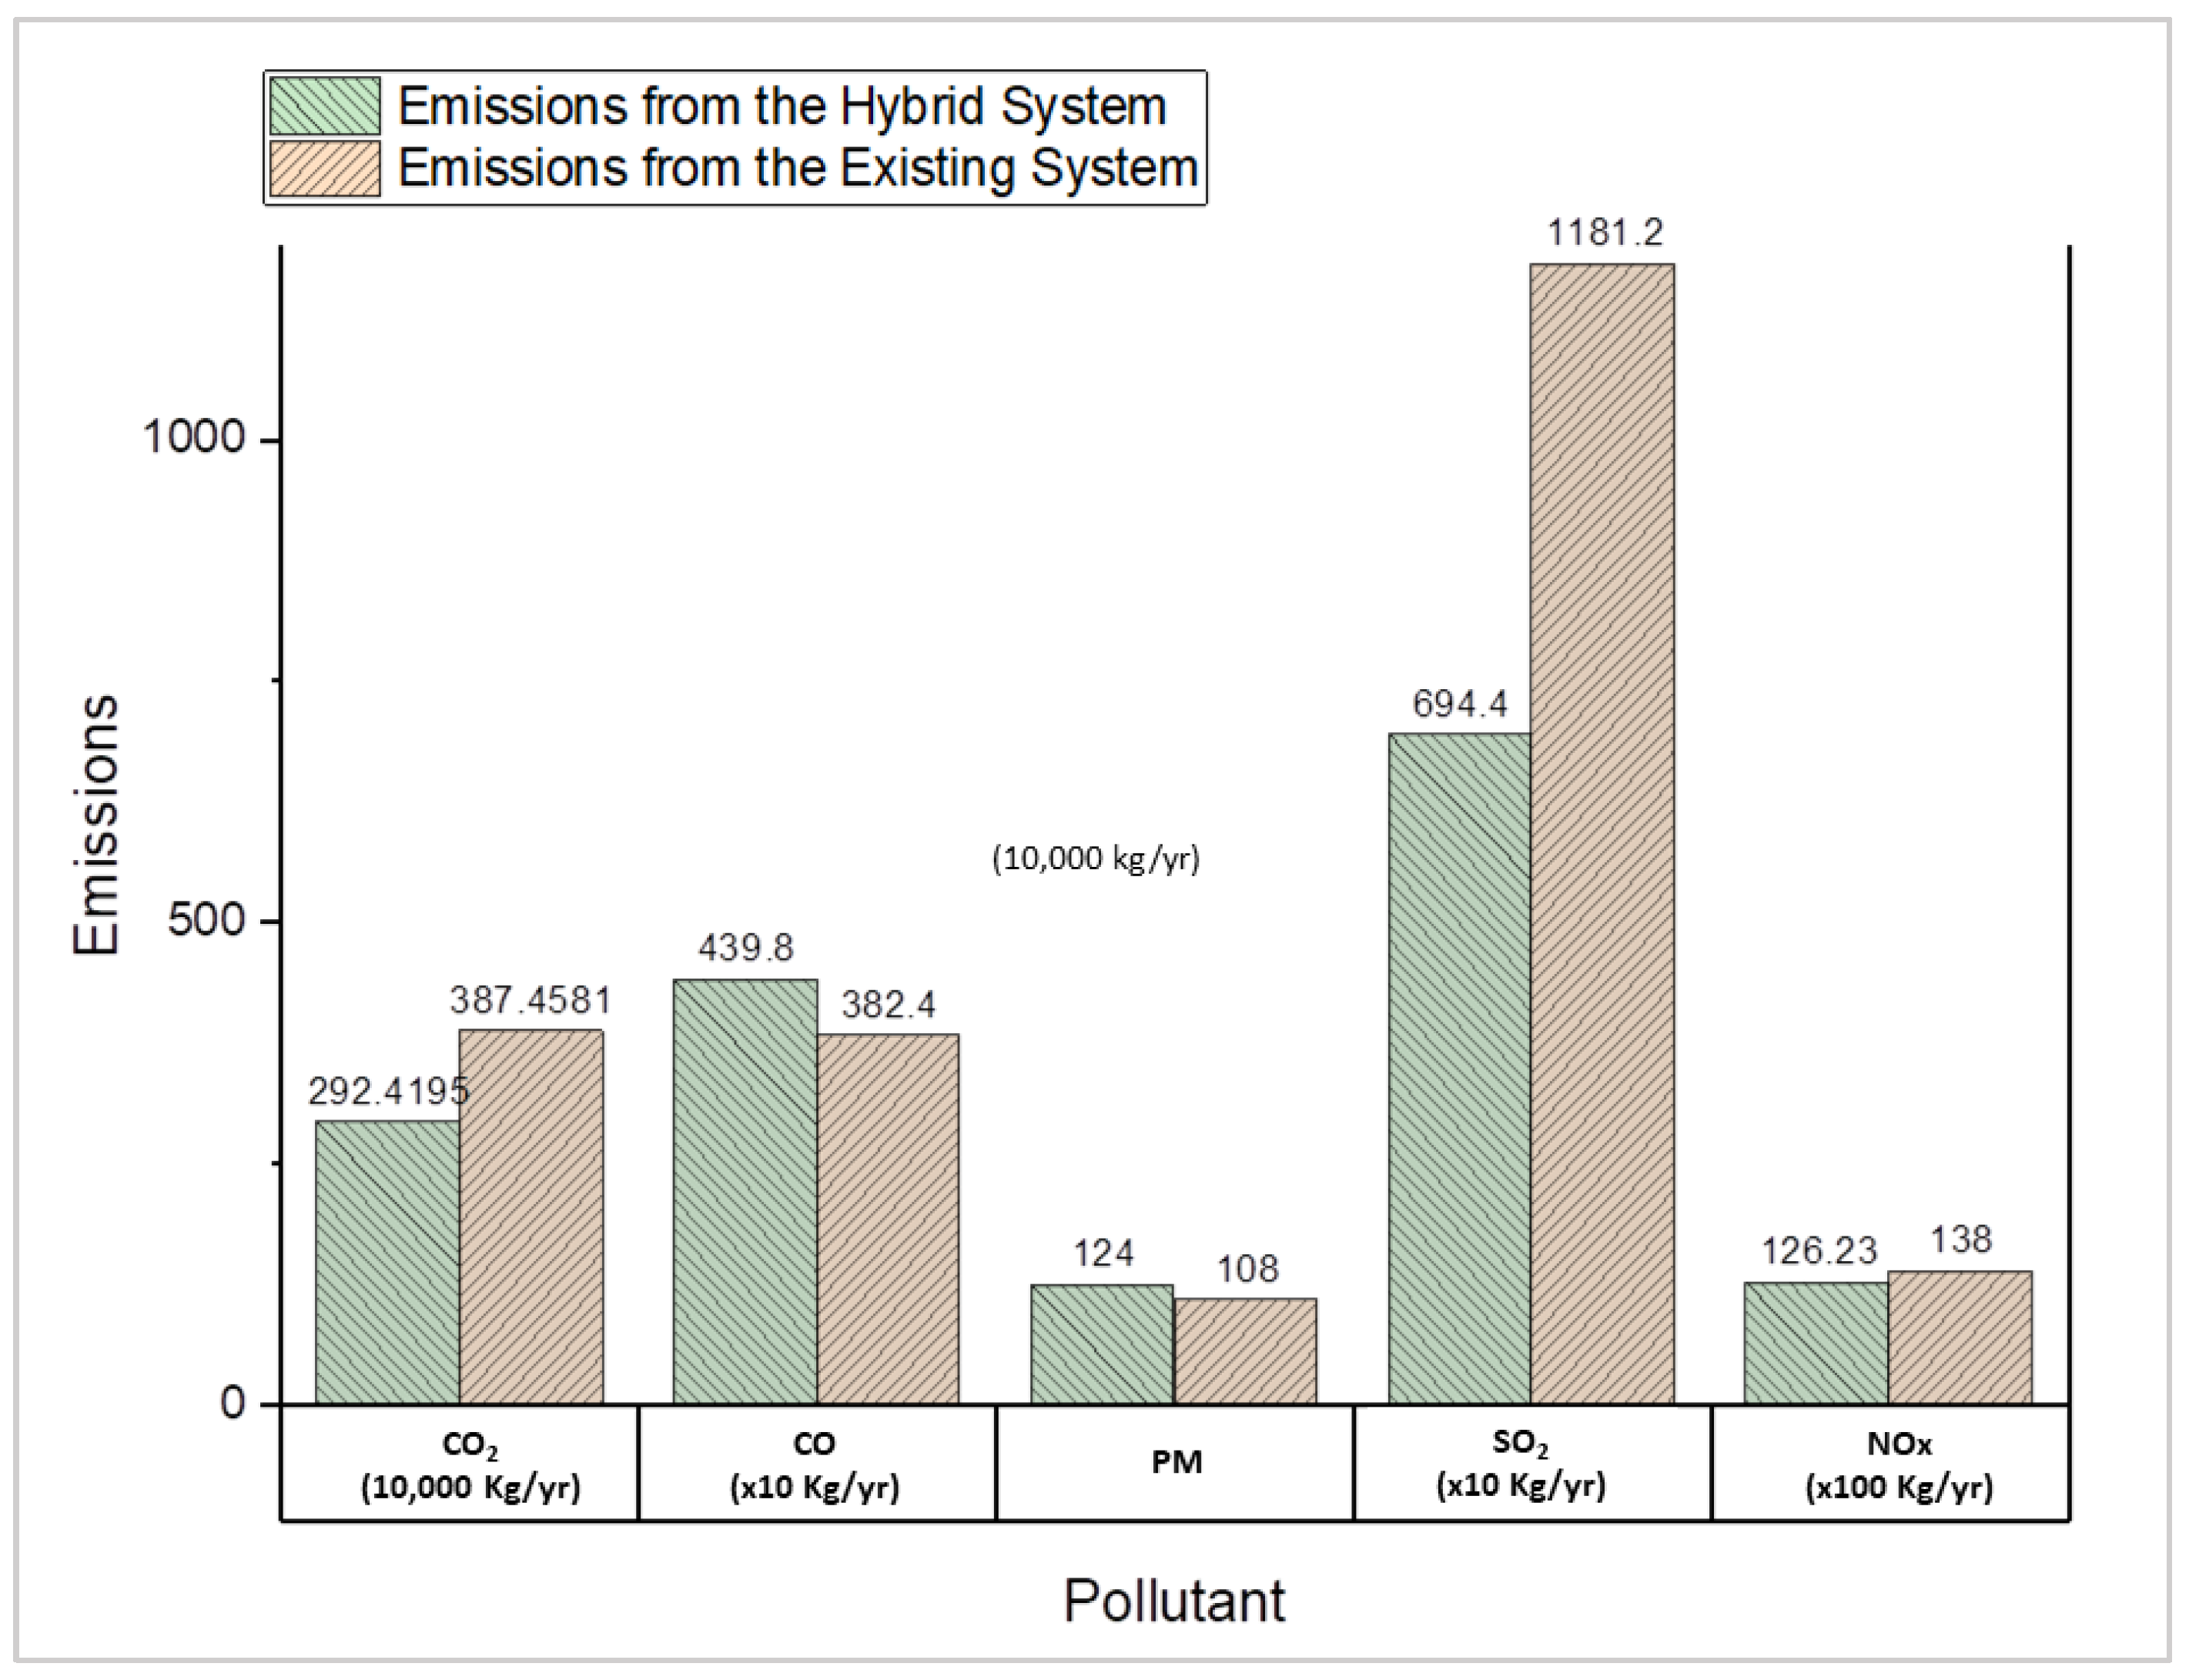
7.2. Comparison of the Proposed System with the Existing Power System
8. Conclusions
Author Contributions
Funding
Conflicts of Interest
References
- Oghenemavwe, L.E.; Awoyemi, L.O. Cardiothoracic Ratio of Nigerians in Gas Flaring Communities. Am. J. Med. Med. Sci. 2020, 10, 279–283. [Google Scholar]
- Soltanieh, M.; Zohrabian, A.; Gholipour, M.J.; Kalnay, E. A review of global gas flaring and venting and impact on the environment: Case study of Iran. Int. J. Greenh. Gas Control 2016, 49, 488–509. [Google Scholar] [CrossRef]
- Ojijiagwo, E.N.; Oduoza, C.F.; Emekwuru, N. Technological and economic evaluation of conversion of potential flare gas to electricity in Nigeria. Procedia Manuf. 2018, 17, 444–451. [Google Scholar] [CrossRef]
- Fathima, A.H.; Palanisamy, K. Optimization in microgrids with hybrid energy systems—A review. Renew. Sustain. Energy Rev. 2015, 45, 431–446. [Google Scholar] [CrossRef]
- Iqbal, M.; Azam, M.; Naeem, M.; Khwaja, A.S.; Anpalagan, A. Optimization classification, algorithms and tools for renewable energy: A review. Renew. Sustain. Energy Rev. 2014, 39, 640–654. [Google Scholar] [CrossRef]
- Al-falahi, M.D.A.; Jayasinghe, S.D.G.; Enshaei, H. A review on recent size optimization methodologies for standalone solar and wind hybrid renewable energy system. Energy Convers. Manag. 2017, 143, 252–274. [Google Scholar] [CrossRef]
- Huang, Z.; Xie, Z.; Zhang, C.; Chan, S.H.; Milewski, J.; Xie, Y.; Yang, Y.; Hu, X. Modeling and multi-objective optimization of a stand-alone PV-hydrogen-retired EV battery hybrid energy system. Energy Convers. Manag. 2019, 181, 80–92. [Google Scholar] [CrossRef]
- Mo, Q.; Liu, F. Modeling and optimization for distributed microgrid based on Modelica language. Appl. Energy 2020, 279, 115766. [Google Scholar] [CrossRef]
- Singh, S.S.; Fernandez, E. Modeling, size optimization and sensitivity analysis of a remote hybrid renewable energy system. Energy 2018, 143, 719–731. [Google Scholar] [CrossRef]
- Fodhil, F.; Hamidat, A.; Nadjemi, O. Potential, optimization and sensitivity analysis of photovoltaic-diesel-battery hybrid energy system for rural electrification in Algeria. Energy 2019, 169, 613–624. [Google Scholar] [CrossRef]
- Ayodele, E.; Misra, S.; Damasevicius, R.; Maskeliunas, R. Hybrid microgrid for microfinance institutions in rural areas—A field demonstration in West Africa. Sustain. Energy Technol. Assess. 2019, 35, 89–97. [Google Scholar] [CrossRef]
- Sen, R.; Bhattacharyya, S.C. Off-grid electricity generation with renewable energy technologies inIndia: An application of HOMER. Renew. Energy 2014, 62, 388–398. [Google Scholar] [CrossRef]
- Astatike, W.; Chandrasekar, P. Design and performance analysis of hybrid micro-grid power supply system using HOMER software for rural village in adama area, Ethiopia. Int. J. Sci. Technol. Res. 2019, 8, 267–275. [Google Scholar]
- Murthy, S.S.; Dutta, P.; Rao, B.S.; Sharma, R. Performance analysis of a stand-alone polygeneration microgrid. Therm. Sci. Eng. Prog. 2020, 19, 100623. [Google Scholar] [CrossRef]
- Shahzad, M.K.; Zahid, A.; Rashid, T.; Rehan, M.A.; Ali, M.; Ahmad, M. Techno-economic feasibility analysis of a solar-biomass off grid system for the electrification of remote rural areas in Pakistan using HOMER software. Renew. Energy 2017, 106, 264–273. [Google Scholar] [CrossRef]
- Rezk, H.; Dousoky, G.M. Technical and economic analysis of different configurations of stand-alone hybrid renewable power systems—A case study. Renew. Sustain. Energy Rev. 2016, 62, 941–953. [Google Scholar] [CrossRef]
- López-González, A.; Ranaboldo, M.; Domenech, B.; Ferrer-Martí, L. Evaluation of small wind turbines for rural electrification: Case studies from extreme climatic conditions in Venezuela. Energy 2020, 209, 118450. [Google Scholar] [CrossRef]
- Shezan, S.A.; Julai, S.; Kibria, M.A.; Ullah, K.R.; Saidur, R.; Chong, W.T.; Akikur, R.K. Performance analysis of an off-grid wind-PV (photovoltaic)-diesel-battery hybrid energy system feasible for remote areas. J. Clean. Prod. 2016, 125, 121–132. [Google Scholar] [CrossRef]
- Singh, G.; Baredar, P.; Singh, A.; Kurup, D. Optimal sizing and location of PV, wind and battery storage for electrification to an island: A case study of Kavaratti, Lakshadweep. J. Energy Storage 2017, 12, 78–86. [Google Scholar] [CrossRef]
- Fazelpour, F.; Soltani, N.; Rosen, M.A. Feasibility of satisfying electrical energy needs with hybrid systems for a medium-size hotel on Kish Island, Iran. Energy 2014, 73, 856–865. [Google Scholar] [CrossRef]
- Bhakta, S.; Mukherjee, V. Performance indices evaluation and techno economic analysis of photovoltaic power plant for the application of isolated India’s island. Sustain. Energy Technol. Assess. 2017, 20, 9–24. [Google Scholar] [CrossRef]
- Tsai, C.T.; Beza, T.M.; Wu, W.B.; Kuo, C.C. Optimal configuration with capacity analysis of a hybrid renewable energy and storage system for an island application. Energies 2019, 13, 8. [Google Scholar] [CrossRef] [Green Version]
- Khan, M.R.B.; Jidin, R.; Pasupuleti, J.; Shaaya, S.A. Optimal combination of solar, wind, micro-hydro and diesel systems based on actual seasonal load profiles for a resort island in the South China Sea. Energy 2015, 82, 80–97. [Google Scholar] [CrossRef]
- Tsai, C.T.; Beza, T.M.; Molla, E.M.; Kuo, C.C. Analysis and Sizing of Mini-Grid Hybrid Renewable Energy System for Islands. IEEE Access 2020, 8, 70013–70029. [Google Scholar] [CrossRef]
- Kumar, A.; Singh, A.R.; Deng, Y.; He, X.; Kumar, P.; Bansal, R.C. Multiyear load growth based techno-financial evaluation of a microgrid for an academic institution. IEEE Access 2018, 6, 37533–37555. [Google Scholar] [CrossRef]
- Sarkar, T.; Bhattacharjee, A.; Samanta, H.; Bhattacharya, K.; Saha, H. Optimal design and implementation of solar PV-wind-biogas-VRFB storage integrated smart hybrid microgrid for ensuring zero loss of power supply probability. Energy Convers. Manag. 2019, 191, 102–118. [Google Scholar] [CrossRef]
- Bhattacharjee, S.; Acharya, S. PV-wind hybrid power option for a low wind topography. Energy Convers. Manag. 2015, 89, 942–954. [Google Scholar] [CrossRef]
- Saiprasad, N.; Kalam, A.; Zayegh, A. Optimum Sizing and Economic Analysis of Renewable Energy System Integration into a Micro-grid for an Academic Institution—A Case Study; Springer International Publishing: Berlin/Heidelberg, Germany, 2019; p. 749. [Google Scholar]
- Ghenai, C.; Bettayeb, M. Modelling and performance analysis of a stand-alone hybrid solar PV/Fuel Cell/Diesel Generator power system for university building. Energy 2019, 171, 180–189. [Google Scholar] [CrossRef]
- Liu, J.; Wang, M.; Peng, J.; Chen, X.; Cao, S.; Yang, H. Techno-economic design optimization of hybrid renewable energy applications for high-rise residential buildings. Energy Convers. Manag. 2020, 213, 112868. [Google Scholar] [CrossRef]
- Al-Ammar, E.A.; Habib, H.U.R.; Kotb, K.M.; Wang, S.; Ko, W.; Elmorshedy, M.F.; Waqar, A. Residential Community Load Management Based on Optimal Design of Standalone HRES with Model Predictive Control. IEEE Access 2020, 8, 12542–12572. [Google Scholar] [CrossRef]
- Lv, Z.; Wang, Z.; Xu, W. A techno-economic study of 100% renewable energy for a residential household in China. Energies 2019, 12, 2109. [Google Scholar] [CrossRef] [Green Version]
- Tiwary, A.; Spasova, S.; Williams, I.D. A community-scale hybrid energy system integrating biomass for localised solid waste and renewable energy solution: Evaluations in UK and Bulgaria. Renew. Energy 2019, 139, 960–967. [Google Scholar] [CrossRef]
- Rad, M.A.V.; Ghasempour, R.; Rahdan, P.; Mousavi, S.; Arastounia, M. Techno-economic analysis of a hybrid power system based on the cost-effective hydrogen production method for rural electrification, a case study in Iran. Energy 2020, 190, 116421. [Google Scholar] [CrossRef]
- Velo, R.; Osorio, L.; Fernández, M.D.; Rodríguez, M.R. An economic analysis of a stand-alone and grid-connected cattle farm. Renew. Sustain. Energy Rev. 2014, 39, 883–890. [Google Scholar] [CrossRef]
- Maammeur, H.; Hamidat, A.; Loukarfi, L.; Missoum, M.; Abdeladim, K.; Nacer, T. Performance investigation of grid-connected PV systems for family farms: Case study of North-West of Algeria. Renew. Sustain. Energy Rev. 2017, 78, 1208–1220. [Google Scholar] [CrossRef]
- Nyeche, E.N.; Diemuodeke, E.O. Modelling and optimisation of a hybrid PV-wind turbine-pumped hydro storage energy system for mini-grid application in coastline communities. J. Clean. Prod. 2020, 250, 119578. [Google Scholar] [CrossRef]
- Deepika, C.H.B. Optimised Site Selection of Hybrid Renewable Installations for Flare Gas Reduction using Multi-Criteria Decision Making. Energy Convers. Manag. 2021, X, 100181. [Google Scholar]
- ONGC. ONGC Annual Report; ONGC: New Delhi, India, 2020. [Google Scholar]
- Bishnoi, D.; Chaturvedi, H. Techno-economic analysis of hybrid energy system for efficient utilization of waste flare gas from oil and gas fields. In Proceedings of the 2021 9th International Conference on Smart Grid (icSmartGrid), Setubal, Portugal, 29 June–1 July 2021; pp. 201–206. [Google Scholar]
- Duman, A.C.; Güler, Ö. Techno-economic analysis of off-grid PV/wind/fuel cell hybrid system combinations with a comparison of regularly and seasonally occupied households. Sustain. Cities Soc. 2018, 42, 107–126. [Google Scholar] [CrossRef]
- Gilman, P.; Lilienthal, P. Micropower System Modeling. Integr. Altern. Sources Energy 2006, 1, 379–418. [Google Scholar]
- Demiroren, A.; Yilmaz, U. Analysis of change in electric energy cost with using renewable energy sources in Gökceada, Turkey: An island example. Renew. Sustain. Energy Rev. 2010, 14, 323–333. [Google Scholar] [CrossRef]
- Xu, Z.; Nthontho, M.; Chowdhury, S. Rural electrification implementation strategies through microgrid approach in South African context. Int. J. Electr. Power Energy Syst. 2016, 82, 452–465. [Google Scholar] [CrossRef]
- Al, H.Z.; Awasthi, A.; Ramli, M.A.M. Optimal design and analysis of grid-connected photovoltaic under di ff erent tracking systems using HOMER. Energy Convers. Manag. 2018, 155, 42–57. [Google Scholar]
- NASA. NASA Prediction of World Wide Energy Resources; NASA: Washington, DC, USA, 2021.
- Kumar, A.; Singh, A.R.; Deng, Y.; He, X.; Kumar, P.; Bansal, R.C. Integrated assessment of a sustainable microgrid for a remote village in hilly region. Energy Convers. Manag. 2019, 180, 442–472. [Google Scholar] [CrossRef]
- Shodhganga. CHAPTER 4 River Brahmaputra; Shodhganga: Gandhinagar, India, 2014. [Google Scholar]
- Kirke, B. Hydrokinetic Turbines for Moderate sized rivers. Energy Sustain. Dev. 2020, 58, 182–195. [Google Scholar] [CrossRef] [PubMed]
- Currents, C.P.F. Schottel Tidal Generator. 2014, p. 2014. Available online: http://www.blackrocktidalpower.com/fileadmin/data_BRTP/pdf/STG-datasheet.pdf (accessed on 5 March 2022).
- Givler, T.; Lilienthal, P. Using HOMER Software, NREL’s Micropower Optimization Model, to Explore the Role of Gen-Sets in Small Solar Power Systems; Case Study: Sri Lanka; National Renewable Energy Lab.: Golden, CO, USA, 2005. [Google Scholar]
- Assam Power Distribution Company Limited. Power Tariff in Assam; Assam Power Distribution Company Limited: Guwahati, India, 2021. [Google Scholar]
- Nadjemi, O.; Nacer, T.; Hamidat, A.; Salhi, H. Optimal hybrid PV/wind energy system sizing: Application of cuckoo search algorithm for Algerian dairy farms. Renew. Sustain. Energy Rev. 2017, 70, 1352–1365. [Google Scholar] [CrossRef]
- Elkadeem, M.R.; Wang, S.; Sharshir, S.W.; Atia, E.G. Feasibility analysis and techno-economic design of grid-isolated hybrid renewable energy system for electrification of agriculture and irrigation area: A case study in Dongola, Sudan. Energy Convers. Manag. 2019, 196, 1453–1478. [Google Scholar] [CrossRef]
- Elmaadawy, K.; Kotb, K.M.; Elkadeem, M.R.; Sharshir, S.W.; Dán, A.; Moawad, A.; Liu, B. Optimal sizing and techno-enviro-economic feasibility assessment of large-scale reverse osmosis desalination powered with hybrid renewable energy sources. Energy Convers. Manag. 2020, 224, 113377. [Google Scholar] [CrossRef]
- Aziz, A.S.; Tajuddin, M.F.N.; Adzman, M.R.; Ramli, M.A.M.; Mekhilef, S. Energy management and optimization of a PV/diesel/battery hybrid energy system using a combined dispatch strategy. Sustainability 2019, 11, 683. [Google Scholar] [CrossRef] [Green Version]
- Costa, T.S.; Villalva, M.G. Technical evaluation of a PV-diesel hybrid system with energy storage: Case study in the Tapajós-Arapiuns Extractive Reserve, Amazon, Brazil. Energies 2020, 13, 2969. [Google Scholar] [CrossRef]
- Bishnoi, D.; Prakash, O.; Chaturvedi, H. Current Trends in Renewable and Alternate Energy. In AIP Conference Proceedings; AIP Publishing LLC: Melville, NY, USA, 2018; Volume 2091, p. 020007. [Google Scholar]
- Dahiru, A.T.; Tan, C.W. Optimal sizing and techno-economic analysis of grid-connected nanogrid for tropical climates of the Savannah. Sustain. Cities Soc. 2020, 52, 101824. [Google Scholar] [CrossRef]
- Bishnoi, D.; Prakash, O.; Chaturvedi, H. Utilizing flared gas for distributed generation: An optimization based approach. In AIP Conference Proceedings; AIP Publishing LLC: Melville, NY, USA, 2019; Volume 2091. [Google Scholar]


| Ref | HRES Mix | Load Type | Grid Connection | Dispatch Strategy | Performance Measure |
|---|---|---|---|---|---|
| [13] | Wind, Solar, Diesel | Rural community | Off-grid | No mention | cost |
| [15] | Solar, Biomass | Agricultural | Off-grid | No mention | |
| [16] | Wind, PV, Battery storage, Fuel cell | Remote Agricultural Area | Grid | No mention | |
| [17] | Wind | Dessert and mountain | Off-grid | No Mention | LCOE |
| [18] | Wind, Diesel, Battery, PV | Daily load | Off-grid | CC | NPC, COE |
| [19] | PV, Battery | Islands | Grid | No Mention | NPC, COE |
| [20] | Wind, Diesel, Battery | Hotel | Grid | No Mention | COE |
| [21] | PV, Battery | Island | Off-grid | COE, NPC, RF | |
| [22] | PV, Diesel, Wind, Battery | Island | Off-grid | No mention | COE |
| [23] | Diesel, PV, Wind, Hydro, Battery | Island | Grid | LF, CC | COE, NPC, RF |
| [24] | Diesel, PV, Battery | Island | Off-grid | LF, CC | COE, NPC, RF |
| [25] | PV, Battery | IIT Guwahati campus | Grid/Off-Grid | LF, CC | COE, NPC |
| [26] | PV, Wind, Biomass, Vanadium redox flow battery (VRFB) | IIEST | Off-Grid | No mention | COE |
| [28] | PV, Wind | Campus | Off-Grid | No Mention | NPC, COE, RF |
| [29] | PV, Fuel cell | Commercial Building | Off-Grid | LF, CC | COE |
| [30] | PV, Wind | High-rise building | Grid | No Mention | LCOE |
| [33] | PV, Wind | Residential Area | Off grid | CD | COE, NOC |
| [34] | Wind, PV, Biogas | City | Grid | No Mention | LCOE |
| Component Name | Type | Rating | Quantity | Capital Cost | Replacement Cost | O&M Cost | Lifetime |
|---|---|---|---|---|---|---|---|
| Gas Microturbine | Capstone | 200 kW | 1 | USD 200,000 | USD 200,000 | 0.005 USD/operational h | 40,000 h |
| 30 kW | 2 | USD 30,000 | USD 30,000 | 0.005 USD/operational h | 40,000 h | ||
| Solar Photovoltaics | CanadianSolar MaxPower | 2000 kW | PV arrays arranged in series and parallel | 0.08 USD/kWh | 0.08 USD/kWh | - | 25 years |
| Hydrokinetic River Turbine | Schottel | 70 kW | 1 | USD 57,000,000 | USD 57,000,000 | USD 6,290,000 | 25 years |
| Converter | Free size | 10,455 kW 1 | 1 | USD 375 | USD 375 | USD 10 | 25 years |
| # | Configuration | Cost Parameters | Environmental Sustainability | ||||
|---|---|---|---|---|---|---|---|
| NPC | LCOE | Operating Cost | Renewable Fraction (%) | Total Fuel Consumption (m3/yr) | Suggested Location | ||
| 1 | PV/GMT/RT/G | USD −2.32B | USD −2.72 | USD −187M | 93.8 | 774,384 | Lakwa |
| 2 | GMT/RT/G | USD 571B | USD 7.16 | USD 39.8M | 1.99 | 774,384 | Lakwa |
| 3 | PV/RT/G | USD −2.14B | USD −2.56 | USD −173M | 95.6 | 0 | Lakwa |
| 4 | PV/GMT/G | USD −2.45B | USD −2.87 | USD −192M | 93.7 | 774,384 | Geleky |
| 5 | GMT/G | USD 445M | USD 5.61 | USD 34.4M | 0 | 774,384 | Geleky |
| 6 | PV/G | USD −2.27B | USD −2.72 | USD −178M | 95.5 | 0 | Geleky |
Publisher’s Note: MDPI stays neutral with regard to jurisdictional claims in published maps and institutional affiliations. |
© 2022 by the authors. Licensee MDPI, Basel, Switzerland. This article is an open access article distributed under the terms and conditions of the Creative Commons Attribution (CC BY) license (https://creativecommons.org/licenses/by/4.0/).
Share and Cite
Bishnoi, D.; Chaturvedi, H. Optimal Design of a Hybrid Energy System for Economic and Environmental Sustainability of Onshore Oil and Gas Fields. Energies 2022, 15, 2063. https://doi.org/10.3390/en15062063
Bishnoi D, Chaturvedi H. Optimal Design of a Hybrid Energy System for Economic and Environmental Sustainability of Onshore Oil and Gas Fields. Energies. 2022; 15(6):2063. https://doi.org/10.3390/en15062063
Chicago/Turabian StyleBishnoi, Deepika, and Harsh Chaturvedi. 2022. "Optimal Design of a Hybrid Energy System for Economic and Environmental Sustainability of Onshore Oil and Gas Fields" Energies 15, no. 6: 2063. https://doi.org/10.3390/en15062063
APA StyleBishnoi, D., & Chaturvedi, H. (2022). Optimal Design of a Hybrid Energy System for Economic and Environmental Sustainability of Onshore Oil and Gas Fields. Energies, 15(6), 2063. https://doi.org/10.3390/en15062063