Review

State-of-the-Art Review of Fluid Catalytic Cracking (FCC) Catalyst Regeneration Intensification Technologies

by
Adefarati Oloruntoba
1,
Yongmin Zhang
1,* and
Chang Samuel Hsu
1,2,3,*
1
State Key Laboratory of Heavy Oil Processing, China University of Petroleum, Beijing 102249, China
2
Department of Chemical and Biomedical Engineering, Florida A & M University, Florida State University, Tallahassee, FL 32310, USA
3
Petro Bio Oil Consulting, Tallahassee, FL 32312, USA
*
Authors to whom correspondence should be addressed.
Energies 2022, 15(6), 2061; https://doi.org/10.3390/en15062061
Submission received: 6 February 2022 / Revised: 2 March 2022 / Accepted: 7 March 2022 / Published: 11 March 2022

Abstract

:
Fluid catalytic cracking (FCC) is the workhorse of modern crude oil refinery. Its regenerator plays a critical role in optimizing the overall profitability by efficiently restoring the catalyst activity and enhancing the heat balance in the riser reactor. Improvement in the device metallurgy and process operations have enabled industrial regenerators to operate at high temperatures with a better coke burning rate and longer operating cycle. Today, the carbon content of regenerated catalyst has drastically reduced to less than 0.1 wt.%. However, the unit is still plagued with operational complexities and insufficient understanding of the underlying dynamic, multiscale intricacies. Recent process-intensification strategies provide insights into regenerator performance improvement potentials. In this review, the importance of the uniform distribution of spent catalysts through structural modification and operational manipulations of the catalyst distributor is discussed. The knowledge of the role of baffles in enhancing excellent gas–solid interaction has been increasing, but skepticism due to its complex hydrodynamic effects on gas–solid flows fends off operators from its application, a critical evaluation of its implication in the regenerators is covered. The understanding of the contribution of air/steam distributor design and feed gas injection techniques for even contact with spent catalyst leading to the improvement in FCC performance is also investigated. The reliability of FCC components is equally a big concern, as unplanned shutdown and enormous economic losses are being witnessed due to device failure. To this end, mitigation approaches to damaging afterburn and high-temperature erosion problems with respect to process control and geometric adjustment in the bed, freeboard, cyclone separators and collection ducts are explored. Emission limits for fluid catalytic cracking unit (FCCU) and products are consistently ratcheting downward; the commingled turnkey solutions to reducing pollutants generation are also reviewed.

1. Introduction

1.1. FCC Process and Its Importance in Petroleum Refineries

In an integrated refinery, the fluid catalytic cracking unit (FCCU) is the hub for primary conversion of low-quality and heavy hydrocarbon molecules to more valuable and lighter ones, which are essential components of transportation fuels (e.g., gasoline, jet fuel, and diesel). Since the first industrial application of fluid catalytic cracking (FCC) technology in 1942, the FCCU has mushroomed to become a pivotal component of the modern petroleum refining process [1].
Over the last six (6) decades, the FCCU has evolved significantly due to a better comprehension of the intrinsic process science and innovative engineering solutions [2,3]. The evidence of these is seen by the development of highly active and selective multi-spherical zeolite catalysts [4,5], and the improvement of risers for catalytic cracking [6,7,8,9]. These innovations have driven a major uptick in yields of different high-quality distillate fuels from poor-quality feedstocks, an increase in unit capacity and operating flexibility, and lower wastewater and emission generations, among others [10,11,12]. Nonetheless, the FCC process is very complicated; as shown in Figure 1, the unit is primarily made up of a reactor section and a regenerator section interlinked by transfer lines to provide for free transportation of spent and regenerated cracking catalysts between them.
Five basic processes are involved in the FCC operation, including feed pretreatment, conversion, heat and pressure recovery, effluent separation, and product treatment [13]. The feedstocks (typically high-boiling-point petroleum fractions termed high-vacuum gas oil, HVGO, from the crude vacuum distillation unit) is preheated (149–400 °C) and charged into the riser inlet where it contacts hot regenerated catalysts stream en route from the regenerator, and the oil feed cracks as the mixture travels up the riser in a fluidized state into the reactor vessel where the effluent vapor is separated from the spent catalyst [14]. The cracked effluent vapor from the top outlet of the reactor is directed into the main fractionation unit for further treatment and recovery of high-value products while the residual slurry stream is sent back to the riser-reactor unit for recycling. As the feed cracks endothermically in the reactor section, a carbonaceous substance (i.e., coke) deposits on the catalyst, thereby resulting in its gradual deactivation and activity loss. Coked catalyst is drawn off the bottom of the reactor and transported by gravity to the regenerator, where the coke is combusted off in a fluidized state by injecting heat and air. The cleaned (regenerated) catalyst is then redirected back to the reactor section to continue the process loop [1].
Industrially, the catalyst travels at elevated velocities and completes the reactor and regenerator cycle in seconds. This is a precursor to surface erosion due to forceful solids impingements; hence, the internal surfaces of the riser, reactor and regenerator are equipped with an anchoring structure and thick internal refractory lining [15,16]. The exothermic coke combustion in the regenerator generates preponderance of heat, which produces the major thermal requirement for endothermic cracking reaction in the reactor/riser, necessitating a heat balance between the reactor and regenerator. The flue gas generated in the regenerator, which is rich in heat, is sent to the CO boiler and recovery gas compressor to regain some energy for other downstream applications before being emitted into the atmosphere together with catalyst fines. This makes FCC the highest polluter in the refinery [13]. This is an oversimplification of the FCC process; detailed operating processes are reported elsewhere [14,17,18].
Currently, the FCC unit is the single largest unit in the modern refinery. There are several commercial designs of FCCUs with common objectives but differing in mechanical configurations. These industrial designs and the distinctions between their designs are discussed in detail in Section 2. The major FCC technology licensors are Kellogg Brown & Root-KBR (formerly Kellogg)—Orthoflow FCC technology, UOP—FCC and RFCC technologies, Axens/IFP—R2R RFCC technology, Shell Global Solutions—FCC technology, Foster Wheeler—FCC technology, and ExxonMobil Research and Engineering (EMRE). More than 400 FCC/RFCC units are operating globally with an estimated total capacity of 20 million barrels per day, which are largely domicile in the Unites States of America, China, Japan and Brazil, and newer facilities are under construction in some developing countries [19]. The unit plays numerous significant roles that are beneficial to the oil refinery, summarized as follows:
  • Processing of extremely heavy crude oil fractions. Due to dwindling accessibility to easy-to-process feeds, FCCU can handle diverse feed slates to maximize the refiner’s overall profitability. Commonly used feeds are severely hydrotreated VGOs and resids, such as vacuum distillates (gas oils), vacuum distillation tower bottoms (vacuum resid; raw, hydrotreated, deasphalted), atmospheric distillation tower resid, coker gas oils, clarified oil (CLO), lube extracts and various slops [20,21,22]. The penalties for poor quality of feedstocks in the reactor unit are high coke formation rate (VGO and resid feeds have 5 and 20 wt.% Conradson carbon, respectively) [23], multicore naphtheno-aromatics formation [24], metal poisoning [1], low feed conversion and product selectivity, and in the regenerator, elevated regenerated catalyst temperature and exceeding high heat load [14].
  • Production of the majority of the world’s high-quality gasoline. FCCU is currently the major gasoline hub, accounting for nearly 45% of global production, derived from the conversion of unconverted 32–57% bottom fraction, which is low in hydrogen and high in carbon contents [25,26,27]. The naphtha quality is close to the finished gasoline specification [11,28,29,30]. Other desired coproducts include diesel, liquefied petroleum gas (LPG), and light cycle oil (LCO). LPG and distillates are optimized [31], thus lowering the amount of residue or wastes in crude oil, providing more flexibility to the refining processes and adapting to changes in the market.
  • Adaptability to the production of light olefins for the petrochemical industry. FCCU is the second largest olefins source for petrochemical applications, after naphtha steam cracker, accounts for 48% of the world’s production [32,33,34,35].
  • Supply of high-quality steam to several process units and power generation. Coke combustion in the regenerator generates a preponderance of heat, which produces a considerable amount of steam used in the other process units within the refinery [36]. Stack flue gases from the regenerator have high thermal profiles ranging between 700–800 °C and pressure between 240–380 kPa. The hot pressurized flue gases effluent can be fed for electric power generation. On average, the electricity generated from the flue gas relatively meets the main air flow power requirements. Based on a barrel per stream day (BPSD), an FCCU capacity of 50,000 BSPD operating at about 310 kPa generates about 200,000 kg/h of flue gas at 720 °C, which are fed into an expander, thus generating an estimated 11 MW of electricity, thereby reducing overall operating cost [37,38].
  • Large throughput, short turnaround (TAR), and long shutdown. In most of the refineries across the globe, FCCU has the second largest throughput, after the distillation unit. Each cracking-regeneration cycle is short, taking a maximum of about a 1 min while the unit runs 24 h per day for up to 3 to 5 years between scheduled shutdowns for routine maintenance, renovations or upgrades; recent studies also indicated that better turnaround times have been recorded [19]. The amount of circulated catalyst within this period is in the range of 7 × 10¹⁰ kg, while the feedstock processed is in the order of 1010 kg [14]. The frequency of unplanned shutdowns has also significantly decreased due to increasing understanding and application of newer process technologies; this will be explicitly discussed in subsequent sections.
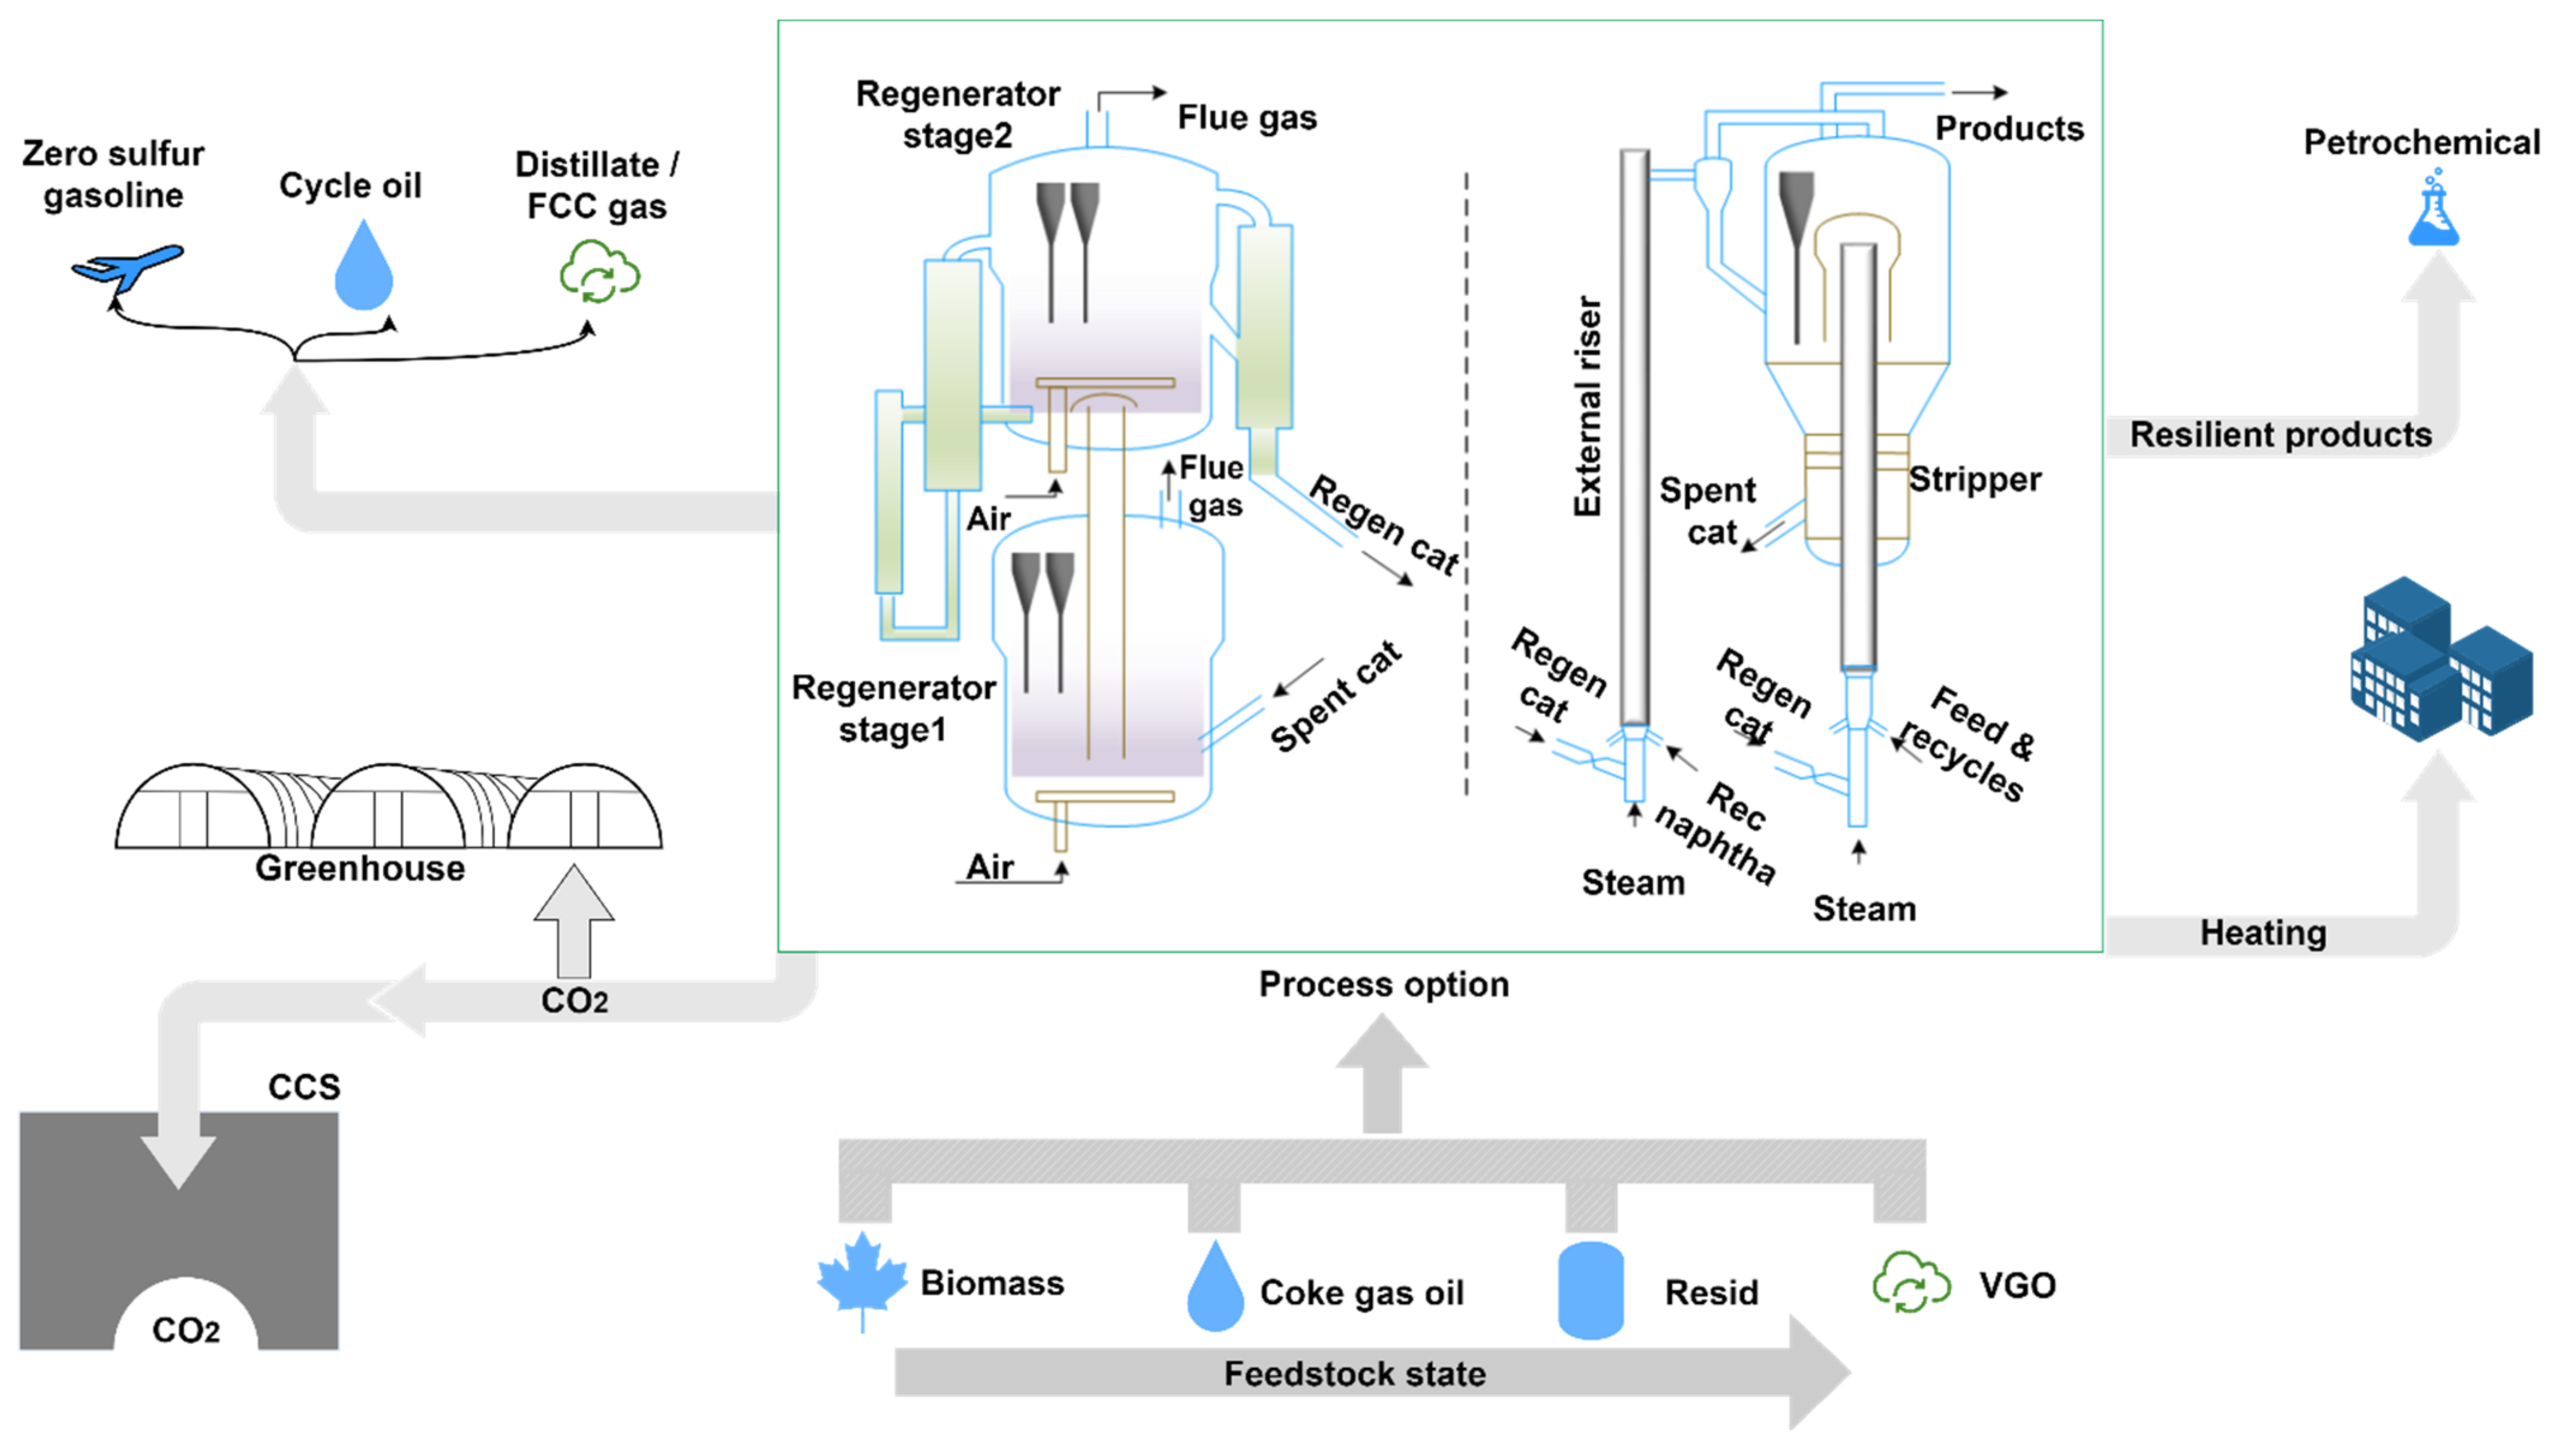
  • Adapted to new feedstocks (co-processing biomass-derived oils and conventional crude oil fractions). Concerted efforts have been geared toward the utilization of biomass-based feedstocks (ranging from used vegetable oils, pyrolysis oils, lignocelluloses to non-carbohydrate materials) in the existing FCC infrastructure within the nominal operating conditions, which is a strategic measure to promote biofuel production, fulfill renewable fuels obligations, and lower emissions from the unit [39,40]. Different biomasses (see Appendix A) have been tested both experimentally and by modeling with both promising outcomes and challenges to overcome.
  • Essential learning in handling fluid–solid systems for other applications. Several innovations in chemical and pharmaceutical industries with respect to design, scaling and process optimization drew insight from FCCU, and the unit was also the most reputable for particulate technology studies [3,41]. For example, FCCU technology is the cradle for the circulating fast bed reactor being used in many industrial applications today [1]. The understanding of gas-particle mixing, reaction chemistry, hydrodynamics, and heat transfer are important parameters for overall FCC performance. Stripper units operate in bubbling fluidization, the riser in the dilute regime, and the regenerator is the biggest vessel known to operate in turbulence in a fast fluidization regime; the cyclone separator involves the vortex effect. These traverse fluidization regimes and complexities provide confident learning for other applications, even in the space and volcanic studies [42,43].

1.2. Future Roles of FCC Process and the Importance of Process Intensification (PI) Technologies

Over the last half-decade, a historical year-on-year drop in total global crude oil production and a corresponding decline in fossil fuel demand has been witnessed. In 2020, though the world proven crude oil reserve increased by 0.2%, representing 1549 billion barrels (bn b), the global refinery capacity dipped by 0.3 million barrels/calendar day (b/cd) to stand at 101.1 mb/cd, partly due to COVID-19 [44]. It is also believed that oil production peaked in 2019, and a continuous reduction in production and refining capacity is inevitable. The FCC feedstock quality is also reducing, leading to the development of several hydrotreating technologies [13]. Stricter environmental regulations for transport fuel are increasing, and the electrification of vehicles is fast growing. In fact, by 2050, the energy mix will change completely by becoming more diverse and primarily driven by customer choice and environmental impact rather than resource availability [14,45,46]. These multivariant challenges spell a bleak future for FCC profitability, thus warranting a change in its future operations.
Therefore, in the future, FCCU must fulfill the following performance requirements to be both acceptable and profitable: high operation flexibility, minimal operating and maintenance cost, improved product selectivity, modularization, an increase in unit capacity and reliability, minimal energy consumption, and high compliance to stringent emission legislations. By implication, as depicted in Figure 2, FCCU must simultaneously accept more low-quality feedstocks (e.g., biomass) and produce high-quality fuels. With a decreasing trend in gasoline demand driven by electrification of the transportation sector, a switch to ultra-low sulfur diesel (ULSD) production will offer the maximum bottom upgrading advantage. The gasoline generated must be free of sulfur and nitrogen-based pollution gases (SO2, SO3, COS, H2S, N2, NO, N2O, NO2, NH3 and HCN). More so, flue CO emission will be eliminated and the CO2 generated will be upgraded for an economic incentive through the integration of carbon capture and utilization (CCU) technologies. On the flipside, to avoid supply and profitability downturn, FCCU will transition to maximum production of intermediate distillate petroleum fractions, especially the olefin product slates with longer turnaround periods. It will also accommodate the coprocessing of different types of biomass in its existing units with no compromise on device reliability and environmental requirements. Due to the energy market flipping, the FCC modular unit will equally be needed for a clean, safe, and modular supply of FCC products. These will attract the penalties of the alteration of combustion kinetics, cracking reaction and structural modification of the unit. A tradeoff for a more sophisticated design and operation than the present technologies may occur but will increase the investment cost. It is also worth stating that the current Houdry FCC process is highly arduous from lab, industrial and computational simulation standpoints, so a more sophisticated system will be an additional and unattractive burden.
In order to achieve the above, the FCCU must function against all its current mechanical and operating constraints. Except for proper catalyst selection, the most needed are process intensification (PI) technologies which can improve the inner multiphase flow hydrodynamics to produce more valuable products or enhance equipment reliability to increase unit service availability (i.e., shorter turnaround and longer turndown periods). Therefore, process technologies integrated into the reactor and the regenerator components with minimum environmental emissions are indispensable. The regenerator unit thus deserves renewed attention with respect to its inherent functionality and PI needs.

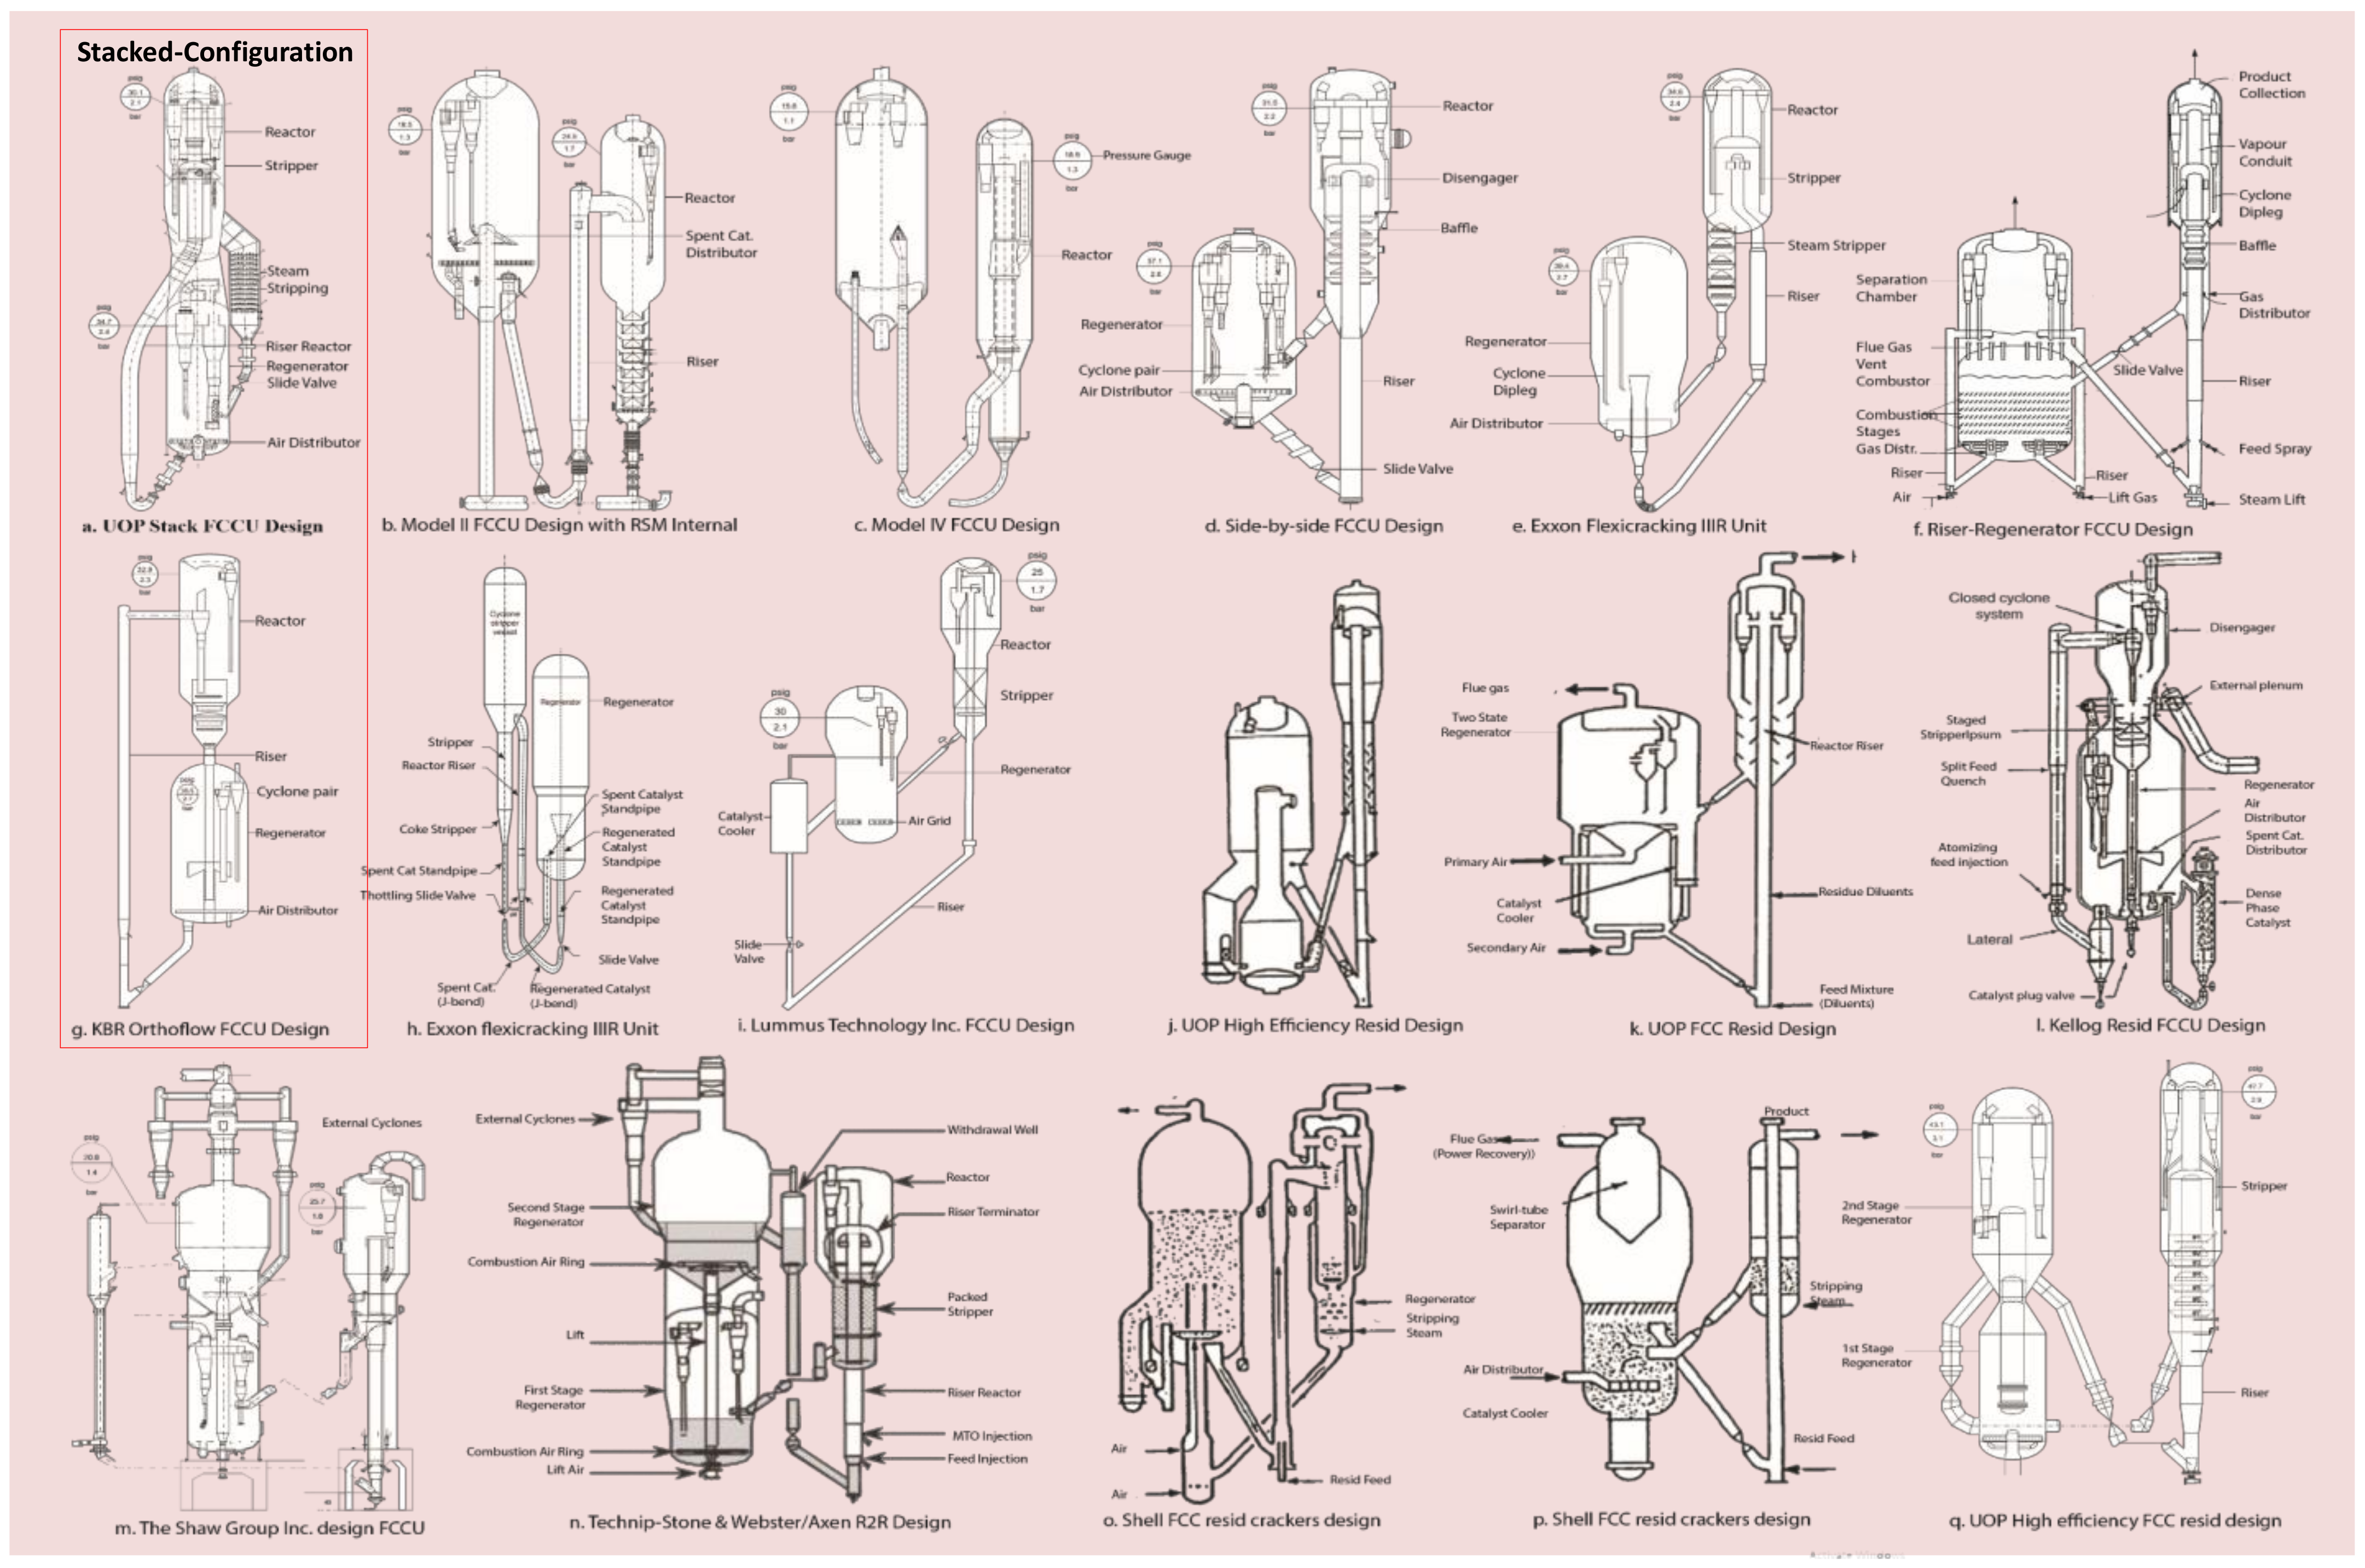
1.3. FCC Regenerator: Functions and Various Designs in Petroleum Refineries

The core functions of FCC regenerators are basically: catalyst activity restoration by eliminating the coke that builds up on the spent catalyst in the reactor without destroying the catalyst, providing heat balance for cracking reactions in the reactor and supplying hot fluidized regenerated catalysts to the feed nozzles [18,47]. The real distinctive processes and reaction mechanisms to achieve them under steady-state conditions are much more complex.
FCC regenerators are available industrially in different designs (see Section 2.2) which are principally delineated by operating condition (bubbling, turbulent or fast fluidization), gas–solid contacting pattern (co-current or countercurrent), combustion level (partial or complete/fullburn), etc. Regardless of the design, commercial FCC regenerators are composed of common rugged structural devices, which are mainly:
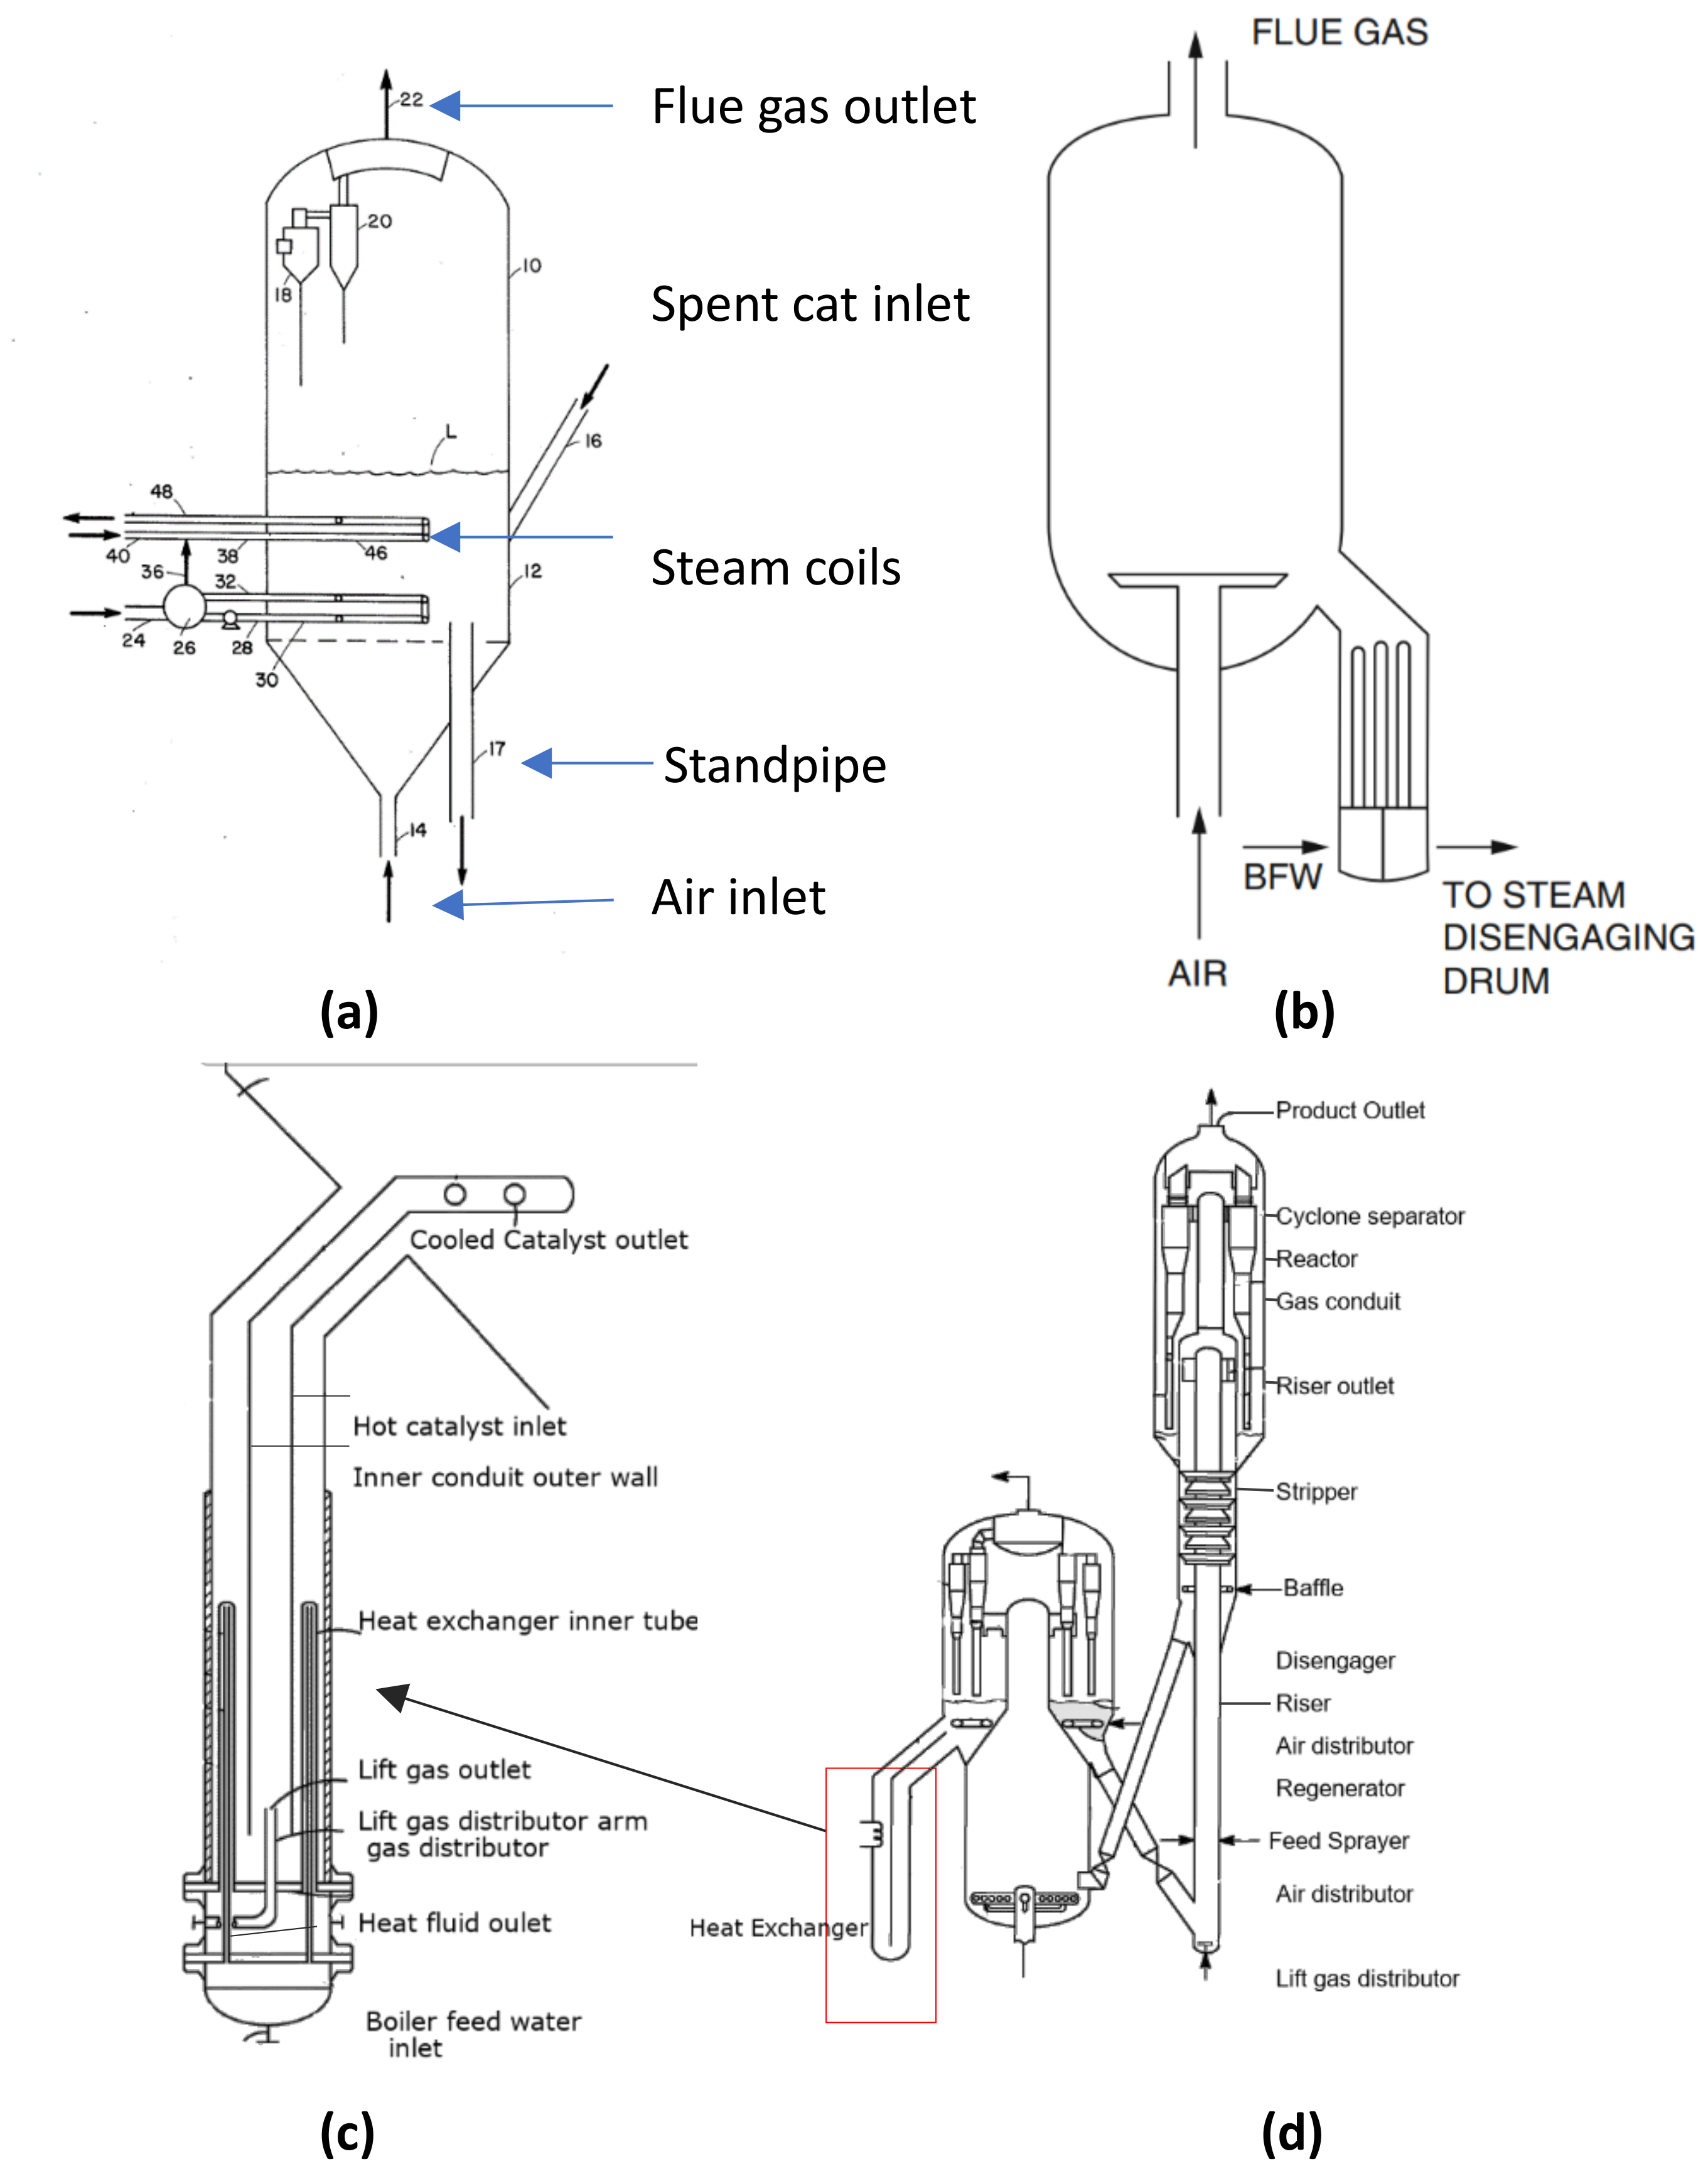
  • Standpipes/slide valves: For building a hydraulic head by maintaining a column of fluidized particles. Spent catalyst standpipe transports coked cracking catalysts into the regenerator from the riser, while the regenerated catalyst standpipe allows the return of cleaned catalyst back into the reactor [48]. The embedded discrete slide valve controls the catalyst circulation rate (see Figure 1 and Figure 2).
  • Spent catalyst distributor: For a uniform spread of coke-laden catalyst across the bed cross-section in the regenerator [49,50].
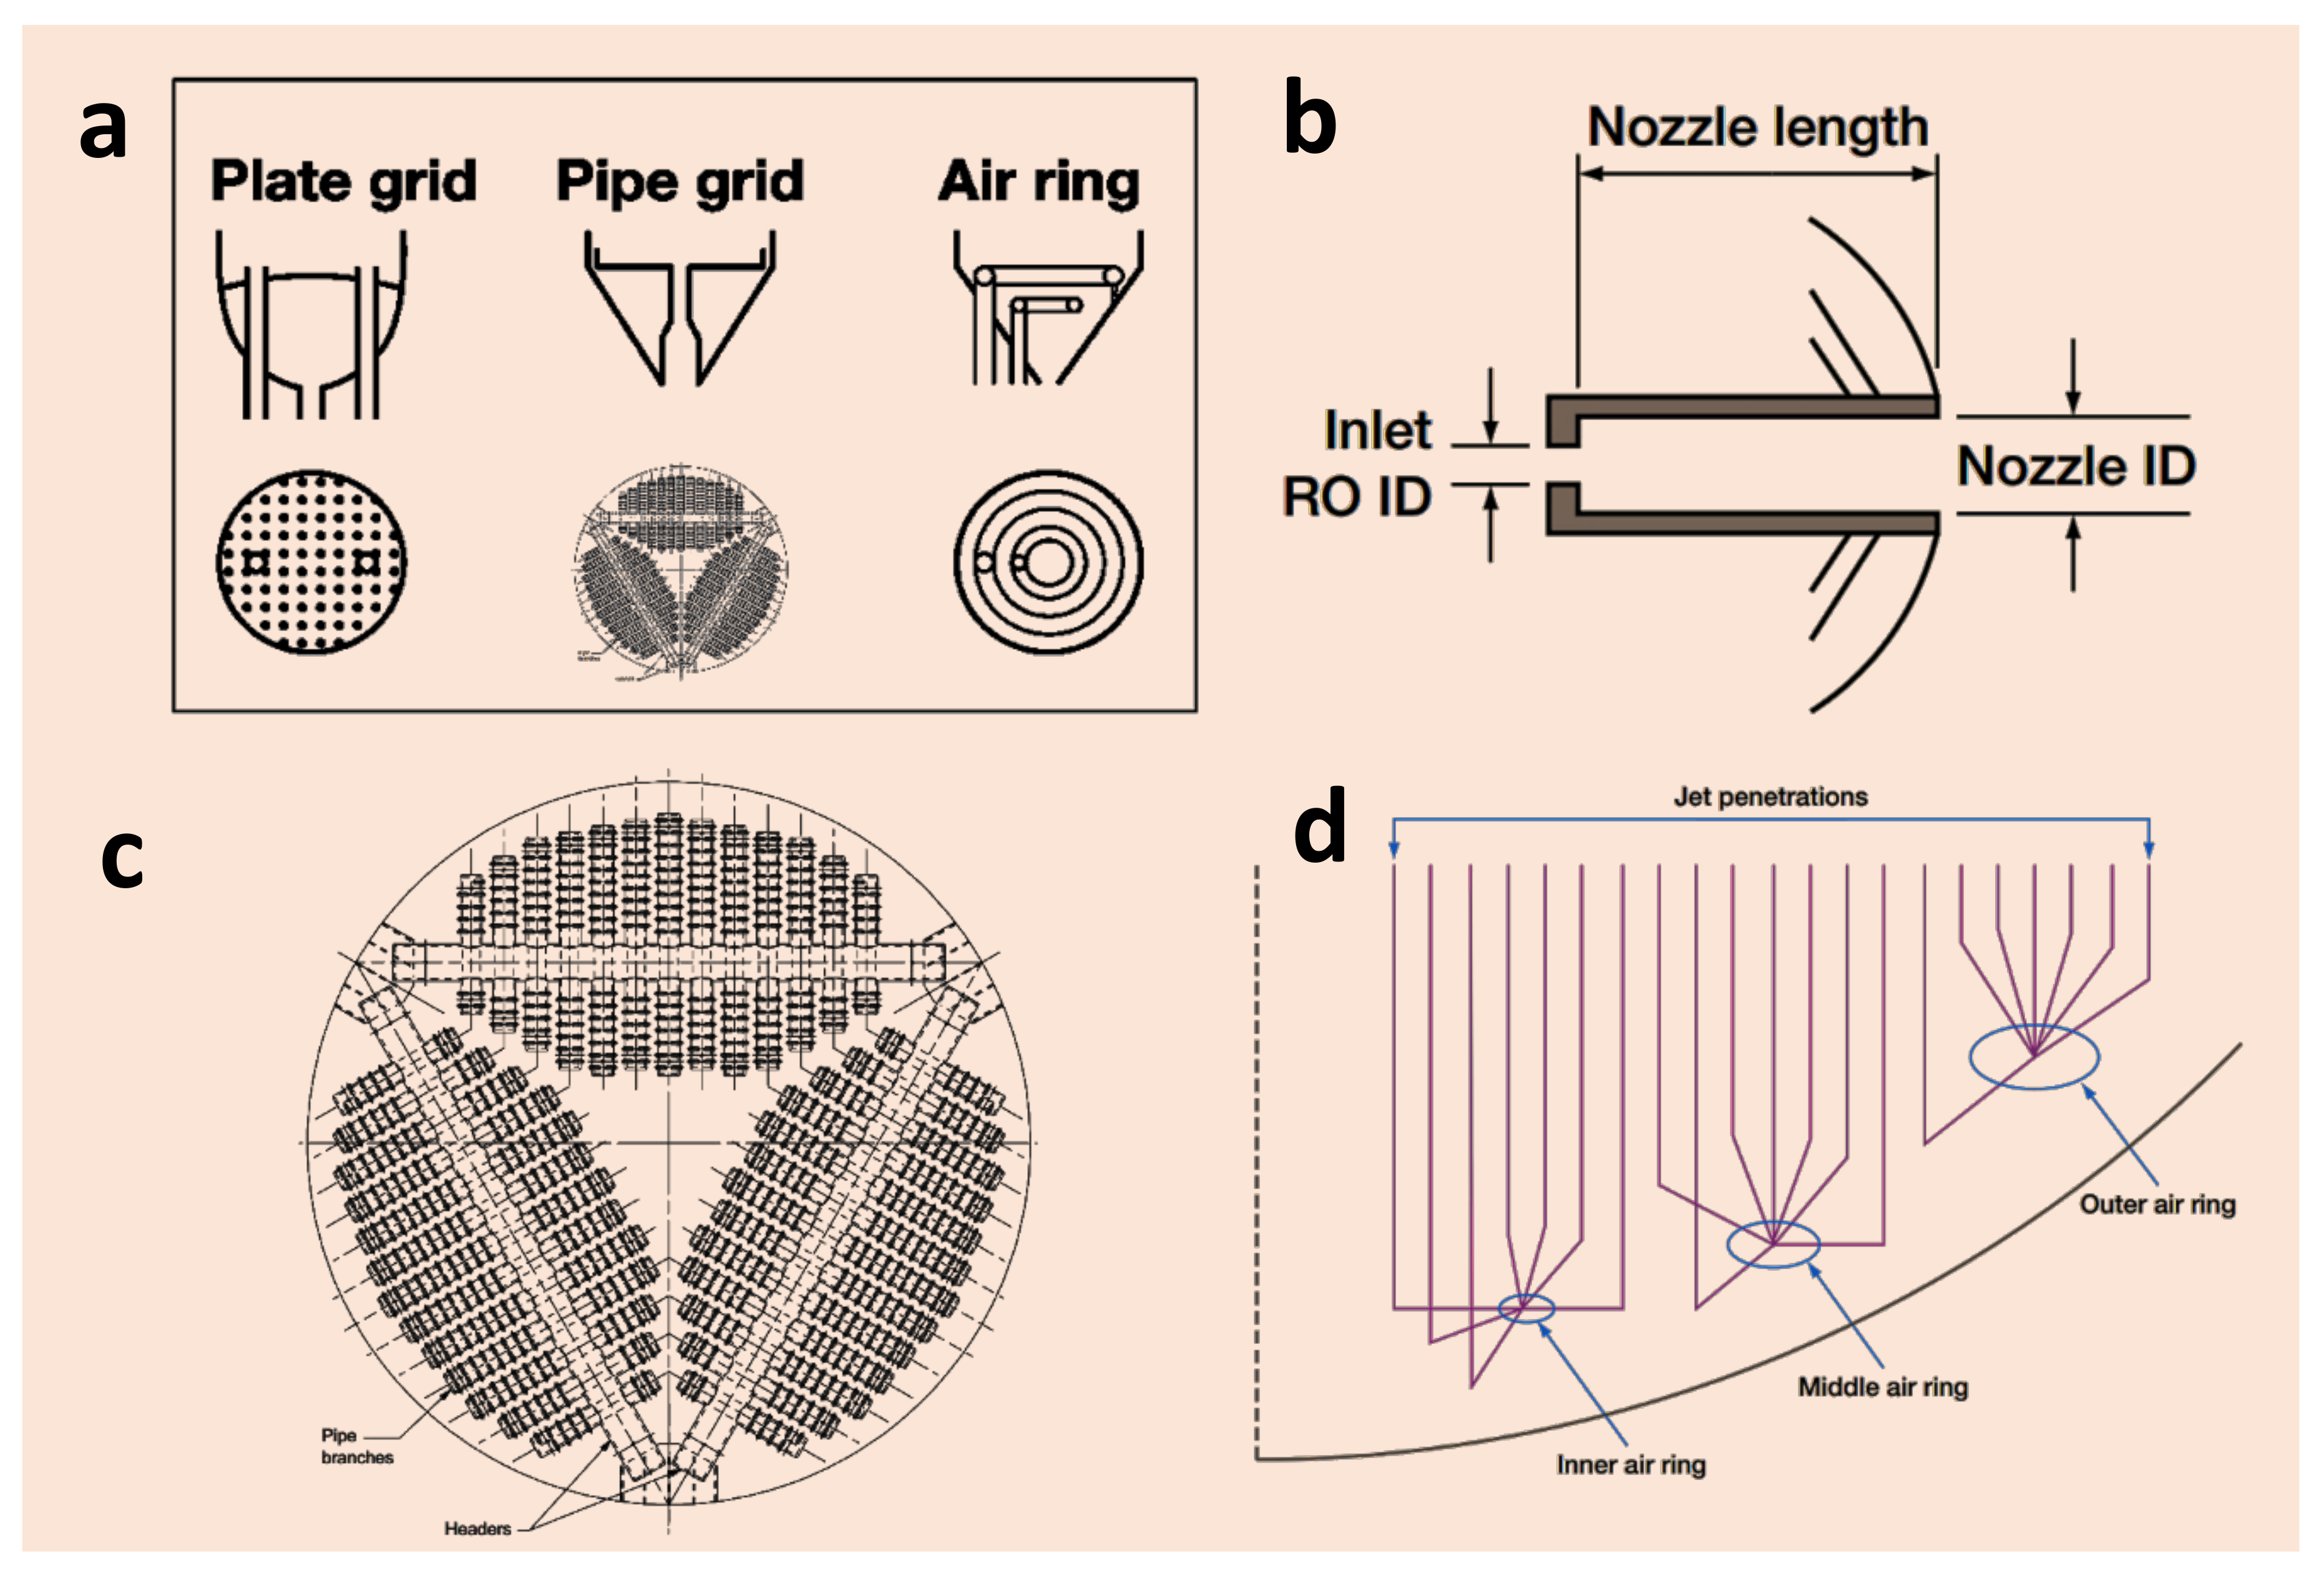
  • Air/steam distributor: For even dispersion of feed gas into the regenerator bed cross section [51].
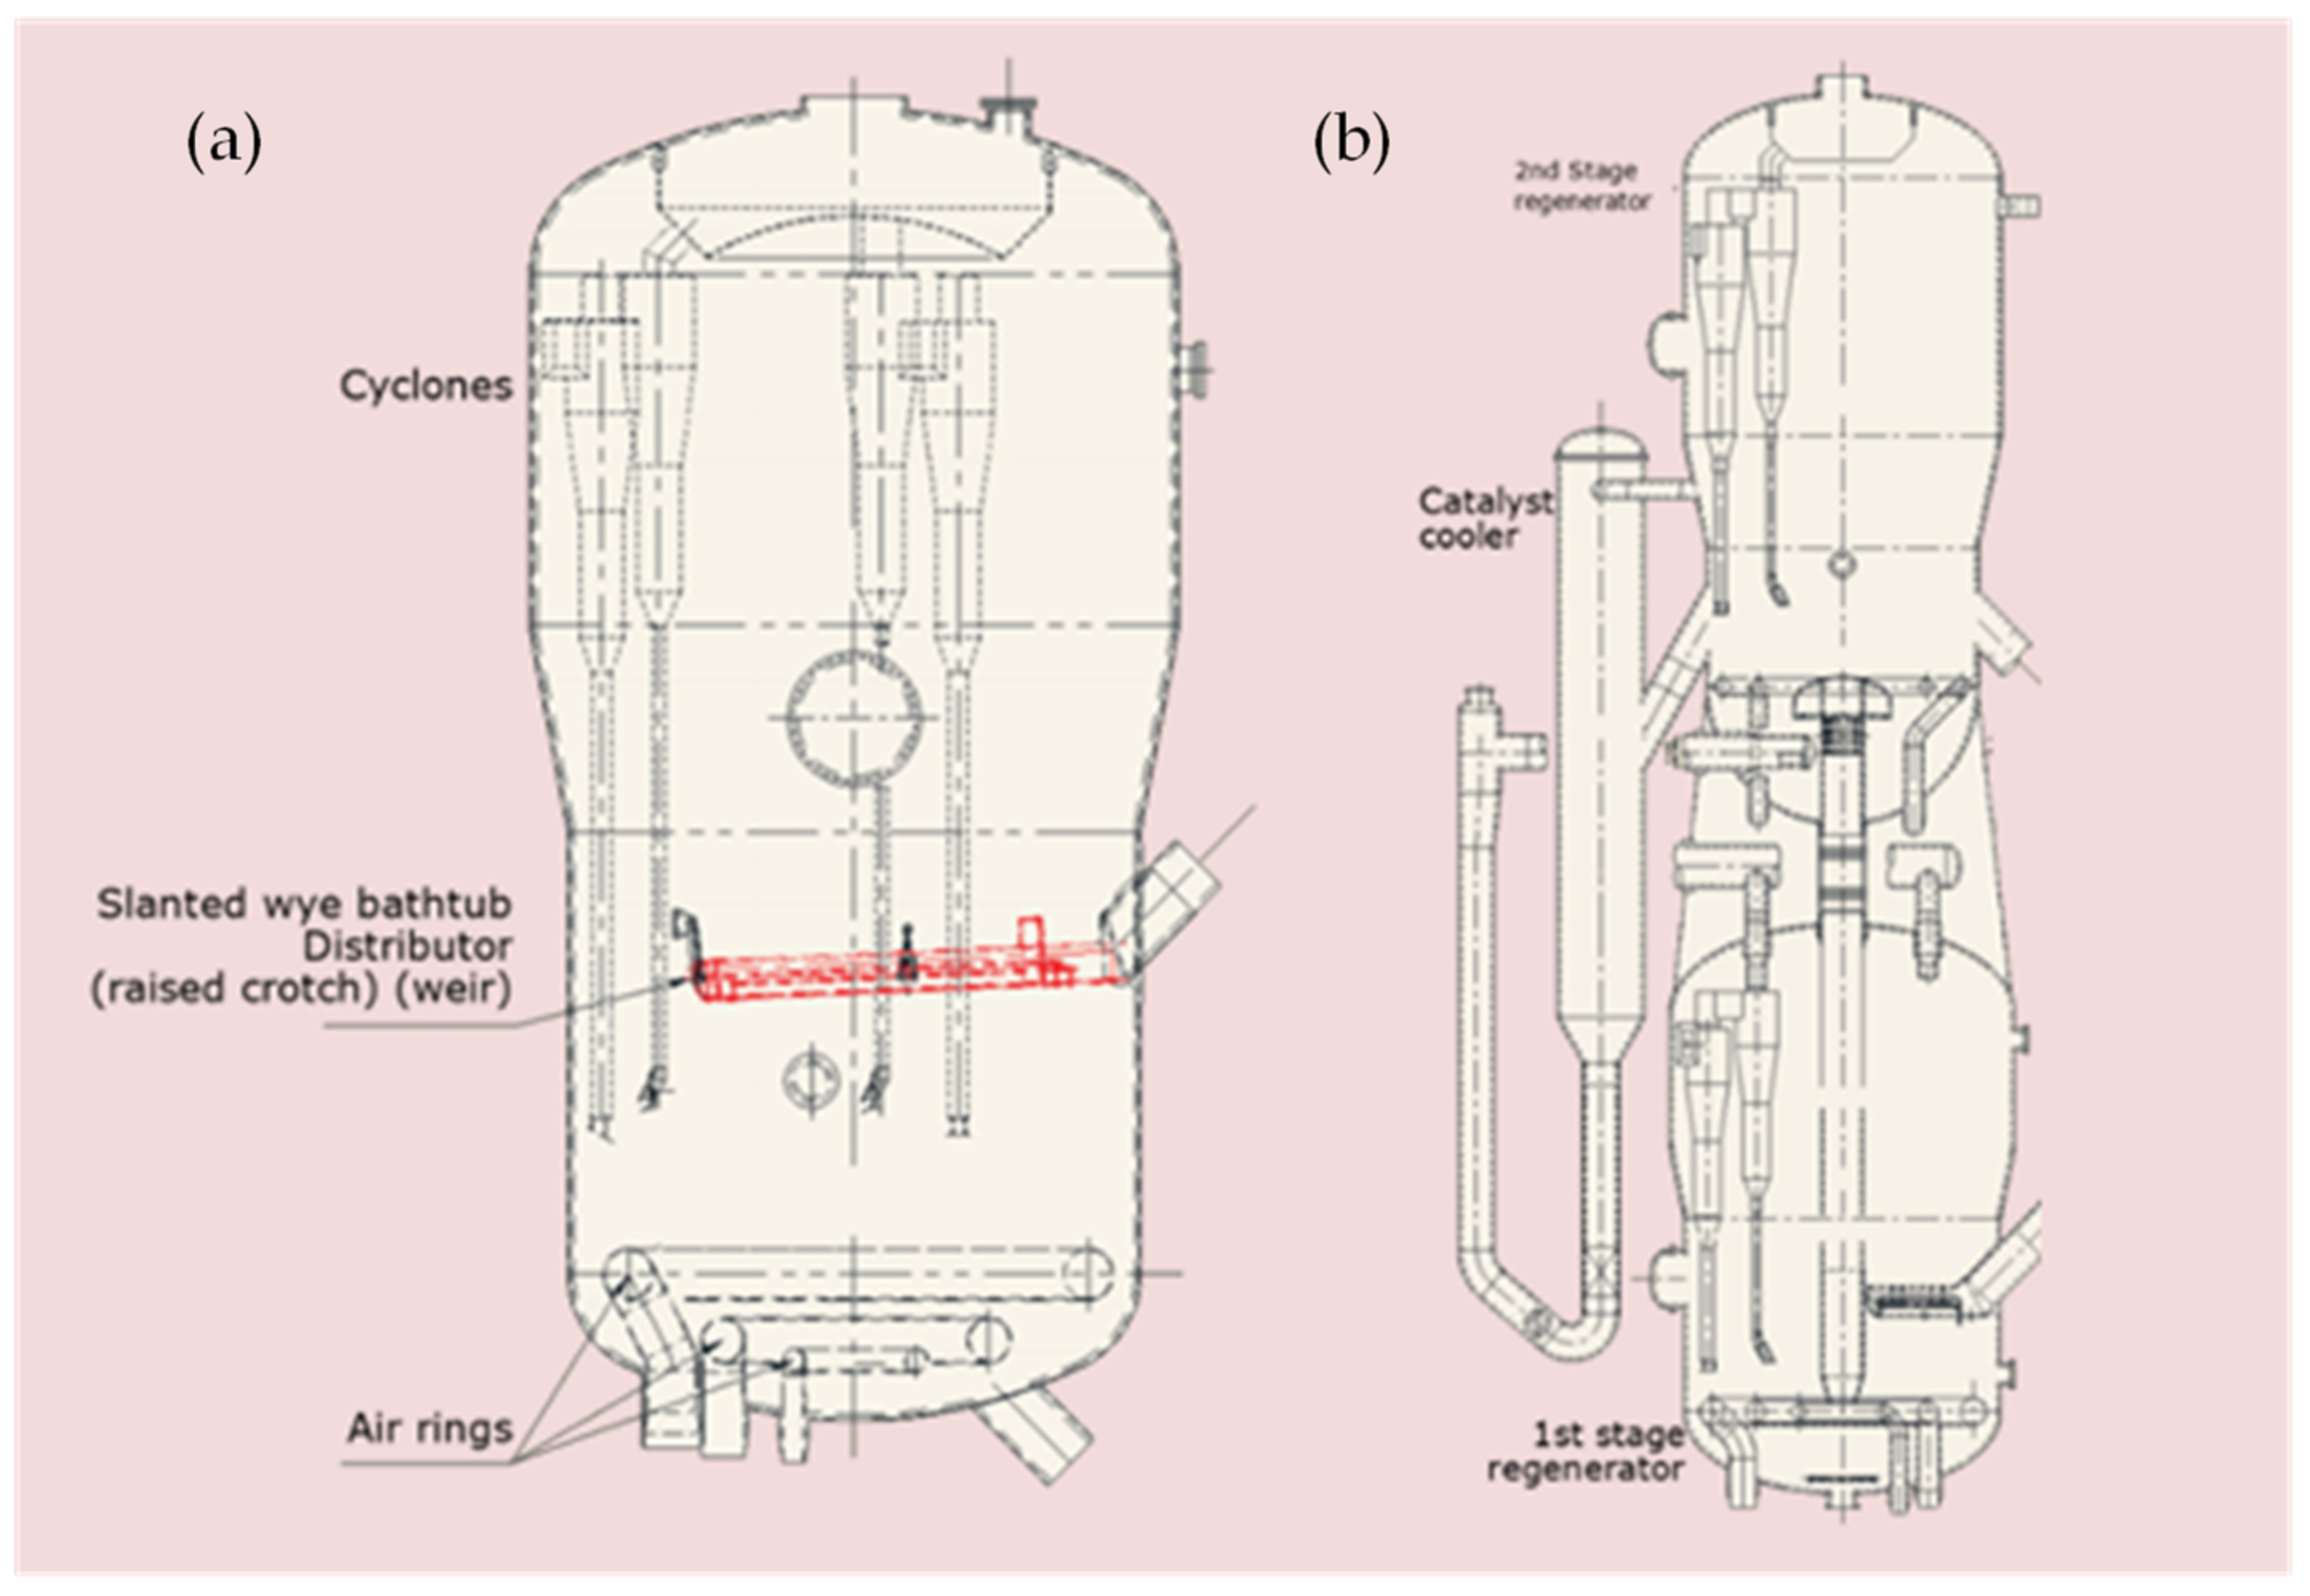
  • Cyclones: Usually in multiple pairs (primary and secondary) for separating entrained catalyst particles from flue gas and returning the solids back to the regenerator bed [13].
  • Plenum: A device positioned at the top of regenerator system, usually made of carbon steel for receiving flue gases from multiple pairs of cyclones before they are vented out. It also aids in minimizing catalyst loss [1].
  • Catalyst cooler: Auxiliary internal used to keep the unit temperature within the tolerance limit. It is one of the most flexible and reliable internals that functions optimally in the range of 100% design duty and can be safely shutdown or restarted during full operation [13].
  • Baffles: Auxiliary internal for inducing efficient gas–solid within the regenerator bed, among others [52].

1.3.1. Coke-on-Catalyst Combustion Mechanisms in the Regenerator

A typical FCC spent catalyst contains 0.5–1.5 wt.% coke, which is dominantly composed of unevenly distributed carbon (about 91–95%) and hydrogen (5–7%). Small quantities (<1%) of heteroatoms; heavy condensed polyaromatics, nitrogen, sulfur, platinum, and iron are also present as contaminants [53,54]. The combustion of these compounds by feed gas follows different competing reaction routes and rates, carbon combusts to generate CO and CO2, hydrogen to steam, nitrogen to NOx (x = 1 or 2), sulfur to SO2, etc. The heat of combustion emanating from hydrogen oxidation is 3.7 times more than of carbon to CO2 oxidation [1]. As a result, two approaches are widely explored by refiners in coke burning: full and partial combustion modes to maximize heat of combustion, as further discussed in the regenerator in Section 2.
From the combustion chemistry perspective, lab experiments on coke combustion are relatively scarce due to the high temperature involved, variation of coke composition and complex relationship between operating conditions and combustion reactions leading to different investigation approaches. Researchers differ on the exact coke deconstruction mechanisms, especially in relation to secondary conversion of CO to CO2. While most studies focused on carbon and hydrogen combustions, some ignored hydrogen combustion due to the difficulty in measuring the quantity of hydrogen in coke; some also only considered homogenous CO combustion but neglected heterogenous reaction [55,56,57], and only a few considered the combustion of sulfur and nitrogen compounds; some researchers uncoupled it on the assumption that their quantity is always small and hence negligible [58,59,60]. These assumptions have grave consequences: neglecting H, S, N species will compromise the accuracy of real O2 available in the system and ignoring catalytic CO combustion will alter the flue gas composition and temperature distribution profile. However, since the operating conditions of these studies vary from one another and were mostly small-scale, it is therefore hard to comparatively assess the quality of their measurements in relation to coke burning performance; however, in some cases, the effect of this discrepancy is often seen on the flue gas O2 concentration profile. In this view, we recommend standard intrinsic coke combustion kinetics based on Arbel et al. [61], which have proven consistent in many experimental and computation investigations; the nitrogen and sulfur kinetics shown in the Table 1 were used by Berrouk et al. [59].
Furthermore, maintaining heat and material balance under steady-state conditions in a regenerator is sacrosanct, but the air flowrate is the single independent control variable while the catalyst circulation rate, temperature, carbon on catalyst and pressure dependent variables frequently change in order to maintain the unit heat balance. The operating variables necessary for an ideal regeneration are described by Equation (1):
d C d t = K × C i × L m O 2 × e A RT
where O2 is the air flow rate, which is the oxygen factor; Ci is the catalyst volume fraction; Lm is the regenerator length; T the regenerator temperature; and A and K are the frequency factor and activation energy, respectively [1]. Air is often the key source of O2 supplied by the air blower through the air distribution system positioned near the base of the regenerator vessel to aid combustion; the combustion air flow rate or superficial gas velocity partly determines both the regenerator bed temperature and the coke burn off. Increasing the gas velocity above the minimum fluidization conditions enables both lateral and vertical catalyst flow, giving rise to the potential to operate the catalyst bed at different aggregative fluidization regimes. As the superficial gas velocity increases, different regimes are sequentially developed: bubbling (characterized by meso-scale structures, bottom dense bed and freeboard sections), turbulence (having dense bubbling and dilute dispersed entrained flow region), circulating fast fluidization (co-existing catalyst clusters and bubbles) and dilute phase transport fluidization [62]. Table 2 shows the operating parameters for a typical regenerator of 50,000 barrel per day capacity. Due to regenerators’ large sizes among other metrics, most industrial FCC regenerators operate in a turbulent regime with feed gas velocities ranging from 0.6 m/s to 1.2 m/s to ensure efficient interaction between the feed gas and catalyst; other important considerations for selecting suitable gas velocity include catalyst characteristics (such as the diameter, particle size distribution, density and flux) and column geometry, since these have a significant influence on the system hydrodynamics and regenerator coke combustion performance [19,63,64,65,66]. The bulk of catalysts are maintained at the dense bed, while the dilute phase contains carry-over catalysts where they are collected by cyclone separators and returned back to the dense bed. Ideally, coke combustion takes place in the dense phase, but due to solids entrainment in the freeboard, both regions combust. This leads to afterburning, erosion, and catalysts loss problems.

1.3.2. Key Process Considerations and Constraints

Maintaining overall material and heat balance in FCCU requires that the regenerator burns the corresponding amount of coke produced in the reactor without thermally destroying the catalyst and also producing the needed heat for the entire unit, which covers the heat circulated to the reactor for endothermic cracking reaction and heat for vaporizing the feed via the circulated catalyst, as well as heat to raise the air and steam to suitable temperatures [51,69]. Heat transferred to the reactor via circulated catalyst is a function of the catalyst-to-oil ratio as described in Equation (2). An increase in circulated catalyst will raise the ratio of catalyst to oil and in turn increase the conversion in the riser reactor but will also raise the amount of coke formed, as described in Equation (3). The coke yield is linear to the catalyst-to-oil ratio. Delta coke is the net coke between spent and regenerated catalysts.
Heat trasnfer lb of feed = catalyst oil   T regen T react
Coke   yield =   delta   coke catalyst oil
The implication of the interwoven relationships between the heat and material balance is that FCCU is constantly self-tuning so as to combust the exact quantity of coke that will generate the required heat by constantly adjusting the catalyst circulate rate; this in turn affects the feed conversion and coke yield. This also places limitations on the use of feed with high Conradson carbon since it will trigger a high coke yield, leading to increased difficulty in controlling the regenerator temperature solely through the catalyst circulation rate. If left unabated, it usually results in regenerator thermal runaway [14].
In general, spent catalysts sent into the regenerator form a bottom dense phase (region of high catalyst concentration), and through the air distribution arm extending from the air blower. A fluidizing agent (air feed stream containing 21.5 wt.% oxygen) is supplied, aiding the combustion process under a minimum superficial gas velocity. A temperature of nearly 988.15 K and an estimated pressure of 241,000 pascal are required to maintain steady fluidization of the catalyst bed. Pure O2 can also supplement the air for intrinsic combustion purposes [13,14]. Air distributor functionality is a key determinant of the regenerator’s performance [70,71]. Hence, the pressure drop industrially is often intrinsically designed to be between 1.02 and 2.18 psi, because when it drops too low, there will be inadequate pressure drop to spread the combustion air out through the distributor nozzles across the grid. As it lowers, it starts aspirating catalysts, and with time, as catalysts aspirate at one point of the grid, it will come out on the other side, giving rise to spent catalyst maldistribution [13]. If this persists, the catalyst would chew up and eventually destroys the grid, marring the reliability of the unit. This will be discussed in detail in Section 3.2.
Owing to the sensitivity of silica alumina catalysts to high temperature and long residence time, not all the coke is allowed to be completely stripped off as it requires long solids residence time. An average regenerated catalyst still carries over about 0.1 wt.% carbon content into the reactor [1]. Several experiments and computation efforts are increasingly geared to achieve lesser carbon content [58,72,73]. Cabrera et al. [74] claimed a 0.05 wt.% carbon on regenerated catalyst is achievable with their patented orthroflow regeneration system. Unfortunately, there has been no industrial success on it yet. This residual carbon backlog also contributes to the limitation in the catalyst regeneration cycles and regenerator’s overall efficiency [14]. Improved understanding of intrinsic coke combustion kinetics and FCC regenerator operation phenomena may eventually birth a coke-free regenerated catalyst in the future.
The pressure and temperature balance are also required for an optimum regenerator operation; the flue gas slide valve is the key tool for adjusting the system pressure and it is maintained to provide a constant pressure gradient between the riser and the regenerator [13]. This is regulated to realize high catalyst circulation and sufficient pressure drops across the various control valves. Additionally, it aids the pressure balance in the wet gas compressor and the air blower. On the other hand, the control for temperature depends on the amount and composition of coke laden on the catalyst being charged into the regenerator, and the method of combusting the coke (partial or full burn mode) [75]. The regenerator temperature has a direct effect on the concentration of CO in the flue gas composition, as can be seen in the heterogenous and homogenous kinetic in Table 1. This implies that meeting the legislation of 500 ppm CO hinges on effective temperature control in the regenerator. Spent cracking catalyst inventory in the regenerator also depends on the ability of the system to withstand high temperature and to forestall damages to the internals many operators control their catalyst inventory to a lower level through the catalyst slide valve, which without doubt compromises the profitability of the unit [45,76].
In the absence of spent catalyst slide value, as is the case with some designs, the catalyst bed level float is a function of the catalyst losses as well as the periodic equilibrium catalyst withdrawal and fresh catalyst addition policies. The rate of periodic replacement of equilibrium catalyst which is also used interchangeably as the catalyst ages is related to the activity of the catalyst S as given in Equation (4) [1].
A = A O S K D + S
where, A and Ao denote the equilibrium and initial catalyst inventories, KD denotes the deactivation constant, and S denotes the fractional catalyst addition rate per day (ton/ton). The implication of this equation is that a lower catalyst inventory in the regenerator would give rise to the biggest equilibrium or activity of the unit. Nonetheless, K relates to different factors that suggest that there is an optimum unit inventory for a specific processing capacity [1]. These factors include the number of catalyst circulation loops between the regenerator and the riser, catalyst type, contact between the spent and the fluidizing gas, and the temperature mix. Apart from the issue related to defining the optimum catalyst inventory in the system, short-circuiting of spent catalyst from the system inlet to the rise, giving rise to high carbon distribution on the regenerated catalyst, is often witnessed [77]. Uniform contact of gas and catalyst through different strategies has largely reduced this problem, and with more instrumentation, the overall system control has become more flexible.

1.3.3. Alternatives to Coke Combustion Method of Coke-on-Catalyst Removal

Due to the aforementioned complexities in coke combustion, several alternative methods for decoking spent catalysts have been attempted, but none to date has gained successful commercial application. Coke removal by steam reforming was first proposed by Matula et al. [78], where a large amount of steam was injected under high pressure to produce hydrogen and CO2; the formation of hydrogen was a great incentive since it valorizes low-value coke into high-value hydrogen instead of heat, but the operating temperature is too high (850–950 °C) for both the FCC catalyst and the hardware components of the regenerator. Hsing and Mudra IV [79] in their invention claimed to have achieved a similar result at lower temperatures in the range of 540–650 °C; nevertheless, no evidence of their application is available. Corma et al. [80] and Hettinger Jr. [81] also explored the option of using CO2 instead of steam and a new type of catalyst; unfortunately, just like putting the cart before the horse, the catalyst has no proven effectiveness or evidence in cracking long-chain hydrocarbons. In addition, their technology cannot account for its influence on NOx and SOx (x = 2 or 3) reductions. Furthermore, Corma et al. [82] proposed the integration of a steam reforming removal method in a conventional combustion system; they investigated this approach using E-cat under differential operating conditions (varying residence time and steam pressure); interestingly, about 25–45% of the coke was removed, though this was quite low compared to the combustion performance but less expensive. The big challenge with this method is the failure to account for the effect on nitrogen and sulfur species in coke knowing fully that CO2, NOx and SOx have seamless interactions. One takeaway from these efforts is that the potential for designing a coke removal method parallel to combustion exists especially in the combination of steam reforming with other methods, which should be intensely pursued further; a possible measure is to introduce a three-stage regeneration method comprising combustion, steam reforming and water gas shift reactions. In addition, resolving problems associated with combustion approach will not only produce cleaner regenerated catalysts but also do so at low cost with flexible dynamic system control.

1.3.4. Various Needs of PI in FCC Regenerators

Even though FCC technology is mature and resilient, considerable intensification of the regeneration process is still feasible with the aim of improving the device performance and reliability. The various needs for PI in FCC regenerators are outlined below:
  • Optimization of geometry to promote intrinsic coke combustion and energy consumption;
  • Increase in particle bed density with more uniform horizontal dispersion of gas and solids and a controllable bed expansion to enhance heat transfer;
  • Reduction in solids residence time to avoid thermal deactivation;
  • Reduction in radial nonuniformity of gas–solid bed mixing to improve bed stability, combustion rate and emission reduction;
  • Prevention of spatial non-uniformities of gas and solids temperature distributions, which forestalls afterburn;
  • Increasing the gas–solid slip velocity so as to intensify the gas–solid heat and mass transfer, emission reduction, etc.
However, conspicuous constraints to the above remain. Bed and internal geometries, solids bed density and residence time distribution (RTD), and temperature distribution have commingled relationships with different process conditions. Thus, they cannot be independently adjusted. For instance, temperature uniformity is often constrained, especially at the interior of the regenerator by the restriction of solid circulation owing to the design of the spent catalyst distributor, severe channeling, gas bypass or solids agglomeration based on particle size distribution, resulting in poor reactor performance. Prudent intensification of different parts with a positive impact on other components is required.

1.4. Scope and Objectives

The current review addresses the new developments and advances in the combustion process intensification in the regenerator section of the FCC unit. This paper is organized as follows: Section 2 presents the distinct features of the different commercial designs of FCC regenerators and their comparative combustion efficiency advantages. Section 3 covers the measures to advancing regenerator performances, Section 4 describes the measures to improving regenerator reliability, Section 5 addresses environmental issues and Section 6 draws the conclusions. This work concisely appraises the breakthrough from regenerator engineering innovations and reveal problems solved arising from process operations or structural configurations. It is hoped that this review will be a valuable reference and teaching tool for research and industrial communities.

2. Different Designs of FCC Regenerators

2.1. Full Regeneration Design

Regenerators are designed either as a single- or two-stage combustion regeneration systems (see Figure 3). This is one of the fastest-growing areas for regeneration intensification.

2.1.1. Single Stage Regenerators

In single-stage regenerators, the whole catalyst rejuvenation process takes place in one fluidized bed chamber [83]. Until the present, it has been the most commonly adopted mode due to the simplicity of the process and equipment design. Two process design approaches are widely explored in single-stage regenerators: complete combustion and partial combustion modes. A partial or incomplete burn allows mild countercurrent combustion (lower temperature between 620 and 675 °C and lean oxygen supply) of coke, generating a targeted large amount of CO which is further combusted to CO2 in a CO boiler (such as power for industry (PFI) boilers) or incinerator to reclaim energy in these gases [1]. Metals such as vanadium and nickel complexes are minimally oxidized and the coke hydrogen content is rapidly burned, with all deactivation precursors removed. Ideally, no O2 is present in its stack flue gas and temperature control is high but the coke on regenerated catalyst (CRC) is relatively high, usually about 0.1 wt.% or higher, which is typically the main performance indicator for regenerators. Flue gas emission is another serious issue in a partial burn regenerator; the efficiency of the boiler system is one important factor for meeting emission legislation. New advances for improving the boiler efficiency have evolved in the design of a CO boiler, resulting in enhanced CO burning and low supplementary fuel consumption; these include resizing the heat transfer surface and replacing the refractory furnace with a membrane water-walls furnace [14,84,85,86,87]. Alternatively, a good spent catalyst distribution can lessen this emission risk in single-stage full-burn regenerators, as discussed in Section 3.1.
Figure 3. FCC regenerator full combustion designs: (a) single-stage regeneraator; (b) TechnipFMC two-stage regenerator (adapted from Singh and Gbordzoe [88]).
Energies 15 02061 g003
In single-stage complete combustion mode, excess air is supplied to the regenerator to ensure all the carbon species are completely reacted to CO2 with no CO in the flue gas, which helps the refiner to meet standard the permissible limit on CO emission. A lesser CRC level is achieved which is typically within 0.05–0.1 wt.% [89,90]. The key pitfalls of complete-burn systems include a limited coke combustion capacity due to the excess air requirement, high propensity due to catalyst deactivation owing to an elevated regenerated temperature, and excess heat liberated from the burning reaction. Temperature control is the topmost challenge peculiar to this mode of full-burn regenerators [77]. Usually, an increase in delta coke on the spent catalyst, especially from heavy residue feedstock processing, would also raise the temperature profile. Additionally, with non-uniform spent catalyst or gas distribution in the regenerator, problems associated with high differential temperature between the bed and dilute phase leading to low mechanical reliability of the internals, high coke content on the regenerated catalyst, and a reduction in the catalyst circulation rate to control the elevated dilute phase temperature can occur [49,91]. These can also happen in the partial combustion mode too.
To offset the thermal effect, integrating a catalyst cooler into the full-burn system and designing the partial burn with both a CO boiler and catalyst cooler are common industrial practices [92,93,94,95].
Catalyst coolers were first developed in the early 1960s to provide extra operational flexibility by removing excess heat from regenerated catalyst and permitting relatively efficient regeneration in a single-stage full-burn mode. Internal and external (flow-through or back mix) designs are the two types of commercially available coolers. Internal catalyst coolers are heat-exchanger coils or tubes installed within the regenerator chambers; they are less common due to several reasons: (i) they provide less specific temperature control ability; (ii) cooling coils interfere with the unit start-up; (iii) they promote catalyst disengagement; and (iv) they are quite difficult to retrofit or to service [96], despite providing the benefit of having fewer units, which is an objective of process intensification [97]. As shown in Figure 4, Luckenbach [98] designed an internal cooler as two steam coils operating with different pressures, which corrects the problem of thermal stress that prior inventions faced [99]; thus, it is possible to maintain a steam coil wet and the other dry concurrently. Notably, about 83 MBTU/Hr/sq.ft/0F was claimed in Luckenbach equipment, but there is no commercial application available. Interestingly, in a recent experimental study, Li et al. [100] observed an increase in the heat transfer intensification effect and radial catalyst distribution when a baffle was installed on the shell side of an internal heat exchanger, but the question of ease of maintenance or retrofitting the device was not addressed. In addition, the scale-up potential of this was neglected taking into consideration the different uncertainties that often emanate from structural resizing in FCC regenerator components [101,102]. In general, no significant advances have been reported in internal cooler design and application, perhaps due to the aforementioned challenges.
An external cooler is another design of FCC regenerator catalyst cooler, of which a shell and tube heat exchanger is the most common. For its operation mechanism, through the slide valve, hot regenerated catalyst is withdrawn from the dense bed of the regenerator to the cooler for indirect heat exchange with steam or water in the heating tubes; afterwards, the catalyst is circulated back to the regenerator dense bed by backmixing (that is, through the same inlet channel) or flow-through method (that is, through the opposite end of the inlet transfer line) [14]. Throughout this cooling process, air from air nozzles are injected into the cooler to keep the catalyst in a fluidized state [103]. It is worth stating that the backmixing return mode requires high aeration to create the turbulence required for catalyst interchange; this is notorious for cooler failure due to the rupture of heat exchange tubes and accumulation of fine catalyst. Many modifications have been patented that reduce the debris accumulation and heat transfer efficiency in the back-mix catalyst cooler: installation of a screen at the cooler inlet [95], staging the backmixing portion of the catalyst cooler in an inverted position backmixing [104], circulation of cooled regenerated catalyst directly to the reactor [105], etc. Despite these improvement attempts, commercial experience indicates that flow-through external coolers are more efficient than backmix coolers [14].
Drastic advances in heat transfer intensification have been achieved through further design modification of the catalyst cooler. The Luoyang Petrochemical Engineering Corporation (LPEC) invented an external cooler that provides for pneumatic control of catalyst circulation instead of the conventional slide valve control [106]. Of course, the slide valve is capital intensive and too restrictive; a multifunctional tool for impromptu shutoff, startup, shutdown, and regulation of catalyst-to-oil ratio is needed; a simple fault on the slide valve can keep the entire unit out of operation. Instead of slide valve control, the LPEC cooler self-adjusts the pressure balance between the catalyst cooler and the regenerated catalyst return line. By controlling the aeration rate, the desired catalyst circulation and heat transfer efficiency can be realized, that is, the air flow rate is linearly correlated to the rates of regenerated catalyst circulation and sensible heat transfer but inversely proportional to the flow density in the return line [94]. Other unique features of this design include dense-phase catalyst return and the application of finned tubes with dual roles first as baffles for bursting large bubbles in the dense phase and for optimizing heat transfer. This design has found wide applications not only in single full-burn mode but also in two-stage regeneration regenerators. Yao et al. [107] carried out an experimental validation of the heat transfer intensification performance in a 3D cylindrical fluidized bed with an annular catalyst cooler; they confirmed a high bed-to-wall heat transfer coefficient with high process flexibility. This result is consistent with the previous study of Bai [93] on the same design.
A recent cooler invented by Palmas and Myers [92] extends the success of eliminating the standpipe from regenerator embodiments by incorporating dual passage of regenerated catalysts within the cooler with two heat exchanger tubes made of many fins. Hot catalyst travels twice within the cooler before they are disengaged into the regenerator bed by lift air (see Figure 4b), thus promoting isothermal operation of the extremely exothermic regeneration process. This introduces a paradigm shift in the heat transfer efficiency with considerable improvement in waste heat minimization and overall regeneration process efficiency. Nonetheless, the geometric change in the catalyst cooler also affects the gas–solid flow and fluidization within the regenerator [108]. According to Li et al. [109], the design of the cooler inlet can affect the regenerator stability and heat transfer performance, while an inlet with a decelerator lowers the particle velocity, but a rectifier plate inlet was found to improve the catalyst distribution due to its ability to develop a groove. They also found a considerable influence of superficial gas velocity on the cooler performance; this implies that further thorough understanding of the relation between hydrodynamics and the intensified heat transfer is needed, which can unveil more opportunities to improve the catalyst cooler efficiency.

2.1.2. Two-Stage Full Burn Regenerator

In order to reduce the catalyst deactivation and thermal effect of single-burn systems, a multi-stage combustion mode has been designed [14,83,110,111,112]. In a two-stage regenerator system, coke combustion is compartmentalized into partial and full combustion zones: the partial combustion stage is a lean zone where at fairly low temperature (≤700 °C) all entrained hydrocarbons carried over from the stripper and about 60–80% of the adsorbed coke is combusted for efficient heat recovery and inhibition of hydrothermal deactivation of catalyst from hydrogen combustion. Hydrogen combustion is quicker than carbon and hence produces moisture, which is deleterious to zeolite catalyst but at the lean zone, all hydrogen components are combusted first with negligible steam formation [1]. The semi-regenerated catalyst is directed through an internal lift riser to the second stage characterized by surfeiting oxygen and a high temperature (usually above 800 °C) where it is fully regenerated, giving rise to low first- and second-stage regenerator temperatures [88]. This design results in a better regeneration process and a lower catalyst consumption in relation to catalyst loss and fresh catalyst addition rate. Typically, the regenerated catalyst contains less than 0.05 wt.% carbon, which is accomplished with an overall lower combustion heat [14,58]. Additionally, a two-stage design also offers flexible control in the manner of catalyst flow and air injection, but the cost implication is high and more complicated to operate.
The upper and lower zones can be designed reversibly for partial and full burn modes, making it suitable for resids. The UOP two-stage design, for example, has the first and second stage on top of each other. Coked catalysts flow into the first regenerator on top for partial coke combustion and flow to the second for full regeneration in contact with the oxygen gas. Partially regenerated catalysts in the lower primary zone are transported into the upper secondary zone together with the flue gas for complete coke removal at a higher temperature. Regenerated catalysts are then disengaged from the base of the second stage and catalyst coolers may be installed for heat recovery and steam production. Due to the excessive high temperature range, the internals are constructed with alloy instead of carbon steel to have a high mechanical forgiving factor [19]. In another two-stage regenerator design such as Axen design, partial regeneration under mild oxygen consumption and temperature (973–1023 K) takes place in the lower unit and lift air is utilized to pneumatically transfer the semi-regenerated catalyst into the upper zone, where CO in a dry atmosphere is completely burned, utilizing the lift air and the on-purpose injected air at elevated temperature (1173 K). Similar to the Axen design, Jin et al. [113] patented a two-stage riser regenerator; unique to this design is the separation of the first stage and second stage to different columns, which mirrors dual single-stage configuration with two-stage operating conditions. According to Bai et al. [73], a high coke burning rate and minimal hydrothermal deactivation was witnessed with this design, but from a process intensification point of view, limiting the space volume objective is compromised and maintaining three reactors is not economically incentivizing. An attempt to convert a single-stage regenerator to a two-stage regenerator with high efficiency (see Figure 3) was designed by Miller et al. [83]; besides the complex process operations involved, the configuration was also severely susceptible to high catalyst backmixing in the dense bed.
Recently, Davydov et al. [114] developed a multistage (five counter-current combustion stages) riser regenerator, embodied majorly with the combustion section, separation chamber, catalyst cooler and one or two risers. Downflowing spent catalyst from top combustion chamber contacts upflows combustion gas at different stages demarcated by a barrier (baffles or packings). Catalyst is completely regenerated as it travels through the integrated riser to the separation section where it is circulated back to the reactor. A high coke burn efficiency, increased volume reduction (i.e., decrease in regenerator size), and low afterburn were claimed. Although the design is simple from a mechanical viewpoint, it is much complex from a hydrodynamic standpoint. This could make it more difficult to regulate, and its maintenance eventually becomes exhausting.
There are no big disparities in the catalyst cooler adopted in a single- or two-stage complete combustion regenerator. Rowe [115] disclosed a series of cooling coils installed in a second zone situated at the base of a two-stage regenerator; water circulating in the heat exchangers absorbed the surplus heat from gravity-descending catalysts, while the cooled regenerated catalysts were transferred to the base of the reactor. Long et al. [116] invented an external catalyst cooler, but here, the top of the regenerator is the second regeneration from which hot regenerated catalysts are directed into the cooler passed from the second regeneration zone. Long and multiple transfer lines are the major drawback to this design. To improve the heat transfer in a flow-through external cooler made of multiple tubes, Carter et al. [103] installed two layers of baffle, one in the dense bed and the other in the dilute phase; the top baffle restrains catalyst entrainment in the freeboard and also increases radial catalyst distribution for optimum heat transfer efficiency.
In general, Table 3 summarizes the core differences between the two combustion designs in relation to performance and operating conditions from past studies; the key deductions are that two-stage regenerators produce cleaner regenerated catalyst (about 0.05 wt.% CRC) with ripple advantages of higher cracking reaction and product yield in the riser reactor, as well as higher efficiency for NO reduction. However, temperature constraints, especially high dense bed temperature owing to more coke burning and a rise in post CO combustion, is still not completely eliminated.
With a correct oxygen consumption as shown in Figure 5, complete coke combustion can be achieved without a ponderance emission of flue O2 and based on industrial data, which can result in low CRC in the range of 0.05 and 0.1 wt.% [14]. The figure shows that when air/coke weight ratio is below 13, there is no O2 in the flue gas, but if the ratio is increased to 13 and beyond, 2% of the O2 will be in the flue gas. So, refiners should operate with an air/coke ratio between 10 and 12% to actualize the correct O2 consumption.

2.2. Structural Regenerator Design and Synergistic Integration to Reactor

Maximizing positive interactions between the operations in the regenerator and reactor is necessary for achieving high process efficiency and safety. Efforts toward achieving this are evident in the reactor–regenerator proximity configuration and new advances in geometry technology of industrial regenerators.

2.2.1. Design Configuration with FCC Reactors

FCC regenerators are also commercially configured with the reactor either side by side or staked. The former is more selective towards gasoline yield but suffers more from nonuniform distribution of spent catalyst [19,121]; examples include ExxonMobil Model IV, Exxon Flexicracker, the Shaw and Axen design, and the UOP high-efficiency regenerator. The design of the FCC regenerator varies with technology licensors (The Shaw Group Inc. (Houston, TX, USA), ExxonMobil, Shell, Total, ABB/Lummus, Universal Oil Products (UOP), and Kellogg Brown and Root (KBR) but divided between the two regeneration configuration systems. They all considerably appreciate similar design philosophies and combustion principles, albeit with minor operating conditions and mechanical configuration differences. The features of common commercial designs as shown in Figure 6 are summarized in Table 4.
The conventional designs were developed between the 1940s and 1980s, but in the last two decades, several emerging technologies in regenerator configuration with distinct features have also surfaced. In particular, the riser regeneration system is becoming more prominent. Bai et al. [73] developed a riser regenerator operating in a distinctive circulating fast fluidization regime (see Table 2); through a one-dimensional model, they investigated the hydrodynamics and regeneration performance of this design and indicated that the conditions at the riser inlet (hydrogen and carbon content, temperature) are functions of those at the outlet of the riser. The Runge–Kutta method was utilized to solve the plug flow differential equations at the riser regenerator section, and it was concluded that the susceptibility potential to quench reaction is high if the system is operated at low temperature (below 450 °C) and a thermal catalyst deactivation cannot be avoided at high temperature (above 800 °C) [122]. Furthermore, Liu et al. [123] proposed a post-riser regeneration technology (PRRT) where a riser regenerator was attached to a conventional single fullburn regenerator. All the hydrogen species and at least 80 wt.% of coke were combusted at a low temperature (below 700 °C) in the turbulent bed regenerator while the complete combustion was staged in the post-riser regenerator at an elevated temperature (above 800 °C); a proprietary separator was utilized to separate the regenerated catalyst from the flue gas before being discharged back into the turbulence bed for final circulation into the reactor. Carbon content less than 0.1 wt.% on the regenerated catalyst was claimed, but the heat removal efficiency was not quantified. In essence, potential merits of riser regenerators encompass high burning efficiency and a lower catalyst inventory. Riser regenerators also offer the highest coke combustion intensity relative to other regenerators (−100, 100–300, 200–500, >1000 kg/t h for one-stage, two-stage, high-efficiency tank and riser regenerator, respectively) [122]. However, these technologies still lack sufficient information for scale-up in industrial applications.

2.2.2. New Advances in Automation Technology Adapted to Regenerators

New technologies to a reasonable degree generate the potential for new solutions. A current trend which is more likely to accelerate and expand is automation of the regeneration process, which was previously impossible as a result of synchronous parameters and constraints to be monitored and controlled. Several processes in the regenerator are manually or semi-manually regulated, for example, in full burn mode of catalyst regeneration, the desired excess O2 in the flue gas is often regulated from the total air injected; differential temperature is also frequently witnessed in the regenerator bed and is manually regulated through feed quality manipulation and preheating temperature while in partial combustion mode; the fluctuation in bed temperature and the carbon content on regenerated catalyst are controlled by adjusting air rate to the regenerator or by aiming at a specific CO concentration in the flue gas. More so, the catalyst inventory within the regenerator is controlled by intermittent removal of excess catalyst to a desirable level; the desired catalyst level is maintained through the slide or plug valve for regenerators that have one. Often, slide valves fail due to negative differential pressure across it, leading to back-flow of air to the riser reactor from the regenerator or the flow of hydrocarbon into the regenerator. The advent of the pressure differential controller (PDIC) has helped to auto-monitor and regulate catalyst raw levels and the flow densities by overriding process controllers and turning off the valve in the advent of a potential flow reversal. In recent decades, the control of multiple constraints across several loops has been boosted by the installation of advance process control (APC) in the refinery distributed control systems (DCS). The core benefits of APC include (i) providing more specific control of multiple operating variables against the regenerator’s constraints; (ii) activating emergency intervention to ambient disorders such as rainstorms; and (iii) controlling multiple constraints at the same time, such as simultaneous optimization of air blower performance and that of wet gas compressor (WGC). DCS monitors can also simultaneously reveal multiple process variables in the following regenerator components:
  • Cyclone separator: velocities, pressure drop;
  • Regenerator bed: catalyst level and inventory, superficial gas velocity;
  • Slide valve: differential pressure;
  • Rate of change of alarms, etc.
In addition, the accuracy of the transmitters (such as optical probe, capacitance probe and EVT) used for the measuring process variables (e.g., pressure and velocity of gas and particles) can be validated by the installation of instrument diagnostics. This process control instrumentation has significantly improved the process safety and can be used to overcome many bottlenecks in catalyst regeneration if intensified. With more breakthroughs in cutting-edge software design tools, the integration of machine learning and artificial intelligence will extend the boundaries of catalyst regeneration in the near-term. This, however, will require harmonization of standards for different regenerator equipment and techniques.
Summarily, the improvement in the FCC designs has translated into higher regeneration efficiency by an order of magnitude. The carbon content of regenerated catalyst has cascaded by more than 100%, representing about 0.1 wt.% compared to the previous 0.3–0.5 wt.% [1]. Stacked configured regenerators are now obsolete and extinct; the modern regenerators are in a side-by-side configuration, as can be seen in Figure 6. The modern regenerator temperature is becoming higher partly due to the shorter residence time it attracts and mainly due to the fact that resid feed processing is becoming conventional. Newer resid regenerators (Figure 6i–m) have been developed which are either single- or multi-stage full burn systems which operate by countercurrent contact of coked catalyst and combustion gas. Nowadays, single-stage partial combustion regenerators are also rare due to their higher coke on regenerated catalyst tendency. Single-stage full-burn regenerators have high coke burn efficiency but are susceptive to catalyst thermal deactivation and afterburn phenomenon.
However, this challenge can be minimized by proper design of the spent catalyst distributor [124], catalyst coolers and the air grid [92,100]; the advent of two- or multi-stage regenerators offer more reliable strategy but at the expense of high capital cost and operation complexity. Due to the elimination of water vapor in the second or latter stage of the regenerator, catalyst deactivation at high temperatures can be overcome [110,112,125].
Newer modifications have been reported in the hardware components. External coolers have mostly replaced internal cooling coils and dilute phase catalyst coolers for keeping the unit in heat balance [92], and larger or multiple air blowers have been introduced to address coke burning issue [19]. Additionally, new designs of the spent catalyst distributor [49,50,88] and air grid [126] have also surfaced. The inlet hopper of the standpipe has been seen replaced with a new disk inlet, which has proved more efficient in creating the optimum catalyst circulation rate and stability commercially [127]. Model IV regenerators have eliminated the slide valve to increase flexible control of the catalyst circulate rate [128], and the alloy internal hardware of most regenerators have been substituted by higher metallurgical materials (carbon steel and chrome-moly) [1]. More significantly is the recent development of riser regenerators [47,113,114], which reportedly have high potential for increased space volume reduction, shorter residence time, lower operation cost, and significant decrease in emission levels without comprising the large catalyst inventory. However, less is known in relation to its hydrodynamic performance and industrial application success.
Much progress has also been made in the area of process control [17,75], especially in the area of understanding pressure drop quantification and adjustment, as displayed in many of the design components in Figure 6. This results in increased operational flexibility and control of the regeneration process.
Figure 6. Different commercial FCCU designs. Adopted from Sadeghbeigi [16], Hsu and Robinson [39], and Chen [129].
Energies 15 02061 g006
Table 4. Reactor–regenerator commercial designs with typical features [9,39,67,130,131].
TypeDeveloper/Licensor Catalyst Charging Pattern/Additional FeaturesStrengthWeaknessStatus
Mode I
Upflow unit
SOD (ExxonMobil) in 1942-Upflow or fast-circulating fluidized bed
-Dilute-phase catalyst cooler
-External cyclones installed
-Quick separation of
from catalyst
-Flue gas precipitation
-high catalyst losses (due to inadequate contact time and low dense bed),
-high reactor height promoting thermal cracking in the reactor dilute phase
-high catalyst loading
-natural clay catalyst
-operational and mechanical problems
-No heat balance
Extinct
Model IIExxon in 1943Downflow -Premix of catalyst and feed before entering the reactor via slide valve
-Operates at low velocities
-Low catalyst loss
-High pressure drops resulting in rapid erosion problems from long regenerated standpipe Few still in existence but with modified riser and air distributor configurations
Model IIIM.W. Kellogg (Shell)
1951
Downflow
Side by side
-low elevation regenerator
-Shorter regenerated catalyst standpipe length
-high riser with internal stripper
-Low catalyst attrition due to the use of microspherical (MS) catalyst
-elimination of Cottrell precipitation
-elimination of waste-heat boilers
-Rapid Erosion of slide valve and in the perforated grid catalyst distributorOperational
Model IV
Side by side unit
SOD
ExxonMobil 1945–1952
-Upflow
-No slide valves
-Same height reactor and regenerator
-Suitable for Modular scale and large units
-Decrease in reactor height
-Efficient catalyst transfer rate
-Low maintenance menace
-Stable fluidization
-Better operational flexibility
-Low erosion occurrence
-Elevated pressure and internal velocities
-Catalyst circulation rate regulated by differential pressure between riser and regenerator
-Non-flexible U-bend operation
-Potential for catalyst defluidization at the U-bend due to lateral flow pattern
-Non-flexible temperature control in the reactor except by adjusting reactor temperature
-Unit demands intense supervision
Operational
Model IV flexicrackerExxon
1972, 1993
-Upflow
-No slide valve
-Side by side
-Catalyst U-bend standpipe substituted with standpipe linked with an upwardly sloped lateral
-Low elevation regenerator
-short contact time
-Catalyst circulation rate regulated by differential pressure between riser and regenerator
-High CAPEX
-Complex process control
Operational
High-efficiency two-stage regeneratorUOP
1978
-Side by side regenerationFast fluidization regime
Small diameter lift
-Uniform coke burn,
-Higher conversion of CO to CO2 and lower NOx emissions
Operational
R2R or RFCCTotal
1980s
-2-stage regeneration
-Air riser moves semi-regenerated catalyst to full combustion zone
Dense-phase coolers
-100% resid feed (atmospheric bottom)
-High coke combustion rate
-Operates at high temperature
-Lower catalyst inventory
-Sharp disengagement of product vapors from the catalyst
-Cost effective and flexible
-high propylene yield
-high heat recovery
-Numerous turnaround flexibility
-Potential localization of afterburn in the first stageOperational
Millisecond-catalytic cracking (MSCC)UOP/Coastal
1994
-Downflow
-Side by side regeneration
-Two reaction zones (dual diameter reactor)
- Quick catalyst-vapor separation
-low-volume cracking reaction zone
High temperature demandOperational
Superflex Kellogg2005-Countercurrent flow
-Side by side regeneration
-Proprietary catalyst
High gasoline cracking to olefinHigh residence time and temperatureOperational
PetroFCC UOP
2007
Downflow
Side by side
-Dual diameter reactor
-Low pressure
-High reaction temperature
- High dry gas yield and low gasoline and diesel
Operational
Catalytic pyrolysis process (CPP)RIPP/Sinopec 2010Downflow
Side by side
-Short residence timeDemands higher regeneration temperature to provide the heat of reaction
-Non-flexible reaction
Operational
ACO Advanced catalytic olefins KBR and SK Innovation Global Technology 2011Orthoflow and stacked Reactor/Regenerator-Lower space volume
-Lower cracking temperature
-Lower coke production
-Non-flexible reactionOperational
HS-FCCNippon/Aramco 2011-Downflow
-Modification in reactor/regenerator and stripping units
-Minimized backmixing
-High selectivity to propylene yield
-High CAPEXOperational
Post-riser Regeneration Technology (PRRT)2007-Downflow
-Two risers
-Side by side
Large capacity
-Ease in starting combustion
-High coke combustion efficiency
-low
No commercial application

3. Measures to Improve Regeneration Performances

In spite of the laudable advances in FCC regenerator technology, the system is still far from reaching regeneration efficiency apogee. As previously mentioned, the potential to further reduce the carbon content of regenerated catalyst to less than 0.05% still remains. In addition, Kalota and Rahmim [54] X-rayed multiple operational and mechanical conundrums with partial or full regeneration systems that placed a dent on the device performance. Recent studies and proceedings from industrial meetings also indicate that issues raised by Kalota and Rahmim [54] still linger [12,19,132,133]. Strategies to enhance the regeneration efficiency are linked to the unique constraints of the different components of the regenerator.

3.1. Main Air Distributor

The main air/steam distributor (also termed gas distributor or a grid) is located in a lower portion of the regenerator chiefly for inducing and maintaining uniform fluidization with maximum coverage of the catalyst bed cross-sectional area. It discharges air or other oxygen-rich gas into the bed to contact the spent catalyst, thus inducing even mixing and coke combustion. The efficiency of regeneration is basically dependent on the optimization of air/steam distributor, which is contingent on its design and operating conditions [134,135]. It is worth stating that previously, the design of the air grid was more of an art than a science, but increasing understanding of its actual roles in the last few decades has now compelled scientific considerations in its designs [126,136,137].
Studies have shown that the gas distribution design directly affects the fluidization quality in relation to bed pressure drop, bubble formation, coalescing and bursting, which in turn influence the regeneration efficiency [71,138]. Without good feed gas distribution (i.e., air flow maldistribution), several issues erupt in the regenerator, including afterburn [58], increase in attrition of the bed material, buildup of stagnant solids (dead zones) [2,135], and insufficient or excess pressure drop issues [19]. Importantly, a relatively high-pressure drop is required to uniformly spread out air across the grid, but as it lowers, the tendency for the catalyst bed to weep into the plenum underneath the grid increases. Weepage is the bane of catalyst maldistribution, and without quick intervention, the grid would be destroyed [135,139].
Although it is established that the effectiveness of the gas distributor to address the aforementioned problems emanating from the maldistribution of gas significantly depends on its design [19,110,140,141], and the choice of best design is still being debated. For instance, Cooper [140] asserted that both pipe and ring gas distributors are better than plate gas distributors as they can operate with lower pressure drops effectively and their nozzles concurrently promote both radial and axial mixing of gas–catalyst with considerable operational flexibility improvement. They argued that the air ring is the most effective, since the cantilever arms of pipe grid due to their geometry suffer from arms cyclic oscillations and fatigue resulting in low mechanical life and more downtime, while the ring grid, on the other hand, could sit concentrically, providing maximum coverage of the entire cross-section of the catalyst bed, providing excellent gas distribution in the annulus of the regenerator. They further argued that the jet penetration from the ring nozzles enhances uniform mixing and combustion with high resistance to erosion of internals and catalyst attrition.
However, from the counter perspective, Cocco et al. [62] categorized the gas distributor configurations into grid plate and sparger designs, and they argued that the former, especially the bubble-cap grid plates, are most favored for alleviating catalyst weepage and entrainment due to the sealing effect offered by the bubble cap, which prevents particle backflow. Sadeghbeigi [19] classified the foremost designs into four common licensor designs, namely flat pipe grid, plate grid, dome, and ring design (see Figure 7), and from their industry evidence concluded that though ring and flat pipe designs are dominant among refineries, the latter provides the best resistance to weeping of the catalyst into the plenum and catalyst attrition. The strength of the flat plate lies in its ability to operate at a lower discharge velocity and an excellent even coverage of the whole cross-section area of the catalyst bed at various feed gas flowrates, while on the contrary, jet penetration from the ring grid often fails to achieve maximum coverage at lower velocity. Surprisingly, Wells [142] found that the design of the gas distributor was absolutely irrelevant to the gas bypassing effect; this ambiguity has not been substantiated by any other reports. From a practical outlook, it appears that Cooper [140] ignored the possible fluctuations of air rates and operating at constant high pressure being difficult from an operational perspective. Cocco et al.’s [62] assertion is less than convincing from a reliability standpoint; not only are bubble caps difficult to clean but bubble-cap distributors are also more susceptible to immediate bubble merger and buildup of stagnant catalysts, resulting in defluidized regions. This is due to a smaller pressure drop induced by reduced flow resistance as gas first flows orifice-to-cap and then to the column. The ring distributor, on the other hand, can reduce the bubble size, create more bubbles, and facilitates lateral and axial gas distribution but has a less forgiving mechanical consistency. For a good gas-distribution system, the grid design must therefore meet the criteria of efficient jet penetration and pressure drop, which depends on the number and diameter of holes; location, size and height of nozzle; opening area; regenerator diameter; bed material; and superficial gas velocity [58,143]. Unfortunately, these parameters also have some nuanced relationships, which have attracted extensive and growing studies with few consistent conclusions. As a matter of fact, gas flow deviation is one of the most researched aspects not only of FCC regenerators but also in most fluidized bed systems. An attempt will be made to evaluate gas distributor intensification strategies from a few studies among the chunks of available literature.

3.1.1. Effect of Temperature and Pressure

Sánchez-Prieto et al. [144] investigated the influence of the system temperature condition at a constant gas velocity on a multi-orifice perforated plate (squarely arranged 140 orifices, 2 mm width and 10 mm pitch) and tuyeres-type (triangularly arranged 19 tuyeres, 20 mm pitch screwed in a perforated plate) gas distributors in a bubbling fluidized bed. They found that the gas distributors’ pressure-drop declined with increasing operating temperature, which was attributed to the decrease in gas density. Dhotre and Joshi [145] also found that a decrease in the distributor pressure drop resulted in a decrease in the uniformity of gas. On the contrary, Kwangbyol et al. [146] obtained a linear relationship between the distributor pressure and superficial gas velocity; it was also found that as the orifice size and pitch increased, the distributor pressure drop also increased. Likewise, Hassan et al. [147] also compared different distributor types, and they found that an increase in gas velocity resulted in an increase in particle circulation flux, but under the same fluidization velocity, strong fluctuations in particle temperature were observed for a perforated distributor compared to plate distributor and tubular distributor, which is consistent with the findings of Zhao et al. [148], where a tubular-type distributor was found to be more suitable for reactive processes. A reason for this can be culled from the findings of Rahimpour et al. [149], where the standard deviation of pressure fluctuations rose in ascending order for the bubble cap, perforated plate, and porous type-distributor, as shown in Figure 8. Sathiyamoorthy and Horio [150] developed an equation for determining the operating superficial gas velocity at which all orifices of a multi-orifice distributor will become active (UM) as Equation (5):
U M U m f = 1 + 2 P d P b 1 / 2
where U m f is the minimum fluidization velocity, P b and P d are pressure drop across the bed and the distributor, respectively.
Additionally, Knowlton and Hirsan [151] also found that increasing the system pressure resulted in an increase in jet penetration length for multi-nozzles, which is more severe in single orifice [152], thus making them unfit for shallow bed operation. Increased jet penetration was found to be a leading cause of turbulent gas–solid flow and solids carryover [153], which is related to induced high-pressure contingent on the diameter and number of the orifice [138]. One key deduction is that to forestall gas maldistribution due to temperature and pressure factors, the design of gas distributor plates must match the intended operating temperature range and the pressure drop across the distributor, which is a determining factor of gas-flow behaviour above the grid and must be duly quantified.

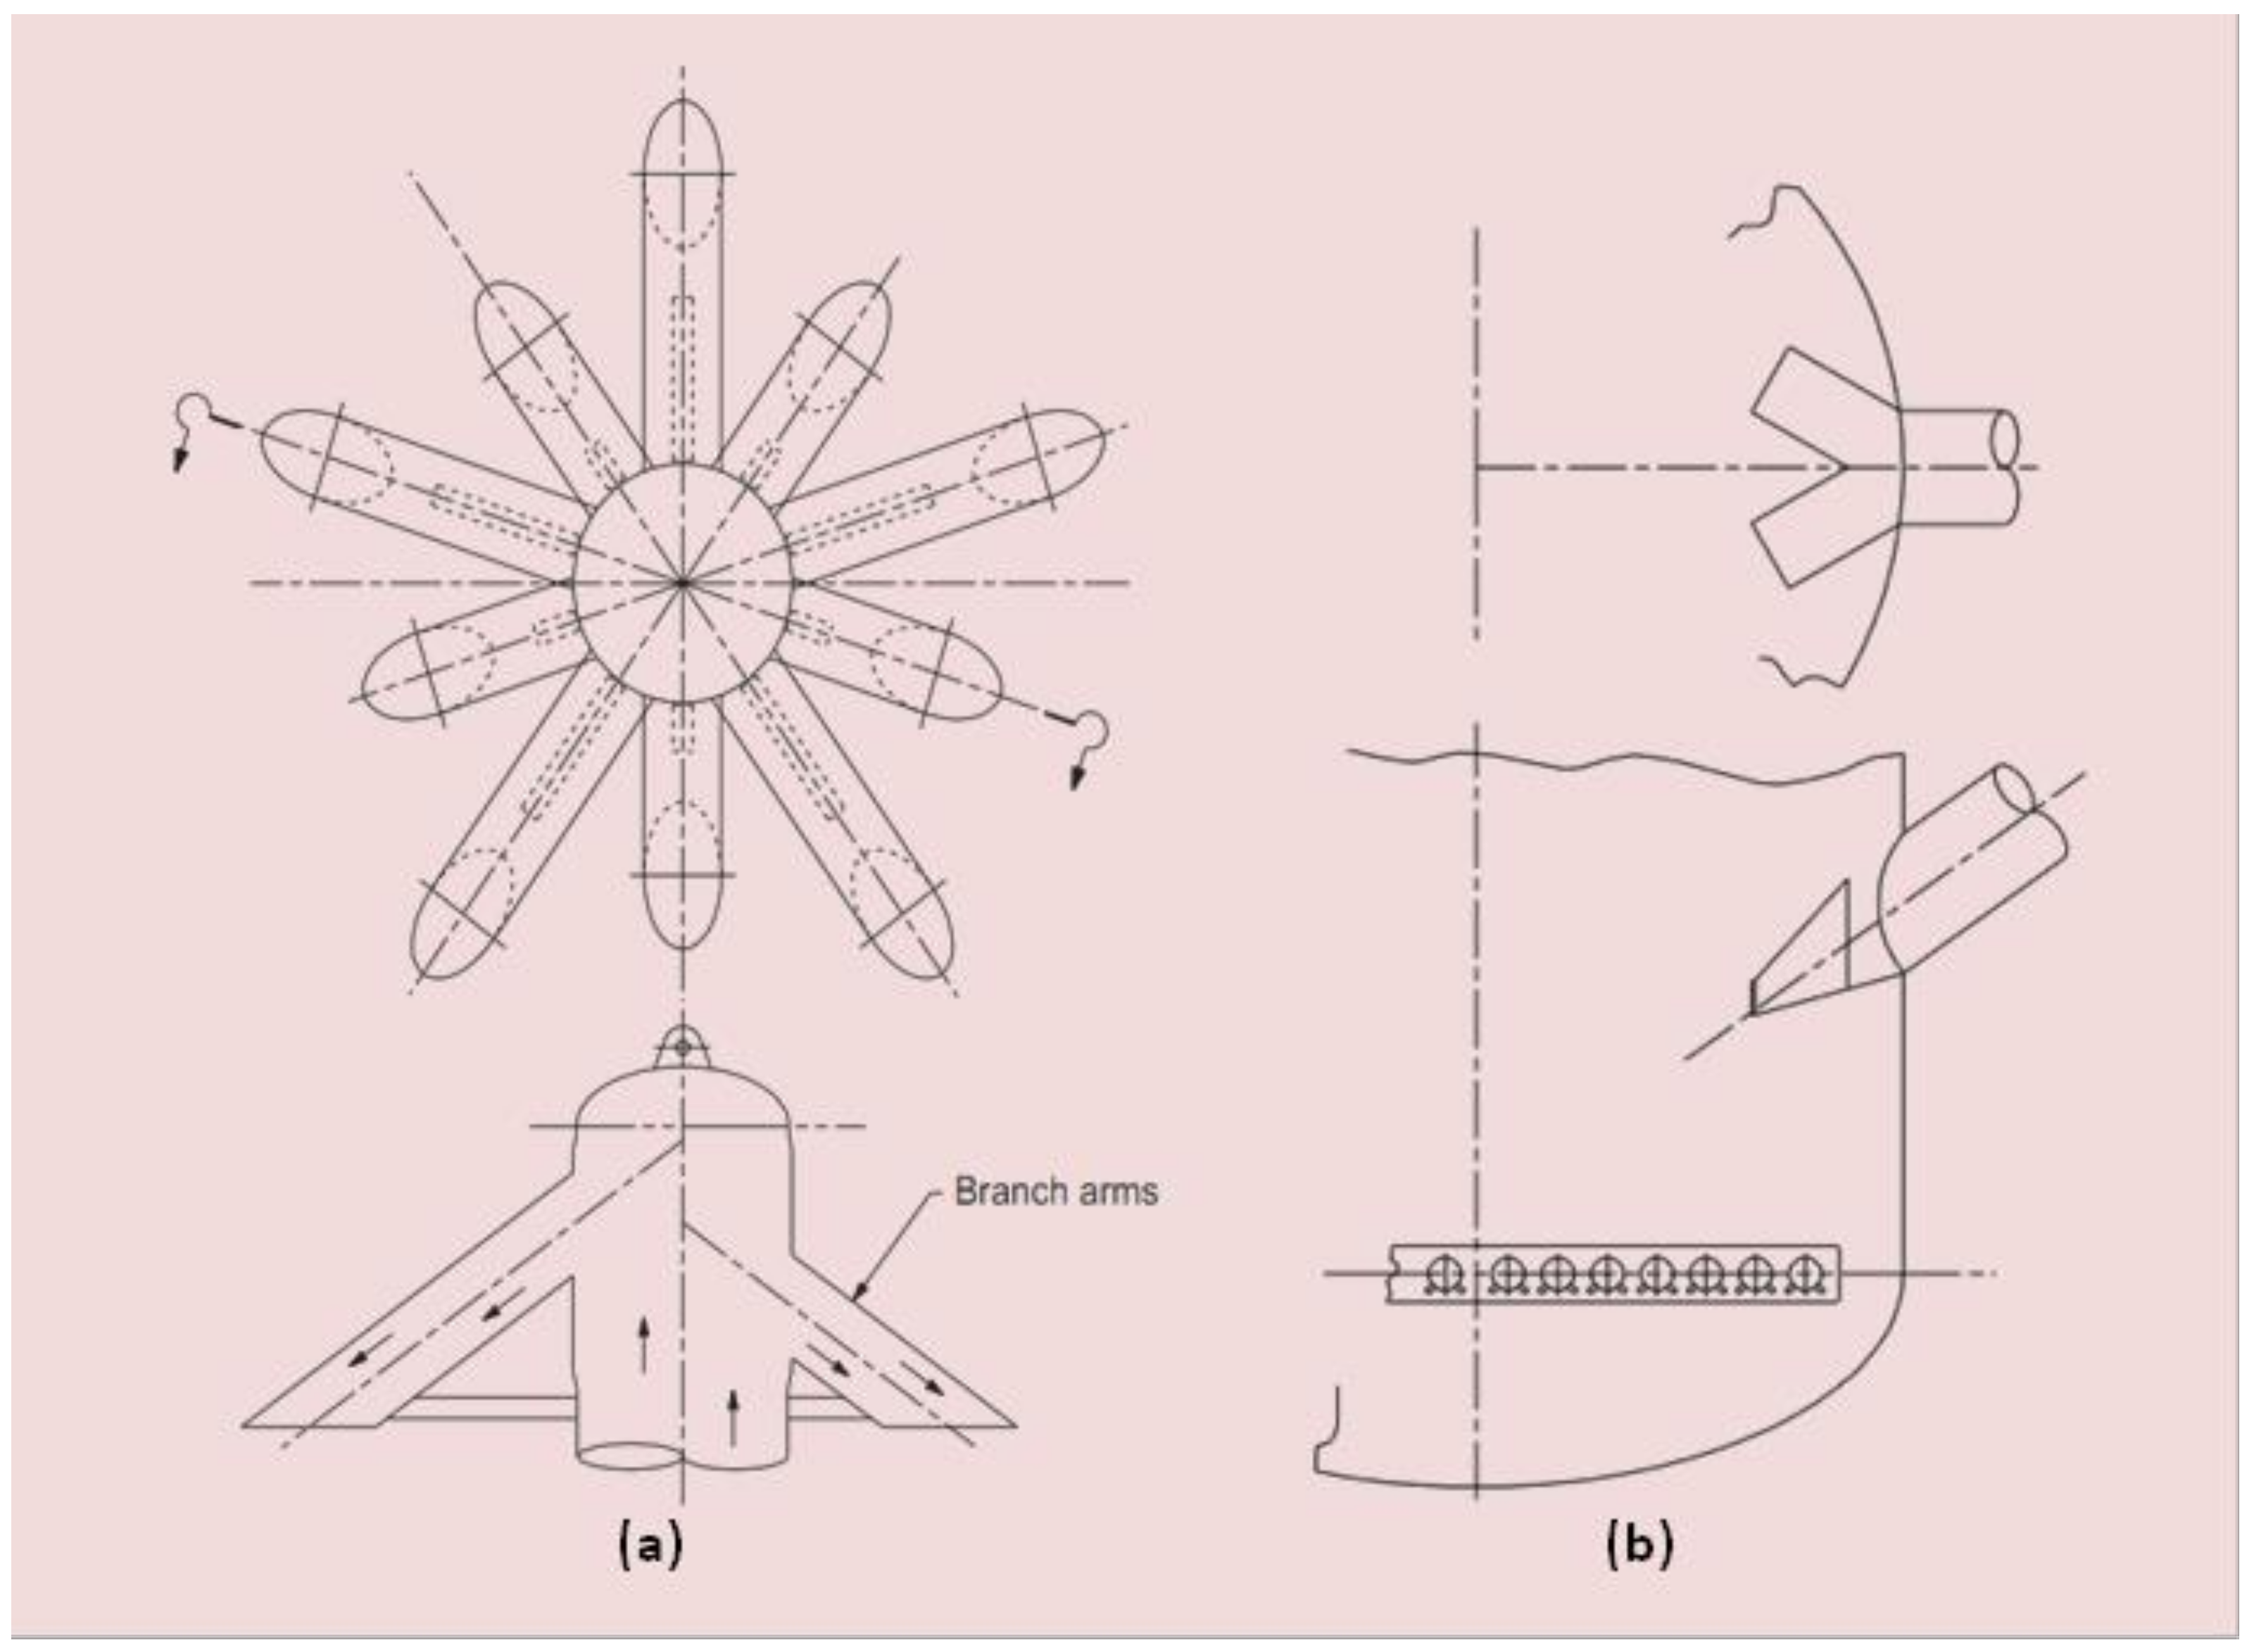
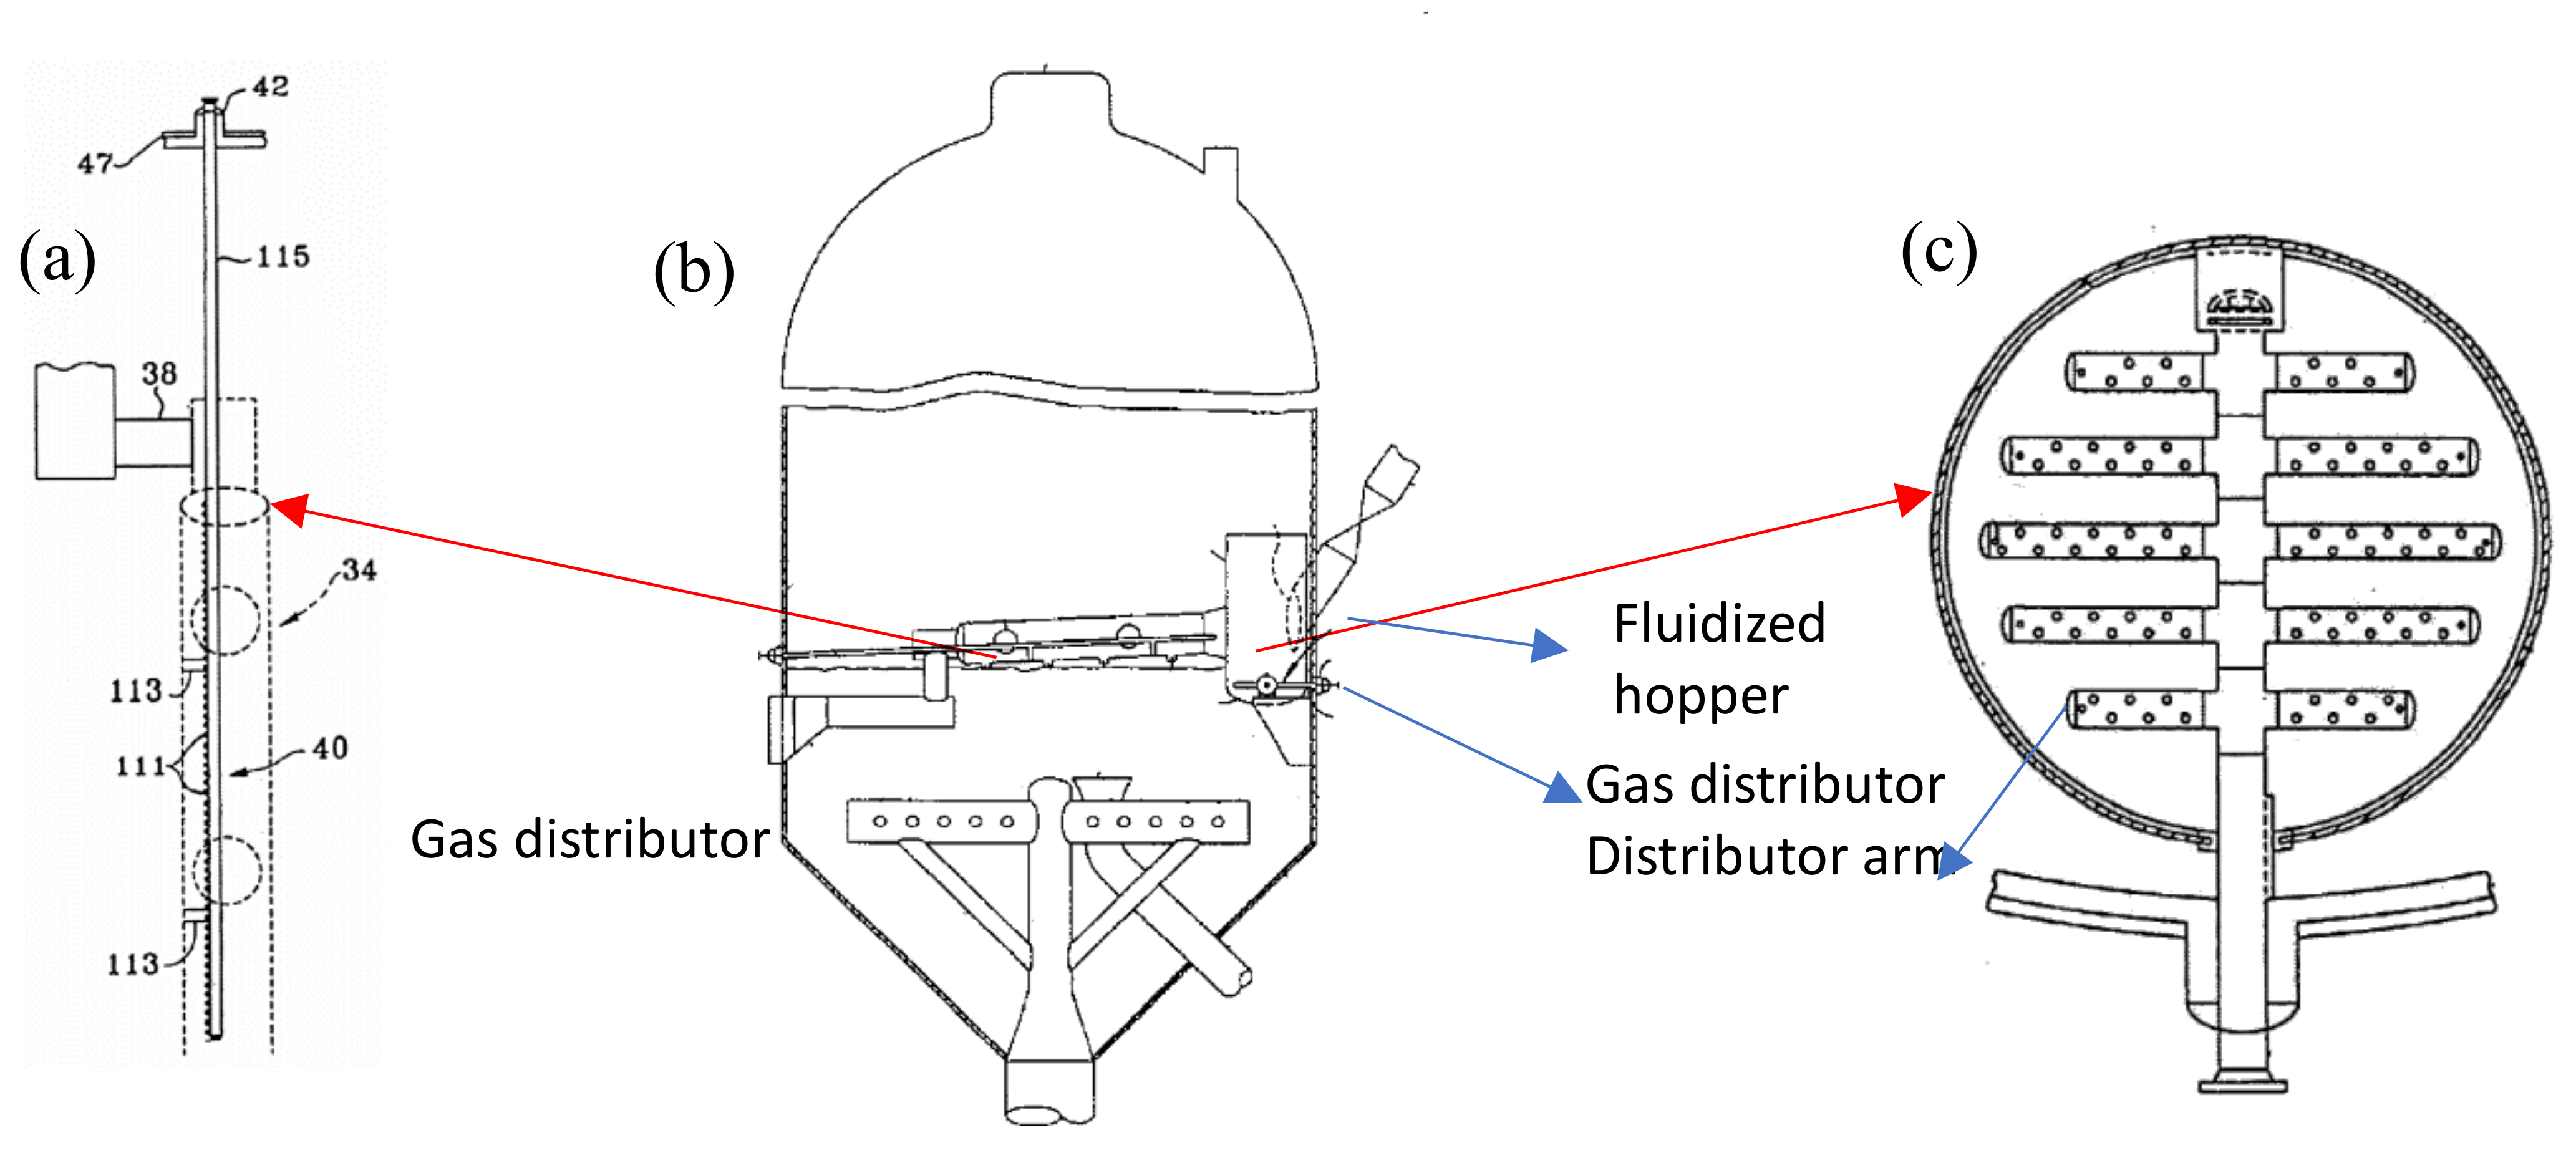
3.1.2. Effect of Distributor Configuration

Besides the operating temperature and pressure, several studies have shown that the distributor design is a dominant factor for fluid dispersion [135,154,155,156,157]. The influence of the number of orifices, diameter of holes, opening areas, nozzles or tuyeres spacings have been studied both experimentally and by simulation for different distributor types. Sobrino et al. [153] experimentally investigated the effect of perforated and bubble-cap distributors in a bubbling fluidized bed; their results showed that early onset of turbulent flow regime and high particle entrainment were triggered by the perforated plate distributor, which could be linked with the large momentum of jetting, higher-pressure values and voidage at the vertical position closet to the perforated plate (Figure 9). Further, as reported by [158], the minimum fluidization velocity decreased with an increase in hole pitch of a perforated distributor, and the resulting increase in gas velocity induced a strong circulation of solids and condition of fluidization within the hole vicinity. However, Sathiyamoorthy and Horio [150] obtained a decrease in jet length when the minimum fluidization velocity decreased under the same nozzle size.

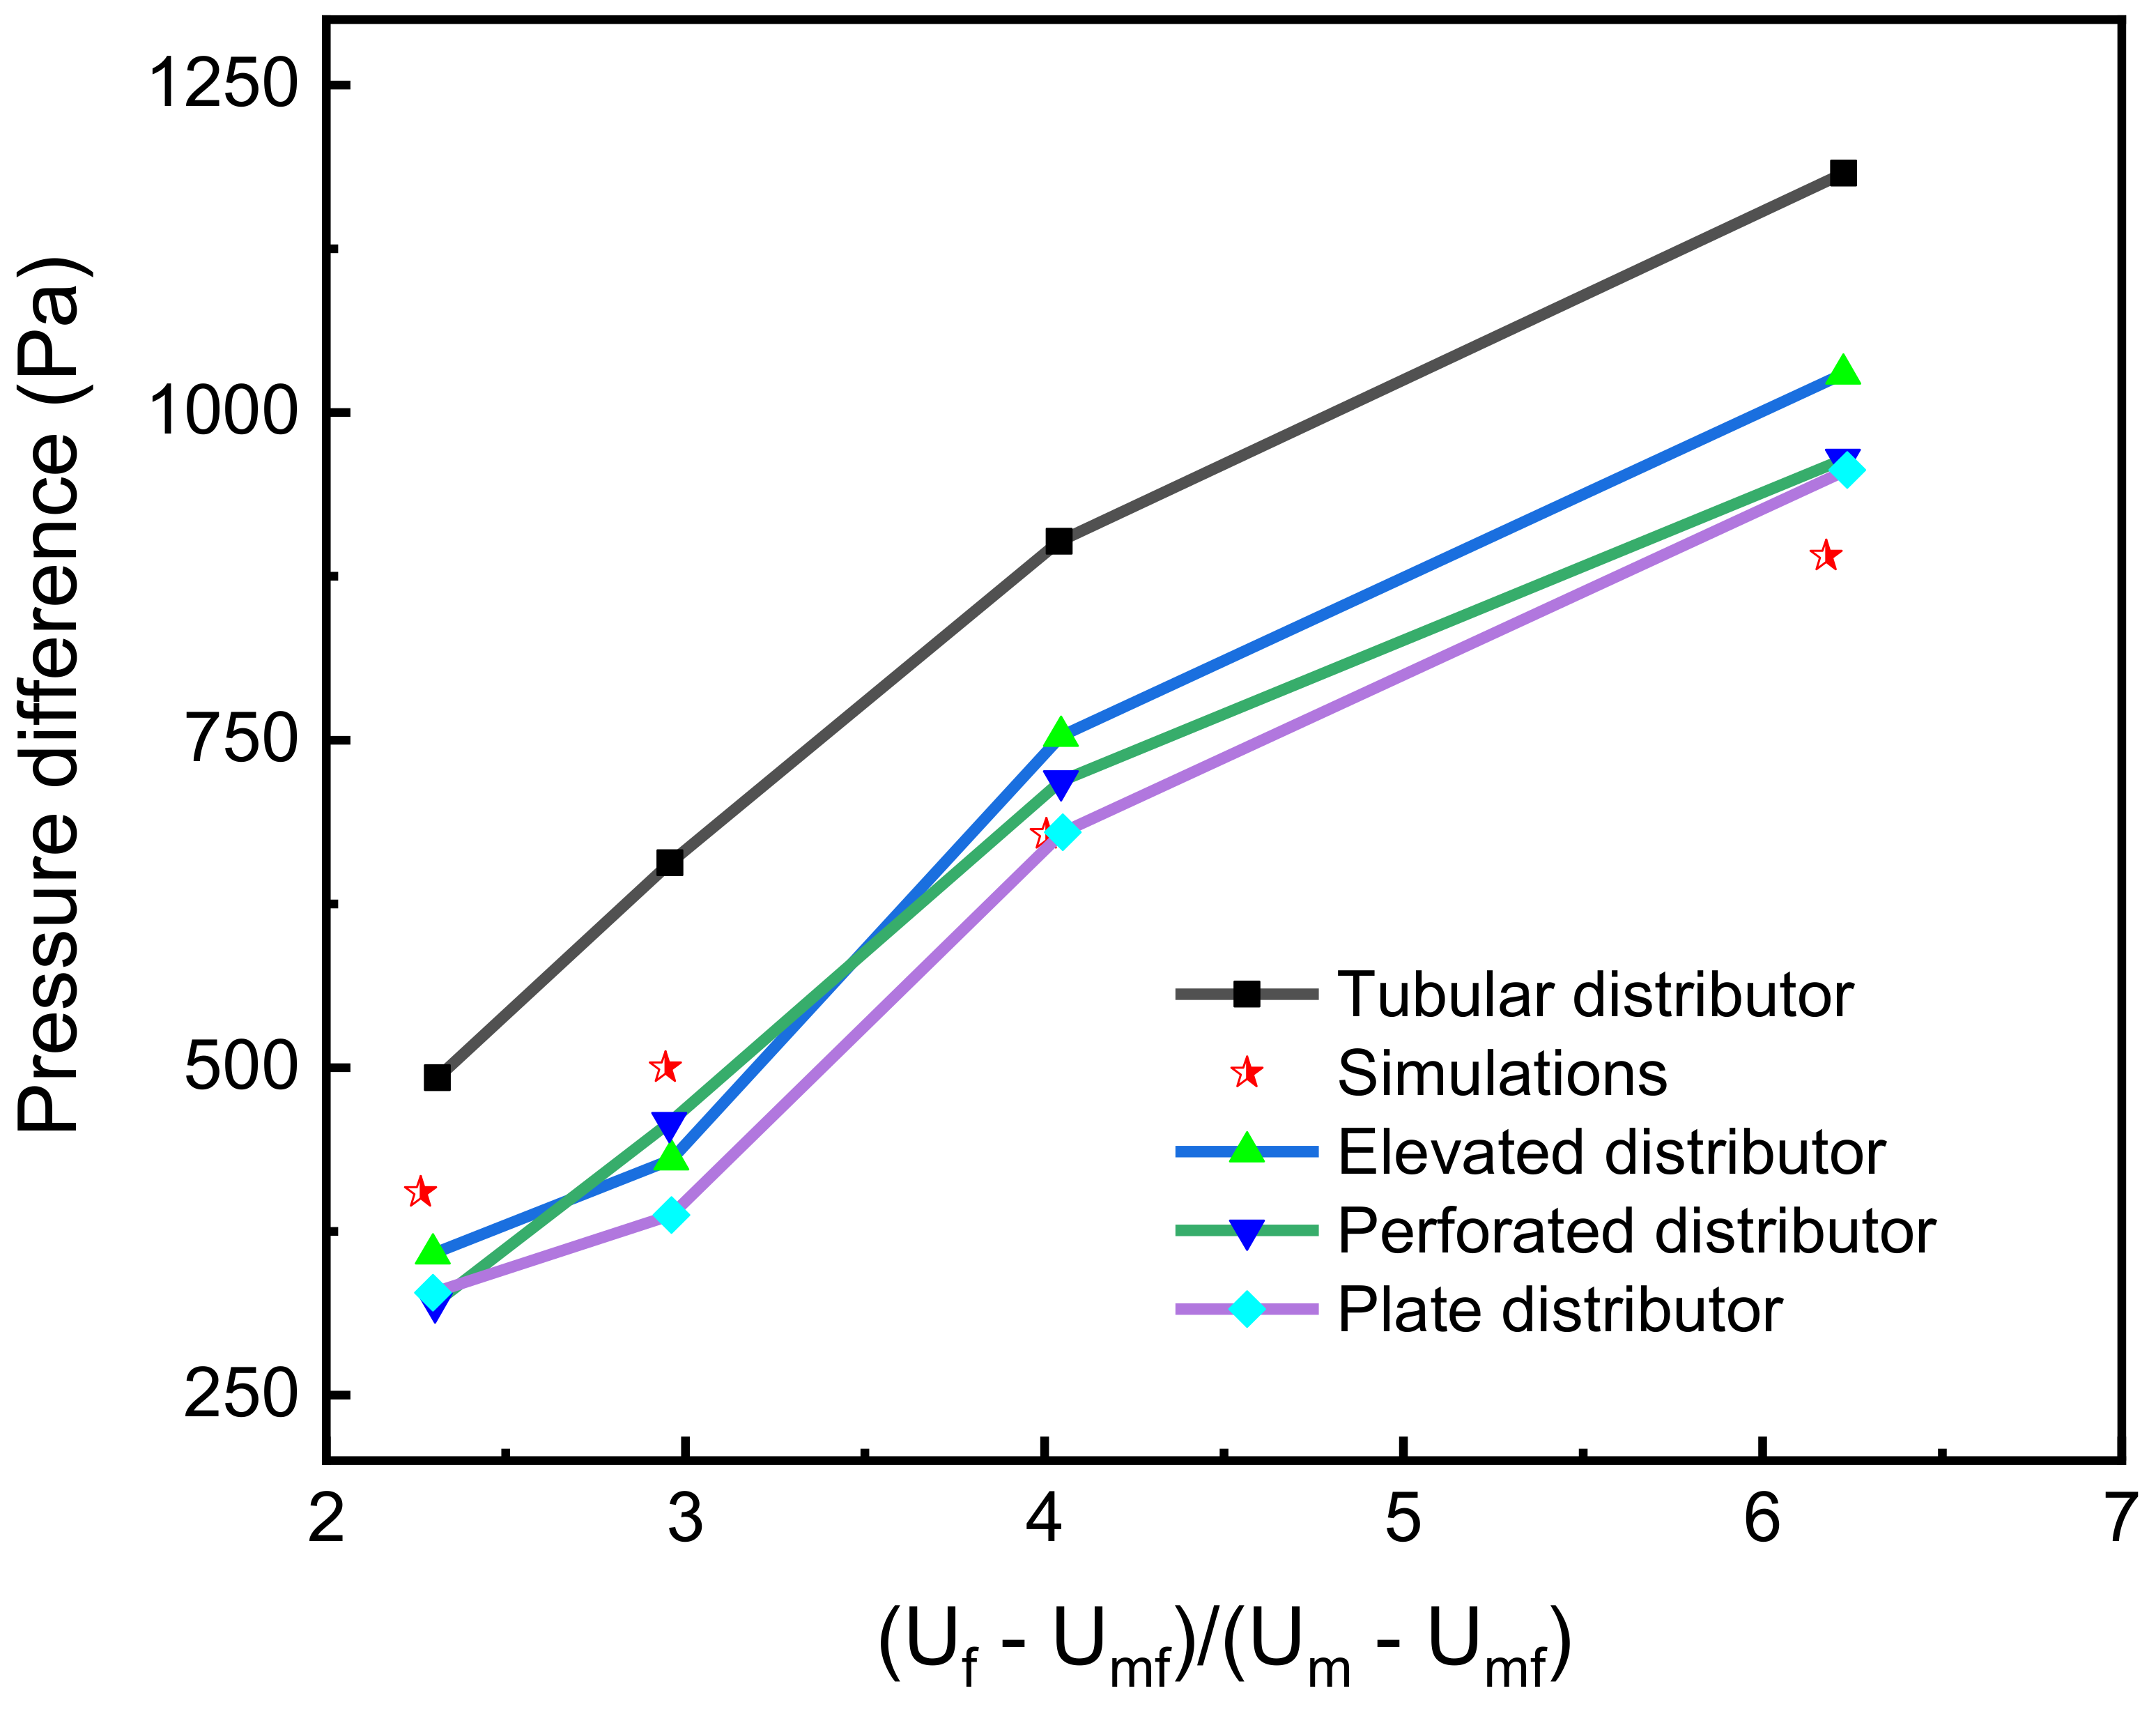
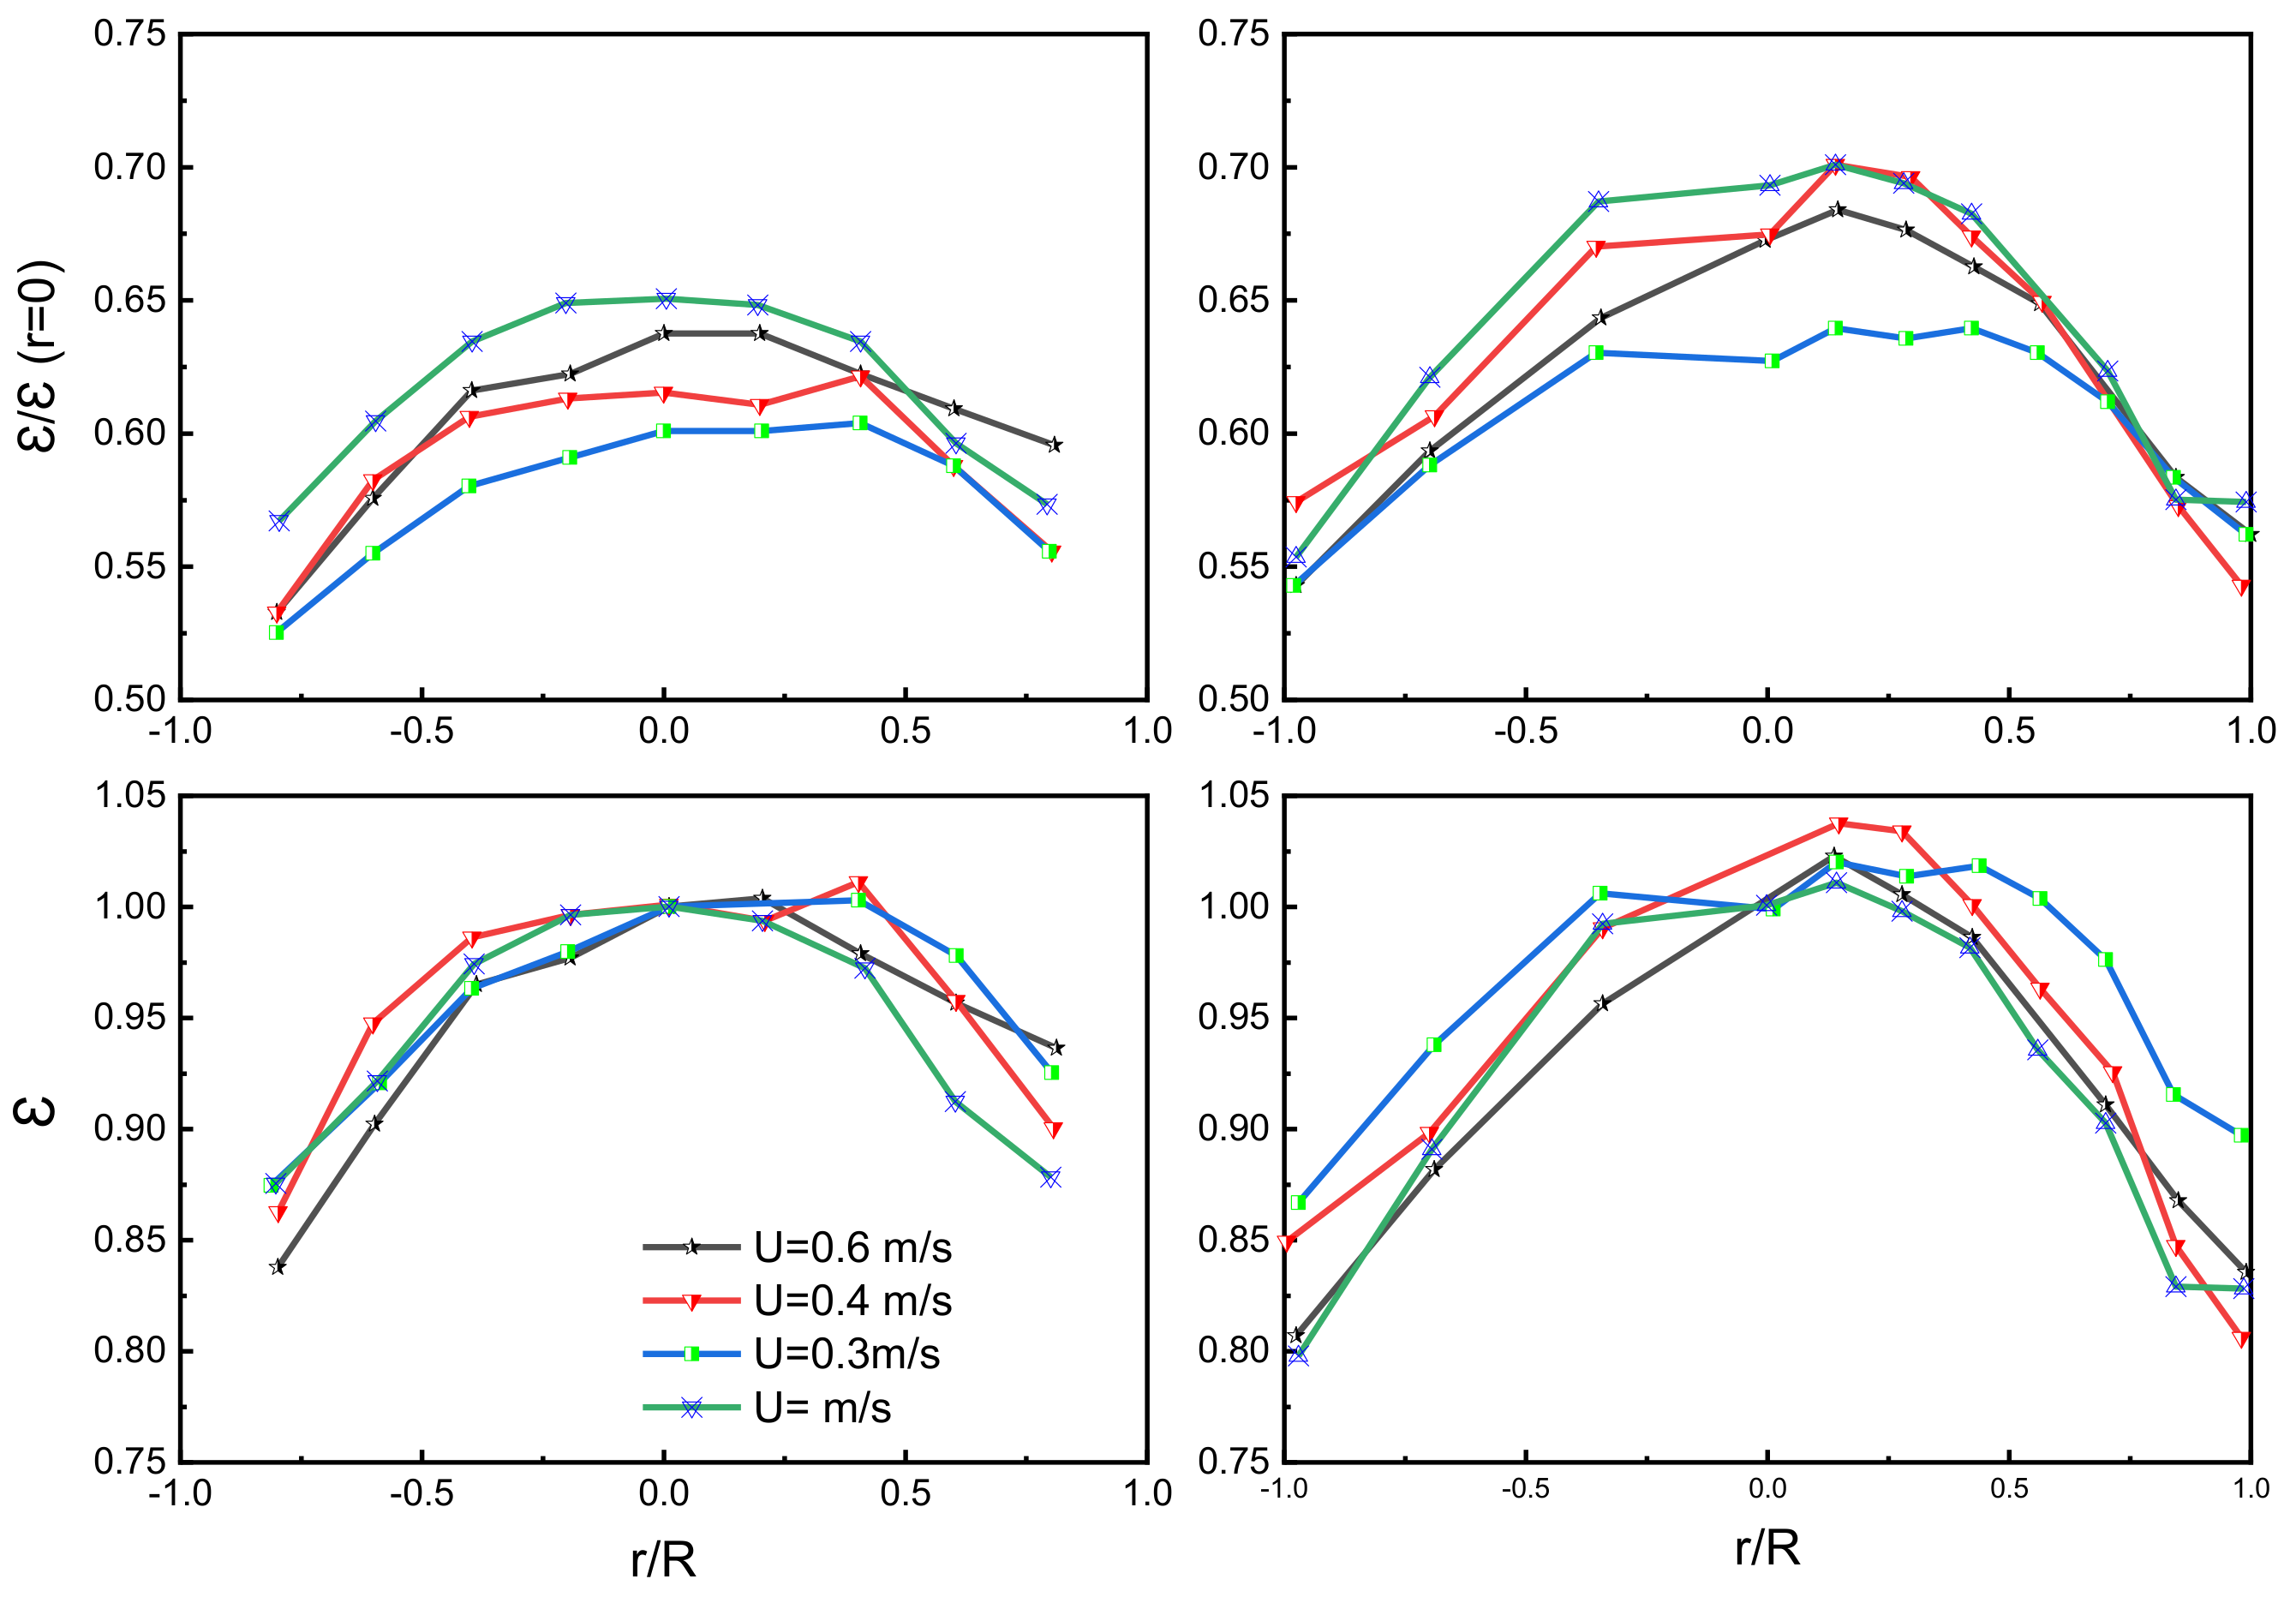
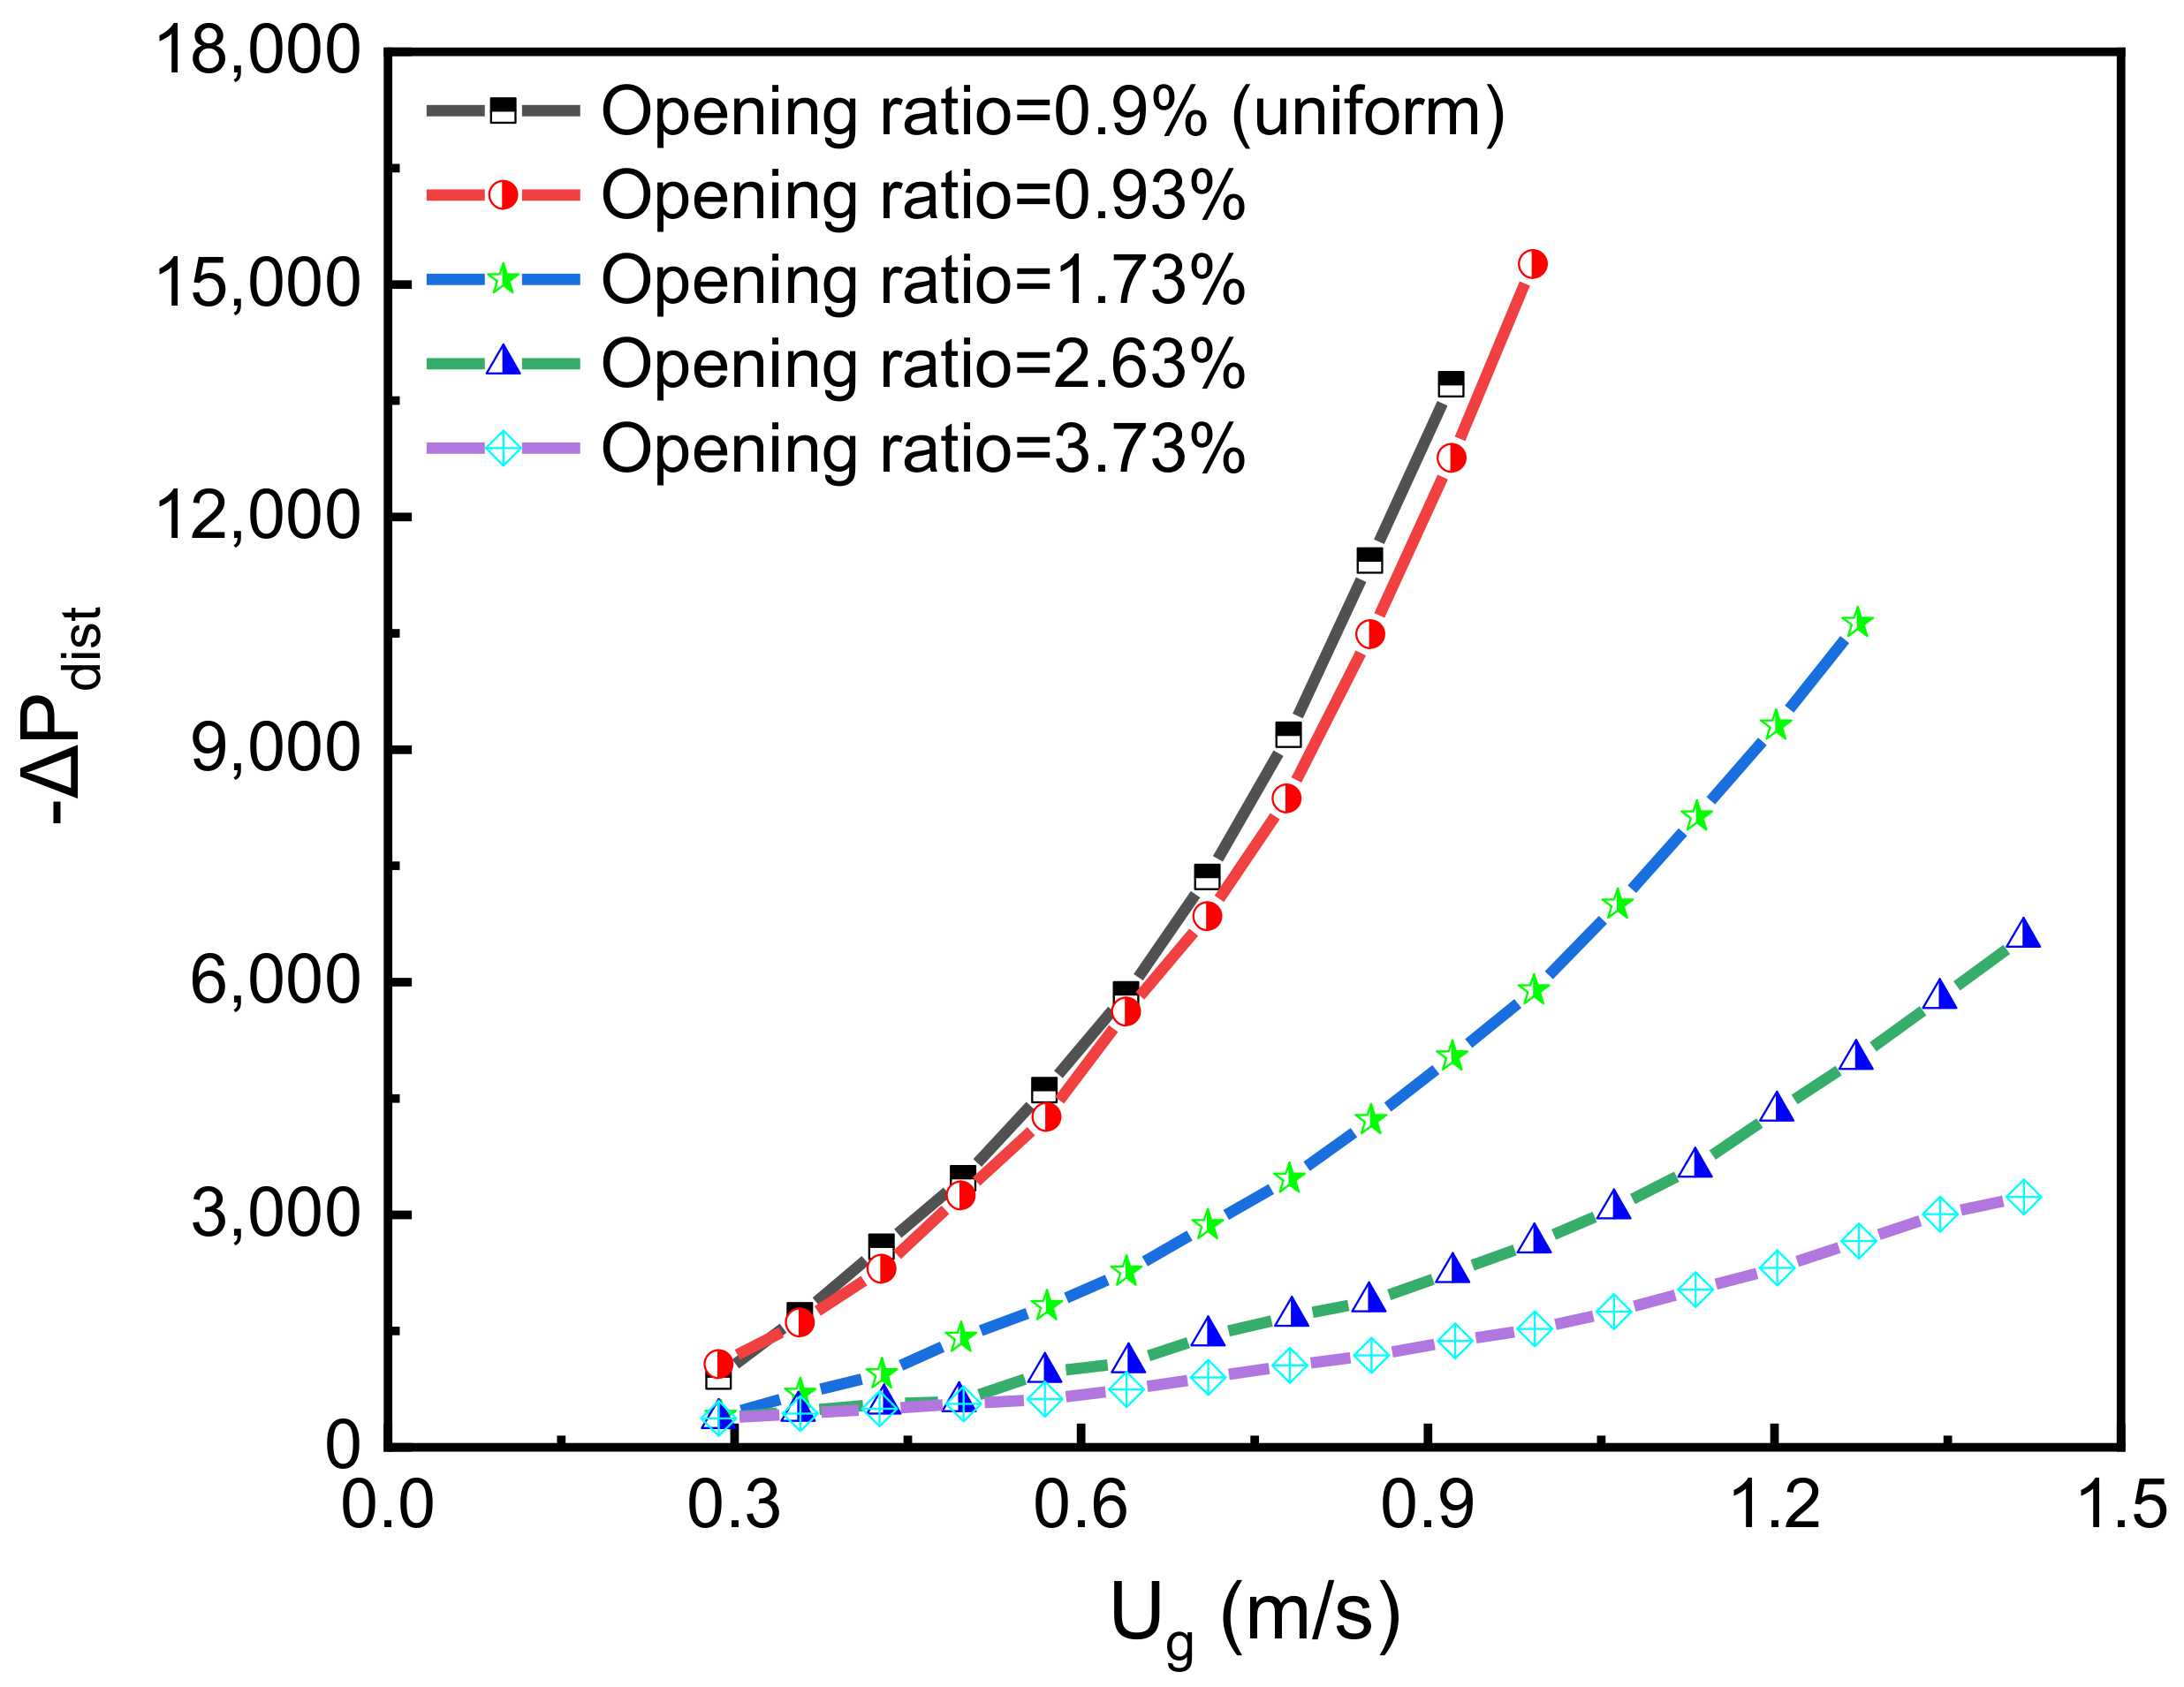
3.1.3. Effect of Distributor Design on Fluidization Quality

According to Dhrioua et al. [159], the gas velocity and open area of distributor influence the homogeneity and stabilization of fluidization. Ouyang and Levenspiel [160] priorly found that fluidization quality was better in a spiral-type distributor than the sintered-plate distributor; in the former, it increased with gas velocity and blade number but slightly independent of the open area, which changed from 1.2% to 4.1%. In a recent study, under the same gas velocity but different open area (5.92%, 3.33%, 1.48%, 0.95%, 0.53%) and different hole numbers (10, 13, 19), the best fluidization stability in a perforated plate distributor was obtained in the smallest opening area with the highest hole number, respectively, of 0.53% and 19; this, however, has its own drawback on the formation of stagnant solids [70], which is consistent with results obtained by Chyang et al. [154]. Figure 10 obtained by Son et al. [161] also showed that the pressure drop increases with both the superficial gas velocity and opening ratio of the perforated plate.
Windows-Yule et al. [71] also found that with an increase in perforated-plate distributor orifice number, the fluidization quality and catalyst bed uniformity improved, but modifying the orifice size at a fixed number of nozzles had a negligible effect on the flow characteristics. This is partially consistent with Sánchez-Delgado et al. [138], wherein increasing the orifice number from 6 to 28 and decreasing the hole diameter (2.2–1 mm) resulted in the decay of jet penetration length, which, of course, is as a result of the reduction of gas mass flow rate per orifice. The distributor with the higher number of nozzles produced a more homogeneous bubble distribution; thus, the gas is more evenly distributed. Similarly, Kwangbyol et al. [146], using both experimental and computation platforms, found that a reduction in orifice size and pitch at a constant open area led to a significant decline in both the distributor pressure drop and the initial bubble size, which in turn increased the homogeneity of solids distribution in the bed as a result of an increase in bed pressure drop. Sathiyamoorthy and Horio [150] investigated the fluidization quality from a perforated distributor using a different number of orifices (121, 325), orifice diameters (0.95, 0.8 mm), open areas (0.273%, 0.52%) and plate thicknesses (6.1, 5.0 mm), and found that the maximum fluidization quality was predominantly influenced by the operating velocity and the nature of the bed material. They concluded that shallow beds have a high proclivity to having good quality fluidization and free from channelling (a phenomenon of gas flowing through the bed as a narrow path) under the large open area conditions, even when the system was operated around the minimum fluidization velocity, which was later proven true by Zhang et al. [70]. It is interesting to see that a particular parameter cannot be solely modified to improve gas–solid flow quality without a domino effect on other structural functions.

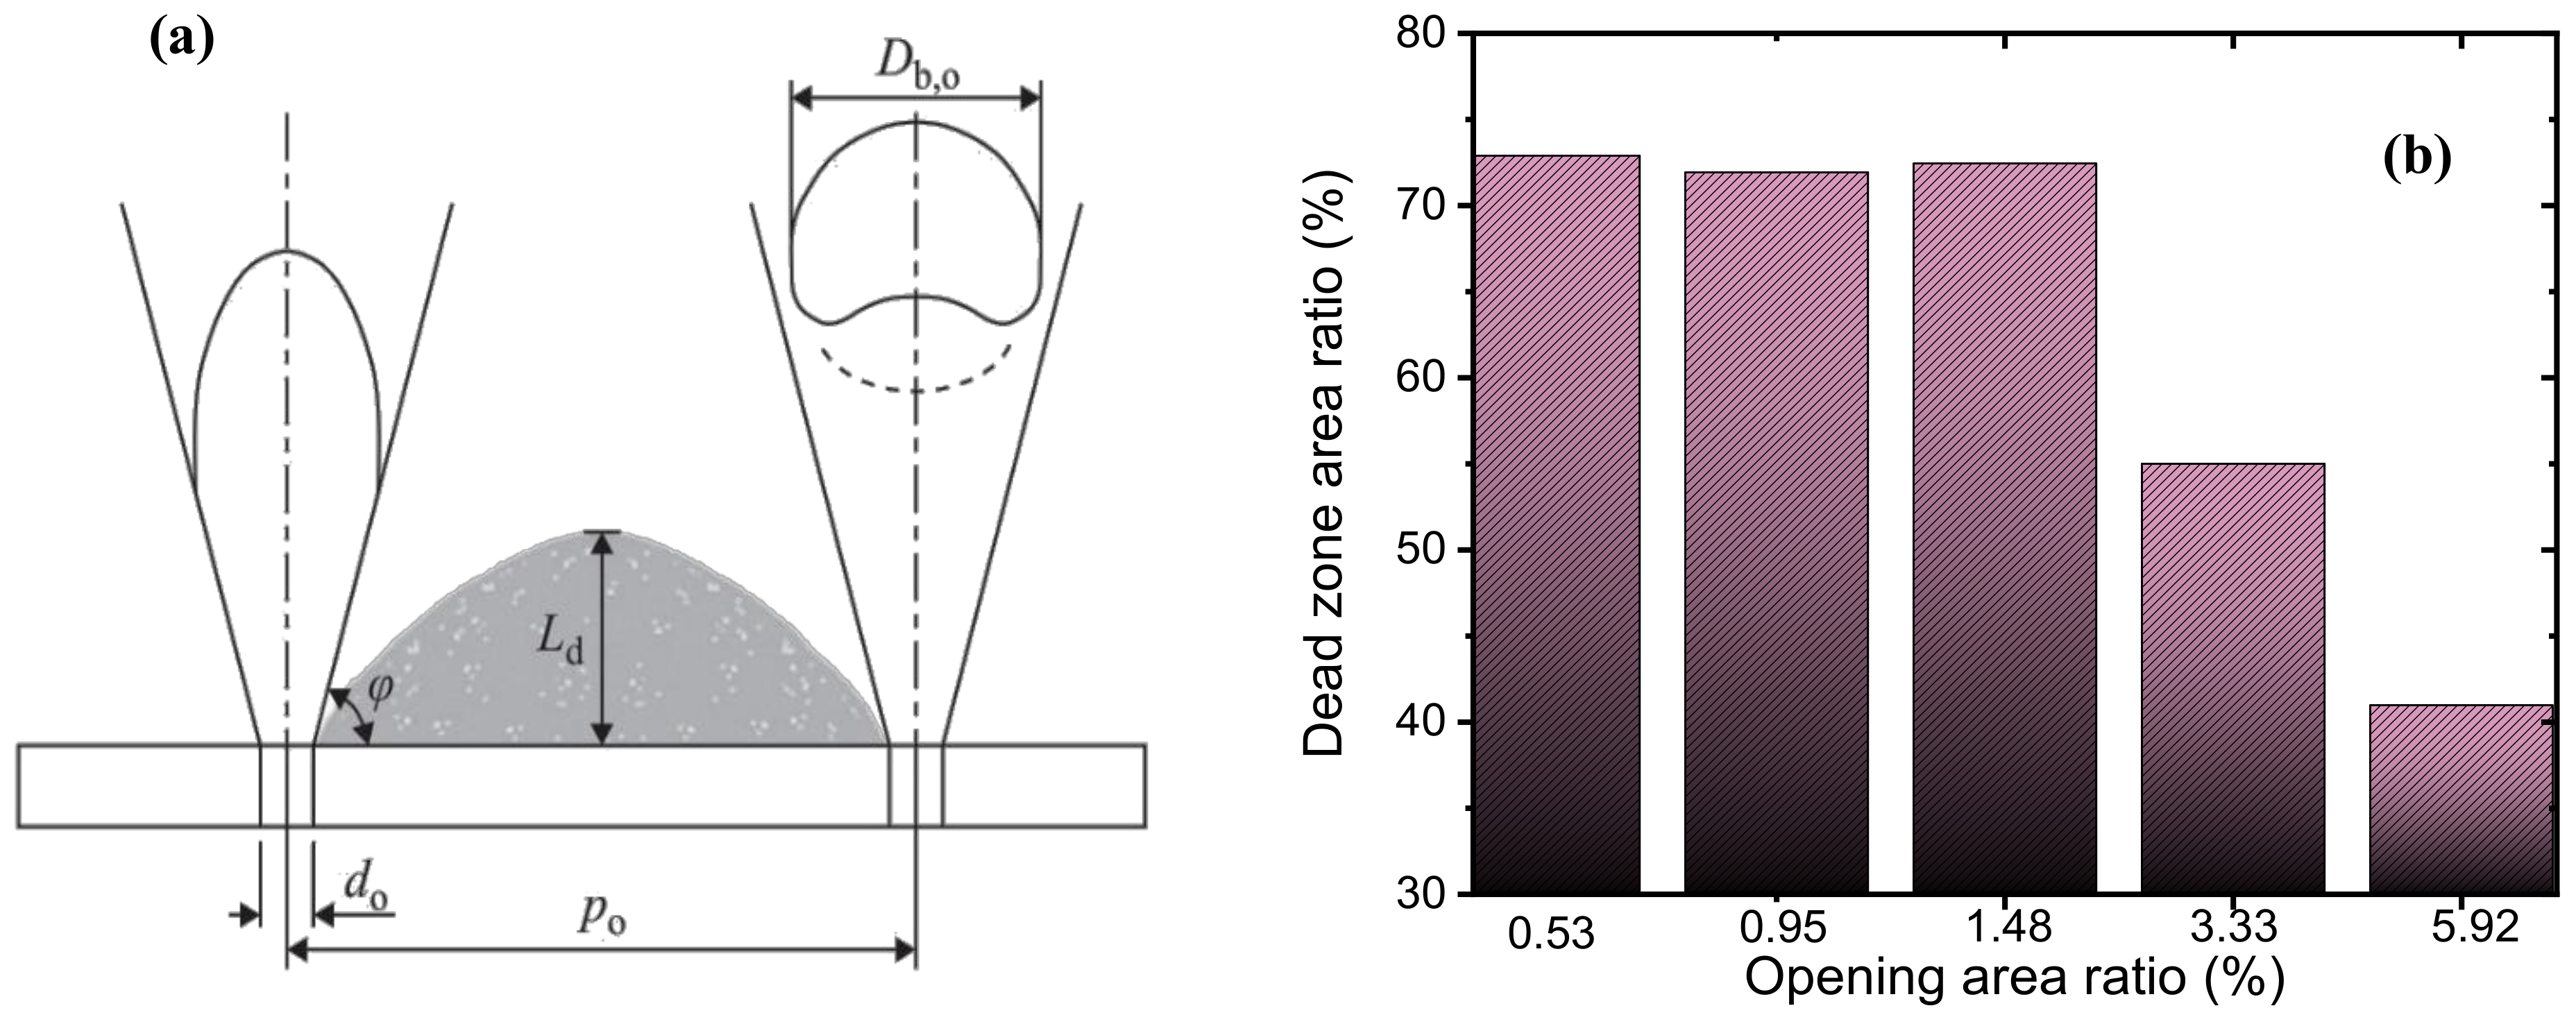
3.1.4. Effect on Dead Zone Formation

The dead zone as shown in Figure 11 is a region characterized by poor gas–solid contact, leading to slow movement of particles or localization of defluidized solids within the bed and poor heat transfer. Kwangbyol et al. [146] analyzed the effects of the orifice pitch (6–26 mm), orifice number (38–994), opening area (2.615–2.631%), and orifice size (1–5 mm) on the formation of a dead zone and initial void on top of the distributor plate and gave the equations for estimating the dead zone height (Ld) as (Equation (6)):
L d = 1 2 P 0 d m t a n φ
where P0 is orifice pitch (mm), φ is the dead zone solid angle, dm is the diameter of the solid flowing above the distributor which estimated a relationship between the orifice diameter (d0, mm) and the gas velocity through the orifice (u0) (Equation (7)):
d m = d 0 4.4 × 10 6 u 0 3 2 + 1.75
The main conclusion from their work is that the combination of smaller orifice diameter with smaller pitch gave the lowest dead zone height and optimum uniform gas distribution while a larger orifice pitch was susceptible to high solid dead zones. The effect of the opening area was found to be small; this, however, could be due to the small difference between the tested opening areas of an average percentage difference of 0.4%.
Differently, Akbari et al. [162] reported a considerable formation of dead zones at the corner of a perforated distributor, but in between two adjacent holes, the localization of dead zone was weak. This phenomenon was completely eliminated in a complete sparger-type distributor, but then the particle circulation was weaker as a result of jet formation above the perforator distributor orifice.
More so, studies have shown that decreasing the opening area increases the dead zone ratio (Figure 11b); this was interpreted as the jetting effect, and to remedy this, the number of holes can be increased since a lower opening is beneficial for stable fluidization [70]. For a tubular distributor, Pham et al. [163] found that reducing the length of the tubular nozzles can reduce the dead-area ratio by an order of magnitude. In addition, homogenous radial and axial distributions of solid volume fraction and decrease in gas distributor pressure drop are potential ways of reducing the height of solids dead zones.
Apart from the aforementioned hydrodynamic and structural balances, another possible way to improve the pressure drop effect in an FCC regenerator is to use multiple air blowers to charge combustion feed gas into the gas distributor and transporting air in the spent catalyst distributor. Here is another difficulty: the main air blower (MAB, which is usually made of stainless steel) being utilized as the aeration medium for the gas distributor is also susceptible to surge, resulting in pressure drop problem. Such a surge can evolve from several caveats such as:
  • Antisurge not conservative enough = surge
  • Antisurge too conservative = loss of efficiency
  • MAB venting to atmosphere = noise complaints
  • Pump performance curve shift = cavitation
  • Sharp vibrations
To resolve problems with regenerator MAB, a direct air heater can be fired up which eventually would increase the velocity, thus creating another cause of concern. Reasonably, a direct air heater is recommended for the startup process until steady fluidization is achieved in the regenerator.
More on the gas distributor viewpoint, the regeneration performance will be better by minimizing the burning air rates to each distributor, i.e., the gas mass flowrate must be set to match the catalyst flowrate. Leaks from the gas distributor should be avoided, and the amount of combustion air to carrier rates should be adjusted. Possible design specifications suggested by Sadeghbeigi [19] are presented in Table 5 for a grid air distributor.
Additionally, abrasion and corrosion attack can be mitigated using refractory/metal nozzles instead of steel. These ambiguities make it difficult to specify the best caveat for all air distributors, but the range provided in Table 5 promises high reliability and performance for a pipe grid.
Designing a typical pipe grid air distributor, the pressure drop can be estimated for several sizes using (Equation (8));
P = ρ 0 2 · g c · 144 V 0 C d 2
where V0 is the air velocity (m/s) via the orifice, ρ0 is the air density in kg/m3, gc the gravitation correction (9.81 m/s) and Cd is the dimensionless discharge coefficient (0/85).

3.2. Spent Catalyst Distributor

The weight of evidence also holds the spent catalyst distributor largely accountable for the obstacles faced in optimizing FCC regenerator efficiency; poor feed gas usage, afterburn, catalyst loss and high NOx emission [50,88,91,164]. Similar to the air/steam distribution issue, nonuniform distribution of catalysts over the dense bed is another leading cause of inefficient contact between air and spent catalyst, which limits the regenerator coke combustion performance. The poor dispersion of spent catalysts on the bed by the spent catalyst distributor results in slug formation and localized temperature distribution across the dense bed. Ideally, a uniform radial distribution of spent catalysts is required to forestall hot spots, zones of incomplete combustion and localization of high oxygen concentration, but more often than not, a substantial amount of large bubbles of air bypass the bed into the freeboard to promote CO combustion and afterburning [91].
Courtesy of advances in the development of several sophisticated computational fluid dynamic (CFD) models and software, the effect of the catalyst distributor is now better understood. Notwithstanding, compared to the air grid, not much progress has been made in the development of the spent catalyst distributor.
In general, the number of openings on the distribution system as well as the location and the pattern of dispersing spent catalyst by the distributor influence some distributor shortcomings, including short circuiting of spent catalyst and poor feed gas utilization [133,165,166]. A single inlet opening distributor is no longer invoke due to the evolution of large diameter regenerators, which would result in poor radial catalyst distribution. Numerous multi-opening design distributors mounted at different regenerator positions have been developed over the years but do not absolve operational difficulties related to distribution uniformity and catalyst flow resistance [50,88]. Recently, in a study on spent catalyst distribution maldistribution by our research team, it was found that the radial openings on the spent catalyst distributor directly above the standpipe are the principal cause of short circuiting of coke-laden catalysts, which resulted in high proportion of regenerated catalyst with carbon greater than 1 wt.% [167]. The spent catalyst from these openings is withdrawn by gravity into the outlet standpipe alongside regenerated catalyst without coke combustion. To circumvent this, the discharge taps directly above the standpipe are closed; hence, the short-circuiting issue is rectified and the regeneration efficiency and hydrodynamics are grossly enhanced [124].
Sadeghbeigi [16] highlighted the pitfalls of the catalyst charging pattern of different catalyst distributors; charging catalyst through a plurality of discrete slots on the upper side wall of the distributor (see Figure 12) often leads to inefficient distribution compared to that from the bottom center of the regenerator above the air grid distributor due to slots propensity to low radial velocities. In addition to this, Chen and Patel [50] added that the ejected transport gas has a short residence time to remix with the catalyst, thereby promoting gas bypass into the freeboard. Myers et al. [91] proposed an improved design of a sidewall distributor equipped with a header aeration lance with multiple orifices for supplying transporting gas, which reduces the catalyst flow resistance (see Figure 13). However, no evidence of industrial application of these new configurations has been found yet. Other designs were reported, such as the U-shaped trough distributor with catalyst discharging openings along the length for the distributor near the top of the dense bed level [168], V-shape distributor with discharge along the cone length [50,169], horizontal conduit fabricated at the bottom of spent catalyst extended from the standpipe which enters the regenerator side near the top of the dense bed which is similar to a UOP ski-jump distributor [16]. Records of successful industrial applications of these new inventions are also currently unavailable, to the authors’ knowledge.
Wolschlag and Couch [141] investigated the efficiency of catalyst distribution of gull wing and piped spent catalyst distributors in an 80,000 barrels per stream day (BSPD) bubbling regenerator. Their results (Figure 14) showed that the pipe distributor more uniformly spread the catalysts throughout the bed while the former was ineffective due to localization of catalyst in the center of the bed. However, Zhang et al. [49] in a commercial cold experiment obtained a relatively high flow resistance under gas flowrates (Ug = 0.55 m/s) in a pipe distributor, thus making it hard to maintain good flow of catalyst in the distributor, which eventually culminated in significant solid maldistribution and poor heat transfer performance. They proposed a new slot spent catalyst distributor which was able to maintain both low flow resistance and relatively uniform particle distribution above a certain critical gas velocity.
Furthermore, numerical simulations using a multiphase particle-in-cell (MP-PIC) model by Parker and Blaser [170] of an industrial regenerator also affirmed that the performance of the spent catalyst distributor is the primary source of many efficiency issues in the regenerator, which is usually borne out of both the design and operational service life. In their study of an old distributor and a new proprietary distributor design, the abysmal thermal asymmetry gas–solid mixing problem found in the old spent cat design was resolved in the new design, as shown in Figure 15. A similar approach and result were obtained by Chen [133] for structural and operational modification of a commercial FCC regenerator unit. As is generally known, all mechanical systems attenuate with time; it is, however, usually difficult to ascertain the remaining useful life (RUL) of catalyst distributor since there are many forces in the system that directly or indirectly affect it. As suggested by Hu et al. [166], less expensive computational tools could provide reliable information on RUL of structural devices based on mechanism analysis, stress data, failure data and direct monitoring data from time series to stochastic filtering.
More so, operating the regenerator in full-burn mode is also averse to spent catalyst distributor optimal performance, since its oxygen breakthrough cannot be avoided [165]. To circumvent this constraint, Schwarz and Lee [77] offered some insights via an Eulerian-Lagrangian computational investigation of a Kellogg design FCC regenerator operating in complete combustion with three spent catalyst distributors tested; two are new modifications of the existing six-arm Kellogg trough distributor positioned above the dense bed. They concluded that the down- and side-facing modified distributors have better oxygen utilization and higher temperature profile than the existing configuration because they induced intimate mixing between spent cracking catalyst and transport gas, thereby creating quiescence in the dilute phase but the two horny-plume behind as seen in Figure 16 reflects turbulence within the regenerator. Following the optimization of spent catalyst distribution, in addition to the improved combustion rate, the incentives of gross reduction of coke on regenerated catalyst, low levels of CO and NOx in the flue gas and low catalyst loss rate are also gained.
Although there is still a paucity of evidence on the catalyst distributor design for best regenerator performance, the significant conclusions one can draw are that a sidewall catalyst discharging is highly ineffective and closing the lateral pipes directly facing the standpipe would considerably alleviate catalyst bypass (short circuiting); the impact of this on the velocity and pressure balance is worth studying further.

3.3. Baffles and Other Internals

Baffles are fixed flow-guiding dead vanes or planes that are usually inserted in the dense phase of many fluidized beds. The key objective of the baffle in the regenerator is to improve the system overall performance at low-cost through (i) the enhancement of catalyst homogenous radial distribution profile, (ii) bursting or impeding large bubbles formation to gaining excellent gas-particle contact, (iii) minimizing catalyst entrainment flux, (iv) restraining the backmixing of gas-particle in the axial direction, and (v) promoting efficient heat and mass transfer by evacuating residual heat produced during coke combustion [52,66,171,172]. Baffles are multifarious and commercially available from simple to complex designs; the major types are horizontal baffles (mesh grid, shed trays, perforated plate, disk or donut, and louver baffle) (see Figure 17) and vertical baffle (planar plates, heat exchange tubes, external catalyst cooler and fixed packings) [125,173], but only a few of these have been adapted in the FCC regenerator due to their strong pliability to intrusive-catalyst bridging and eventual defluidization of the catalyst bed [52,174,175].
The KBR fixed packing baffle (see Figure 17b), pagoda-shape and ridge-shape internals, and Zhang [176] multilayer Crosser grid that is a replica of louver baffle are some of the more successful applications in the FCC regenerator.
It is evident that despite the simplified purpose of the baffle in the regenerator, complexities and controversies trail the knowledge of its actual effect on hydrodynamic, scale up design, and degree of impacts on overall regenerator performance. Studies have shown that the efficiency of the baffle in improving regeneration hinges on its plane geometry, vane orientation (i.e., inclination pitch), vane inclination angle, and dimensions [68,177,178,179]. Bubbles are the engine that drives the catalyst bed, which in turn makes high heat and mass transfer rates a possibility, and at the same time, large bubbles (slug) are also the cause of poor fluidization quality in the bed and hardware surface erosion [2]. In the literature, it was found that louver and ring baffles were only effective for bursting large bubbles at low superficial gas velocities [178,180,181,182]. Zhang et al. [178] studied the influence of baffles on the performance of a two-dimensional fluidized bed of FCC Geldart A particle. They found that, at lower superficial gas velocities (<~0.7 m/s), only large bubbles were effectively split as they passed through a layer of Louver baffles. However, at higher superficial gas velocities marking the turbulent regime, expectedly, the bubble diameters decreased and thus escaped freely through the baffle open areas unscathed. They concluded that until a bubble’s diameter is larger than the baffle’s vane pitch, it cannot be effectively busted. Alternatively, decreasing the baffle open area is another possibility for enhancing the breaking of small diameter bubbles, but this could lead to blockage of particle motion and a decline in mixing in that direction. Additionally, above 0.4 m/s superficial gas velocity, they observed the emergence and growth of a permanent gas parcel beneath the horizontal baffle layer (this is otherwise called a gas cushion), and the gas cushion height increased with increasing gas velocity. The high gas cushion was effective in suppressing particle backmixing, which is desirable for gas–solid contact [52]. Nonetheless, an extremely high gas cushion also has its own negative implications, such as a reduction in volume efficiency of the regenerator and the potential of defluidzing the regenerator bed since only a few particles would be allowed to pass through the gas cushion and the baffle slats [183], harmful to the regenerator performance. This implies that in a fast fluidized bed where the superficial gas velocity exceeds 1.2 m/s, baffle installations require some special considerations.
The effects of an open area ratio of horizontal baffle on gas cushion height have been widely studied [181,182,184]. Samruamphianskun et al. [184] investigated the influence of different geometric parameters on a ring baffle in a circulating fast fluidized bed via cold flow experiment and two-fluid model (TFM) simulations. The FCC catalyst’s mean diameter was 76 µm, typical of Geldart A solids, whilst the fluidizing agent had an air of density of 1.2 kg/m3. They found that, at a constant gas velocity (5.2 m/s), the effect of the baffle opening area-space is the most dominant; that is, a higher gas cushion height (see Figure 18) appeared below a ring baffle of a lower open area ratio than that of larger open area ratio. Intuitively, the change in gas cushion height is proportional to the catalyst flowrate across the baffle layer. In other words, as the upward solid flowrate increases, the bed height below the baffle layer decreases. Additionally, with a decrease in catalyst flowrate, a steady decrease in bed height was observed, which continued until it paralleled the downward catalyst flowrate; this significantly increased the lateral mixing. However, a negative vertical catalyst and gas velocities were observed in the baffle region due to the insufficient space for particles and gas to pass through the slats. It then recommended that an extremely low opening ratio of baffle be avoided, and it is unnecessary to install a baffle in reactors of low bed heights.
Although large bubbles are broken by the baffles, which help to reduce bed vibration and increase relatively uniform redistribution of bubble size [185], a cause for concern is the effect of dynamic forces on the baffles resulting from the continuous violent bubble and particle impingement. This constant attack imposes huge stress on the baffle vanes and slats, which in the long run would lead to structural deformation of the device. The impact of these forces is reportedly a function of certain factors, namely superficial gas velocity, bed depth, particle properties (size and density), slat pitch and layout location [186,187,188]. Nagahashi et al. [189] initiated a mechanistic study to unravel the actual dynamic forces affecting baffles; the forces were found to be the conglomeration of solid-contact force, fluid viscous force and differential pressure. Further on this, Nagahashi et al. [186] numerically characterized the effect of buffeting load on the baffles. They obtained dynamic stress and pressure signals from sensor gauges attached to the baffle slats and transformed the associated root mean square data σ RMS to the intensity of the load felt on the test slat across a time period through Equation (9):
σ RMS = 1 N k = 1 N σ k 2
where N represents the number of sampling data points collected across a sampling period, while σk (Equation (10)) denotes the stress value at each data point calculated from strain value using Hooke’s law.
σ = E ε
Herein, ε denotes the experimental strain value; E denotes the elasticity modulus (distinct for discrete materials, E = 206 GPa for test slat constructed with 304 stainless steel). To account for the impact of many bubbles and slugs buffeting a single baffle slat along its radial length, Xiong [190], assumed a uniform upward load density (qRMS), given as (Equation (11)):
σ ^ RMS , i = M W = a q RMS ( l 2 + x i 2 2 l x i ) / a b 3 12 2 b = 3 q RMS l 2 + x i 2 2 x i l b 2   ( i = 1 , 2 5 )
where σ ^ RMS , i denotes the calculated RMS stresses at different locations; M denotes the bending/deformation moment; W denotes the region modulus of the test slat; l denotes the slat length; a denotes the slat width; b denotes the slat thickness; xi denotes the distance of the i-th strain sensor gauges from the fixed end. Liu et al. [183] assumed a negligible difference between the calculated and the measured RMS stresses to derive an equivalent RMS uniform load density; hence, from the principle of least squares method, a reliable work function (ϕ) representing equivalent RMS uniform load density was formulated (Equation (12)):
φ = i = 1 5 ( σ RMS , i σ ^ RMS , i ) 2
Using this technique, Liu et al. [183] found that a smaller slat with a moderate thickness appeared to be a universal desirable design configuration for the louver baffles. Since the applied experimental conditions and the baffle design utilized are close to an industrial hydrodynamic condition, it thus offers an innovative tool for fabricators in quantifying to a high precision the mechanical force that will affect the baffle performance. However, validations with other experimental studies are required since the baffles used in the real regenerators are usually complex and made of several rows of the slats and varying particle sizes. Moreover, the applicability of this to ring baffles has not yet been tested. Based on Yang et al. [180], the axial particle volume fraction fluctuates with different baffle configurations. More studies in this direction are anticipated in the future.
Furthermore, the structural size and shape are also salient parameters influencing baffle’s performance. While Samruamphianskun et al. [184] found out that ring baffles optimize the gas–solid contact effect, Shah et al. [171] added that longer baffles and compound internals give a more uniform catalyst dispersion and homogenous temperature profile. Shah et al. [171], however, argued that increasing the number of baffles would not necessarily correspond to higher regenerator performance, and in short, with an increasing size and number of baffles, catalyst holdup in the bed declined while the discrete catalysts velocities increased. To this effect, the catalyst residence time is reduced and the conversion efficiency also dips. However, from a counter perspective, Zhang and Lu [66] tested the influence of a three-layered baffle in a turbulent fluidized bed and observed a significant reduction in the pressure fluctuations and a reduction in the catalyst circulation flux by 89–96%, thus improving the suppression of the gas-particle backmixing. They also recommended the lower section of the dense bed for baffle installation for optimum regenerator performance. Kwauk [177] had earlier suggested a distance of 0.4–0.6 m between the adjacent baffle layers in an industrial fluidized bed regenerator so that each baffle could operate independently without the effect of one influencing the other. It is therefore logical to say that increasing the size and number of baffles is not the real problem as claimed by Shah et al. [171]; instead, the baffle spacing is defective, leading to a lower solid concentration and velocity profiles. Therefore, the recommendation of Kwauk [177] should be given serious consideration. In addition, the diameter and bed height of the column as well as the catalyst properties are yardsticks for determining the maximum baffle required in a regenerator.
The aiding contribution of baffles against bed gas-bypass has also been investigated, and it is found to be better than other analogous internals, cyclone diplegs, hot wire or film probe and protruding nozzles [66,187,188,191,192,193]. In their study, Issangya et al. [194] seemingly veered with this conclusion that increasing the pressure of a fluidized bed is a more reliable alternative measure to minimizing gas bypassing into the dilute phase than using baffles. They observed a reduction in gas bypass without baffles by raising the system pressure from 15 to 20 psig in a 0.6 m diameter column using a Geldart A particle. This is an interesting and significant finding, but it is difficult to concur with this deduction since baffle or other internals were not tested in their investigation. Of course, at a higher pressure, especially in a low-velocity fluidized bed of Geldart A solids, bubbles become smaller as they split by division from the roof and their number also reduces, but the pressure control is a function of multiple metrics, implying that it is difficult to be singly maintained or regulated. More so, Zhang [176] found that specifically designed baffles enormously reduced differential pressure fluctuations and promoted higher bed expansion in a bubbling flow regime regenerator. The bed expansion observation was attributed to the continuous bubble coalescence restrain, bubble breaking and the formation of dilute gas cushion phase under the baffle. Future comparative industrial studies with different superficial fluid velocities and internals will be more appreciated. Importantly, operating in the turbulent flow regime with high superficial gas velocities is a common practice in industrial FCC regenerators; this inevitably results in low catalysts holdup above the thickening gas cushion in the dense bed. With baffles, the gas cushion is obstructed and the catalysts inventory in the regenerator increases; thus, the performance of the regenerator is optimized.
As mentioned earlier, a baffle can increase the regenerator performance by suppressing catalyst backmixing flux, lowering catalyst entrainment in the freeboard, and can function as a pseudo-air distributor under high superficial gas velocities, as is the case for turbulent and fast fluidized regimes [125,179,180,195]. As revealed in Figure 19, the baffled bubbling fluidized bed (BFB) system experienced less than a quarter of the mean catalyst circulation of the baffle-free fast fluidized bed (FFB) regenerator, depicting an enormous catalyst backmixing effect that causes poor regeneration.
On the negative side, baffles have also been found to increase the catalyst loss rate and prompt bed transition to the turbulence regime. This is often attributed to the small flow areas between the vanes that trigger a rise in superficial gas velocity and the breakup of catalyst clusters, resulting in higher catalyst entrainment flux, as shown in Figure 20 [196,197]. A possible solution was recommended by Cocco et al. [196], which encompassed a selective introduction of fine particles to Geldart A particles to buffer the particle size distribution, and in turn minimizes entrainment when baffles are installed. George and Grace [198] and Kunii and Levenspiel [199] also argued that there is an insignificant impact of baffles or any internals installed in the fluidized bed freeboard on the catalyst carry-out flux. This should perhaps be considered in the event of inserting multiple layers of baffles, which might have a layer extending beyond the dense region.
Succinctly, based on the discussion above and as can be seen in Table 6, direct evidence now exists that baffles improve the regeneration efficiency and that the effective performance of baffles in FCC regenerators directly correlates with the geometric design, number and material construction. Horizontal baffles desirably break large bubbles, in effect promote good gas–solid contacting, narrow the particles residence time distribution (RTD) and reduce the tendency for system defluidization. However, baffle insertion increases the regenerator structural complexity, limits accurate quantification of local hydrodynamics, increases system energy consumption and can accelerate the transition of bubbling fluidization to a turbulence regime. Especially for louver baffles, a suitable configuration would have a long length, lower open-air ratios, mounted in the lower part of the dense phase and be made of carbon steel or low chrome alloy to avoid deformation since they are continuously impinged by rising large bubbles. One key area that still requires more understanding is the full mechanistic effect of dynamic forces on the ring baffle, which is also common in industrial regenerators.
Other internals such as cyclone discharge pipes (i.e., diplegs) and downflow standpipes also influence flow structure in the FCC regenerator [200], but since their contact with the catalyst bed is quite small, relative to baffle internal, their overall bed performance in relation to strengthening the contact efficiency of gas–solids and to improving the fluidization quality is apparently negligible. Moreover, no comprehensive study of their influence on mechanisms of effect on the regeneration efficiency were carried out.
Table 6. Effects of horizontal baffles on FCC regenerator performance.
Baffle Parameter DegreeAdvantages Disadvantages Model GeometricType/Specification Reference
SizeLonger lengthIncreases radial dispersion close to the baffle region
Lowers radial temperature gradient
Increases particle velocity (especially in the annulus)
Low effect on flow at regions far from the baffles
Increases dead zone near the walls (i.e., low particle content in the regions far from the baffles)
2D 30 × 1 mLouvers
10, 7.5 and 5 cm
[171]
SpacingSmaller Increases breaking of large bubbles
Improves radial homogeneity
Higher dilute flow and low particle near the wall
Increases near wall dead zone
Extent of particle segregation is negligible at low gas velocity
2D 30 × 1 mLouvers
5, 2.5, and 1 m
Perforated
6, 4, and 2 cm
[171,201]
NumberHigherIncreases bed expansion
Decreases bubbles diameter
Bubble energy is weakened, hence coalesce and formation of new bubbles declines
More uniform particle distribution around baffles
Increases pressure drop2D 1 × 0.1 mPerforated
4, 3, 2, and 1
[182,201]
Slat PitchSmallerForces acting on baffles decrease at high superficial gas velocity Dynamic forces acting on baffle increase at low superficial gas velocity3D 0.3 × 0.3 × 5 m
Baffle geometry: 0.3 × 0.05 × 0.003 m
Louvers
0.104, 0.071, 0.053, 0.035 m
[183]
Superficial gas velocityHigherIncreases solids segregation efficiency
Decrease in time required to attain a steady state
Constricts axial particle flow
Higher pressure drop3D 0.102 × 6.32 m
3D 0.3 × 0.3 × 5 m
Perforated
1.8–3.1 m/s
Ring
1.5–2.5 m/s
Louvers
0.2–0.8 m/s
[183,201,202]
Opening space Smaller Eliminates the formation of large bubbles
Reduces bubble energy
Improves particle segregation efficiency
Higher dynamic forces on the baffle
Higher pressure gradient
Increases axial particle velocity
2D 1 × 0.1 mPerforated
30.2, 20.5, and 10.6%
[182]
Caps Present Restrains jet flow entrainment and particle backmixing
More uniform particle distribution
Increases pressure drop2D 1 × 0.1 mPerforated
20 mm
[182]
Layout positionHigher Low dynamic force at higher lateral position at high superficial gas velocityHigher stress is imposed on the annular slat at higher superficial gas velocities3D 0.3 × 0.3 × 5 mLouvers
0.9, 0.7, 0.5, 0.3, and 0.1 m
[183]

4. Measures to Improve Regenerator Reliability

The innovative improvements in the design of FCC regenerators have resulted in better metallurgy and apprehension of better operational features culminating in the unit extended on-stream availability and performance. Prior to 2013, an average FCCU turnaround (TAR) was within 2–3 years but has now extended to 3–5 years; nonetheless, the propensity to make all its components more reliable is still vast. As depicted in Figure 20, the unit is still faced with several problems that compromised its optimum reliability leading to impromptu shutdowns or system damage [1]. A typical example is an explosion of the ExxonMobil refinery electrostatic precipitator (ESP) in 2015 leading to the shutdown of the whole refinery for over a year, which was partly due to the erosion of a spent catalyst slide valve, which promoted leakage of combustible hydrocarbons into the ESP en route from the regenerator unit [203]. Apart from erosion problems, afterburn is another serious challenge that destroys regenerator internals. Catalyst losses, attenuation of rotating equipment, high vibration and noise levels problems have also been flagged. These issues have attracted intense academic efforts and strategic solutions are being developed. Here, discussion on regenerator reliability improvement is delimited to afterburn, erosion and catalyst loss solutions as shown in Figure 21.

4.1. After-Burn Control Measures

Afterburning (also called post-combustion) is a phenomenon associated with the localization of extremely high temperatures in the freeboard, usually as a result of post-combustion of carbon monoxide to produce carbon dioxide in the dilute phase, which can be interment or continuous. Entrained catalysts upon entering this zone by reason of prolong exposure to higher temperatures and overheating become incandescent and lose their activity or are completely damaged due to adverse alteration of their bulk density and porosity [204]; this holds true for every regenerator mode (either partial or full burn). Afterburning is mostly critical to the freeboard, thus affecting cyclones, plenum and overhead flue gas exit ducts; the dense bed, on the other hand, is immune because the heat of combustion liberated by regeneration is absorbed by the high catalyst inventory and holdup; therefore, extremely high temperature in the dense bed is uniformly distributed and ducked [19,204]. Afterburn effect demands intermittent operator intervention, making auto-monitoring and control impracticable. It also forces refiners to operate the bed at undesirable lower temperatures, which in turn affects the throughput to the unit (reducing catalyst circulate rate by practically 10%) and the profitability of the whole unit; a huge loss of about tens of thousands of dollars daily has been reported [205].
A limited level of afterburn is normal in most FCC regenerators, but when the temperature exceeds the limits imposed by the material construction for the metallurgical internals, afterburn inevitably distorts their structural integrity. The extent of afterburning is therefore one of the important metrics for measuring the coke combustion efficiency and a synaptic performance indicator of regenerators.
Notably, the uncontrolled oxidation of CO in the dilute phase is predominantly homogenous with high heat of combustion (7697 cal/mol) while less than half of this heat (3000 cal/mol) is produced from the CO heterogenous burning in the dense bed. This contributes to the differential heat of formation and temperatures; therefore, the optimum regenerator temperature thus occurs in homogenous complete CO combustion [61], which cannot be materially utilized. As a result, the whole heat balance is materially punctured and the efficiency of the regeneration system plummets. An ideal state would require that all the CO combust in the particle dense region.
Multiple causes of afterburn in FCC regeneration system can be broadly categorized into insufficient burning kinetics, maldistribution of spent catalyst and air in the bed, and catalyst-feed gas mixing efficiency. From the reactor section, a circuitous catalyst flow from the stripper can also trigger afterburn in the regenerator [204,206,207]. A summary of the root causes of afterburn in the regenerator and the potential solutions are presented in Table 7. The latest central effective measures to prevent afterburn include: application of CO combustion promoters, adjusting the operation parameters, and mechanical design modifications as discussed below.

4.1.1. Application of CO Combustion Promoters

CO combustion promoters are additives with varying activity used in the catalyst bed in full burn regenerator to improve CO catalytic oxidation where heat of combustion released is efficiently absorbed in the dense bed by surrounding catalyst particles resulting in lesser temperature rises. It is worth stating that CO can also self-ignite at any temperature above 1120 0F [208]; therefore, even for regenerators operating in partial-burn mode where a lower amount of oxygen is provided, afterburning cannot be sheer avoided but the addition of CO promoter would significantly reduce it. Important criteria for a suitable promoter include (i) excellent activity to enhance complete CO burning, (ii) resistance to undesirable contaminant formation, (iii) thermal stability, (iv) immunity to hydrothermal conditions, and (v) cost effectiveness [29,209,210]. Commercially, CO promoters are available as platinum-group metals (PGM) or non-platinum-based, the choice of applications considerably depend on the balance between CO oxidation and NO reduction (e.g., excessive Pt-based CO promoter use increases NOx emission but favors complete CO combustion) [209]. The application of platinum within 300–800 ppm as an active ingredient has been found to be most efficient for heterogenous CO oxidation, but its tendency to increase NOx level has discouraged its acceptability [209]; hence, many operators today adopt nonplatinum-based CO promoters. Kassel [204] proposed the application of CO oxidizing catalysts incorporated with a small amount of first row transition metals (such as Cu, Cr, Mn, Co and Ni) in the range of 0.0005–0.01 wt. %. In their investigation, no adverse effect on cracking reaction was found and the oxidation of CO in the dense bed was favored with negligible afterburning in the dilute phase. Other base metals (Cr, Ni, and Mn) and noble metals (Ag, Ir, Rh, Os, and Ru) have also been tested but with limited industrial success [211,212,213]. For example, though Cr has moderate catalytic activity but deactivates the FCC catalyst easily, Mn significantly reduces NO emission but has less influence on oxidation activity.
Iliopoulou et al. [211] in their experimental studies indicated that simultaneous thermal NO reduction to N2 and CO oxidation occurs at 700 °C, and to avoid trade off of NO reduction under high O2 concentration (40% excess oxygen), a complete CO combustion with near zero NOx emission was achieved using 500 ppm Ir/CPBase and 1000 ppm Ir/CPBase additives
2 CO + 2 NO N 2 + 2 CO 2
2 CO +   O 2 2 CO 2
At 720 °C, which is within an FCC regenerator thermal operating range, Wen et al. [214] found that both CO and NO can be efficiently removed independent of oxygen constraint over Ce-based catalysts synthesized by co-precipitation method including CuMgAlO (Cu-cat), CeMgAlO (Ce-cat), and CuCeMgAlO (CuCe-cat). Due to the strong interaction between the Cu+ and Ce+ ions, deactivation of the CuCe-cat by SO2 is impeded, unlike other tested Ce-based catalysts.
Stockwell [215] and Vaarkamp and Stockwell [216] also proposed new CO promoters composed of a mixture of precious metal (s), metals or metal oxides (Cu, Ag or Zn) distributed at a specific location of catalyst base at varying amounts for enhancing CO oxidation and noxious NOx decomposition. Apart from the economic implication of precious metals, there are no sufficient studies available to confirm or validate these claims, which will be interesting in the future.
One of the latest developments in CO promoter intensification which is different from PGMs is the use of low-cost and environmentally friendly perovskite-based catalyst (ABO3, A: rare earths, B: transition metals of the first row) [217,218]. Experimental findings have shown that the activity of perovskite can be enhanced by promoting the base metal-based oxides with precious metals, which is consistent with the earlier finding that noble metals retain excellent dispersion on perovskite surfaces. Several investigations have shown their application (including LaBO3 (B = Fe, Co, Mn) as FCC CO promoter with low coke generation during cracking, high CO conversion during catalyst regeneration and low catalyst attrition [5,218]. Zhang et al. [219] found that the CO oxidation activity can be further increased by using Lanthanum-deficient synthesis (La defect) to tune the surface concentrations between A and B elements which incorporated with trace amounts of precious metals (Rh, Pd, and Pt). Other studies have also indicated the possibility of reduction of NO [208,217,220,221]. Further research on hydrodynamic effects is necessary since this offers a promising future for FCC catalyst, opening avenue to further and cheaper reduction of the overall FCCU carbon footprint.

4.1.2. Modification of Air/Spent Catalyst Distributor

As discussed earlier in Section 3, an uneven distribution of combustion air or spent catalyst distributor stem from the design and operation of the distributor systems, which not only promotes high coke content in the regenerated catalyst but also causes excessive afterburn. To avoid repetition of discussions, the solutions in relation to modification of sidewall spent catalyst distributor with internal baffle or splash plates, application of distributor arms or trough to spread solids across the entire bed cross section, use of perforated plate or multiple air distributor to enhance uniform gas distribution, use of domed grids to improve catalyst flow the orifice of the grid, among others, would minimize or avert excessive localized afterburn due to hardware problems.

4.1.3. Pressure and Other Process Adjustments

With respect to operational factor, Sadeghbeigi [19] ascribed reversed catalyst flow as another source of afterburning. With an undesirable differential pressure across the slide valve which serves as a link between regenerated catalyst and fresh hydrocarbon feedstock, the latter backflows into the regenerator. This leads to unstripped hydrocarbon combustion and higher temperature excursions in the freeboard. To circumvent this, installation of differential pressure alarm at the regenerated catalyst slide valve would help prevent backflow. It is also necessary to ensure the correct air rates is maintained consistently. More importantly, the pressure drop across all the regenerator embodiments (Figure 22) must be thoroughly monitored and balanced.
William and Heigl [207] also identified changes in operating variables as a major way of controlling afterburn since it has a direct relationship with rate of change of CO available in the regenerator. They debunked the assertion that extremely high temperature in the dilute phase reflects the amount of CO; instead, it is the rate of change of CO. In essence, a 5% CO content might enhance afterburning than a 10% level if the rate of change exceeds 0.1%. They therefore proposed instantaneous measurement of CO level in the flue gases especially with the aid of a split-beam infra-red gas analyzer, and an auto closing of solenoid valve to reduce the amount of redundant oxygen provided. They also developed a carborundum filter which can be used to collect coarse catalyst and to recirculate gas, this was also recommended by Ellis [222] for intercepting entrained particles or gasses; however, the feasibility from a mechanical design point of view is yet to be proven or successful.
Other considerations in relation to operating conditions that would help reduce damaging afterburn include:
  • Installation of catalyst cooler;
  • Injection of torch into the regenerator or slurry oil recycle into the reactor to maintain heat balance across the reactor–regenerator;
  • Regulating the regeneration air flowrates to match each air/steam distributor;
  • Raising the pressure across the regenerator unit; standpipe, slide valve, air/steam distributor, cyclone diplegs, among others;
  • Reducing redundant oxygen provided and optimizing the flue gas excess oxygen;
  • Appropriate design or modifications of the gas and spent catalyst distributors to induce uniform distribution of regeneration air and spent catalyst across the dense bed.

4.2. Anti-Erosion Measures

Continuous and rapid strike of gas and catalyst on the surface of the regenerator and the internals results in wear or material loss from the surfaces; this is otherwise termed erosion. Erosion due to particle strike is termed solid particle erosion (SPE); this is critical to basically cyclone, slide or plug valve, transfer lines, and expansion joint. Mechanical stresses induced by cavitation (implosion of gas bubbles) at high gas velocities are also critical, especially to the grid and air distributor nozzles. In general, erosion in the regenerator potentially stems from high catalyst velocity (above 1.0–40 m/s), inlet catalyst loading, catalyst size, processing period, transport gas viscosity and jetting effect [223]. Erosion rate can also be a function of impingement angle, solid shape, composition and surface treatment (i.e., lining and coating) of the unit components, temperature, chemical attack (erosion corrosion), among others.
It is worth mentioning that results from different surveys conducted among FCC licensors and experts indicate that high temperature erosion of internals is also currently one of the most primary concerns in regenerator systems, typically responsible for over 40% of emergency shutdowns [133,224]. As depicted in Figure 23, an evidence of erosion is seen from mild body-through cyclone wear to severe inside-out perforations of the cyclones leading to cut off and falling off of the diplegs.
Erosion mechanisms vary from unit to unit. For cyclone separators, Chen [133] attributed high temperature, catalyst loading and gas velocity as surface erosion driving forces. Knowlton and Reddy Karri [48] asserted that due to low solids flux in the secondary cyclones, erosion rates are comparably low relative to primary cyclones, which is consistent with Chen’s earlier conclusion [133]. The explanation for this counter-intuitive revelation is that in primary cyclones, catalysts are hauled down by gravity (inertial separation) with low particle-surface impact owing to high solids flux and relatively large particle size, but with a low solid loading and high gas velocities in the secondary cyclones, a centrifugal force is induced consisting of a continuous chaotic, tailing and rotating vortex, which swirls and tangentially whips the catalysts multiple times around the cone before exiting via the diplegs in the secondary cyclones, thereby resulting in violent particle impingement and eventual higher catalyst attrition and abrasion of the cyclone wall. It is therefore obvious that surface erosion is correlated with the kinetic energy released in the process of constant particle-surface impingement. The extent of damage is also associated with the angle of particle strike; however, this varies from the type of bed vis a viz bubbling and turbulent fluidized beds.
Chen [133] also offered insights into multiple solutions to alleviating cyclone erosion, which basically include modifying the mechanical structure of the cyclone. This involves increasing the length (L/D) and cone angle of the second stage cyclone and installing a flat-disk vortex stabilizer to enhance pressure balance in the cyclone. Testing for different L/Ds with a vortex stabilizer, the cone erosion rate was significantly reduced at 5.1 L/D, suggesting that the vortex intensity was reduced and whipping of the catalysts substantially resisted. In addition, increasing the diameter of the cyclone barrel would avert the catalysts from bouncing into the vortex (Figure 24a). An about 2 cm erosion-resistant refractory lining is also recommended for cyclone internal surfaces [40]. These measures are also reported by Knowlton and Reddy Karri [48] and have found widely successful commercial applications [226].
Based on the understanding of the proclivity of long vortex in generating erosion and re-entrainment of catalyst, a correlation (Equation (13)) for estimating the vortex length at low catalysts flux developed by Bryant et al. [227] could also be used in designing cyclones.
L v D B = 2 A 0 A i 1 / 2
where Lv is the vortex length, DB is the cyclone diameter, A0/Ai is the dimensionless outlet to inlet area ratio which must be greater than 0.4 for regenerator cyclones.
Another reliable measure to minimizing high temperature erosion is to embed erosion resistant lining into the cyclone. For example, welding the interior surface of the cyclone with SS 304H hex mesh of nearly 0.08 ft (25 mm) and duly packed calcium-rich refractory material. Though this has proven beneficial to withstand erosion, the solution birthed another problem related to oxidation-sulfidation corrosion, especially in a complete combustion mode operation. Since the hex mesh bottom is exposed to flue gas and the bottom also resides in a reducing environment, the effect of sulfidation, carburization and oxidation, which contributes to refractory lining erosion, has been reported. Although there no perfect solution in the moment to refractory failure is available, there is a silver lining ahead. Close control of temperature change in relation to heatup and cooldown rates in the regenerator, good refractory anchoring (i.e., proper anchor welding, use of sturdy or ring tabs anchors and single-cell refractory), are current technically feasible measures to protect refractory linings in the air distributor and cyclones from extreme erosion. More so, Vannasing and Hulfachor [223] expounded on the possibility of using cathodic protection systems to redirect catalyst current flow on metal surface to forestall chemical erosion, however application of this approach is impractical since catalyst flow is limited to dry gas jets in FCC regenerators. Blaser et al. [228] also reported a model for measuring the erosion index (I) which predicts the extent of particle impingement on the refraction lined surfaces of any hardware components (Equation (14)).
I = P C m p 3 / 5 v p 7 / 2 A T
where p denotes the functional form of the summation of catalyst particle, p, impinging a wall surface normalized by time, T. mp represents the mass of particulate, vp represents the velocity of particle, A the area of the surface patch, T represents the normalized time, and C represents the angular coefficient which is a function of particle strike angle, the valued for different curves have been reported [229,230].
Besides the particle-surface impact, other studies have also confirmed the contribution of fluid-surface impact such as impingement on the gas outlet tube as shown in Figure 23, and bubble size and bubble wake impact as erosion sources [224]. This is not unconnected to gas volumes and fluid jet flow pattern from the air distributor. The design of the distributor nozzles has a great impact on erosion, as shown in Figure 25a. The UOP developed has new and improved Optimix (ER) feed distributor tip designs which replace the conventional borda tube nozzles with a high resistance to erosion performance. Ceramic provides the best erosion protection and feed distributors with ceramic tips across several studies and industrial reports having indicated the ability to withstand highly erosive environments with zero discernable.
Other measures to reducing erosion have been developed which vary from material design and selection to addition of inhibitors to the impingement surfaces include:
  • Design of long shrouds to restrain direct fluid jet impingement on the regenerator side walls or on the distributor plate.
  • Use of short nozzles mounted over the grid holes to induce jets flow, hence reducing fluid-surface impacts.
  • Preferably using volute inlet cyclones for highly loaded catalyst separation while tangential inlet configuration is efficient as secondary cyclones where interference with the inlet catalyst flow stream is rare.
  • Increased number of series cyclones, this has been proved to achieve over 99.999% efficiency [231].
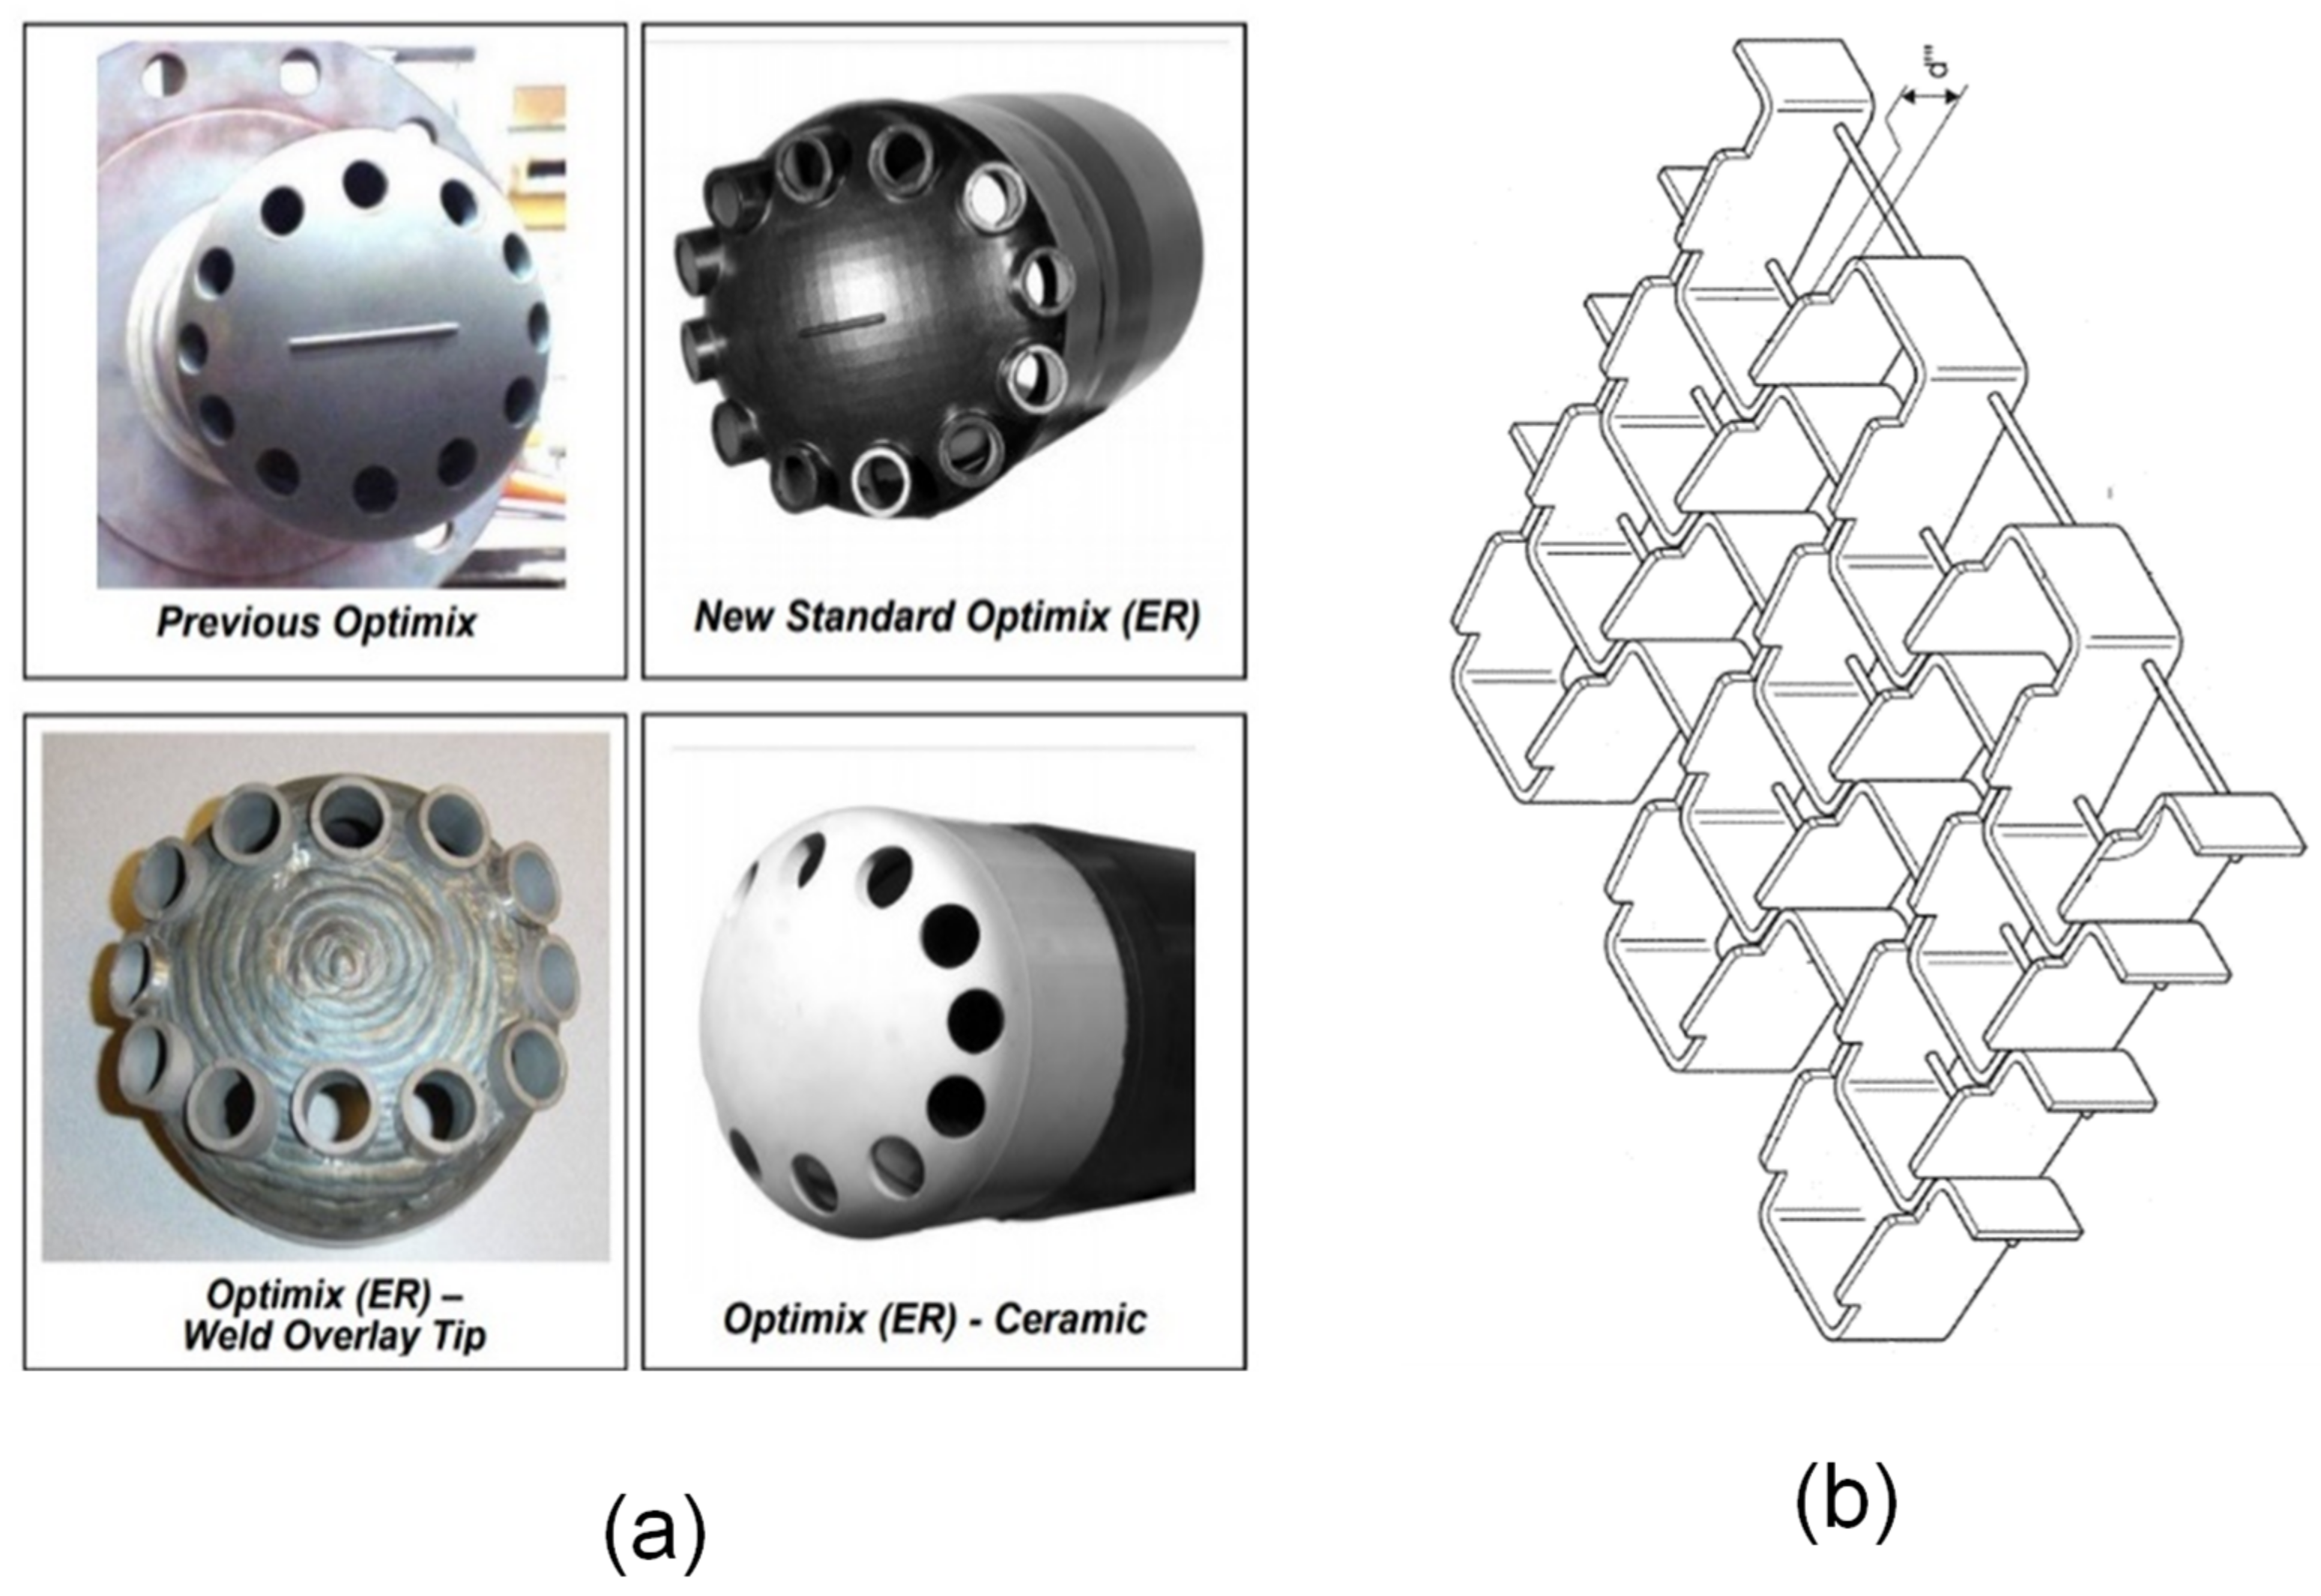
  • Cyclone walls must be smooth and coated with composite material (refractory or ceramic) held by a specially designed fastening structure (Hexmesh) made of austenitic stainless steel. This metal-matrix composite (MMC) would help lower corrosion-erosion [232]. An example of hexmesh design is shown in Figure 25b.
  • Addition of inhibitors to the coatings or primers of closed loop internals.
  • Increasing the thickness and hardness of the materials in vulnerable sections.
  • Replacement of metallic distributors with ceramic feed distributors [233].
  • Use of durable alloys such as Stellite-types for coating.
  • Coatings must be glued well to reduce delamination and lower grain boundary adhesion.
  • Reinforced material construction of bellows and expansion joint, including the use of high-quality nickel alloys, titanium and super austenitic stainless steels.
In brief, inferior material construction, excessive temperature gas mass, too low or too high catalyst bed level, sudden change in operations resulting in abrupt change in temperature, and derisory maintenance are precursors to erosion and unscheduled shutdown of the regenerator. Cyclone design with high separation efficiency and durable fabrication for severe operating conditions are recommended.
Figure 25. (a) New vs. old feed distributor tips design; (b) design of hexmesh for lining cyclone inner surface. Adopted from Decker and Simon [232].
Energies 15 02061 g025

4.3. Catalyst Losses and Countermeasures

Catalyst loss refers to the loss of catalyst particles (especially the finer and lighter solids (0–40 µm)) from the regenerator. Excess catalyst loss is a major problem facing refiners necessitating frequent device troubleshooting which not only reduces the unit profitability but also causes unscheduled shutdowns and elevated particulate emission [1]. High catalyst losses in the regenerator can be identified by: decrease in dense bed, reduction in the amount of fine content, increase in the amount of large particle sizes (>80 µm) and the average particle size, and reduction in particle mixing stability and uniformity.
Catalyst losses are caused by hardware design or damage, operating conditions and catalyst properties. These factors instigate catalyst attrition or sintering, high entrainment and elutriation fluxes, flow resistance which in turn induces high solids loss rate. Catalyst attrition occurs chiefly in the dense bed and within the cyclone of the regenerator primarily by abrasion or fragmentation occasioned by particle–particle collision and bed-to-wall impacts [234]. Attrition in the bed accounts for more than 60% of the catalyst loss while about 16% is attributed to the cyclone [235]. Catalyst loss due to attrition can be addressed by its driving factors which can be categorized into three, namely catalyst characteristics, fluidization condition, and structural parameters.
From the material properties perspective, the shape, size, hardness, texture, mechanical strength and roughness are directly related to attrition. Wu et al. [236] demonstrated that at steady-state, the attrition rate reduces with increasing catalyst size due to abrasion occasioned by mass difference. Small size solids due to their small mass and lower inertia to movement, flow very fast and are sucked into the high velocity jet directly above the distributor, resulting in their frequent and vigorous collisions, high surface abrasion and elutriation [68]. Liu et al. [237] depicted that catalyst becomes more attrition-resistant with increasing sphericity and decreasing surface roughness. However, the latter can only be achieved by lowering the iron (Fe) content in the FCC catalyst to gain lower catalyst loss rate [16]. Some of the strategies that directionally mitigates catalyst loss are:
i.
Operating solutions for catalyst loss control
The technical feasible operating options suggested in the literature for lowering the attrition and catalyst loss in the regenerator are the following:
  • Superficial gas velocity and gas composition. Decreasing superficial gas velocities will reduce solid carry-over (entrainment) in the regenerator [238,239]. With increasing Ug bed expansion rises, the velocity of large diameter bubbles increases, leading to forceful eruption and rupturing of bubbles at bed surface. Vertical drag on the solids in the freeboard also increases. These result in high entrainment and in turn high catalyst loss; the solid carry-over rate is proportional to Ug to the power of 3 to 4.
Experimental evidence shows that the addition of helium gas to the fluidizing gas decreases entrainment. Increasing the concentration of He in the combustion gas at superficial gas velocity below 1 m/s reduces both the gas density and viscosity but raises the circulation rate [240,241]. However, these studies were conducted at ambient conditions; more research is needed at industrial regenerator operating conditions to validate these claims.
  • Particle size distribution (PSD): Keeping the fine particle (0–40 µm to 14–20% will reduce catalyst loss [16]. Although high amounts of fine catalysts promotes high fluidization quality and combustion efficiency as its acts as a lubricant for ease of gas–solid flow, it is also a cause of high entrainment [68].
  • Catalyst inventory. The catalyst bed level must be maintained in the regenerator by monitoring and controlling catalyst flow density rate and pressure drop above the gas distributor. A high catalyst circulation rate or catalyst loading directionally increases solid loss in and from the FCC regenerator [199,241].
  • Pressure and temperature. Decreasing the operating pressure reduces the gas density and in turn increases solids terminal settling velocity and then results in a reduced entrainment rate, transport disengaging height (TDH) and solids loss rate [242]. Nonetheless, this only applies to a specific pressure range [242]. Regenerators are operated at elevated temperatures and the influence of temperature on catalyst loss is complex because the temperature affects other factors discretely. While some researchers obtained a decrease in entrainment rate and attrition at lower temperatures [243], some found the opposite trend [244], and others even argued temperature to be independent of the solids carry-over rate, albeit at a narrow temperature range [63]. These can be attributed to many variables (gas density, viscosity, cohesive or drag force) that contribute to spatiotemporal distribution of temperature in the device [63,196,240,241,245].
ii.
Regenerator hardware solutions for catalyst loss control
The design and mechanical integrity of the regenerator internals are critical in realizing low catalyst loss: [246].
  • Cyclones: Geometry of cyclones has negligible impact on attrition rate and catalyst loss rates [247]. Holes in the cyclones and cyclone plenum, and extremely large dipleg diameter reduces cyclone efficiency and recovery rate of catalyst particles and in turn promotes high catalyst loss. Multiple cyclone pairs depending on regenerator capacity (15–22 pairs for 40 m diameter regenerator) could reduce solid loss rate but at the expense of higher maintenance cost and system complexity. Increase in cyclone pairs will also reduce catalyst loading to the cyclones and lowers attrition rate. Holes in the cyclones must be detected early via the pressure loss measurement. The diameter of cyclone dipleg should also be adjusted to the entrainment flux rate [248].
  • Column wall lining: Refractory lining of regenerator reinforced by hex-steel must be in a good condition to reduce catalyst flow restricting at the wall which tends to elevate selective carry-over of catalyst fine particles as the center of the bed [13].
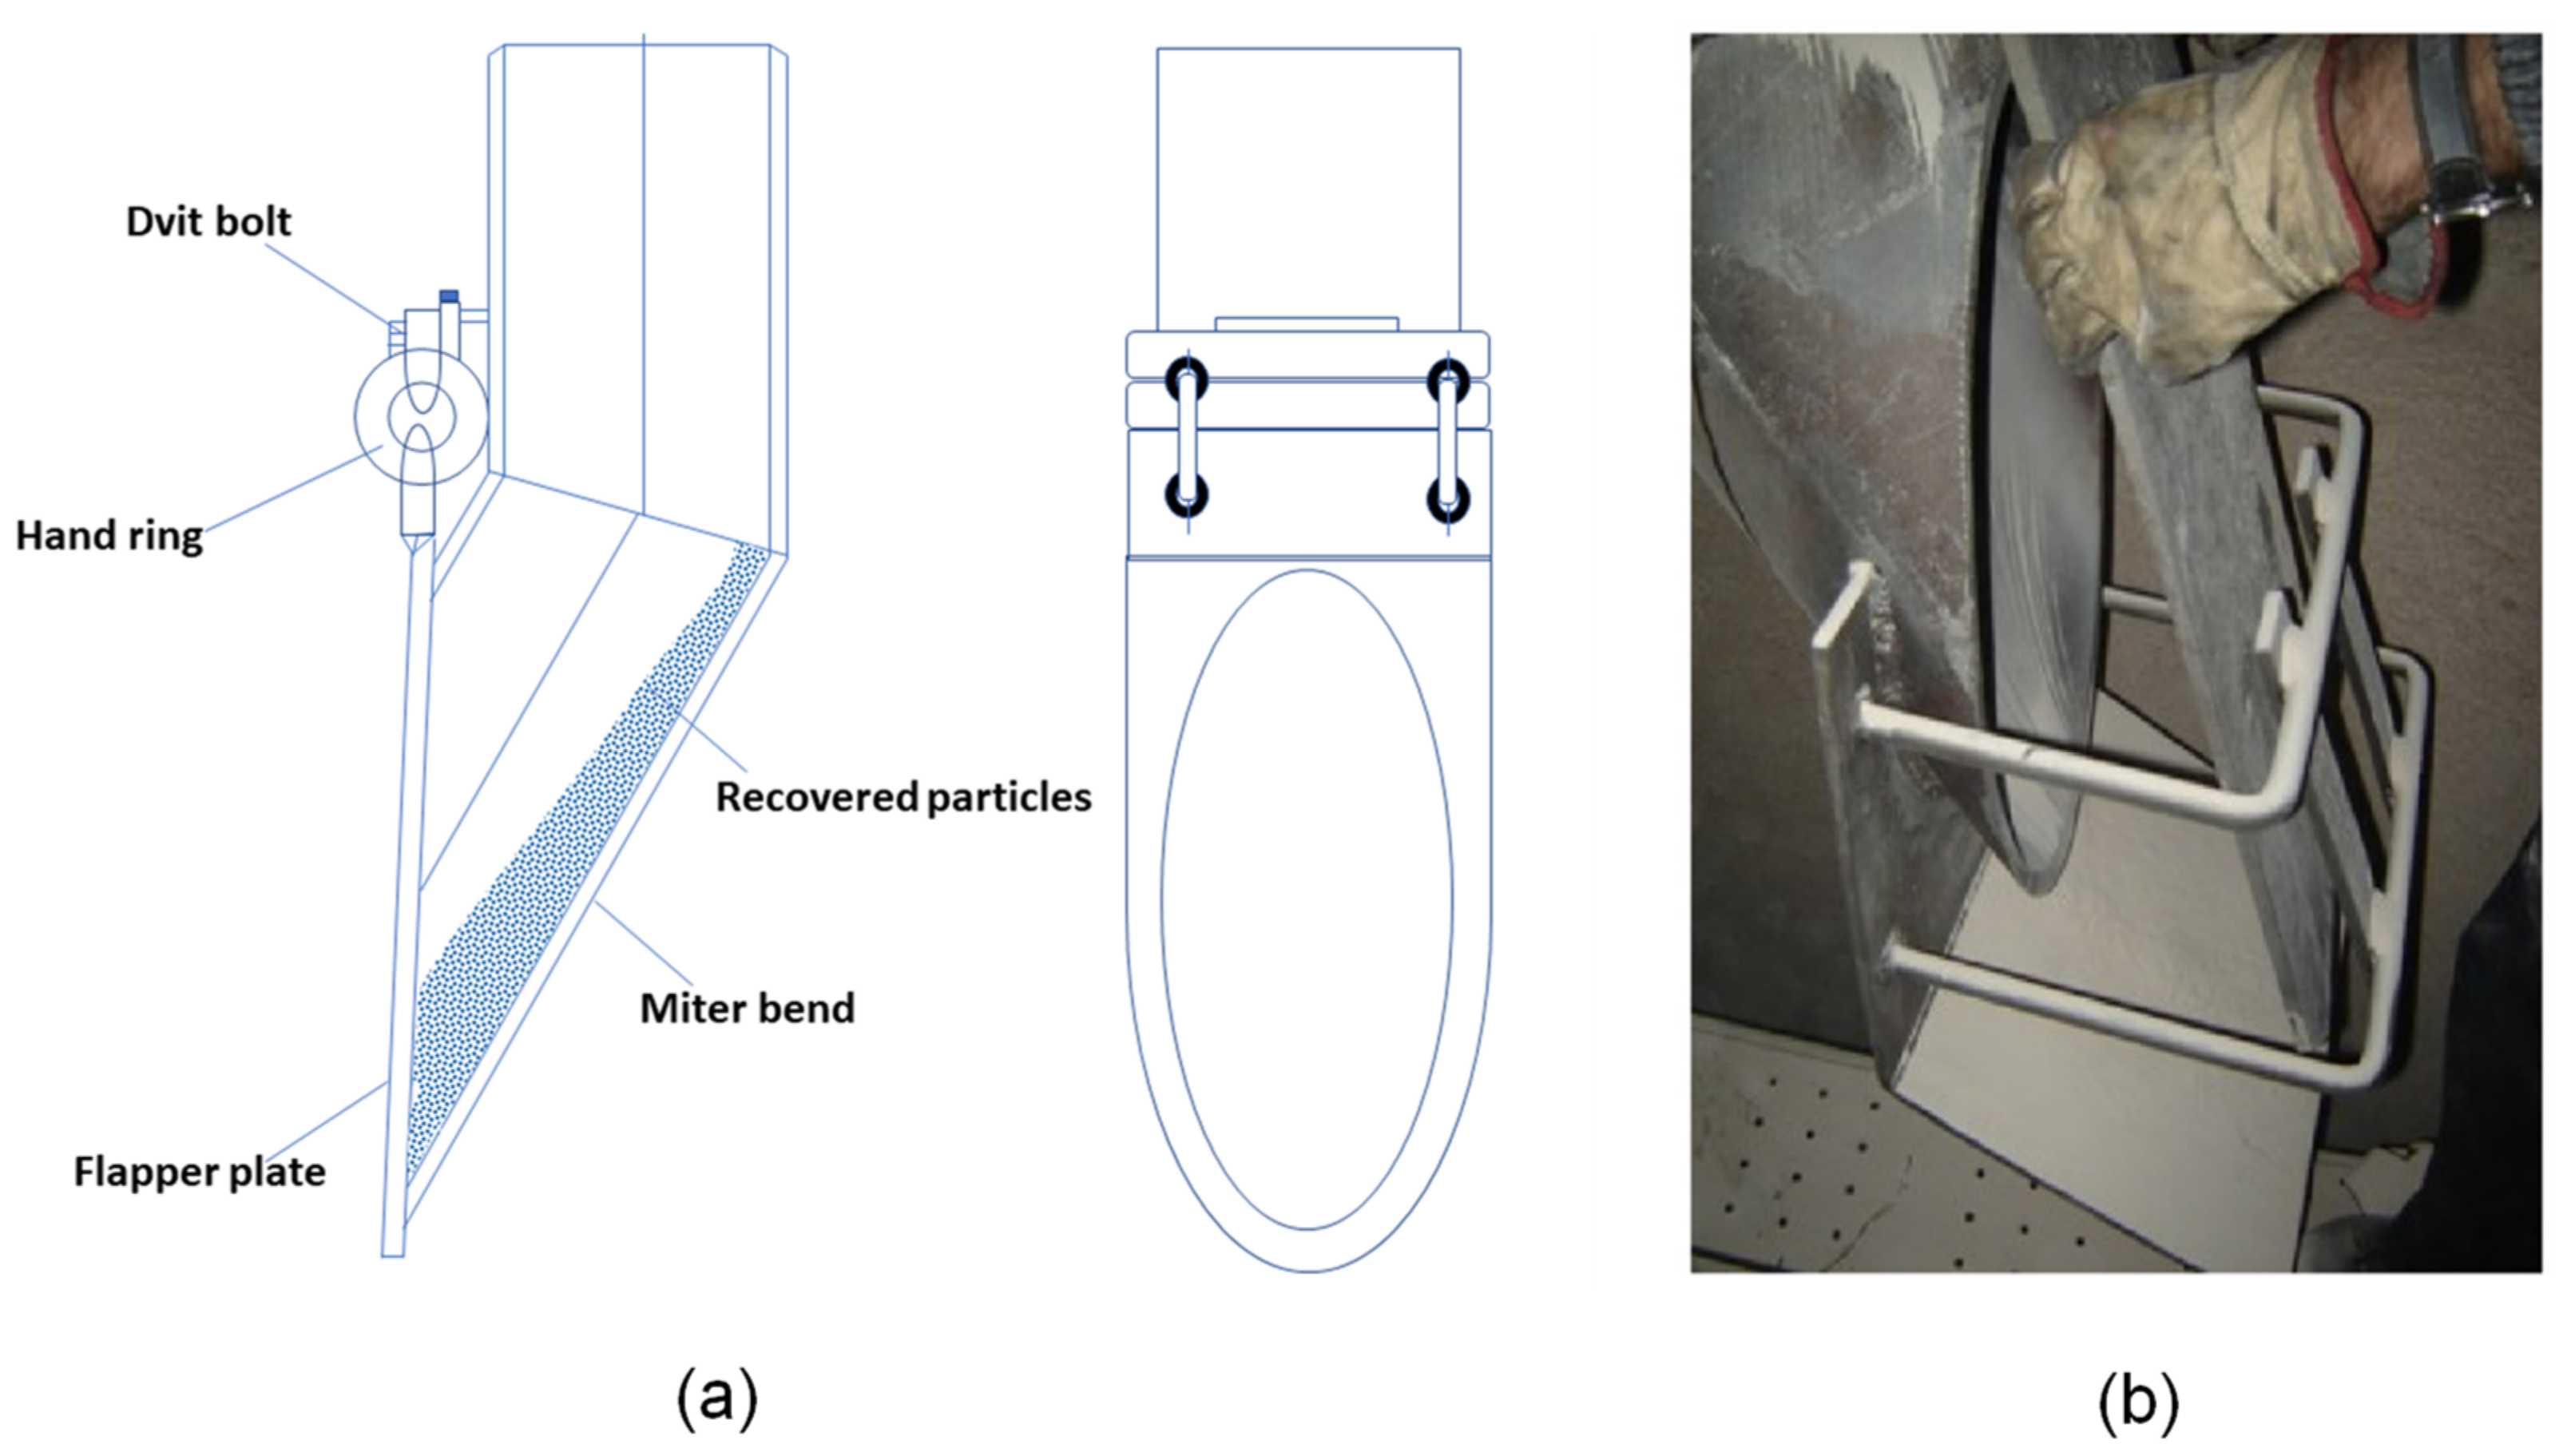
  • Trickle valve: Submerged dipleg-trickle valve (Figure 26) often attached to secondary cyclone diplegs must be designed with erosion-resistant flapper surface. Defluidzation of catalyst underneath the submerged trickle valve can result in defluidization of cyclone diplegs, catalyst flow reversal and high catalyst loss rate, which must all be avoided [249].
  • Gas distributor. It is imperative to attain a relatively uniform distribution of fluidizing gas through the regenerator. Any faults of the air grid have been found to generate a poor spatial gas distribution [157,238] and can consequently raise the catalyst loss rate. Orifice parameters (design, number, diameter, flowrate, etc.) must be attrition-resistance; in fact, the solid attrition rate is linear to grid jets kinetic energy ρ g × U h 2 . By implication, the attrition rate will increase when the pressure rises at a fixed orifice velocity. In theory, raising the gas temperature would lower the attrition rate, but, in reality, a strong supplementary consequence of thermal shocks may be triggered. Additionally, the attrition rates in vertical and radial jets are comparable; nonetheless, abrasion is 5–15 times greater with downward jets. An empirical correlation was developed to quantify the attrition rate instigated by gas jets in multiphase flow reactors as follows [2].
    η = 7.81 × 10 7 α β d h 1.131 U h j 0.55 ρ j U h j 2 1.635 U g U m f U m f 0.494
    where dh is the diameter of the orifice, Uhj is the orifice interjection velocity and ρ j is the gas density orifice. α and β, respectively, account for the influence of the particle characteristics and nozzle geometry, while U m f and U g are the minimum fluidization velocity and superficial gas velocity, respectively.
  • Spent catalyst distributor. The spent FCC catalyst should be well and evenly distributed across the catalyst bed to minimize the catalyst loss rate as discussed in Section 3.2.
  • Geometry and enlargement of freeboard cross section. Catalyst loss due to entrainment becomes important when the column diameter (Dc) is greater than 100 mm with a linear relationship. Increasing the height and expanding the diameter of the freeboard section could dampen the region gas pressure, reduces gas velocity and attenuates the velocity of entraining solids, leading to an increase in terminal velocity and lower catalyst loss rate [68,238,241].
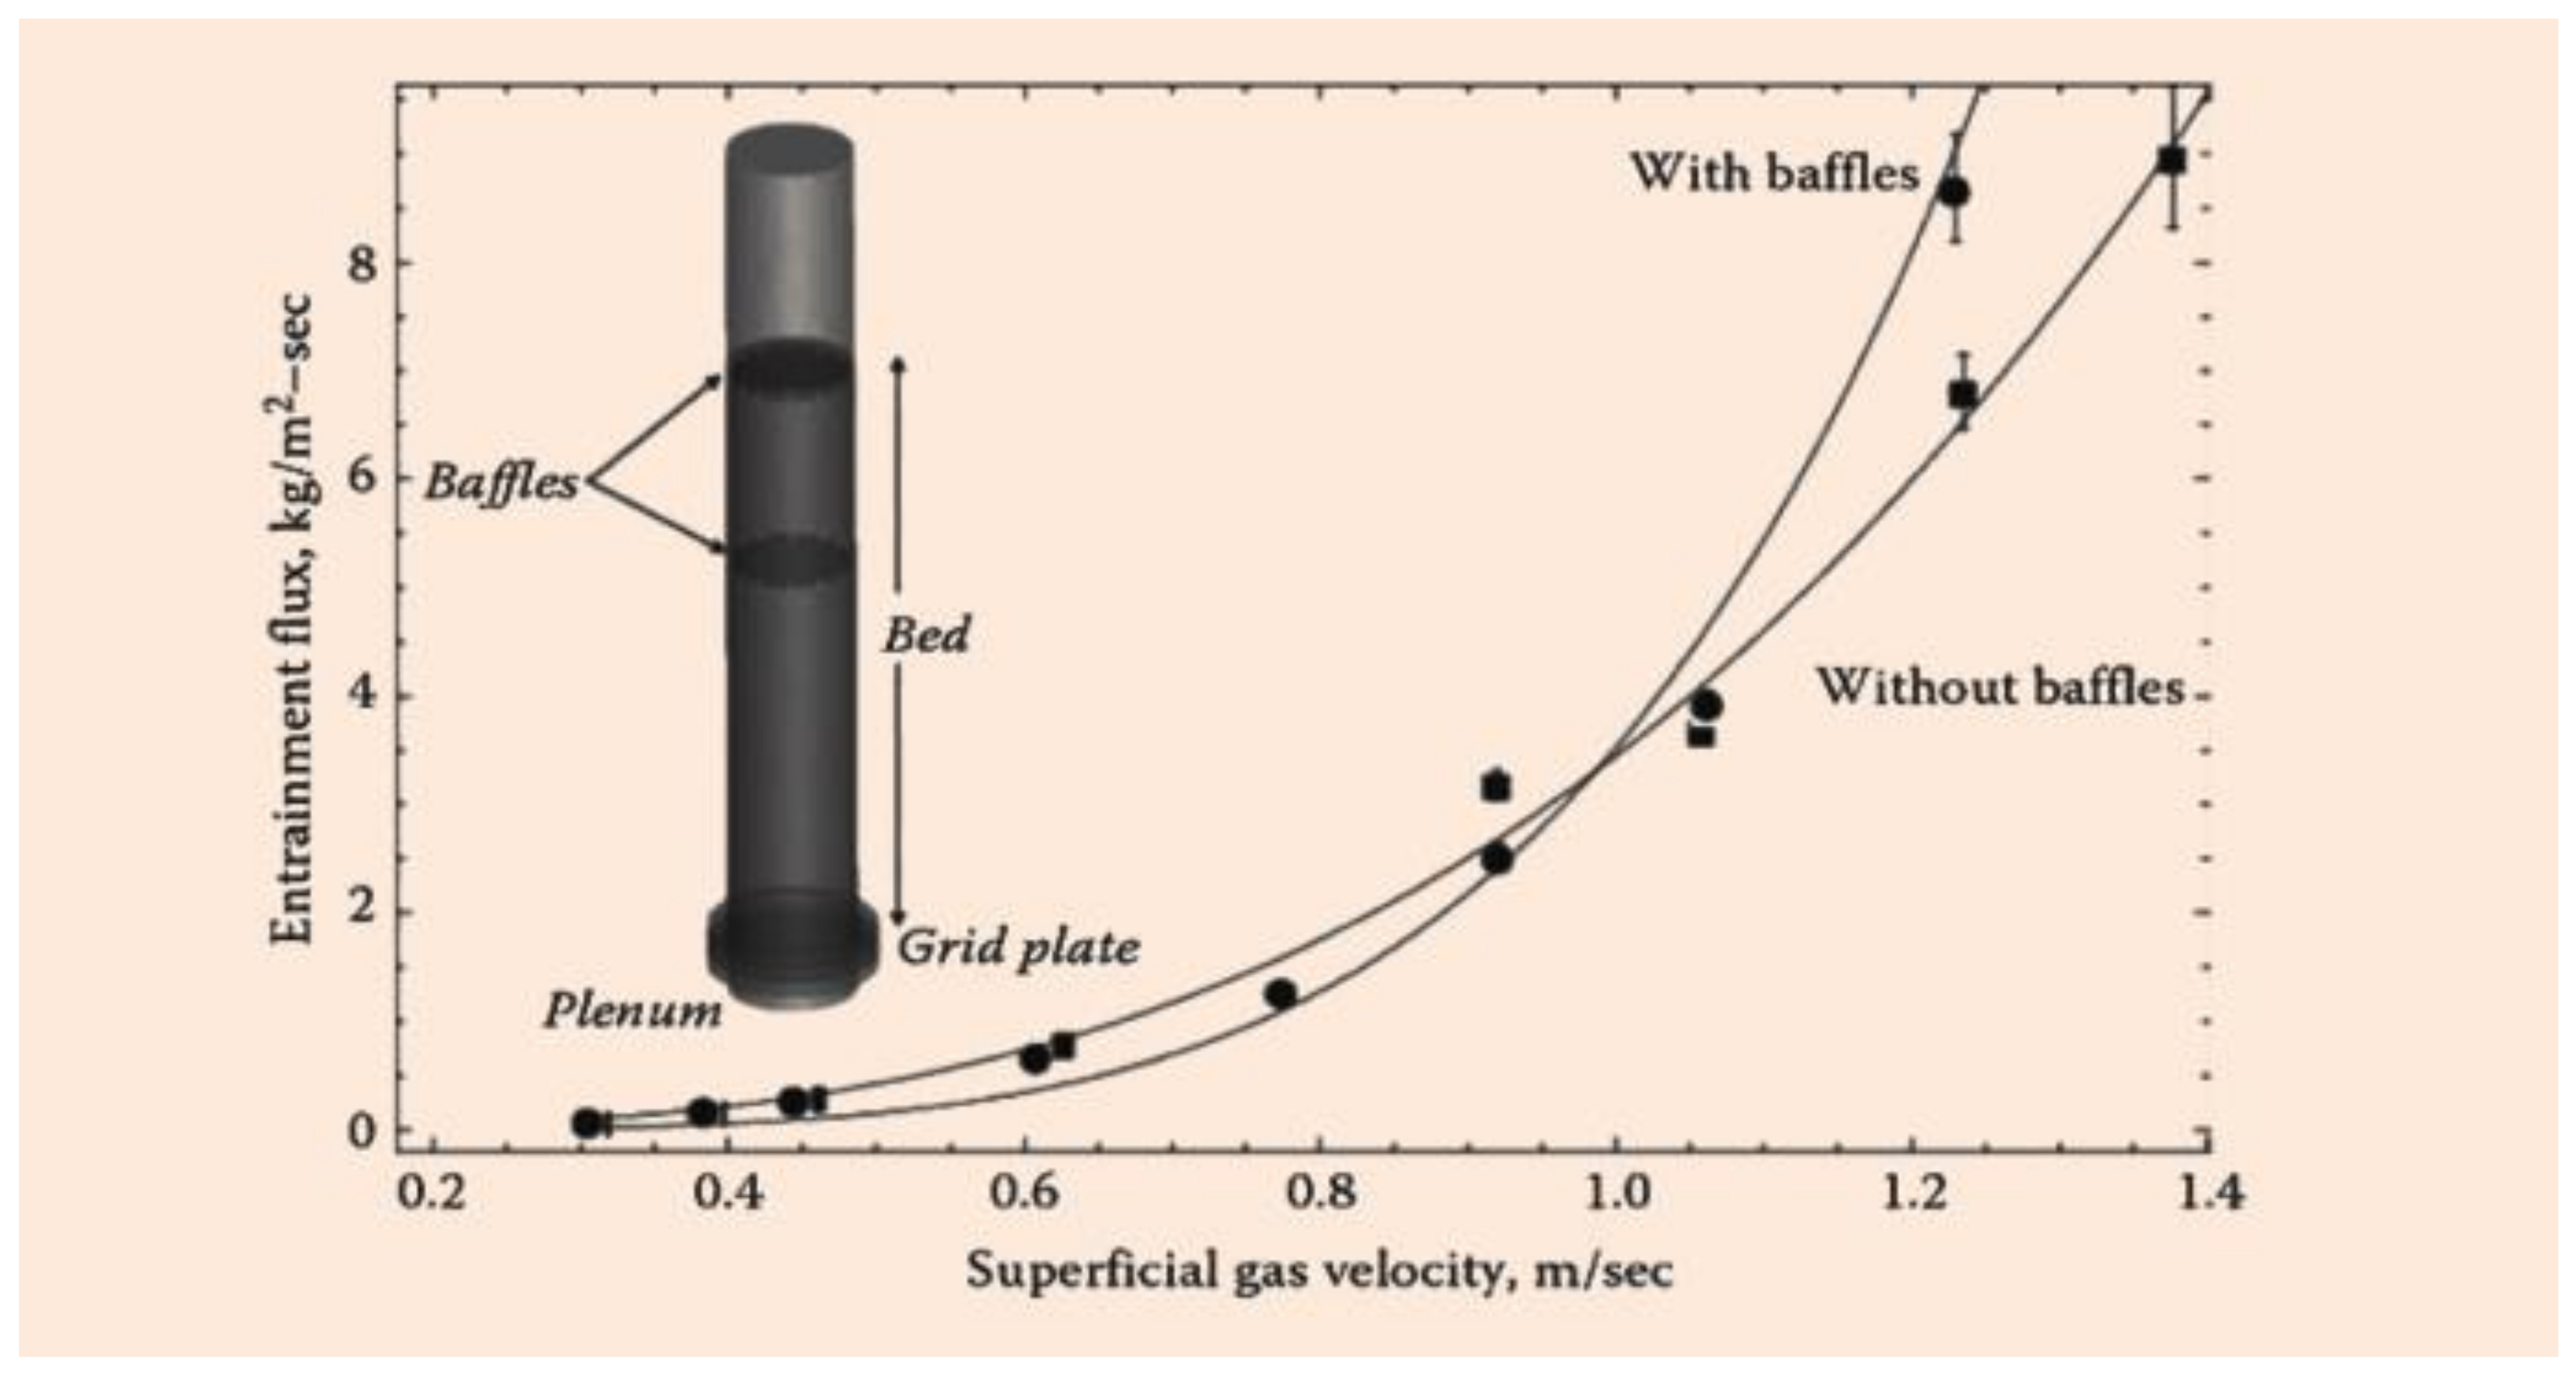
  • Installation of internals. Properly installed internals such as baffle and heat exchangers can also mitigate the catalyst loss by reducing entrainment flux in addition to their discrete primary purposes [250]. However, they can also trigger a rise in the fluidizing gas velocity [68]; thus, care is required in their design specification and operation as discussed in Section 3.3.
External considerations for reducing catalyst loss from the regenerator include prevention of shutdown of ancillary devices (electrostatic precipitator (ESP) and CO boiler) and adjusting catalyst flow rate from the reactor, among others. However, it is worth mentioning that catalyst loss is time-dependent; therefore, some of the above measures must be prudently matched with critical points in the regeneration process. Other than mechanical faults, nonsteady-state or start-up time represents the peak of catalyst loss rate with a corresponding highest attrition rate. Thon et al. [235] showed that the catalyst loss is highest in the first 40 days of industrial operation of an FCC regenerator, after which the mass fraction of fine catalyst equals the mass fractions of larger particle sizes, which indicates the loss of catalyst fine in the dense is compensated by the attrition of larger solids at steady system operation.

5. Environmental Issues

Increased knowledge of the environmental footprint of chemical processes has prompted the increasing demand for transformational change in refineries emissions. Irrespective of the design and size of FCC regenerators, the process of regenerating coked catalysts produces flue gases (including criteria particulates (0–20 µm size), CO, SOx, NOx and Ni compounds) and without an effective cleanup process available, they are emitted into the air at elevated levels. The FCC unit typically produces 50% of the total emission in a refinery, but comparatively significant progress has been achieved in reducing discharged pollutants concentration in the last two decades, as seen in Table 8. Nonetheless, in the face of the current pursuit of a net-zero emissions economy, ever-increasing stringent environmental requirements, and an influx of heavier crude oil, regenerator processes must be further intensified to increasingly reduce stack emissions.

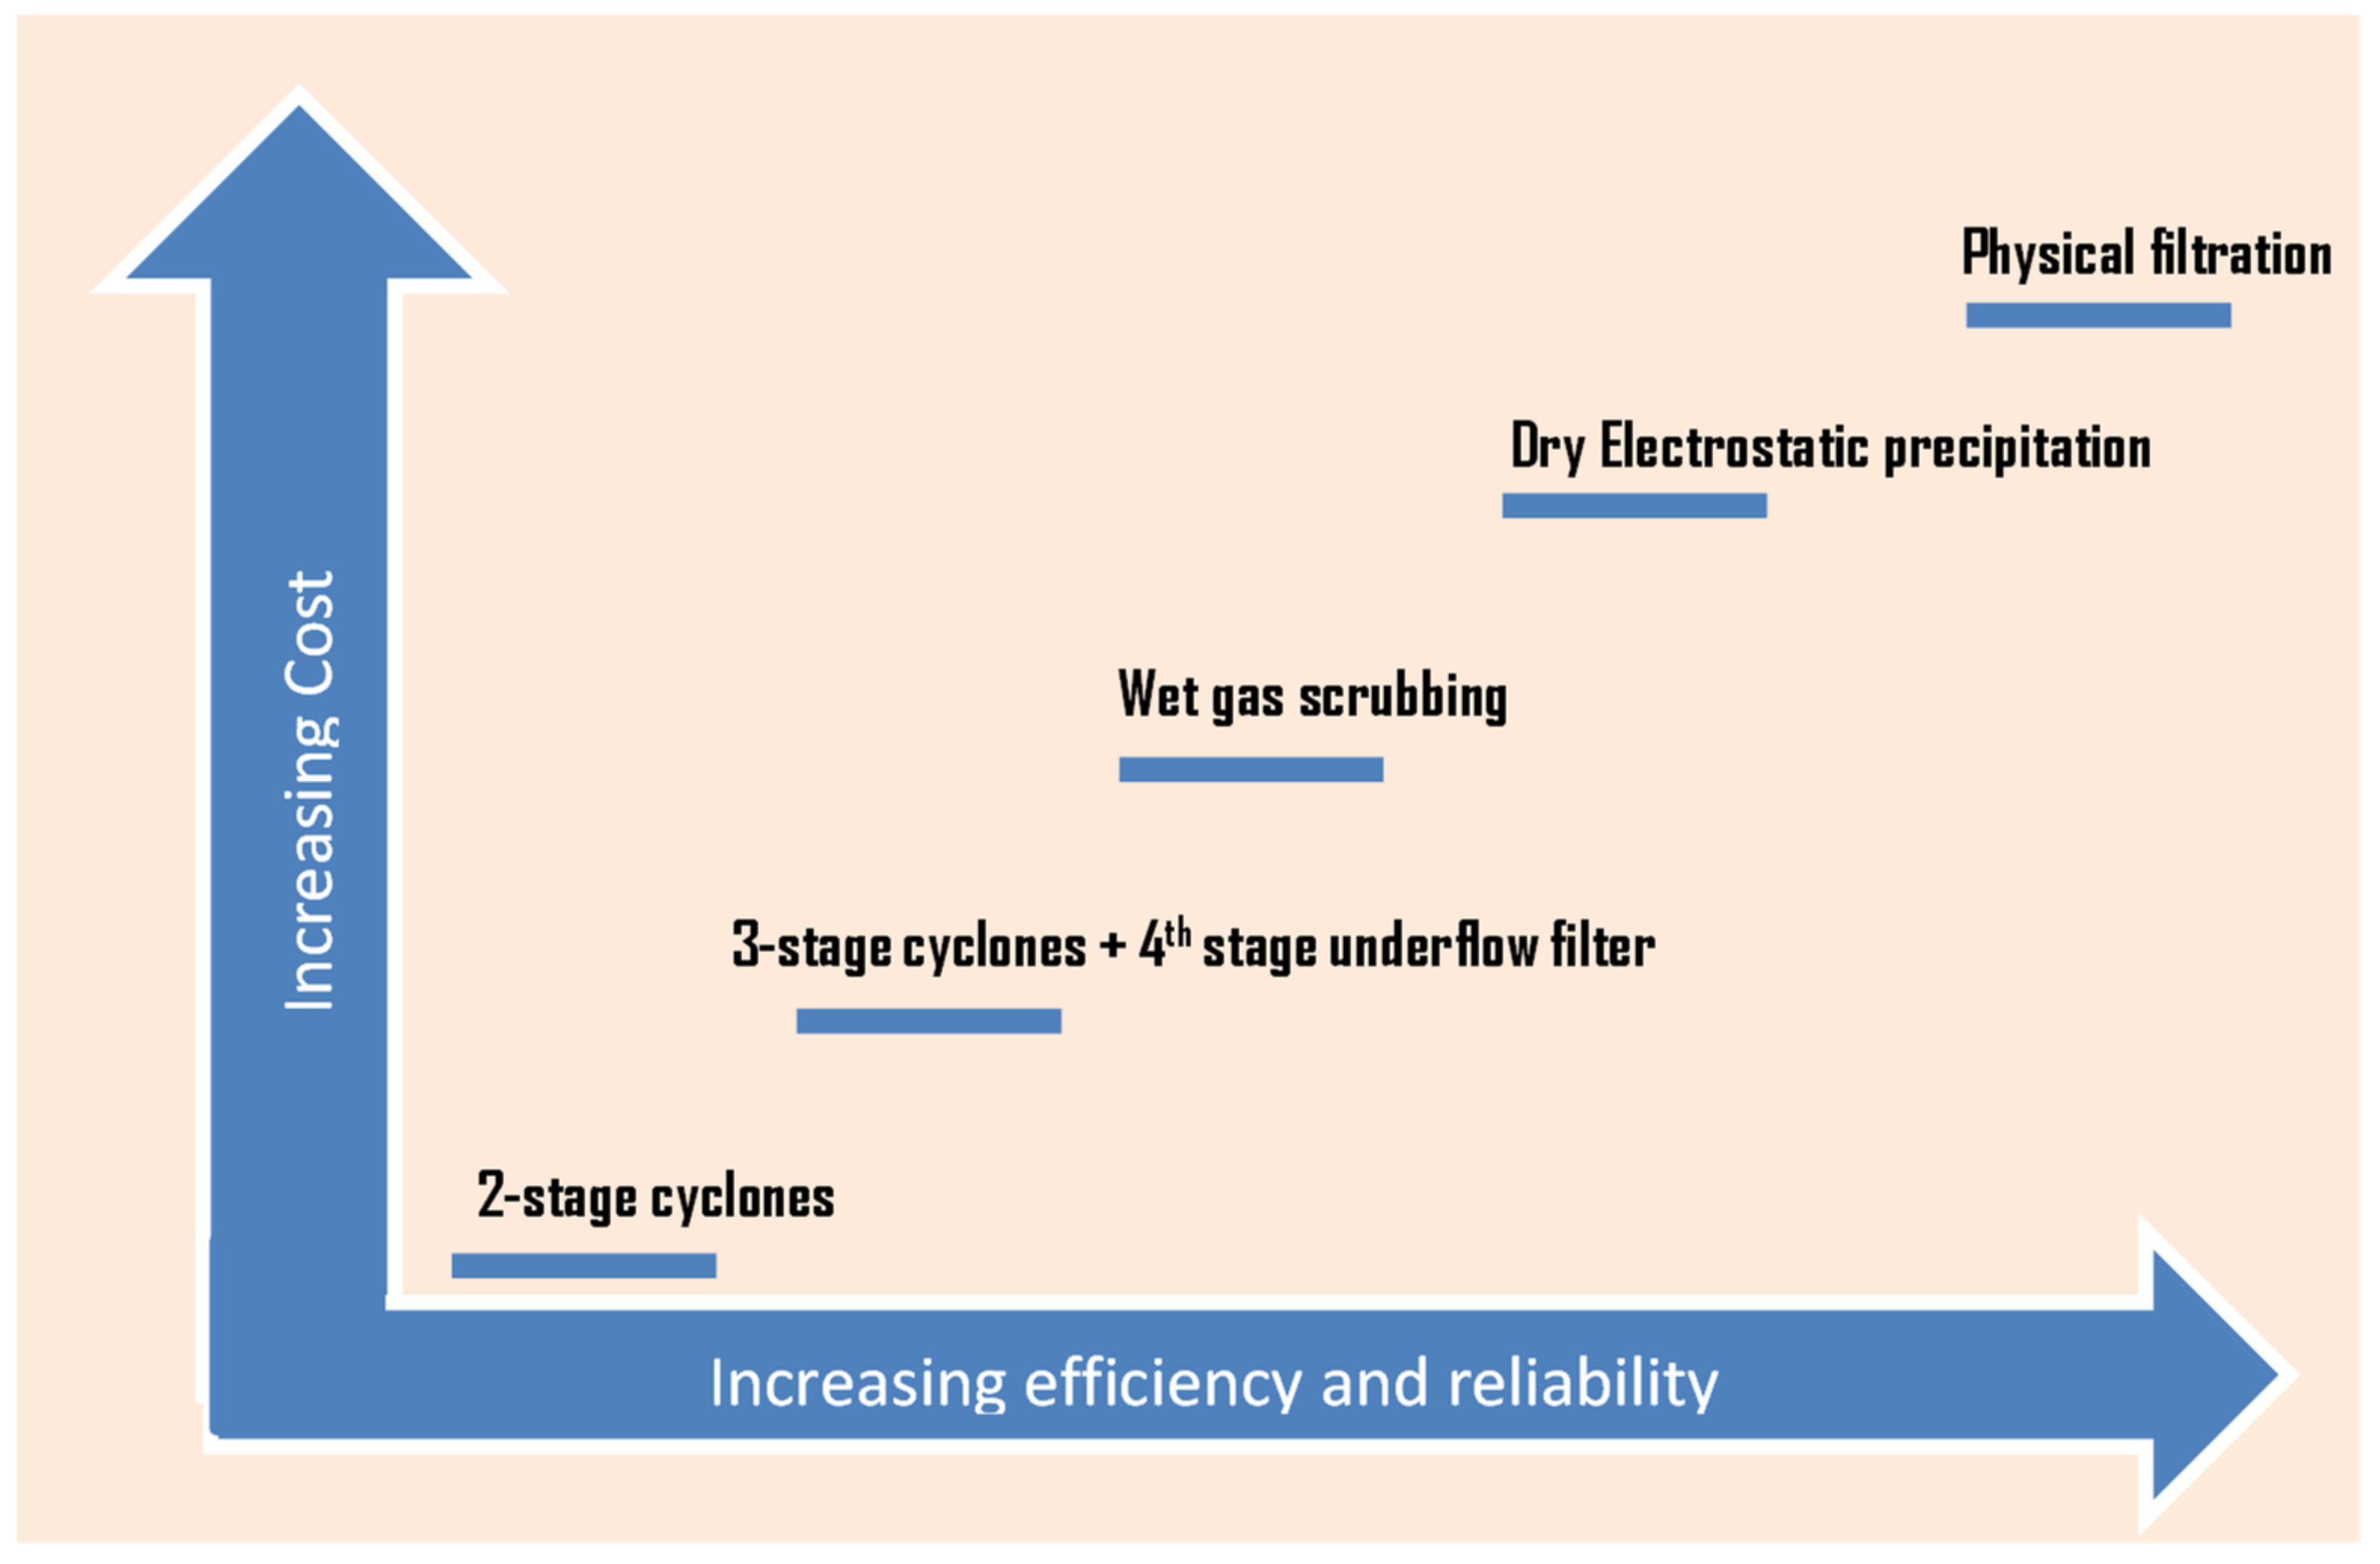
5.1. Process Intensification for Particulate Matter (PM) Reduction

Catalyst dust is also known as fine dust or PM bound in the flue gas leaving the regenerator exit stack. They could also become obnoxious fugitive PM emissions during regenerator turnarounds and periodic withdrawal of aged catalyst or making up for losses discussed in Section 4.3 [14]. They are carcinogenic due to the presence of nickel in the catalyst, making it a chemical health hazard. The regenerator is the highest emitter of PM in a refinery. Emission requirement for criterion small particulates (FCC fines, particularly PM10) depends on the governing regulating authorities and the refiners, but a common PM legislation is based on the amount of carbon combusted in the regenerator. In essence, for every 1000 lb coke combusted only 1 lb of PM or less (an equivalent of 95–125 and 80–500 mg/Nm3 for US and EU, respectively) can exit the FCC regenerator [252]. Stricter concentration of 50 mg/Nm3 has been reported elsewhere [252], and futuristically might further dip to 10 mg/Nm3 before 2050.
Adverse operating conditions (such as gas surges at start up and upset circumstances), catalyst attrition due to fracture and abrasion (<50 µm particle size) and equipment malfunctioning (e.g., cyclone separator erosion or electrostatic precipitator ground fault), catalyst flow reversal, and cyclone inefficiency are flashpoints for high particulate emission [129]. Key conventional control optimization strategies include: the use of efficient flow systems alongside anti-surge device, switching to high efficiency regenerators, adopting wet flue gas scrubbing system, installation of third-fourth stage cyclones (TSS) and utilization of dry electrostatic precipitator (ESP).
i.
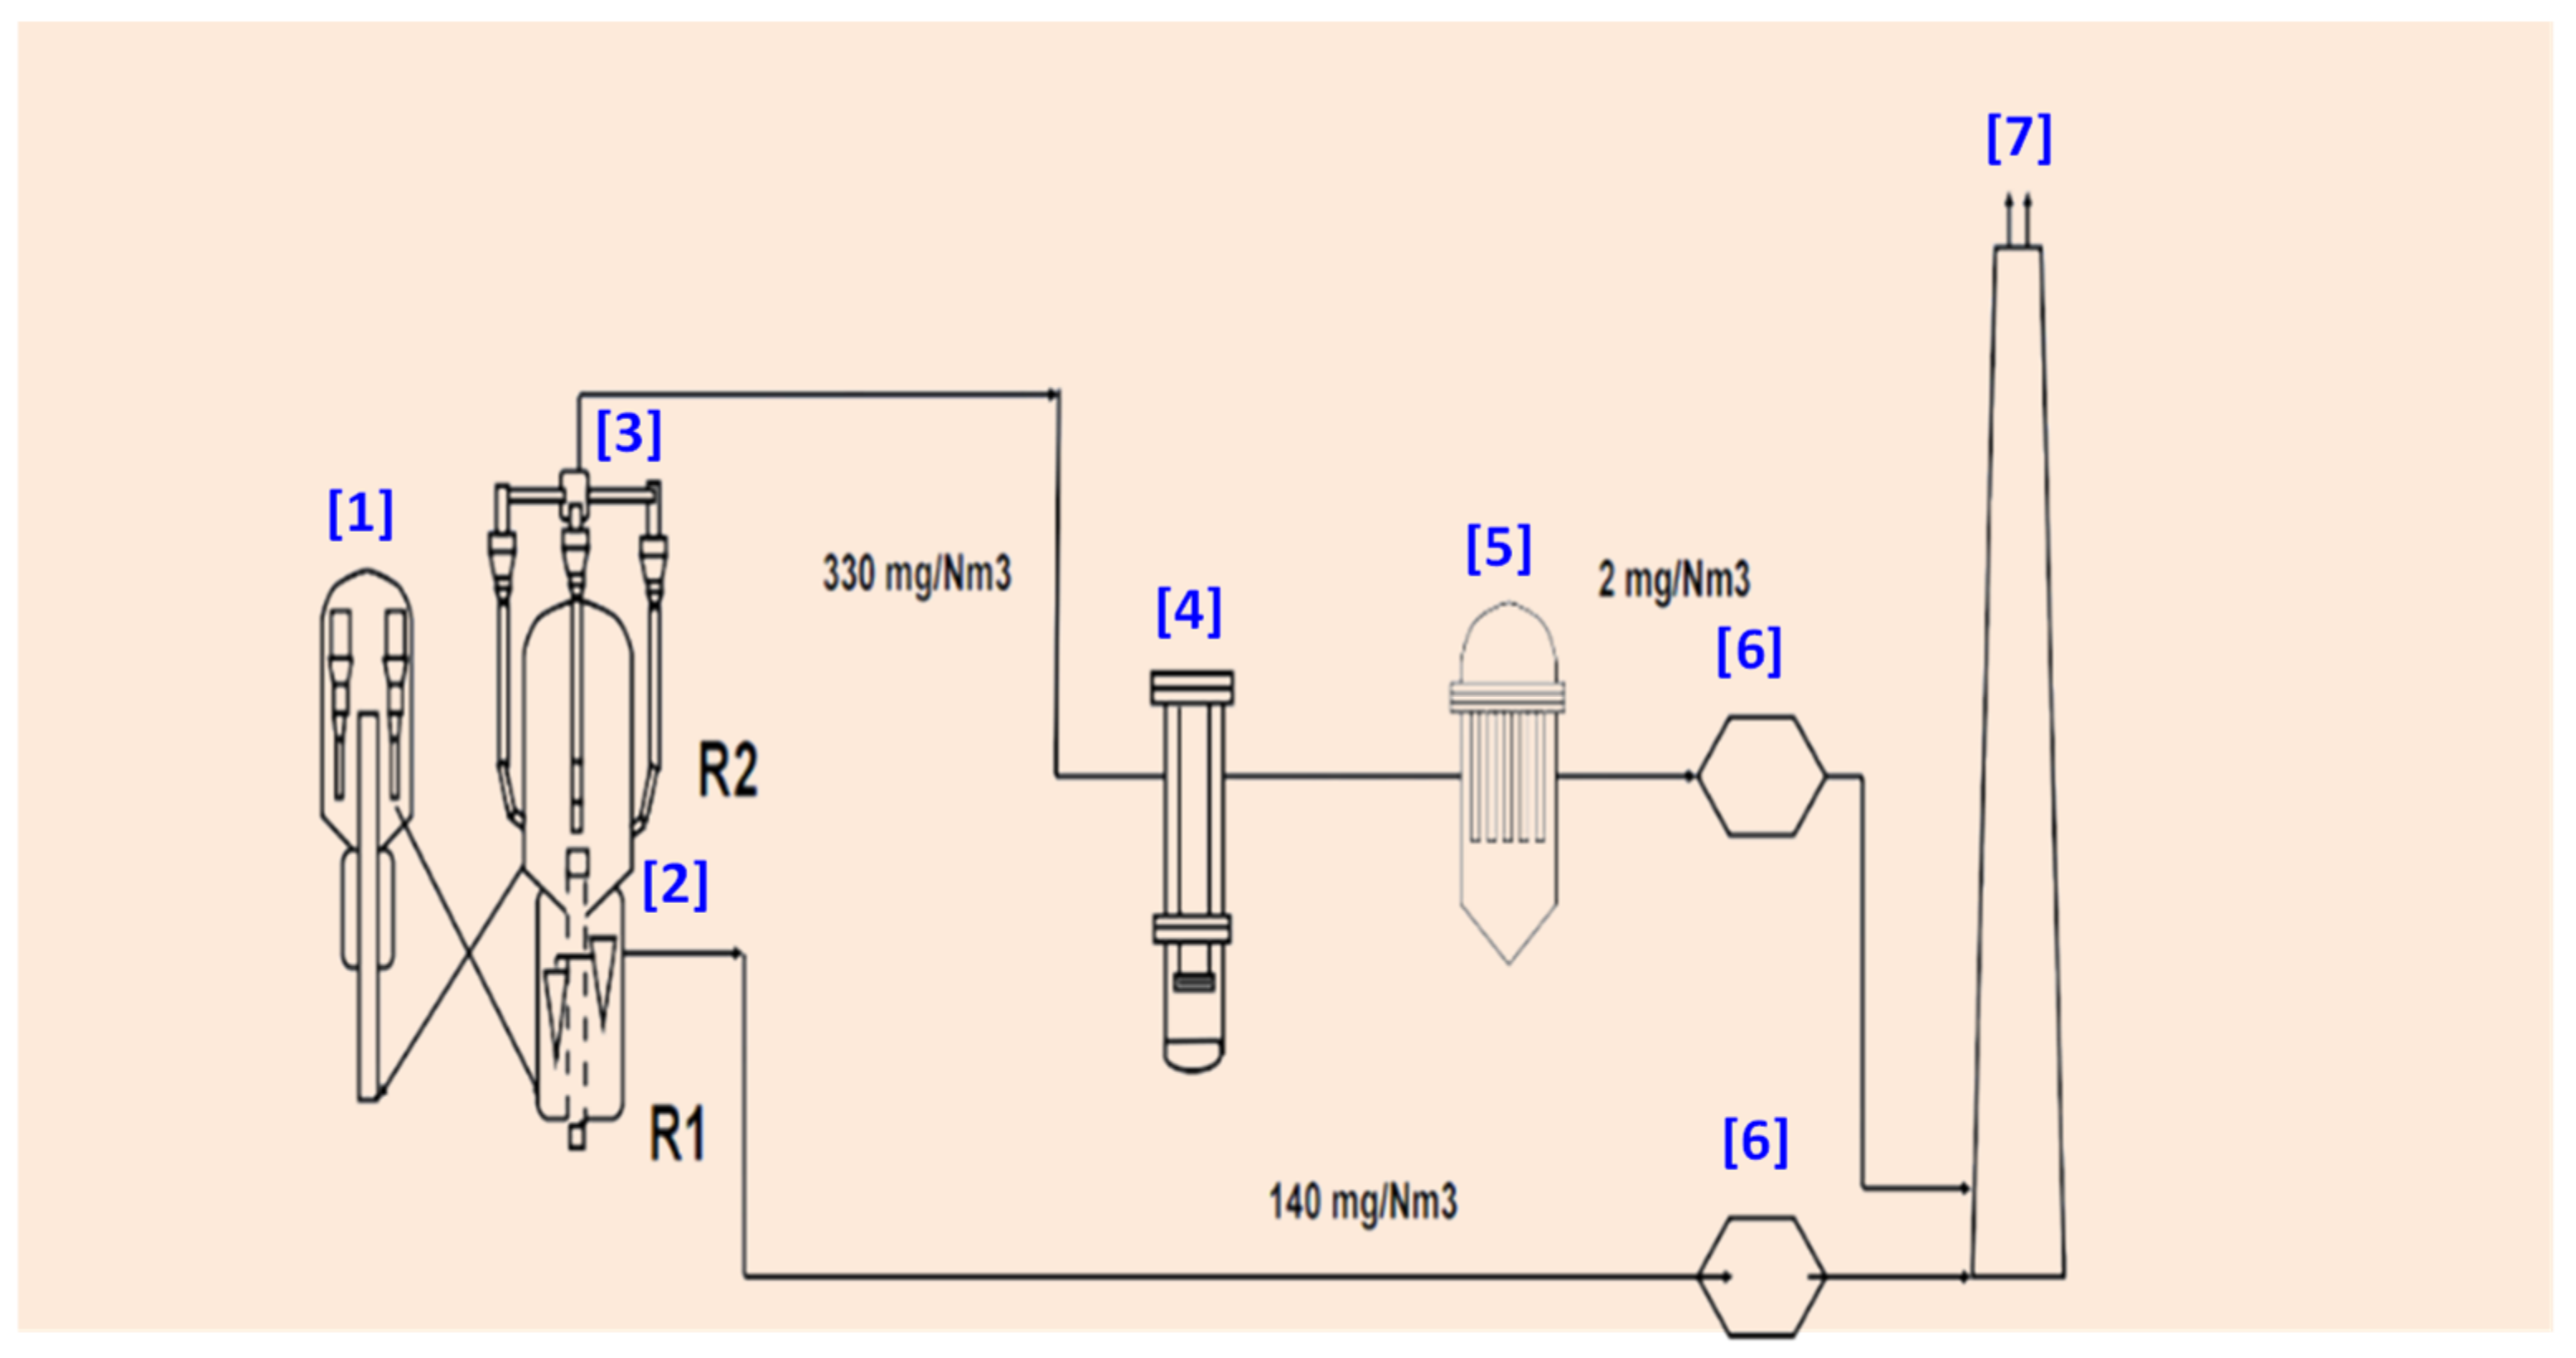
Third-Stage/Fourth-Stage Separator
While two-stage cyclones can achieve 99% separation efficiency of solid catalyst, the particulates still escape into the flue gas streams. The concentration of particulates exiting two-stage regenerator cyclones ranges from 0.05–0.15 grains of solid per actual ft3 (gr/acf) of effluent flue gas which exceeds the standard emission legislation. One newer and more effective removal option that has been devised is multiple stage cyclonic separation which could be large-diameter cyclones or small-diameter third-stage cyclones attached with 4th stage underflow filter. It can reduce the stack particulate level to 50 mg/Nm3 [45]. The performance and viability of these designs, however, depends on the number and diameter of cyclones, inlet solid PSD, uniformity of flue gas distribution, cyclone velocities, etc.
ii.
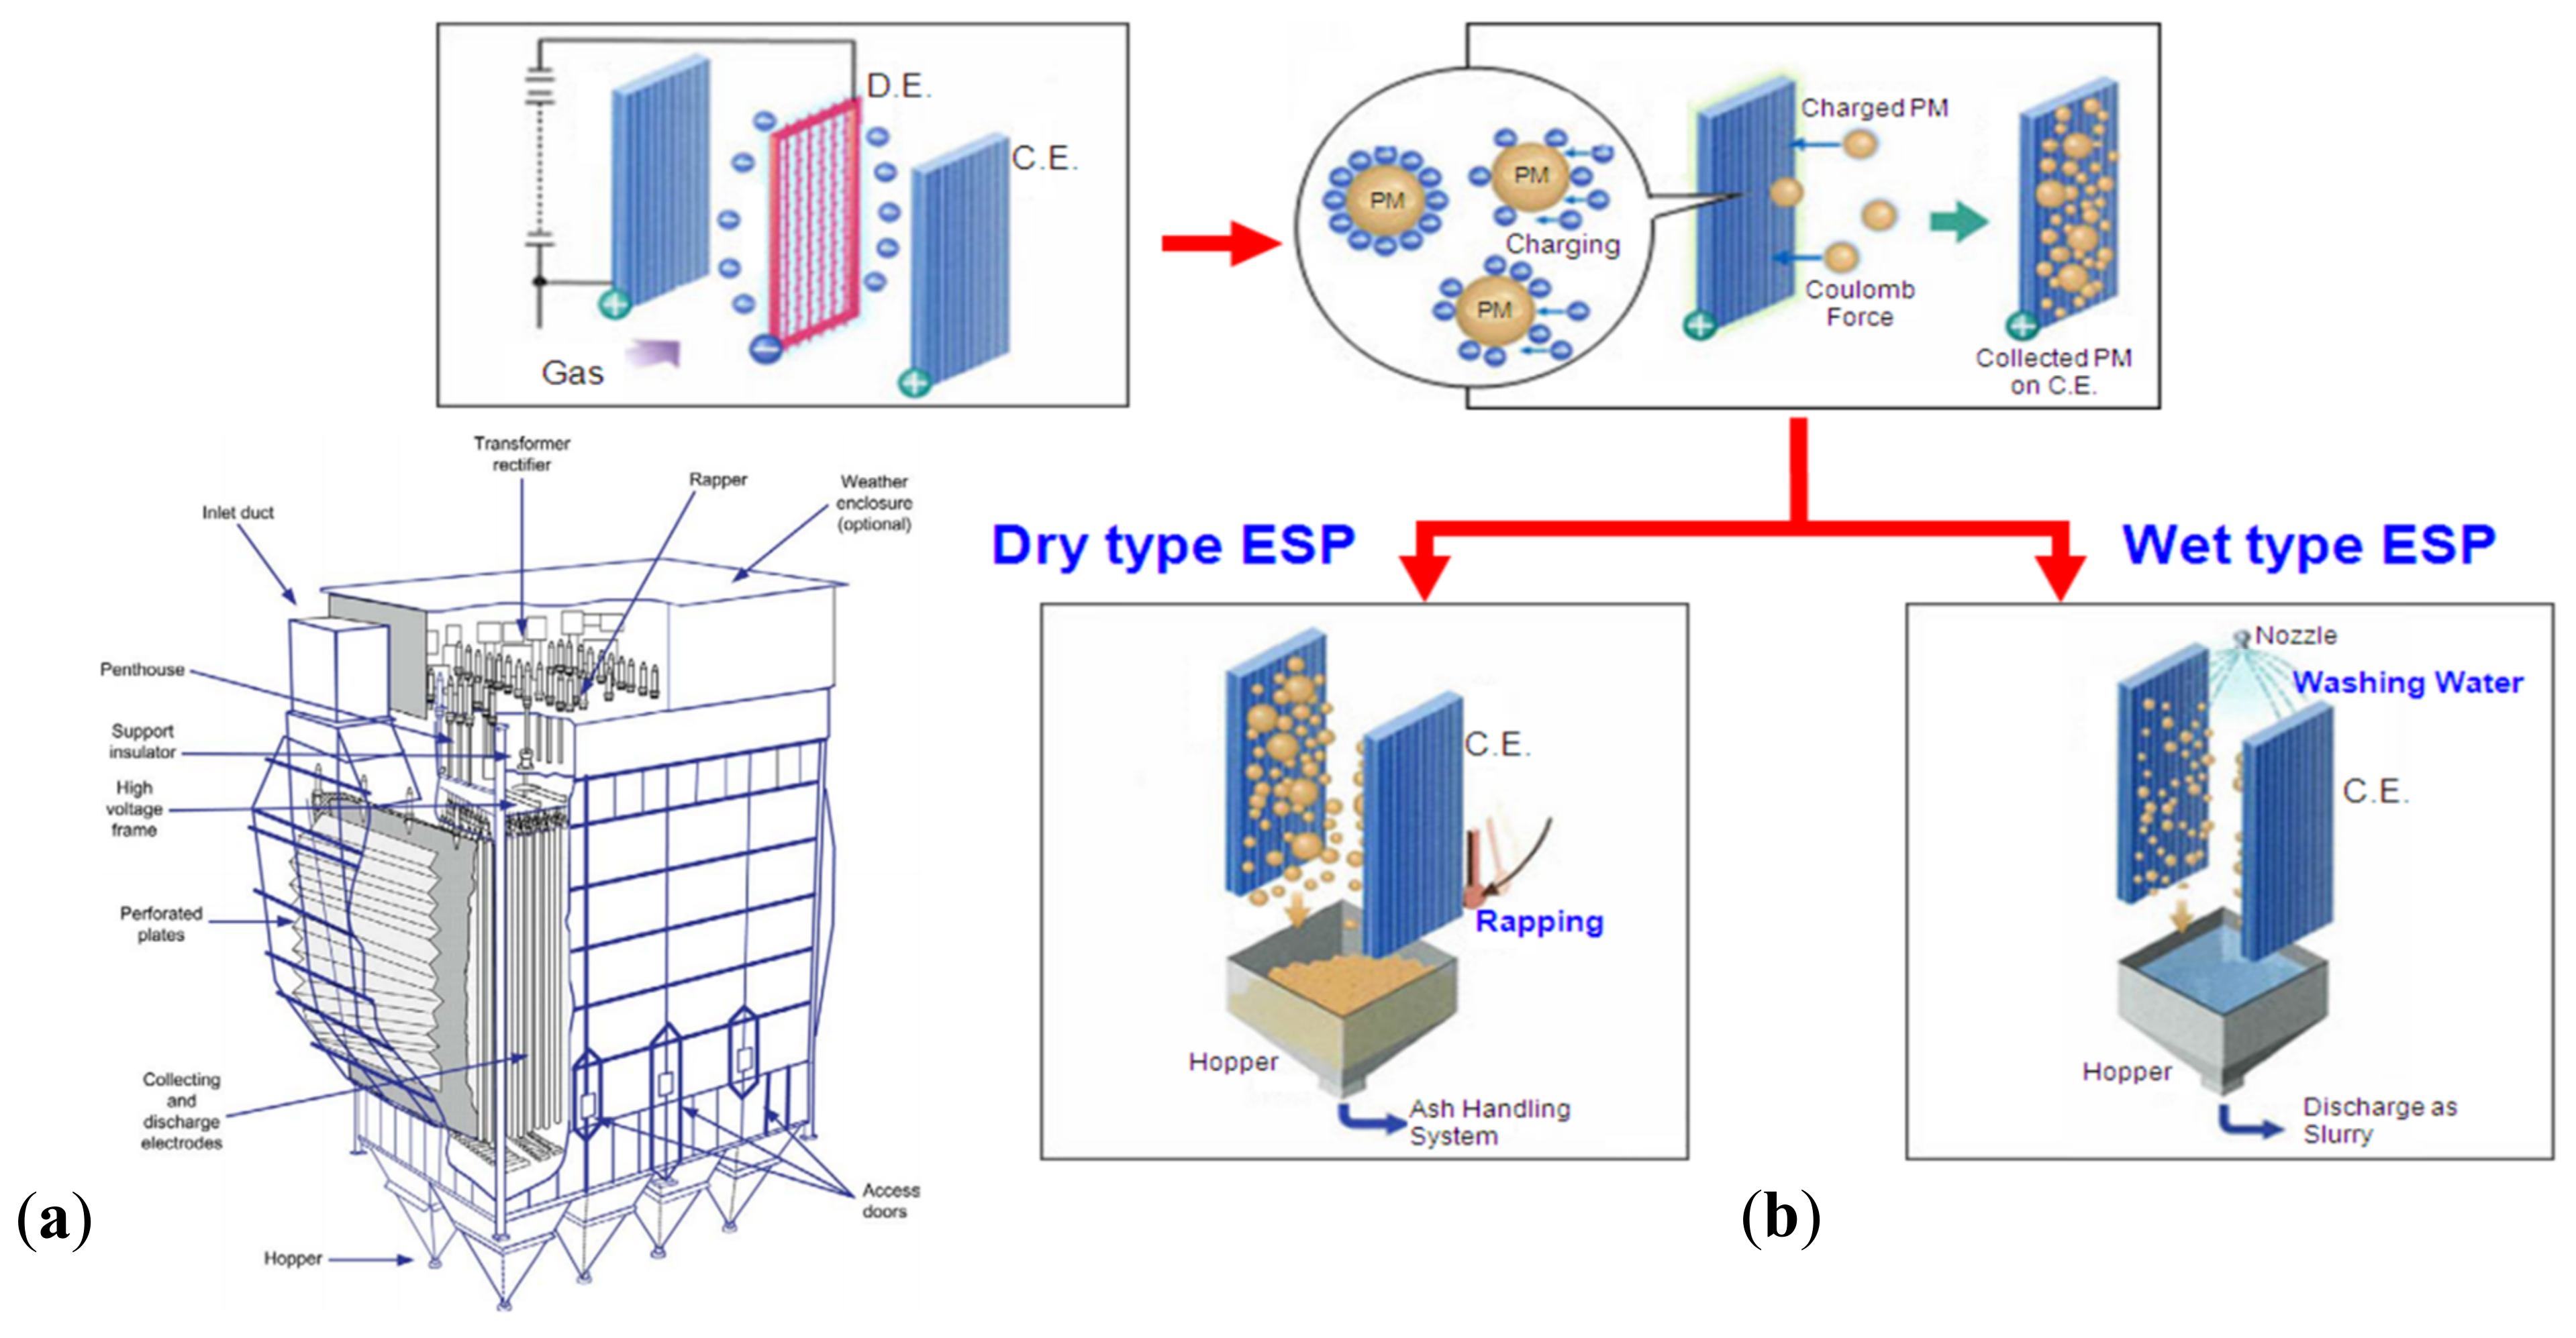
Dry or Wet Electrostatic Precipitator (DESP or WESP)
ESP operates on the principle of separation by electrostatic precipitation to collect particulate matter transported from the FCC regeneration process (see Figure 26). An ESP typically has high catalyst dust collection efficiency and operates at low pressure with relatively low operating expenses (OPEX) and capital expenditures (CAPEX) [253]. In general, it utilizes high-voltage electrodes to pass a negative charge to the entrained catalyst powders in the flue gas, which are attracted and deposited on the positively charged plates where they are periodically collected into the hopper; for DESP, the collection is gravitationally induced by the impact force of mechanical rapping, while in WESP, washing water removes the dusts at low flue gas temperature conditions. The recovered waste catalyst fine is known as electrostatic precipitator catalyst (Epcat).
The collection efficiency of ESP is a function of catalyst fine resistivity; the latter depicts the degree to which powders are receptive towards electronegative charging. The major factors that contribute to lesser powder resistivity include: high moisture content, high mixture inlet temperature, NH3 injection, high concentration of carbon, rare earth and metals on the fines, etc. Fine festivity influences electrostatic precipitator loading which in turn limits coke burning in the regenerator. The DESP is well-favored owing to high flue gas temperature tolerance, but it is often difficult to collect ultra-fine particles of high electric resistivity [254]. Although WESP is ineffective under high gas temperatures, it offers some exclusive advantages, especially operating at a much higher gas velocity and zero accumulation of Epcat on electrodes courtesy of water spray or running water washing; hence, no attenuation of performance is witnessed due to back corona. This is consistent with an experimental finding where 99.2–99.7% collection efficiency of nanosized catalyst fines was achieved by WESP operated with fine water mist [255].
Nagata et al. [256] disclosed a novel vertical-flow-type WESP effective for PM2.5 removal; the unique invention difference from the conventional horizontal type-WESPs is the use of alternate high voltage system in collecting powders both on the positive and negative electrode plates (see Figure 27). This is one of the latest progresses on the development of efficient ESP. The performance of WESP has been widely covered with consistent conclusion of high and stable particulate removal performance [253,254,256,257,258]. The key parameters (i.e., spray nozzles, electric field solution, fluid-droplet flow, and electric field) influencing WESP performance were investigated by Guo et al. [254]. Their simulation results proved that hollow cone spray in WESPs provide a better droplet collection efficiency than solid cone spray; the droplet collection rate is also strongly influenced by the electric field. It is also worth stating that feeding of liquid spray alters the gas flow conditions in relation to temperature and humidity, which intrinsically influences the electric field and catalyst dust charging; however, the full understanding of the fundamental mechanism by which is performed is still elusive.
iii.
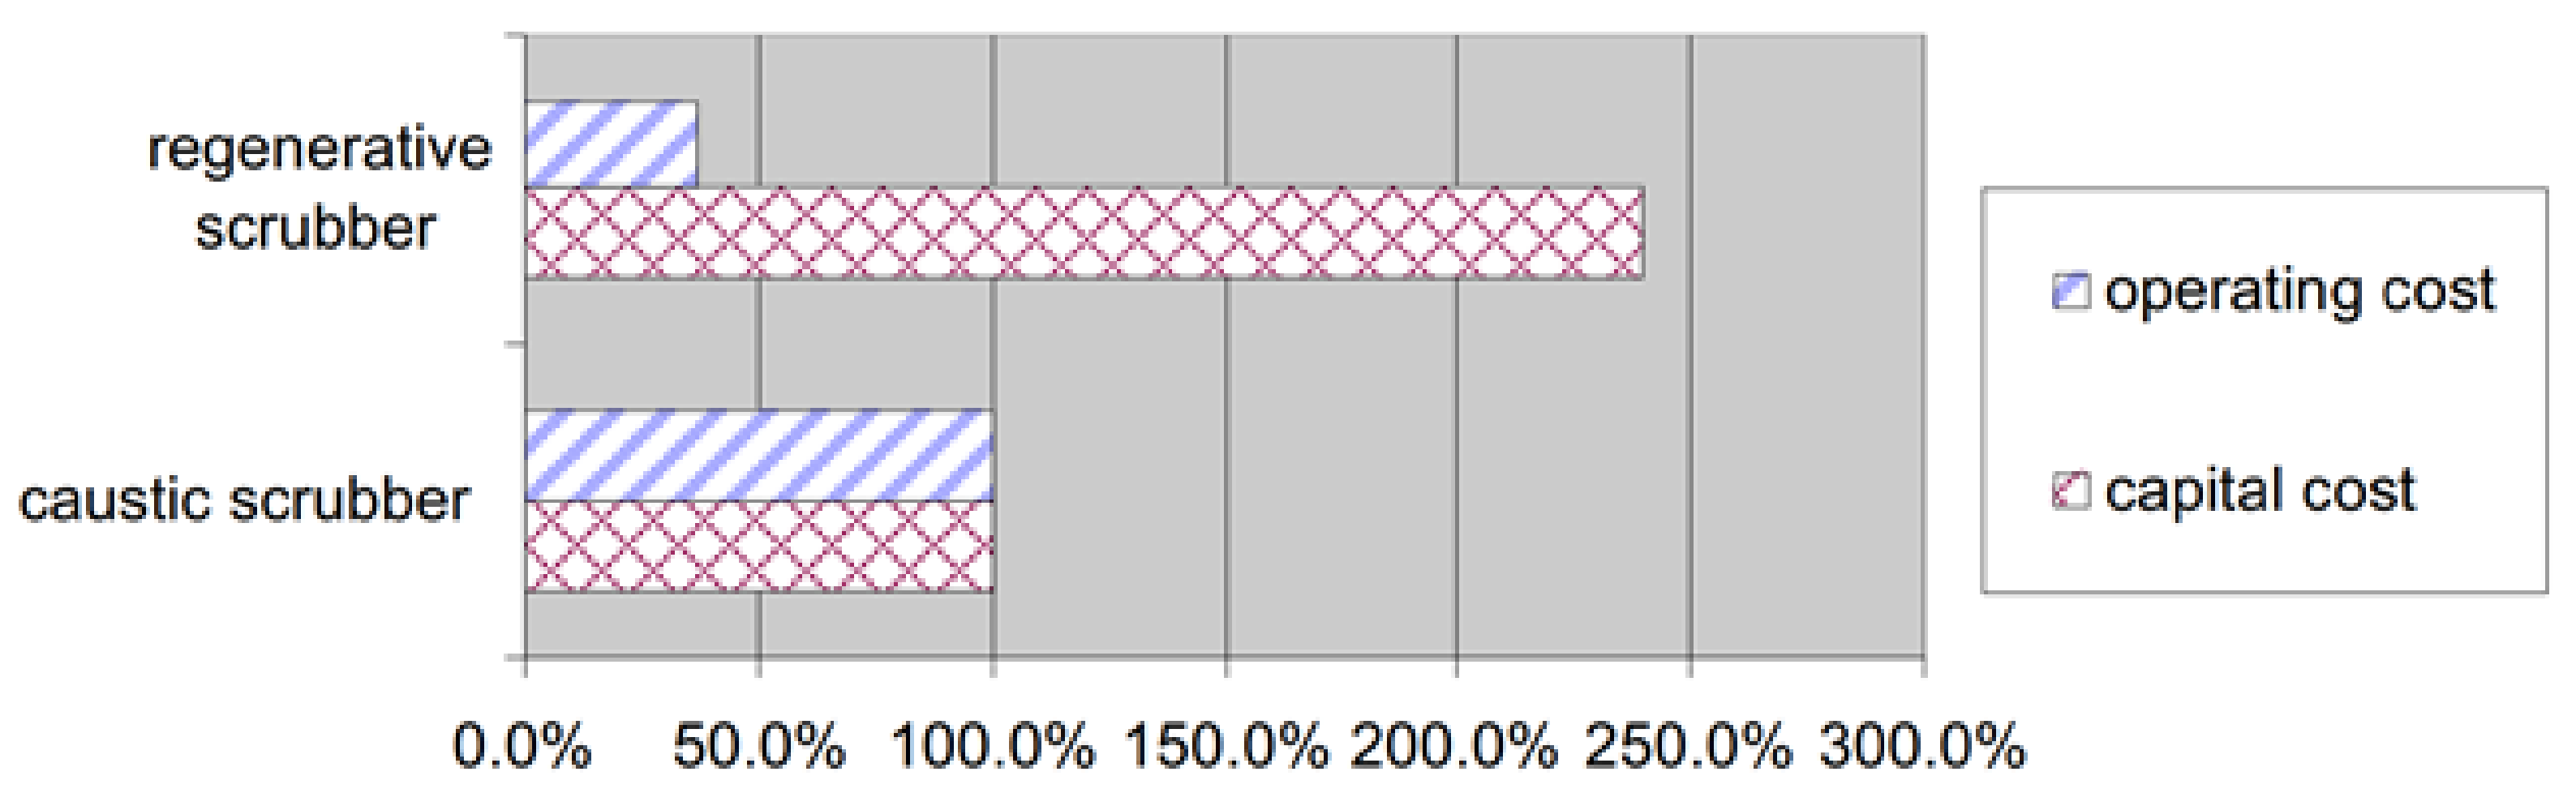
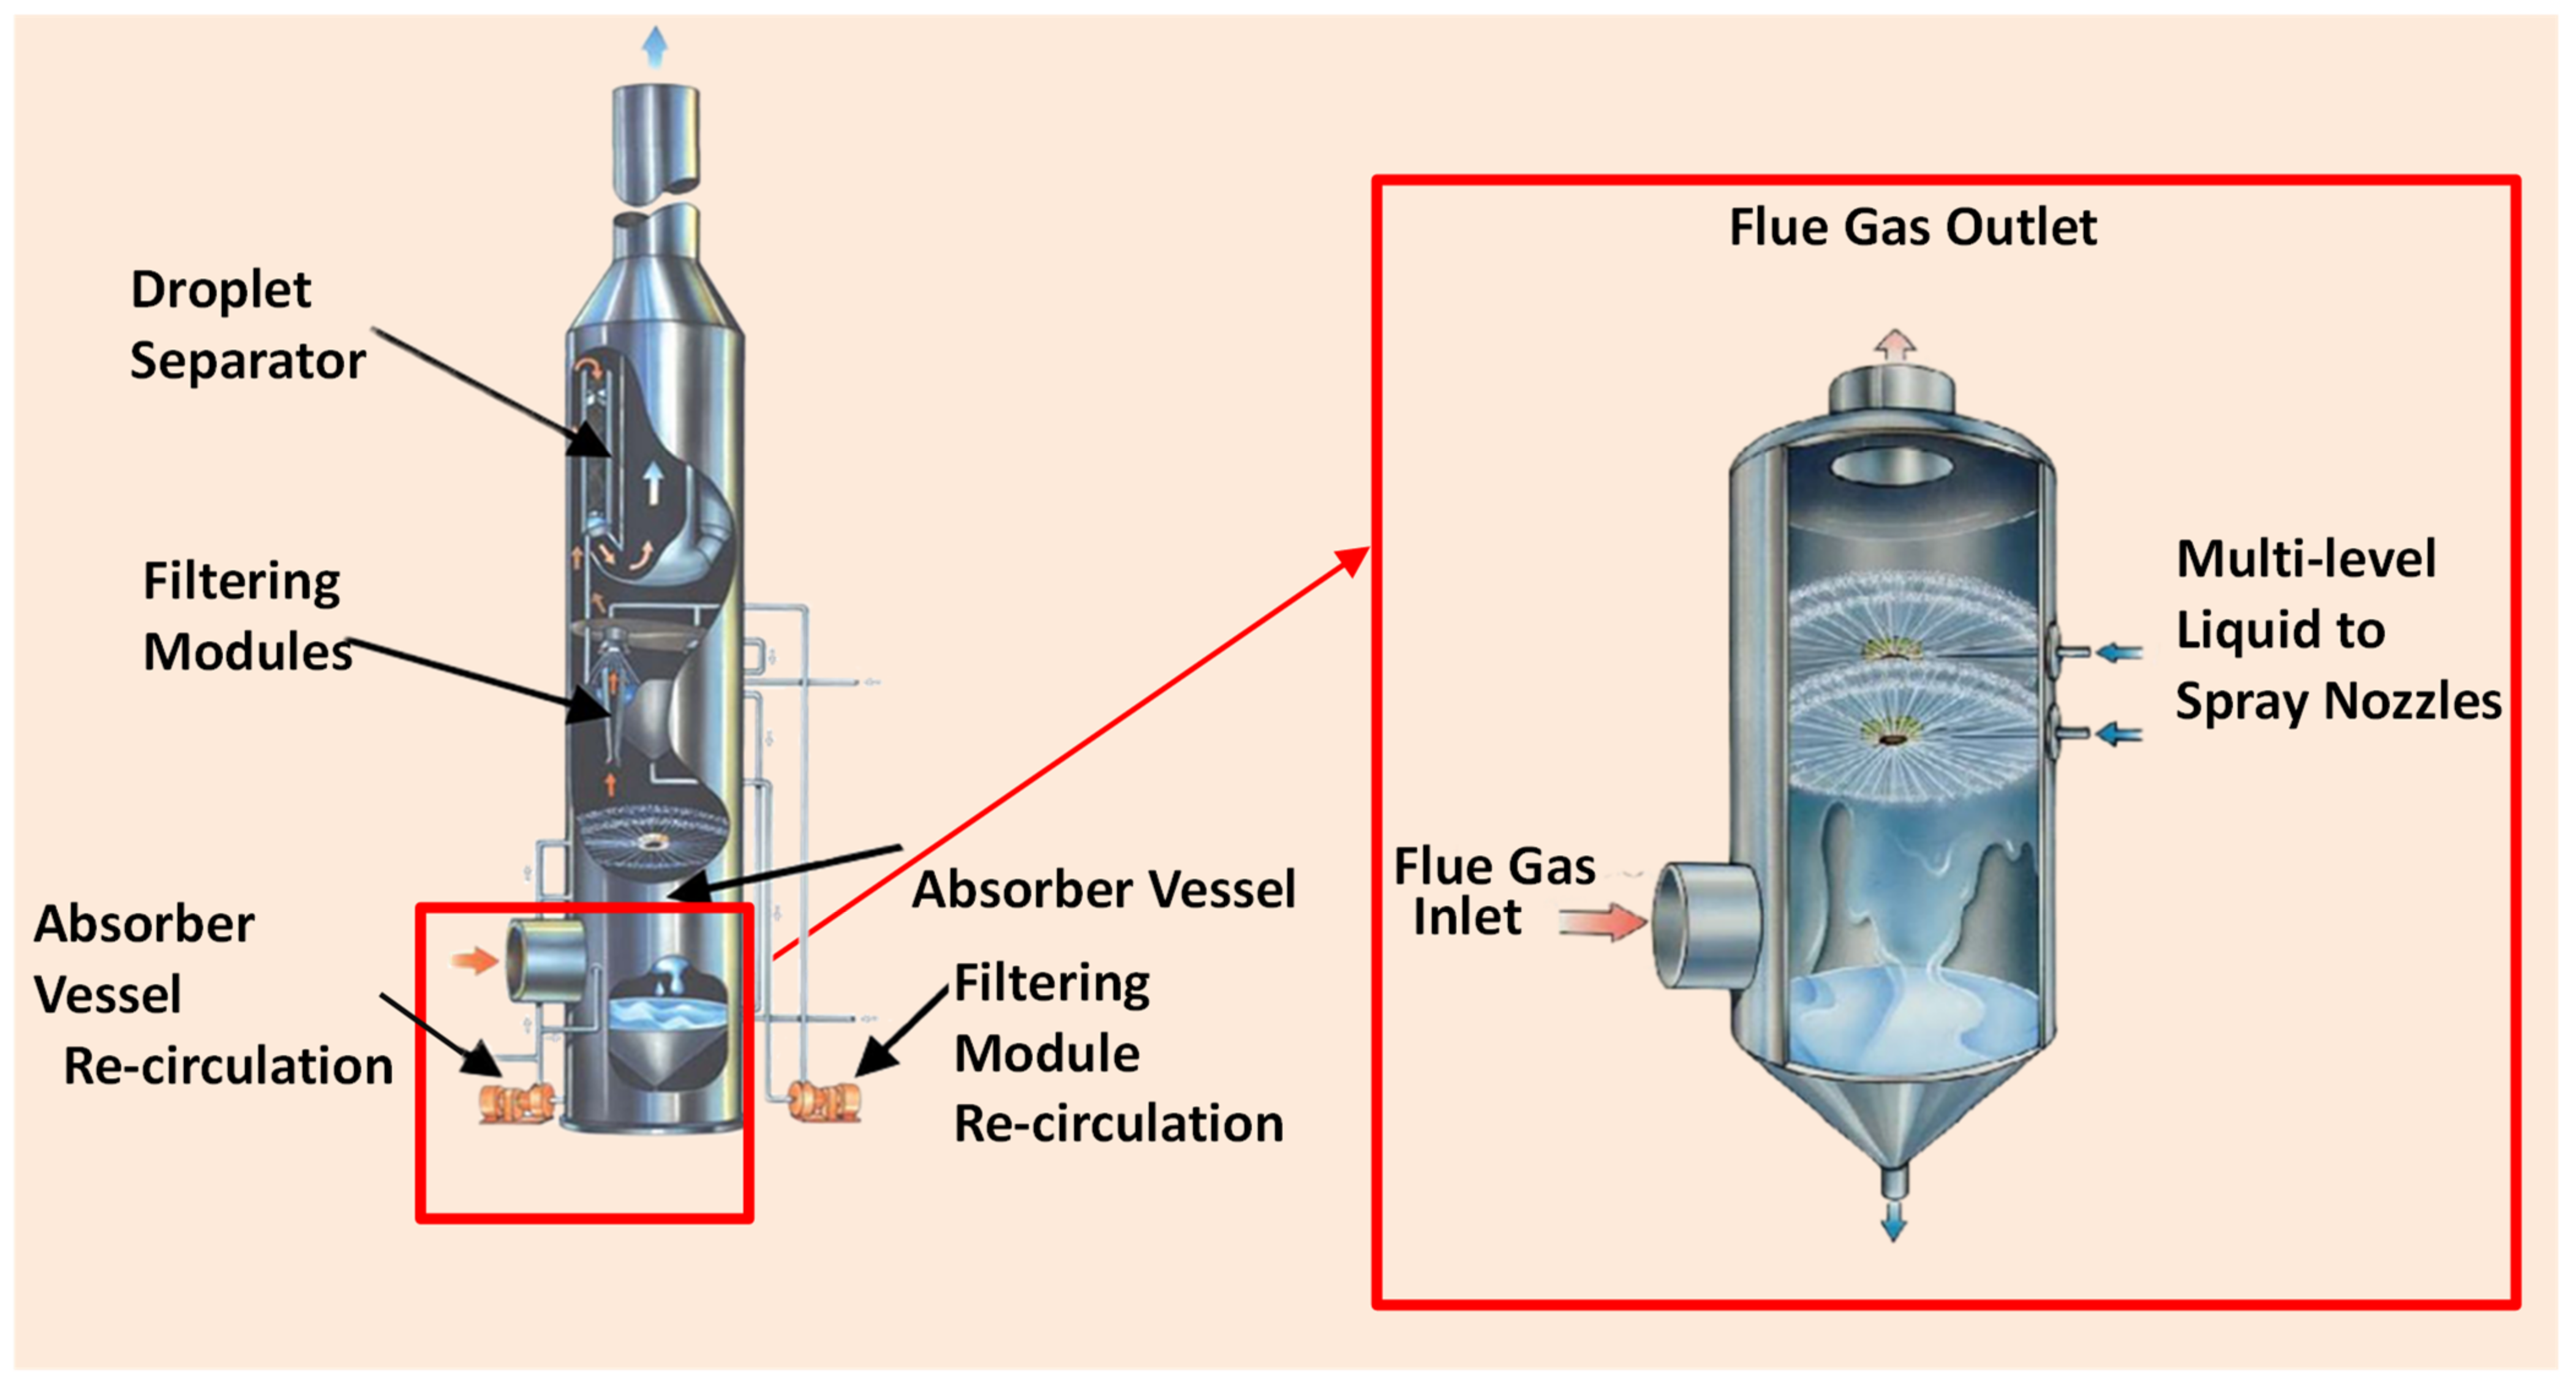
Regenerative and Non-regenerative flue gas scrubber
The applications of both regenerative and non-regenerative (caustic scrubber) flue gas scrubbing technologies for effectively removing not only catalyst wastes but also SO2 from flue gas stream in FCCU are commercially mature and incentivizing. The design is quite simple with high mechanical forgiving ability but are rather expensive in relation to initial CAPEX and OPEX [19]. The choice of the most suitable wet scrubbing system borders on the environmental regulation compliance, technical reliability and flexibility, and cost implications of each technology. In a nutshell, hot flue gas containing particulates directly from FCC regenerators third stage cyclones (TSS) or from other units (including heat boilers, expander, waste heat exchanger) are treated in the scrubber system using high-density water and caustic soda (NaOH); the cleaned gas is afterwards discharged through the integrated stack to the atmosphere. Detailed treatment mechanisms of flue gas wet scrubbing are reported elsewhere [19,259]. Recovery of the alkaline reagent is the main difference between the regenerative and non-regenerative system; no fewer than 95% of the current FCC flue gas scrubbers are nonregenerative design. A separate process unit is often integrated into the regenerative designs to recover the reagent (caustic soda or proprietary amine solution) while the effluent SO2-rich off-gas is sent to the Claus unit for sulfur recovery. This uniquely minimizes cost but the initial investment usually doubles that of the nonregenerative design (Figure 28). In addition, the design and performance of wet scrubbing system also depends on many factors including: inlet catalyst dust mass flow rate, type of alkaline solution, the composition of the flue gas, pressure at the scrubber inlet, utilities requirement, temperature the scrubber inlet, etc.
Wet scrubbers are usually designed to provide excellent contact between the liquid and the flue gas in order to obtain at least 95% removal efficiency [259]. For example, Pan et al. [260] reported 99.9% and 94.7% removal rates, respectively, of SO2 and catalyst particulates of flue gas from a RFCC flue gas scrubber. Nevertheless, in the process of liquid-to-flue gas contact, fine mist is formed which reduces pollutant collection efficiency. Several high-efficiency mist eliminators including wave-plate, vane, wire-mesh mist eliminators have been developed [261,262,263,264,265,266] but are also faced with plugging and maintenance menace due to particles and salts build-up on their surfaces [267,268].
In essence, major attention has been placed on the liquid spraying pattern for quenching the flue gas and avoiding fine mist generation. Proprietary LAB-G spray nozzles have been developed and installed in multiple levels within the open tower of a scrubber with the capacity to generate high-density water curtains through which flue gas must pass. PM and SO2 are effectively removed by the multiple level spray nozzles that provide uniform liquid distribution across the tower cross section. Filtering modules are also installed above the spray tower where LAB-F nozzle is installed to counter-currently spray water to outlet gas flow to ensure that very fine particulates are trapped, and SO2 is captured as dissolved sulfites/sulfates (NaHSO3, NaSO3, and Na2SO4) for further treatment in a purge treatment unit (PTU) [259].
A growing interest and effort is also seen in the development of integrated technologies under the guise of wet scrubber system to simultaneously capture multiple pollutants such as CO2 and NOx alongside SO2 and catalyst dusts [90,269,270,271,272]. Gao et al. [269] demonstrated that 90–99% post-combustion CO2 can be achieved in a piperazine amine scrubbing system at a significant low energy consumption elevation. Wang et al. [270] similarly in a bench-scale electrochemically mediated amine regeneration (EMAR) process obtained about 80% CO2 separation from flue gas stream with a stable operation condition. Concurrent removal of SO2 and NOx from flue gas also achieved under scrubbing-electrolytic regeneration system. These findings are interesting even though they are lab-scale demonstrations: the imminent consideration of modular refineries makes them more promising. However, comprehensive studies are needed to underscore the scale up design and joint removal of all the pollutants.
Furthermore, Tragesser [45] proposed combined process units as an alternative control solution, which includes: the addition of wet gas scrubber, dry electrostatic precipitator, high temperature barrier filters made of alloys of iron aluminide composite and physical filtration technique (see Figure 29). These can reportedly reduce the flue gas particulate emission to less than 10 mg/Nm3, but no commercial success of this design is available.
So far, as can be seen in Figure 30, particulate emission reduction is best achieved by the combination of internal particle separation devices and downstream cleaning systems. Additionally, integrating a good gas flow regulator with some anti-surge devices would alleviate gas surge and PM emission.

5.2. Process Intensification for SOx Reduction

Irrespective of the regeneration mode, spent catalysts must be de-oiled prior to regeneration to reject as many hydrocarbons as possible and to strip off sulfur compounds. This will forestall sulfate formation, which cannot be removed from the catalyst surface during regeneration with a deleterious effect on catalyst performance. However, small amounts of sulfur compounds still enter the regenerator and are converted to SOx flue gases.
Sulfur oxides (SOx) are made up of gaseous SO2 and SO3; the former is often used as the primary indicator due to its dominant proportion and toxicity. SOx is a precursor of secondary inorganic aerosol, acid rain and photochemical haze formation, which constitute environmental hazard [13]. Feedstock quality is usually the major determinant of SOx emissions from an FCC unit. In the reactor section, about 5–30% of sulfur in the feed is embedded with other combustible deposits such as coke on the catalyst, and with a poor stripper efficiency, the sulfur content would be greater [273]. SOx are produced in the regenerator from the oxidation of all the sulfur compounds bound in coke, the concentration is often 90% SO2 and the rest SO3 [19,214,274]. A summary of the origin and solution of SOx emission in the regenerator is presented in Table 9.
A quick and cheap approach to reducing SOx emission is via the catalyst additive platform [273,275,276,277,278,279,280,281]. SOx transfer additives represent the common control option among FCC operators owing to its cost effectiveness, but its incentives have not been fully gained because of its tendency to catalyst deactivation drawbacks [273,277,278,280,281]. The conventional tripartite mechanism for SOx formation and removal in FCC regenerator flue involves burning of coke sulfur to SO2, followed by SO2 oxidation to SO3 and finally capturing of SO3 to metal salt as thus:
SOx   Formation :   S   coke + O 2   g SO 2   g
SOx   Formation :   SO 3   g + 1 2 O 2   g SO 3   g
Formation   of   Metal   Sulfate :   SO 3 + MeO   S MeSO 4   s
Earlier, DeSOx additives which were made of rare earth metal supported on alumina suffered from low SOx adsorption under severe FCC conditions [282]. The advent of spinel (magnesium/aluminum solid) with cerium catalyst has yielded enormous improvement in SOx adsorption [278,279]. This is widely explored in many FCC units today. Several other metals have been tested with cerium with success. Specifically, Wen et al. [214] reported a multifunctional catalyst CuCe-cat with high activity even at high temperatures for simultaneous conversion of NO, CO and SOx adsorption; the strength of the catalysts lies in the synergistic interaction between copper and cerium.
Avoiding the recycling of heavy streams in the reactor system is another cost-effective strategy for SOx reduction, but this begs the question of refinery profitability. Instead, feed hydrodesulfurization could be adopted as an effective alternative control measure but this also attracts high CAPEX and is not flexible like flue gas scrubbing technologies. The dual application of scrubbing system and DeSOx additive have been reported to reduce large quantities of SOx to near zero ppmv.
As mentioned in Section 5.1, nonregenerative wet scrubbing system based on caustic reagent has proven excellent in removing both particulates and SO2. It readily handles all process upset conditions with very little attention required. The EDV® wet scrubbing system [272] is a representative nonregenerative scrubber found to have achieved a 99.92% SO2 removal efficiency [259]. However, caustic scrubber systems produce the largest volumes of process wastewater, about 26 gallons per barrel of oil processed, which is one of its greatest weakness [260].
The LABSORB scrubbing system developed by DuPont Belco [259], CANSOLV process developed by Shell Global Solutions [283], RASO process patented by SINOPEC Luoyang Petrochemical Engineering Corporation [284], Lextran process developed by Lextran Ltd. [285], and PahlmanTM Process developed by EnviroScrub Technologies Corporation [286] are the major commercial wet flue gas scrubbing technologies. The LABSORB process (see Figure 31), a representative regenerative wet scrubbing system, achieved a recovery of high-purity SO2 in the range of 90–95% with less than 1% waste and less than 10% material make up or removal [259]. The reagent buffer utilized is also non-volatile and non-toxic.

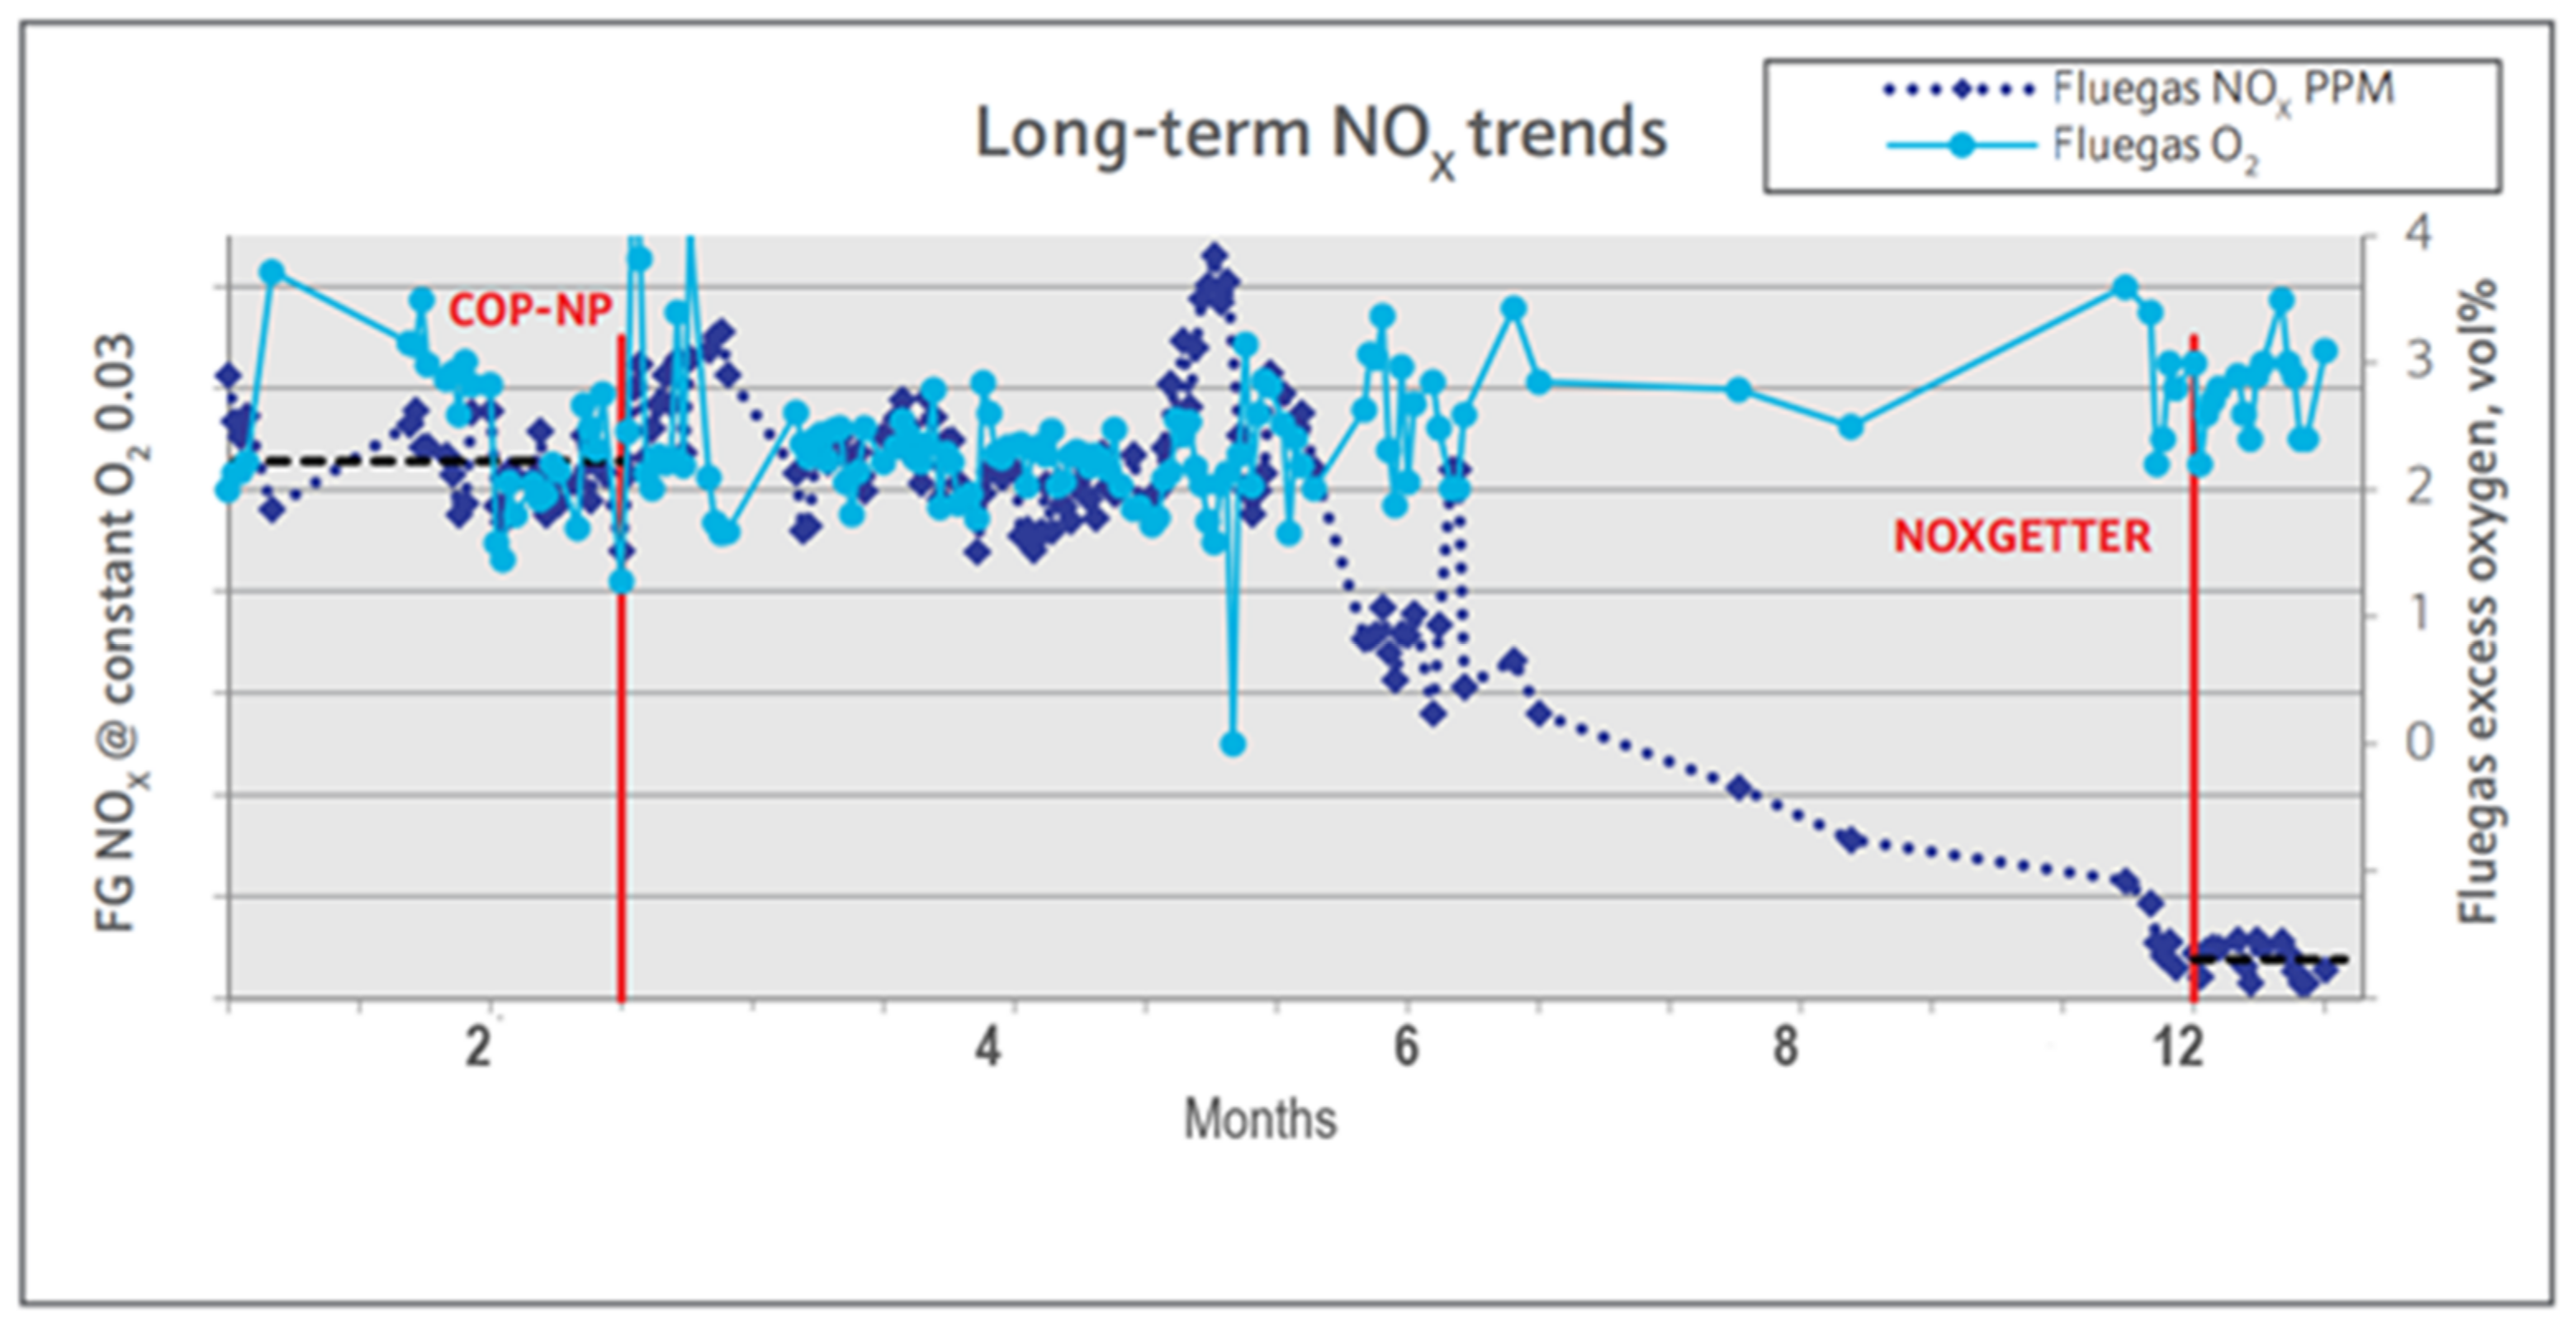
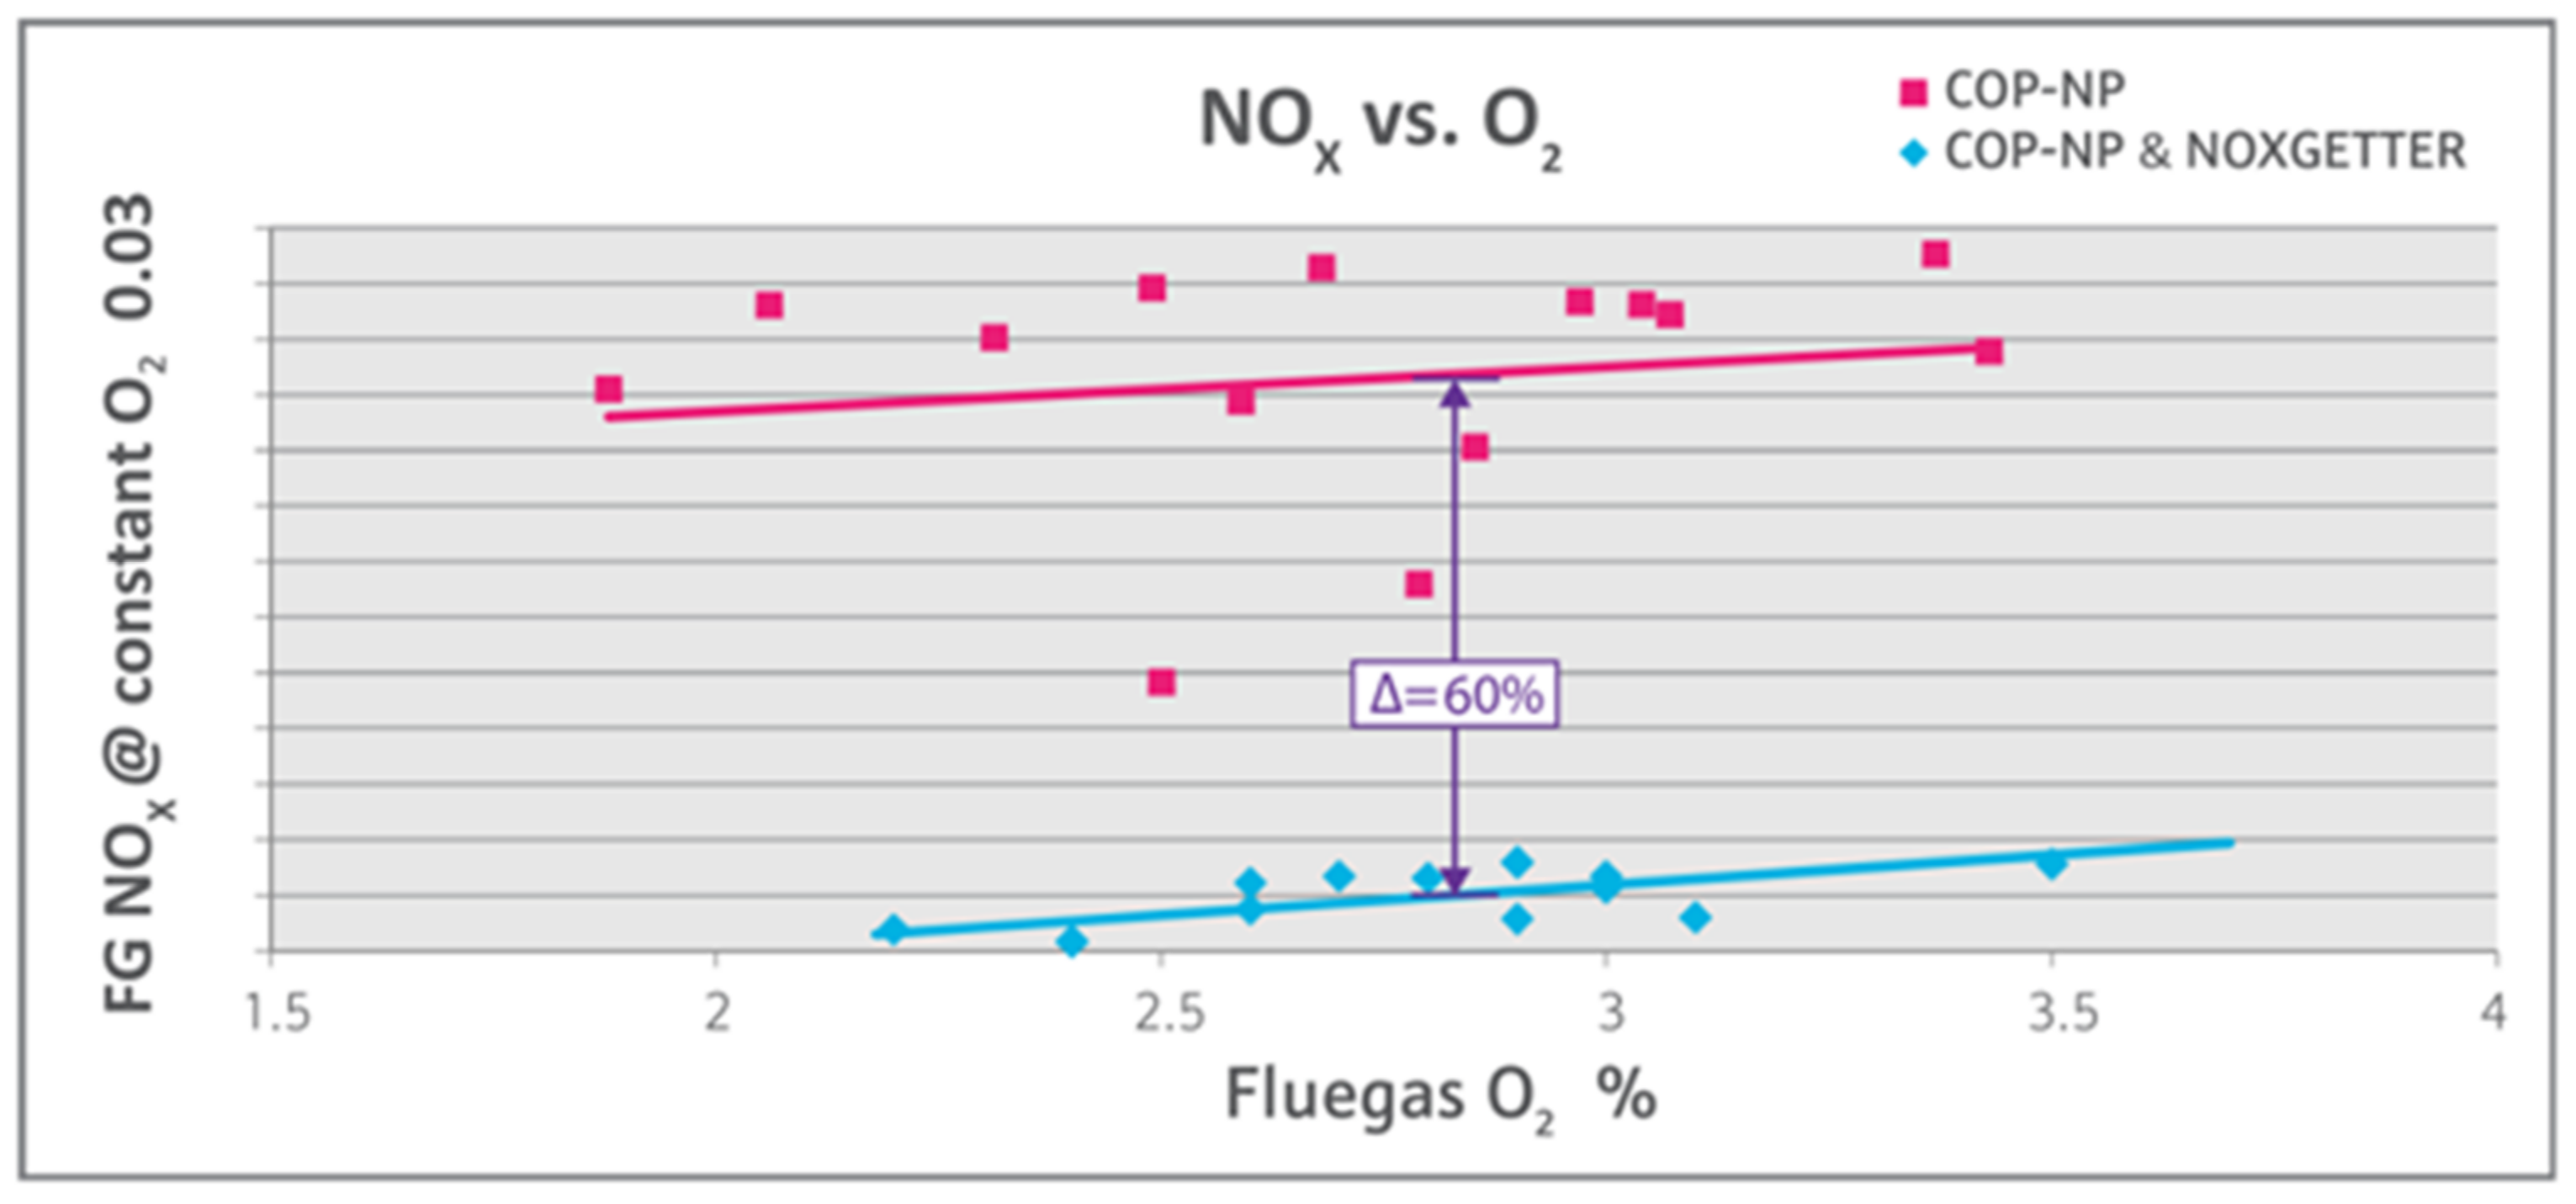
5.3. Process Intensification for FCC Regenerator Flue Gas NOx Emission Reduction

Nitrogen oxides, generally referred to as NOx (NO + NO2 + N2O), are a leading ozone precursor and play a role in acid rain, smog and the formation of PM10 and PM2.5. FCC regenerator is the biggest single NOx emitter in the refinery in range of 100–500+ ppm, which is mainly NO. FCC feed often contains 0.05–0.5% organic nitrogen compounds, and about 50% of this is bounded into coke on catalyst. Debates on key sources of regenerator NOx long persist; Bryden et al. [274] argued that nitrogen from combustion air, CO boiler combustion and largely nitrogen feed are the sources of nitrogen in the regenerator, but many researchers with both industrial experience and experimental evidence have shown that only the latter is significant [14,117,287]. Additionally, the NOx formation pathway is broadened into three: thermal-, prompt- and fuel-based. Thermal NOx is only feasible above 1760 °C, which is outside industrial regenerators and the possibility for prompt NOx is slim under conventional regenerator operating conditions. Fuel NOx remains the only sure sources of NOx formation as it emanates from nitrogenous compounds present in the combustion fuel [14]. However, Genç et al. [288], based on industry expertise and experimental investigation, found that feed nitrogen has an insignificant influence on FCC NOx production. According to them, approximately, 75% of coke nitrogen is combusted to inert nitrogen (N2) and discharged freely, while the remaining 25% is transformed into NOx and reduced N-species (NH3, HCN and NO). The implication is that NOx generation is sensitive to the ability to skew the reaction routes in the regenerator to favor reduction of NOx to N2. This suggests that a thorough understanding of the reaction mechanisms for NOx generation is the key rather than controlling nitrogen in feed, which has always been the norm and is quite uneconomical.
Three core caveats for high NOx production in the regenerator include: (i) exponential rise in combustion temperature, (ii) preheating of feed gas and, and (iii) a high amount of combustion gas. In addition, oxygen concentration in the regenerator is the focal dictator of whether coke nitrogen is converted to N2 or NOx. With oxygen below the stoichiometric combustion (peculiar to partial burn or fullburn with non-uniform radial air-catalyst mixing), reduced N-species are increasingly formed and are further converted to NOx upon contact with surfeit of oxygen in catalyst bed, vapor space, plenum, flue gas ducts or in the presence of excess air injected into the CO boiler. In full burn under high temperature, excess oxygen skews the reaction in the direction of NOx generation as shown in Figure 32. Based on this understanding, Genç et al. [288] recommends a theoretical midpoint compromise termed the “sweet spot” where the regenerator operates between full-burn and partial-burn mode, bringing excess oxygen and CO to a near-zero level. This is impractical and only a counter-current regenerator operates close to this point, thus explaining the reason for their low NOx level.
Similar to SOx reduction, several online and end-of-pipe approaches have been developed to address NOx emission and are summarized in Table 10.
As an online control measure, several NOx reduction additives have been patented and adapted for FCCU applications including: DENOx, XNOx, and NOXGETTER [287,288]. While DENOx only targets the reduction of NO to N2, XNOx and NOXGETTER can simultaneously function as CO promoter and as NO reduction additive. Unfortunately, Pt-based CO promoters create a bigger conundrum; N-species generation is promoted, leading to more NOx [117,211,287]. According to Genç et al. [288], with NOXGETTER additive a 75% NOX reduction was attained in a UOP side-by-side configuration with a bubbling bed regenerator operating in complete combustion mode as revealed in Figure 33. The non-platinum CO promoter NOXGETTER was supported on silica-alumina, an acidic carrier with high surface area. The palladium enhances CO oxidation and reduces NO generation.
For a turbulent bed regenerator, since CO promoter converts CO to CO2 at the expense of a rise in NOx emissions under low excess oxygen (2–3%) [14]. The optimum design requirement for NOx reduction will require a turbulent bed in the dense zone; reducing excess oxygen to less than 0.5 mol% [289,290], lowering the platinum level to less than 0.5 ppm [289], avoiding spent catalyst maldistribution [19], and reducing the fluidizing fluid residence time to less than 4 s [287].
End-of-pipe options such as selective catalytic reduction (SCR) and non-selective catalytic reduction solutions (NSCR) have been developed. Deductions from Cheng and Bi [291] review on NOx selective catalytic reduction (SCR) technologies include: (i) NH3-SCR, HC-SCR and NSR have commercial success; (ii) NH3 slip is still a big challenge except for HC-SCR; (iii) NH3-SCR offers the best NOx reduction efficiency; and (iv) present technologies can be modified to meet future FCCU-biomass requirements.
In the non-catalytic NOx mitigation approach, an anhydrous or an aqueous reducing agent (such as NH3 and CH4N2O) is injected into the regenerator flue gas at high temperature (between 760–1070 °C). A uniform dispersion of the reducing fluid into the main flue duct is achieved with a grid, thus creating a turbulence-mixing and rapid reducing reaction with the NO component in the flue gas composition. The oversimplified reaction pathway is given, thus:
4 NO + 4 NH 3 + O 2 4 N 2 + 6 H 2 O
With this uncatalyzed measure, 40% of the NOx reduction can be obtained and the overall stack NOx would cascade to 30–80 ppm. Much more than this, nearly 90–97% NOx reduction from the uncontrolled level can be realized from the catalyzed approach where gaseous NH3 or CH4N2O are premixed with air and are selectively injected into the grid in a specific location of a close-range temperature with a low residence time. NOx reducing catalyst are introduced afterwards. The caveats are that the injection is stalled until flue gas attained the required high temperature range, this is necessary in order to forestall accumulation of ammonium nitrate salt leading to explosion in the flue gas collecting ducts or considerable heat from the convention coils. Additionally, the proportion of air to NH3 must be carefully regulated below the explosion limits.
Using CO to reduce NOx has been explored very widely since both are produced during combustion in the regenerator; this is accomplished by manipulating the chemistry of NOx formation [215]. HCN is the dominant nitrogenous compound produced in the regenerator during coke combustion which is then oxidized to NH3 or directly to NOx depending on the region (lean or rich), the NH3 can be selectively oxidized to N2 [292]. Usually, the concentration of NO is inversely proportional to that of CO. The challenges faced in reducing NOx include that in the presence of excess O2, NO reduction is suppressed because of stronger adsorption potential of O2, which thereby deactivate the oxidized catalysts. This has been circumvented by different innovations supported by numerous experimental and computational investigations [293,294]. Utilizing a multistage regenerator in the presence of oxidized catalysts (Pt/SAPO-34) achieved high NO reduction by CO at high temperature lower than 700 °C, suppressing O2 from inhibiting NOx reduction, usually in the presence of excess O2, making it highly efficient in reducing NO compared to a single-stage regenerator [117].
Over the oxidized Fe catalyst surface, O2 is adsorbed to form two radicals [2O (s)], which inhibited the NO adsorption. The radicals are consumed upon CO introduction and NO starts to adsorb onto the surface to further form N (s) and O (s) radicals. CO reduces the O (s) to CO2 while N (s) combine together to produce N2 [294]. As shown in Figure 34, Fe catalyst is more effective in reducing NO conversion, achieving over 80% in the regeneration, but then, to what extent is Fe catalyst efficient in the riser as FCC catalyst?
Praxair uses partial burn regenerator (CONOx) technology in the CO boiler to deconstruct NH3 and HCN (NOx precursor); this leads to 60% NOx reduction as shown in Figure 34. High velocity jet heated oxygen is injected into the flue gas stream coming from the regenerator exit before it enters the CO boiler; this fast mixing and free radical reaction oxidizes CO to CO2 without NOx production [46]. In recent times, NOx reduction additives have gained recognition among FCC catalyst manufacturers leading to as low as 20 ppm of NOx in stack flue gas of many industrial regenerators. Grace Davidson patented GDNOXTM 1 NOx, which is effective in reducing NOx up to 80% representing 10% additive addition rate and 2.5–7.5 wt.% of total catalyst inventory [295].
In general, the optimization of emissions reduction is a continuous process as more stringent controls for pollutant emissions continue to rise. Cost-effective technologies to reducing pollutants in FCC regenerator are also not optional for refiner profitability. Improvements in mechanical structures and catalyst modifications have provided increased control of emissions to meet present legislation requirements. However, the existing control strategies must be further strengthened. Key hardware approaches revolve around correct design of cyclones for efficient solids separation, incorporation of third-fourth stage cyclones, and excellent air/spent catalysts distributors for even air-catalysts mixing for higher reduction in particulates emission. Monitoring and controlling excess oxygen utilization is also cardinal for all pollutants control, in partial burn units, CO/CO2 ratio must be minimized to promote less reductive environment for N-species formation. For full burn units, the sweet spot of oxygen must be targeted where surfeit of O2 is close to zero; this will push the reaction in the direction of N2 formation. To this effect, counter-current regenerators instead of co-current ones are well suited. Integrated approaches to simultaneously capture all pollutants are promising from the economical perspective but are currently technically immature; thus, more efforts are required. Emission reduction additives in small quantities have also proven reliable as an emission control option, lowering Pt concentration or switching to a non-platinum-based additive in CO combustors results in excellent NOx and afterburn mitigation. The activity and thermal tolerance performance of non-toxic and more environmental additives such as spinel catalyst need to be further intensified.

6. Conclusions

In this paper, we provide a comprehensive state-of-the-art review of FCC regeneration intensification technologies, focusing on the regenerator performance optimization and overall reliability advancement. The findings avail insights into the reported challenges that limit the performance of catalyst regeneration in industrial FCC unit. Specifically, we conclude that:
  • The key features of the newer regenerator designs include several transitions, dilute cooler and bed steam coils to dense bed coolers, carbon steel hardware to highly mechanically forgiving alloys (chrome-moly steel), standpipe inlet from inlet hopper to disk design, catalyst transfer via the standpipe, post-riser regeneration, partial CO combustion or complete CO combustion to multistage regeneration, high temperature operation tolerance (704–732 °C) for coke and full CO burning, and reduced catalyst inventories resulting from better knowledge of coke burning chemistry.
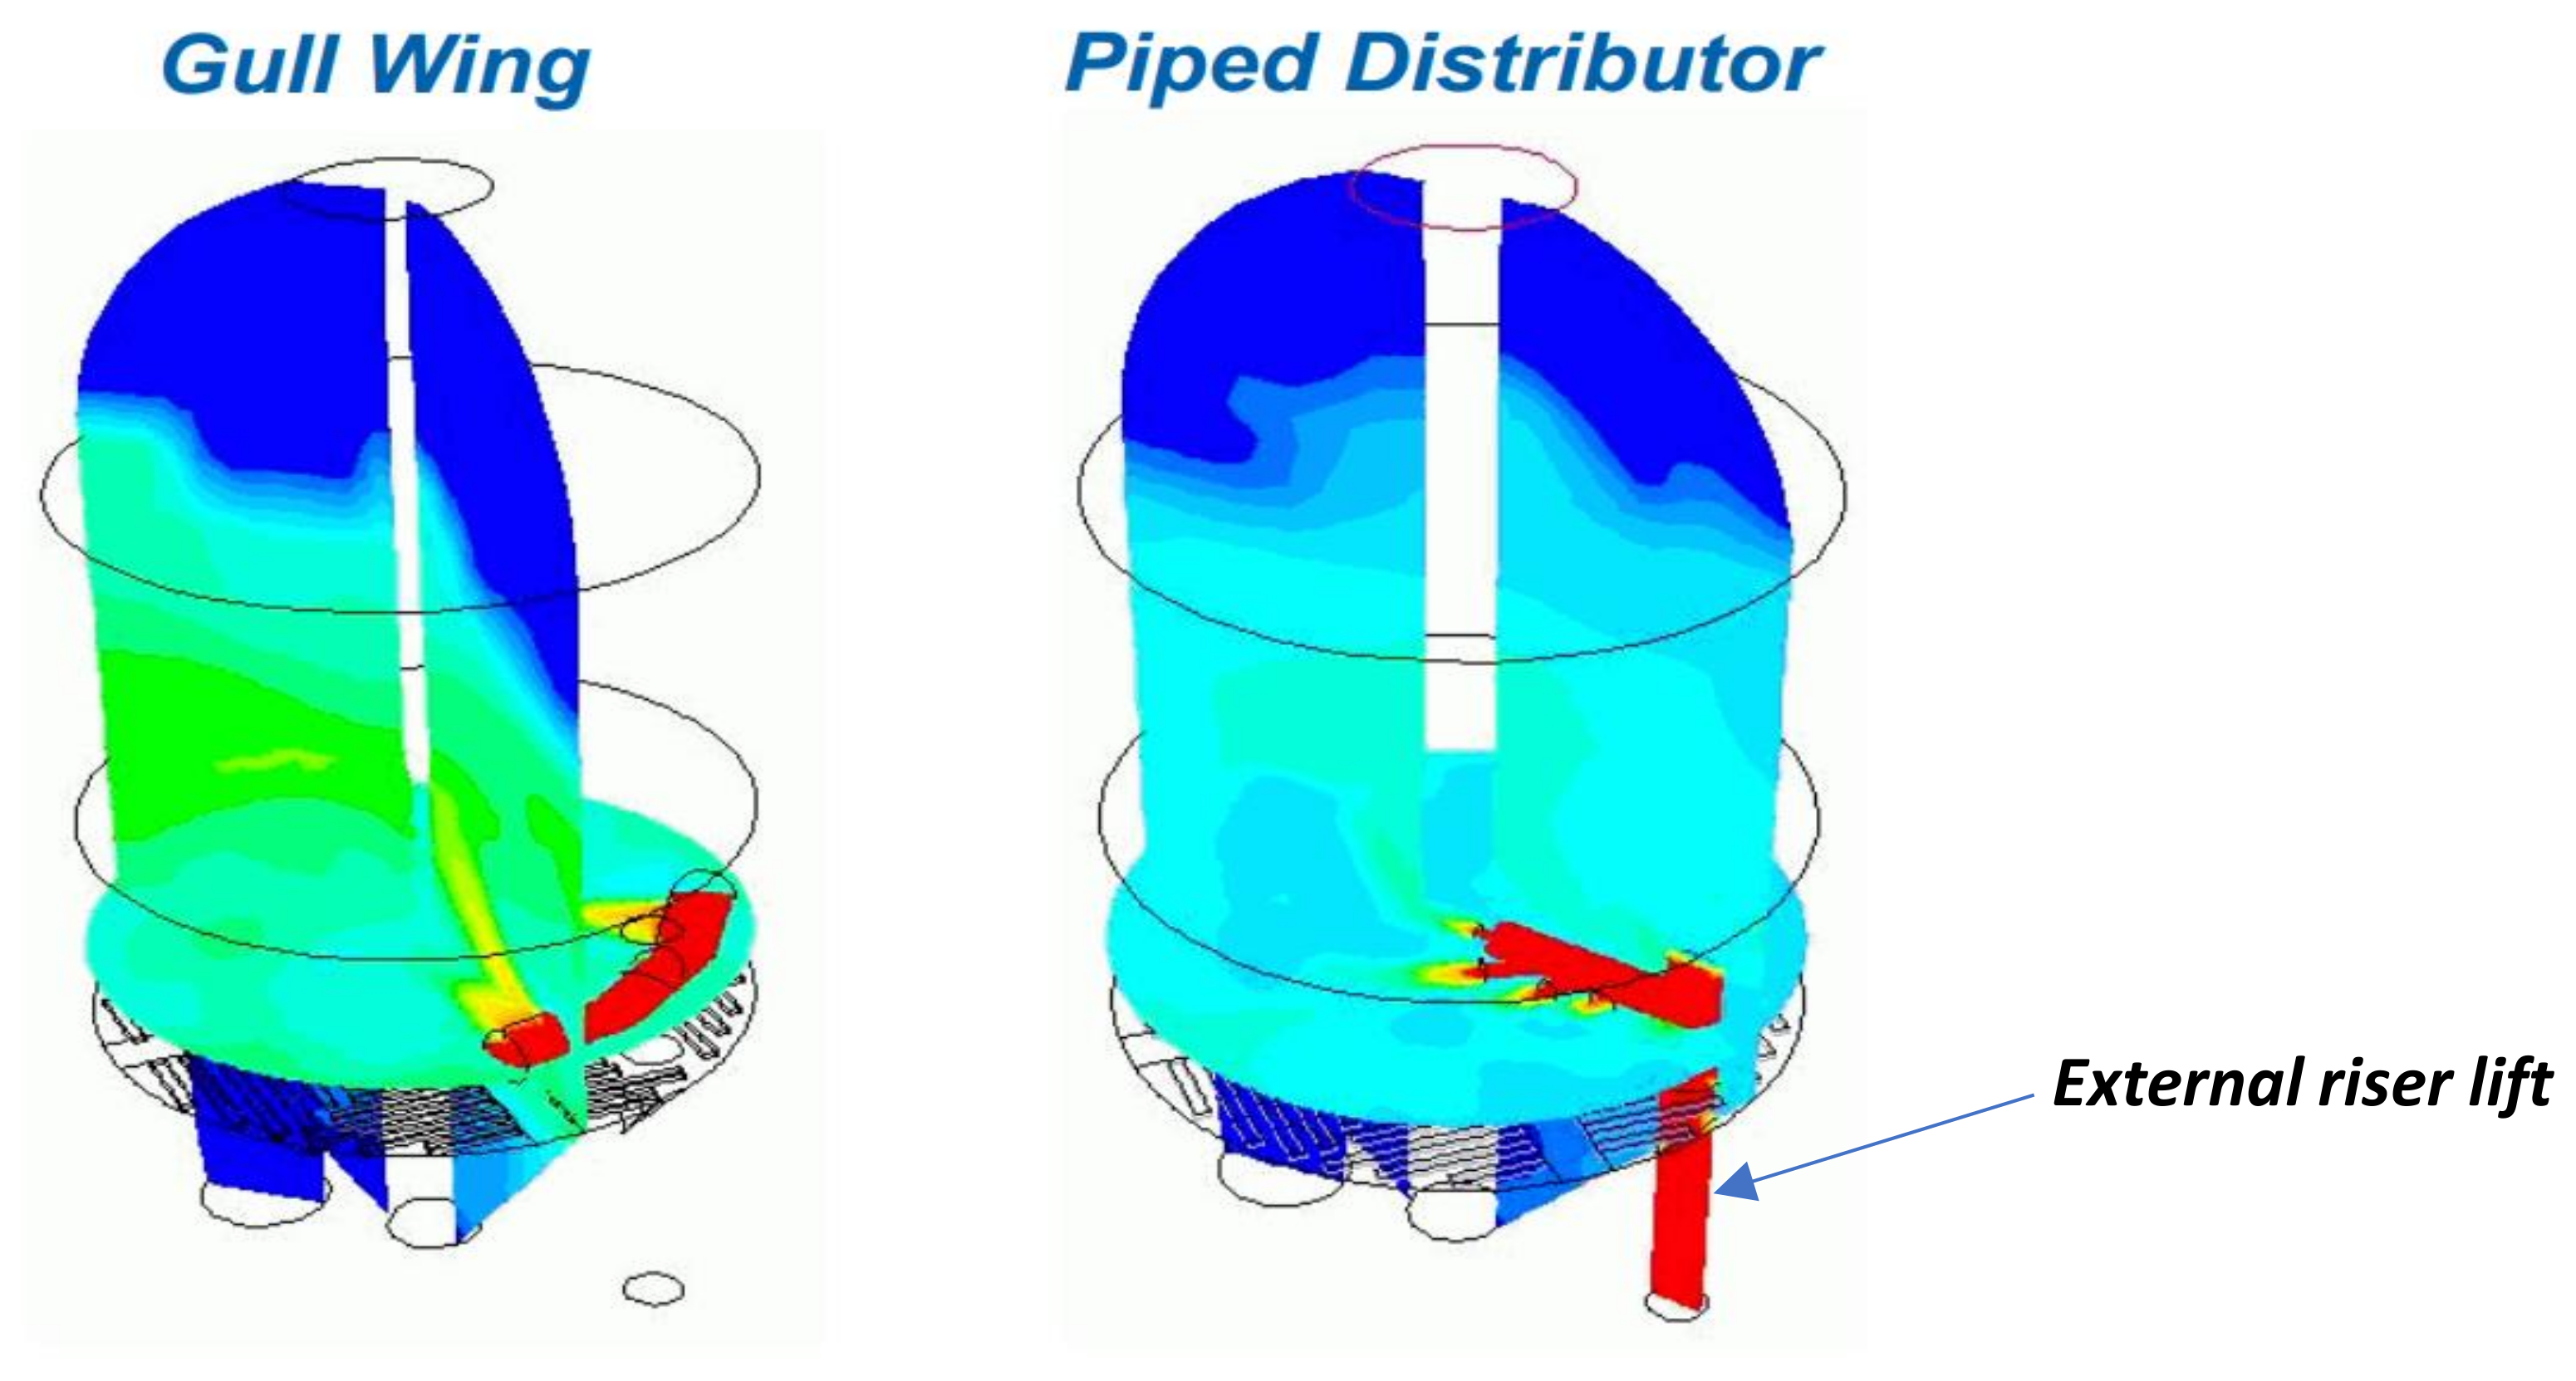
  • Maldistribution of spent catalyst and feed gas accounts for two-thirds of the process intensification and reliability problems in the regenerator. Poor axial and radial distributions of catalyst and air across the bed cross section are the precursors to high entrainment of particles in the freeboard, high catalyst loss, extreme erosion and afterburn. Nonuniform radial gas–solid mixing is mostly likely when catalysts are charged into the bed through sidewall, especially when equipped with a ski-jump distributor, newer catalyst distributors have reduced this nonuniformity phenomenon. A pipe grid catalyst distributor is found to be more effective than the counterpart gulf design.
  • Sufficient transport gas must be supplied to keep the catalyst fluidized in the spent catalyst standpipe before being discharged into the spent catalyst distributor, otherwise catalyst slumping will be promoted, leading to poor regeneration. Short circuiting of spent catalysts can be impeded by closing the radial openings/nozzles along the spent catalyst distributor directly facing the standpipe or discharge ports. The influence of this on the distributor pressure drop, however, requires further assessment.
  • An efficient gas distributor is linear to good regeneration. Most of the newer air distributors can provide relatively uniform gas dispersion with few performance superiorities over each other. The ring gas distributor can operate at a low pressure drop with better lateral distribution coverage of the bed cross-section. However, the pipe grid has a similar dispersion efficiency but suffers from mechanical attenuation due to its arms’ constant cyclical oscillations.
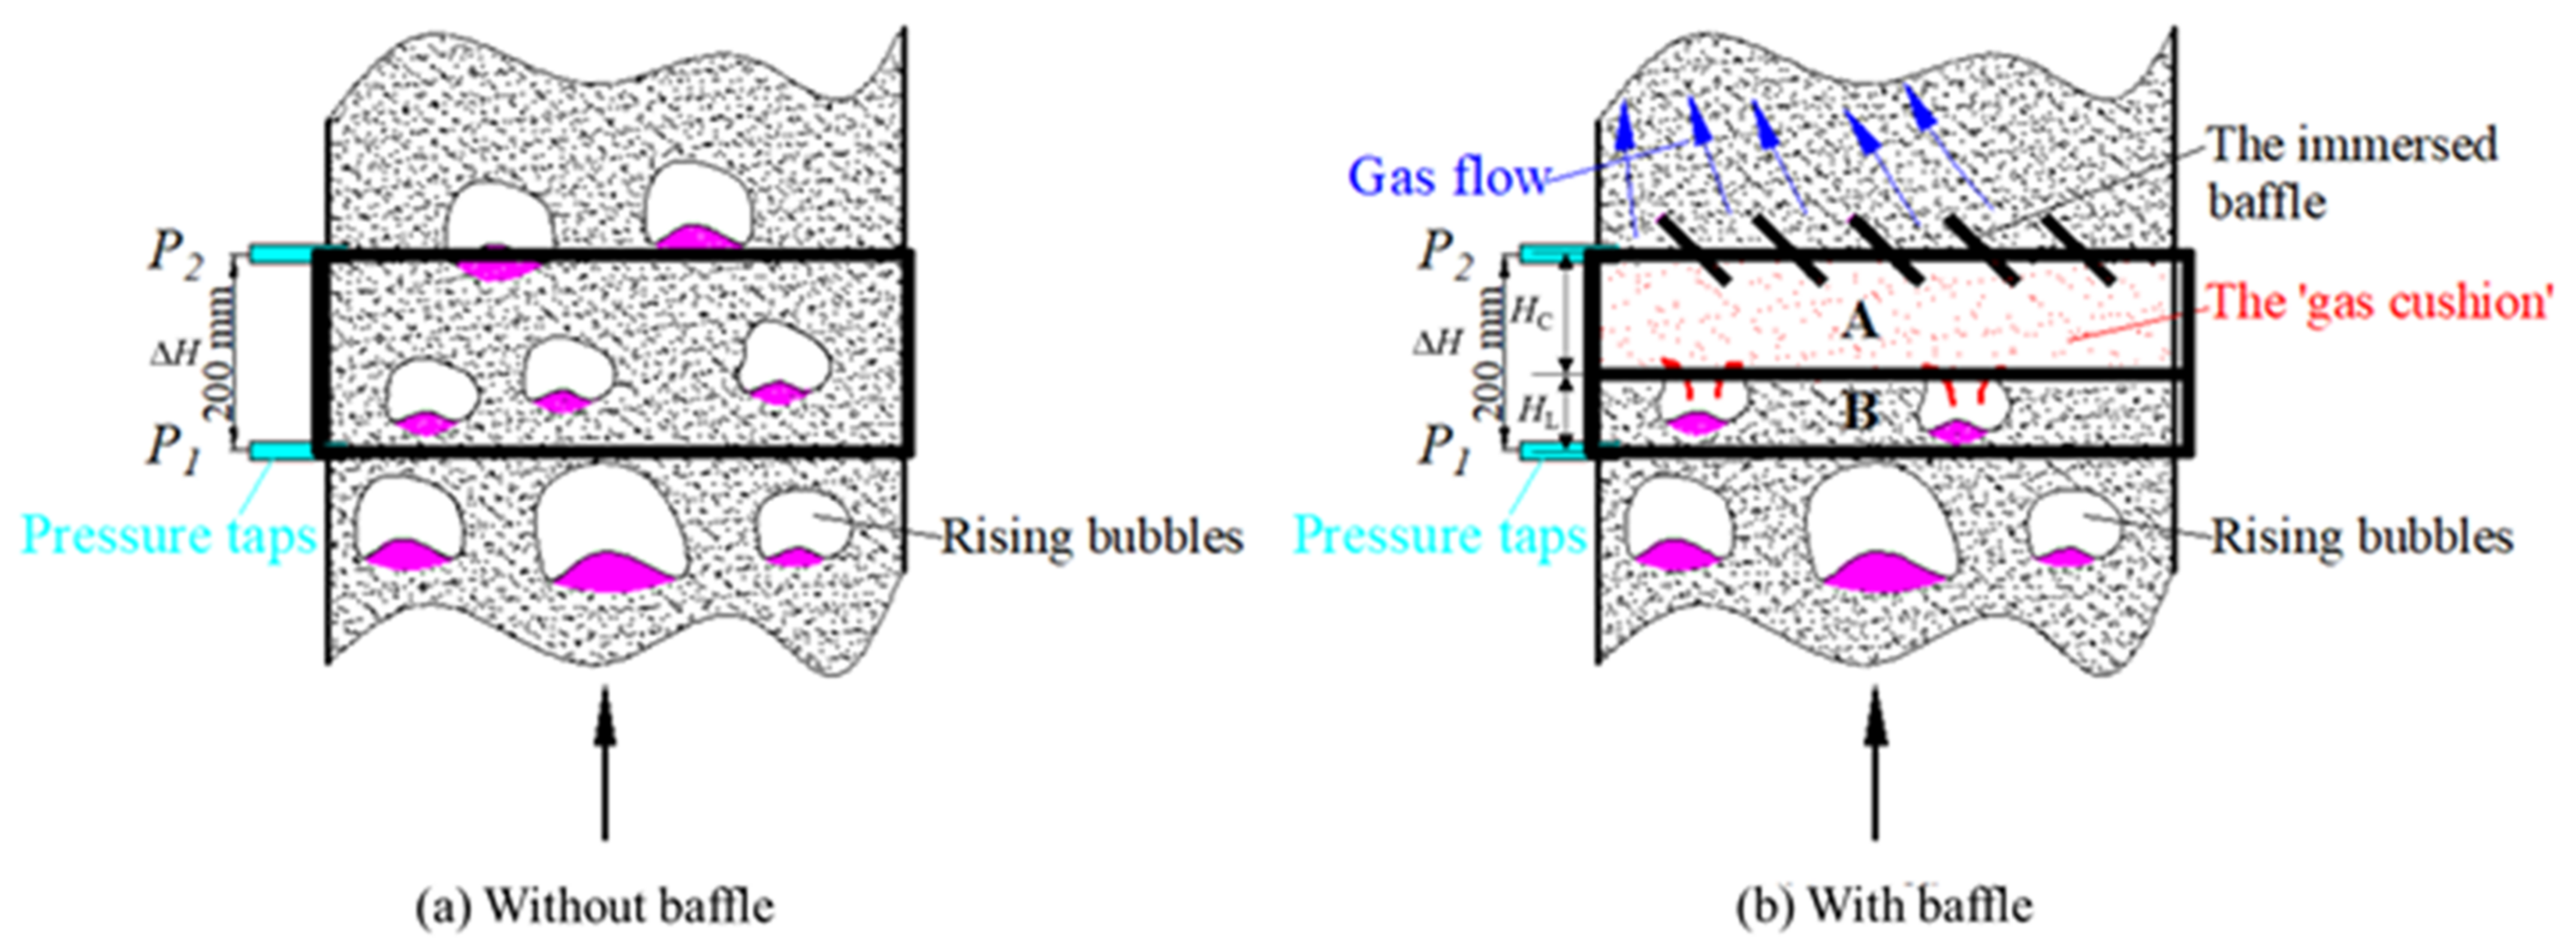
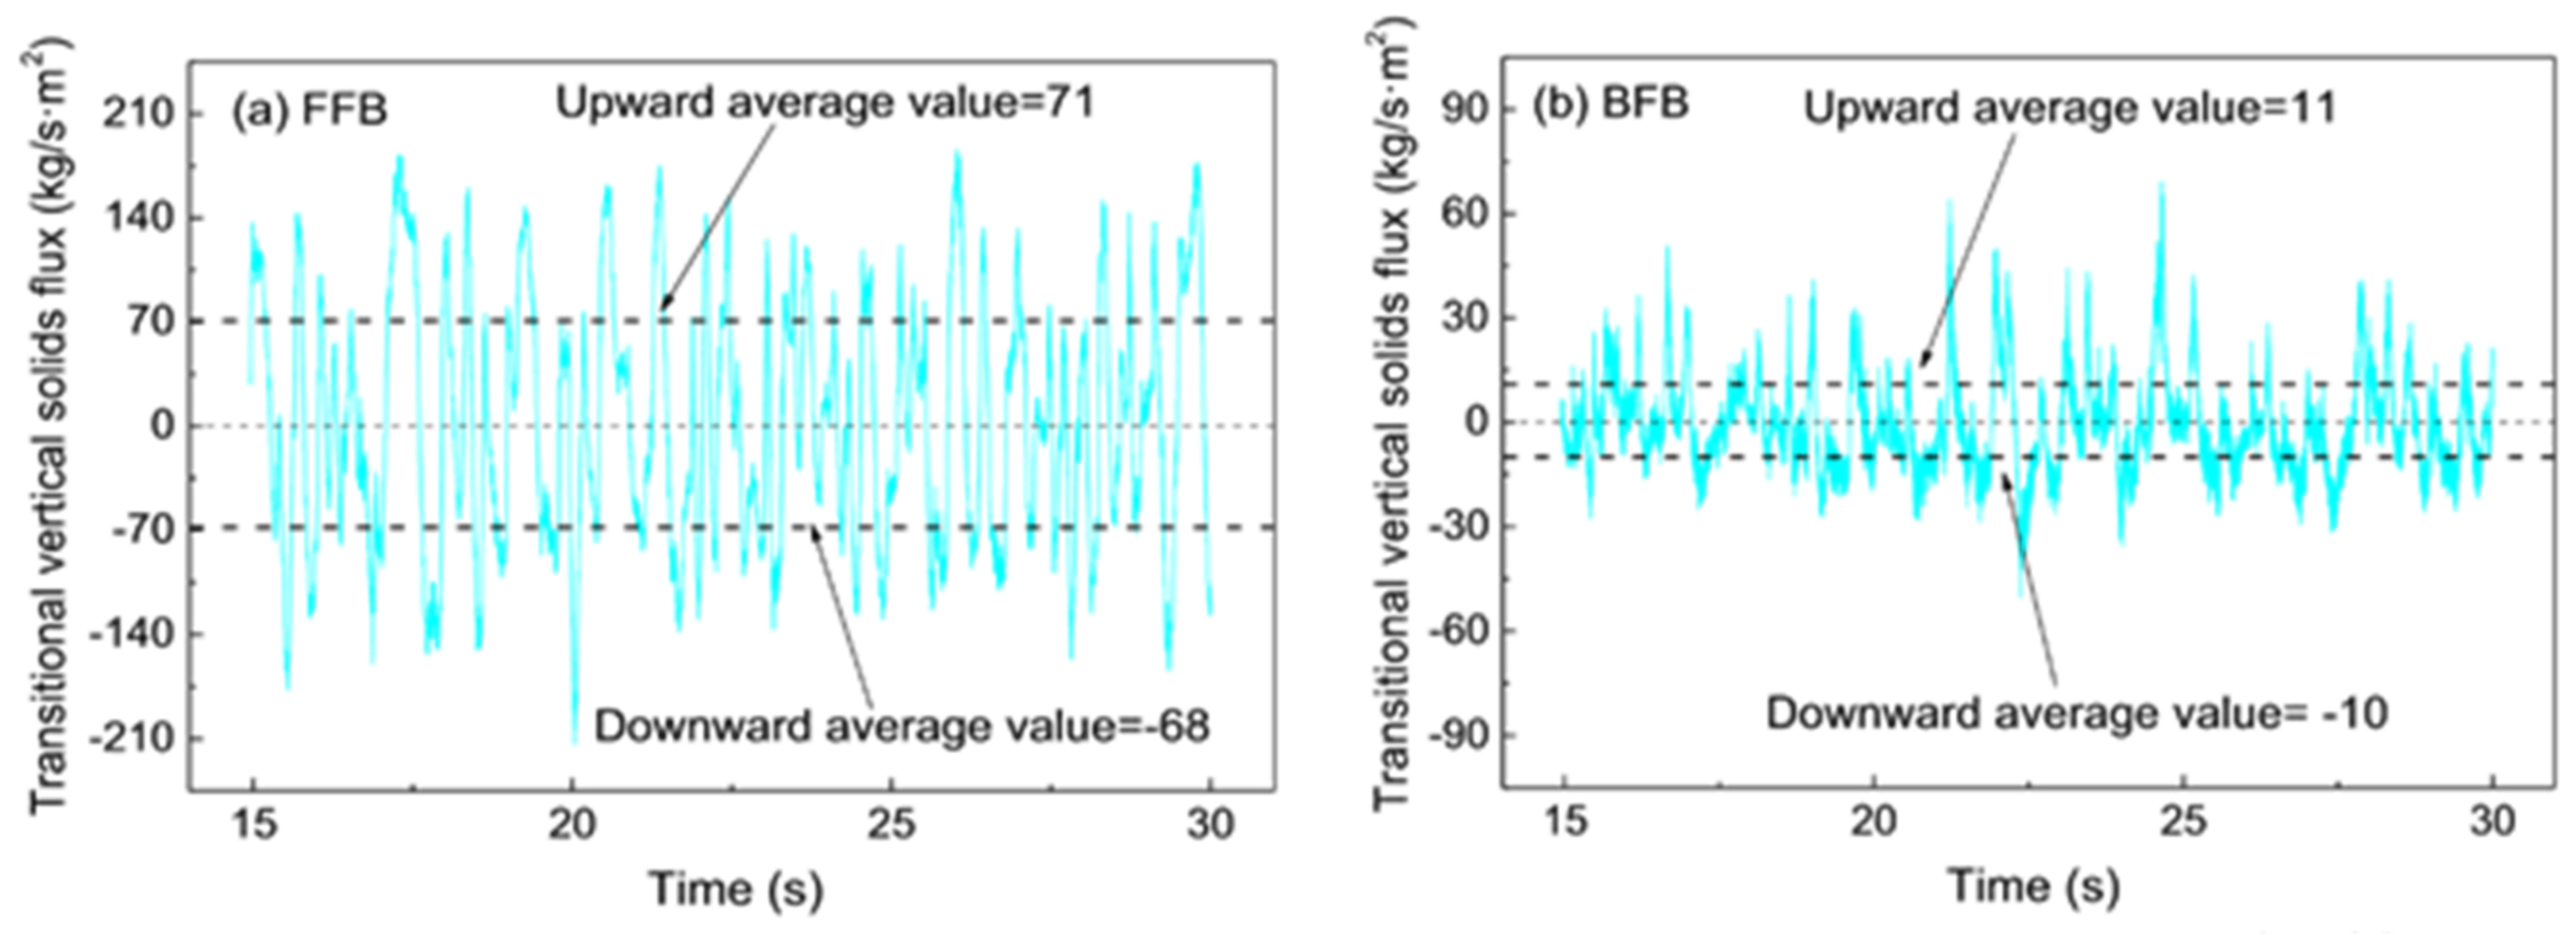
  • Installing baffles or other internals into the dense bed or freeboard can significantly suppress gas bypass or backmixing, reduce catalyst entrainment, break large bubbles, and promote even gas–solid dispersion in the bed. It significantly achieves these by distorting core–annular flow structure and compelling redistribution of gas and solids. The multilayered horizontal baffle has been proved as an effective solution not only for minimizing gas bypass but also for enhancing radial gas dispersion in the bed, but a correct geometric construction is required, which has been suggested. Additionally, maintaining differential pressure balance is a new promising route to mitigating gas bypass effect. A circumspective rise in the regenerator pressure is found to significantly deteriorate the intensity of gas bypassing, and as a result impede adverse combustion of CO in the dilute phase. It is still presently hard to achieve this industrially since the pressure balance control simultaneously interacts with the reactor–regenerator circuit.
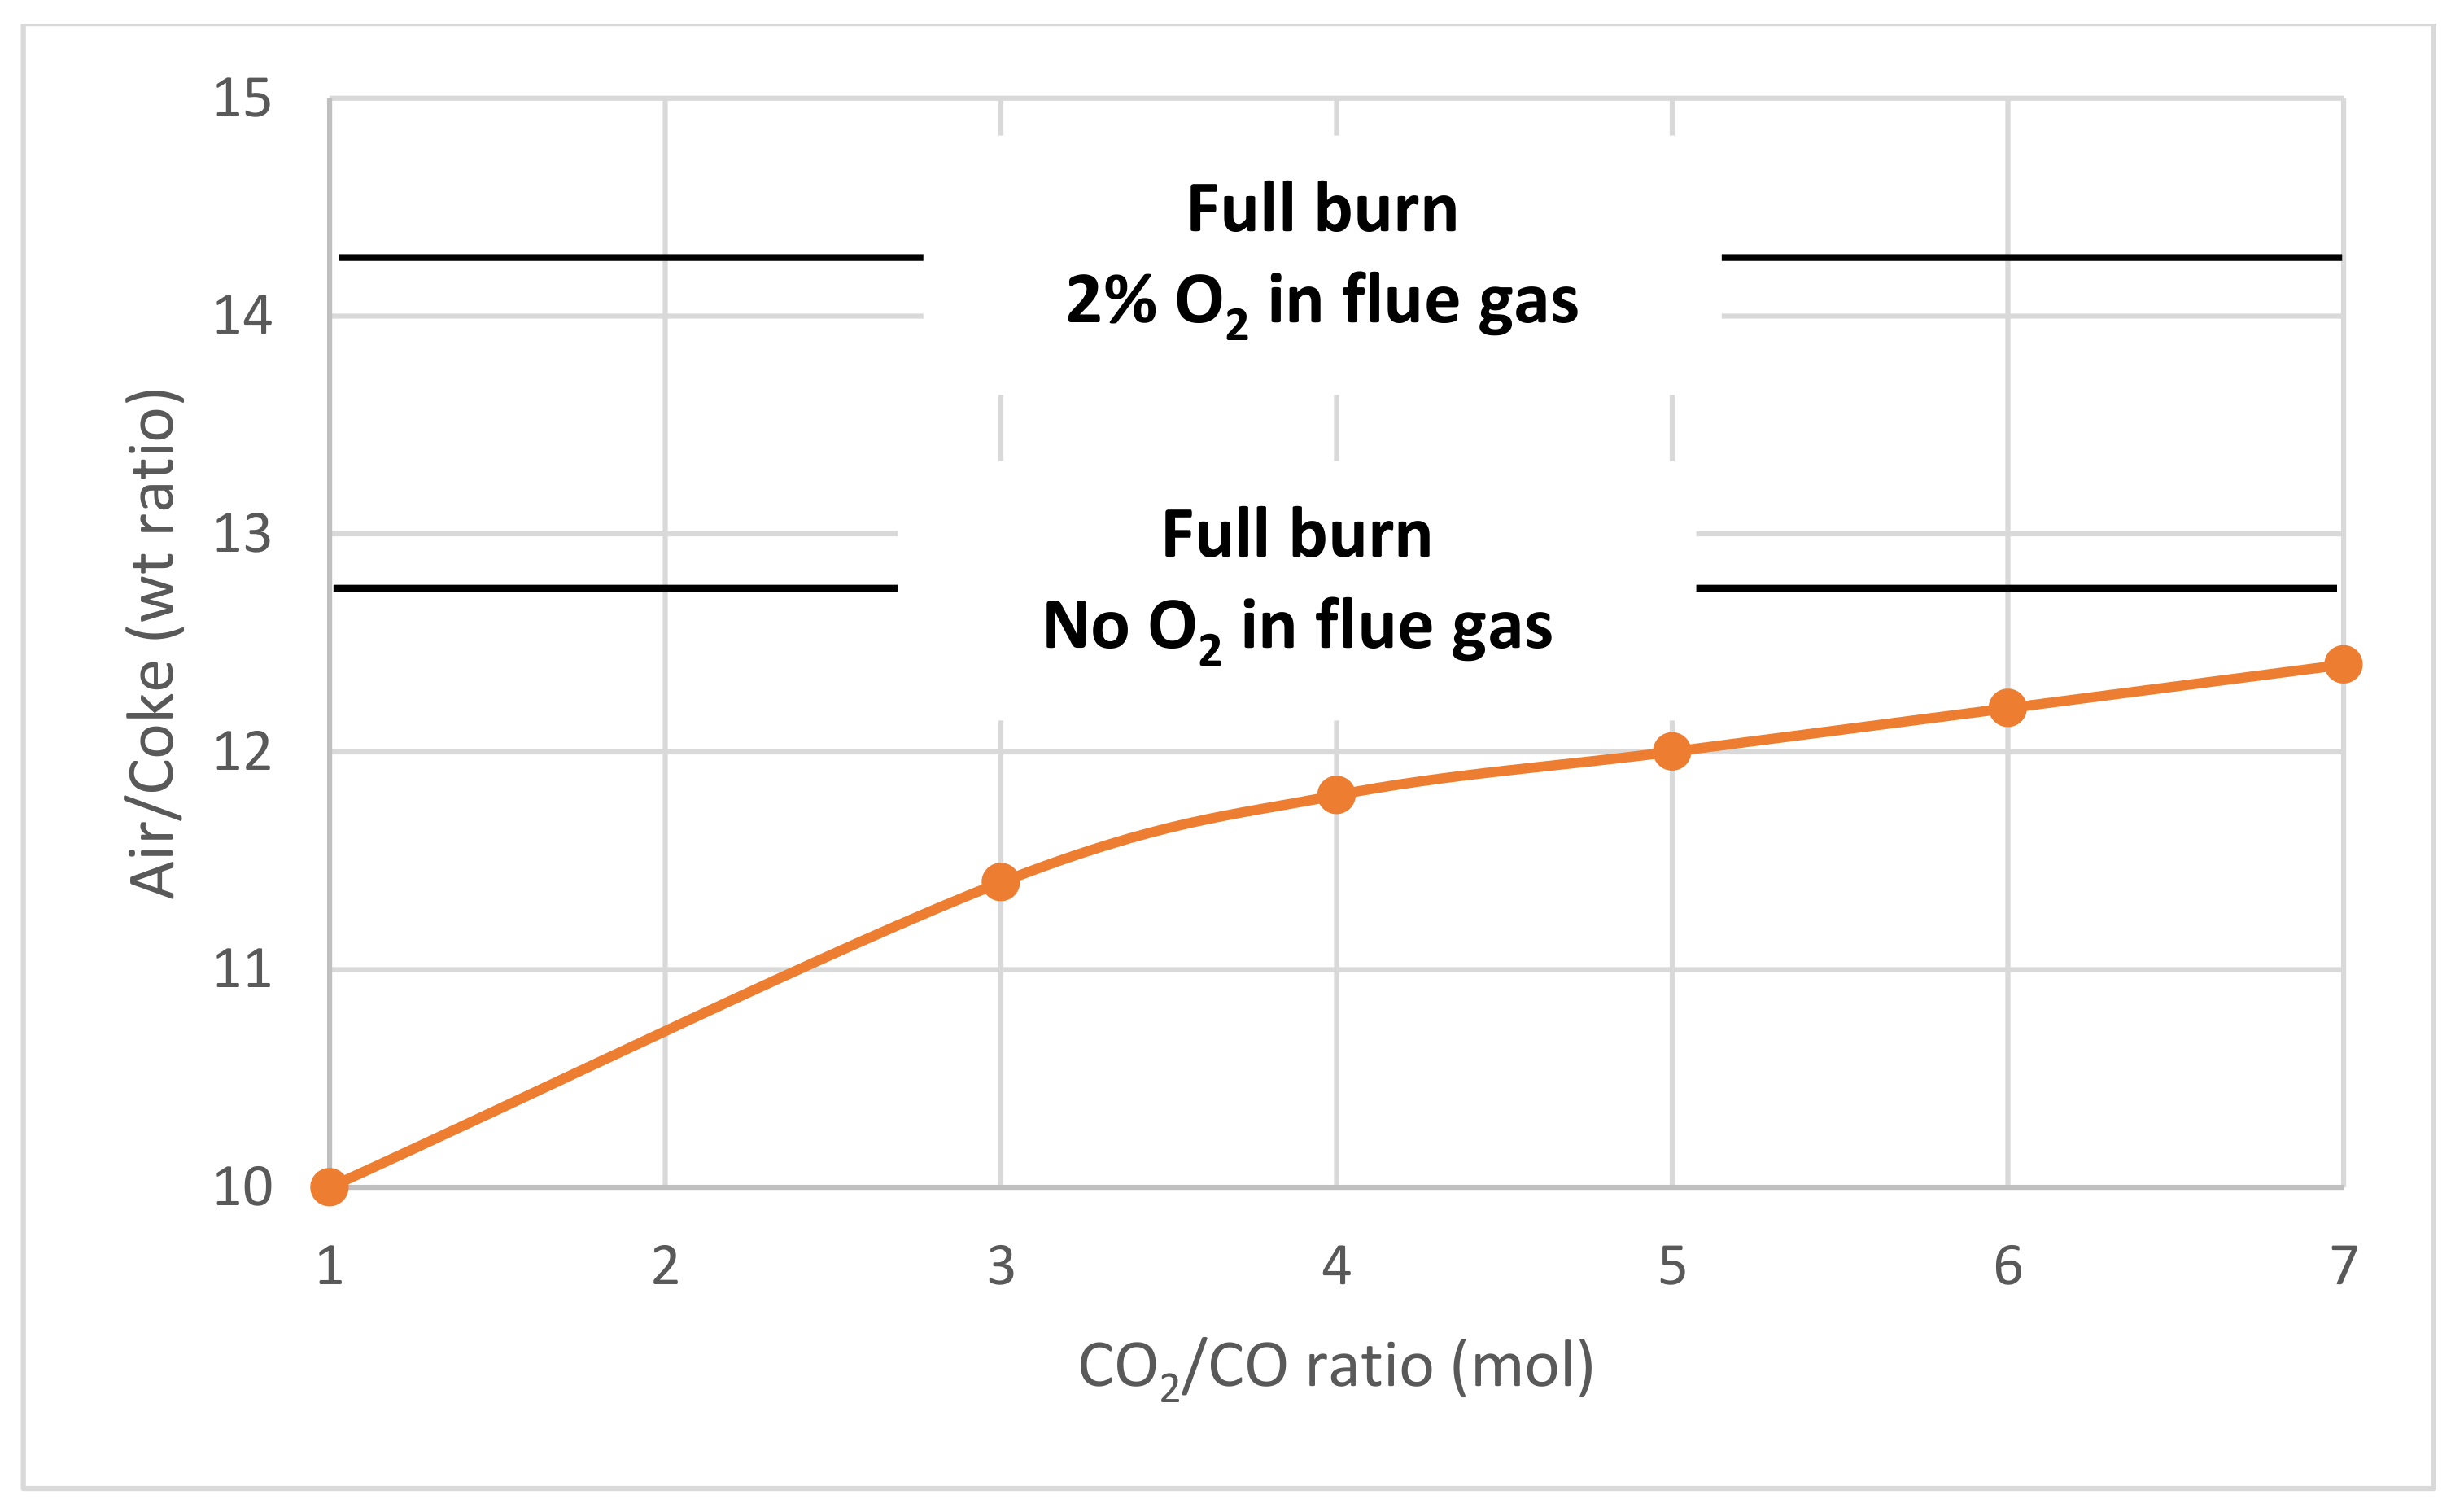
  • In regard to the influence of oxygen on afterburn effect, distinct peculiarities in full or partial burn mode are found to be key factors. Supplementing the feed gas with pure O2 or increasing the fraction of O2 is essential in full burn while minimizing the O2 level below the stoichiometry requirement is perpetually needed for a partial combustion system. In addition, to control for the afterburn effect, pressure taps must be consistently monitored to forestall catalyst flow reversal due to negative differential pressure balance.
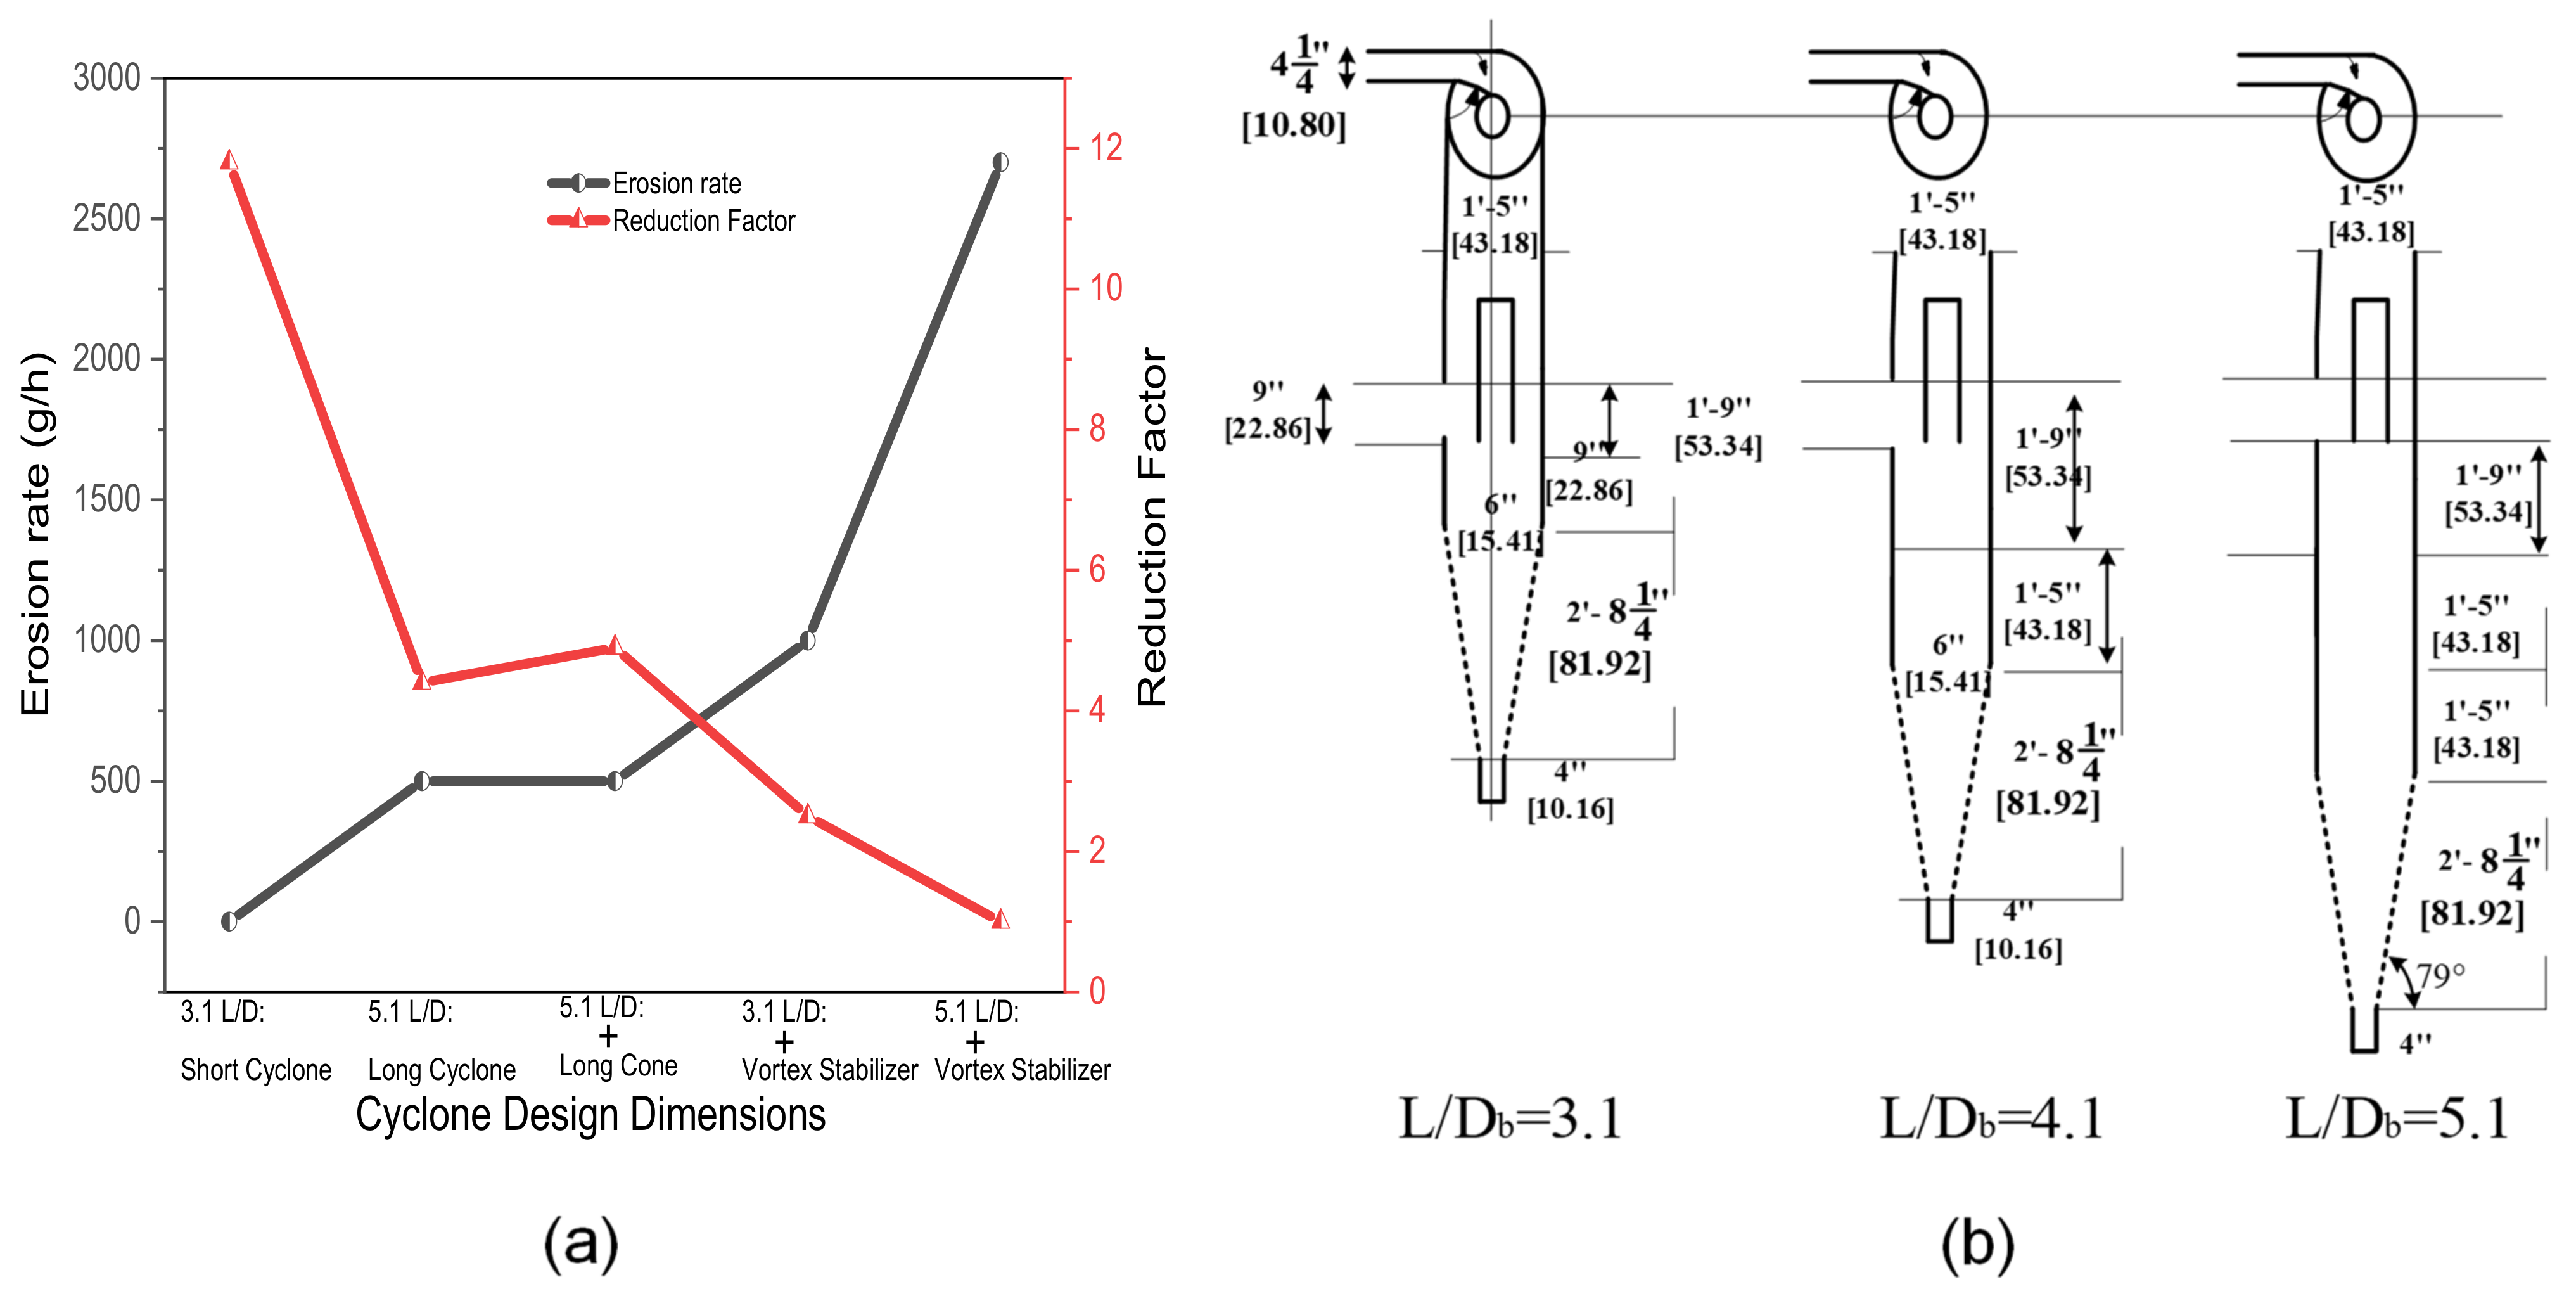
  • High-temperature erosion can be considerably curtailed, especially in the cyclone system through design modification that encompasses longer dipleg, bigger cone angle, bigger diameter and material fortification of the hardware surface. The latter is effective for chemical erosion/corrosion (oxidization attack) mitigation.
  • Commingling of process intensification strategies and structural modifications can further reduce particulates, SOx, CO and NOx emissions from regenerator to meet present and future legislation requirements. However, the existing control strategies must be further strengthened. In complete combustion mode, the CO/CO2 ratio must be minimized to promote less reductive environment for NOx formation. For full burn units, the sweet spot of oxygen must be targeted where the surfeit of O2 is close to zero, which will push the reaction in the direction of N2 formation. To this effect, counter-current regenerators instead of concurrent regenerators are well suited to accomplish this. Emission reduction additives in small quantities have also proven to be a reliable emission control option, lowering Pt concentration or switching to non-platinum-based additive in CO combustors results in excellent NOx and afterburn mitigation.

7. Future Prospects and Recommendations

Future energy gravitates towards non-gasoline fuels, improving the flexibility of FCC to process desired intermediate products and co-process biomass feedstocks. Therefore, regenerator operating conditions will need to be overhauled to efficiently reactivate coked catalyst from biomass cracking and simultaneously meet future stringent environmental demands. A deeper understanding of heat and material balances with respect to their influence on operating variables and regenerator hydrodynamics is necessary. It is uncertain that newer FCC units will be constructed especially in top economic countries in the near term; hence, more attention towards improving the performance of different components of existing units is necessary. This eventually will culminate in overall improvement in regeneration efficiency, operational reliability and profitability of the unit. The regeneration process intensification has been demonstrated with improved air or spent catalyst distributors but the potential for improvement still exists. By using numerical techniques, the performance of new FCC regenerator designs needs to be validated, especially the riser regenerator designs. A further development of cyclone with high separation efficiency and reliability is needed with valuable validation tools. Less sophisticated and cost-effective corrosion-resistant materials in the near future will also be attractive and incentivized, which would require intense research and development efforts towards other designs and acid-resistant polymers or alloys. Continued research and technology development for baffles should seek to further elucidate/investigate its hydrodynamics impact at different process conditions on the regenerator performance and reliability, especially in the freeboard. More computation and experimental studies in this regard will suffice and in turn boost confidence in its applications beyond FCCs. More importantly, focus on increasing overall regenerator operational flexibility to accommodate spent catalysts with high coke content especially from co-processing with biomass feedstocks is key to exploring favorable market opportunities.

Author Contributions

Conceptualization, Y.Z. and A.O.; methodology, A.O.; software, A.O., C.S.H. and Y.Z.; validation, A.O., Y.Z. and C.S.H.; formal analysis, A.O., C.S.H. and Y.Z.; investigation, A.O., Y.Z. and C.S.H.; resources, A.O.; data curation, A.O.; writing—original draft preparation, A.O.; writing—review and editing, A.O., Y.Z. and C.S.H.; visualization, A.O.; supervision, Y.Z. and C.S.H.; project administration, A.O.; funding acquisition, Y.Z. All authors have read and agreed to the published version of the manuscript.

Funding

This research was funded by the National Key Research and Development Program with the funding number of 2021YFF0600600 (China) and the China Government Scholarship (CSC No. 2019ZFY011300).

Institutional Review Board Statement

Not applicable.

Informed Consent Statement

Not applicable.

Data Availability Statement

Not applicable.

Acknowledgments

The authors gratefully acknowledge the financial support of the National Key Research and Development Program (2021YFF0600600) and the China Government Scholarship (CSC No: 2019ZFY011300).

Conflicts of Interest

The authors declare no conflict of interest.

Appendix A

Table A1. Co-processing of biomass-based oils with petroleum oils (fractions).
Feedstock Bio-Oils: VGO Blending RatioCatalystOperating Temperature (°C)Key FindingsAuthor
HDO oil from pine sawdust1:20
1:10
1:5
0:1
E-CAT482Coke, dry gas, increased with bio-oils. High bottom fraction yield and low gasoline yield [296]
Pine woodchips 500 µm1:2,
3:10
10:0
NiMo-Al2O3350Coke and dry gas selectivity rises with increase in bio-oil ratio. While diesel selectivity increases, that of gasoline declines[297]
HDO-oil1:4Y-zeolite500High yields of coke, aromatics and olefins. Poor quality of LCO and gasoline quality compared to pure VGO[298]
Pyrolysis Oil from forest residue1:10E-CAT350Low coke formation under high pure oxygen gas content (about 28 wt.%) condition, and vice versa[299]
HDO-oil from pine wood1:4Fresh FCC,
HY-zeolite,
HZSM-5
500Structure of zeolite catalyst influences cracking reaction, lignin polymers over the catalyst decomposed into methoxyphenols but phenolic content was poorly converted, increase in olefin, aromatics, LPG over gasoline with high coke yield. Best activity observed in FCC[300]
Pyrolysis liquids (PLs)1:9
0:10
NiCuMo/SiO2525Low gasoline and dry gas yields and high bottom, LCO, and coke yields compared to pure VGO[301]
Palm oil1:2USY+ZSM-5500–520High liquid yield of nearly 79.2%, high yield of LPG but low gasoline yield. Gasoline quality meets fuel standards[302]
FAME0–100
2:5
1:2
E-CAT550Decrease in gasoline and increase in LO, resid and coke with increase in bio-oil.[303]
Rapeseed oil7.5:15E-CAT550Increase in diesel cetane index
HPO1:10E-CAT560Hydrotreating pyro-oil improved naphtha quality compared to pure VGO [304]
HPO: hydrotreated pyrolysis oil, FAME: Fatty acid methyl esters, HDO: Hydrodeoxygenated oil, LO: low olefins, LPG: liquefied petroleum gas, LCO: light cycle oil, VGO: vacuum gas oil.

References

  1. Letzsch, W. Fluid Catalytic Cracking (FCC) in Petroleum Refining. In Handbook of Petroleum Processing; Treese, A., Pujadó, P.R., Jones, S.J.D., Eds.; Springer: London, UK, 2015; pp. 261–316. [Google Scholar]
  2. Grace, J.R.; Bi, X.; Ellis, N. Essentials of Fluidization Technology; KGaA: Boschstr. 12, 69469; Wiley-VCH Verlag GmbH & Co.: Weinheim, Germany, 2020. [Google Scholar]
  3. Li, J.; Ge, W.; Wang, W.; Yang, N.; Liu, X.; Wang, L.; He, X.; Wang, X.; Wang, J.; Kwauk, M. From Multiscale Modeling to Meso-Science; Hong Kong University of Science and Technology: Berlin-Heidelberg, Germany, 2013. [Google Scholar]
  4. Sabahi, A.; Loebl, A.J.; Galvada, S.; Francis, J.A.; Iyyamperumal, E. FCC Catalyst with More than One Silica, Its Preparation and Use. U.S. Patent 16/322,779, 4 July 2019. [Google Scholar]
  5. Hosseinpour, N.; Mortazavi, Y.; Khodadadi, A.A. Cumene cracking activity and enhanced regeneration of FCC catalysts comprising HY-zeolite and LaBO3 (B = Co, Mn, and Fe) perovskites. Appl. Catal. A Gen. 2014, 487, 26–35. [Google Scholar] [CrossRef]
  6. Li, Z.; Lu, C.-X. FCC riser quick separation system: A review. Pet. Sci. Technol. 2016, 13, 776–781. [Google Scholar] [CrossRef] [Green Version]
  7. Xie, J.; Zhong, W.; Yu, A. MP-PIC modeling of CFB risers with homogeneous and heterogeneous drag models. Adv. Powder Technol. 2018, 29, 2859–2871. [Google Scholar] [CrossRef]
  8. Myers, D.N.; Palmas, P.; Johnson, D.R.; van Opdorp, P.J. Advanced Elevated Feed Distribution System for Very Large Diameter RCC Reactor Risers. U.S. Patent Application No. 11/541,052, 3 April 2008. [Google Scholar]
  9. Yang, C.; Chen, X.; Zhang, J.; Li, C.; Shan, H. Advances of two-stage riser catalytic cracking of heavy oil for maximizing propylene yield (TMP) process. Appl. Petrochem. Res. 2014, 4, 435–439. [Google Scholar]
  10. Hsu, C.S.; Robinson, P.R. Gasoline Production. In Petroleum Science and Technology; Springer: Berlin/Heidelberg, Germany, 2019; pp. 189–210. [Google Scholar]
  11. He, L.J.; Zheng, S.Q.; Dai, Y.L. An FCC catalyst for maximizing gasoline yield. J. Chem. Chem. Eng. 2017, 66, 9–15. [Google Scholar] [CrossRef] [Green Version]
  12. Dean, C.; Letzsch, W.S. How to make anything with a catalytic cracker. In Hydrocarbon Processing; Gulf Publishing Co.: Houston, TX, USA, 2014. [Google Scholar]
  13. Sadeghbeigi, R. Fluid catalytic cracking handbook. In An Expert Guide to the Practical Operation, Design, and Optimization of FCC Units, 4th ed.; Butterworth-Heinemann: Oxford, UK, 2020. [Google Scholar]
  14. Jones, D.S.J.; Treese, S.A. Environmental Control and Engineering in Petroleum Processing. In Handbook of Petroleum Processing; Springer: Cham, Switzerland, 2015; pp. 1219–1308. [Google Scholar]
  15. Lesage, R.; Simon, H. Anchoring Structure for an Anti-Erosion Coating, in Particular for Protecting a Wall of an FCC Unit. U.S. Patent 10,799,846, 13 October 2020. [Google Scholar]
  16. Sadeghbeigi, R. Fluid Catalytic Cracking Handbook: An Expert Guide to the Practical Operation, Design, and Optimization of FCC Units; Elsevier: Amsterdam, The Netherlands, 2012. [Google Scholar]
  17. Grosdidier, P.; Mason, A.; Aitolahti, A.; Heinonen, P.; Vanhamäki, V. FCC unit reactor-regenerator control. Comput. Chem. Eng. Technol. 1993, 17, 165–179. [Google Scholar] [CrossRef]
  18. Dong, Q.; Bai, S.; Liu, Y.; Li, N.; Zhao, L.; Liu, S. Research progress of regenerator in FCC unit. J. Chem. Ind. Eng. 2013, 34, 1–4. [Google Scholar]
  19. Sadeghbeigi, R. Process Description. In Fluid Catalytic Cracking Handbook; Butterworth-Heinemann: Oxford, UK, 2012. [Google Scholar]
  20. Venugopal, R.; Selvavathy, V.; Lavanya, M.; Balu, K. Additional feedstock for fluid catalytic cracking unit. Pet. Sci. Technol. 2008, 26, 436–445. [Google Scholar] [CrossRef]
  21. Natalie, P.; Larry, H.; George, Y.; Grace, D. Profiting with FCC feedstock diversity. In Digital Refining Processing; Operations and Maintenance; W. R. Grace & Co.: Columbia, MD, USA, 2006; pp. 1–9. [Google Scholar]
  22. Olafadehan, O.; Daramola, O.; Sunmola, O.; Abatan, G. Modelling and simulation of riser reactor of a commercial fluid catalytic cracking unit using 6-lump kinetics of vacuum gas oil. Pet. Petrochem. Eng. J. 2019, 3, 000194. [Google Scholar]
  23. Letzsch, W.S.; Ashton, A.G. Chapter 12 The effect of feedstock on yields and product quality. Stud. Surf. Sci. Catal. 1993, 76, 441–498. [Google Scholar]
  24. Rodgers, R.P.; Mapolelo, M.M.; Robbins, W.K.; Chacón-Patiño, M.L.; Putman, J.C.; Niles, S.F.; Rowland, S.M.; Marshall, A.G. Combating selective ionization in the high resolution mass spectral characterization of complex mixtures. Faraday Discuss. 2019, 218, 29–51. [Google Scholar] [CrossRef] [PubMed]
  25. Altgelt, K.H. Composition and Analysis of Heavy Petroleum Fractions; CRC Press: Boca Raton, FL, USA, 1993. [Google Scholar]
  26. Al-Mutaz, I.; Al-Fariss, T. Optimum gasoline production in oil refineries by linear programming. Oil Gas Eur. Mag. 1997, 23, 43. [Google Scholar]
  27. Chen, Y.-M. Applications for fluid catalytic cracking. In Handbook of Fluidization and Fluid-Particle Systems; Marcel Dekker: New York, NY, USA, 2003; pp. 379–396. [Google Scholar]
  28. Jin, N.; Wang, G.; Yao, L.; Hu, M.; Gao, J. Synergistic process for FCC light cycle oil efficient conversion to produce high-octane number gasoline. Ind. Eng. Chem. Res. 2016, 55, 5108–5115. [Google Scholar] [CrossRef]
  29. Liu, Y.; Liu, W.; Lyu, Y.; Liu, X.; Zhang, J.; Gu, Y.; Huang, J.; Mintova, S.; Yan, Z. Intra-crystalline mesoporous SAPO-11 prepared by a grinding synthesis method as FCC promoters to increase iso-paraffin of gasoline. Micropor. Mesopor. Mater. 2020, 305, 110320. [Google Scholar] [CrossRef]
  30. Karthikeyani, A.V.; Anantharaman, N.; Prabhu, K.M.; Kumaresan, L.; Pulikottil, C.A.; Ramakumar, S.S.V. In Situ FCC gasoline sulfur reduction using spinel based additives. Int. J. Hydrog. Energy 2017, 42, 26529–26544. [Google Scholar] [CrossRef]
  31. Chen, Y.; Wang, W.; Wang, Z.; Hou, K.; Ouyang, F.; Li, D. A 12-lump kinetic model for heavy oil fluid catalytic cracking for cleaning gasoline and enhancing light olefins yield. Pet. Sci. Technol. 2020, 38, 912–921. [Google Scholar] [CrossRef]
  32. Maddah, H.A. Polypropylene as a promising plastic: A review. Am. J. Polym. Sci. 2016, 6, 1–11. [Google Scholar]
  33. Trent, D.L. Propylene oxide. In Kirk-Othmer Encyclopedia of Chemical Technology; Wiley Online Library: Hoboken, NJ, USA, 2000. [Google Scholar]
  34. Bedell, M.W.; Ruziska, P.A.; Steffens, T.R. On-purpose propylene from olefinic streams. Davison Catalagram 2004, 94, 33–42. [Google Scholar]
  35. Koempel, H.; Liebner, W. Lurgi’s Methanol To Propylene (MTP®) report on a successful commercialisation. Stud. Surf. Sci. Catal. 2007, 167, 261–267. [Google Scholar]
  36. Hsu, C.S.; Robinson, P.R. Cracking. In Petroleum Science and Technology; Springer: Berlin/Heidelberg, Germany, 2019; pp. 211–244. [Google Scholar]
  37. McGehee, J.F. Cogeneration Process for a Regenerator in an FCC System. U.S. Patent 7,802,435, 28 August 2010. [Google Scholar]
  38. Upson, L.L.; Rosser, F.S.; Hemler, C.L.; Palmas, P.; Bell, L.E.; Reagan, W.J.; Hedrick, B.W. Fluid Catalytic Cracking (FCC) Units, Regeneration. In Kirk-Othmer Encyclopedia of Chemical Technology; Wiley Online Library: Hoboken, NJ, USA, 2004; pp. 700–734. [Google Scholar]
  39. Hsu, C.S.; Robinson, P.R. Midstream Transportation, Storage, and Processing. In Petroleum Science and Technology; Springer: Berlin/Heidelberg, Germany, 2019; pp. 385–394. [Google Scholar]
  40. Speight, J. Catalytic Cracking. In Heavy Extra-Heavy Oil Upgrading Technologies; Gulf Professional Publishing: Oxford, UK, 2013; pp. 39–67. [Google Scholar]
  41. Wang, J. Continuum theory for dense gas-solid flow: A state-of-the-art review. Chem. Eng. Sci. 2020, 215, 115428. [Google Scholar] [CrossRef]
  42. Grace, J.R. Introduction, history and applications. In Essentials of Fluidization Technology; Wiley-VCH: Weinhard, Germany, 2020; pp. 11–31. [Google Scholar]
  43. Horio, M. Fluidization in natural phenomena. In Chemistry, Molecular Sciences and Chemical Engineering; Reedijk, J., Ed.; Elsevier: Waltham, MA, USA, 2017. [Google Scholar]
  44. OPEC. Historical Production Data. In OPEC Monthly Oil Market ReportVienna; Ayed, S.A., Ed.; OPEC: Vienna, Austria, 2020; pp. 1–93. [Google Scholar]
  45. Tragesser, S. FCC Regenerator Design to Minimize Catalyst Deactivation and Emissions; Shaw Energy and Chemicals Group: Houston, YX, USA, 2018; pp. 1–37. [Google Scholar]
  46. Leger, C.; Lenhert, D.; Scalise, J. FCC regenerator off gas: Cost effective emissions control. Refin. Oper. 2015, 1. Available online: https://www.lindeus.com/-/media/corporate/praxairus/documents/reports-papers-case-studies-and-presentations/industries/refining/ertc_conox_paper.pdf?rev=c3e1f85389c943bea45a0ae11a03f674 (accessed on 11 January 2022).
  47. Du, Y.; Sun, L.; Berrouk, A.S.; Zhang, C.; Chen, X.; Fang, D.; Ren, W. Novel integrated reactor-regenerator model for the fluidized catalytic cracking unit based on an equivalent reactor network. Energy Fuels 2019, 33, 7265–7275. [Google Scholar] [CrossRef]
  48. Knowlton, T.M.; Karri, S.B.R. Standpipes and return systems, separation sevices, and feeders. In Essentials of Fluidization Technology; Wiley-VCH: Weinhard, Germany, 2020; pp. 203–237. [Google Scholar]
  49. Zhang, Y.; Zha, C.; Yu, S. Experimental study on a new FCC spent catalyst distributor. In Fluidization XV; Chaouki, J., Bi, X., Cocco, R., Eds.; SEMANTIC SCHOLAR: Seattle, WA, USA, 2016. [Google Scholar]
  50. Chen, Y.-M.; Patel, M.S. Spent Catalyst Distributor. U.S. Patent 6,797,239, 28 August 2004. [Google Scholar]
  51. Mirek, P. Air distributor pressure drop analysis in a circulating fluidized-bed boiler for non-reference operating conditions. Chem. Eng. Technol. 2020, 43, 2233–2246. [Google Scholar] [CrossRef]
  52. Zhang, Y. Baffles and Aids to Fluidization. In Essentials of Fluidization Technology; Wiley-VCH: Weinhard, Germany, 2020; pp. 431–455. [Google Scholar]
  53. Cerqueira, H.S.; Sievers, C.; Joly, G.; Magnoux, P.; Lercher, J.A. Multitechnique characterization of coke produced during commercial resid FCC operation. Ind. Eng. Chem. Res. 2005, 44, 2069–2077. [Google Scholar] [CrossRef]
  54. Kalota, S.A.; Rahmim, I.I. Solve the five most common FCC problems. In Proceedings of the Advances in Fluid Catalytic Cracking I, New Orleans, LA, USA, 30 March–3 April 2003. [Google Scholar]
  55. Ahmed, N.A.; Mustala, M.A.; Seory, A.M.A. Computational fluid dynamics simulation of a fluid catalytic cracking regenerator. Univ. Khartoum Eng. J. 2016, 5, 82. [Google Scholar]
  56. Chang, J.; Wang, G.; Lan, X.; Gao, J.; Zhang, K. Computational investigation of a turbulent fluidized-bed FCC regenerator. Ind. Eng. Chem. Res. 2013, 52, 4000–4010. [Google Scholar] [CrossRef]
  57. Tang, G.; Silaen, A.K.; Wu, B.; Fu, D.; Agnello-Dean, D.; Wilson, J.; Meng, Q.; Khanna, S.; Zhou, C.Q. Numerical simulation and optimization of an industrial fluid catalytic cracking regenerator. Appl. Therm. Eng. 2017, 112, 750–760. [Google Scholar] [CrossRef] [Green Version]
  58. Amblard, B.; Singh, R.; Gbordzoe, E.; Raynal, L. CFD modeling of the coke combustion in an industrial FCC regenerator. Chem. Eng. Sci. 2017, 170, 731–742. [Google Scholar] [CrossRef]
  59. Berrouk, A.S.; Huang, A.; Bale, S.; Thampi, P.; Nandakumar, K. Numerical simulation of a commercial FCC regenerator using multiphase particle-in-cell methodology (MP-PIC). Adv. Powder Technol. 2017, 28, 2947–2960. [Google Scholar] [CrossRef]
  60. Li, Y.; Zhang, X.; Huangfu, L.; Yu, F.; Chen, Z.; Li, C.; Liu, Z.; Yu, J.; Gao, S. The simultaneous removal of SO2 and NO from flue gas over activated coke in a multi-stage fluidized bed at low temperature. Fuel 2020, 275, 117862. [Google Scholar] [CrossRef]
  61. Arbel, A.; Huang, Z.; Rinard, I.H.; Shinnar, R.; Sapre, A. Dynamic and control of fluidized catalytic crackers. 1. Modeling of the current generation of FCC’s. Ind. Eng. Chem. Res. 1995, 34, 1228–1243. [Google Scholar] [CrossRef]
  62. Cocco, R.; Karri, S.R.; Knowlton, T. Introduction to fluidization. Chem. Eng. Prog. 2014, 110, 21–29. [Google Scholar]
  63. Alsmari, T.A.; Grace, J.R.; Bi, X.T. Effects of superficial gas velocity and temperature on entrainment and electrostatics in gas–Solid fluidized beds. Chem. Eng. Sci. 2015, 123, 49–56. [Google Scholar] [CrossRef]
  64. Gao, X.; Li, T.; Sarkar, A.; Lu, L.; Rogers, W.A. Development and validation of an enhanced filtered drag model for simulating gas-solid fluidization of Geldart a particles in all flow regimes. Chem. Eng. Sci. 2018, 184, 33–51. [Google Scholar] [CrossRef]
  65. Kim, S.W.; Kim, S.D. Void properties in dense bed of cold-flow fluid catalytic cracking regenerator. Processes 2018, 6, 80. [Google Scholar] [CrossRef] [Green Version]
  66. Zhang, Y.; Lu, C. Experimental study and modeling on effects of a new multilayer baffle in a turbulent fluid catalytic cracking regenerator. Ind. Eng. Chem. Res. 2014, 53, 2062–2066. [Google Scholar] [CrossRef]
  67. Speight, J. Catalytic Cracking Processes. In Heavy Oil Recovery and Upgrading; Gulf Professional Publishing: Oxford, UK, 2019; pp. 357–421. [Google Scholar]
  68. Fotovat, F. Entrainment from bubbling and turbulent Beds. In Essentials of Fluidization Technology; Wiley-VCH: Weinheim, Germany, 2020; pp. 181–202. [Google Scholar]
  69. Letzsch, W.; Santner, C.; Tragesser, S. Improving the profitability of the FCCU. Chem. Ind. 2010, 129, 91–100. [Google Scholar]
  70. Zhang, F.; Zhang, Z.; Liu, Y.; Zhong, Z.; Xing, W. Effect of gas distributor on hydrodynamics and the rochow reaction in a fluidized bed membrane reactor. Ind. Eng. Chem. Res. 2016, 55, 10600–10608. [Google Scholar] [CrossRef]
  71. Windows-Yule, C.R.K.; Gibson, S.; Werner, D.; Parker, D.J.; Kokalova, T.Z.; Seville, J.P.K. Effect of distributor design on particle distribution in a binary fluidised bed. Powder Technol. 2020, 367, 1–9. [Google Scholar] [CrossRef]
  72. Schwarz, M.P. Simulation of the BP FCC regenerator: Coke combustion and temperature distribution. In Proceedings of the Chemeca: Knowledge Innovation (Conference), Engineers Australia, Auckland, New Zealand, 17–20 September 2006; pp. 701–707. [Google Scholar]
  73. Bai, D.; Zhu, J.-X.; Jin, Y.; Yu, Z. Novel designs and simulations of FCC riser regeneration. Ind. Eng. Chem. Res. 1997, 36, 4543–4548. [Google Scholar] [CrossRef]
  74. Cabrera, C.A.; Myers, D.N.; Hammershaimb, H.U. Partial CO Combustion with Staged Regeneration of Catalyst. U.S. Patent 4,849,091, 18 July 1989. [Google Scholar]
  75. Letzsch, W. Process and Apparatus for Controlling Catalyst Temperature in a Catalyst Stripper. U.S. Patent 7,273,543, 25 August 2007. [Google Scholar]
  76. Wilson, J.W. FCC regenerator afterburn–Causes and cures. In Proceedings of the Annual Meeting of the NPRA (National Petrochemical and Refiners Association), Washington, DC, USA, 10 June 2003. [Google Scholar]
  77. Schwarz, M.P.; Lee, J. Reactive CFD simulation of an FCC regenerator. Asia-Pac. J. Chem. Eng. 2007, 2, 347–354. [Google Scholar] [CrossRef]
  78. Matula, J.P.; Weinberg, H.N.; Weissman, W. Flexicoking: An Advanced Fluid Coking Process, Preprint 4572, From proceedings–American Petroleum Institute. Div. Refin. 1972, 52, 665–681. [Google Scholar]
  79. Hsing, H.; Mudra, J., IV. Fluid Catalytic Cracking Process Yielding Hydrogen. U.S. Patent 5,362,380, 8 November 1993. [Google Scholar]
  80. Corma, A.; Palomares, A.E.; Rey, F. Optimization of SOx additives of FCC catalysts based on MgO-Al2O3 mixed oxides produced from hydrotalcites. Appl. Catal. B-Environ. 1994, 4, 29–43. [Google Scholar] [CrossRef]
  81. Hettinger, W.P., Jr. Catalysis challenges in fluid catalytic cracking: A 49 year personal account of past and more recent contributions and some possible new and future directions for even further improvement. Catal. Today 1999, 53, 367–384. [Google Scholar] [CrossRef]
  82. Corma, A.; Sauvanaud, L.; Doskocil, E.; Yaluris, G. Coke steam reforming in FCC regenerator: A new mastery over high coking feeds. J. Catal. 2011, 279, 183–195. [Google Scholar] [CrossRef] [Green Version]
  83. Miller, R.; Johnson, T.; Santner, C.; Avidan, A.; Beech, J. Comparison between Single and Two-Stage FCC Regenerators; National Petroleum Refiners Association: Washington, DC, USA, 1996. [Google Scholar]
  84. Pan, J.; Wu, G.; Yang, D. Thermal-hydraulic calculation and analysis on water wall system of 600 MW supercritical CFB boiler. Appl. Therm. Eng. 2015, 82, 225–236. [Google Scholar] [CrossRef]
  85. Chinsuwan, A.; Dutta, A.; Janlasad, N. Prediction of the heat flux profile on the furnace wall of circulating fluidized bed boilers. J. Energy Inst. 2014, 87, 314–320. [Google Scholar] [CrossRef]
  86. Ganapathy, V. Steam Generators and Waste Heat Boilers: For Process and Plant Engineers; CRC Press: Boca Raton, FL, USA, 2014. [Google Scholar]
  87. Kakac, S.; Liu, H.; Pramuanjaroenkij, A. Heat Exchangers: Selection, Rating, and Thermal Design; CRC Press: Boca Raton, FL, USA, 2020. [Google Scholar]
  88. Singh, R.; Gbordzoe, E. Modeling FCC spent catalyst regeneration with computational fluid dynamics. Powder Technol. 2017, 316, 560–568. [Google Scholar] [CrossRef]
  89. Haddad, J.H.; Owen, H.; Ross, M.S. Catalyst Regeneration in a Single Stage Regenerator Converted to a Two Stage High Efficiency Regenerator. U.S. Patent 5,158,919A, 27 October 1992. [Google Scholar]
  90. Ding, J.; Freeman, B.; Rochelle, G.T. Regeneration design for NGCC CO2 capture with amine-only and hybrid amine/membrane. Energy Procedia 2017, 114, 1394–1408. [Google Scholar] [CrossRef]
  91. Myers, D.N.; Tretyak, M.; Pittman, R.M.; Niewiedzial, S. FCC Spent Catalyst Distributor. U.S. Patent 7,368,090 B2, 6 May 2008. [Google Scholar]
  92. Palmas, P.; Myers, D.N. Catalyst Cooler for Regenerated Catalyst. U.S. Patent 9,587,824 B2, 7 March 2017. [Google Scholar]
  93. Bai, Y. Heat transfer in the circulating fluidized bed of a commercial catalyst cooler. Powder Technol. 2000, 111, 83–93. [Google Scholar] [CrossRef]
  94. Chan, T.Y.; Soni, D.S. Advances in catalyst cooler technology. In Digital Refining Processing, Operations and Maintenance; Digital Refining: Croydon, UK, 1999; pp. 1–5. [Google Scholar]
  95. Johnson, D.R.; Brandner, K.J. FCC Catalyst Cooler. U.S. Patent 5,209,287, 11 May 1993. [Google Scholar]
  96. Lomas, D.A.; Thompson, G.J. Fluid Catalyst Regeneration Process. U.S. Patent 4,353,812, 12 October 1982. [Google Scholar]
  97. Stankiewicz, A.; van Gerven, T.; Stefanidis, G. The Fundamentals of Process Intensification; Wiley-VCH: Weunheim, Germany, 2019. [Google Scholar]
  98. Luckenbach, E.C. Method of Temperature Control in Catalyst Regeneration. U.S. Patent 4,009,121, 22 February 1977. [Google Scholar]
  99. Owen, H. Method for Catalytic Cracking of Residual Oils. U.S. Patent 3,886,060A, 27 May 1975. [Google Scholar]
  100. Li, J.; Yao, X.; Liu, L.; Zhong, X.; Lu, C. Heat transfer characterization and improvement in an external catalyst cooler fluidized bed. Particuology 2020, 56, 103–112. [Google Scholar] [CrossRef]
  101. Bubalik, M.; Nagy, L.; Csaszar, Z.; Thernesz, A. Installation of an electrostatic precipitator in the FCC plant of Duna Refinery (DR). MOL Sci. Mag. 2010, 2, 52–59. [Google Scholar]
  102. Golden, S.W. Approaching the revamp. In Hydrocarbon Technology International; Process Consulting Services, Inc.: Houston, TX, USA, 1995; pp. 47–55. [Google Scholar]
  103. Carter, M.A.; Camille, A.K.; Fewel, K.; Ciobotaru, R.; Diwanji, B. Catalyst Heat Removal Cluster and Tube Design. U.S. Patent 10,782,075B2, 22 September 2020. [Google Scholar]
  104. Lomas, D.A. Inverted Backmix Coolers for FCC Units. U.S. Patent 5,212,129A, 18 May 1993. [Google Scholar]
  105. Lengemann, R.A. FCC Process with Dual Function Catalyst Cooling. U.S. Patent 5,800,697, 1 January 1998. [Google Scholar]
  106. Wang, H.; Chai, Z.; Zheng, T. Analysis of pneumatic controlled external cooler in FCC unit. Pet. Refin. Eng. 2003, 11, 12–14. [Google Scholar]
  107. Yao, X.; Sun, F.; Zhang, Y.; Lu, C. Experimental validation of a new heat transfer intensification method for FCC external catalyst coolers. Chem. Eng. Processing Process Intensif. 2014, 75, 19–30. [Google Scholar] [CrossRef]
  108. Mozón, E.M.L.; de Pádua, T.F.; Braga, M.G.R.; Lopes, G.C. CFD preliminary study of gas-solid flow in FCC catalyst coolers. In Proceedings of the Modelling, Simulation and Identification/841: Intelligent Systems and Control, Campinas, Brazil, 16–18 August 2016. [Google Scholar]
  109. Li, J.; Yao, X.; Liu, L.; Lu, C. Investigation on distribution of particles in inlet region of an FCC external catalyst cooler with different inlet structures. Powder Technol. 2020, 362, 267–277. [Google Scholar] [CrossRef]
  110. Hedrick, B.W. Three-Stage Counter-Current FCC Regenerator. U.S. Patent 7,915,191, 29 March 2011. [Google Scholar]
  111. Miller, R.; Yang, Y.; Johnson, T. RegenMaxTM Technology, Staged Combustion in a Single Regenerator. In Proceedings of the 1999 NPRA Annual Meeting, San Antonio, TX, USA, 21–23 March 1999. AM-99-14. [Google Scholar]
  112. Raterman, M.F. Two-Stage Fluid Bed Regeneration of Catalyst with Shared Dilute Phase. U.S. Patent 5,198,397, 30 March 1993. [Google Scholar]
  113. Jin, Y.; Yu, Z.-Q.; Bai, D.; Wei, F. Downlink FCC Riser Two-Stage Regeneration Unit. China Patent No. 932199720, 30 July 1993. [Google Scholar]
  114. Davydov, L.; Sandacz, M.S.; Palmas, P.; Fei, Z.; Lippmann, M. FCC Counter-Current Regenerator with a Regenerator Riser. U.S. Patent 10,751,684 B2, 25 August 2020. [Google Scholar]
  115. Rowe, F. Regeneration of Cracking Catalyst in Two Successive Zones. U.S. Patent 4,388,218, 14 June 1983. [Google Scholar]
  116. Long, S.L.; Ross, J.L.; Krishnaiah, G. Apparatus for Controlling Catalyst Temperature during Regeneration. U.S. Patent 5,571,482, 5 November 1996. [Google Scholar]
  117. Li, J.; Luo, G.; Wei, F. A multistage NOx reduction process for a FCC regenerator. Chem. Eng. J. 2011, 173, 296–302. [Google Scholar] [CrossRef]
  118. Mann, R. Fluid catalytic cracking: Some recent developments in catalyst particle design and unit hardware. Catal. Today 1993, 1, 509–528. [Google Scholar] [CrossRef]
  119. Zhang, C.; Qian, W.; Wang, Y.; Luo, G.; Wei, F. Heterogeneous catalysis in multi-stage fluidized bed reactors: From fundamental study to industrial application. Can. J. Chem. Eng. 2019, 97, 636–644. [Google Scholar] [CrossRef]
  120. Pereira, H.B.; Sandes, E.F.; Gilbert, W.R.; Roncolatto, R.E.; Gobbo, R.; Casavechia, L.C.; Candido, W.V.C.; Bridi, P.E.; Brasileiro, S.P. Impact of FCC Regenerator Design in the NOx Emissions. In Proceedings of the Rio Oil and Gas Expo and Conference 2012, Rio de Janeiro, Brazil, 17–20 September 2012. [Google Scholar]
  121. Letzsch, W. Fluid catalytic cracking (FCC). In Handbook of Petroleum Processing; Springer: Berlin/Heidelberg, Germany, 2008; pp. 239–286. [Google Scholar]
  122. Bai, D.; Zhu, J.; Jin, Y.; Yu, Z. Simulation of FCC catalyst regeneration in a riser regenerator. Chem. Eng. J. 1998, 71, 97–109. [Google Scholar] [CrossRef]
  123. Liu, X.; Lu, C.; Shi, C. Post-riser regeneration technology in FCC unit. Petrol. Sci. 2007, 4, 91–96. [Google Scholar] [CrossRef] [Green Version]
  124. Yang, Z.; Zhang, Y.; Oloruntoba, A.; Yue, J. MP-PIC simulation of the effects of spent catalyst distribution and horizontal baffle in an industrial FCC regenerator. Part I: Effects on hydrodynamics. Chem. Eng. J. 2021, 412, 128634. [Google Scholar] [CrossRef]
  125. Miller, R.B.; Yang, Y.-L. Staged Catalyst Regeneration in a Baffled Fluidized Bed. U.S. Patent 6,503,460, 7 July 2003. [Google Scholar]
  126. Gao, Z.; Chai, X.; Zhou, E.; Jia, Y.; Duan, C.; Tang, L. Effect of the distributor plugging ways on fluidization quality and particle stratification in air dense medium fluidized bed. Int. J. Min. Sci. Technol. 2020, 30, 883–888. [Google Scholar] [CrossRef]
  127. Chen, Y.; Brosten, D.J. Standpipe Inlet Enhancing Particulate Solids Circulation for Petrochemical and Other Processes. U.S. Patent 6,228,328B1, 8 May 2001. [Google Scholar]
  128. Huq, I.; Moran, M.; Sorensen, R.C. Modifications to model IV fluid catalytic cracking units to improve dynamic performance. AlChE J. 1995, 41, 1481–1499. [Google Scholar] [CrossRef]
  129. Chen, Y.M. Recent advances in FCC technology. Powder Technol. 2006, 163, 2–8. [Google Scholar] [CrossRef]
  130. Kauff, D.A.; Bartholic, D.B.; Steves, C.A.; Keim, M.R. Successful application of the MSCC process, CONF-960356. In Proceedings of the 1996 National Petroleum Refiners Association Annual Meeting, San Antonio, TX, USA, 17–19 May 1996. [Google Scholar]
  131. Hsu, C.S.; Robinson, P.R. Springer Handbook of Petroleum Technology; Springer: Berlin/Heidelberg, Germany, 2017. [Google Scholar]
  132. Sexton, J.A. FCC cyclone using acoustic detectors. U.S. Patent 10,239,034, 26 March 2019. [Google Scholar]
  133. Chen, Y.M. Evolution of FCC-past present and guture and the challenges of operating a high temperature CFB system. In Proceedings of the 10th International Conferences on Circulating Fluidized Beds and Fluidization Technology, ECI Symposium Series, Sun River, OR, USA, 1–5 May 2013; p. 29. [Google Scholar]
  134. Li, G.; Yang, X.; Dai, G. CFD simulation of effects of the configuration of gas distributors on gas–liquid flow and mixing in a bubble column. Chem. Eng. Sci. 2009, 64, 5104–5116. [Google Scholar] [CrossRef]
  135. Karri, S.R.; Werther, J. Gas distributor and plenum design in fluidized beds. In Handbook of Fluidization and Fluid-Particle Systems; Yang, W.-C., Ed.; Marcel Dekker: New York, NY, USA, 2003; pp. 155–170. [Google Scholar]
  136. Li, G.; Cai, Q.; Dai, G.; Yang, X. Numerical simulations of fluid dynamics and mixing in a large shallow bubble column: Effects of the sparging pipe allocations for multiple-pipe gas distributors. Int. J. Eng. Syst. Model. Simul. 2009, 1, 165–175. [Google Scholar] [CrossRef]
  137. Kaewklum, R.; Kuprianov, V.I. Experimental studies on a novel swirling fluidized-bed combustor using an annular spiral air distributor. Fuel 2010, 89, 43–52. [Google Scholar] [CrossRef]
  138. Sánchez-Delgado, S.; Marugán-Cruz, C.; Serrano, D.; Briongos, J.V. Distributor performance in a bubbling fluidized bed: Effects of multiple gas inlet jet and bubble generation. Chem. Eng. Sci. 2019, 195, 367–380. [Google Scholar] [CrossRef]
  139. Cocco, R.; Shaffer, F.; Karri, S.R.; Hays, R.; Knowlton, T. Particle Clusters in Fluidized Beds. Proc. Int. Conf. Fluidization XIII—New Paradigm in Fluidization Engineering; ECI: Westover, MD, USA, 16–21 May 2010; pp. 45–48. [Google Scholar]
  140. Cooper, C. FCC Air/Steam Rings; Shaw’s Energy & Chemicals Group: Baton Rouge, LA, USA, 2011. [Google Scholar]
  141. Wolschlag, L.; Couch, K. UOP FCC innovations developed using sophisticated engineering tools. In Proceedings of the 3rd AIChE Regional Process Technology Conference Texas, Galveston, TX, USA, 6–7 October 2011. [Google Scholar]
  142. Wells, J.W. Streaming flow in large scale fluidization, Paper 201e. In Proceedings of the AIChE Annual Meeting, Particle Technology Forum, Reno, NV, USA, 4–9 November 2001. [Google Scholar]
  143. Filho, R.M.; Batista, L.L.; Fusco, M. A fast fluidized bed reactor for industrial FCC regenerator. Chem. Eng. Sci. 1996, 51, 1807–1816. [Google Scholar] [CrossRef]
  144. Sánchez-Prieto, J.; Soria-Verdugo, A.; Briongos, J.; Santana, D. The effect of temperature on the distributor design in bubbling fluidized beds. Powder Technol. 2014, 261, 176–184. [Google Scholar] [CrossRef]
  145. Dhotre, M.T.; Joshi, J.B. Design of a gas distributor: Three-dimensional CFD simulation of a coupled system consisting of a gas chamber and a bubble column. Chem. Eng. J. 2007, 125, 149–163. [Google Scholar] [CrossRef]
  146. Kwangbyol, J.; Yali, F.; Haoran, L. Effect of gas distributor structure on fluidization characteristics in a gas-solid fluidized bed. China Pet. Processing Petrochem. Technol. 2020, 22, 102–110. [Google Scholar]
  147. Hassan, M.; Schwarz, M.P.; Yuqing, F.; Rafique, M.; Witt, P.; Huilin, L. Numerical investigation of solid circulation flux in an internally circulating fluidized bed with different gas distributor designs. Powder Technol. 2016, 301, 1103–1111. [Google Scholar] [CrossRef]
  148. Zhao, W.; Wang, T.; Wang, C.; Sha, Z. Hydrodynamic behavior of an internally circulating fluidized bed with tubular gas distributors. Particuology 2013, 11, 664–672. [Google Scholar] [CrossRef]
  149. Rahimpour, F.; Zarghami, R.; Mostoufi, N. Effect of distributor on fluidized bed hydrodynamics. Can. J. Chem. Eng. 2017, 95, 2221–2234. [Google Scholar] [CrossRef]
  150. Sathiyamoorthy, D.; Horio, M. On the influence of aspect ratio and distributor in gas fluidized beds. Chem. Eng. J. 2003, 93, 151–161. [Google Scholar] [CrossRef]
  151. Knowlton, T.; Hirsan, I. The effect of pressure on jet penetration in semi-cylindrical gas-fluidized beds. In Fluidization; Springer: Berlin/Heidelberg, Germany, 1980; pp. 315–324. [Google Scholar]
  152. Lau, R.; Sim, W.S.B.; Mo, R. Effect of gas distributor on hydrodynamics in shallow bubble column reactors. Can. J. Chem. Eng. 2009, 87, 847–854. [Google Scholar] [CrossRef]
  153. Sobrino, C.; Ellis, N.; de Vega, M. Distributor effects near the bottom region of turbulent fluidized beds. Powder Technol. 2009, 189, 25–33. [Google Scholar] [CrossRef] [Green Version]
  154. Chyang, C.-S.; Lieu, K.; Hong, S.-S. The effect of distributor design on gas dispersion in a bubbling fluidized bed. J. Chin. Inst. Chem. Eng. 2008, 39, 685–692. [Google Scholar] [CrossRef]
  155. Kulkarni, A.V.; Badgandi, S.V.; Joshi, J.B. Design, Design of ring and spider type spargers for bubble column reactor: Experimental measurements and CFD simulation of flow and weeping. Chem. Eng. Res. Des. 2009, 87, 1612–1630. [Google Scholar] [CrossRef]
  156. Kulkarni, A.V. Design of a pipe/ring type of sparger for a bubble column reactor. Chemi. Eng. Technol. 2010, 33, 1015–1022. [Google Scholar] [CrossRef]
  157. Oloruntoba, A.; Zhang, Y.; Xiao, H. Study on effect of gas distributor in fluidized bed reactors by hydrodynamics-reaction-coupled simulations. Chem. Eng. Res. Des. 2022, 177, 431–447. [Google Scholar] [CrossRef]
  158. Hilal, N.; Ghannam, M.; Anabtawi, M. Effect of bed diameter, distributor and inserts on minimum fluidization velocity. Chem. Eng. Technol. 2001, 24, 161–165. [Google Scholar] [CrossRef]
  159. Dhrioua, M.; Hassen, W.; Kolsi, L.; Anbumalar, V.; Alsagri, A.S.; Borjini, M.N. Gas distributor and bed material effects in a cold flow model of a novel multi-stage biomass gasifier. Biomass Bioenergy 2019, 126, 14–25. [Google Scholar] [CrossRef]
  160. Ouyang, F.; Levenspiel, O. Spiral distributor for fluidized beds. Ind. Eng. Chem. Process Des. Dev. 1986, 25, 504–507. [Google Scholar] [CrossRef]
  161. Son, S.-Y.; Lee, D.H.; Han, G.Y.; Kim, D.J.; Sim, S.J.; Kim, S.D. Effect of air distributor on the fluidization characteristics in conical gas fluidized beds. Korean J. Chem. Eng. 2005, 22, 315–320. [Google Scholar] [CrossRef]
  162. Akbari, V.; Borhani, T.N.G.; Aramesh, R.; Hamid, M.K.A.; Shamiri, A.; Hussain, M.A. Evaluation of hydrodynamic behavior of the perforated gas distributor of industrial gas phase polymerization reactor using CFD-PBM coupled model. Comput. Chem. Eng. J. 2015, 82, 344–361. [Google Scholar] [CrossRef]
  163. Pham, H.H.; Lim, Y.-I.; Han, S.; Lim, B.; Ko, H.-S. Hydrodynamics and design of gas distributor in large-scale amine absorbers using computational fluid dynamics. Korean J. Chem. Eng. 2018, 35, 1073–1082. [Google Scholar] [CrossRef]
  164. Bussey, B.K.; Glasgow, P.E.; Kalota, S.A.; Niccum, P.K. Spent Catalyst Distribution. U.S. Patent 5,773,378A, 30 June 1998. [Google Scholar]
  165. Sapre, A.; Leib, T.; Anderson, D. FCC regenerator flow model. Chem. Eng. Sci. 1990, 45, 2203–2209. [Google Scholar] [CrossRef]
  166. Hu, C.; Zhou, Z.; Zhang, J.; Si, X. A survey on life prediction of equipment. Chin. J. Aeronaut. 2015, 28, 25–33. [Google Scholar] [CrossRef] [Green Version]
  167. Yang, Z.; Zhang, Y.; Liu, T.; Oloruntoba, A. MP-PIC simulation of the effects of spent catalyst distribution and horizontal baffle in an industrial FCC regenerator. Part II: Effects on regenerator performance. Chem. Eng. J. Adv. 2021, 421, 129694. [Google Scholar] [CrossRef]
  168. Serrand, W.; Holmes, P.; Steffens, T.R.; Terry, P.H.; Eberly, P.E. Catalytic Cracking Process with Circulation of Hot, Regenerated Catalyst to the Stripping Zone. U.S. Patent No. 5,348,642A, 20 September 1994. [Google Scholar]
  169. Shabaker, H.A. Temperature Control of Exothermic Reactions. U.S. Patent 2,816,010A, 10 December 1957. [Google Scholar]
  170. Parker, J.; Blaser, P. Validation and utilization of CFD for reducing CO emissions from an FCC regenerator. In Proceedings of the 5th Annual TRC-Idemitsu Workshop, Abu Dhabi, United Arab Emirates, 11–15 February 2015. [Google Scholar]
  171. Shah, M.T.; Pareek, V.K.; Evans, G.M.; Utikar, R.P. Effect of baffles on performance of fluid catalytic cracking riser. Particuology 2018, 38, 18–30. [Google Scholar] [CrossRef]
  172. Harrison, D.; Grace, J.R. Fluidized beds with internal baffles. In Fluidization; Academic Press: Cambridge, UK, 1971. [Google Scholar]
  173. Markham, C.L.; Muldowney, G.P. Baffled FCC Regeneration Process and Apparatus. U.S. Patent 5,288,397A, 22 February 1994. [Google Scholar]
  174. Veluswamy, G.K.; Upadhyay, R.K.; Utikar, R.P.; Evans, G.M.; Tade, M.O.; Glenny, M.E.; Roy, S.; Pareek, V.K. Hydrodynamics of a fluid catalytic cracking stripper using γ-ray densitometry. Ind. Eng. Chem. Res. 2011, 50, 5933–5941. [Google Scholar] [CrossRef]
  175. Grace, J.R. Hydrodynamics of Bubbling Fluidization. In Essentials of Fluidization Technology; Wiley-VCH: Weinheim, Germany, 2020; pp. 131–152. [Google Scholar]
  176. Zhang, Y. Hydrodynamic and Mixing Properties of a Novel Baffled Fluidized Bed. Ph.D. Dissertation, China University of Petroleum, Beijing, China, 2009. [Google Scholar]
  177. Kwauk, M. Chemical Engineering Handbook; Shi, J., Wang, J., Eds.; Chemical Industry Press: Beijing, China, 1996; pp. 94–95. [Google Scholar]
  178. Zhang, Y.; Grace, J.R.; Bi, X.; Lu, C.; Shi, M. Effect of louver baffles on hydrodynamics and gas mixing in a fluidized bed of FCC particles. Chem. Eng. Sci. 2009, 64, 3270–3281. [Google Scholar] [CrossRef]
  179. Issangya, A.; Karri, S.B.R.; Knowlton, T.; Cocco, R. Effects of Bed Diameter, Baffles, Fines Content and Operating Conditions on Pres Sure Fluctuations in Fluidized Beds of FCC Catalyst Particles. In ECI Symposium Series, Proceedings of the Fourteenth International Conference on Fluidization–From Fundamentals to Products, New York, NY, USA, 26–31 May 2013; Kuipers, J.A.M., Mudde, R.F., van Ommen, J.R., Deen, N.G., Eds.; Engineering Conferences International (ECI): New Delhi, India, 2013; pp. 477–484. [Google Scholar]
  180. Yang, S.; Peng, L.; Liu, W.; Zhao, H.; Lv, X.; Li, H.; Zhu, Q. Simulation of hydrodynamics in gas-solid bubbling fluidized bed with louver baffles in three dimensions. Powder Technol. 2016, 296, 37–44. [Google Scholar] [CrossRef]
  181. Wang, S.; Luo, K.; Hu, C.; Fan, J. CFD-DEM study of the effect of ring baffles on system performance of a full-loop circulating fluidized bed. Chem. Eng. Sci. 2018, 196, 130–144. [Google Scholar] [CrossRef]
  182. Zhu, X.; Feng, X.; Zou, Y.; Shen, L. Effect of baffles on bubble behavior in a bubbling fluidized bed for chemical looping processes. Particuology 2020, 53, 154–167. [Google Scholar] [CrossRef]
  183. Liu, D.; Zhang, Y.; Zhang, S.; Oloruntoba, A. Effect of structure parameters on forces acting on the baffles used in gas-solids fluidized beds. Particuology 2022, 61, 111–119. [Google Scholar] [CrossRef]
  184. Samruamphianskun, T.; Piumsomboon, P.; Chalermsinsuwan, B. Effect of ring baffle configurations in a circulating fluidized bed riser using CFD simulation and experimental design analysis. Chem. Eng. J. 2012, 210, 237–251. [Google Scholar] [CrossRef]
  185. Jin, Y.; Wei, F.; Wang, Y. Effect of internal tubes and baffles. In Hanbook of Fluidization and Fluid-Particle Systems; Yang, W.-C., Ed.; Chemical Industries-New York-Marcel Dekker: New York, NY, USA, 2003; pp. 171–200. [Google Scholar]
  186. Nagahashi, Y.; Grace, J.R.; Lim, K.S.; Asako, Y. Dynamic force reduction and heat transfer improvement for horizontal tubes in large-particle gas-fluidized beds. J. Therm. Sci. 2008, 17, 77–83. [Google Scholar] [CrossRef]
  187. Liu, D.; Zhang, S.; Wang, R.; Zhang, Y. Dynamic forces on a horizontal slat immersed in a fluidized bed of fine particles. J. Chem. Eng. Res. Des. 2017, 117, 604–613. [Google Scholar] [CrossRef]
  188. Liu, D.; Zhang, S.; Zhang, Y.; Grace, J.R. Forces on an immersed horizontal slat during starting up a fluidized bed. Chem. Eng. Sci. 2017, 173, 402–410. [Google Scholar] [CrossRef]
  189. Nagahashi, Y.; Takeuchi, H.; Grace, J.R.; Yoshioka, D.; Tsuji, T.; Tanaka, T. Dynamic forces on an immersed cylindrical tube and analysis of particle interaction in 2D-gas fluidized beds. Adv. Powder Technol. 2018, 29, 3552–3560. [Google Scholar] [CrossRef]
  190. Xiong, Y. Strength of Materials Mechanics; Science Press: Beijing, China, 2009; pp. 279–916. [Google Scholar]
  191. Issangya, A.; Karri, S.R.; Knowlton, T. Effect of baffles on jet streaming in deep fluidized beds of Group A particles. In Proceedings of the Circulating Fluidized Bed Technology IX, Hamburg, Germany, 13–16 May 2008; Werther, J., Nowak, W., Wirth, K., Hartge, E., Eds.; pp. 105–110. [Google Scholar]
  192. Liu, D.; Zhang, Y.; Yuan, Y.; Grace, J.R. Effect of particle properties on forces on an immersed horizontal slat during start-up of a fluidized bed. Chem. Eng. Res. Des. 2020, 159, 105–114. [Google Scholar] [CrossRef]
  193. Zhang, Y.; Wang, H.; Chen, L.; Lu, C. Systematic investigation of particle segregation in binary fluidized beds with and without multilayer horizontal baffles. Ind. Eng. Chem. Res. 2012, 51, 5022–5036. [Google Scholar] [CrossRef]
  194. Issangya, A.S.; Karri, S.R.R.; Knowlton, T.; Cocco, R. Use of pressure to mitigate gas bypassing in fluidized beds of FCC catalyst particles. Powder Technol. 2016, 290, 53–61. [Google Scholar] [CrossRef]
  195. Yang, Z.; Zhang, Y.; Zhang, H. CPFD simulation on effects of louver baffles in a two-dimensional fluidized bed of Geldart A particles. Adv. Powder Technol. 2019, 30, 2712–2725. [Google Scholar] [CrossRef]
  196. Cocco, R.; Hays, R.; Karri, S.B.K.R.; Knowlton, T.M. The effect of cohesive forces on catalyst entrainment in fluidized bed regenerators. In Advances in Fluid Catalytic Cracking; Occelli, M.L., Ed.; CRC Press: Boca Raton, FL, USA, 2010; pp. 155–172. [Google Scholar]
  197. Baron, T.; Briens, C.L.; Bergougnou, M.A. Reduction of particle entrainment from gas-fluidized beds with a screen of floating balls, Paper 150N, CONF-871113. In Proceedings of the American Institute of Chemical Engineers Annual Meeting, New York, NY, USA, 15 November 1987. [Google Scholar]
  198. George, S.; Grace, J. Entrainment of particles from a pilot scale fluidized bed. Can. J. Chem. Eng. 1981, 59, 279–284. [Google Scholar] [CrossRef]
  199. Kunii, D.; Levenspiel, O. Chapter 3-Fluidization and Mapping of Regimes. In Fluidization Engineering, 2nd ed.; Butterworth-Heinemann: Oxford, UK, 1991; pp. 61–94. [Google Scholar]
  200. Issangya, A.S.; Karri, S.B.R.; Knowlton, T.M.; Cocco, R. Effect of gas bypassing in deep beds on cyclone dipleg operation. In ECI Symposium Series, Proceedings of the 10th International Conference on Circulating Fluidized Beds and Fluidization Technology-CFB-10, Sun River, OR, USA, 1–5 May 2011; Knowlton, T., PSRI, Eds.; ECI: New Delhi, India, 2013. [Google Scholar]
  201. Chyang, C.-S.; Wu, K.-T.; Ma, T.-T. Particle segregation in a screen baffle packed fluidized bed. Powder Technol. 2002, 126, 59–64. [Google Scholar] [CrossRef]
  202. Jiang, P.; Bi, H.; Jean, R.-H.; Fan, L.-S. Baffle effects on performance of catalytic circulating fluidized bed reactor. AIChE J. 1991, 37, 1392–1400. [Google Scholar] [CrossRef]
  203. Zhang, Z.; Wu, Z.; Rincon, D.; Christofides, P.D. Operational safety via model predictive control: The Torrance refinery accident revisited. Chem. Eng. Res. Des. 2019, 149, 138–146. [Google Scholar] [CrossRef]
  204. Kassel, L.S. Prevention of Afterburning in Fluidized Catalytic Cracking Processes. U.S. Patent 2,436,927A, 2 March 1948. [Google Scholar]
  205. Blaser, P.; Pendergrass, J.; Gabites, J.; Brooke, A. Viva Energy′s Geelong refinery reduces FCCU turnaround risk. Hydrocarb. Process. 2018, 1–6. Available online: https://www.hydrocarbonprocessing.com/magazine/2018/september-2018/special-focus-refining-technology/viva-energy-s-geelong-refinery-reduces-fccu-turnaround-risk (accessed on 11 January 2022).
  206. Clark, S.; Fletcher, R.; Blaser, P. Identifying the root cause of afterburn in fluidized catalytic crackers. In Proceedings of the Annual Meeting of American Fuel & Petrochemical Manufacturers AM-16-15, San Francisco, CA, USA, 13–15 March 2016. [Google Scholar]
  207. William, M.; Heigl, J.J. Method of Detecting Incipient Afterburning during Regeneration. U.S. Patent 2,545,162A, 13 March 1951. [Google Scholar]
  208. Wu, D.; Schmidt, M.; Huang, X.; Verplaetsen, F. Self-ignition and smoldering characteristics of coal dust accumulations in O2/N2 and O2/CO2 atmospheres. Proc. Combust. Inst. 2017, 36, 3195–3202. [Google Scholar] [CrossRef]
  209. Chester, A.W. Chapter 6 CO combustion promoters: Past and present. In Studies in Surface Science and Catalysis; Elsevier: Amsterdam, The Netherlands, 2007; pp. 67–77, 166. [Google Scholar]
  210. Wang, R.; Luo, X.; Xu, F. Economic and control performance of a fluid catalytic cracking unit: Interactions between combustion air and CO promoters. Ind. Eng. Chem. Res. 2014, 53, 287–304. [Google Scholar] [CrossRef]
  211. Iliopoulou, E.F.; Efthimiadis, E.A.; Nalbandian, L.; Vasalos, I.A.; Barth, J.O.; Lercher, J.A. Ir-based additives for NO reduction and CO oxidation in the FCC regenerator: Evaluation, characterization and mechanistic studies. Appl. Catal. B-Environ. 2005, 60, 277–288. [Google Scholar] [CrossRef]
  212. Iliopoulou, E.F.; Efthimiadis, E.A.; Vasalos, I.A. Ag-based catalytic additives for the simultaneous reduction of NO and CO emissions from the regenerator of a FCC unit. Ind. Eng. Chem. Res. 2004, 43, 1388–1394. [Google Scholar] [CrossRef]
  213. Iliopoulou, E.F.; Efthimiadis, E.A.; Vasalos, I.A.; Barth, J.O.; Lercher, J.A. Effect of Rh-based additives on NO and CO formed during regeneration of spent FCC catalyst. Appl. Catal. B-Environ. 2004, 47, 165–175. [Google Scholar] [CrossRef]
  214. Wen, B.; He, M.; Costello, C. Simultaneous catalytic removal of NOx, SOx, and CO from FCC regenerator. Energy Fuels 2002, 16, 1048–1053. [Google Scholar] [CrossRef]
  215. Stockwell, D.M. Lower Temperature CO Promoters for FCC with Low NOx. U.S. Patent 20070129234A1, 7 June 2007. [Google Scholar]
  216. Vaarkamp, M.; Stockwell, D.M. CO Oxidation Promoters for Use in FCC Processes. U.S. Patent 7,959,792B2, 14 June 2011. [Google Scholar]
  217. Schön, A.; Dacquin, J.-P.; Granger, P.; Dujardin, C. Non stoichiometric La1-yFeO3 perovskite-based catalysts as alternative to commercial three-way-catalysts?—Impact of Cu and Rh doping. Appl. Catal. B-Environ. 2018, 223, 167–176. [Google Scholar] [CrossRef]
  218. Yang, X.; Liu, G.; Li, Y.; Zhang, L.; Wang, X.; Liu, Y. Novel Pt–Ni bimetallic catalysts Pt (Ni)–LaFeO3/SiO2 via lattice atomic-confined reduction for highly efficient isobutane dehydrogenation. Trans. Tianjin Univ. 2019, 25, 245–257. [Google Scholar] [CrossRef]
  219. Zhang, L.; Filot, I.A.; Su, Y.-Q.; Liu, J.-X.; Hensen, E.J. Understanding the impact of defects on catalytic CO oxidation of LaFeO3-supported Rh, Pd, and Pt single-atom catalysts. J. Phys. Chem. C 2019, 123, 7290–7298. [Google Scholar] [CrossRef] [PubMed] [Green Version]
  220. Schoen, A.; Dujardin, C.; Dacquin, J.-P.; Granger, P. Enhancing catalytic activity of perovskite-based catalysts in three-way catalysis by surface composition optimisation. Catal. Today 2015, 258, 543–548. [Google Scholar] [CrossRef]
  221. Wu, Y.; Ni, X.; Beaurain, A.; Dujardin, C.; Granger, P. Stoichiometric and non-stoichiometric perovskite-based catalysts: Consequences on surface properties and on catalytic performances in the decomposition of N2O from nitric acid plants. Appl. Catal. B-Environ. 2012, 125, 149–157. [Google Scholar] [CrossRef]
  222. Ellis, N. Experimental Investigation of Fluidized Bed Systems. In Essentials of Fluidization Technology; Wiley-VCH: Weinhard, Germany, 2020; pp. 75–108. [Google Scholar]
  223. Vannasing, D.; Hulfachor, J. Erosion Resistance of Tungsten-Carbide Coatings for Steel Pipes in Fluid Catalytic Cracking Units, Chevron-Material Engineering Report; Chevron ETC: Richmond, CA, USA, 2019; pp. 1–42. [Google Scholar]
  224. di Natale, F.; Nigro, R. An experimental procedure to estimate tube erosion rates in bubbling fluidised beds. Powder Technol. 2016, 287, 96–107. [Google Scholar] [CrossRef]
  225. Willbourne, P. Barriers to superior FCC cyclone performance. Primary causes, repair options and design solutions. In Proceedings of the 15th Grace EMEA FCC Technology Conference, Barcelona, Spain, 21–24 April 2015; pp. 1–30. [Google Scholar]
  226. Nnabalu, C.R.; Falcone, G.; Bortone, I. The role of fluid catalytic cracking in process optimisation for petroleum refineries. Int. J. Chem. Mol. Eng. 2019, 13, 370–376. [Google Scholar]
  227. Bryant, H.S.; Silverman, R.W.; Zenz, F.A. How dust in gas affects cyclone pressure drop. Hydrocarb. Process 1983, 62, 87–90. [Google Scholar]
  228. Blaser, P.; Thibault, S.; Sexton, J.A. Use of computational modeling for FCC reactor cyclone erosion reduction at the marathon petroleum catlettsburg refinery. In Proceedings of the 14th International Conference on Fluidization–From Fundamentals to Products, Noordwijkerhout, The Netherlands, 26–31 May 2013; Engineering Conferences International ECI Digital Archives. Kuipers, J.A.M., Mudd, R.F., van Ommen, J.R., Deen, N.G., Eds.; pp. 1–9. [Google Scholar]
  229. Karri, S.B.R.; Davuluri, R.P. Dilute-Phase Pneumatic Conveying–Design Aspects of Bend Types; Research Report 71; Particulate Solid Research, Inc.: Chicago, IL, USA, 1995. [Google Scholar]
  230. Tilly, T.P. Erosion caused by airborne particles. Wear 1969, 14, 63–79. [Google Scholar] [CrossRef]
  231. Koffman, L. The cleaning of engine air Part 2. In Gas Oil Power; Roki Co., Ltd.: Rayong, Thailand, 1953; pp. 89–94. [Google Scholar]
  232. Decker, S.; Simon, H. Element for Anchoring an Anti-Erosion Coating to an Inner Wall of a Chamber of an FCC Unit. U.S. Patent 10,048,006, 14 August 2018. [Google Scholar]
  233. Clough, M.; Pope, J.C.; Lin, L.T.X.; Komvokis, V.; Pan, S.S.; Yilmaz, B.J. Nanoporous materials forge a path forward to enable sustainable growth: Technology advancements in fluid catalytic cracking. Micropor. Mesopor. Mat. 2017, 254, 45–58. [Google Scholar] [CrossRef]
  234. Zhang, H.; Degrève, J.; Baeyens, J.; Wu, S.-Y. Powder attrition in gas fluidized beds. Powder Technol. 2016, 287, 1–11. [Google Scholar] [CrossRef]
  235. Thon, A.; Püttmann, A.; Hartge, E.-U.; Heinrich, S.; Werther, J.; Patience, G.S.; Bockrath, R.E. Simulation of catalyst loss from an industrial fluidized bed reactor on the basis of labscale attrition tests. Powder Technol. 2011, 214, 21–30. [Google Scholar] [CrossRef]
  236. Wu, D.; Wu, F.; Li, Y. Particle size effect on the catalyst attrition in a lab-scale fluidized bed. AlChE J. 2017, 63, 914–920. [Google Scholar] [CrossRef]
  237. Liu, W.; Wu, Y.; Cai, T.; Xu, Z.; Liu, D.; Ma, J.; Chen, X.; Liu, D. A molding method of Na2CO3/Al2O3 sorbents with high sphericity and low roughness for enhanced attrition resistance in CO2 sorption/desorption process via extrusion-spheronization method. Powder Technol. 2020, 366, 520–526. [Google Scholar] [CrossRef]
  238. Werther, J.; Hartge, E.U. Elutriation and entrainment. In Hand book of Fluidization and Fluid-Particle Systems; Yang, W.C., Ed.; CRC Press: Boca Raton, FL, USA, 2003; pp. 113–128. [Google Scholar]
  239. Ellis, N.; Xu, M.; Lim, C.J.; Cloete, S.; Amini, S. Effect of change in fluidizing gas on riser hydrodynamics and evaluation of scaling laws. Ind. Eng. Chem. Res. 2011, 50, 4697–4706. [Google Scholar] [CrossRef]
  240. Hoekstra, E.; Sookai, S. The effect of gas density on fluidized-bed entrainment. S. Afr. J. Chem. Eng. 2014, 19, 90–98. [Google Scholar]
  241. Kunii, D.; Levenspiel, O. Entrainment and elutriation from fluidized beds. In Fluidization Engineering; Elsevier: Amsterdam, The Netherlands, 2013; pp. 165–192. [Google Scholar]
  242. Chan, I.H.; Knowlton, T.M. The effect of pressure on entrainment from bubbling gas-fluidized beds. In Proceedings of the 4th International Conference on Fluidization, Engineering Foundation Conferences, Kashikojima, Japan, 29 May–3 June 1983; Kunii, D., Toei, R., Eds.; pp. 283–290. [Google Scholar]
  243. Park, S.S.; Choi, Y.T.; Lee, G.S.; Kim, S.D. Coal combustion characteristics in an internal circulating fluidized bed-combustor. In Circulating Fluidized Bed Technology; Basu, P., Horio, M., Hasatani, M., Eds.; Pergamon: Oxford, UK, 1991; pp. 497–503. [Google Scholar]
  244. Knowlton, T.M.; Findlay, J.; Sishtla, C. Attrition and Entrainment Studies Related to Fluidized bed Gasifiers, Final Report for U.S. Dept. of Energy; Institute of Gas Technology: Chicago, IL, USA, 1990. [Google Scholar]
  245. Yang, F.M.; Wang, L.; Yin, S.W.; Li, Y.H. Experimental study on the relationship between carrier gas temperature and entrainment characteristics of ultrafine silicon powder in fluidized bed. Adv. Mater. Res. 2012, 484, 2587–2591. [Google Scholar] [CrossRef]
  246. Werther, J.; Reppenhagen, J. Attrition. In Handbook of Fluidization and Fluid–Particle Systems; Yang, W.C., Ed.; Marcel Dekker: New York, NY, USA, 2003; pp. 201–238. [Google Scholar]
  247. Bayham, S.C.; Breault, R.; Monazam, E. Particulate solid attrition in CFB systems—An assessment for emerging technologies. Powder Technol. 2016, 302, 42–62. [Google Scholar] [CrossRef] [Green Version]
  248. Niccum, P.K.; Tragesser, S. Twenty questions: Identify probable cause of high FCC catalyst Loss, Paper AM-11-35. In Proceedings of the 2011 NPRA Annual Meeting, San Antonio, TX, USA, 20–22 March 2011. [Google Scholar]
  249. Yan, C.-Y.; Sun, G.-G.; Chen, J.-Y.; Wei, Y.-D.; Lu, C.-X. Experimental study on the particle flow patterns in a cyclone dipleg with a trickle valve. Pet. Sci. Technol. 2020, 17, 822–837. [Google Scholar] [CrossRef]
  250. Callen, A.; Moghtaderi, B.; Galvin, K.P. Use of parallel inclined plates to control elutriation from a gas fluidized bed. Chem. Eng. Sci. 2007, 62, 356–370. [Google Scholar] [CrossRef]
  251. Bouziden, G.D.; Gentile, J.K.; Kunz, R.G. Selective Catalytic Reduction of NOx from Fluid Catalytic Cracking Case Study: BP Whiting Refinery; National Petrochemical & Refiners Association: Washington, DC, USA, 2002. [Google Scholar]
  252. Sechrist, P.A.; Hedrick, B.W. Apparatus and Process for Separating Fine Solid Particulates from a Gas Stream. U.S. Patent 6,797,026, 28 September 2004. [Google Scholar]
  253. Jaworek, A.; Sobczyk, A.; Krupa, A.; Marchewicz, A.; Czech, T.; Śliwiński, L. Hybrid electrostatic filtration systems for fly ash particles emission control. Rev. Sep. Purif. Technol. 2019, 213, 283–302. [Google Scholar] [CrossRef]
  254. Guo, B.-Y.; Su, Y.-B.; Yang, D.; Yu, A.-B. Predictions of the gas–liquid flow in wet electrostatic precipitators. Appl. Math. Model. 2017, 44, 175–188. [Google Scholar] [CrossRef]
  255. Chen, T.M.; Tsai, C.J.; Yan, S.Y.; Li, S.N. An efficient wet electrostatic precipitator for removing nanoparticles, submicron and micron-sized particles. Sep. Purif. Technol. 2014, 136, 27–35. [Google Scholar] [CrossRef]
  256. Nagata, C.; Suzuki, S.; Miyake, K.; Tomitatsu, K. Wet type electrostatic precipitator technology for industrial and power applications. In Proceedings of the 13th International Conference on Electrostatic Precipitation (ICESP XIII), Bangalore, India, 16–21 September 2013. [Google Scholar]
  257. Fujishima, H.; Nagata, C. Experiences of wet type electrostatic precipitator successfully applied for SO3 mist removal in boilers using high sulfur content fuel. In Proceedings of the 9th International Conference of Electrostatic Precipitation (ICESP IX), Pretoria, South Africa, 17–21 May 2004; pp. 1–12. [Google Scholar]
  258. Nagata, C.; Suzuki, S.; Miyake, K.; Tomimatsu, K. Historical review of wet type electrostatic precipitator technology for Industrial and power applications in MHI-MS. Plasma Environ. Sci. Technol. 2014, 8, 27–36. [Google Scholar]
  259. Weaver, E.H. Wet scrubbing system control technology for refineries-An evaluation of regenerative and non-regenerative systems. In Proceedings of the Beijing International Petroleum Technology Progress Exchange Conference, Beijing, China, 24–26 April 2006. [Google Scholar]
  260. Pan, Q.; Ming, T.; Xin, C. Analysis of operation of RFCC flue gas scrubbing unit. Pet. Refin. Eng. 2011, 8. [Google Scholar]
  261. Azzopardi, B.; Sanaullah, K. Re-entrainment in wave-plate mist eliminators. Chem. Eng. Sci. 2002, 57, 3557–3563. [Google Scholar] [CrossRef]
  262. Brunazzi, E.; Paglianti, A. Design of complex wire-mesh mist eliminators. AlChE J. 2000, 46, 1131–1137. [Google Scholar] [CrossRef]
  263. Brunazzi, E.; Paglianti, A.; Talamelli, A. Simplified design of axial-flow cyclone mist eliminators. AlChE J. 2003, 49, 41–51. [Google Scholar] [CrossRef]
  264. Galletti, C.; Brunazzi, E.; Tognotti, L. A numerical model for gas flow and droplet motion in wave-plate mist eliminators with drainage channels. Chem. Eng. Sci. 2008, 63, 5639–5652. [Google Scholar] [CrossRef]
  265. Lebedev, Y.N.; Zil’berberg, I.; Lozhkin, Y.P.; Chekmenev, V. High-efficiency mist eliminators. Chem. Technol. Fuels Oils 2002, 38, 42–45. [Google Scholar] [CrossRef]
  266. Narimani, E.; Shahhoseini, S. Optimization of vane mist eliminators. Appl. Therm. Eng. 2011, 31, 188–193. [Google Scholar] [CrossRef]
  267. Burns, H.H.; Burns, D. Lessons Learned from Start-Up Testing of a Mixed Waste Incinerator; Westinghouse Savannah River Co.: Aiken, SC, USA, 1997. [Google Scholar]
  268. Verma, N.; Verma, A. Amine system problems arising from heat stable salts and solutions to improve system performance. Fuel Process. Technol. 2009, 90, 483–489. [Google Scholar] [CrossRef]
  269. Gao, T.; Selinger, J.L.; Rochelle, G.T. Demonstration of 99% CO2 removal from coal flue gas by amine scrubbing. Int. J. Greenh. Gas Con. 2019, 83, 236–244. [Google Scholar] [CrossRef]
  270. Wang, M.; Rahimi, M.; Kumar, A.; Hariharan, S.; Choi, W.; Hatton, T.A. Flue gas CO2 capture via electrochemically mediated amine regeneration: System design and performance. Appl. Energy 2019, 255, 113879. [Google Scholar] [CrossRef]
  271. Liang, Y.; Yao, X.; Quin, L.; Chen, W.; Han, J. Simultaneous removal of SO2 and NOx from sintering flue gas using ammonia-Fe (II) EDTA combined with electrolytic regeneration. Environ. Prot. Eng. 2018, 44, 19–36. [Google Scholar] [CrossRef]
  272. Hsieh, J.; Gilman, K.R.; Philibert, D.; Eagleson, S.; Morin, A. Wet Scrubbing Apparatus and Method for Controlling NOx Emission. U.S. Patent 7,214,356, 8 August 2007. [Google Scholar]
  273. Jiang, R.; Shan, H.; Zhang, Q.; Li, C.; Yang, C. The influence of surface area of De-SOx catalyst on its performance. Sep. Purif. Technol. 2012, 95, 144–148. [Google Scholar] [CrossRef]
  274. Bryden, K.; Singh, U.; Berg, M.; Brandt, S.; Schiller, R.; Cheng, W.C. Fluid catalytic cracking (FCC): Catalysts and additives. In Kirk-Othmer Encyclopedia of Chemical Technology; Wiley: New York, NY, USA, 2000; pp. 1–37. [Google Scholar]
  275. Polato, C.M.S.; Henriques, C.A.; Rodrigues, A.C.C.; Monteiro, J.L.F. De–SOx additives based on mixed oxides derived from Mg, Al-hydrotalcite-like compounds containing Fe, Cu, Co or Cr. Catal. Today 2008, 133, 534–540. [Google Scholar] [CrossRef]
  276. Chang, J.C.; Hovis, L.S. Pilot Evaluation of Enhanced E-SOx Process; Acurex Corp.: Research Triangle Park, NC, USA, 1990. [Google Scholar]
  277. Jiang, R.; Shan, H.; Li, C.; Yang, C. Preparation and characterization of Mn/MgAlFe as transfer catalyst for SOx abatement. J. Nat. Gas Chem. 2011, 20, 191–197. [Google Scholar] [CrossRef]
  278. Pereira, H.B.; Polato, C.M.; Monteiro, J.L.F.; Henriques, C.A. Mn/Mg/Al-spinels as catalysts for SOx abatement: Influence of CeO2 incorporation and catalytic stability. Catal. Today 2010, 149, 309–315. [Google Scholar] [CrossRef]
  279. Polato, C.M.S.; Henriques, C.A.; Neto, A.A.; Monteiro, J.L.F. Synthesis, characterization and evaluation of CeO2/Mg, Al-mixed oxides as catalysts for SOx removal. J. Mol. Catal. A Chem. 2005, 241, 184–193. [Google Scholar] [CrossRef]
  280. Stern, D.; Nariman, K.; Buchanan, J.; Bhore, N.; Johnson, D.; Grasselli, R. The mobil oil SOx treatment process (MOST). Catalytic removal of SOx and H2S from refinery tailgas. Catal. Today 2000, 55, 311–316. [Google Scholar] [CrossRef]
  281. Wenbin, J.; Weicheng, F.; Yinglin, T.; Weiqun, M. Manufacture and Commercial Trial of RFS-C SOx Transfer Promotor for Reducing SOx Emission from FCCU. Pet. Process. Petrochem. 2003, 34, 21–25. [Google Scholar]
  282. Vierheilig, A.; Evans, M. The role of additives in reducing fluid catalytic cracking SOx and NOx emissions. Pet. Coal 2003, 45, 147–153. [Google Scholar]
  283. Shaw, D. Cansolv CO2 capture: The value of integration. Energy Procedia 2009, 1, 237–246. [Google Scholar] [CrossRef] [Green Version]
  284. Min, H.; Guo, H.; Hu, Y.; Tang, H.; Wang, K.; Xin, T.; Zhu, L. Important engineering issues in FCC regenerable wet flue gas scrubbing process. Pet. Refin. Eng. 2012, 5, 1–7. [Google Scholar]
  285. Basu, S. Chemical and biochemical processes for NOx control from combustion off-gases. Chem. Eng. Commun. 2007, 194, 1374–1395. [Google Scholar] [CrossRef]
  286. EPRI. 2010 Status of Multi-Pollutant Process Development; Electric Power Research Institute: Palo Alto, CA, USA, 2010; p. 1019718. [Google Scholar]
  287. Efthimiadis, E.; Iliopoulou, E.; Lappas, A.; Iatridis, D.; Vasalos, I. NO reduction studies in the FCC process. Evaluation of NO reduction additives for FCCU in bench-and pilot plant-scale reactors. Ind. Eng. Chem. Res. 2002, 41, 5401–5409. [Google Scholar] [CrossRef]
  288. Genç, M.; Gül, A.; Dalgıç, E.; Avcılar, Ş.; Tüpraş; Ventham, T.; Matthey, J. Taking steps to reduce FCC NOX emissions. In Hydrocarbon Engineering; Johnson Matthey: London, UK, 2018; pp. 1–12. [Google Scholar]
  289. Mehlberg, R.; Rosser, F., Jr.; Fei, Z.; Stevens, C. Low NOx FCC catalyst regeneration process. U.S. Patent 7,914,666B1, 29 March 2011. [Google Scholar]
  290. Belessi, V.C.; Costa, C.N.; Bakas, T.V.; Anastasiadou, T.; Pomonis, P.J.; Efstathiou, A.M. Catalytic behavior of La–Sr–Ce–Fe–O mixed oxidic/perovskitic systems for the NO+ CO and NO+ CH4+ O2 (lean-NOx) reactions. Catal. Today 2000, 59, 347–363. [Google Scholar] [CrossRef]
  291. Cheng, X.; Bi, X.T. A review of recent advances in selective catalytic NOx reduction reactor technologies. Particuology 2014, 16, 1–18. [Google Scholar] [CrossRef]
  292. Bahrami, B.; Komvokis, V.G.; Ziebarth, M.S.; Alexeev, O.S.; Amiridis, M.D. NH3 decomposition and oxidation over noble metal-based FCC CO combustion promoters. Appl. Catal. B-Environ. 2013, 130, 25–35. [Google Scholar] [CrossRef]
  293. Li, J.; Wang, S.; Zhou, L.; Luo, G.; Wei, F. NO reduction by CO over a Fe-based catalyst in FCC regenerator conditions. Chem. Eng. J. Adv. 2014, 255, 126–133. [Google Scholar] [CrossRef]
  294. Li, J.; Luo, G.; Chu, Y.; Wei, F. Experimental and modeling analysis of NO reduction by CO for a FCC regeneration process. Chem. Eng. J. Adv. 2012, 184, 168–175. [Google Scholar] [CrossRef]
  295. Griesinger, E. GDNOXTM 1 additive-Grace Davison’s next generation NOx reduction additive. Catalagram 2011, 1, 109. [Google Scholar]
  296. Lindfors, C.; Paasikallio, V.; Kuoppala, E.; Reinikainen, M.; Oasmaa, A.; Solantausta, Y. Co-processing of dry bio-oil, catalytic pyrolysis oil, and hydrotreated bio-oil in a micro activity test unit. Energy Fuels 2015, 29, 3707–3714. [Google Scholar] [CrossRef]
  297. Mathieu, Y.; Sauvanaud, L.; Humphreys, L.; Rowlands, W.; Maschmeyer, T.; Corma, A. Opportunities in upgrading biomass crudes. Faraday Discuss. 2017, 197, 389–401. [Google Scholar] [CrossRef] [PubMed] [Green Version]
  298. Fogassy, G.; Thegarid, N.; Toussaint, G.; van Veen, A.C.; Schuurman, Y.; Mirodatos, C. Biomass derived feedstock co-processing with vacuum gas oil for second-generation fuel production in FCC units. Appl. Catal. B-Environ. 2010, 96, 476–485. [Google Scholar] [CrossRef]
  299. Mercader, F.D.; Groeneveld, M.; Kersten, S.; Way, N.; Schaverien, C.; Hogendoorn, J. Production of advanced biofuels: Co-processing of upgraded pyrolysis oil in standard refinery units. Appl. Catal. B-Environ. 2010, 96, 57–66. [Google Scholar] [CrossRef]
  300. Fogassy, G.; Thegarid, N.; Schuurman, Y.; Mirodatos, C. From biomass to bio-gasoline by FCC co-processing: Effect of feed composition and catalyst structure on product quality. Energy Environ. Sci. Pollut. Res. 2011, 4, 5068–5076. [Google Scholar] [CrossRef]
  301. Wang, C.; Venderboasch, R.; Fang, Y. Co-processing of crude and hydrotreated pyrolysis liquids and VGO in a pilot scale FCC riser setup. Fuel Process. Technol. 2018, 181, 157–165. [Google Scholar] [CrossRef]
  302. Tian, N.; Li, C.; Yang, C.; Shan, H. Alternative processing technology for converting vegetable oils and animal fats to clean fuels and light olefins. Chin. J. Chem. Eng. 2008, 16, 394–400. [Google Scholar] [CrossRef]
  303. Weinerta, A.; Bielanskya, P.; Reichholda, A. Upgrading biodiesel into oxygen-free gasoline: New applications for the FCC-process. APCBEE Procedia 2012, 1, 147–152. [Google Scholar] [CrossRef] [Green Version]
  304. Gueudre, L.; Chapon, F.; Mirodatos, C.; Schuurman, Y.; Venderbosch, R.; Jordan, E.; Wellach, S.; Gutierrez, R.M. Optimizing the bio-gasoline quantity and quality in fluid catalytic cracking corefining. Fuel 2017, 192, 60–70. [Google Scholar] [CrossRef]
Figure 1. FCC unit. (a) Schematic diagram of a simplified set up; (b) industrial plant.
Energies 15 02061 g001
Figure 2. Illustration of future roles of FCC unit. Note: CCS: carbon capture and storage, VGO: vacuum gas oil, Rec: reactant (feed).
Energies 15 02061 g002
Figure 4. Catalyst cooler in FCC regenerator designs: (a) internal cooler, (b) backmix external cooler, (c) flow-through external cooler, (d) FCC resid cracker (adopted from Jones and Treese [14] and Palmas and Myers [92]).
Energies 15 02061 g004
Figure 5. Feed gas condition against CO2/CO in the flue gas [14].
Energies 15 02061 g005
Figure 7. Air distributor design. (a) Different grid configurations; (b) nozzle design; (c) pipe grid part; (d) ring jet arrangement. Adopted from Sadeghbeigi [19] and Cooper [140].
Energies 15 02061 g007
Figure 8. Influence of gas distributor design on temperature profiles. Adopted from Rahimpour et al. [149].
Energies 15 02061 g008
Figure 9. Effect of distributor type on lateral voidage profiles. Adopted from Sobrino et al. [153].
Energies 15 02061 g009
Figure 10. Influence of superficial gas velocity on pressure across the different distributor designs. Adopted from Son et al. [161].
Energies 15 02061 g010
Figure 11. (a) Solids dead zone and initial bubble generation immediately above gas distributor; (b) effect of open area of distributor on dead zone formation. Adapted from Zhang et al. [70] and Kwangbyol et al. [146].
Energies 15 02061 g011
Figure 12. Design of spent catalyst distributor. (a) RMS bottom-center style; (b) hockey stick injection style. Adopted from Sadeghbeigi [16].
Energies 15 02061 g012
Figure 13. Sidewall spend catalyst distributor: (a) aeration lancer (b) regenerator with distributor (c) horizontal header. Adopted from Myers et al. [91]. Fluidized hopper located at regenerator sidewall receives spent catalyst and a horizontal header extended across dense bed cross section distributes the catalyst through its multiple arms while the lance inside the header provides supplementary transport gas for uniform catalyst spray.
Energies 15 02061 g013
Figure 14. Spent catalyst density distribution by different spent catalyst distributors in FCC regenerator. Adapted from Wolschlag and Couch [141].
Energies 15 02061 g014
Figure 15. Effect of spent catalyst distributor on regenerator performance. Left: old spent catalyst distributor. Right: new distributor with new design. Adopted from Parker and Blaser [171].
Energies 15 02061 g015
Figure 16. Iso-surface oxygen concentration profile. Adopted from Schwarz and Lee [77].
Energies 15 02061 g016
Figure 17. Baffle designs. (a) Crosser baffle; (b) KBR fixed packing baffle; (c) Single turn baffle. Adopted from Zhang [52].
Energies 15 02061 g017
Figure 18. Effect of baffles on fluidized beds with respect to gas cushion formation. (a) Without baffle (b) With baffle.
Energies 15 02061 g018
Figure 19. Influence of baffles on catalyst back-mixing profile. Adopted from Yang et al. [195].
Energies 15 02061 g019
Figure 20. Influence of baffles on catalyst carry-over in the freeboard. Adopted from Cocco et al. [196].
Energies 15 02061 g020
Figure 21. Major reliability issues in FCC regenerator.
Energies 15 02061 g021
Figure 22. Pressure-monitoring taps in a FCCU regenerator. Modified from Sadeghbeigi [19].
Energies 15 02061 g022
Figure 23. Severe high-temperature erosion impacts. (a) Cyclone inside-out wear; (b) steam purge inside-out wear; (c) eroded air distributor nozzle. Adopted from Chen [133] and Willbourne [225].
Energies 15 02061 g023
Figure 24. (a) Erosion reduction rates for different cyclone modifications, (b) Diagrams of different cyclone L/D’s. Data obtained from Di Natale and Nigro [224].
Energies 15 02061 g024
Figure 26. (a) Schematic diagram of cyclone trickle valve with free falling particle; (b) flapper section.
Energies 15 02061 g026
Figure 27. (a) Electrostatic precipitator; (b) operation mechanisms of WESP and DESP Adapted from Nagata et al. [258].
Energies 15 02061 g027
Figure 28. Economic implication of web scrubbing systems (Adapted from Weaver [259]).
Energies 15 02061 g028
Figure 29. BP Kwinana flue gas particulate removal system. Adopted from Tragesser [45]. (1) Riser; (2) regenerator; (3) third-stage separator; (4) CO boiler; (5) flue gas filter by Pall; (6) orifice chamber; (7) stack.
Energies 15 02061 g029
Figure 30. Flue gas particulate emission reduction technologies.
Energies 15 02061 g030
Figure 31. (left) Nonregenerative EDV wet scrubber apparatus; (right) spray tower. Adopted from Weaver [259].
Energies 15 02061 g031
Figure 32. Time average of NOx emission at excess O2 in the FCC regenerator. Adopted from Genç et al. [289].
Energies 15 02061 g032
Figure 33. NOx emission against O2 supply. Adopted from Genç et al. [288].
Energies 15 02061 g033
Figure 34. Comparison of Fe-based and FCC catalyst NO conversion performance. Data obtained from Leger et al. [46].
Energies 15 02061 g034
Table 1. Important coke combustion reactions occurring and heat of combustion in the FCC regenerator.
Chemical ReactionStoichiometric EquationReaction Kinetics EquationEnthalpy of Combustion Kcal/kg of C, H2, or S
Partial Carbon combustion C + 1 2 O 2   r 1 CO r 1 = 1 θ g k 1 C rgc M w C ρ c P O 2 2200
Heterogenous Carbon combustion C + O 2   r 2 CO 2 r 2 = 1 θ g k 2 C rgc M w C ρ c P O 2 7820
CO homogeneous combustion CO + 1 2 O 2   r 3 hom   CO 2 r 3 hom = θ g k 3 hom P O 2 P CO 5600
CO heterogeneous combustion CO + 1 2 O 2   r 3 het   CO 2 r 3 het = x pt   1 θ g k 3 het ρ c P O 2 P CO
Hydrogen combustion H + 1 4 O 2   r 4 1 2 H 2 O r 4 = 1 θ g k 4 H rgc M w H ρ H P O 2 28,900
Nitrogen combustion N   s + 1 2 O 2 NO r 5 = k 5 P O 2 0.58 + k 6 P O 2 0.64 -
Catalytic NO reduction C   s + NO CO + 1 2 N 2 r 7 = k 6 P NO -
Sulfur combustion S   s + xO SO X r 8 = k 8 P O 2 0.58 + k 10 P O 2 0.64 2209
Note: All the parameters in the equations can be found in Sadeghbeigi [13] and Arbel et al. [61].
Table 2. Pros and cons of fluidization regimes in FCC regenerators.
RegimeSuperficial Gas Velocity Range (m/s)Residence Time (Min)Temperature (K)Catalysts Inventory (tons)
Minimum fluidization 0.003–0.009<1>923–978>300
Minimum bubbling0.015–0.030–5>923–978300–800
Bubbling bed0.09–0.65–201100300–800
Turbulent bed0.6–1.23–51250–1350200
Circulating fast fluidized bed1.3–31–31275–1350120
Dilute phase transport fluidized bed>3>31275–1350<120
Source: Data adapted from Sadeghbeigi [19], Speight [67], and Fotovat [68].
Table 3. Comparative performance of single- and multi-stage regenerators.
ParameterSingle StageMulti-StageReference
Catalyst inventoryHigh inventory,
High propensity to catalyst loss
High Propensity to catalyst makeup
Much larger bed
High throughput and low inventory,
Low propensity to catalyst loss
High Propensity to catalyst makeup
[18]
NO reduction by CO (%)50%90%[117]
NO reduction with promoter--Over 80%[118]
Exit NO (ppm) 1[119]
Carbon content (wt.%)0.280.02 [117]
0.530.05[73]
0.440.23[120]
Heat recoveryExcess heat removal is difficultAddition of heat exchanger between the two stages fosters excess heat removal[73]
ControlDifficult temperature controlEase to monitor and regulate[73]
Temperature (°C)700650/700 *[117]
Catalyst Inventory
(Volume Reduction)
Higher regenerator size Low regenerator size[114]
* Represents the ratio of first stage to second stage temperatures.
Table 5. Process and design consideration for pipe grid air distributor.
ParameterValues
MaterialStainless steel walled with 2.5 cm ceramic, 10–30% of the bed static head at minimum air rate for downward-pointing nozzles
Pressure drop0.1–0.15 atm at design rate
Nozzles:
Length10 cm (minimum)
L/D5:1–6:1
Outlet velocity30–45 m/s
Angle45° (downward)
Position of 1st nozzles20–30 cm from slot edge in the branch arm
TypeDual diameter with orifice in the nozzle back
BranchLess than 10 to reduce vibration and support area requirement
Pipe L/DContinuous pipe through the main header and slotted opening
ArmFit
FittingsForged fittings instead of miters for supporting the headers; the forged fittings minimize failures due to stress cracking
Table 7. Summary of afterburn causes and potential solutions in FCC regenerators.
ComponentIndicator/Cause Solution
Spent catalyst distributorImproper design (tangential or radial sidewall catalyst injection leading to high O2 bypass in carbon lean zone)Modification to the distributors (installation of plate or baffle deflector)
Spent or spent catalyst slide valve
-
Catalyst flow reversal due to undesirable negative differential pressure
Utilization of pressure differential controllers (PDICs) to regularly track and regulate differential pressure across the slide valves (see Figure 10)
Cyclone
-
differential rise in cyclone outlet temperatures
-
High gas volume and temperature
-
High catalyst loading
-
Catalyst characteristics (e.g., coarse)
-
Inferior surface material construction
-
Poor maintenance
-
Sudden switch in operating conditions (e.g., rise in inlet or outlet velocity, high pressure drop, sudden temperature change)
-
Too low bed height
-
Too high bed height
-
Poor bed fluidization
-
Modifying the cyclone suspension geometry
-
Material reinforcement to withstand afterburn
-
Injection of steam into the freeboard before gases transfer to the cyclones
-
Moderate increase in gas expansion angle to lower gas buffeting the outlet tube
Ensure steady catalyst circulation flux from reactorRaise the bed height but to a level not leading to an elevation of entrainment or catalyst loss rate
Partial burn
Regenerator
-
Low bed temperature with rising combustion feed gas (resulting in incomplete O2 utilization in the freeboard)
-
Low bed height
-
High Concentration of CO in the freeboard
-
Raise system pressure
-
Raise the bed height but to a level not leading to an elevation of entrainment or catalyst loss rate
-
Minimize excess O2 level in the flue gas composition
Full burn
Regenerator
-
Maldistribution air or catalyst distribution (improper design or faulty air/spent catalyst distributor)
-
Low feed gas concentration (leading to incomplete burning of CO to CO2 in the freeboard)
-
Use of CO combustion promoter
-
Raise system pressure or optimizing suction pressure of air blower
-
Increase O2 level for coke combustion or supplement with pure O2
Table 8. Flue gas emission regulation in FCC regenerator unit [251].
ParametersCO (ppmv)SOx (ppmv)Particulate (mg/Nm3)NOx (ppmv)
Typical FCC emission range300–60020–30050–50080–550
Environmental limit<500<2595–125 **20
**: represents 1kg of PM per every 1000 kg of coke combusted in the regenerator.
Table 9. Causes of FCC flue gas SOx emissions.
FactorContribution to SOx ConcentrationAlternative Mitigation
Feedstock qualityHeavier feedstocks amount to high sulfur in feedHydrotreat heavy crudes
Recycle streamsUsually heavy coke-sulfur formingLower the amount of recycle stream
Fresh catalystLower alumina lowers SOx efficiencyIntroduce sulfur capturing agents
Equilibrium catalystActivity and additives present (SOx and CO)Select suitable additive grade and level
Circulation rateLower rate punctures removal efficiencyIncrease O2 partial pressure
Regenerator InventoryLarger inventories reduce efficiencyUse multi-stage combustion mode
Regenerator TemperatureHigh temperature favors SOx oxidation, hinders SO3 absorptionIncrease excess O2 and lower temperature to favor SO3 formation
Reactor temperatureLow temperature inhibits reduction of sulfates to H2SHigher temperature favors reduction of sulfates to H2S
CO Promoter UsageReduction in CO promoter will decline efficiencyAdjust the amount of CO promoter
Additives AdditionBatch addition reduces efficiencyNear-continuous addition enhances efficiency
Stripper OperationPoor stripping will promote SOx levelIncrease stripper efficiency
Table 10. Operational and Structural mitigation of NOx emission.
Control OptionMechanism/Additional FeaturesPitfallStrength
Online Improvement Options
Feed Deep hydrotreating/Low N2-based feedstockHydrogen + feed, high temperature and pressureNot flexible, energy intensive and costlyReduction in impurities and low coke deposition
Pt-based combustion promoters
-
reducing platinum to <2 ppm
-
reducing bed temperature
-
reducing excess oxygen
-
Excessive NOx formation
-
easily poisoned by Pb/Sb
Good Afterburn control
-
40% NOx reduction
Pd-based combustion promoters (CP, P) +
-
Full-burn
-
multiple cyclones
-
modern feed nozzles
-
<0.6 wt.% DeNOx additive
Presence of CO can act to reduce NOx to N2 as:
2CO + 2NO --> 2CO2 + N2
NOx reduction by 65%
Maintain good Afterburn control
Process controlControl of excess air
-
Fuel and O2 Staging
-
Steam injection
-
Ultra-lean premix of catalyst and air
-
Flue gas recirculation
-
Initial O2 leanly combusts in the 1st stage and the remaining air burns in the second stage
Optimize the operation to minimize excess O2 in full burn and reducing the CO percentage in partial burn systems
Hydrothermal deactivation of entrained catalysts
-
High temperature control is achieved
-
High reduction in NOx
Add CO promoter separately rather than pre-blending it with the catalystPre-blending limits control and flexibility in stable and unstable operationsRequires high monitoringHigh reduction in NOx
End-of-pipe Options
Selective non-catalytic reduction
(SNCR)
NH3 or urea nozzles are installed in the
convection section of CO boilers. These nozzles are used to atomize NH3
at temperatures of 850–1030 °C. NH3
will react with NOx species through to N2
-
Uses H2 as reducing agent
NO + NH 3 + 1 2 O 2 + 2 H 2 O + 1 2 H 2 N 2 + 4 H 2 O
NH3 slip can reach as high as 20 ppm in the stack gas in an SNCR process, depending on
the quality of NH3
NO ratio control in the reaction section
NH4HSO4 and (NH4)2SO4 salts can form as byproducts, causing plugging and corrosion downstream
Decrease in NOx level by 20–75%
selective catalytic reduction (SCR)a V2O5 or WO3 based catalyst aids the formation of N2 from NOx, using air and NH3 as reactants
Optimum operational temperature is between 300–400 °C
4 NO + 4 NH 3 + O 2 4 N 2 + 6 H 2 O
6 NO + 4 NH 3 5 N 2 + 6 H 2 O
Catalyst Plugging due to salts formation
High flue gas pressure drop
Large space requirement
Potential Precipitation of sulfur as (NH4)HSO4
High CAPEX
70–97% by the SCR processcatalyst life is typically between four to six yearsLow NH3 slip (<10 ppm)Generates waste water
Wet Gas Scrubbers
(LoTOX Technology)
NOX is converted to N2O5 and then to HNO3 by ozone.
Nitrogen leaves the process as NaNO3
through reaction with NaOH
-
Under reaction temperature < 149 °C
NO + O 3 NO 2 + O 2
2 NO 2 + O 3 N 2 O 5 + O 2
N 2 O 5 + H 2 O 2 HNO 3
High CAPEX and OPEX
Treatment of NaNO3
and NaSO4 enriched steams is typically required, Otherwise, crystallization
units are required to remove salts from the purge streams,
resulting in further capital and operational costs
NOx removal is above 98% (<10 PPMVD)
Does not convert SO2 to SO3
Low flue gas pressure drop
Operates at flue gas saturation temperature
Generates lots of waste water
Publisher’s Note: MDPI stays neutral with regard to jurisdictional claims in published maps and institutional affiliations.

