Article

Study of the Fire Behavior of Multilayer Cables in a Mine Tunnel

1
College of Safety Science and Engineering, Liaoning Technical University, Huludao 125105, China
2
Key Laboratory of Mine Thermo-Motive Disaster and Prevention, Ministry of Education, Huludao 125105, China
*
Author to whom correspondence should be addressed.
Energies 2022, 15(6), 2059; https://doi.org/10.3390/en15062059
Submission received: 27 January 2022 / Revised: 27 February 2022 / Accepted: 9 March 2022 / Published: 11 March 2022

Abstract

:
Fires caused by cables occur frequently in mines, which endanger the safety of workers. To explore the characteristics of a multilayer cable fire in a mine tunnel, multilayer cable fire simulations were carried out using the Fire Dynamics Simulator (FDS). The influence of cable tray spacing, ignition position, and tunnel ventilation speed on the characteristics of the fire were studied. The results showed that these factors change the amount of contact between the cable and air, the heat accumulation, and the heat transfer by the flame interaction between the cables. It was also noted that increasing the spacing or wind speed both made the peak of heat release rate (PHRR) initially increase and then decrease. The influence of wind speed on the cable burnout rate in the upstream and downstream sides of the fire source was not consistent, and the wind speed had a sensitive effect on the cable burn out rate in the upstream side of the fire source. The higher the ignition position was, the longer the arrival time of PHRR was and the slower the fire developed. There was a higher burn velocity close to the ceiling. The cable hooks obstructed the cable fire. This study provides a theoretical basis for cable fire prevention and control in mine tunnels.

1. Introduction

Coal is the main energy source in the world. There are many disasters in coal mines that affect the safety of workers [1]. Cables are widely used in mine tunnels for electrical equipment in underground mines. Electric cable fires frequently occur [2]. Cable fires are easily caused by circuit overloads, short circuits, interface failure, and other fire sources, leading to enormous casualties [3,4]. The cables are usually laid in the way of multiple layers along the walls of the tunnels. The other layers may quickly ignite if one layer of the cable tray burns, leading to a catastrophic fire event [5,6]. Thus, it is necessary to study the combustion characteristics of multilayer cables in mine tunnels.
The research of cable fires has mainly focused on fire characteristics and calculating the flame spread rate of the cables [7]. Researchers proposed a critical condition for maintaining the expansion of a cable fire, deduced an empirical formula for the spread rate of a vertical upward fire, and further revealed the impacts of cable size, material, and other parameters on the spread of a cable fire [8,9]. Additionally, the environmental factors also had some influence on cable fire, such as areas of a cable tunnel [10], thermal circumstance [11], a T-shaped [12] or L-shaped utility tunnel [13], cable inclination angle [14], etc. Furthermore, the consequences (thermal effect, smoke propagation, and chemical species) of cable tray fires in the tunnel were investigated. The effect of cables and adjacent side wall on fire growths and PHRR were discussed in detail [15]. The cable laying conditions such as interlayer distance and cable spacing also have a great influence on the flame characteristics and fire hazards of multilayer cables in public engineering tunnels [16,17].
In terms of numerical simulation, the Consolidated Model of Fire and Smoke Transport (CFAST) and the Fire Dynamics Simulator (FDS) are the most widely used. Some researchers used the FDS and compared simulated data with experimental data to verify the accuracy and feasibility of cable fire numerical simulations [18]. They used simulation software to conduct a large number of full-scale tunnel studies [19,20]. Hu conducted a full-scale tunnel experiment to study the smoke spread and longitudinal temperature distribution in a long channel [21,22]. Some studies also showed that FDS can be used to establish a fire prediction model, which can be used to predict the movement of fire smoke in tunnels [23,24,25].
At present, some scholars have focused on the gas diffusion, flame propagation and temperature distribution of fire in integrated underground pipe corridors or tunnels. Few studies have been carried out for cable fires in mine tunnel structures. The cable laying requirements of mine tunnels are different from those of integrated underground pipe corridors and tunnels. The cables in the integrated underground pipe corridors and tunnels are mostly laid on the cable bridge, while the cables in the mine tunnels are close to the wall and connected by hooks. Cables in the mine tunnels may be commonly placed on a wall by a hook, and wall constraint will affect a cable fire [26]. Additionally, the cross-section size of the mine tunnels is smaller than the integrated underground pipe corridors and tunnels. The influencing factors for cable fire behavior in mine tunnels are complex, such as the multilayer cable layout, tunnel ventilation, fire location, and topography. Moreover, in some simulations, an excessive grid size was used to merge multiple cables into one large-sized cable, and the interaction between cables during combustion of multiple cables was ignored. The combustion condition of each cable was not precisely analyzed.
According to the Code for Design of Mine of Coal Industry (Chinese standard GB50215–2015) and the Code for Design of Roadway Section and Junction of Coal Mine (Chinese standard GB50419–2017), a cable fire model was established using the FDS. Each cable was considered as an independent entity. The fire behavior of mine tunnel cables was analyzed with three types of variables: wind speed, ignition position, and cable tray spacing. This study provides a theoretical basis for cable fire prevention and control in mine tunnels.

2. Materials and Methods

2.1. FDS Theoretical Basis
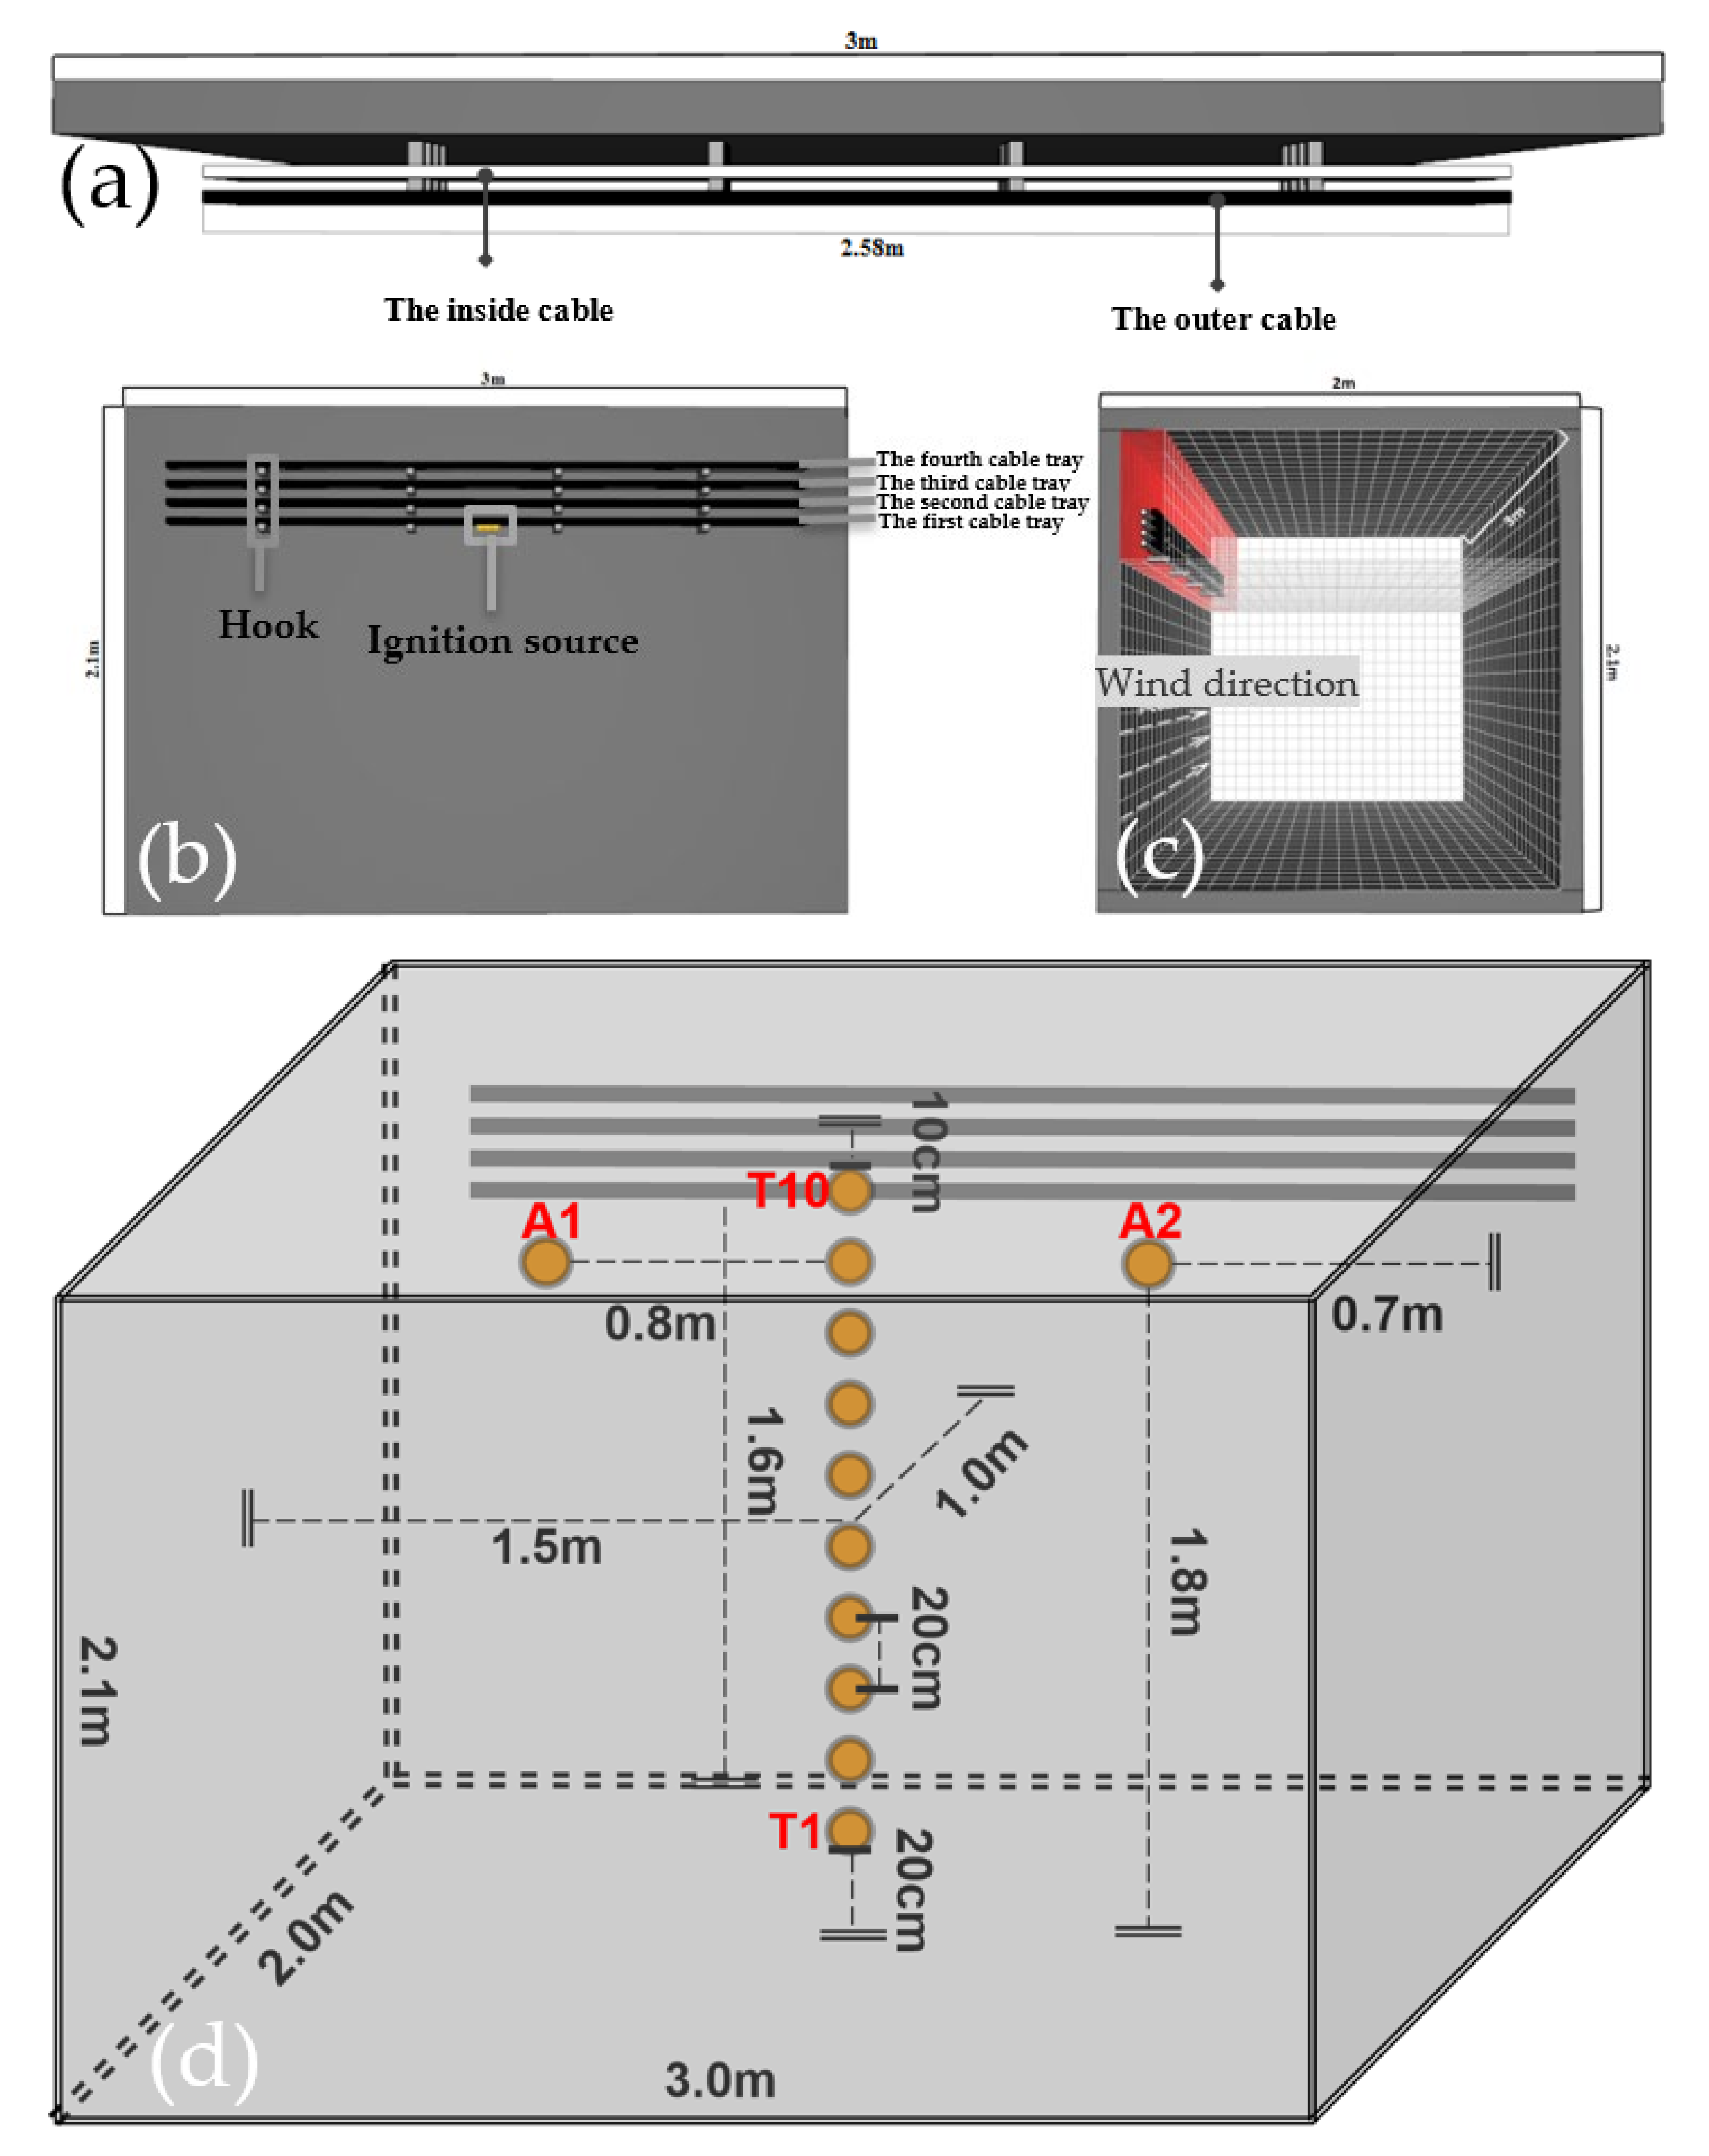
FDS is a Computational Fluid Dynamics (CFD) model of fire-driven fluid flow jointly developed by the National Institute of Standards and Technology (NIST) and the Technology Research Center of Finland [27]. The model solves Navier–Stokes equations appropriate for low-speed and thermally driven flow, emphasizing numerical smoke and heat transport from fires. The partial derivatives of the conservation equations for mass, momentum, and energy are solved by finite differences. Thermal radiation is computed using a finite volume technique on the same grid. Lagrangian particles are used to simulate smoke movement and sprinkler discharge. It is widely used in the field of fire simulation. The Fundamental Conservation Equations are presented here.
Conservation of Mass
ρ t + ρ v = s
Conservation of Momentum
ρ d v d t = p + ρ g + μ 2 v ρ d v d t
Conservation of Energy
ρ E t + v ρ E + p = k T j h j J j + τ v + s k
E = h p ρ + v 2 2
where ρ is the density, g/cm3; t is the time, s; v is the velocity vector, m/s; s is the quality, g; p is the pressure, Pa; g is the acceleration of gravity, m/s2; μ is the dynamic viscosity, Pa·s; E is the total energy, J; J j is the diffusion flux of component, kg/(m2·s); s k is the exothermic and endothermic reactions, J; h is the Weight potential energy, J; k is the effective heat conductivity.

2.2. Physical Model

The size of the mine tunnel was set to 3 m × 2 m × 2.1 m, according to the Code for Design of Mine of Coal Industry (Chinese standard GB50215–2015). Four layers of cable trays were laid 50 mm away from the wall surface, and two lines of cable were placed on each tray at 25 mm intervals. There were 8 cables with a length of 2.58 m each. A total of four layers of cables were laid with a cable tray spacing ranging from 25 mm to 75 mm, depending on the working conditions. The cable suspension height was not less than 1.5 m, and the distance from the wall was not less than 0.5 m. Accordingly, the installation height of the first cable tray was fixed at 1.6 m, and the two lines of cables were 50 mm and 100 mm away from the wall surface, respectively.
In order to understand the longitudinal temperature distribution of the tunnel and the influence of cable combustion on the surrounding environment, a set of thermocouples were placed on the longitudinal center line of the tunnel. In total, 10 thermocouples with a spacing of 0.2 m were installed at the longitudinal center line of the tunnel from bottom to top, and the measurement height range was 0.2–2.0 m, labelled T1–T10. In addition, two thermocouples, A1 and A2, were arranged at 0.8 m on both sides of the longitudinal axis at a horizontal height of 1.8 m. When increasing the ventilation, A1 measured the temperature upstream of the fire source and A2 measured the temperature downstream of the fire source. The thermocouple distribution is shown in Figure 1d. The physical model is shown in Figure 1 (the cable tray spacing is 25 mm in the schematic).

2.3. Combustion Settings

The fuel was a copper core polyvinyl chloride (PVC) cable mainly composed of a copper conductor and a PVC insulating sheath [28]. The cable material parameters are shown in Table 1 [29]. The combustion reaction equation for PVC is as follows:
1 (C2H3Cl) + 1 (1.53 O2 + 1.53 (3.76) N2) →
Fuel         Air
1 (HCl + H2O + 0.14 CO + 0.96 CO2 + 0.90 C + 1.53 (3.76) N2)
Products
Due to the working principle of the FDS, the calculation area and object were set as cuboids. The cable was simplified as cuboid with a cross-section of 0.025 m × 0.025 m. The surface thickness of cable was 0.025 m, and the surface was set as a mixture of 33% copper and 67% PVC. The cable combustion was a simple pyrolysis model, and ignited at 300 °C, and the heat of combustion was 16,400 kJ/kg [30].

2.4. Ignition Source

In order to simulate the burning of the cable due to a short circuit, three particle heaters, which can emit particles at 1200 °C, were used to heat the cable. Figure 1b shows that each particle heater had a transverse spacing of 0.03 m and was located 0.005 m below the center of the first layer of cable. The time of particle heaters in the simulations was 1500 s.

2.5. Other Conditions Settings
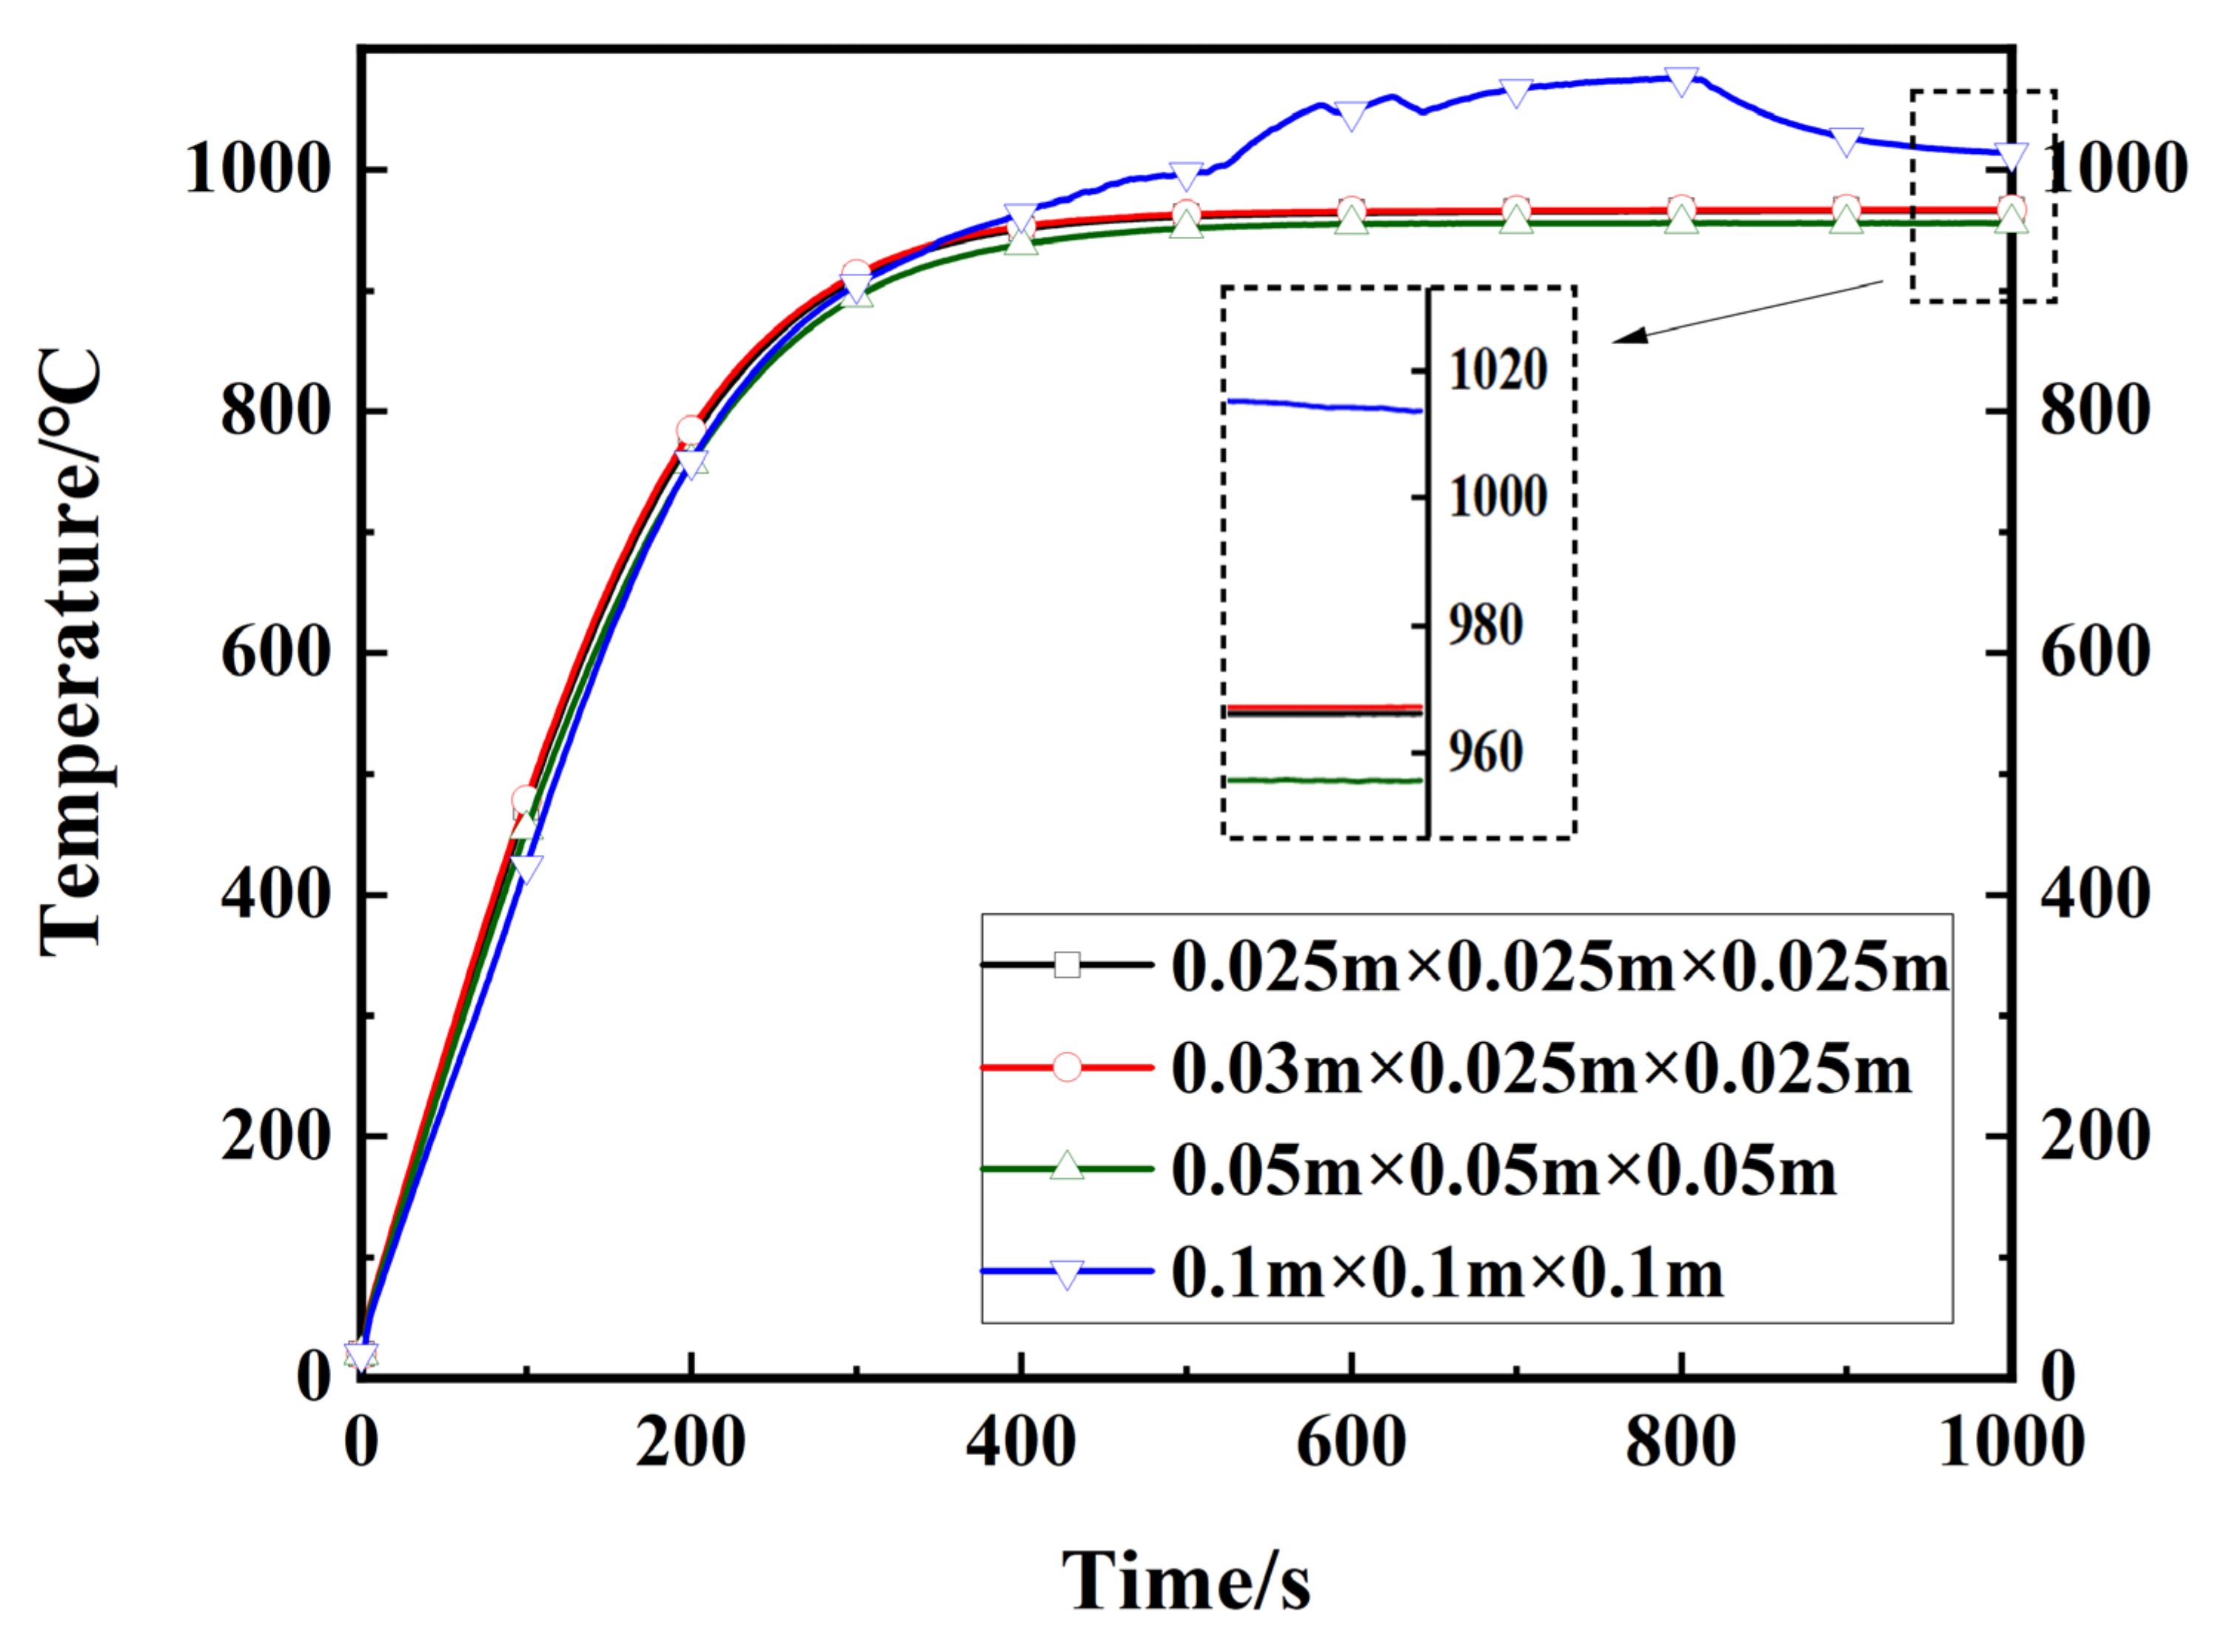
The boundary conditions of the walls and roof were set to concrete with a thickness of 0.1m, ambient temperature of 20 °C, air pressure of 101,325 Pa, and relative humidity of 40%. Both ends were in the open state. When the ventilation condition is increased, the boundary condition on the left side of the tunnel is supplied, and the ventilation wind speed was between 0 m/s and 1.0 m/s, according to different working conditions.

2.6. Dividing Mesh

Dividing meshes are a vital part of the simulation, directly affecting the accuracy of the simulation. In general, the smaller the mesh is, the higher the calculation accuracy is, but it was found that an excessively large or excessively small mesh size will cause a relatively large error. A reasonably sized mesh can shorten calculation time and ensure calculation accuracy. The calculation accuracy is determined by mesh sensitivity analysis, which shows that the simulation accuracy is high when the mesh size is between 1/4 and 1/16 of the fire source diameter [27]. The calculation formula for flame diameter (D*) is as follows. The specific parameters are shown in Table 2.
D * = Q / ρ c T g 2 / 5
The flame diameter is about 0.38 m which is obtained by Equation (6). The mesh size between 0.095 m and 0.02375 m is reasonable in the main combustion zone. Mesh independence analysis is carried out in this interval [31]. Figure 2 shows the temperature at the heat source center under different mesh sizes. With the improvement of mesh accuracy, the temperature at the heat source center tends to be consistent. The heat source center temperature at a mesh size of 0.03 m × 0.025 m × 0.025 m is basically consistent with that at a mesh size of 0.025 m × 0.025 m × 0.025 m, but in the calculation process, the former takes 73 min, and the latter takes 90 min, which is 19% higher than the former. Therefore, 0.03 m × 0.025 m × 0.025 m is suitable for mesh size. Moreover, the FDS calculation on the Y-axis and X-axis is based on the Poisson solver of the Fast Fourier Transform (FFTs). The running time will be shortened significantly when the mesh quantity on the Y-axis and Z-axis is a common multiple of 2/3/5 [27]. The flame and flue gas are mainly gathered around the side of the cable and ceiling in the process of tunnel cable combustion. The hybrid mesh was selected to have a combination of high calculation accuracy and short running time. The main combustion zone used a high-precision mesh (0.03 m × 0.025 m × 0.025 m), and others used a low-precision mesh (0.12 m × 0.1 m × 0.1 m). The number of all meshes was 29,400. Figure 1c shows that the red area used a high-precision mesh, and the white area used a low-precision mesh.

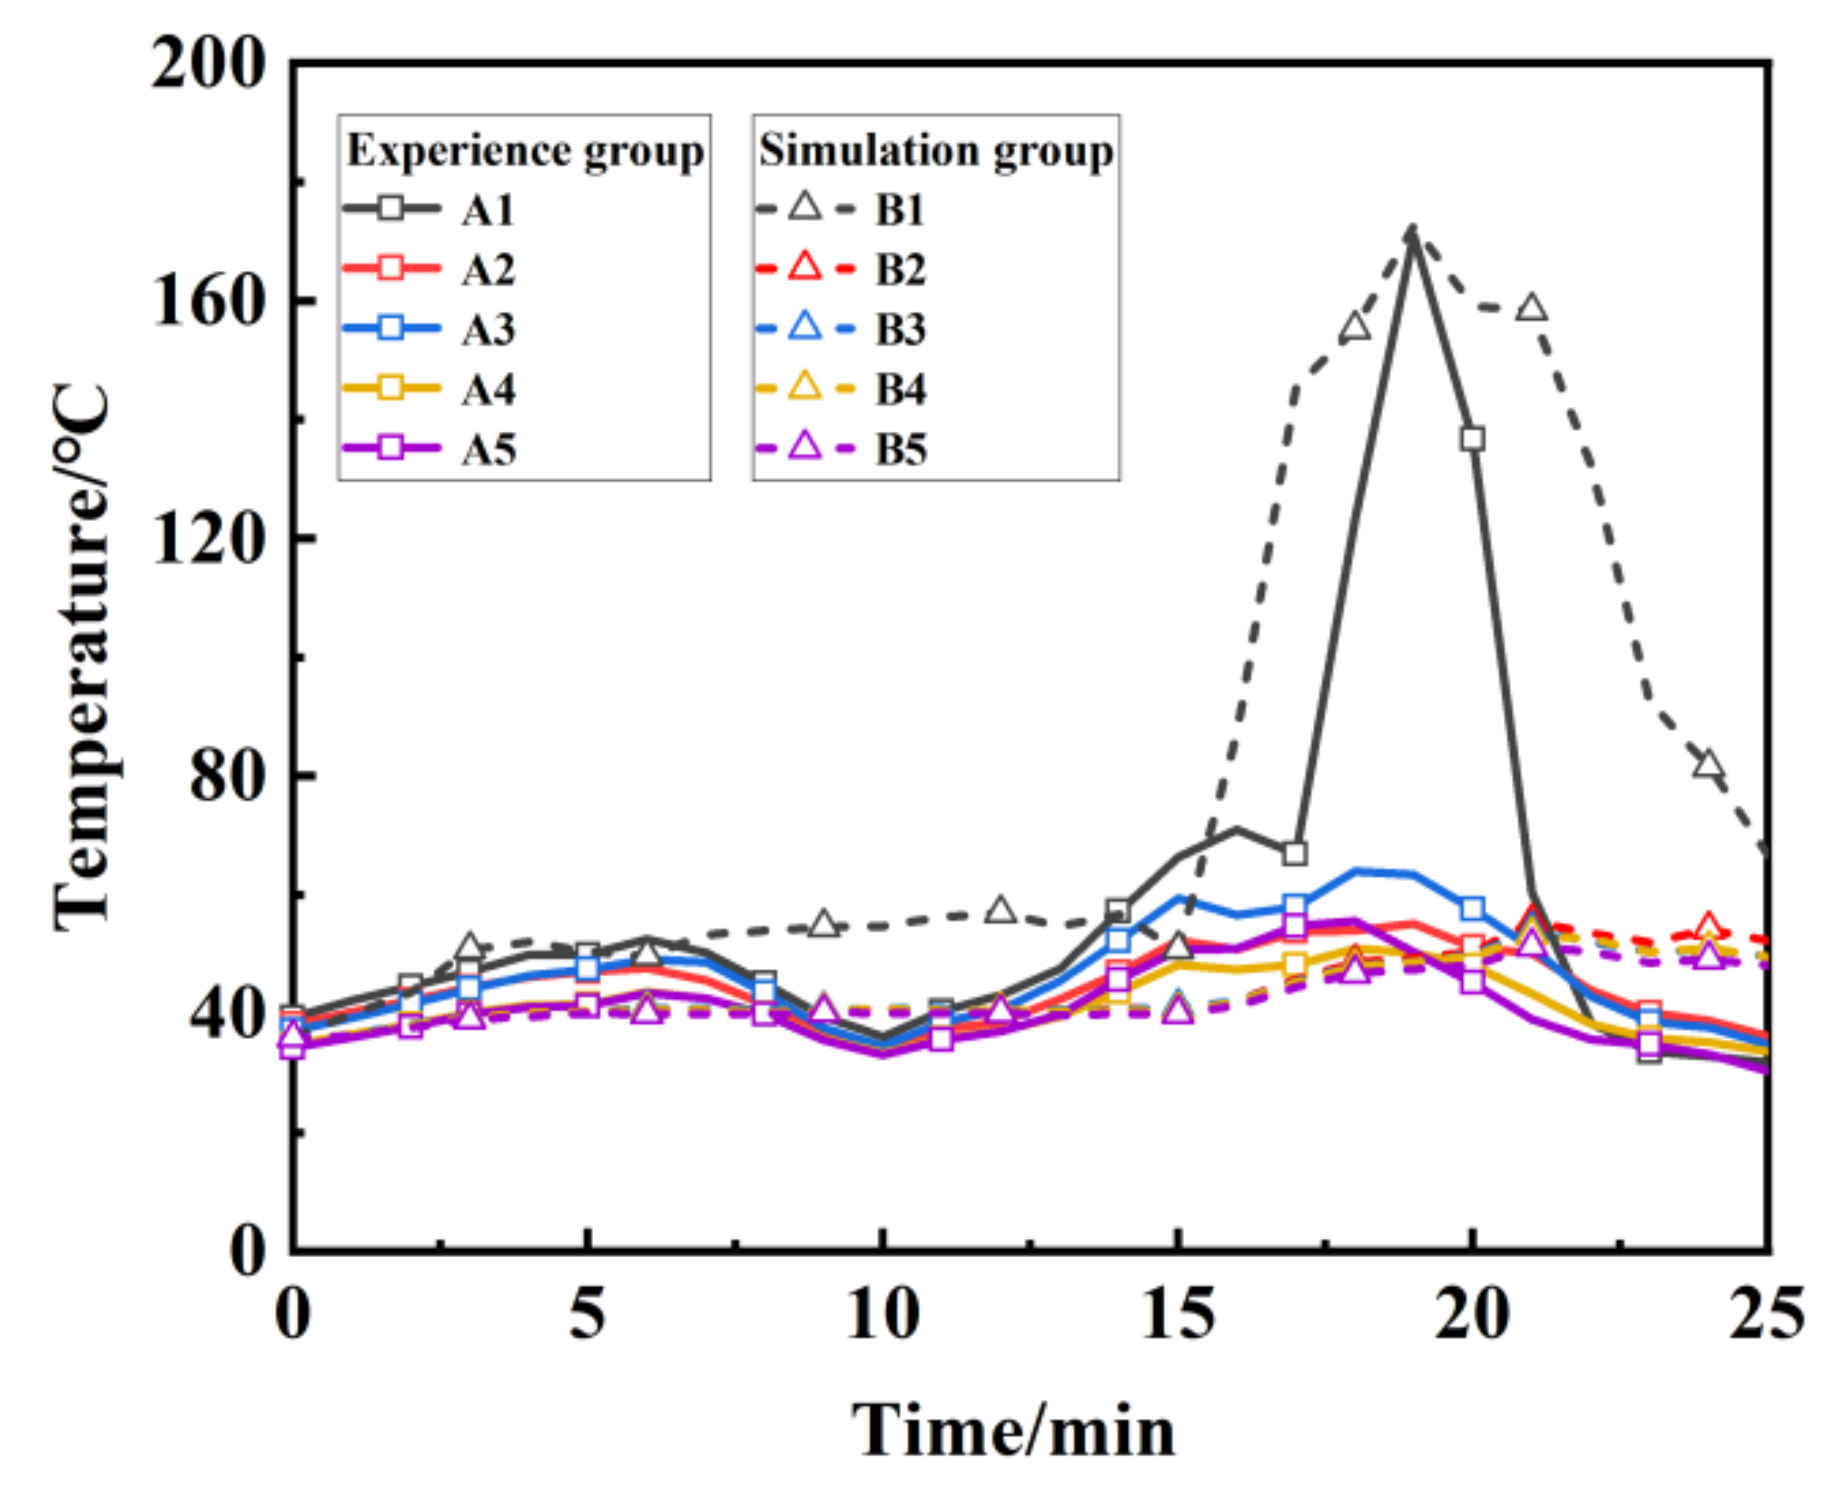
2.7. Feasibility Analysis of Simulation

The size of the tunnel in the experiment was 3 m × 0.26 m × 0.26 m (Figure 3a), and a cable with a diameter of 0.011 m and length of 1 m was used, which was placed in the center of the tunnel at a distance of 0.13 m from the bottom and at a distance of 1 m from the air inlet. Five thermocouples were arranged along the center line of the tunnel to measure the temperature, 0.15 m from the bottom, and 1 m, 1.25 m, 1.5 m, 1.75 m, and 2 m from the air inlet, respectively, with the probe located just above the cable. The ignition source is set at a distance of 1 m from the air inlet, the ignition source was burning pine, and the fuel was diesel. In FDS, the ignition source was a burner with a heat release rate per area of 300 kW/m2, and the effective heat release area of the burner was 0.05 m × 0.03 m. The other parameters are consistent with the experiment (Figure 3b).
The temperature change curve with time is shown in Figure 4, where A1–A5 are experimental data and B1–B5 are simulation data. It can be seen from the figure that the variation trend of the temperature curve and the peak value of the temperature in the simulation are similar to the experimental data, and the error is within the acceptable range. Therefore, the simulation in this paper is feasible.

2.8. Working Conditions

To explore the influence of cable tray spacing, wind speed, and fire position on cable combustion behavior, 10 working conditions were set up according to the Code for urban engineering pipelines comprehensive planning (Chinese standard GB50289–2016). The specific working conditions in Table 3 were set up. The standard working condition was set as a cable tray spacing of 50 mm, ventilation speed of 0 m/s, and ignition position under the first cable tray.

3. Results and Discussion

The heat release rate is the first fire characteristic that allows to quantify its intensity. The heat generated by combustion causes the ambient temperature to rise continuously, which endangers life when the temperature exceeds the limit that escaping personnel can bear, and it easily ignites wood, pipes, and other combustible materials in the mine tunnel. Thus, it is necessary to study fire behavior by analyzing the heat release rate. In addition, cables are horizontally laid in confined and narrow spaces. The spread of a cable fire is mainly transverse, so the fire expansion rate can reflect the velocity of expansion of the fire hazard area and determine the trends in fire development and fire intensity. For multilayer cable laying, each cable tray will interact during combustion, which is different from individual cable combustion. A change in working conditions has a different influence on the cables in different layers. Therefore, it is necessary to analyze the combustion rate of each cable layer. In this paper, the cable fire expansion rate will be selectively expressed by the flame spread rate and cable burnout rate, according to different working conditions.

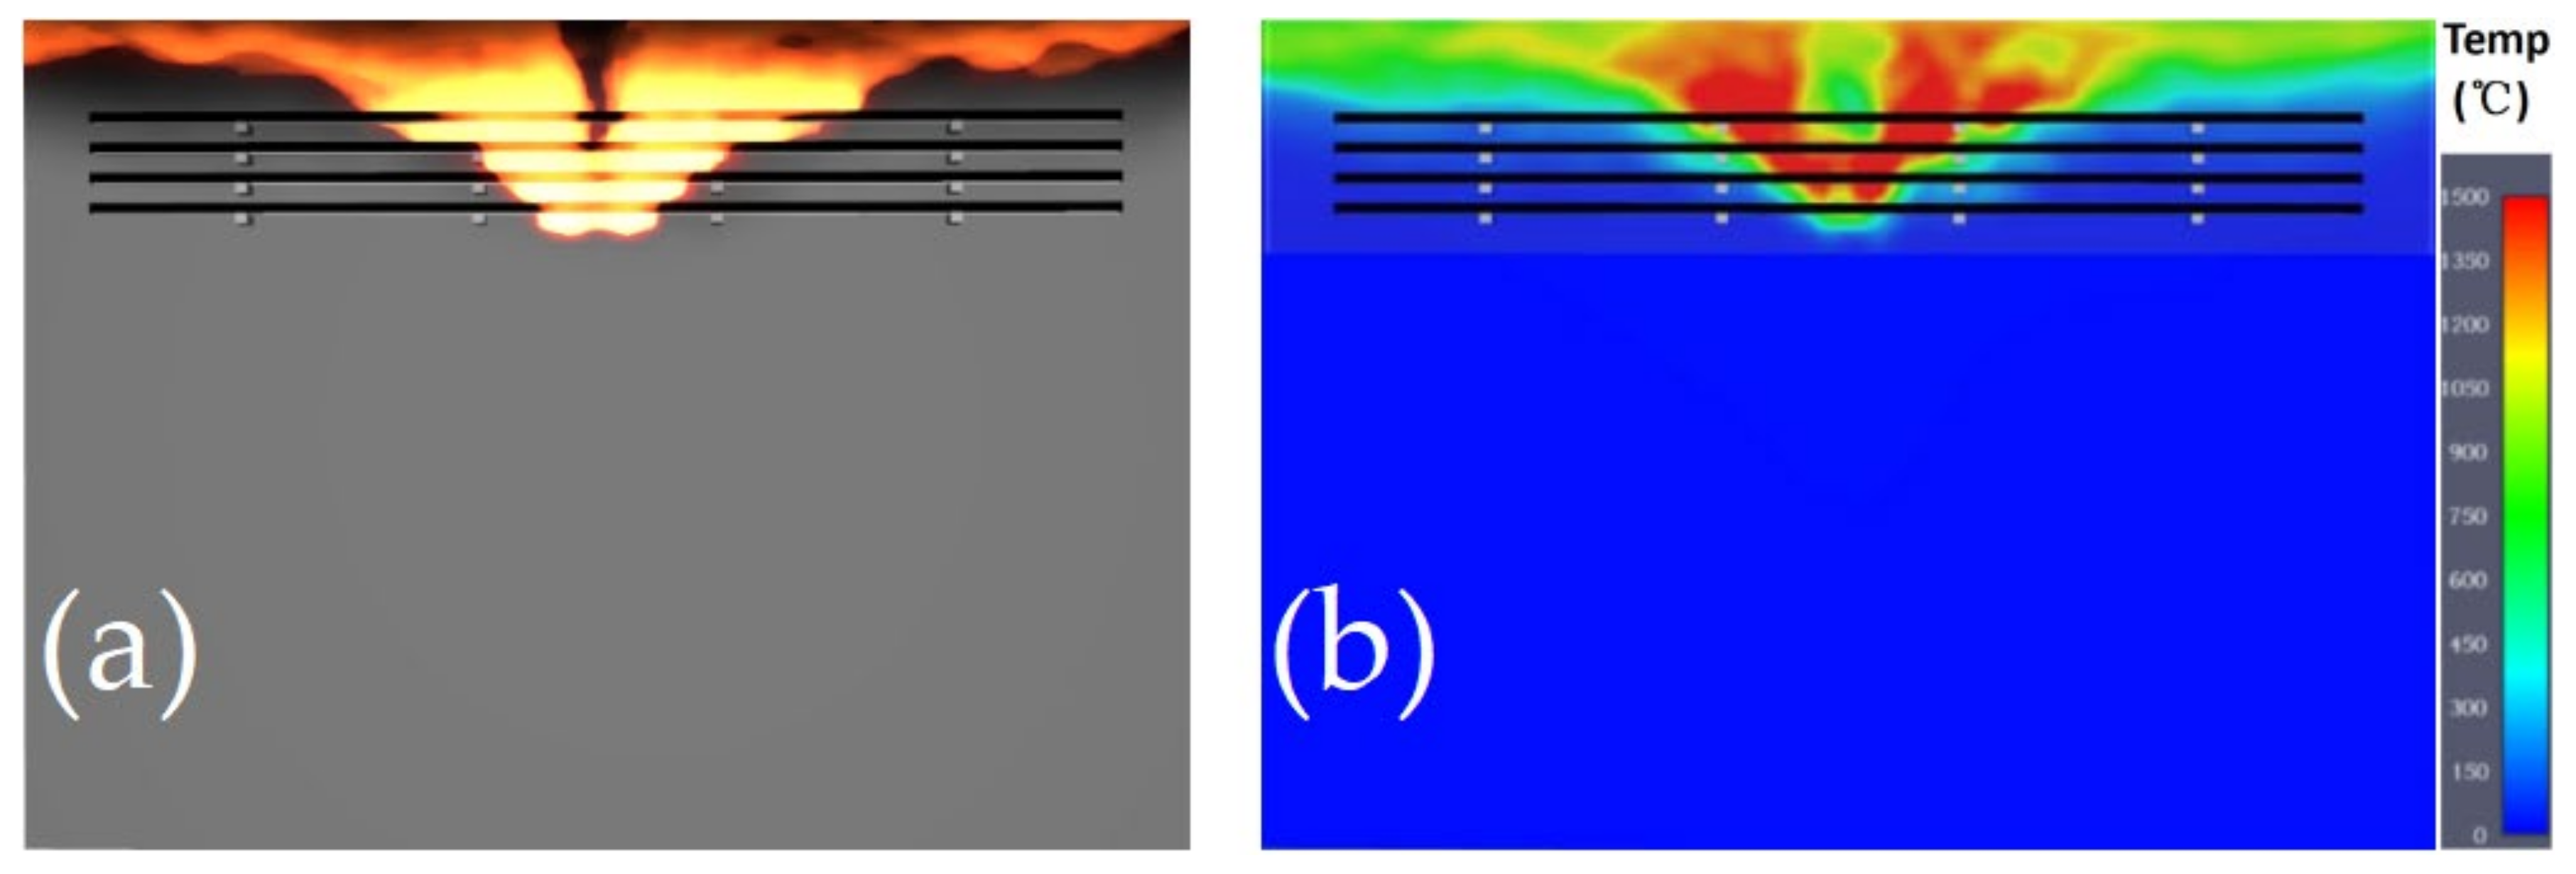
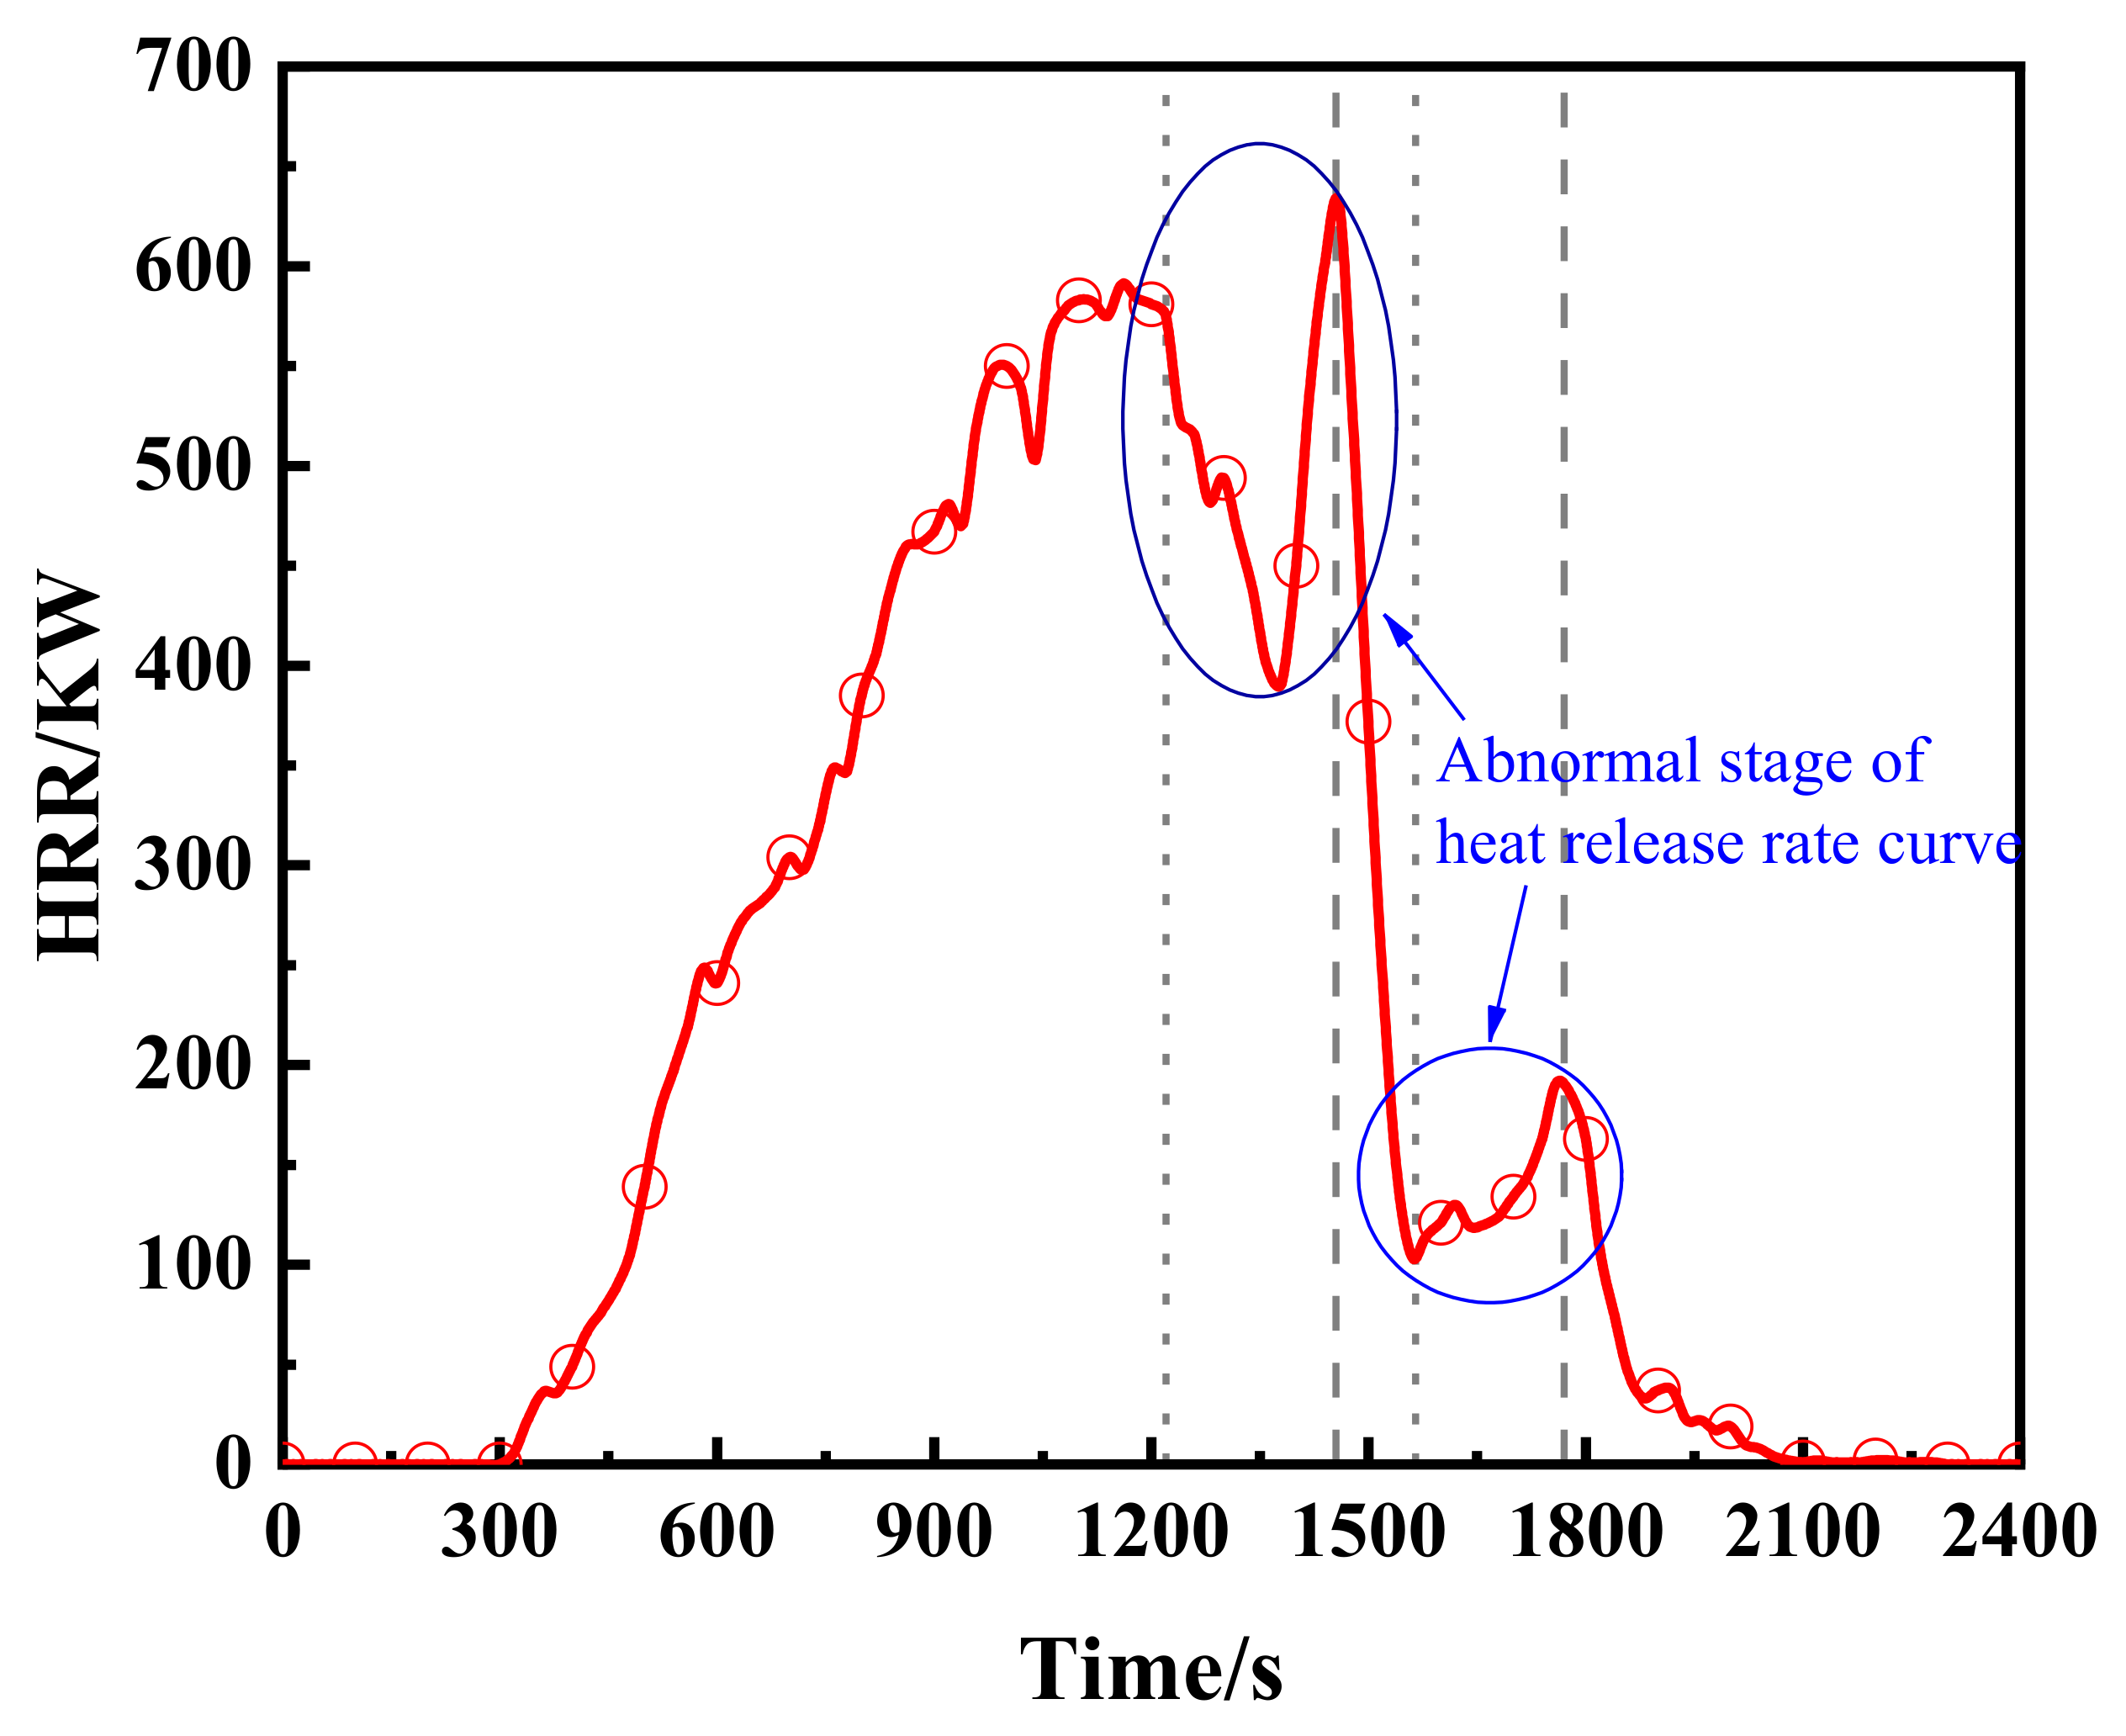
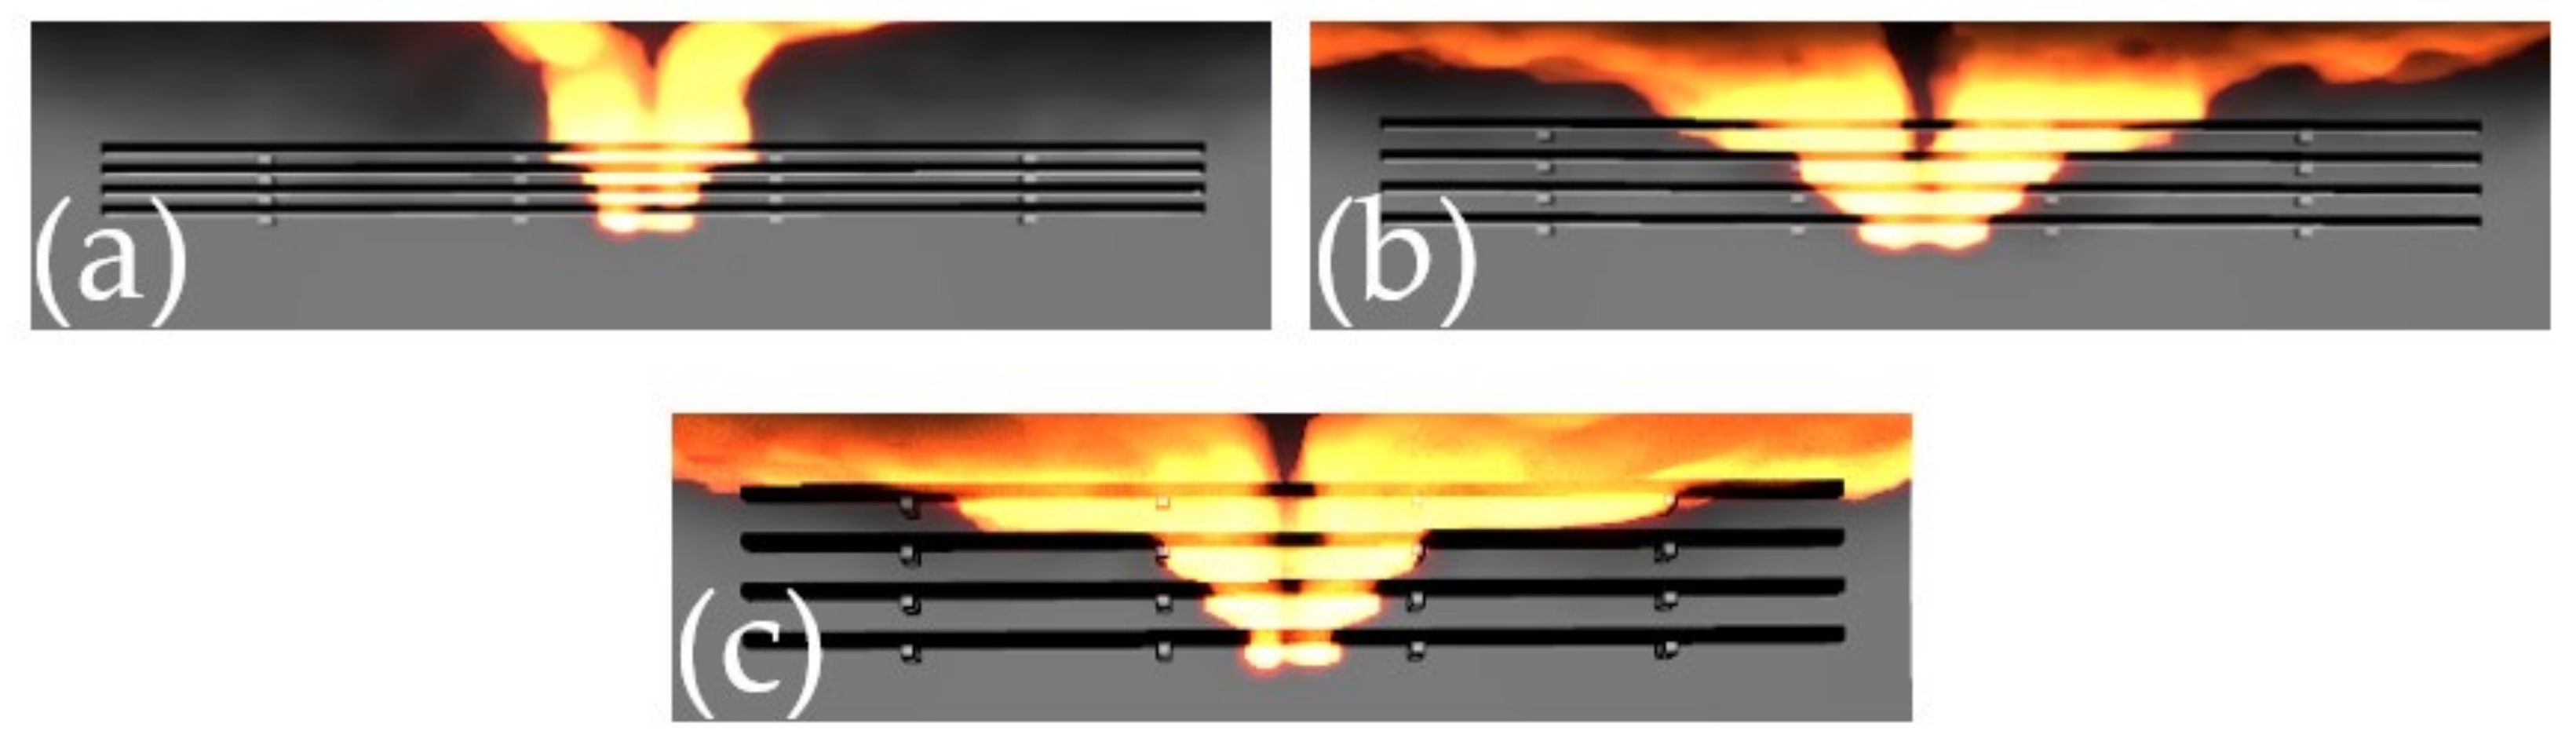
3.1. Fire Characteristics of a Multilayer Cable

The cable tray spacing was 50 mm without forced ventilation and the ignition position was at the first cable tray, and the cable burning condition and temperature slice at 700 s are shown in Figure 5. The fire spread upward, and the upper cables burned faster than the lower cables. The fire zone formed a “v” shape due to the cable flames spreading upward under the influence of thermal buoyancy. Observing the temperature slice diagram, it can be found that the upper part of the cable is hotter. In addition, the high temperature zone of the upper cables was larger, so the cables burned faster. The calculation formula of flame propagation average rate ( V a ) is as follows:
V a = h / t
where V a is the flame propagation average rate; h is the length of the cable, m; t is the total time that the flame propagation to the end of cable, s.
The flame propagation average rate on both sides of the cables is shown in Table 4. The flame spread rate of the cable in the first layer is about 0.056. The National Institute of Standards and Technology conducted a mass of cable fire experiments [32] and measured that the flame spread rate of PVC cable with horizontally placed conditions was 0.05 m/min under natural. The experimental data are close to that in this paper, which verifies the accuracy of numerical simulation.
According to the heat release rate curve calculated by FDS (Figure 6), the change of heat release rate mainly underwent four stages: the ignition stage, the rapid growth stage, the stable stage, and the rapid decline stage. Before 300 s, the heat release rate was in the ignition period, the cables did not burn to generate heat, the cables were gradually heated to the ignition point. The cable flames spread quickly to both ends after the cables were ignited at approximately 300 s. The combustion length of cable increased continuously, and the heat released by combustion was in the rapid increase stage. The cable flames of the fourth layer spread to the ends at approximately 900 s. In the 900–1200 s period, the heat release rate was in the stable stage because the change in the cable combustion area was small, and the flame spread rate was close to the cable burnout rate. After approximately 1500 s, the flames of all the cables had spread to the ends, and the total burning area no longer increased along the moving direction of the flame surface but decreased continuously as the cable burnt out. At this point, the heat release rate was in the rapid decline stage.
The heat release rate decreased and then increased rapidly in the 1220~1460 s period. The reason was that the FDS simplifies the cable and the hook as a cuboid. In fact, the cables and hooks are cylindrical. Close contact between the cable and hook hinders air entry and prevents the flame from spreading out. It slows down the rate of spread of the fire when the cable burns to the iron hook. Simultaneously, the length of the burning area of the third- and fourth-layer cables continued to decrease. After reaching a minimum value at 1380 s, the cables burned through the hooks, and the cables have larger surface contact with air. Additionally, at this time, the third and fourth layers of cables have burned to the end, the first and second cables have more oxygen contact (Figure 7). So, the spread rate rebounded, and the heat release rate rose again. For the same reasons mentioned above, the heat release rate suddenly increased slightly at approximately 1600 s.
The tunnel’s longitudinal temperature distribution curve is shown in Figure 8, and its changing trend was consistent with the heat release rate curve. The Figure 8 also shows that, in the multi-layer cable tunnel, the closer the roof is, the higher the temperature is. The fire plume hit the roof, driven by buoyancy, and drew in air from below to form a roof jet. The high-temperature flue gas changed from a vertical to horizontal flow and spread out along the roof to provide more thermal feedback. The temperature difference between horizontal heights of 0.2 m and 1.2 m was small and the temperature was low, while the temperature difference between horizontal heights of 1.2 m and 2.0 m was large, and the highest temperature was between 70 °C and 300 °C. At this height range, the high temperatures could gravely injure workers in the mine tunnel. There are a lot of wooden supports in a mine tunnel. The ignition point of wood is about 250 °C [33], and they could undergo ignition due to the heat flux received by the cable fires to enlarge the fire.

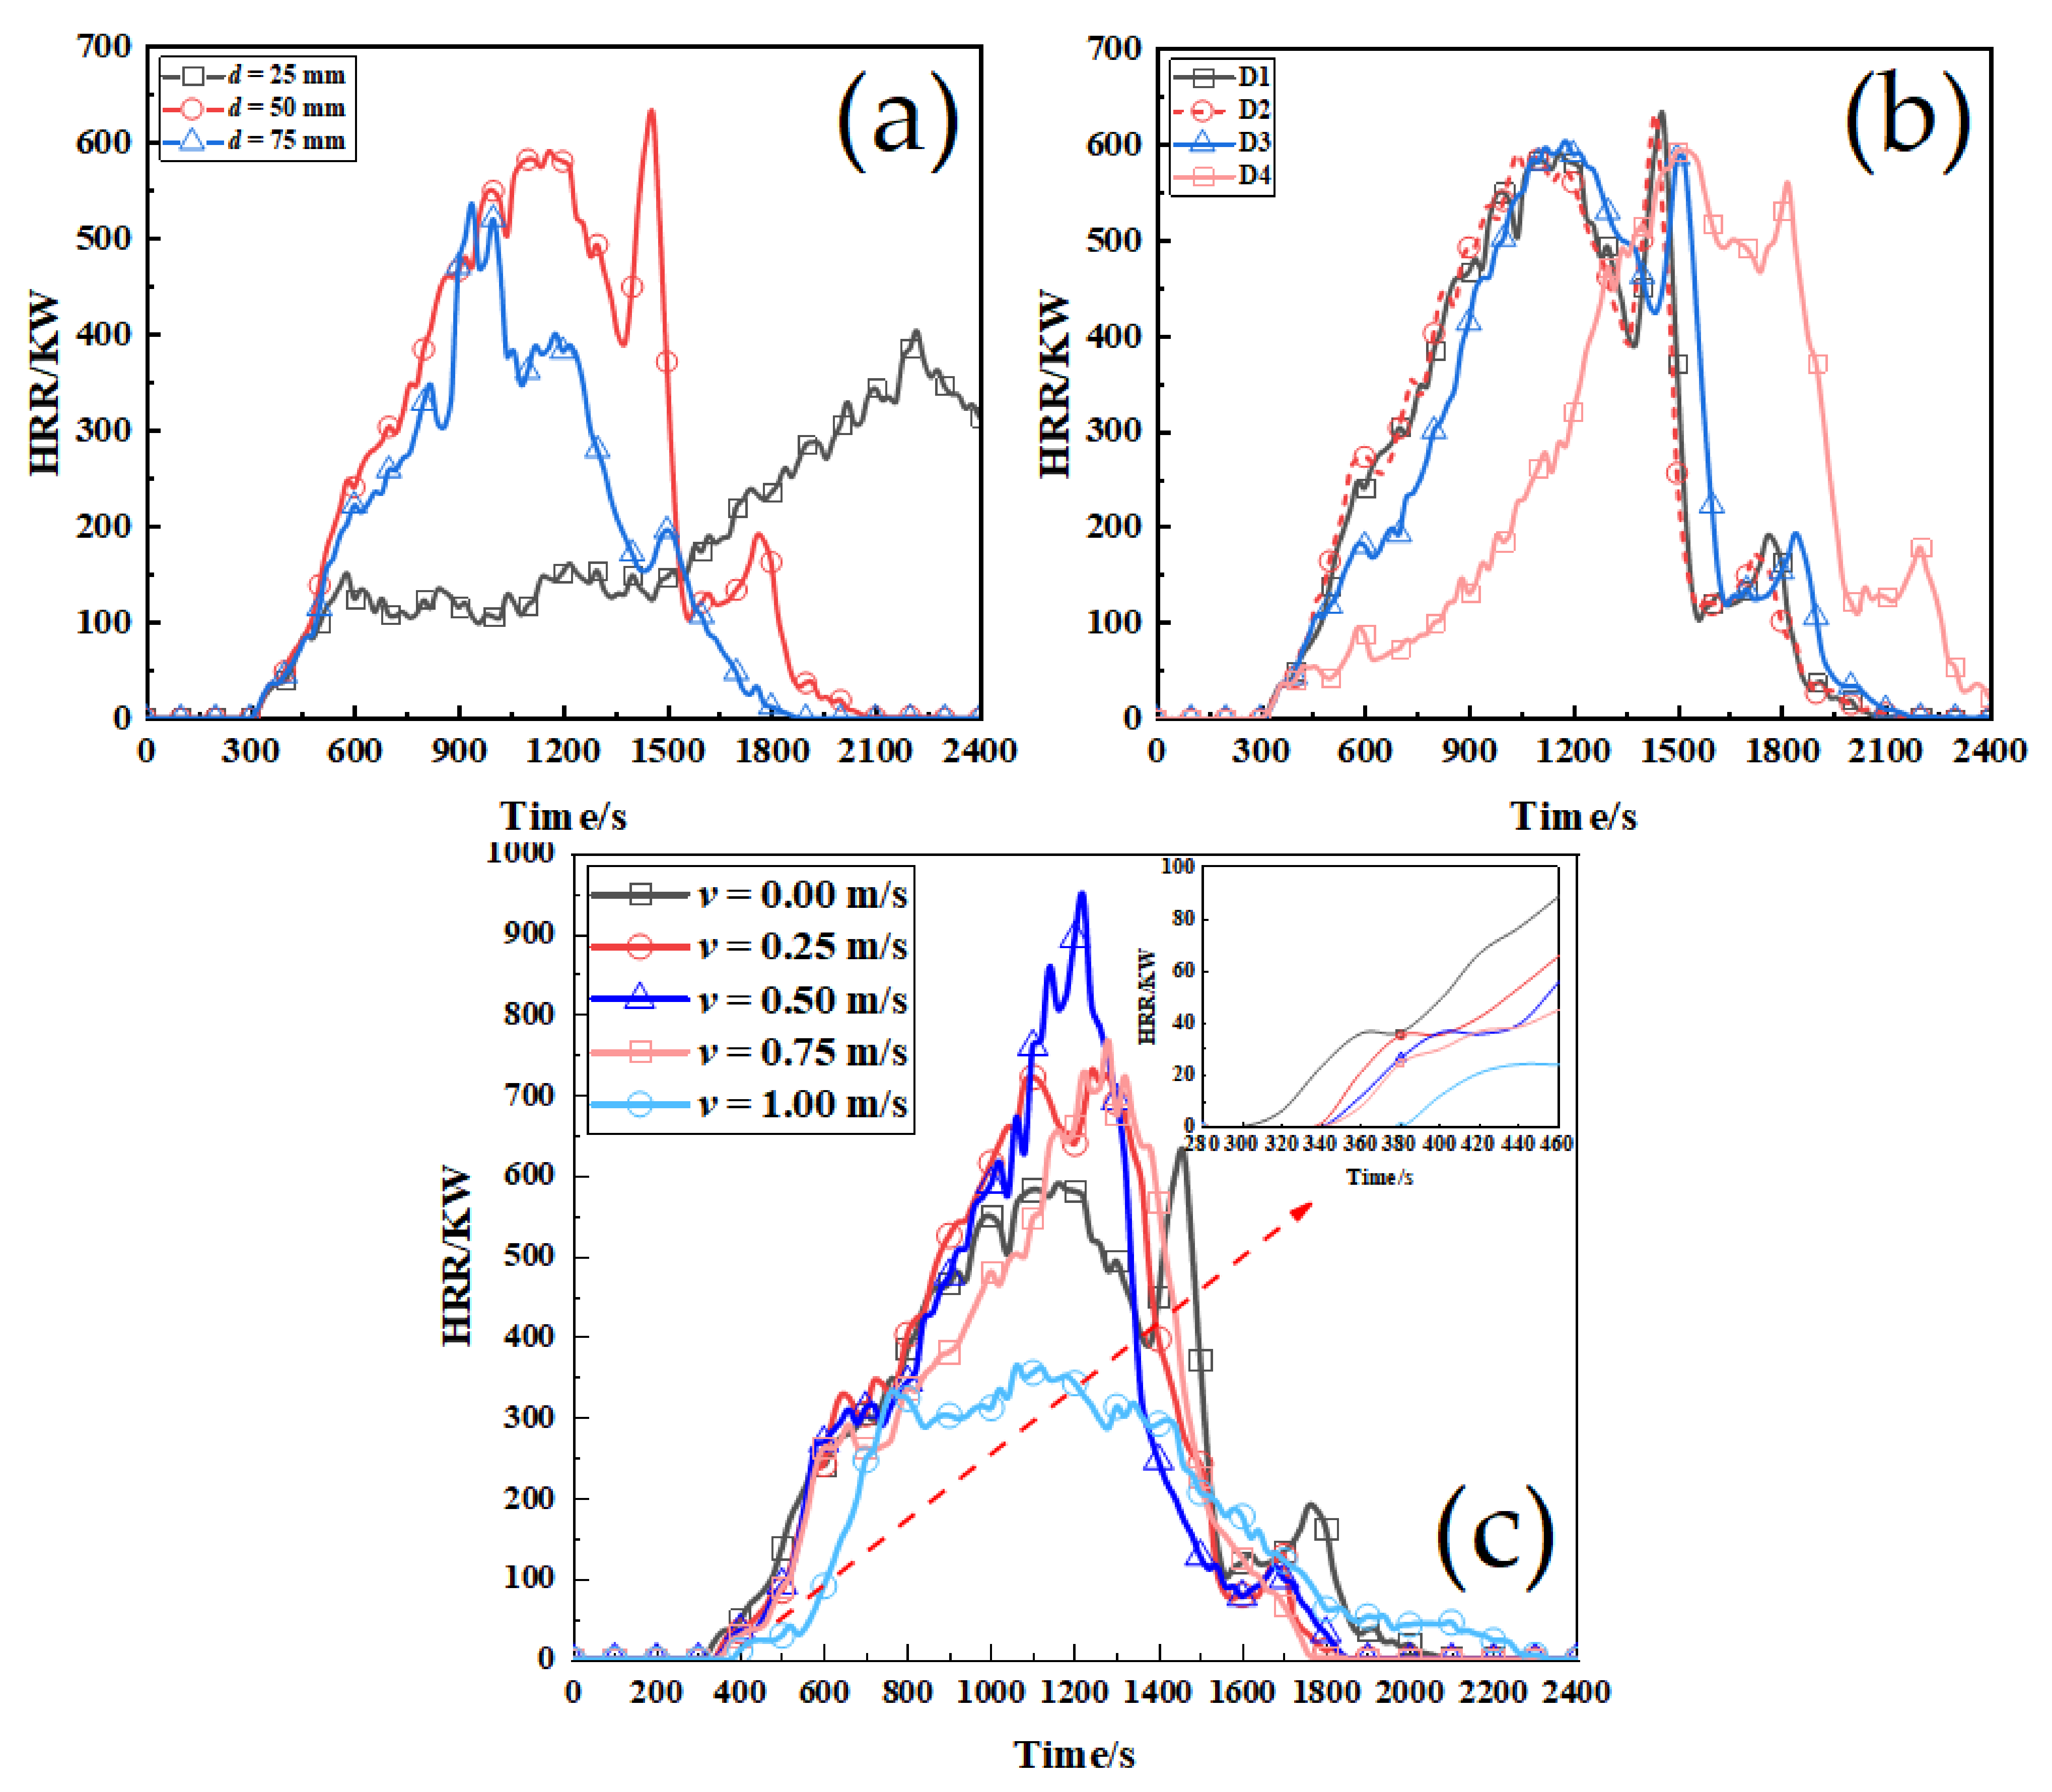
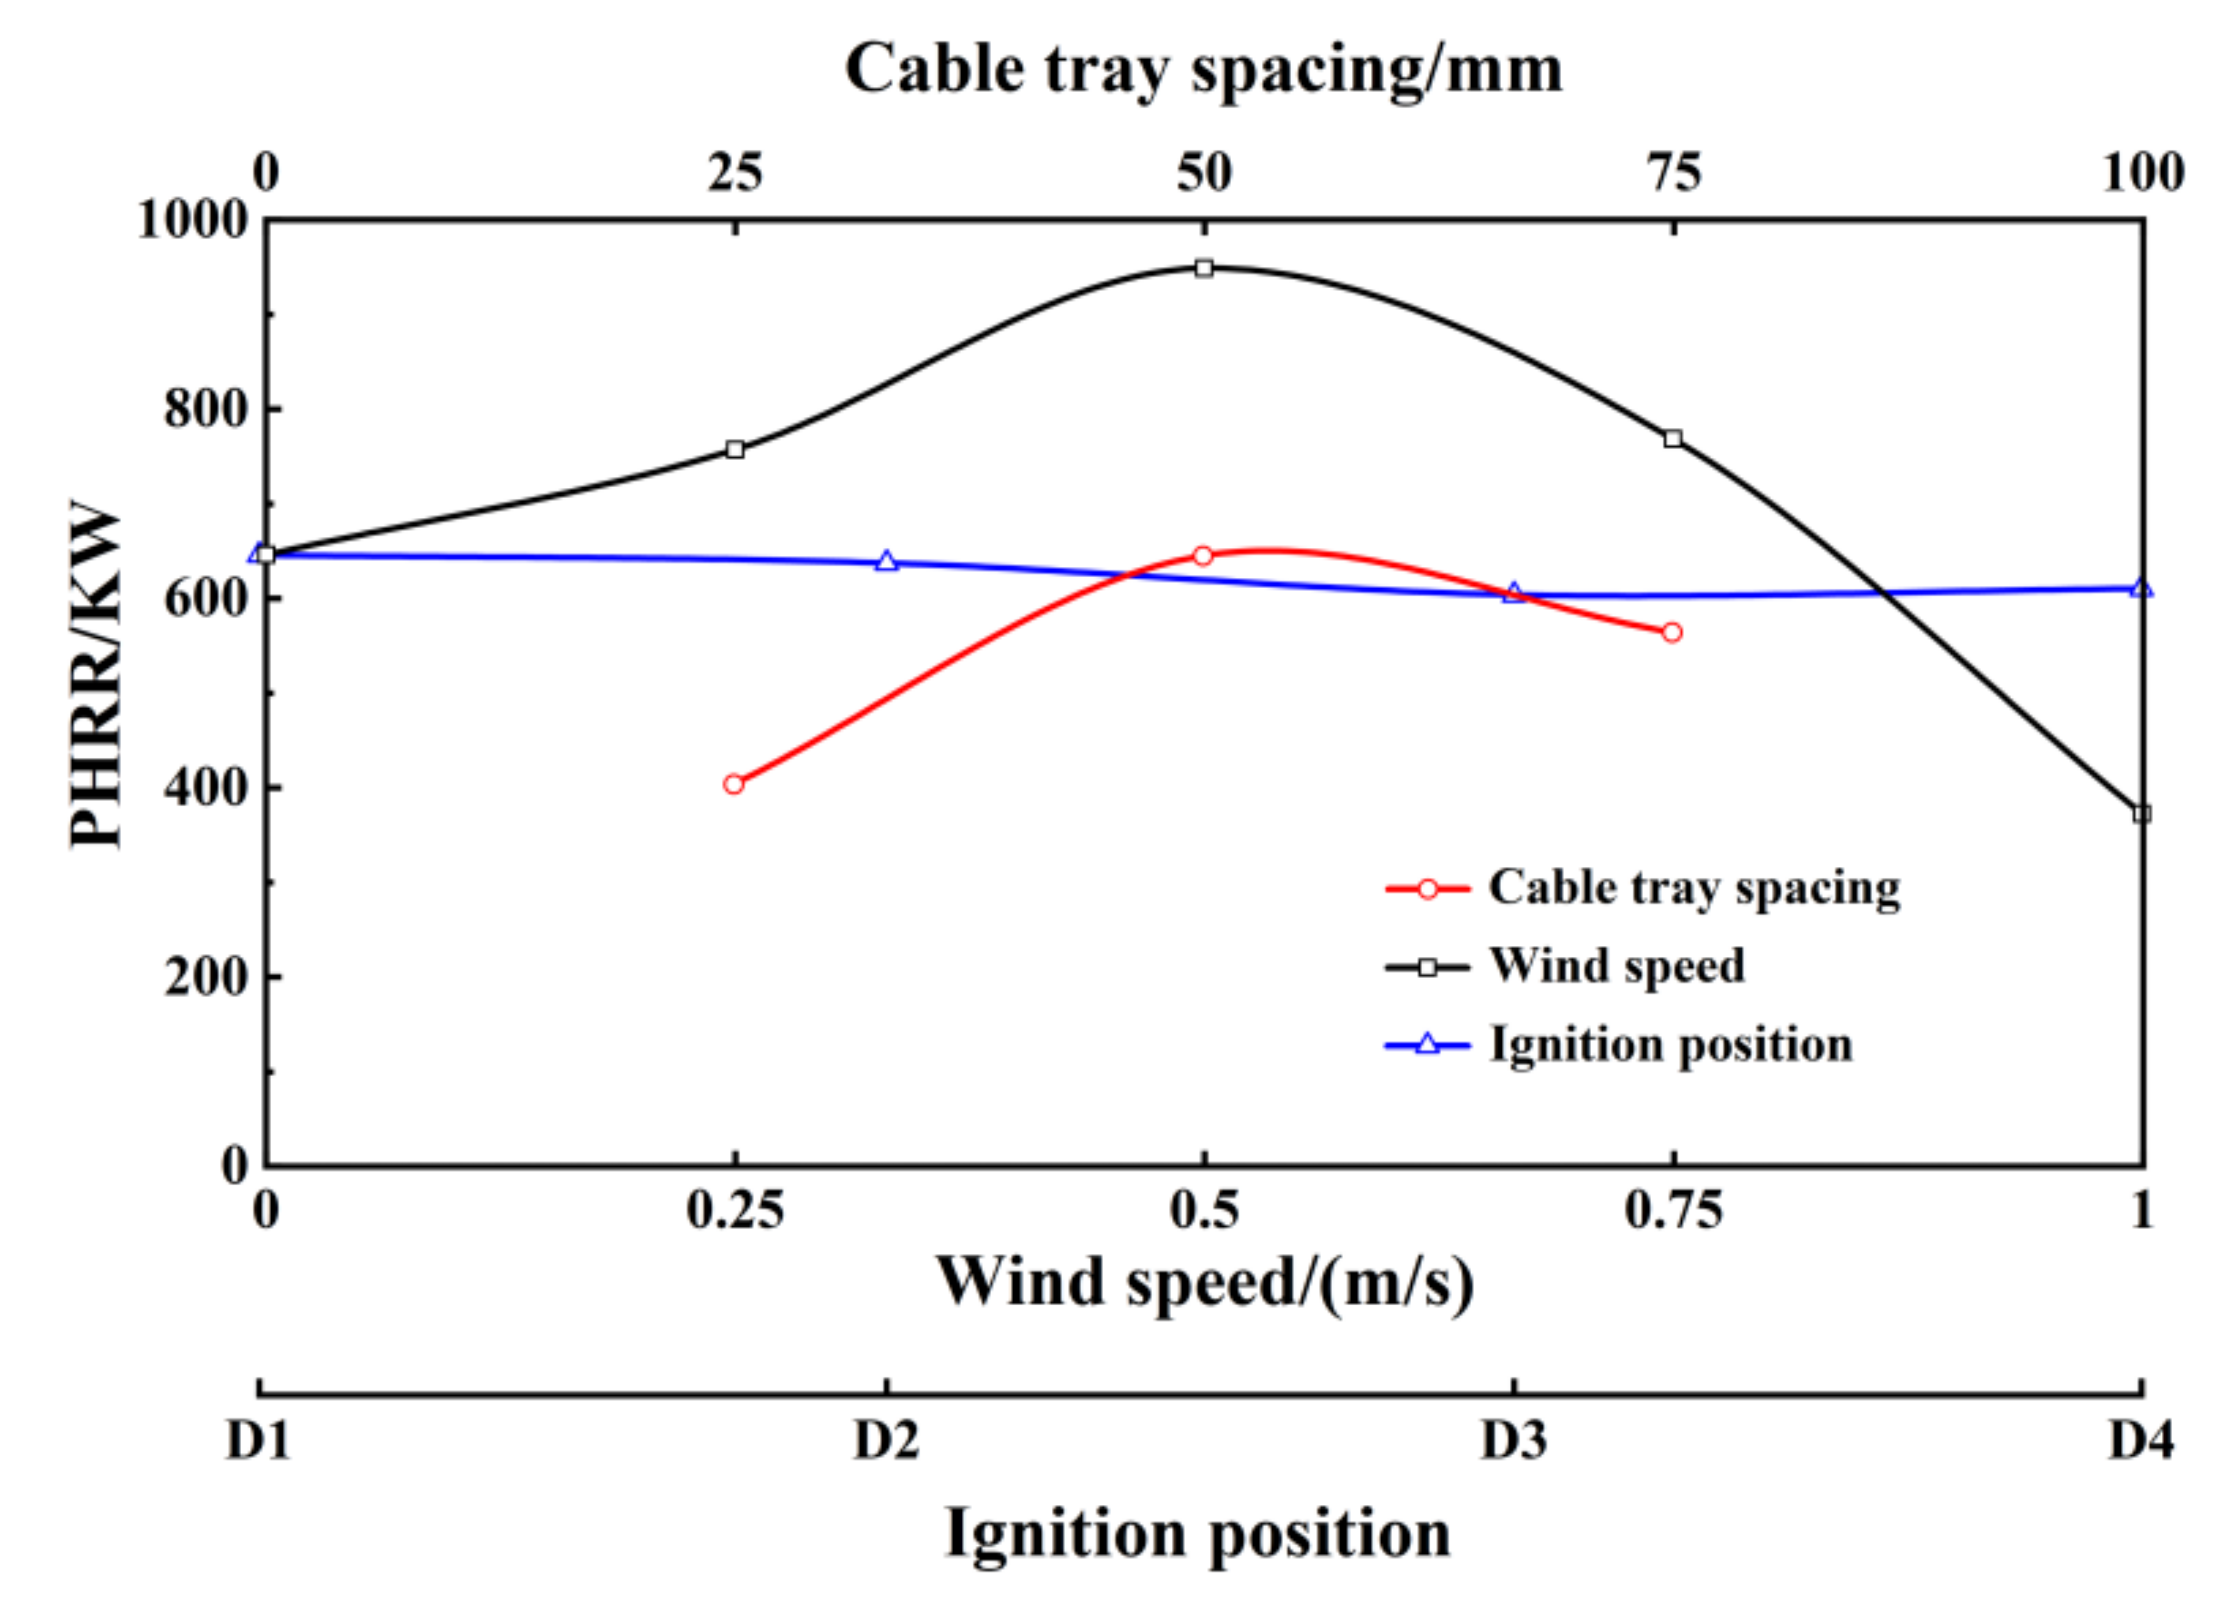
3.2. Heat Release Rate under Different Working Conditions

The heat release rate curve and PHRR under different conditions is shown in Figure 9 and Figure 10. Where the v represents wind speed, the d represents cable tray spacing, and the D1, D2, D3, and D4 represent the working conditions when the ignition position is under first cable tray to the fourth cable tray, respectively.
The curves show that the cable burning was not over at 2400 s at a cable tray spacing of 25 mm (Figure 9a). The PHRR was the lowest and occurred the latest. The PHRR at a 50 mm spacing was the largest, and its increasing trend was the steepest. The 75 mm spacing cable was the fastest to complete burning. However, the fire was extinguished before the first layer cable completely burned.
When the cable tray spacing increased from 25 mm to 50 mm, more heat was released, and the cables burned vigorously. The cable tray spacing continuously increased to 75 mm, the PHRR decreased, and the combustion yielded. Accordingly, the cable fire intensity first rose and then decreased with increasing spacing. Although the greater spacing can provide more oxygen contact, it also leads to reduced heat transfer between cables. The relationship between radiation intensity and distance is as follows [34]:
I = α 0 d m T 4 e μ d  
where m > −2. Therefore, as the distance between cables increases, the thermal radiation between cables decreases.
Meanwhile, the heat generated by cable combustion was mainly stored in the flame zone and plume zone. The hot smoke layer accumulated above the cable under the influence of thermal buoyancy and gravity. Hence, the fire spreading of the first layer cable could not be maintained when the spacing between the cables was very large. When the spacing was 50 mm, the heat release was highest, and the combustion was most intense.
The ignition position has little effect on the PHRR. The heat release rate curves in D1 and D2 coincide. As the ignition position moved up, the increase in the rate of heat release in D3 was lower than D1 and D2 at the initial stages of the fire, and D4 was more prominent. The ignition position of cables mainly affects the time of cable combustion initiation in the different layers. Table 5 shows the time of cable combustion initiation at different ignition positions. The cables above the ignition source take less time to ignite, while the cables below the ignition source take longer to ignite. As the ignition position moves up, the lower cables become farther from the ignition source, and the ignition time becomes longer. The first layer of cables was ignited at 702 s and 1080 s under the D3 and D4 conditions. When all the cable trays were ignited, the heat release rate curves under the four ignition positions were similar in shape, and the PHRRs were the same. The amount of heat released and the intensity of the burn were similar.
Positive pressure ventilation was applied on the left side of the tunnel. Based on Figure 9c, we see that the wind speed significantly influenced the heat release rate of the cable fire. The PHRR under the standard working conditions without ventilation was 550 kW. At wind speeds of 0.25 m/s, 0.50 m/s, 0.75 m/s, the PHRRs were 723 kW, 949 kW, and 769 kW, respectively. Compared with the standard working conditions, they burned more intensely, the peak value increases by 31%, 73%, and 40%, respectively, and the cable completed burning more quickly. When wind speed increased to 1.00 m/s, the growth rate of the heat release rate was very slow in the initial stages of the fire. The peak value was 330 kW, which was 39% lower than the standard condition, and the fire duration was also prolonged. Increasing wind speed will provide more oxygen supply and carry heat away from the cable combustion zone of the fire, causing more heat loss. This is mainly due to the airflow cooling effect. As a result, the flame speed slows down. According to Equation 9 of heat convection efficiency, With the increase of wind speed, more fresh air mixed with hot smoke. As Δ T decreased, the thermal convection efficiency between cables decreases. The heat release rate first increased and then decreased with increasing wind speed. The cable fire was promoted when wind speed was between 0.25 m/s and 0.75 m/s, and when the wind speed was 0.5 m/s, the promoting effect was most apparent, the heat release was highest, and the combustion was most intense. When the wind speed was 1.0 m/s, the cable fire was inhibited, and the heat release was the lowest.
Φ = α A T T w = T T w 1 / α A = Δ T R
where Φ is the convective heat transfer rate, rw (heat flow); A is the heat transfer area, m2; Δ T is the convective heat transfer temperature difference, °C/K; T w is the wall temperature in contact with fluid, °C; T is the average temperature of the fluid, °C; α is the convective heat transfer coefficient; R is the convective heat transfer thermal resistance, °C/W.

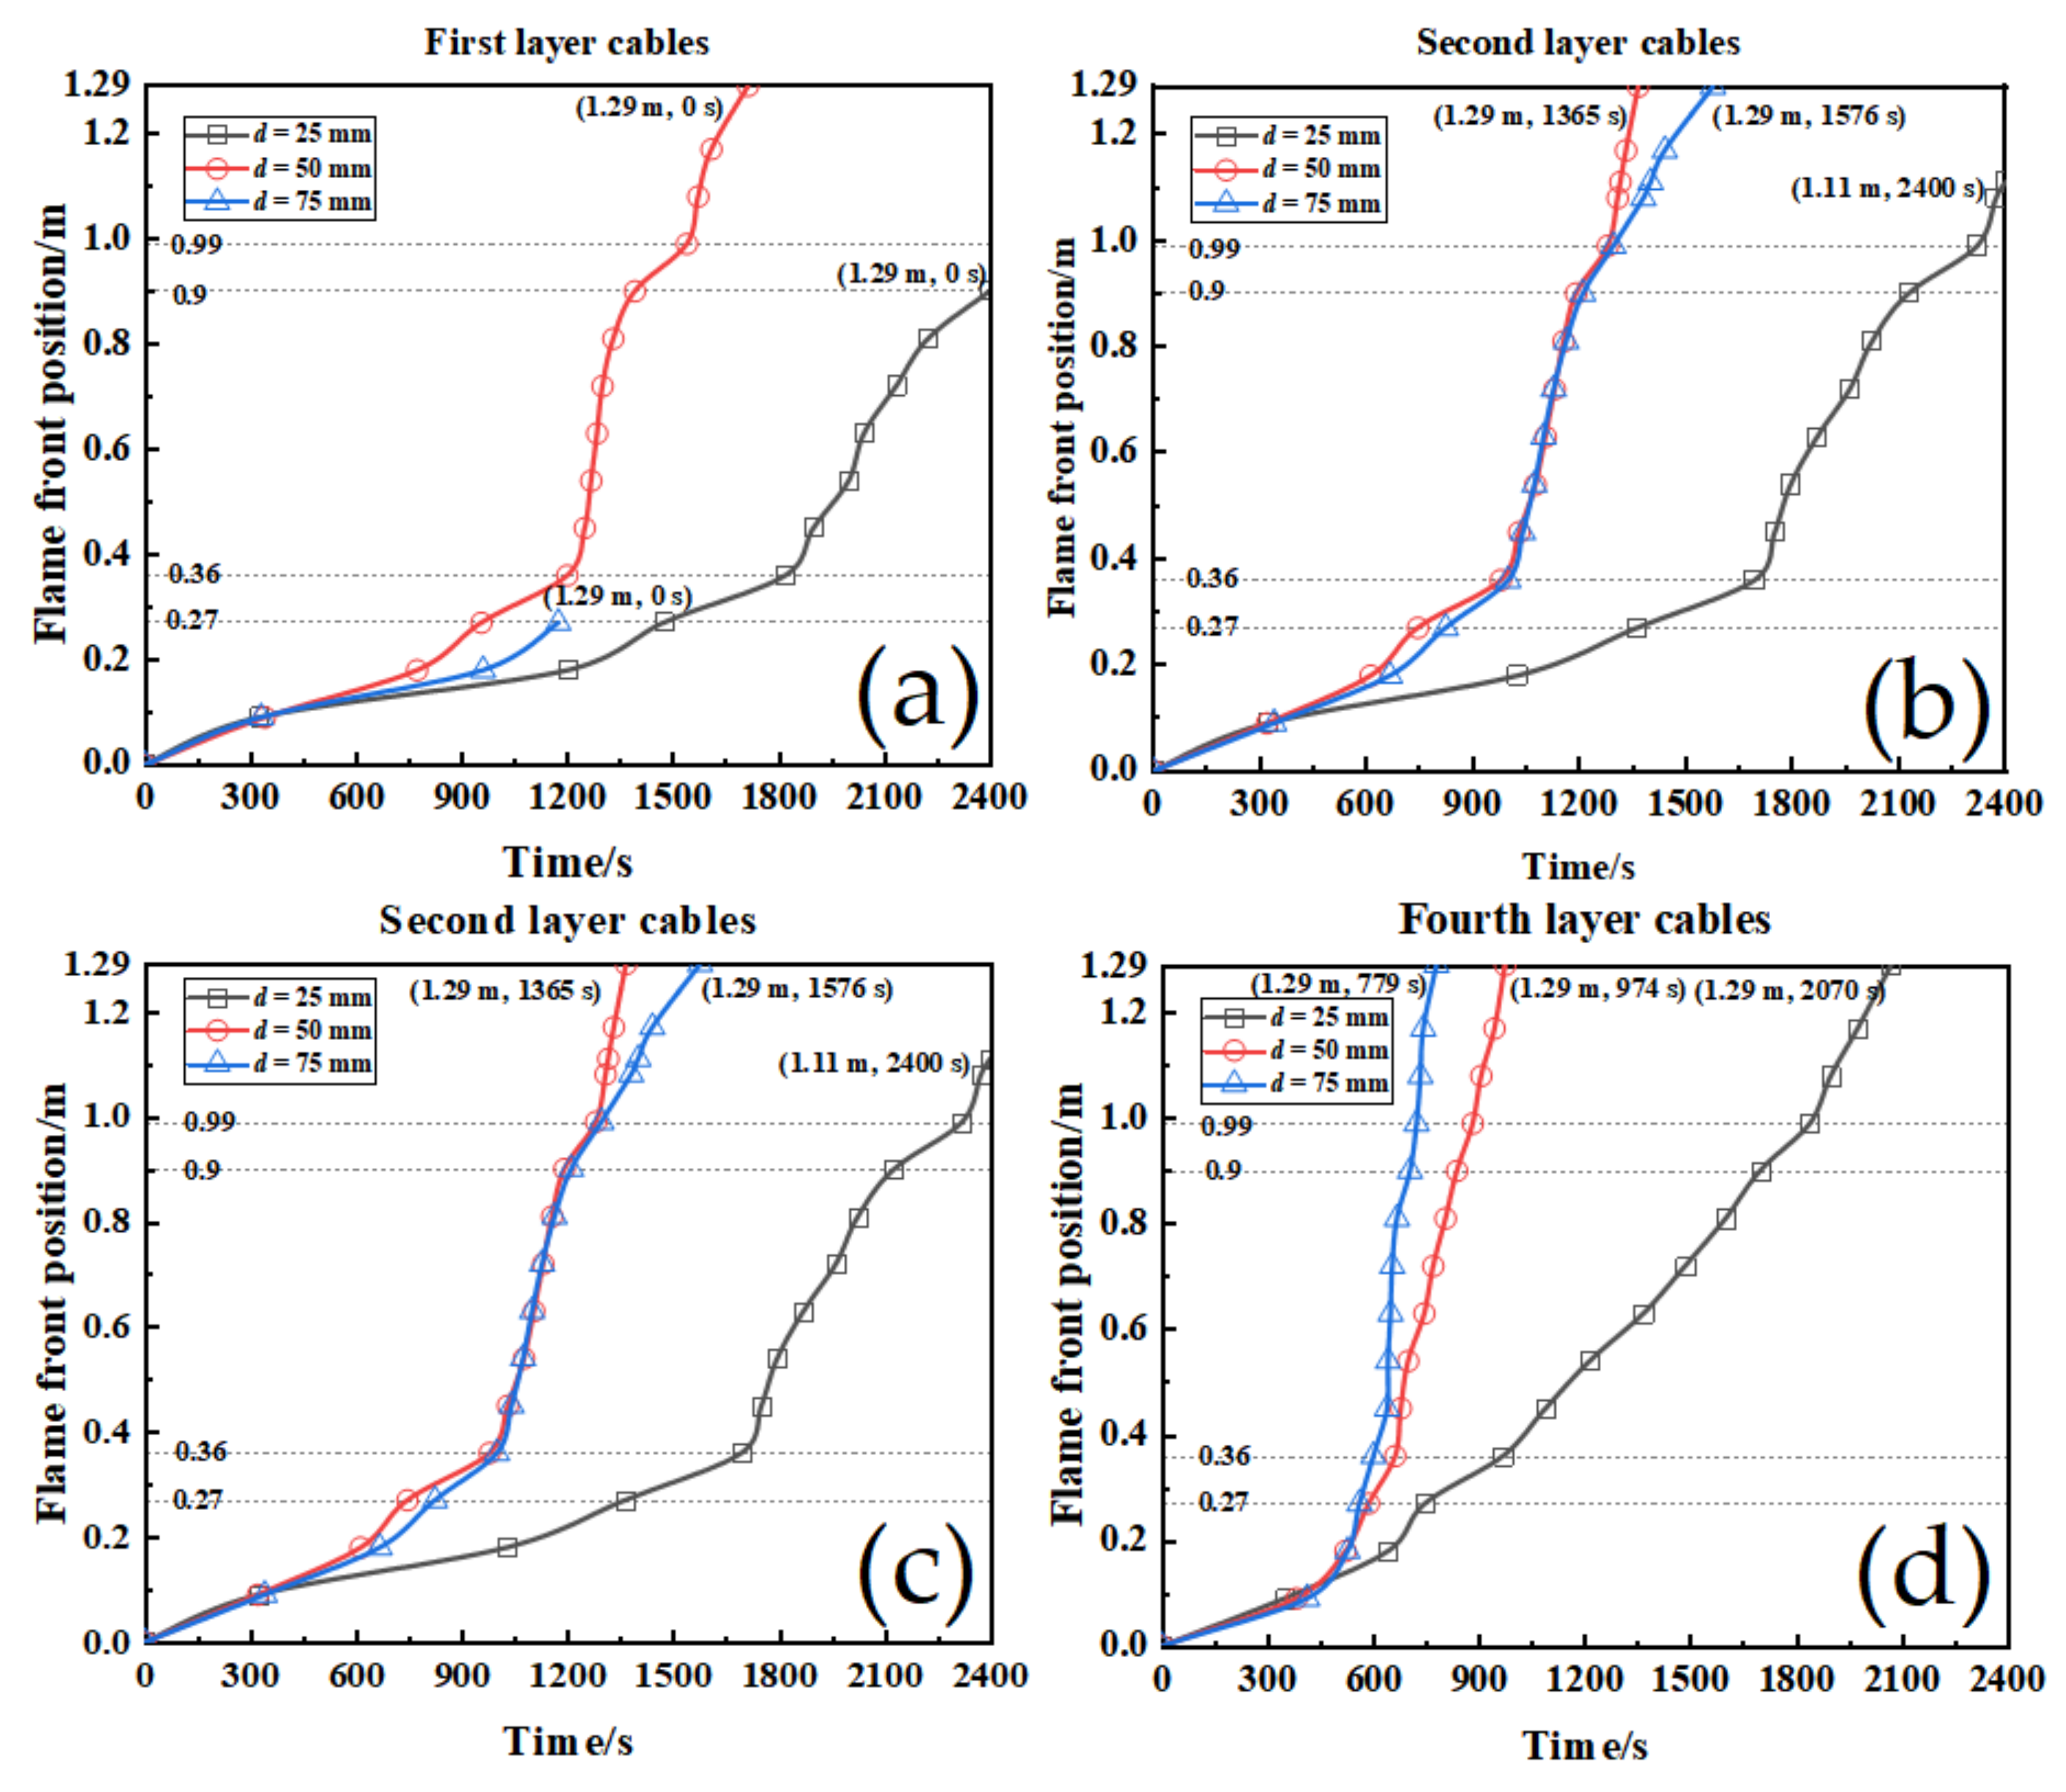
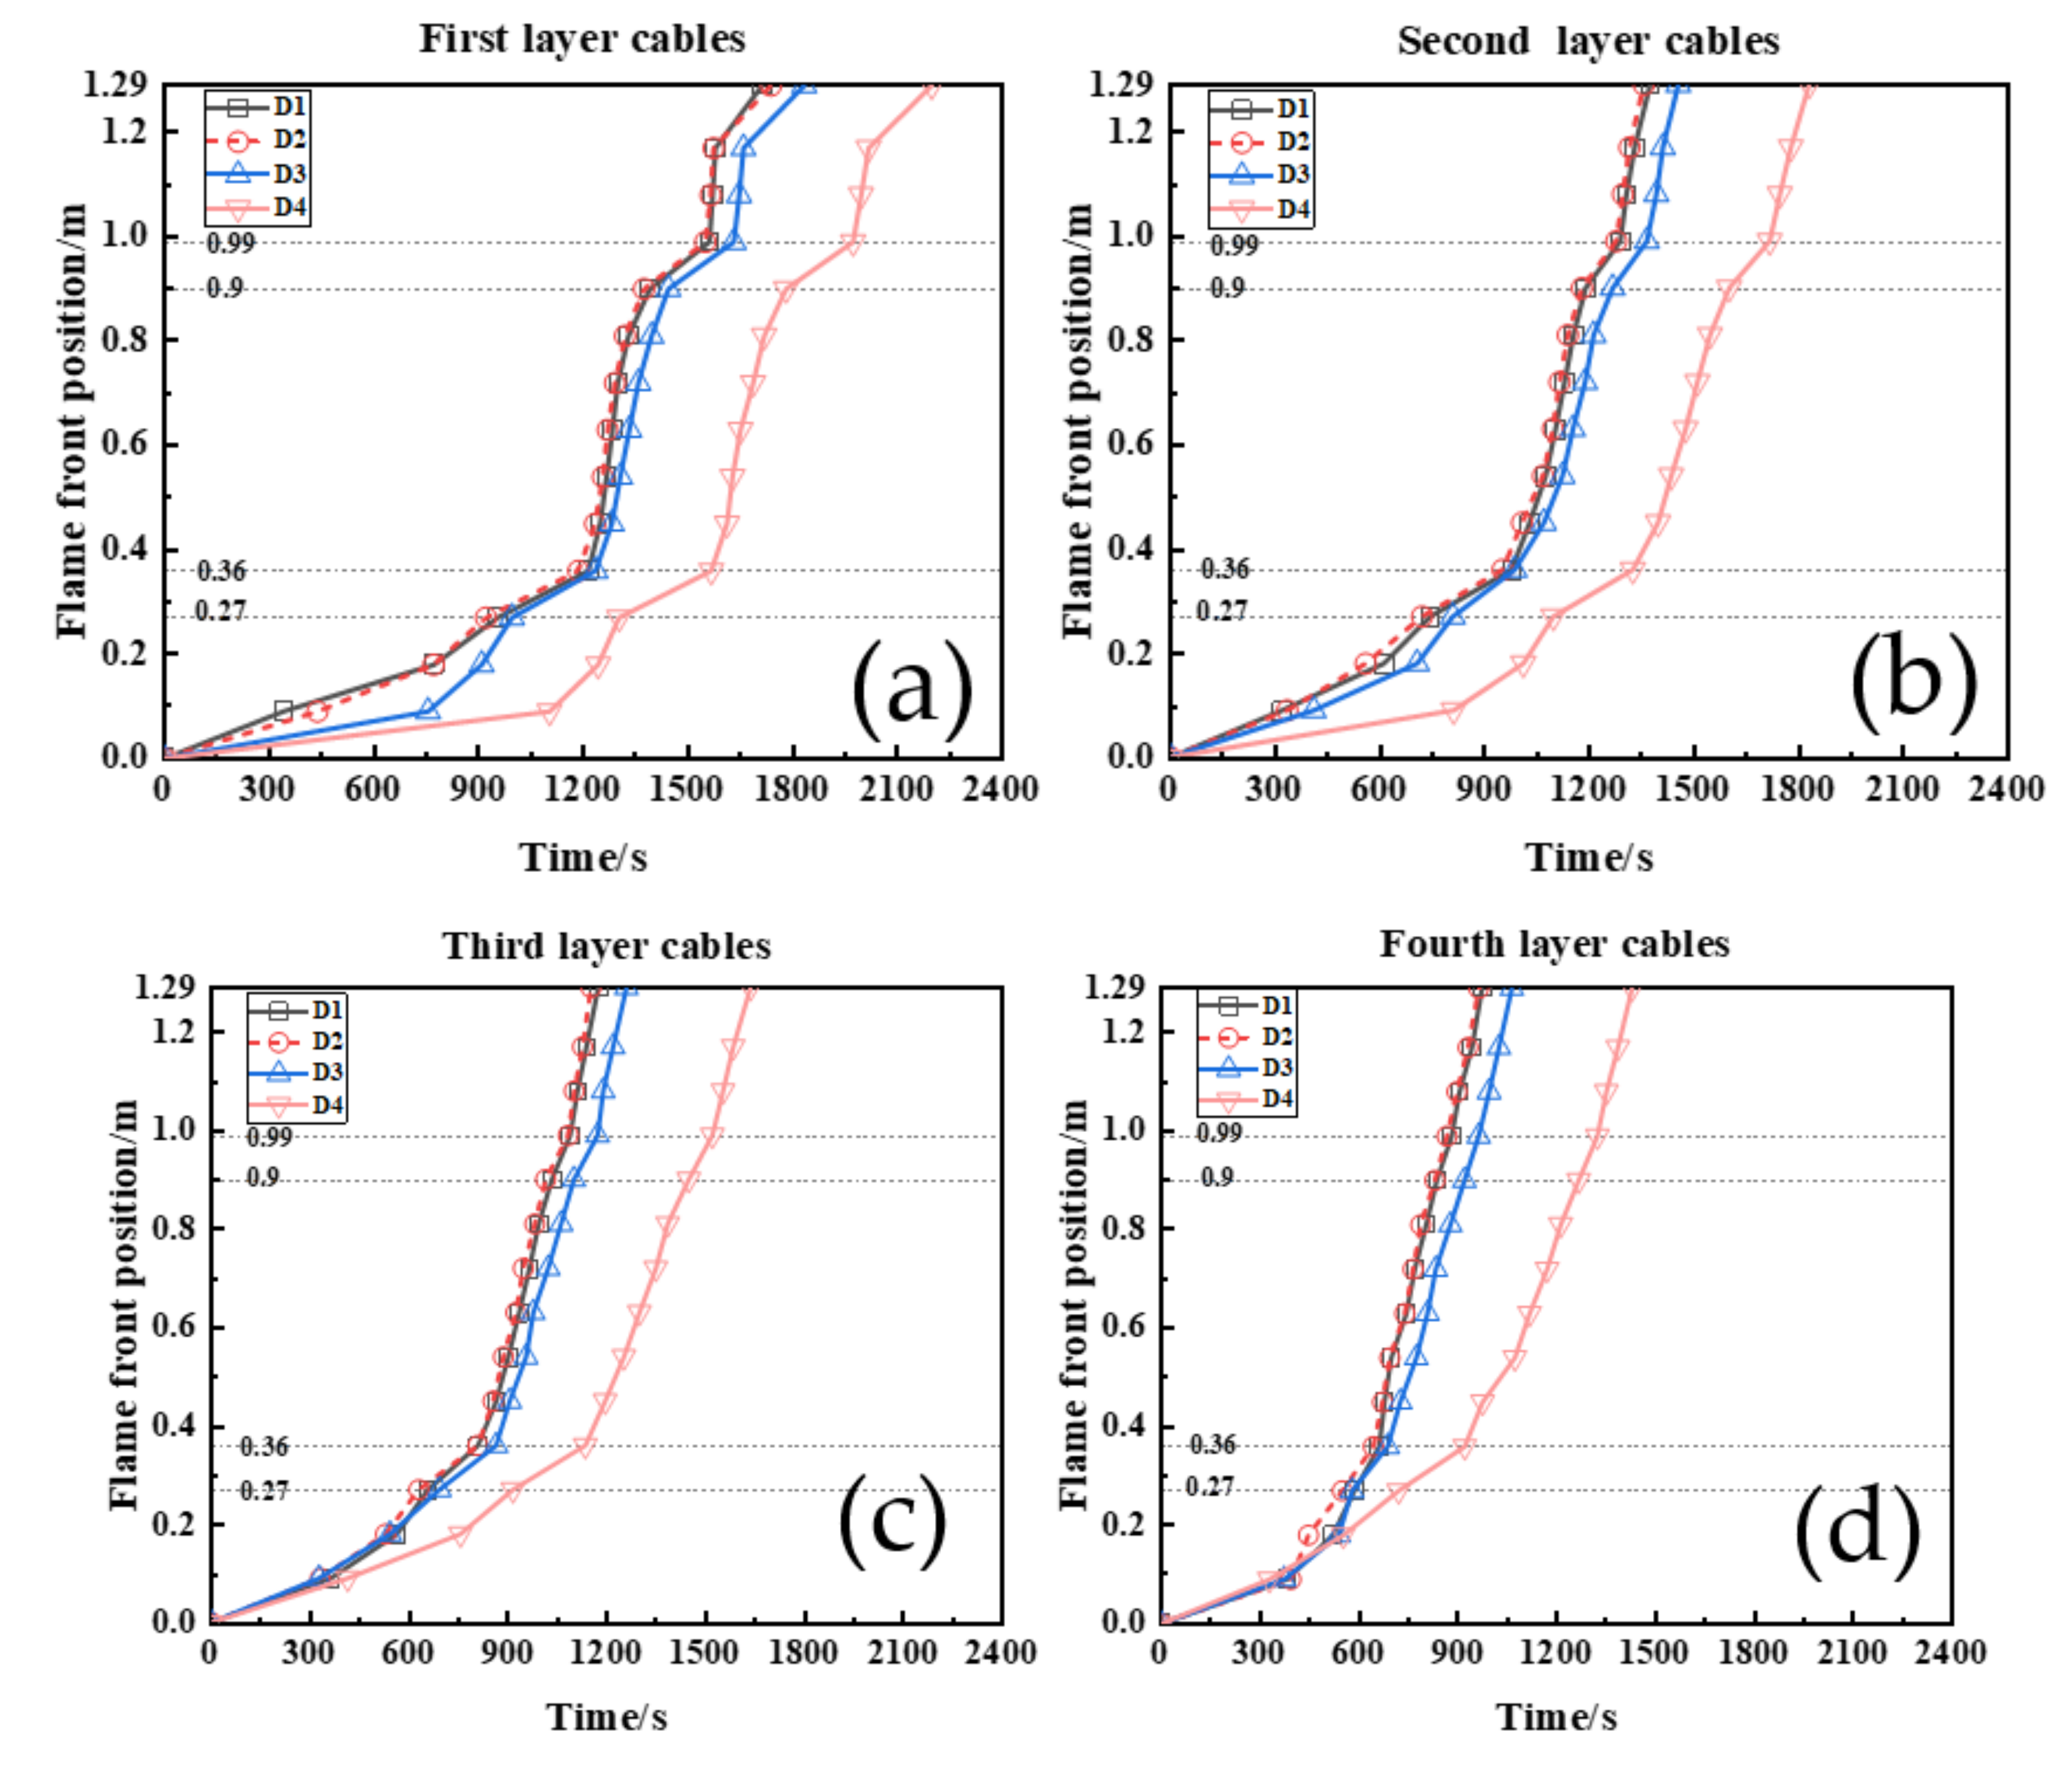
3.3. The Flame Spread Rate under Different Working Conditions

With the increasing length in the direction of the fire zone, the flame front movement per unit time is defined as the flame spread rate ( V s ). In order to analyze the rate of cable fire spread in detail, the cables were divided into 13 segments with 14 nodes. The length of the last segment is 0.09 m, and the length of the remaining segments is 0.12 m. The calculation formula is as follows:
V s = h / ( t i + 1 t i )
where V P is the flame propagation rate, m/s; h is the displacement distance of flame front surface, m; t i is the time for flame front reach to nodes “i” (i = 1, 2, …… 13, 14), s.
The fire conditions of the cable on the left and right sides of the ignition source were identical. The flame propagation to the left of the cables is shown in Figure 11 and Figure 12.
In Figure 11, as the flame front moved outward from the ignition source, the slope increased gradually, and the flame spread rate increased. When the fire burned to the ends of cables, the flame spread rate decreased. When the cable tray spacing increased, the flame spread rate of the first and second layer of cables increased and then decreased, while it continuously increased in the third and fourth layer of cables. When the cable tray spacing increased from 50 mm to 75 mm, the heat transfer caused by the combustion from the other cable trays decreased, the first layer of cables could not sustain the spread of the flame. As cable tray spacing increases, the spacing between the upper cables and the roof will be shorter, more cables will be directly heated by the flame. In Figure 13c, although the flame of fourth layer of cables were not burning to the end, we can see that the entire cables were in the flame zone and were directly heated by the flames. The propagation rate was significantly higher than those at 25 mm and 50 mm cable tray spacings (Figure 13).
The ignition position has a smaller effect on the flame spread rate compared with cable tray spacing. The overall flame shapes of D1 and D2 were similar. All four layers of the cables burned (Figure 14a,b). Both D3 and D4 did not ignite the first layer of cables, and D4 was significantly slower than D1, D2, and D3 in their flame spread rate (Figure 14c,d). In Figure 12, the positions of the D1 and D2 flame front essentially overlapped. As the ignition positions continued to rise, the flame spread rate decreased significantly at the initial stages of cable combustion. The lower the cable laying position was, the more significant the impact on the cables was. With the ignition position rising, the lower cables received less heat from the heater, so they took longer to ignite. The heat generated by cable combustion was mainly stored in the flame area, plume area, and hot smoke layer, which was accumulated above the cable because of thermal buoyancy and gravity. The lower layer cables also received less heat from heat transfer, so the flame spread at a lower rate in the front part of the lower layer of cables. When all four layers of cables were ignited, the influence of the ignition positions on the flame spread rate gradually decreased. With the development of the fire, we find that the flame spread rate of the middle and rear sections of cables at different ignition positions are the same by observing the slope.
Figure 11 and Figure 12 also show that the flame spread rate will decrease collectively when cables are extended to 0.27 m–0.36 m and 0.9 m–0.99 m because of the cable hooks that reduce air contact. The upper cables are close to the roof, and under the influence of the roof jet, the upper smoke flow temperature was higher. The upper cables can be easily ignited by accumulated heat transfer from the lower cables. Consequently, the upper cables are less affected than the lower cables. In addition, with the development of the fire, the effect of the hooks on the flame spread rate also gradually decreased.
When ventilation was added, the point of combustion initiation in each layer of the cables changed; it was offset towards the wind flow rather than remaining in the middle of the cable. The left side of the cable fire initiation point is defined as the upstream side of the cable fire source, while the right side of the cable fire initiation point is defined as the downstream side of the cable fire source. The time of cable combustion initiation under different wind speeds is shown in Table 6. Under the influence of wind flow, heat was not easy to accumulate in the early stages. Part of the heat will be carried out of the combustion zone by wind flow. When no ventilation is added, most of the heat propagated upwards because of buoyancy, and the time of cable combustion initiation was the shortest. With an increase in wind speed, the greater the heat loss in the airflow direction, the longer the time of cable combustion initiation will be.
Per unit time, the distance that the flame moves in the direction of the reduced fire zone is defined as the burnout rate ( V b ). The calculation formula is as follows:
V b = l / 2 + d ) / ( t e t s  
where V b is the burnout rate, m/s; l is the length of cable, m; d is the distance between the initial combustion position and the centre of the cable (The value is negative when the position is to the left of the centre, otherwise, it is positive), s; t e is the time for cable to start burning; t s is the time for cable burnout, s.
The cable burnout rate in the upstream and downstream sides of a fire source at different wind speeds is shown in Figure 15. The cable burnout rate of the upstream and downstream sides of a fire source in each layer speeds are the same under natural ventilation, and the higher cables burn out faster. When forced ventilation was added, the upstream side of the cable was greatly affected by wind speed. When the wind speed was less than 0.50 m/s, the cable burnout speed increased noticeably with an increase in wind speed. In addition, the upstream cable’s burnout rate was greater than the downstream cable’s burnout rate. Because the direction of expansion of the roof jet was opposite to the longitudinal wind upstream of the fire source, and the interaction between them mainly consisted of the shear force of the reverse flow, the shear force of the reverse flow acts as a heat collecting barrier [35], causing the energy of the smoke flow to accumulate under the roof and making the temperature of the upstream side higher than that of the downstream side. As there was a vertical wall under the roof, heat will also accumulate in the vertical wall.
Upstream and downstream of the fire source, the temperature curve for different wind speeds is shown in Figure 16. Which shows that the temperature upstream of the fire source was significantly higher than that downstream of the fire source. Thus, the cables burn more vigorously and burn out faster upstream of the fire source. When the wind speed exceeds 0.50 m/s, the burnout speed of upstream cables declines sharply. Since the increased wind speed brings more oxygen supply, more heat and hot gases from the fire are carried out of the combustion zone by wind currents. The wind reduces heat accumulation and inhibits cable fire expansion. The downstream cables are affected less by wind speed. When the wind speed was 0.25 m/s, the downstream cable burnout rate increased slightly. When wind speed increased to 0.50 m/s, the upstream cables burned vigorously, consuming much of the oxygen in the air. The flue gas generated was blown downstream of the fire source, inhibiting the combustion of downstream cables. In summary, increasing ventilation will generate heat collecting obstacles on the upstream side of a fire source, accelerating the burning speed of the upstream cables. In addition, the burning rate of downstream cable also increases slightly. The burning rate of the overall cable was the fastest when wind speed was 0.50 m/s.

4. Conclusions

A numerical model of a PVC cable fire in a mine tunnel was established. The influences of cable tray spacing, ignition position of the cable, and wind speed on cable fire behavior were studied by analyzing heat release and combustion rates. The following conclusions were drawn:
(1)
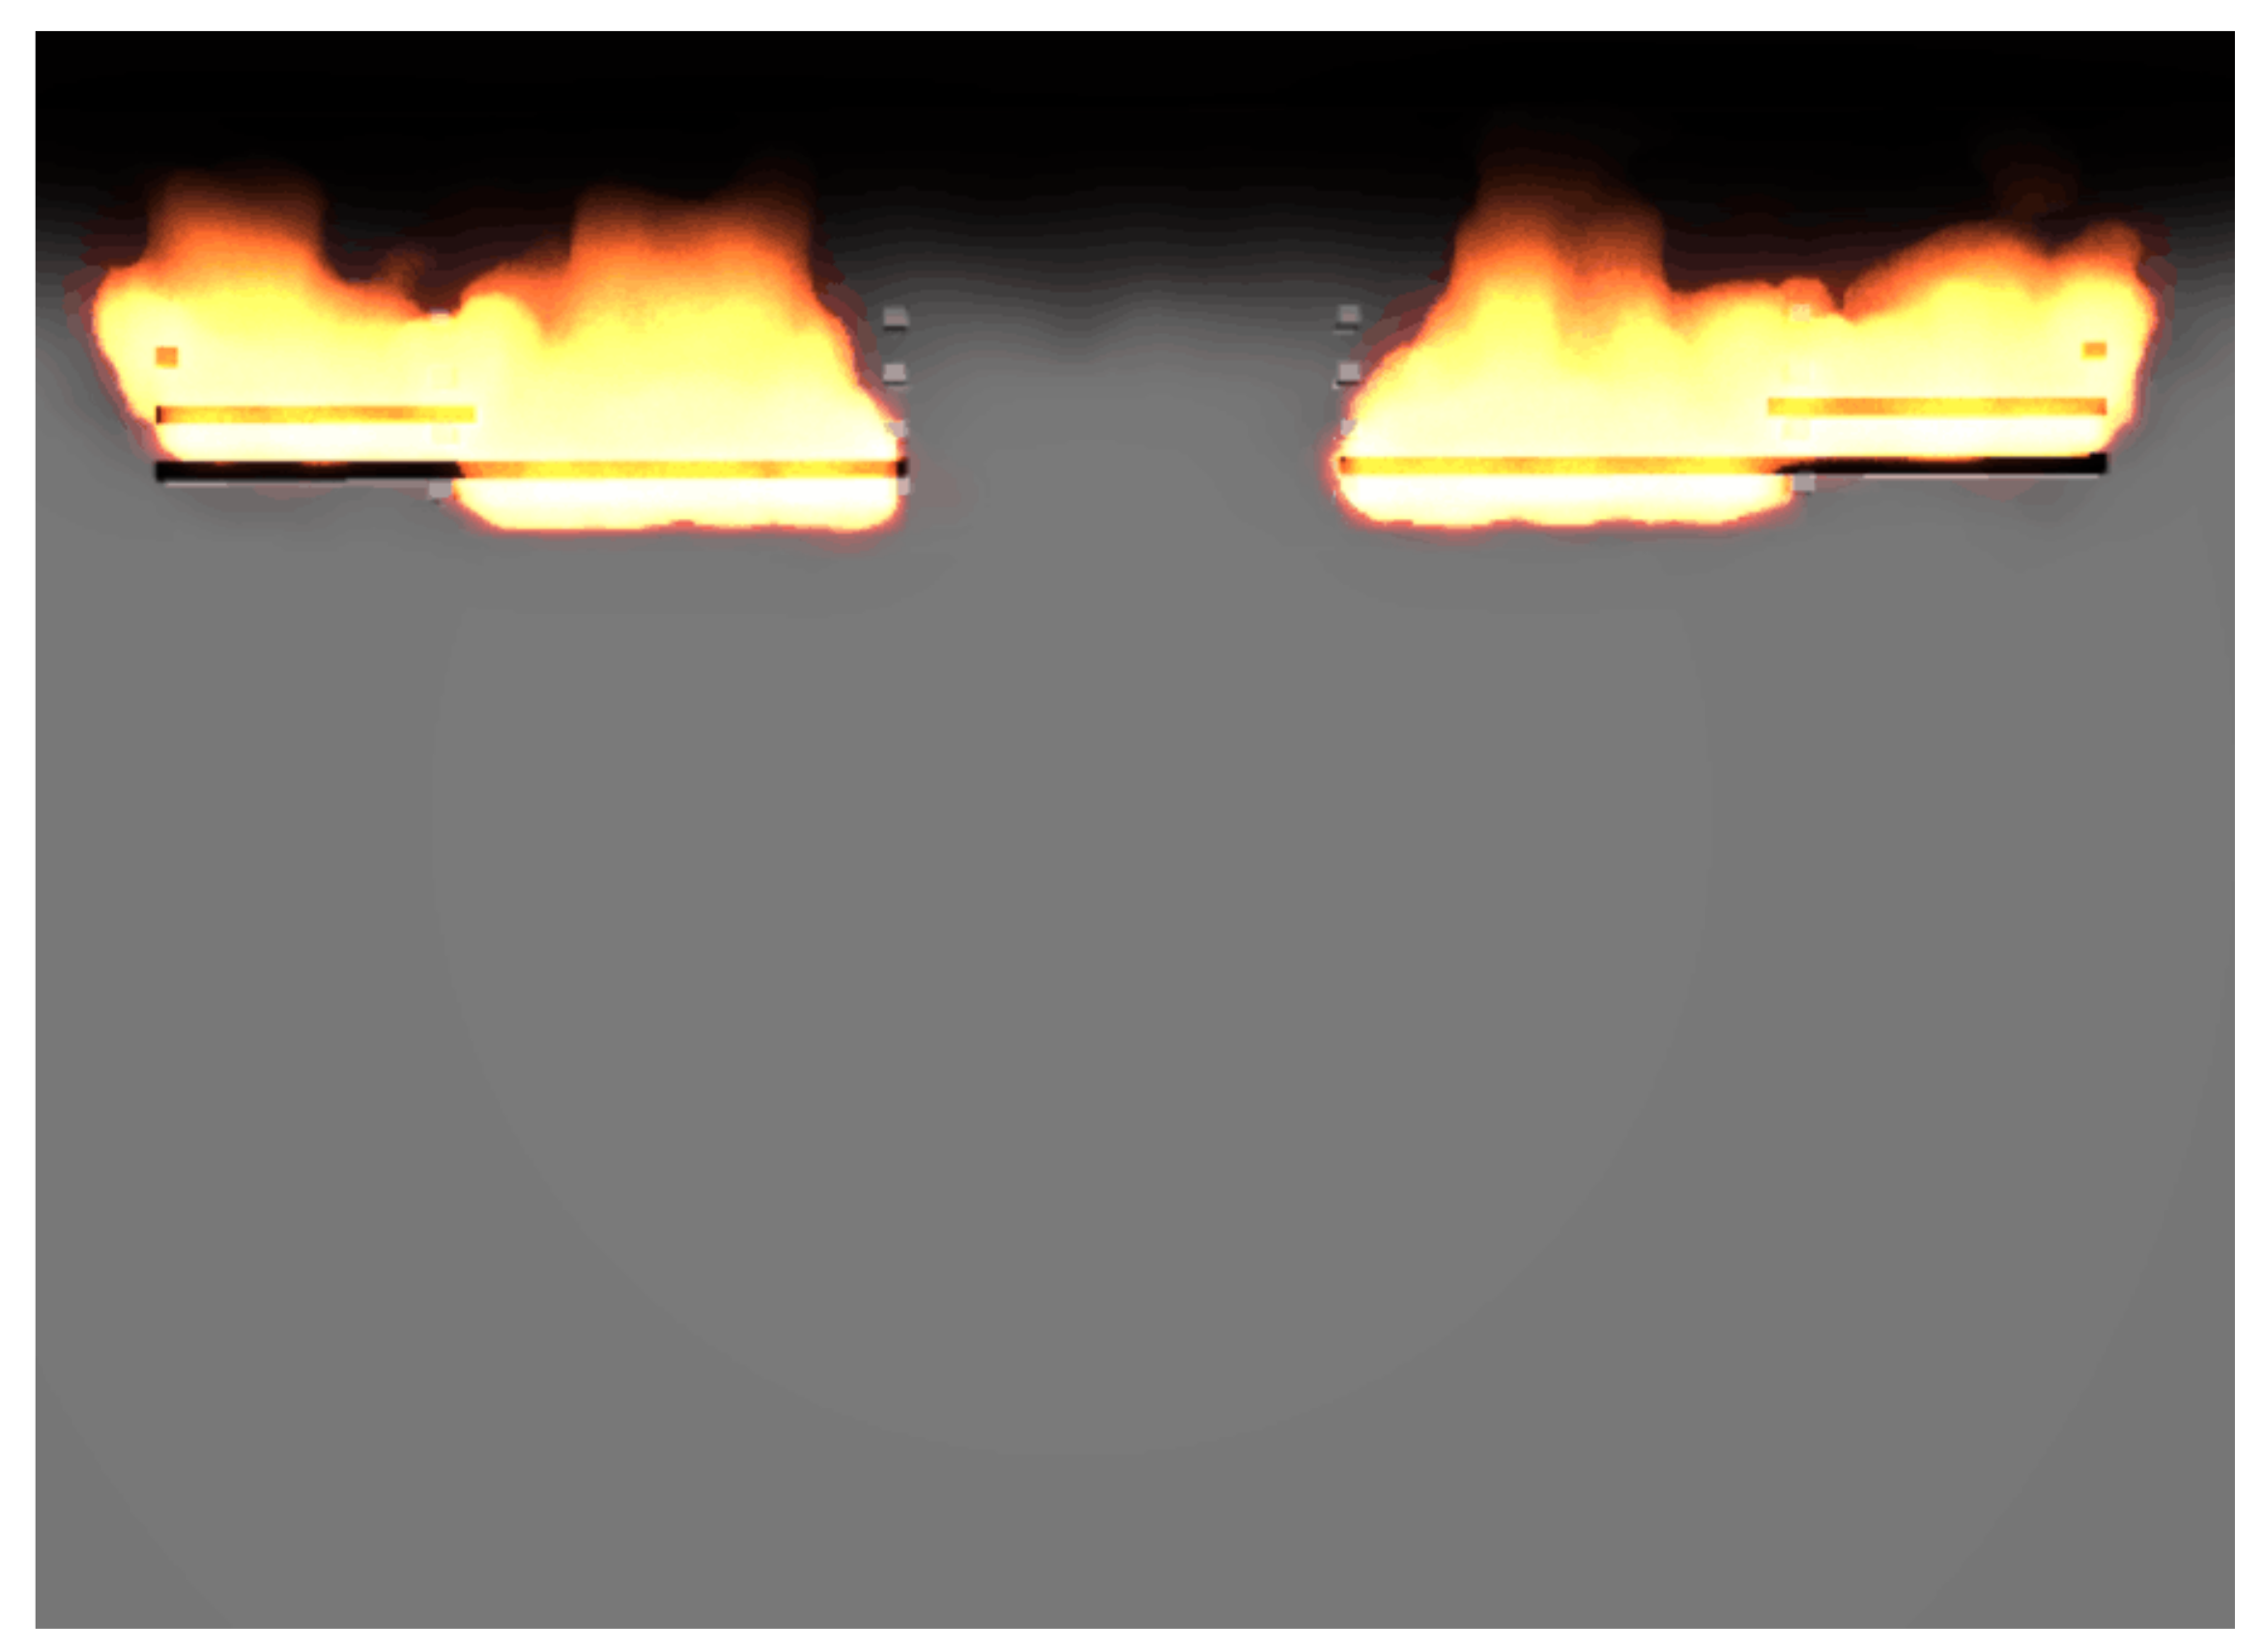
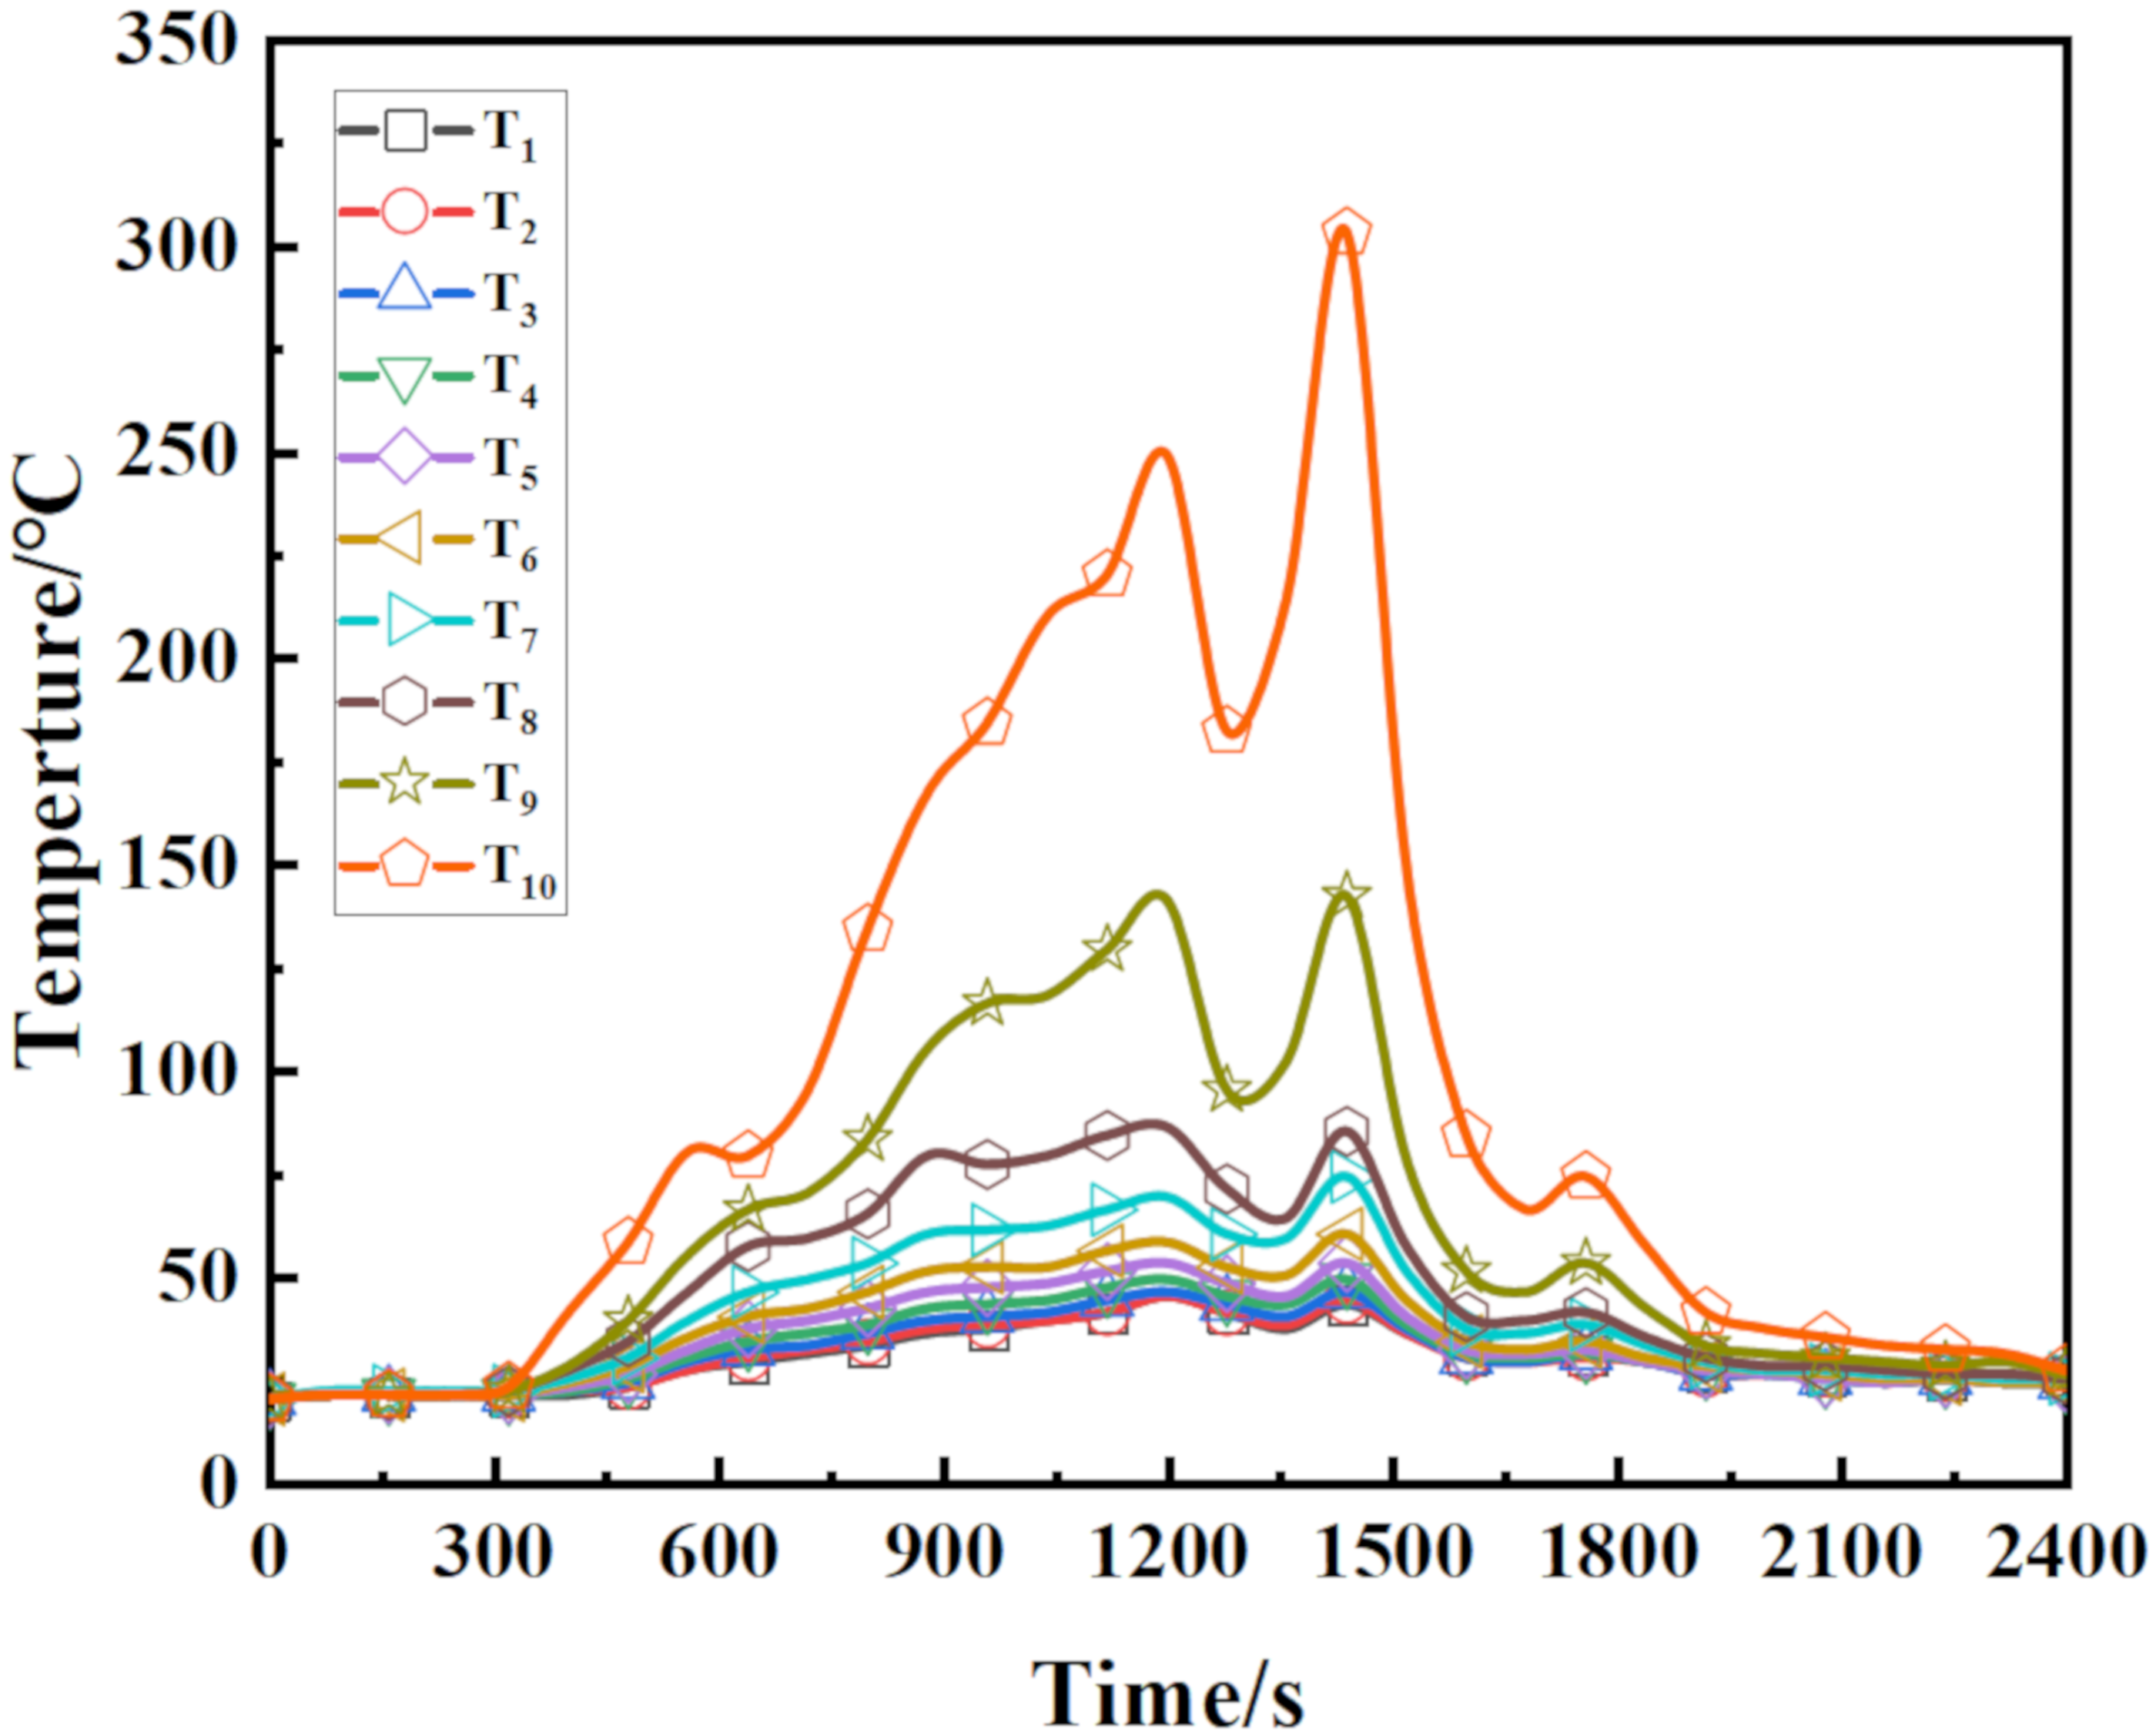
For multilayer cables, cable flames and hot flue gases spread upward under the influence of thermal buoyancy and form a roof jet, leading to a higher temperature closer to the roof. In addition, the burning rate of the upper cables is faster than that of the lower cables, and the fire zone forms a “V” shape. The closer the cables were to the ceiling, the faster the cables burned. Therefore, cables should not be laid too close to the ceiling.
(2)
Cable hooks have a noticeable inhibition effect on cable combustion, the hooks hinder air entry. It slows down the rate of spread of the fire when the cable burns to the iron hook. The impact on the upper layer cables is lower than that on the lower layer cables. As the fire develops, this impact gradually diminishes.
(3)
Cable tray spacing, ignition position, and wind speed influence the behavior of a multilayer cable fire. These factors change the heat transfer between the cables, the amount of contact with air, and heat accumulation. It was also noted that increasing the spacing or wind speed both made the peak of heat release rate (PHRR) initially increase and then decrease, and affected the combustion of cables initially promoting and then inhibiting. The influence of wind speed on the cable burnout rate in the upstream and downstream sides of fire source was not consistent, and the wind speed had a sensitive effect on the cable burnout rate in the upstream side of the fire source. The ignition position affected the development speed of the cable fire. The higher the ignition position was, the longer the arrival time of PHRR was and the slower the fire developed. Combined with the above factors, when the cable tray spacing is 25 mm, the ignition position is below the fourth layer of cables, the wind speed is 1 m/s, the cable combustion rate is the slowest, the heat release is the smallest, and the fire hazard is the lowest.

Author Contributions

Conceptualization, K.G. and Z.T.; methodology, Z.T. and Z.L. (Zeyi Liu); software, Z.T. and Z.L. (Zimeng Liu); validation, K.G. and Z.T.; formal analysis, Z.T.; investigation, Z.T.; resources, K.G. and Z.T.; data curation, Z.T. and C.Z.; writing—original draft preparation, Z.T.; writing—review and editing, K.G. and Z.T.; visualization, Z.T.; supervision, K.G. and Y.S.; project administration, K.G. and Y.S.; funding acquisition, K.G. All authors have read and agreed to the published version of the manuscript.

Funding

This research was funded by the National Natural Science Foundation of China (grant number 52074148 and 52104194) and Scientific Research Fund of Liaoning Provincial Education Department (grant number LJKZ0341).

Conflicts of Interest

The authors declare no conflict of interest.

References

  1. Gao, K.; Li, S.; Su, B.; Liu, Y.; Wang, X.; Shi, L. Hole/pore-scale investigation of gas explosions in a coal-mine gob. Process Saf. Environ. Prot. 2021, 156, 531–544. [Google Scholar] [CrossRef]
  2. Kaczorekchrobak, K.; Fangrat, J. Calorimetric Behaviour of Electric Cables. Energies 2021, 14, 1007. [Google Scholar] [CrossRef]
  3. Perka, B.; Piwowarski, K. A Method for Determining the Impact of Ambient Temperature on an Electrical Cable during a Fire. Energies 2021, 14, 7260. [Google Scholar] [CrossRef]
  4. Li, C.; Chen, J.; Zhang, W. Influence of Arc Size on the Ignition and Flame Propagation of Cable Fire. Energies 2021, 14, 5675. [Google Scholar] [CrossRef]
  5. Wu, Y.J.; Yuan, Q.G.; Song, Z.S. Analysis on Power Cable Firing Accident Cause and Prevention Measures in Underground Mine. Chin. Coal Eng. 2010, 12, 53–54. [Google Scholar]
  6. Chen, J. Reflection on Mine Electric Cable Fire Accident. Chin. Saf. Coal Mines 2011, 42, 133–134. [Google Scholar]
  7. Klein, R.A. SFPE handbook of fire protection engineering. Fire Saf. J. 1997, 29, 61–63. [Google Scholar] [CrossRef]
  8. Tewarson, A.; Khan, M. Fire Propagation Behavior of Electrical Cables. Fire Saf. Sci. 1989, 2, 791–800. [Google Scholar] [CrossRef] [Green Version]
  9. Tewarson, A.; Khan, M. Flame propagation for polymers in cylindrical configuration and vertical orientation. Symp. Combust. 1989, 22, 1231–1240. [Google Scholar] [CrossRef]
  10. Nuianzin, O.; Pozdieiev, S.; Hora, V.; Shvydenko, A.; Samchenko, T. Experimental study of temperature mode of a fire in a cable tunnel. Eastern-Eur. J. Enterp. Technol. 2018, 3, 21–27. [Google Scholar] [CrossRef]
  11. Wang, W.; Li, L.M.; Wan, Y.T. Full scale flame spread test on bundled PVC cables. Chin. Fire Sci. Technol. 2009, 28, 473–478. [Google Scholar]
  12. Liang, K.; Hao, X.; An, W.G.; Tang, Y.; Cong, Y. Study on cable fire spread and smoke temperature distribution in T-shaped utility tunnel. Case Stud. Therm. Eng. 2019, 14, 100433. [Google Scholar] [CrossRef]
  13. An, W.G.; Tang, Y.H.; Liang, K.; Cai, M.; Wang, T.; Wang, Z. Study on temperature distribution and CO diffusion induced by cable fire in L-shaped utility tunnel. Sustain. Cities Soc. 2020, 62, 102407. [Google Scholar] [CrossRef]
  14. An, W.G.; Wang, X.S.; Tang, Y.H.; Wang, T.; Lu, J. Influence of cable inclination angle and longitudinal ventilation on temperature distribution during cable fire in utility tunnel. Case Stud. Therm. Eng. 2021, 27, 101304. [Google Scholar] [CrossRef]
  15. Plumecocq, W.; Audouin, L.; Zavaleta, P. Horizontal cable tray fire in a well-confined and mechanically ventilated enclosure using a two-zone model. Fire Mater. 2019, 43, 530–542. [Google Scholar] [CrossRef]
  16. Magalie, C.; Anne-Sophie, C.; Rodolphe, S.; Laurent, F.; Emmanuelle, G.; Christian, L. Fire behaviour of electrical cables in cone calorimeter: Influence of cables structure and layout. Fire Saf. J. 2018, 99, 12–21. [Google Scholar] [CrossRef]
  17. Effects of interlayer distance and cable spacing on flame characteristics and fire hazard of multilayer cables in utility tunnel—Sciencedirect. Case Stud. Therm. Eng. 2020, 22, 100784. [CrossRef]
  18. Li, L.; Huang, X.; Bi, K.; Liu, X. An enhanced fire hazard assessment model and validation experiments for vertical cable trays. Nucl. Eng. Des. 2016, 301, 32–38. [Google Scholar] [CrossRef]
  19. Luo, X.; Huang, X.J.; Kun, B.I.; Liu, X.S.; Jiang, X. On the vertical cable tray combustion in regard to the different cable allocation in the open and wrapped-up space. J. Saf. Environ. 2017, 17, 975–979. [Google Scholar]
  20. Wu, T.Q.; Huang, X.J.; Kun, B.I.; Liu, X.S.; Jiang, X. Experimental and numerically simulated study on the fires in the horizontally arranged multilayer cable trays. J. Saf. Environ. 2016, 16, 69–74. [Google Scholar]
  21. Hu, L.; Fong, N.; Yang, L.; Chow, W.; Li, Y.; Huo, R. Modeling fire-induced smoke spread and carbon monoxide transportation in a long channel: Fire dynamics simulator comparisons with measured data. Hazard. Mater. 2007, 140, 293–298. [Google Scholar] [CrossRef] [PubMed]
  22. Hu, L.; Huo, R.; Wang, H.; Yang, R. Experimental and numerical studies on longitudinal smoke temperature distribution upstream and downstream from the fire in a road tunnel. Fire Sci. 2007, 25, 23–43. [Google Scholar] [CrossRef]
  23. Hu, L.; Tang, F.; Yang, D.; Liu, S.; Huo, R. Longitudinal distributions of CO concentration and difference with temperature field in a tunnel fire smoke flow. Int. Heat Mass Tran. 2010, 53, 2844–2855. [Google Scholar] [CrossRef]
  24. Chen, L.; Hu, L.; Tang, W.; Yi, L. Studies on buoyancy driven two-directional smoke flow layering length with combination of point extraction and longitudinal ventilation in tunnel fires. Fire Saf. J. 2013, 59, 94–101. [Google Scholar] [CrossRef]
  25. Chen, X. Simulation of temperature and smoke distribution of a tunnel fire based on modifications of multi-layer zone model. Tunn. Undergr. Space Technol. 2008, 23, 75–79. [Google Scholar]
  26. Wang, Z.; Wang, J. A comprehensive study on the flame propagation of the horizontal laboratory wires and flame-retardant cables at different thermal circumstances. Process Saf. Environ. Prot. 2020, 139, 325–333. [Google Scholar] [CrossRef]
  27. McGrattan, K.; Hostikka, S.; Floyd, J.; Baum, H.; Rehm, R.; Mell, W.; McDermott, R. Fire Dynamics Simulator Technical Reference Guide (Version 5); Natlional Institute of Standards and Technology: Washington, DC, USA, 2010. [Google Scholar]
  28. Ke, G.; Zimeng, L.; Jinzhang, J.; Zeyi, L.; Shengnan, L. Study on Flame Spread Characteristics of Flame-Retardant Cables in Mine. Adv. Polym. Technol. 2020, 10, 1–7. [Google Scholar] [CrossRef] [Green Version]
  29. Stein, A.B.; Sparrow, E.M.; Gorman, J.M. Numerical simulation of cables in widespread use in the nuclear power industry subjected to fire. Fire Saf. J. 2012, 53, 28–34. [Google Scholar] [CrossRef]
  30. Gong, T.; Xie, Q.; Huang, X. Fire behaviors of flame-retardant cables part I: Decomposition, swelling and spontaneous ignition. Fire Saf. J. 2018, 95, 113–121. [Google Scholar] [CrossRef]
  31. Zhong, W.; Ma, W.H.; Sun, C.P.; Gao, Z.H.; Zhao, J. Numerical simulation on ignition process of 110 kV high-voltage cable. Chin. Fire Sci. Technol. 2021, 40, 8. [Google Scholar]
  32. Mcgrattan, K.; Lock, A.; Marsh, N.; Nyden, M.; Bareham, S.; Price, M. Cable Heat Release, Ignition, and Spread in Tray Installations During Fire (CHRISTIFIRE). Phase 1: Horizontal Trays; United States Nuclear Regulatory Commission: Rockville, MD, USA, 2012; pp. 112–166. [Google Scholar]
  33. Babrauskas, V. Ignition of Wood: A Review of the State of the Art. J. Fire Prot. Eng. 2002, 12, 163–189. [Google Scholar] [CrossRef] [Green Version]
  34. Yang, D.X.; Liu, A.P.; Qi, O.U.; Yang, J.J.; Zhang, X.M.; Guang hong, H.E.; Han, Z. Relationship between thermal radiation intensity and distance based on difference method. Phys. Experiment. 2019, 39, 13–17. [Google Scholar]
  35. Hu, L.H.; Huo, R.; Li, Y.Z.; Wang, H.B.; Chow, W.K. Full-Scale burning tests on studying smoke temperature and velocity along a corridor. Tunn. Undergr. Space Technol. 2005, 20, 223–229. [Google Scholar] [CrossRef]
Figure 1. Diagram of mine tunnel and meshes: (a) Top view of the side where the cable is placed; (b) Front view of the side where the cable is placed; (c) Dividing Mesh; (d) Diagram of thermocouple distribution.
Energies 15 02059 g001
Figure 2. The temperature curve at the heat source center.
Energies 15 02059 g002
Figure 3. (a) Experiment tunnel; (b) simulation tunnel.
Energies 15 02059 g003
Figure 4. The temperature change curve with time.
Energies 15 02059 g004
Figure 5. (a) Cable burning condition; (b) temperature slice.
Energies 15 02059 g005
Figure 6. Heat release rate curve.
Energies 15 02059 g006
Figure 7. Simulation of cable combustion at 1380 s.
Energies 15 02059 g007
Figure 8. Temperature distribution curve.
Energies 15 02059 g008
Figure 9. The heat release rate curves under different conditions: (a) Different cable tray spacing; (b) Different ignition positions; (c) Different wind speed.
Energies 15 02059 g009
Figure 10. PHRR change curves under different working conditions.
Energies 15 02059 g010
Figure 11. The flame spread rate at different cable tray spacings: (a) First layer of cables; (b) Second layer of cables; (c) Third layer of cables; (d) Fourth layer of cables.
Energies 15 02059 g011
Figure 12. Cable extension at different ignition positions: (a) First layer of cables; (b) Second layer of cables; (c) Third layer of cables; (d) Fourth layer of cables.
Energies 15 02059 g012
Figure 13. Simulates the flame propagation at different intervals at 700 s: (a) d = 25 mm; (b) d = 50 mm; (c) d = 75 mm.
Energies 15 02059 g013
Figure 14. Flame propagation for different ignition positions: (a) D1 700 s; (b) D2 700 s; (c) D3 700 s; (d) D4 700 s.
Energies 15 02059 g014
Figure 15. Cable burnout rate at different wind speeds: (a) Upstream cable; (b) Downstream cable.
Energies 15 02059 g015
Figure 16. Temperature upstream and downstream of the fire source.
Energies 15 02059 g016
Table 1. Cable parameters.
MaterialsDensity [kg/m³]Specific Heat Capacity [kJ/(kg·K)]Heat Conductivity [W/(m·K)]
PVC13801.280.2
Copper89400.38387
Table 2. Parameter table.
ParameterMeaningValues
Q Heat release rate [KW]100
ρ Air density [kg/m3]1.2
c Air specific heat [kJ/(kg · K)]1
T Environment temperature [K]293.15
g Acceleration of gravity [m/s2]9.8
Table 3. Table of Simulated Operating Conditions.
Condition NumberCable Tray Spacing [mm]Ventilation Speed [m/s]Ignition Position
1250Under the first cable tray
2500Under the first cable tray
3750Under the first cable tray
4500.25Under the first cable tray
5500.50Under the first cable tray
6501.00Under the first cable tray
7501.50Under the first cable tray
8500Under the second cable tray
9500Under the third cable tray
10500Under the fourth cable tray
Table 4. The fire spread rate on both sides of the cables.
First Layer of CableSecond Layer of CableThird Layer of CableFourth Layer of Cable
The left side of ignition position0.056 m/min0.065 m/min0.078 m/min0.084 m/min
The right side of ignition position0.056 m/min0.064 m/min0.077 m/min0.085 m/min
Table 5. Ignition time of cables at different ignition positions.
First Layer CableSecond Layer CableThird Layer CableFourth Layer Cable
D1303 s320 s340 s374 s
D2391 s303 s320 s340 s
D3702 s389 s303 s320 s
D41080 s768 s392 s303 s
Table 6. The time of cable combustion initiation under different wind speeds.
0.00 m/s0.25 m/s0.50 m/s0.75 m/s1.00 m/s
The time of cable combustion initiation303 s334 s342 s344 s380 s
Publisher’s Note: MDPI stays neutral with regard to jurisdictional claims in published maps and institutional affiliations.

