Article

Green Solution for Insulation System of a Medium Frequency High Voltage Transformer for an Offshore Wind Farm

by
Mohammad Kharezy
1,2,*,
Hassan Reza Mirzaei
3,
Torbjörn Thiringer
2 and
Yuriy V. Serdyuk
2
1
RISE Research Institutes of Sweden, 50462 Borås, Sweden
2
Department of Electrical Engineering, Chalmers University of Technology, 41296 Göteborg, Sweden
3
Department of Electrical Engineering, University of Zanjan, Zanjan 45371-38791, Iran
*
Author to whom correspondence should be addressed.
Energies 2022, 15(6), 1998; https://doi.org/10.3390/en15061998
Submission received: 6 February 2022 / Revised: 28 February 2022 / Accepted: 7 March 2022 / Published: 9 March 2022
(This article belongs to the Special Issue Power System Dynamics and Renewable Energy Integration)

Abstract

:
High Voltage Direct Current (HVDC) transmission represents the most efficient way for transporting produced electrical energy from remotely located offshore wind farms to the shore. Such systems are implemented today using very expensive and large power transformers and converter stations placed on dedicated platforms. The present study aims at elaborating a compact solution for an energy collections system. The solution allows for a minimum of total transformer weight in the wind turbine nacelle reducing or even eliminating the need for a sea-based platform(s). The heart of the project is a Medium Frequency Transformer (MFT) that has a high DC voltage insulation towards ground. The transformer is employed in a DC/DC converter that delivers the energy into a serial array without additional conversion units. The insulation design methodology of an environmentally friendly HV insulation system for an MFT, based on pressboard and biodegradable oil, is introduced. The measurement method and results of the measurements of electrical conductivities of the transformer oil and Oil Impregnated Pressboard (OIP) are reported. The measurements show that the biodegradable ester oil/OIP conductivities are generally higher than the mineral oil/OIP conductivities. Numerical simulations reveal that the performance of the insulation system is slightly better when ester oil is used. Additionally, a lower temperature dependency for ester oil/OIP conductivities is observed, with the result that the transformer filled with ester oil is less sensitive to temperature variations.

1. Introduction

The potential to harness energy from wind is enormous and offshore wind power generation is one of the most rapidly developing methods to utilize this potential. This type of electricity generation contributes to the reduction of CO2 emissions from electricity generation worldwide [1]. However, it remains of great importance to reduce the cost of these energy sources throughout their life cycle. Thus, the energy generated by the offshore windfarms is transferred to the shore by means of submarine high voltage cables. Since AC transmission becomes inefficient at distances longer than approximately 60 km [2], it is necessary to switch to High Voltage Direct Current (HVDC) transmission for sea-based wind farms. Today’s HVDC concept of offshore wind farms require a transformer and a converter station platform, which serves as the hub for the collection network and as a connection point of the HVDC cable to land. This solution is economically inefficient, and therefore, a reduction in costs of platforms is highly desirable.
The present work contributes to a green solution that partly reduces the need for offshore platforms as well as costs and weight in the wind turbines themselves. The suggested concept foresees replacing heavy 50 Hz transformers with lighter and smaller Medium Frequency Transformers (MFT) in container-mounted DC/DC converters that delivers the electrical energy to series coupled converters to achieve a high DC voltage sufficient for direct transfer of the generated energy to land [3] (see Figure 1). The design of the MFT, which is the key component of such a system, presents a very challenging task as its AC insulation level is much lower compared with a conventional converter transformer and its volume can be considerably decreased by utilizing higher operation frequency.
Another advantage of the series concept is the ability to deliver as much energy as possible in a low wind situation. This can be achieved by minimizing the amount of magnetic and Ohmic losses in the power supply circuit using a DC/DC converter and an MFT.
A significant potential for the series DC concept was identified in [4], through considerable cost savings from a Life Cycle Cost (LCC) perspective, compared to today’s technology with internal ‘parallel-coupled’ AC radials. The main cost reduction was due to the replacement of AC transformers with significantly smaller DC/DC converters, which eliminates the need for a dedicated offshore platform [4]. The results of that work were expected to be used by offshore windfarm integration-network designers and manufacturers of equipment for wind farms, as well as manufacturers of MFTs for insulated DC/DC converters. Furthermore, during the previous phases of the project, design and construction processes of prototype transformers that can withstand a high DC offset voltages were reported [5,6] and the challenges in designing such transformers were reviewed [7]. In the present paper, the next step of the project is reported, which focuses on implementation of an environmentally friendly solution of the insulation system of MFT, based on biodegradable transformer oil and Oil Impregnated Pressboard (OIP).
Design principles of the insulation of MFTs operating at very high DC voltages to ground have not been widely presented in the literature [8]. Most of the publications deal with insulation systems of conventional HVDC converter station transformers, which contain large amounts of mineral oil with relatively long insolation distances inside the transformer tank. Due to much higher operation frequency, an MFT is much more compact compared with a 50 Hz transformer. When a biodegradable oil is used, as this article reveals, the performance of the transformer insulation is different, especially during the transient operations of energizing or loading.
Among the transformer oils, mineral oil bears the most well-known characteristics for AC and HVDC insulated large converter transformers [9]. Still, there is an increasing trend and interest to use biodegradable oils specially the ester-based oils for transformer insulation systems [10]. To secure proper functioning of the insulation system, its design should be based on well-established properties of the constituting materials. In [11] the various aspects of using the synthetic ester oil in the high voltage equipment including its breakdown performance under different electrical stress conditions are reviewed. The design of an HVDC insulation system strongly depends on the electrical conductivity values of oil and OIP under very high DC voltages. However, the electrical conductivity values given in the literature are typically obtained at low test voltages and therefore, are hardly applicable for designing an HVDC insulation [12]. Information regarding conductivity of biodegradable synthetic ester oil under HVDC stress is rather limited [13,14] and even less data is available for ester OIP [15].
The purpose of the present study is to contribute to the development of an MFT bearing a high DC insulation strength and at the same time a much more compact design compared with conventional power transformers. The new design uses biodegradable insulation materials instead of mineral oil, which is undesirable from an environmental point of view, especially for offshore applications. The electrical conductivities of mineral oil and OIP insulation materials were measured previously by the authors and reported in [16]. In this work, the properties of the biodegradable dielectric oil and OIP are measured under an extensive effort and presented, and the results are used for the insulation design of an MFT introduced in the paper. Additionally, a 10 MVA HVDC MFT with an insulation system using biodegradable oil and OIP is designed based on the method developed previously and verified by experimental testing [5]. Consequently, the performance of the ester-based insulation system is analyzed and compared to the case when mineral oil is used. Furthermore, in addition to previously considered safety factors of the insulating oil gaps and creepage paths, a novel criterion based on the combined path is suggested.
First in Section 2, an overview of the design, manufacturing, and verification tests of a mineral-oil-based high voltage DC medium frequency transformer prototype is presented. In Section 2.1 the implemented design process is reviewed, and the performed verification tests are reported. Later in Section 2.2, a real scale 10 MW 200 KV DC transformer suitable for an offshore wind farm based on the DC series system is introduced. The insulation system behavior under DC stress is explained later under Section 2.3. Section 3 describes the details of the method used for the measurement of temperature and stress dependent conductivities of a biodegradable oil/OIP. The results are compared with the previously performed measurement results of a sample mineral oil/OIP. In Section 4, FEM simulations are applied to present a reliable design of a high-power medium frequency transformer filled with an environment-friendly oil which is to be subjected to a very high offset DC voltage. Finally, a discussion on the results is presented in Section 5.

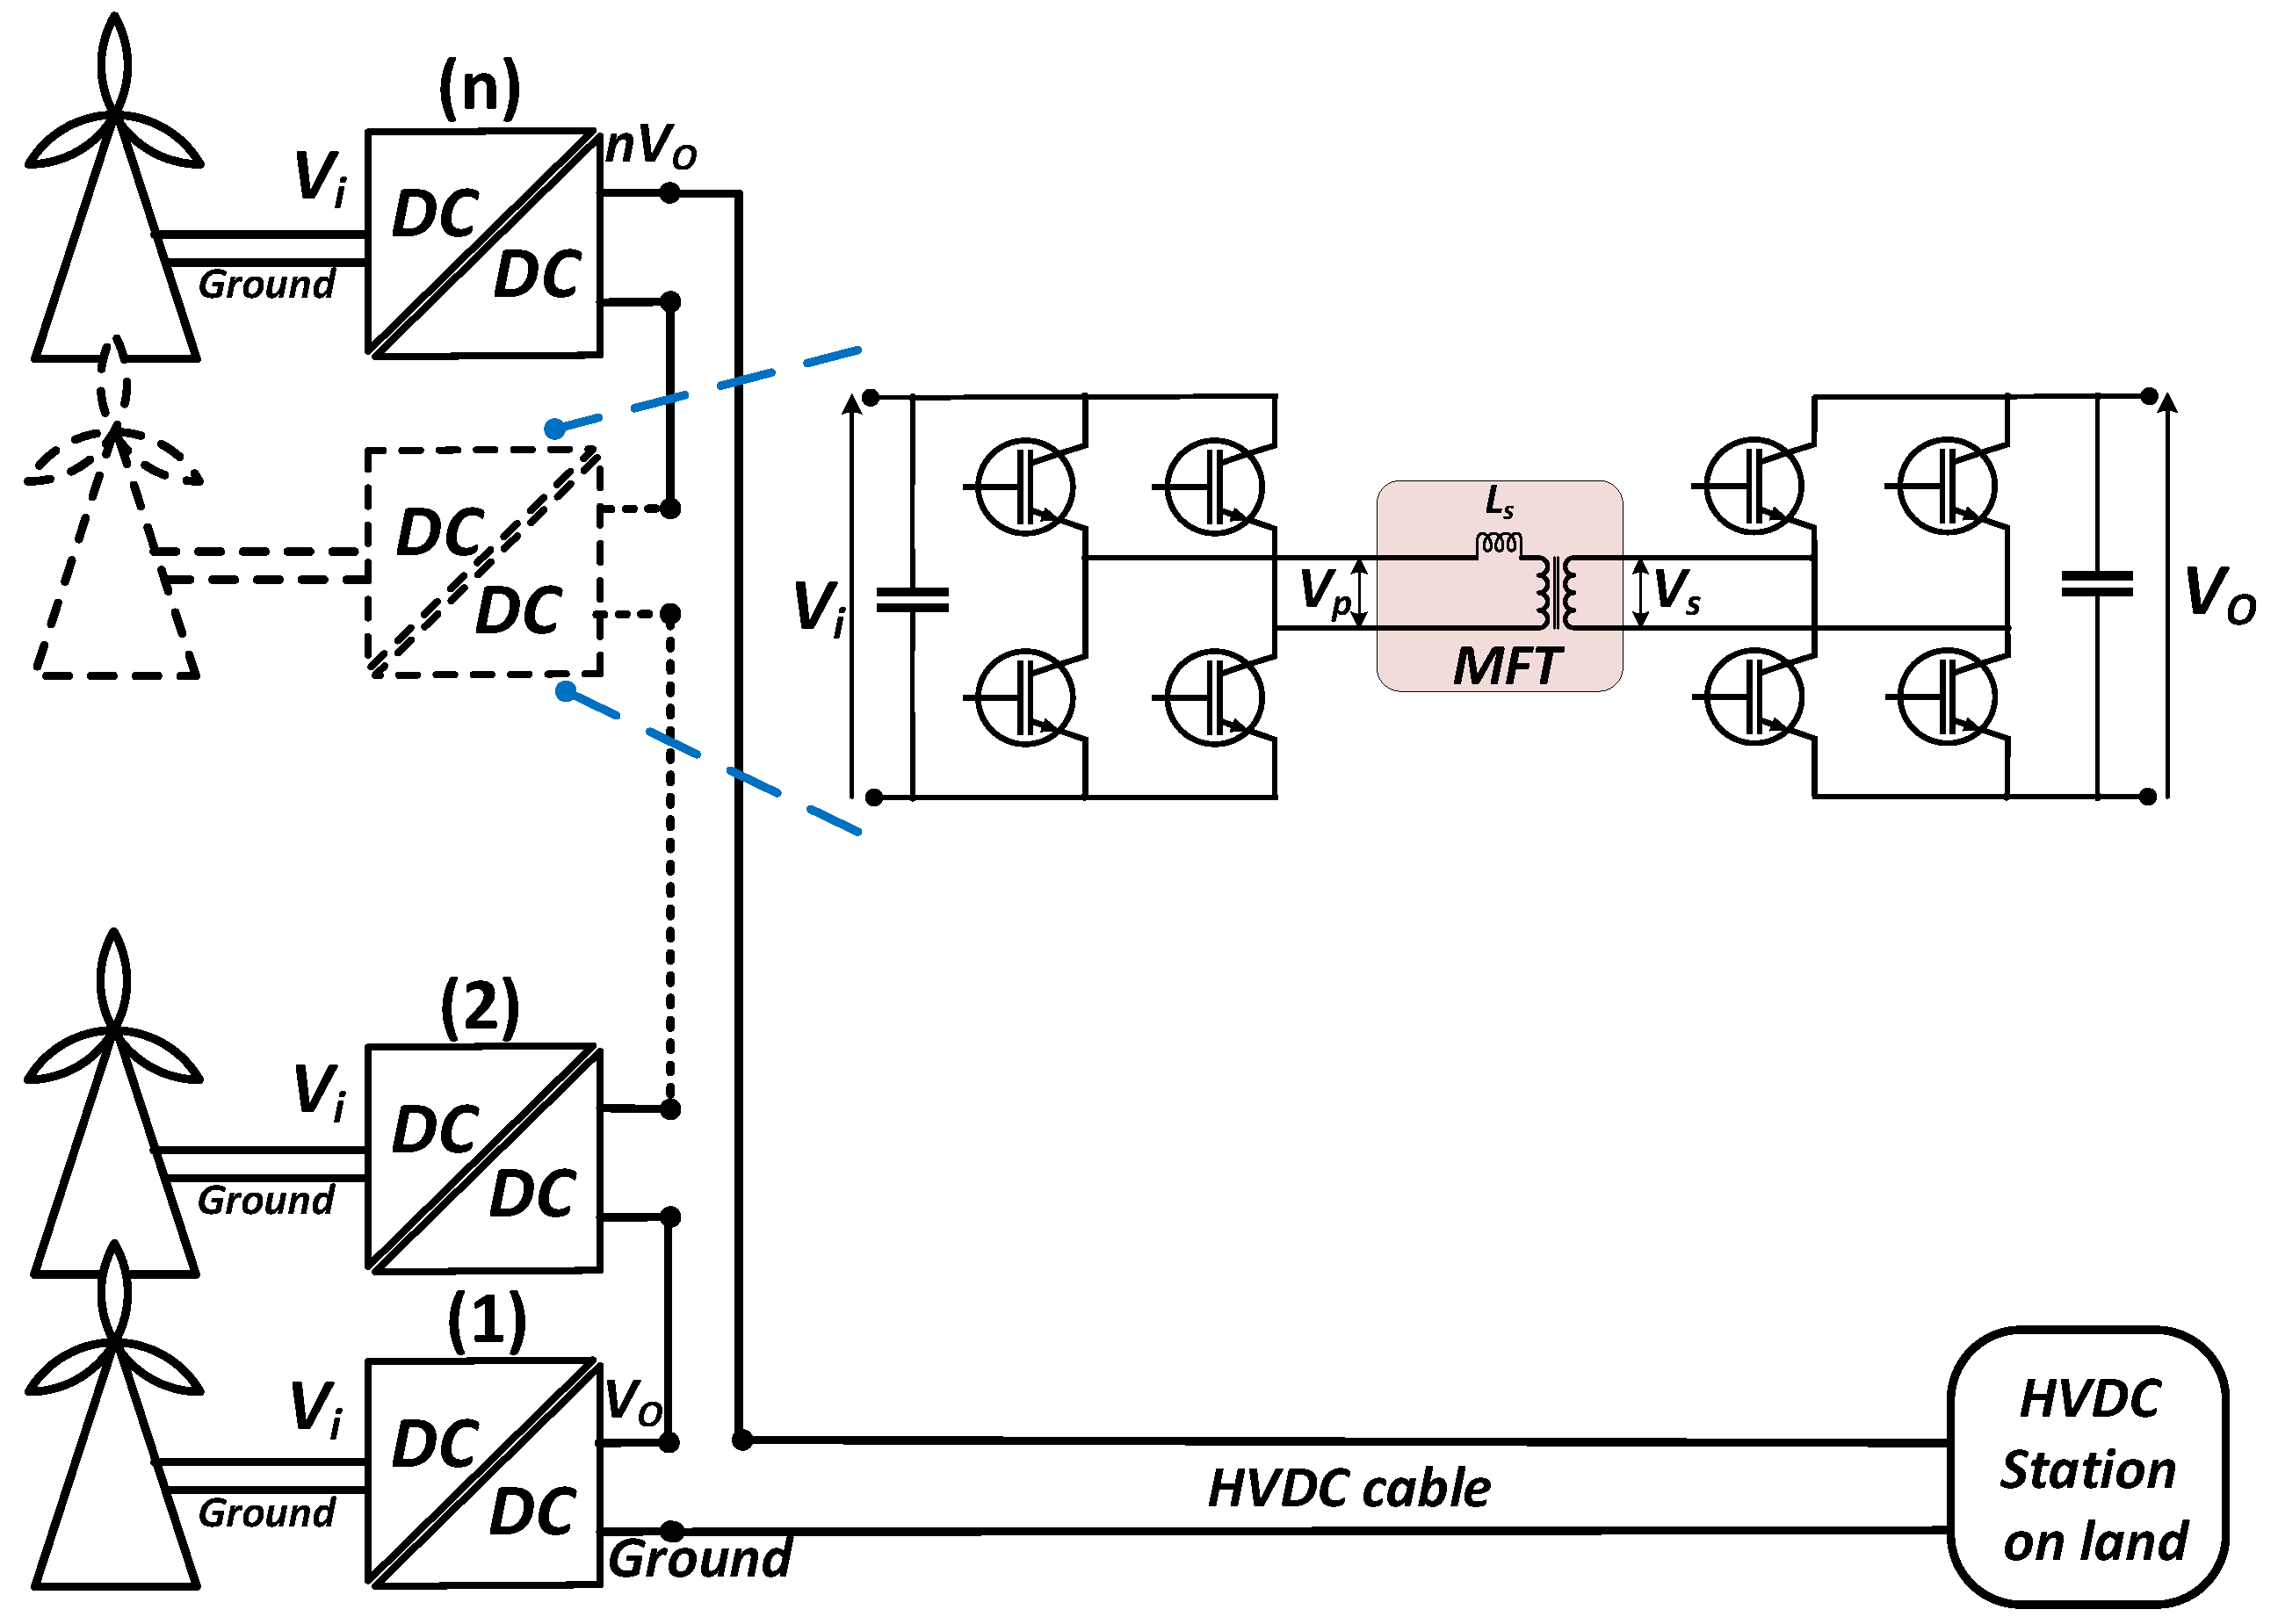
2. Overview of the Design of the Mineral-Oil-Based HVDC Medium Frequency Transformer

2.1. Design Method Development and Verification

After successfully manufacturing two downscaled prototypes [6], a set of adopted methods for designing an oil insulated transformer having a very high DC isolation to ground was developed. The methods were verified by manufacturing a 50 kW, 0.42/4.5 kV AC 5 kHz and a 125 kV DC prototype transformer [5] (see Figure 2).
As seen from Figure 2, the core consists of ten rectangularly shaped ferrite core sets and the windings made of stranded Litz conductors are placed inside the core window. The structure is fixed between PMMA plates using plastic tighteners. The transformer is immersed in oil and main insulation is provided by paper and pressboard elements. The background for such a design and the procedure of manufacturing the insulation system is described in [5].
The equation relating the number of turns and the core cross section for a given flux is:
φ m = V P D T 2 N = V P 4 N f
where T is the time period of the wave and here it is assumed that the duty cycle of the applied rectangular wave D is 0.5. Therefore, the needed core area is:
A C = φ m B m = V P 4 N f B m
where VP is the rms of the DC voltage on the primary winding, Ac is the effective cross section of the transformer core, φm is the maximum flux in the core, Bm is the maximum flux density of the core, N is the number of turns for the primary winding and f is the switching frequency [17].
For specific voltage conditions and to achieve a certain power, the optimal switching frequency of a Dual Active Bridge (DAB) converter for high power applications is practically limited to the range of 6–20 kHz [18]. However, the rise time of the voltage pulses are very short which means harmonic components of much higher frequencies. This dictates special criteria for the selection of core material as well as the winding wire types and construction [5]. In the case of a core, the main material requirements are low loss, high saturation flux density, and high continuous operating temperature [19]. In case of a suitable winding conductor to minimize the extra losses caused by high frequency current harmonics, stranded Litz conductors are used to minimize the proximity and skin effects.
In this article, the focus centers on the DC insulation design of the transformer, which is mostly based on temperature dependent high voltage conductivity values of the insulation materials. The losses in transformer components like the core and windings, increase the temperature of the insulation materials. Therefore, it is crucial to characterize the main loss components of the transformer which are in the core and windings.
The core loss is highly dependent on the duty cycle and the rise time of the excitation wave shape. Increasing the rise time, results in higher core loss and increasing the duty cycle reduces the losses. A set of adopted versions of that equation used by the designers is introduced in [19].
At high frequencies, the winding losses increase considerably because of the skin effect in the conductors, and the proximity effect of the adjacent conductors. The winding losses can be calculated by a numerical method proposed by the authors, using (Finite Element Method) FEM simulations among the other methods [20].
To achieve a soft switching possibility in the DAB and to consequently increase the efficiency of the DC/DC converter, it is of great importance to set a maximum limit to the leakage inductance of the MFT. That is why the precise calculation of the inductance is crucial for the optimized operation of a DAB converter. In [21] a relation for calculation of the leakage inductance required for a DAB is presented. For an MFT, the leakage inductance can be calculated using the total magnetic energy stored inside the core window [22]. By increasing the isolation distance between the windings, the amount of stored energy in this region will also increase [22,23]. Consequently, the leakage inductance will increase and may pass the upper limit set by the soft switching requirement. Simultaneously, a high insulation distance between the windings is required to withstand the high applied DC voltage between the windings. Therefore, special care must be paid to these two contradicting requirements for the gap between the windings. The authors have presented an effective analytical method, for calculating the leakage inductance of shell-type transformers with circular windings in [24].

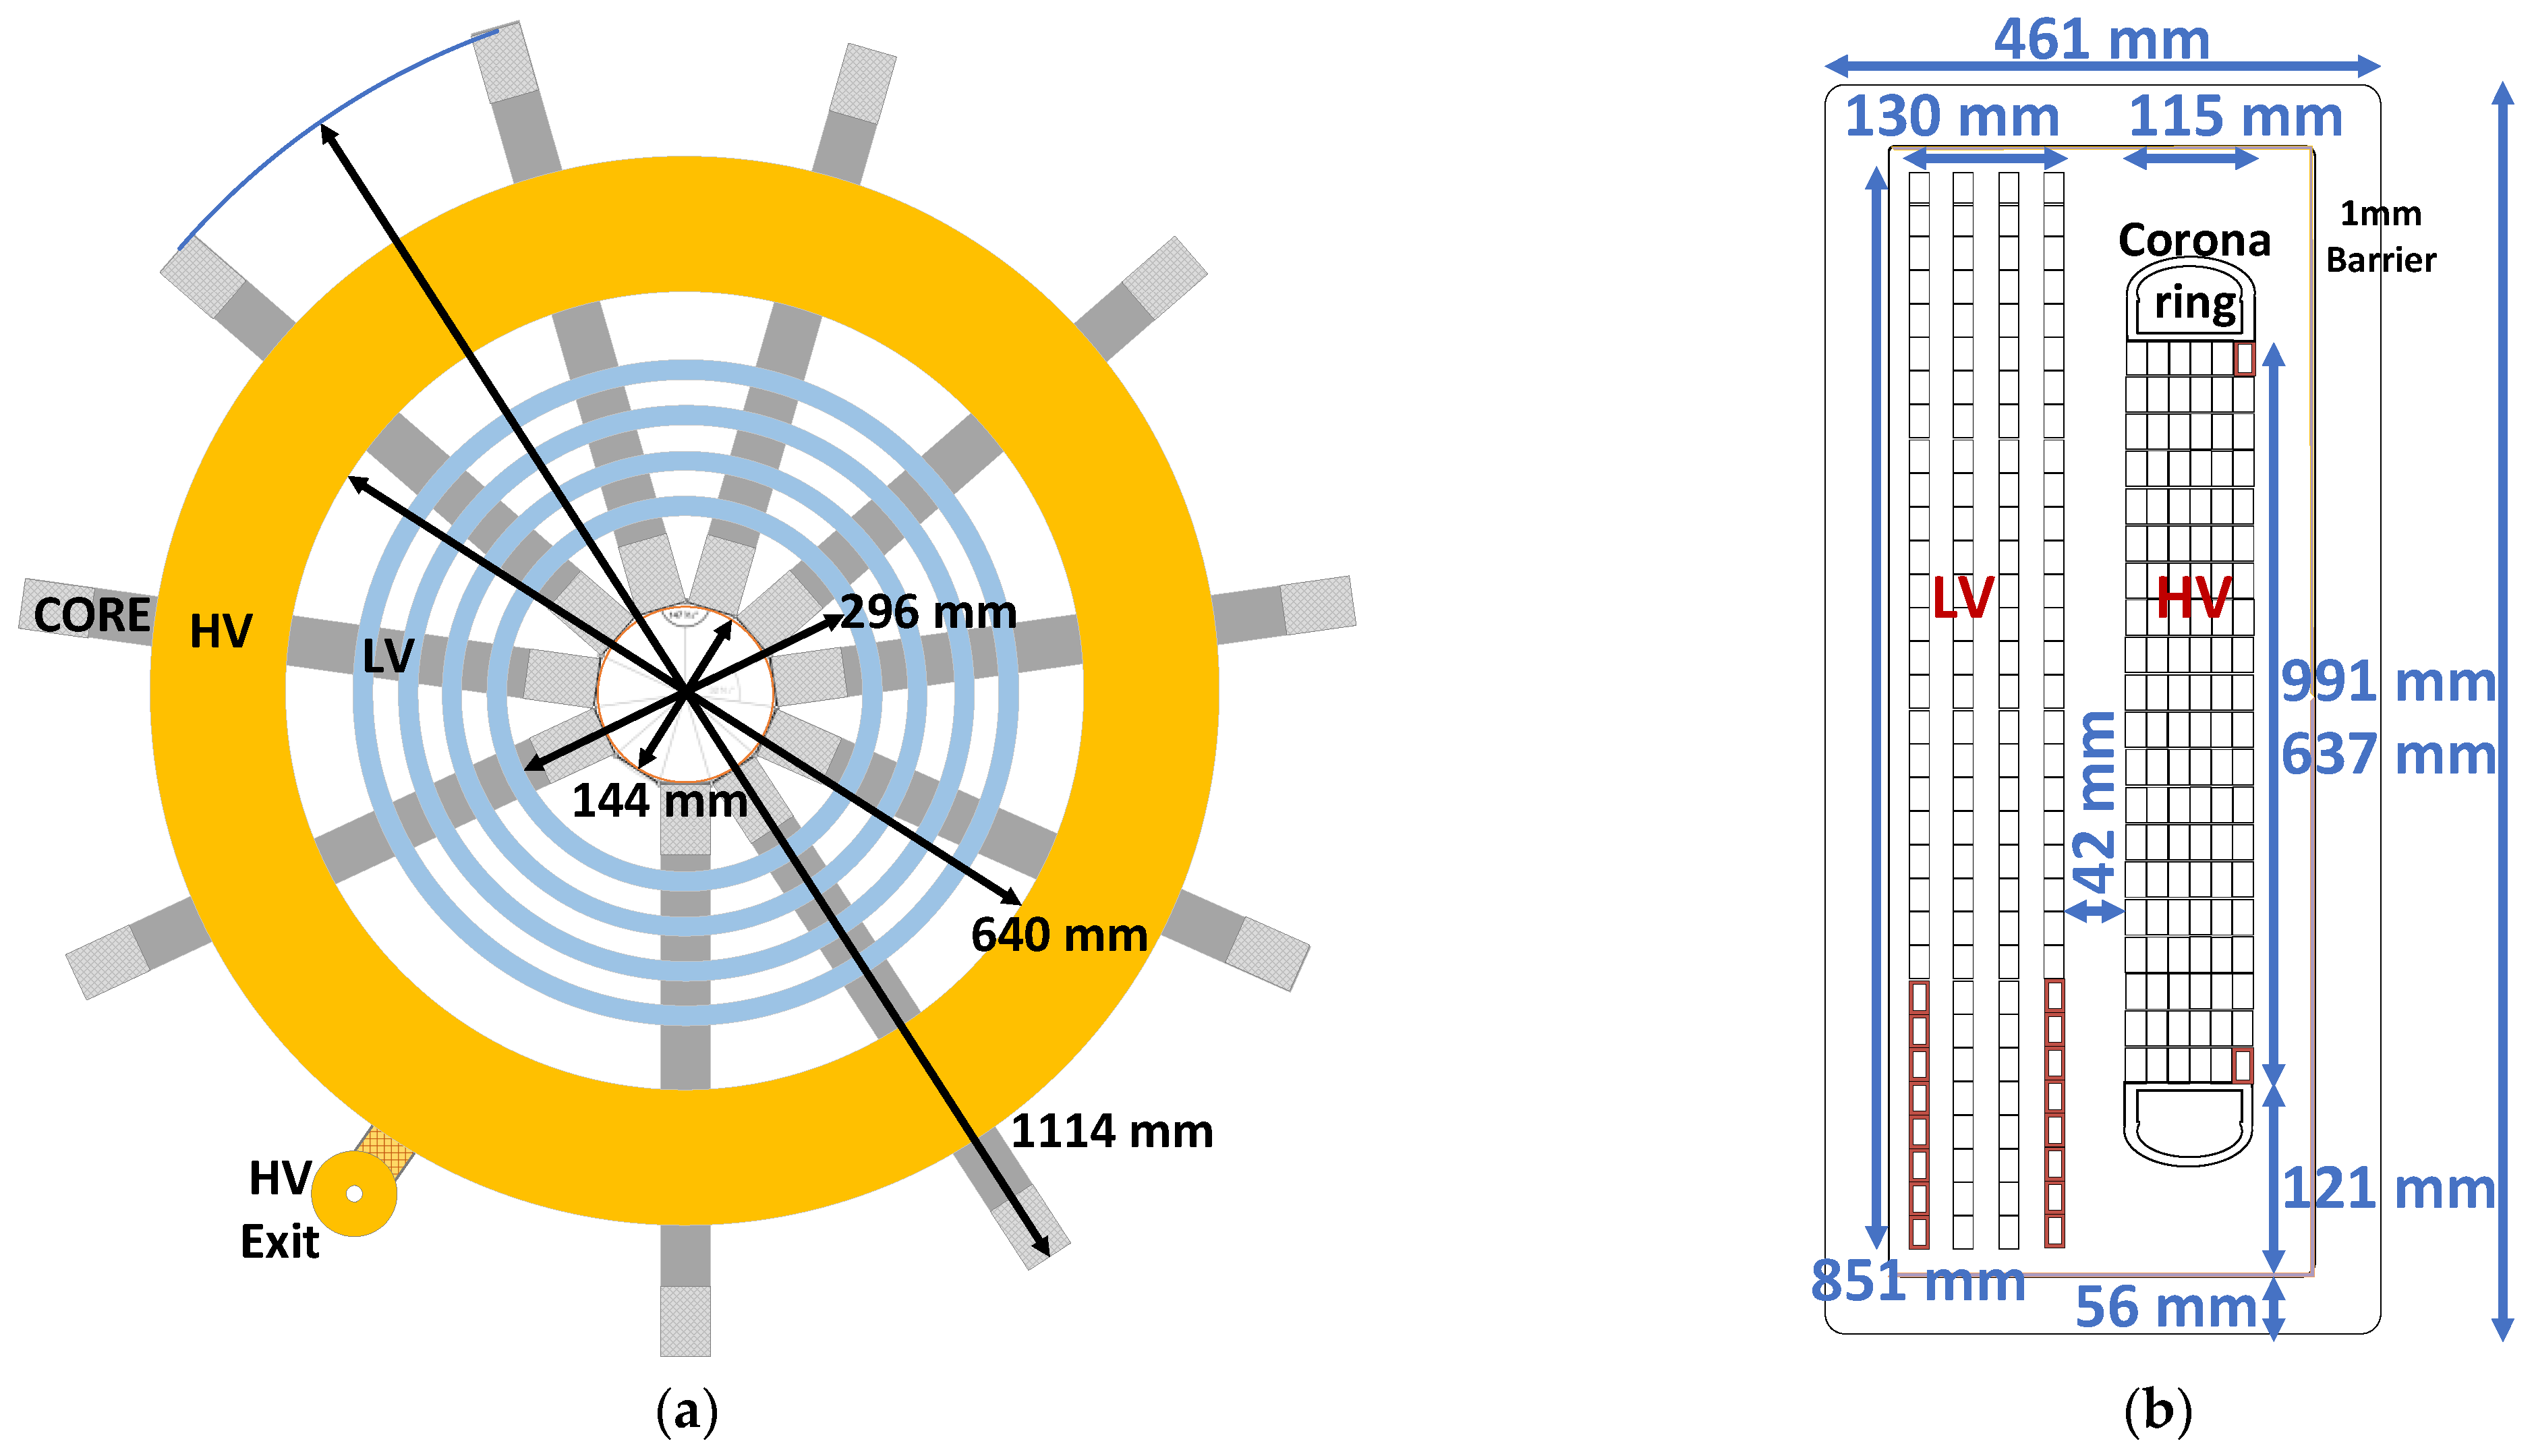
2.2. A Real Scale 10 MW HVDC MFT

In [4] a life cycle cost and the energy efficiency of three different offshore windfarms of AC/AC, AC/DC and DC/DC were determined and compared using an example of a real 1 GW wind park containing 100 wind turbines of 10 MW capacity and 200 KV DC output voltage. For the DC series system, a series connection of several 1.8/18 kV DC/DC converters is proposed employing 5 kHz transformers inside, each bearing 200 kV DC to ground insulation strength (see Figure 1). For such an operating voltage, the DC isolation should be designed for the level of at least 250 kV (HV winding to ground) to ensure a safety margin.
In the developed MFT prototype, the number of turns, N1 and N2 are 12 and 120, respectively. A ferrite magnetic core having 2240 mm2 as its physical core area including 10 core stacks is selected. A Litz wire bearing 9000 strands, each with 0.2 mm in diameter and a physical dimension of 26.6 × 17.5 mm2 is used. The primary winding is the layer type with 4 layers, each consisting of 3 turns. Each turn is made from 8 parallel Litz conductors. A 20 mm oil gap between the layers are considered for cooling purposes. The secondary winding is a disc type winding, each disc consisting of 6 turns. The HV winding contains twenty discs with a 5.5 mm oil gap between two adjacent discs.
Compared with the previously manufactured prototype MFT [5], the isolation distances are increased, and a higher number of barriers and oil gaps and higher oil gap width, and a greater OIP barriers thickness are used. The insulation design aspects are thoroughly discussed in Section 4. The dimensions of the described real scale 10 MVA HVDC MFT are presented in Figure 3.

2.3. Insulation System Behaviour under DC Stress

The insulation design of AC transformers has been performed for several decades and well-known methods are developed for this purpose [25]. The AC stress distribution in these transformers is based on dielectrics’ permittivities, and as the model is purely capacitive, it is time invariant. Similarly, when applying a step DC voltage to the transformer windings, the initial stress distribution is determined by the insulations’ permittivities. However, when the transient is attenuated, conduction currents are developed inside insulations which are determined by their electric conductivities as well as the electric field intensity. Since these currents are not the same in the series insulations, time varying space charges will be accumulated at their interfaces. The resulting electric field stress distribution stabilizes when the space charge is established and come into a steady state condition. At this time, the stress distribution is determined by materials’ conductivities. This procedure is explained in the Linear Maxwell–Wagner (LMW) model. The differential equation of this model is explained in [5]. The LMW model is widely used for the DC dielectric design for oil–paper converter transformers [26,27]. According to this model, directly after applying a DC voltage, the ratio of the initial electric fields in the materials is proportional to the inverse of their dielectric constants’ ratios, which are 2.2/4.4 = 0.50 for mineral oil/OIP, and 3.5/4.6 = 0.76 for ester oil/OIP. Therefore, the electric field intensity in the oil is higher than the paper. But at the final steady state, in which the conductivity of materials determines the stress; a material with greater conductivity will take less field intensity, and vice versa [8]. For example, since the ratio of the mineral oil/OIP conductivities may vary from 2 to 1000 [16,28], the paper will be more stressed than the oil at steady state. Therefore, the conductivity plays a crucial role in an insulation system which is stressed by a DC voltage.
For each dielectric, a time constant is defined as the ratio of its electrical conductivity to its permittivity. In a system formed by layered dielectric materials with different time constants, time dependent electric field transients appear. While the electric potential distribution in dielectric materials depends on their capacitances at the instant of the HVDC application, it is determined by their resistances at the final steady state. The stabilization time may last up to 10,000 s or longer in the case of using mineral oil [27,29,30].
It is known that the electrical conductivity of dielectrics depends on temperature and electric field intensity [16,30,31,32]. Therefore, the LMW model is not fully suitable for determining the electrical stress distribution in the transformer’s dielectric structure under very high DC voltage application. In [5], the authors investigated and demonstrated the non-linear dependence of the mineral oil/OIP conductivities to the variation of the applied voltage as well as the temperature. Additionally, a Non-Linear Maxwell–Wagner (NLMW) model is developed by implementing FEM to consider the nonlinear behavior of the insulation materials with respect to the applied electric field.
In the next section, the temperature and stress dependent conductivities of ester oil/OIP are measured and compared with the conductivities of mineral oil/OIP. Consequently, in Section 4, the measured values are implemented using the NLMW method for dielectric design of the real scale MFT, comparing ester and mineral oils/OIPs application.

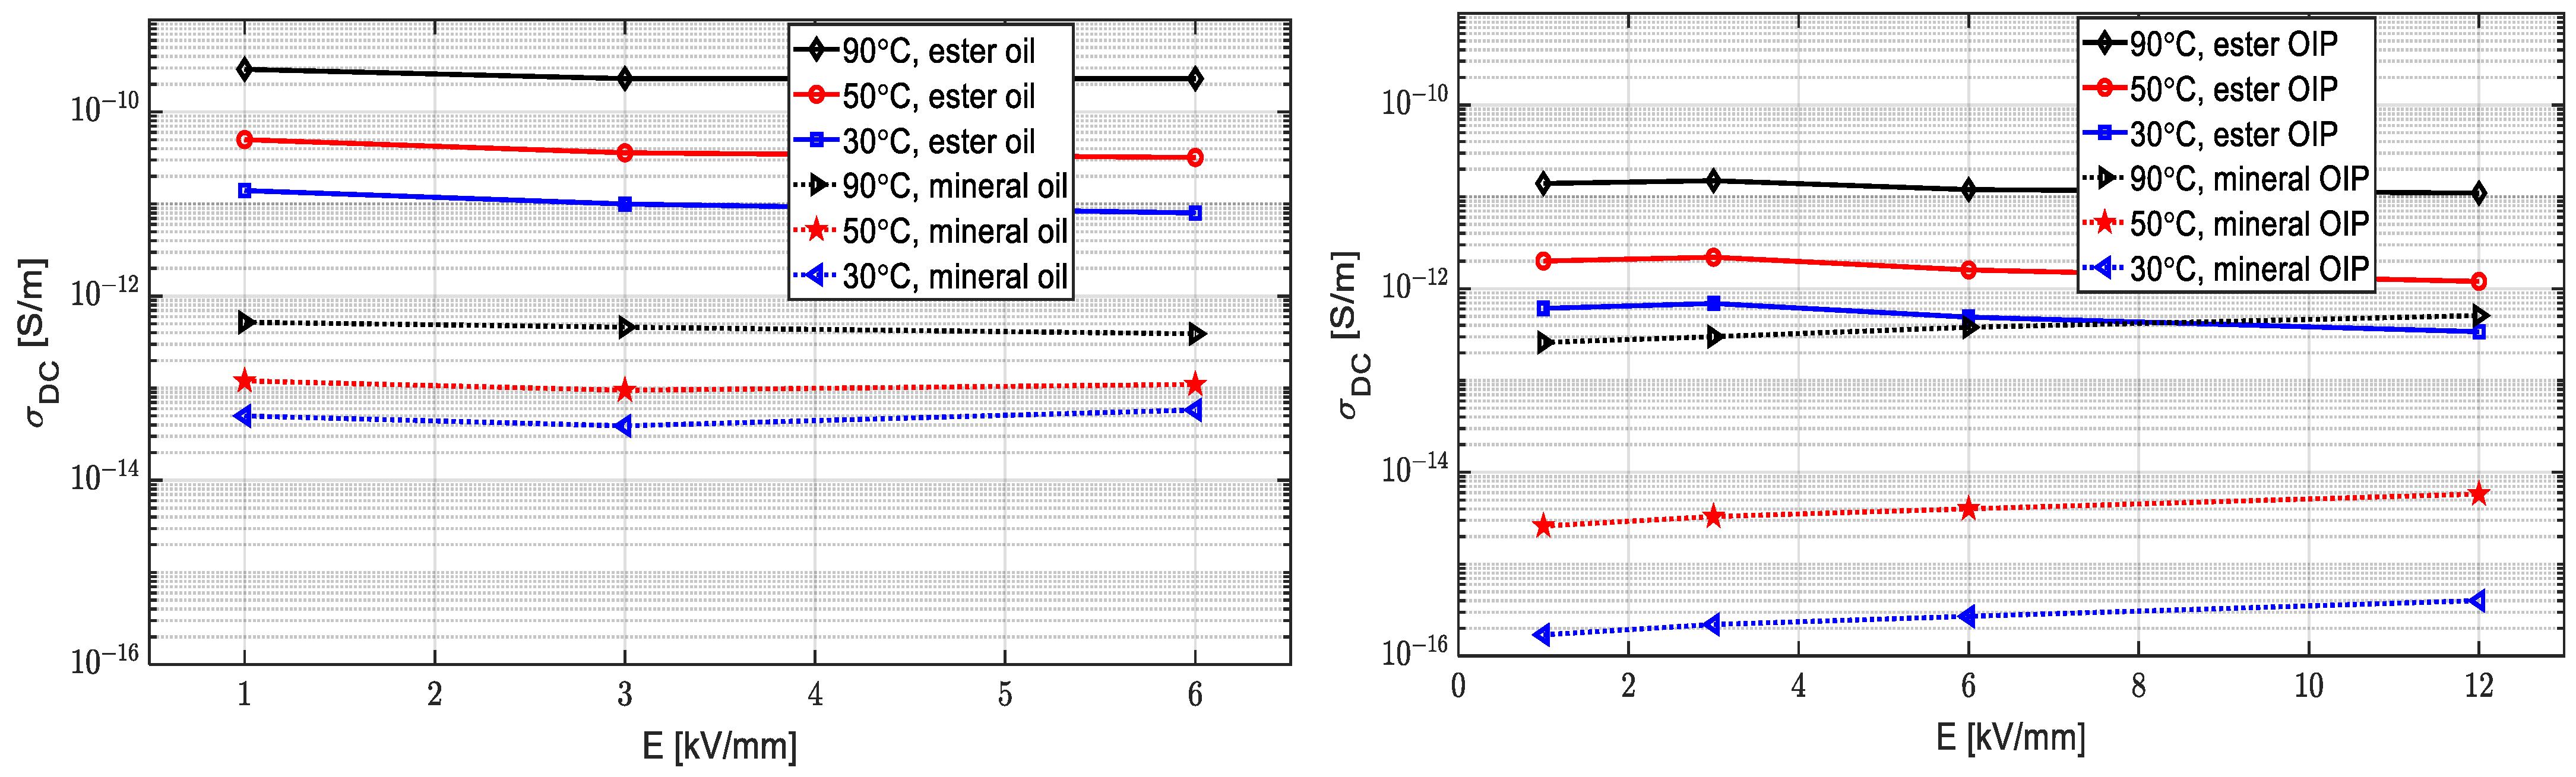
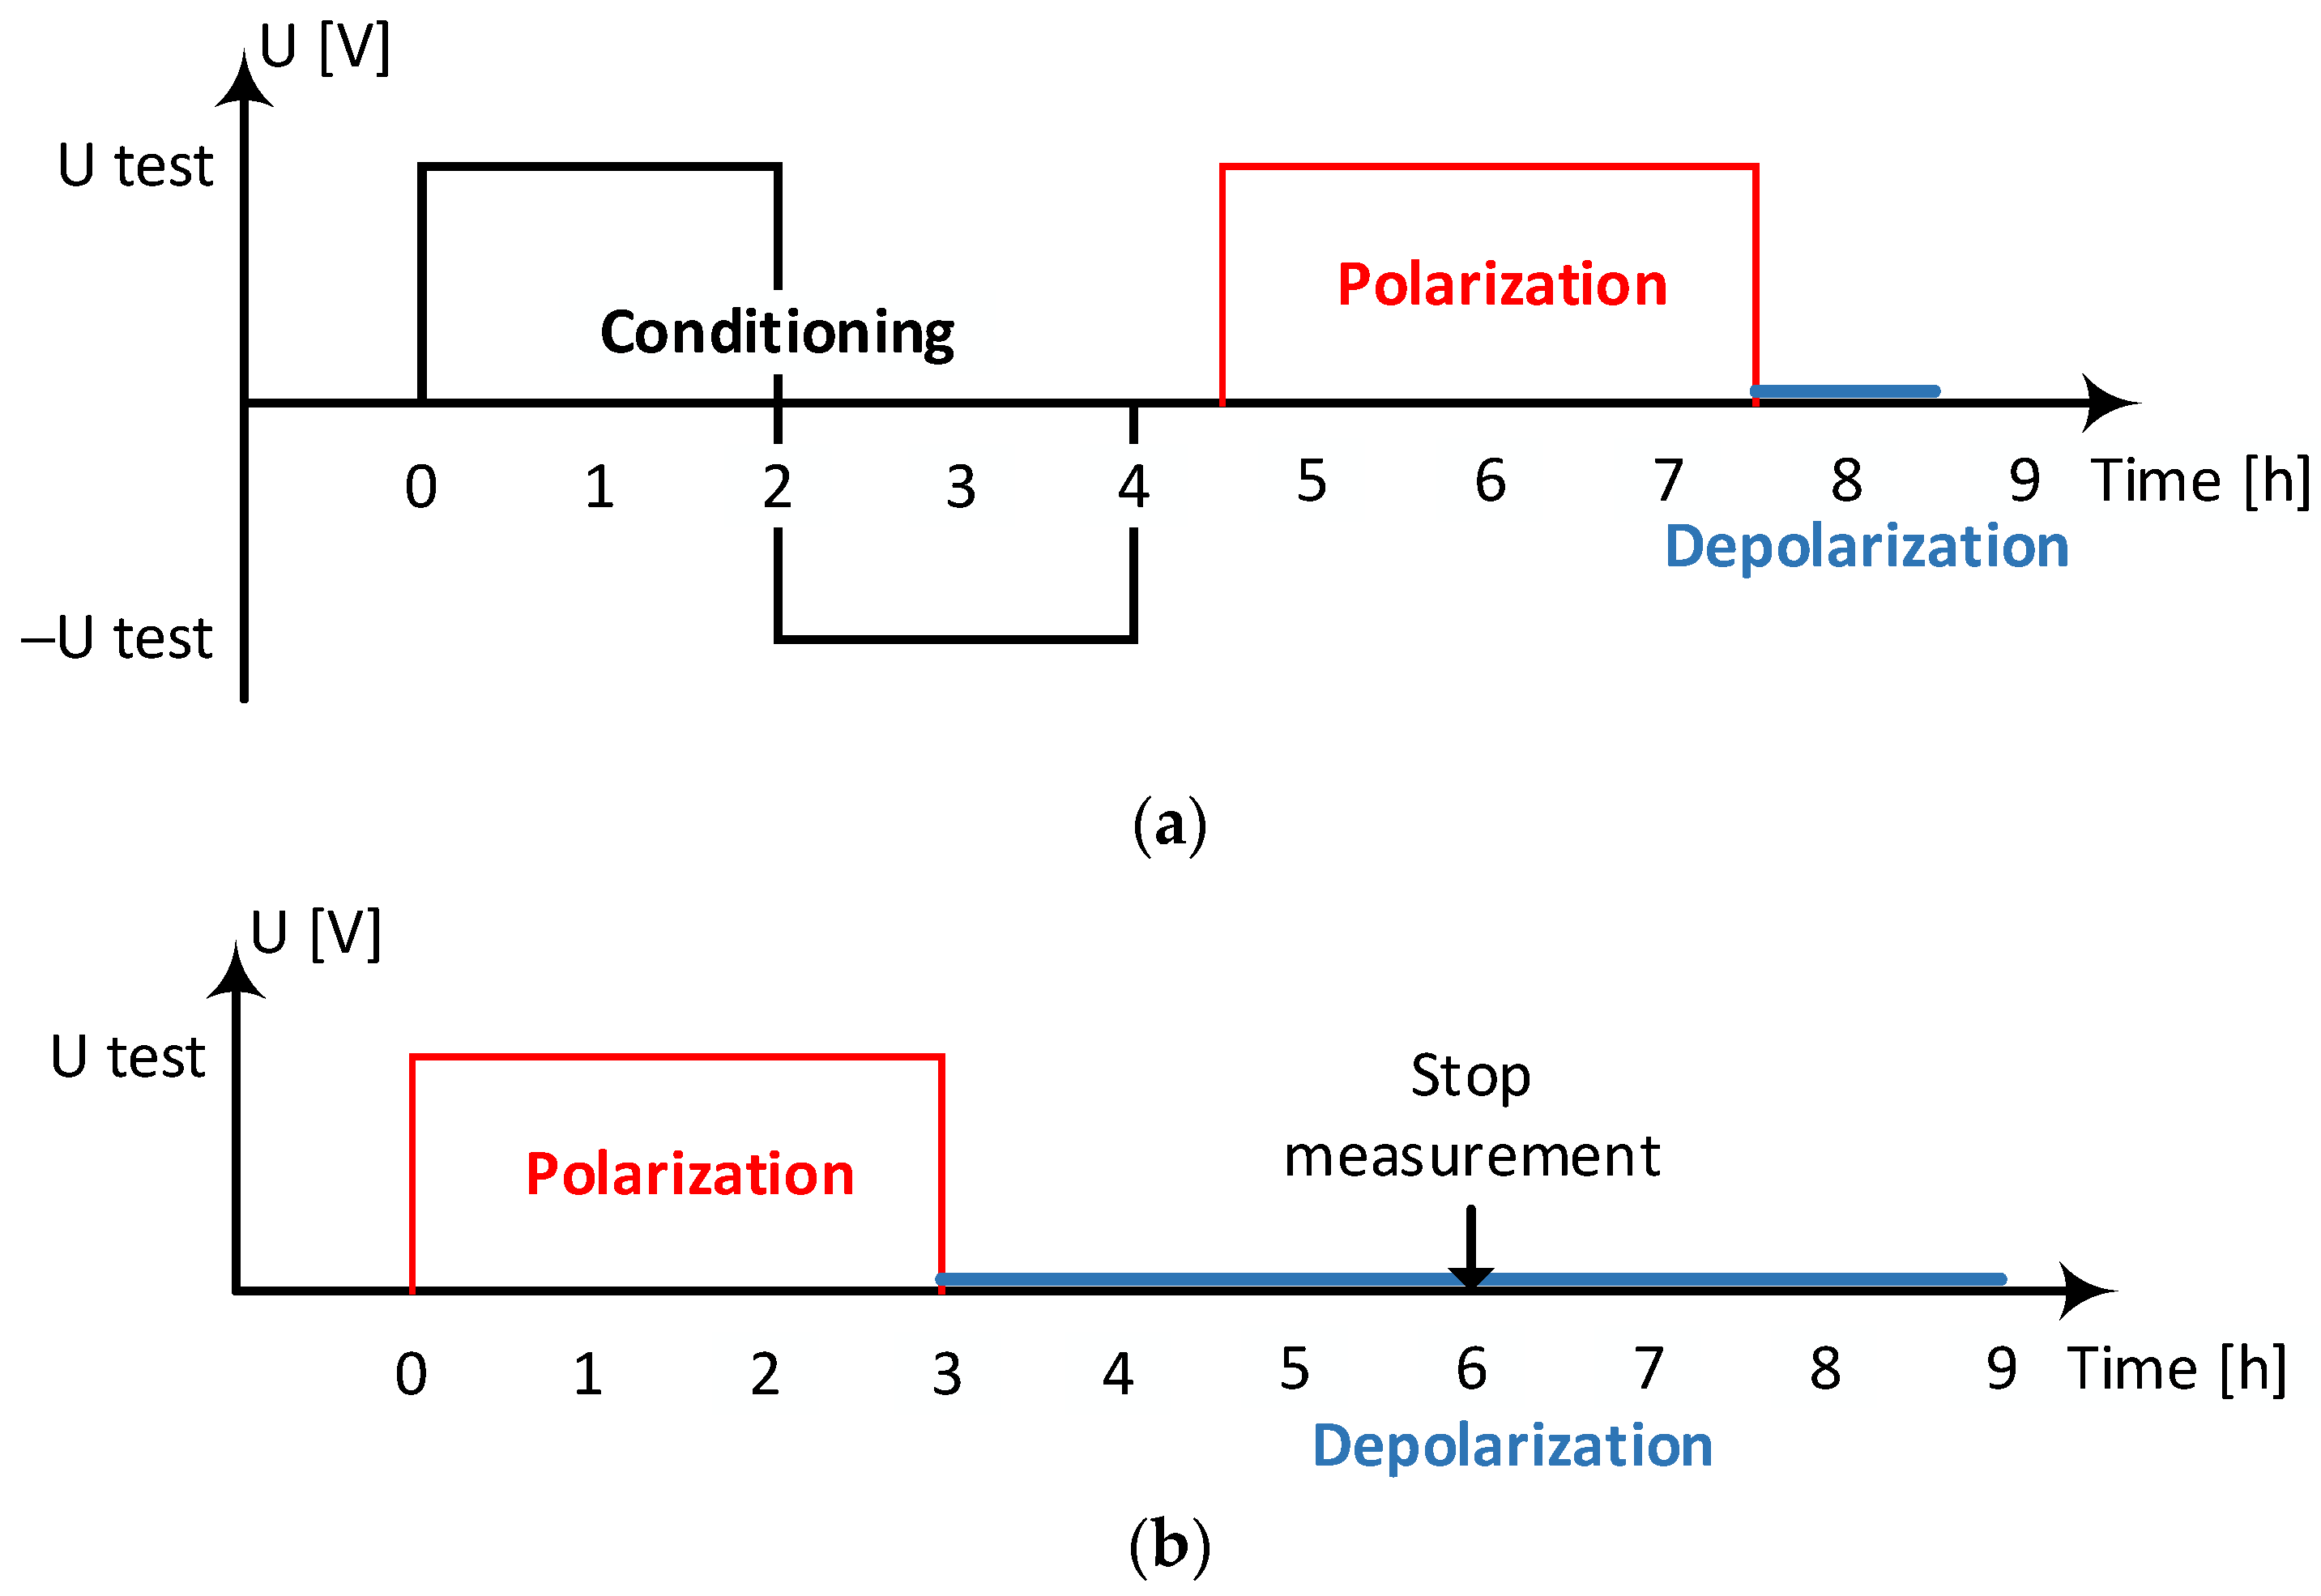
3. Conductivity Measurement
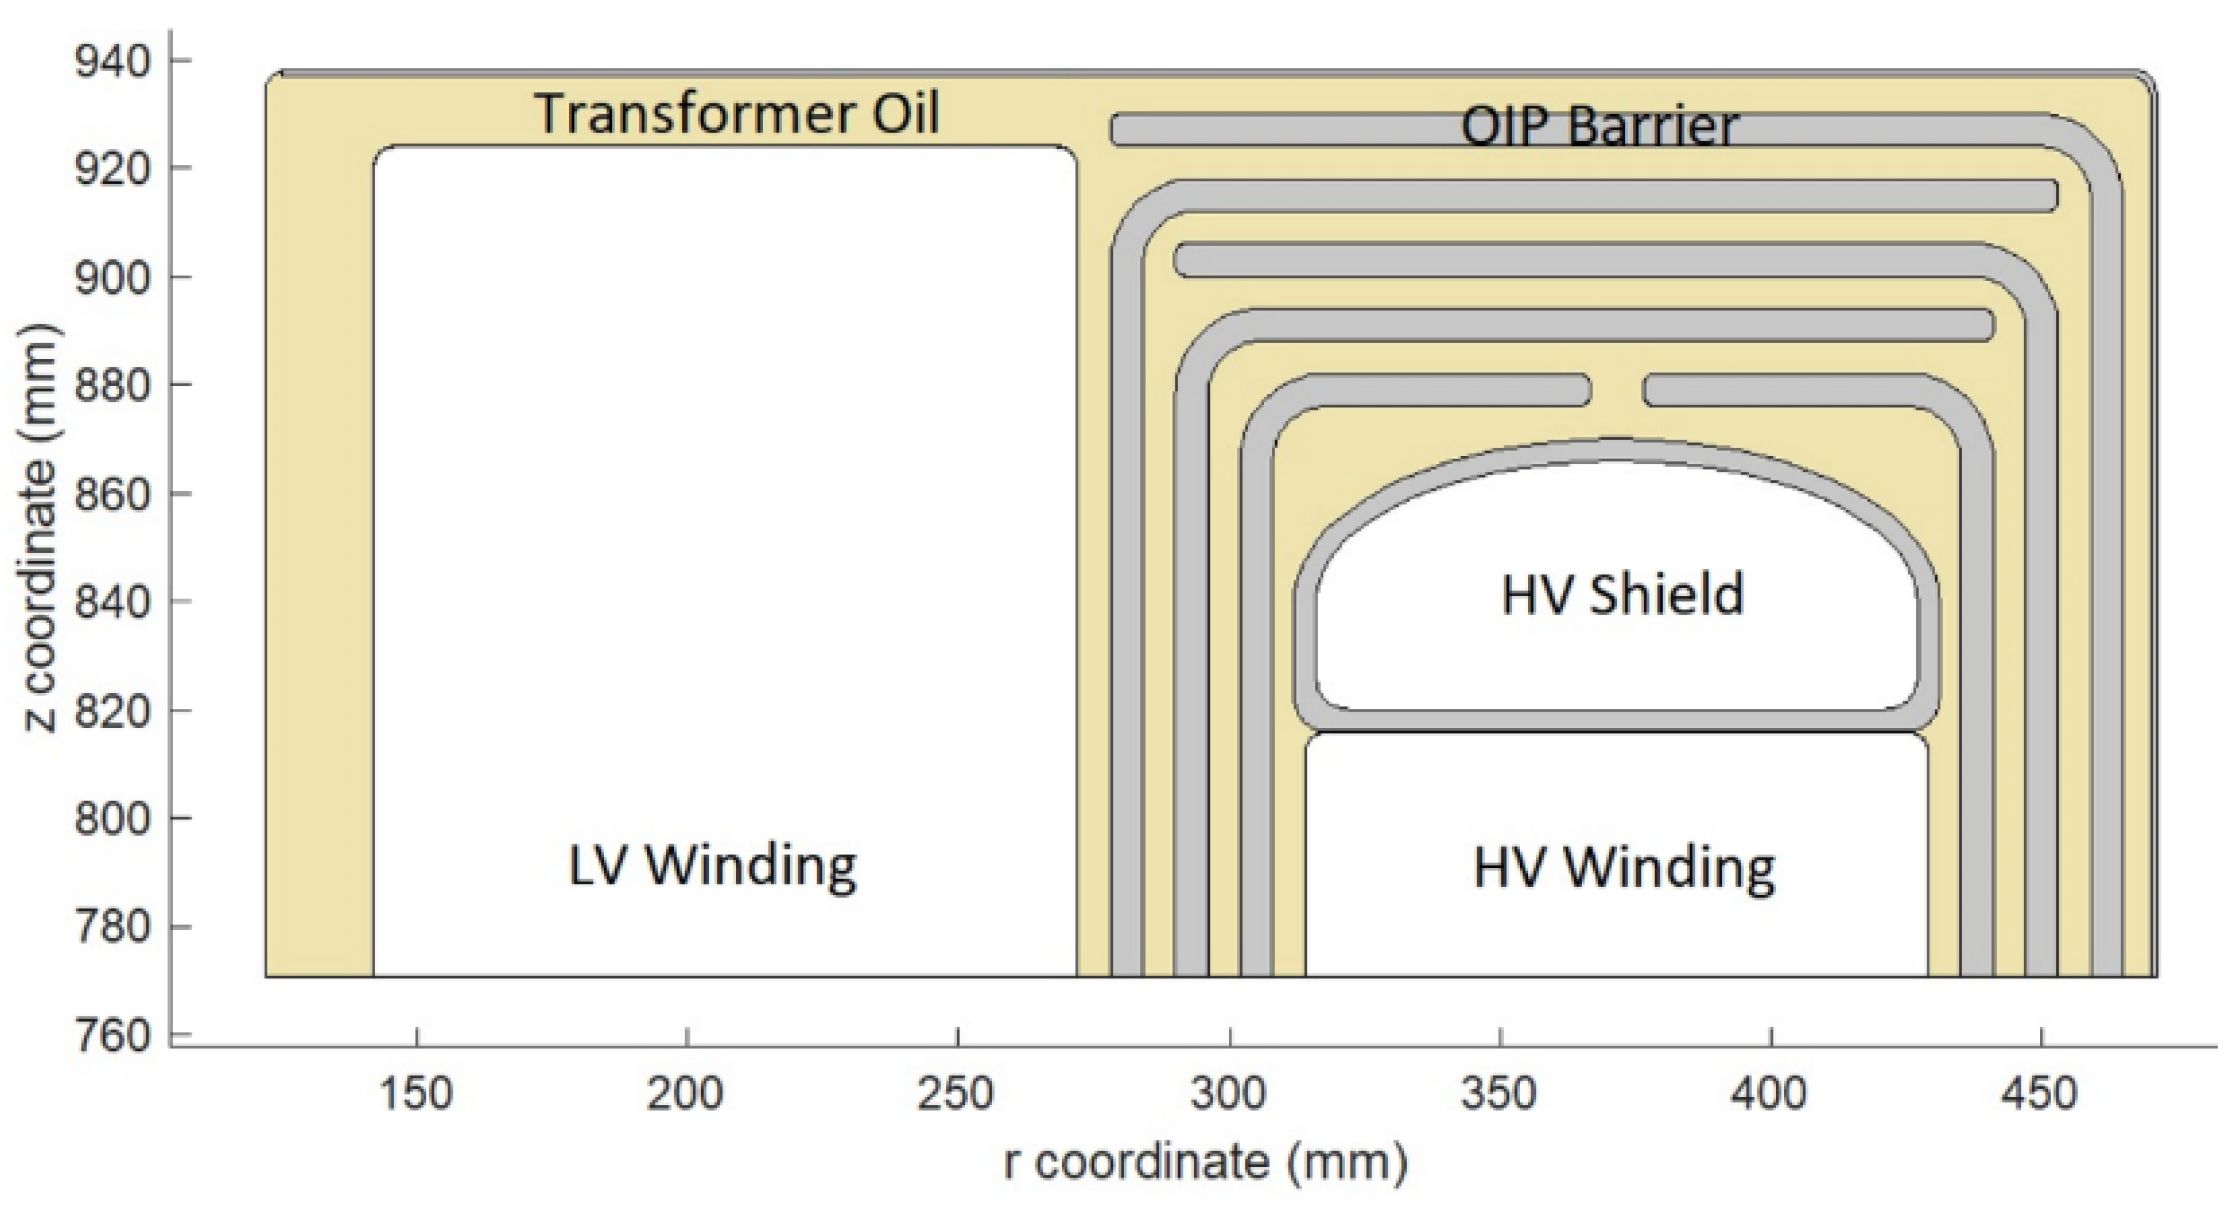
The electrical conductivity values given in the literature are typically obtained at low test voltages and therefore are hardly applicable for designing HVDC insulation. Moreover, insulation materials behave nonlinearly under high DC voltage stresses. In addition, additives such as inhibitors, pour-point depressants, antioxidants or antistatic agents that are added to the transformer oils, introduce large variations of the real conductivity values [33]. Even specific features of production facilities or the season of production and packaging can make an effect. The conductivity of OIP is also dependent on the cellulose fiber density and properties of the oil used for the impregnation [34]. Studies show that the standard production and treatment methods do not guarantee reproducible and comparable measurements results under an HVDC test or service conditions [16]. Furthermore, parameters such as temperature, field strength, pre-stressing and duration of stress bear a direct effect on the conductivity values under high DC stress [35]. Hence, for a successful insulation design, actual conductivity values are needed and should be measured within the actual ranges of electric field strength and temperature variations that are expected to appear under real working conditions.
The method of conductivity measurements including the procedures for preparation of the test samples, the design and setup of the measuring equipment, and methods of treating the measurement data are presented by the authors in their previously published works [5,16]. To achieve reliable results, the following activities should be carefully planned and implemented: the test cell design and temperature chamber preparation, the preparation of oil and solid insulation samples as well as the high voltage supply system and its safety circuit design, the current measuring system and its protection circuit design and the mitigation of noises. In addition, the very low current values recorded under very high voltage stress and under noisy environmental conditions should be treated using a proper method [16,36].
As the MFT introduced here is intended for installation in the sea environment, the use of a biodegradable insulation oil is considered as the substitute to the traditional mineral oil and its electrical properties are investigated in the present work. Previously, a complete set of conductivity measurements was performed by the authors for mineral oil and OIP and the results were comparable with the presented values in literature [16]. Here, the same method is applied to measure the conductivities of ester oil/OIP under a similar range of high voltage stresses and temperatures. MIDEL 7131 synthetic ester oil is used.
As the preliminary tests showed unstable results for the polarization current of ester oil, it was thus decided to perform conditioning for the ester oil and to increase polarization time from 1 h (which was used for mineral oil) to 3 h [15]. Ester OIP is tested similarly to the mineral OIP for 3 h. Figure 4 demonstrates the conditioning process and the test duration for ester oil (a) and ester OIP (b), respectively.
Table 1 and Table 2 summarize the conductivity measurements results for ester and mineral oils/OIPs whereas Figure 5 presents them graphically.
It is noticeable that the ester oil/OIP conductivities are generally higher than the mineral oil/OIP conductivities. Quantitatively, the differences are 100–130 times at 30 °C, 320–430 times at 50 °C, and 450–480 times at 90 °C. This causes a lower time constant and reduces the dynamic stress duration of the insulation system, which consequently results in a shorter time to reach the steady state condition in cases when ester oil is employed. The Conductivity Ratio (CR) values of mineral oil/OIP indicate stronger temperature dependence compared to the ester oil/OIP. This renders the transformers filled with the mineral oil very sensitive to the temperature variation during energizing or loading as well as operational environmental temperature. Since the CR determines the stress ratio of the oil to OIP at steady sate condition, a high and unstable variation in CR for mineral oil, results in the unstable stress shift from oil to OIP or vice versa. In the case of ester oil/OIP, the CR variation is very low, and the stress distribution condition is more stable. Further comparisons are presented in the next sub-section.

4. FEM Simulation

It can be clearly noticed from Figure 1 that the applied HVDC in the last unit of the DC/DC converters is at maximum. Therefore, the insulation design of the real scale MFT, which is placed inside the last converter unit, is selected to be investigated here as the worst case. The dielectrics of the MFT will be under time varying electric field stresses, which change from the initial permittivity-based distribution to the final conductivity-based distribution, including the transient phase in-between. To find exact values of the stresses on dielectric materials, computer simulations were conducted utilizing time dependent electric current physics in COMSOL Multiphysics software. Owing to the vertical symmetry at the core window section, only the upper part of the design is considered. A DC voltage is applied to the HV winding while both the LV winding and the core are supposed to be at ground potential (Figure 6). For the combined AC and DC voltages on the HV winding of the MFT, the magnitude of the DC voltage (250 kV) is much higher than the AC voltage (18 kV). In this way, applying just a step HVDC to this winding can be considered enough to simulate the operational condition. The logarithmic time steps from t = 1 s (the instant of HVDC application) to t = 10,000 s (when the steady state condition supposed to be reached) are considered to find the solutions. The conductivities of the ester oil/OIP and mineral oil/OIP materials depend on the temperature and the instantaneous electric field intensity. Therefore, as a basis for a NLMW solution, three separate sets of simulations were performed for 30, 50 and 90 °C temperatures for ester oil/OIP, and similarly, for mineral oil/OIP. In each set, the measured results from Table 1 and Table 2 were used as two input local tables of stress dependent conductivities in COMSOL. The electric field distribution was investigated during three distinguished time periods: initial, final and transient stages. Subsequently, a smart algorithm for dielectric stress evaluation is applied.

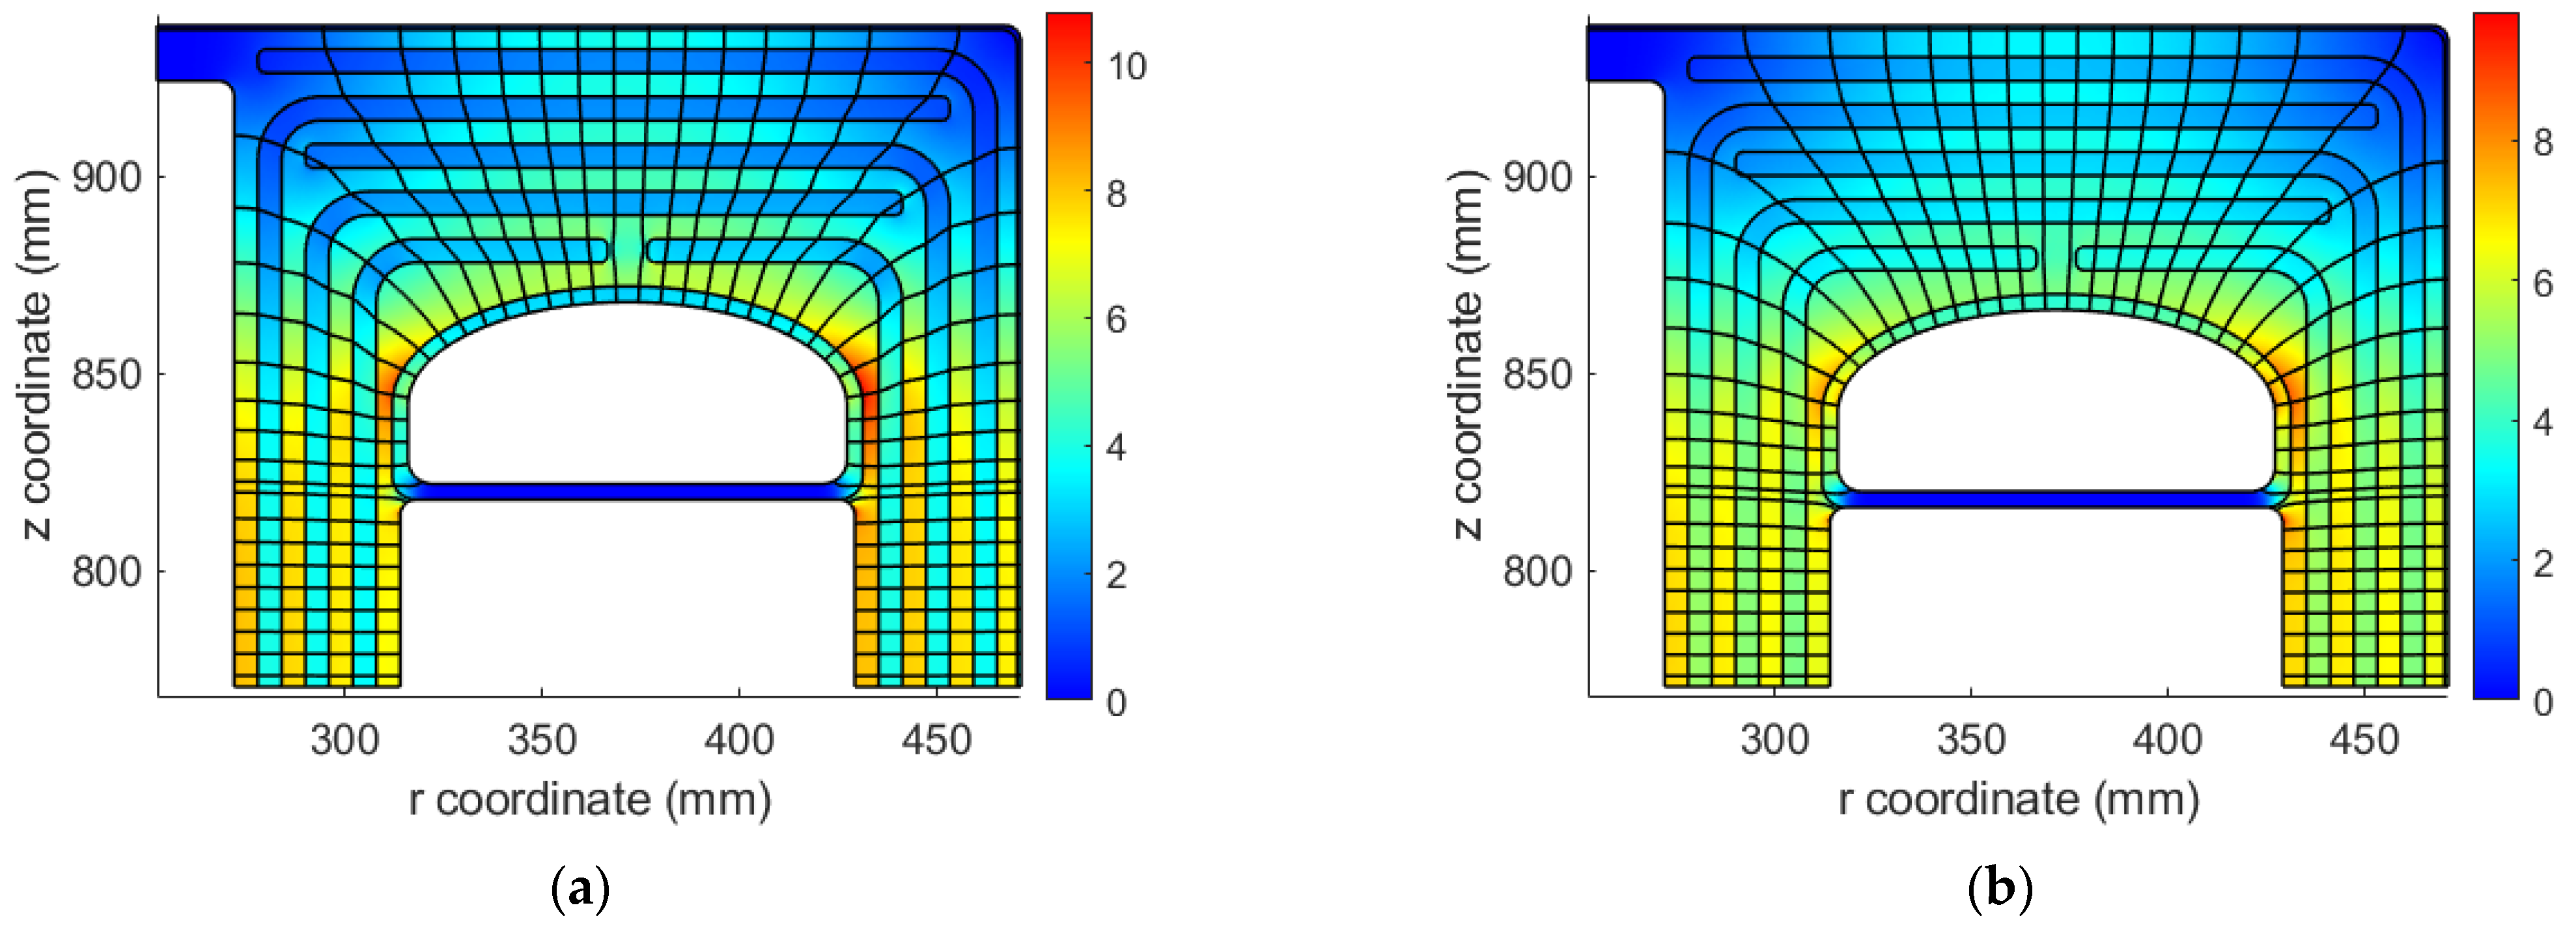
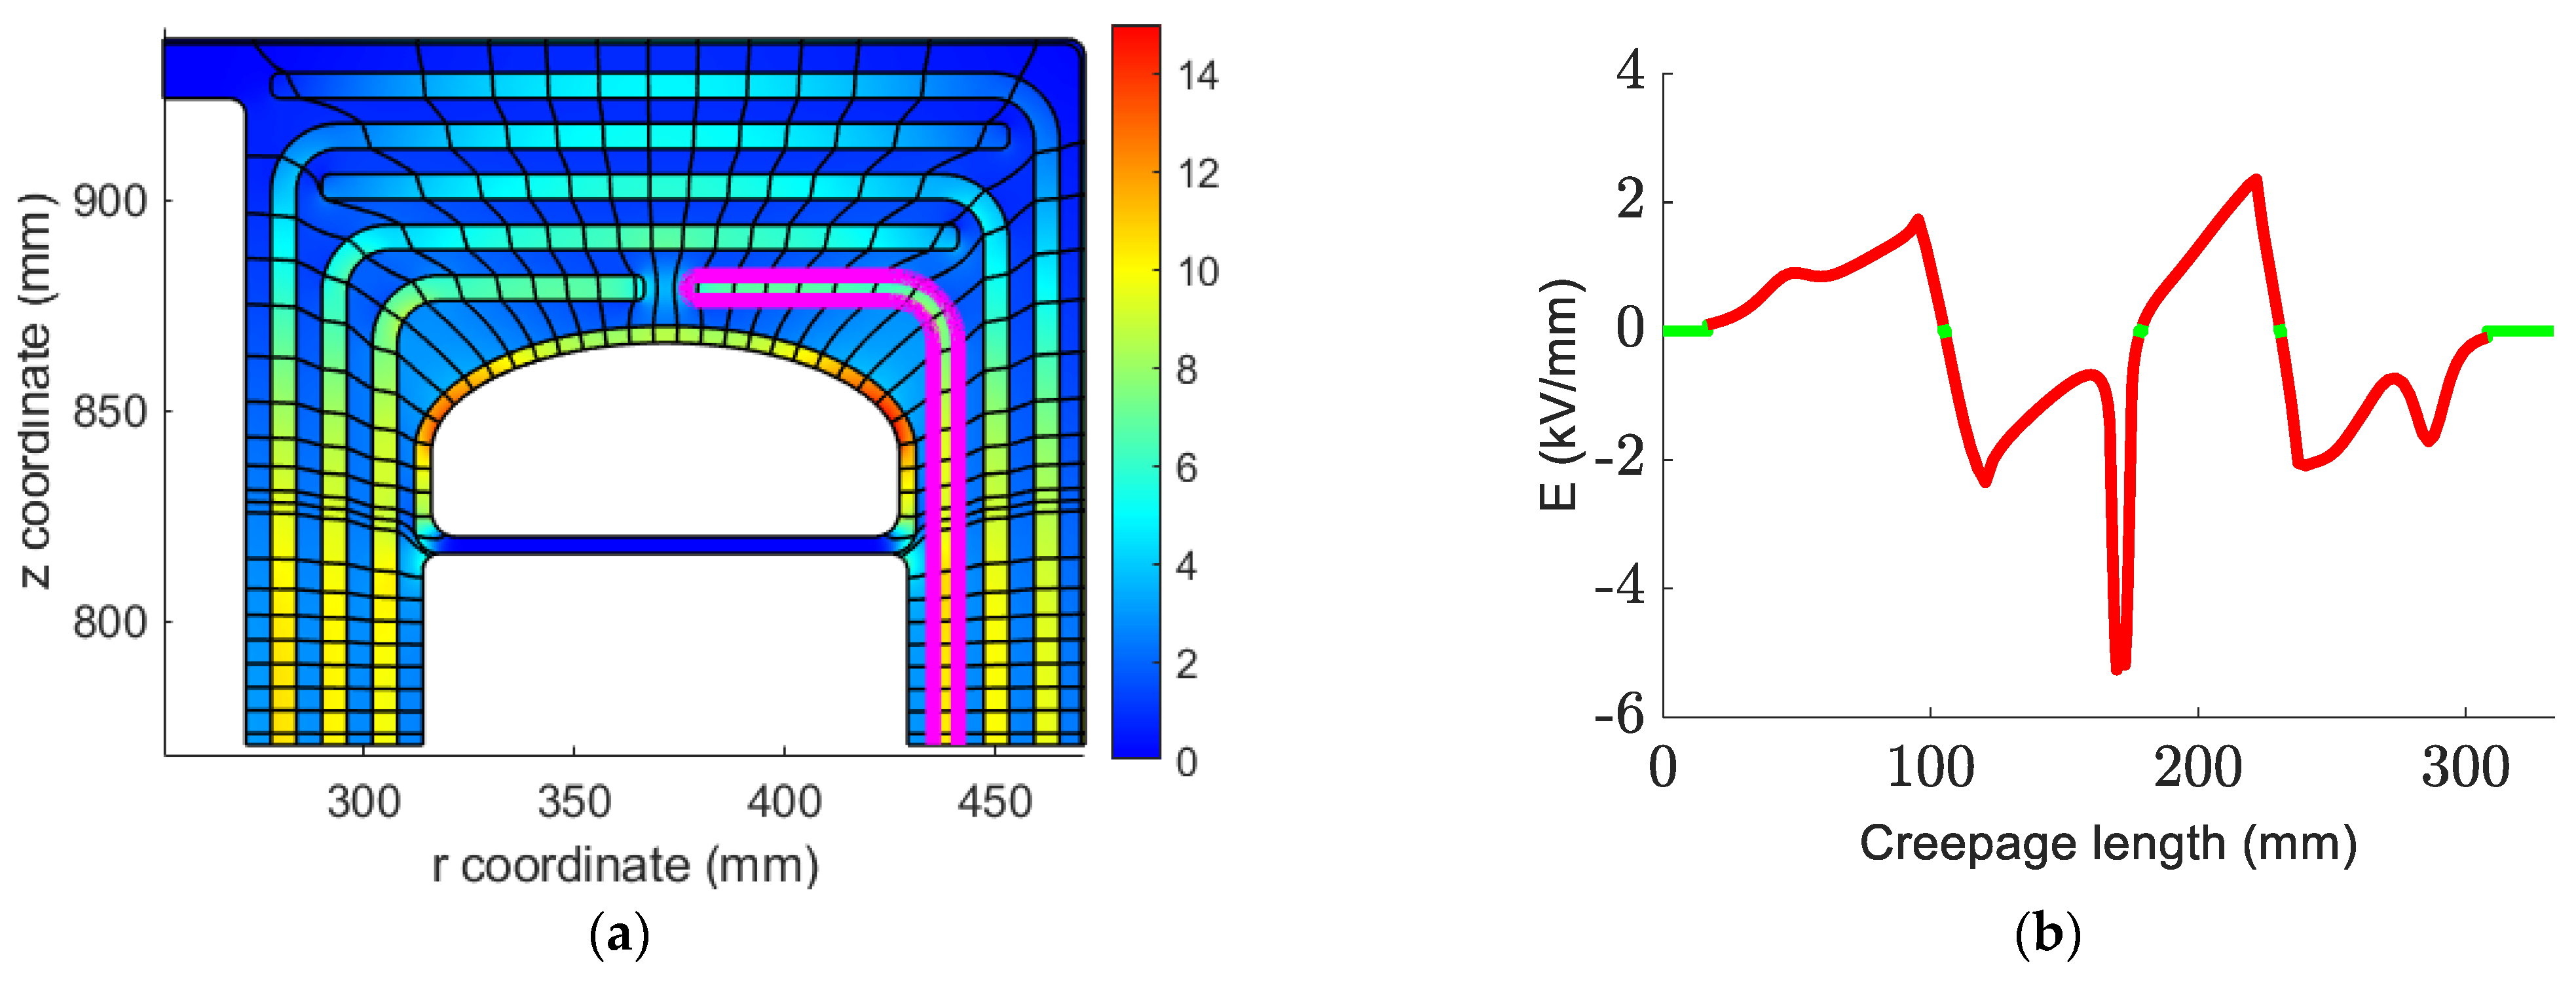
4.1. Initial Stress Distribution

Figure 7 demonstrates the initial distribution of the electric stress at the insulation system immediately after the application of 250 kV DC which is based on the Permittivity Ratio (PR) of the oil to OIP. The dielectric permittivity does not depend on temperature, and therefore, the initial distribution of the stresses is temperature independent. Since the permittivities of the oils are lower than the OIPs in both ester and mineral oils, the stresses in the oil channels are higher than in the OIP barriers. However, since the PR of the ester oil to ester OIP (3.5 to 4.6) is lower than the PR of the mineral oil to mineral OIP (2.2 to 4.4), for the case of ester oil, the initial stresses in OIPs is higher than in the case when mineral oil is used. As shown in Figure 7, the distribution of the streamlines is nearly the same for ester and mineral oils and the highest stresses in both cases are at the sides of the HV shields and in the oil. Moreover, as can be seen from the color bars, the maximum stress in the mineral oil is slightly higher than in ester oil.

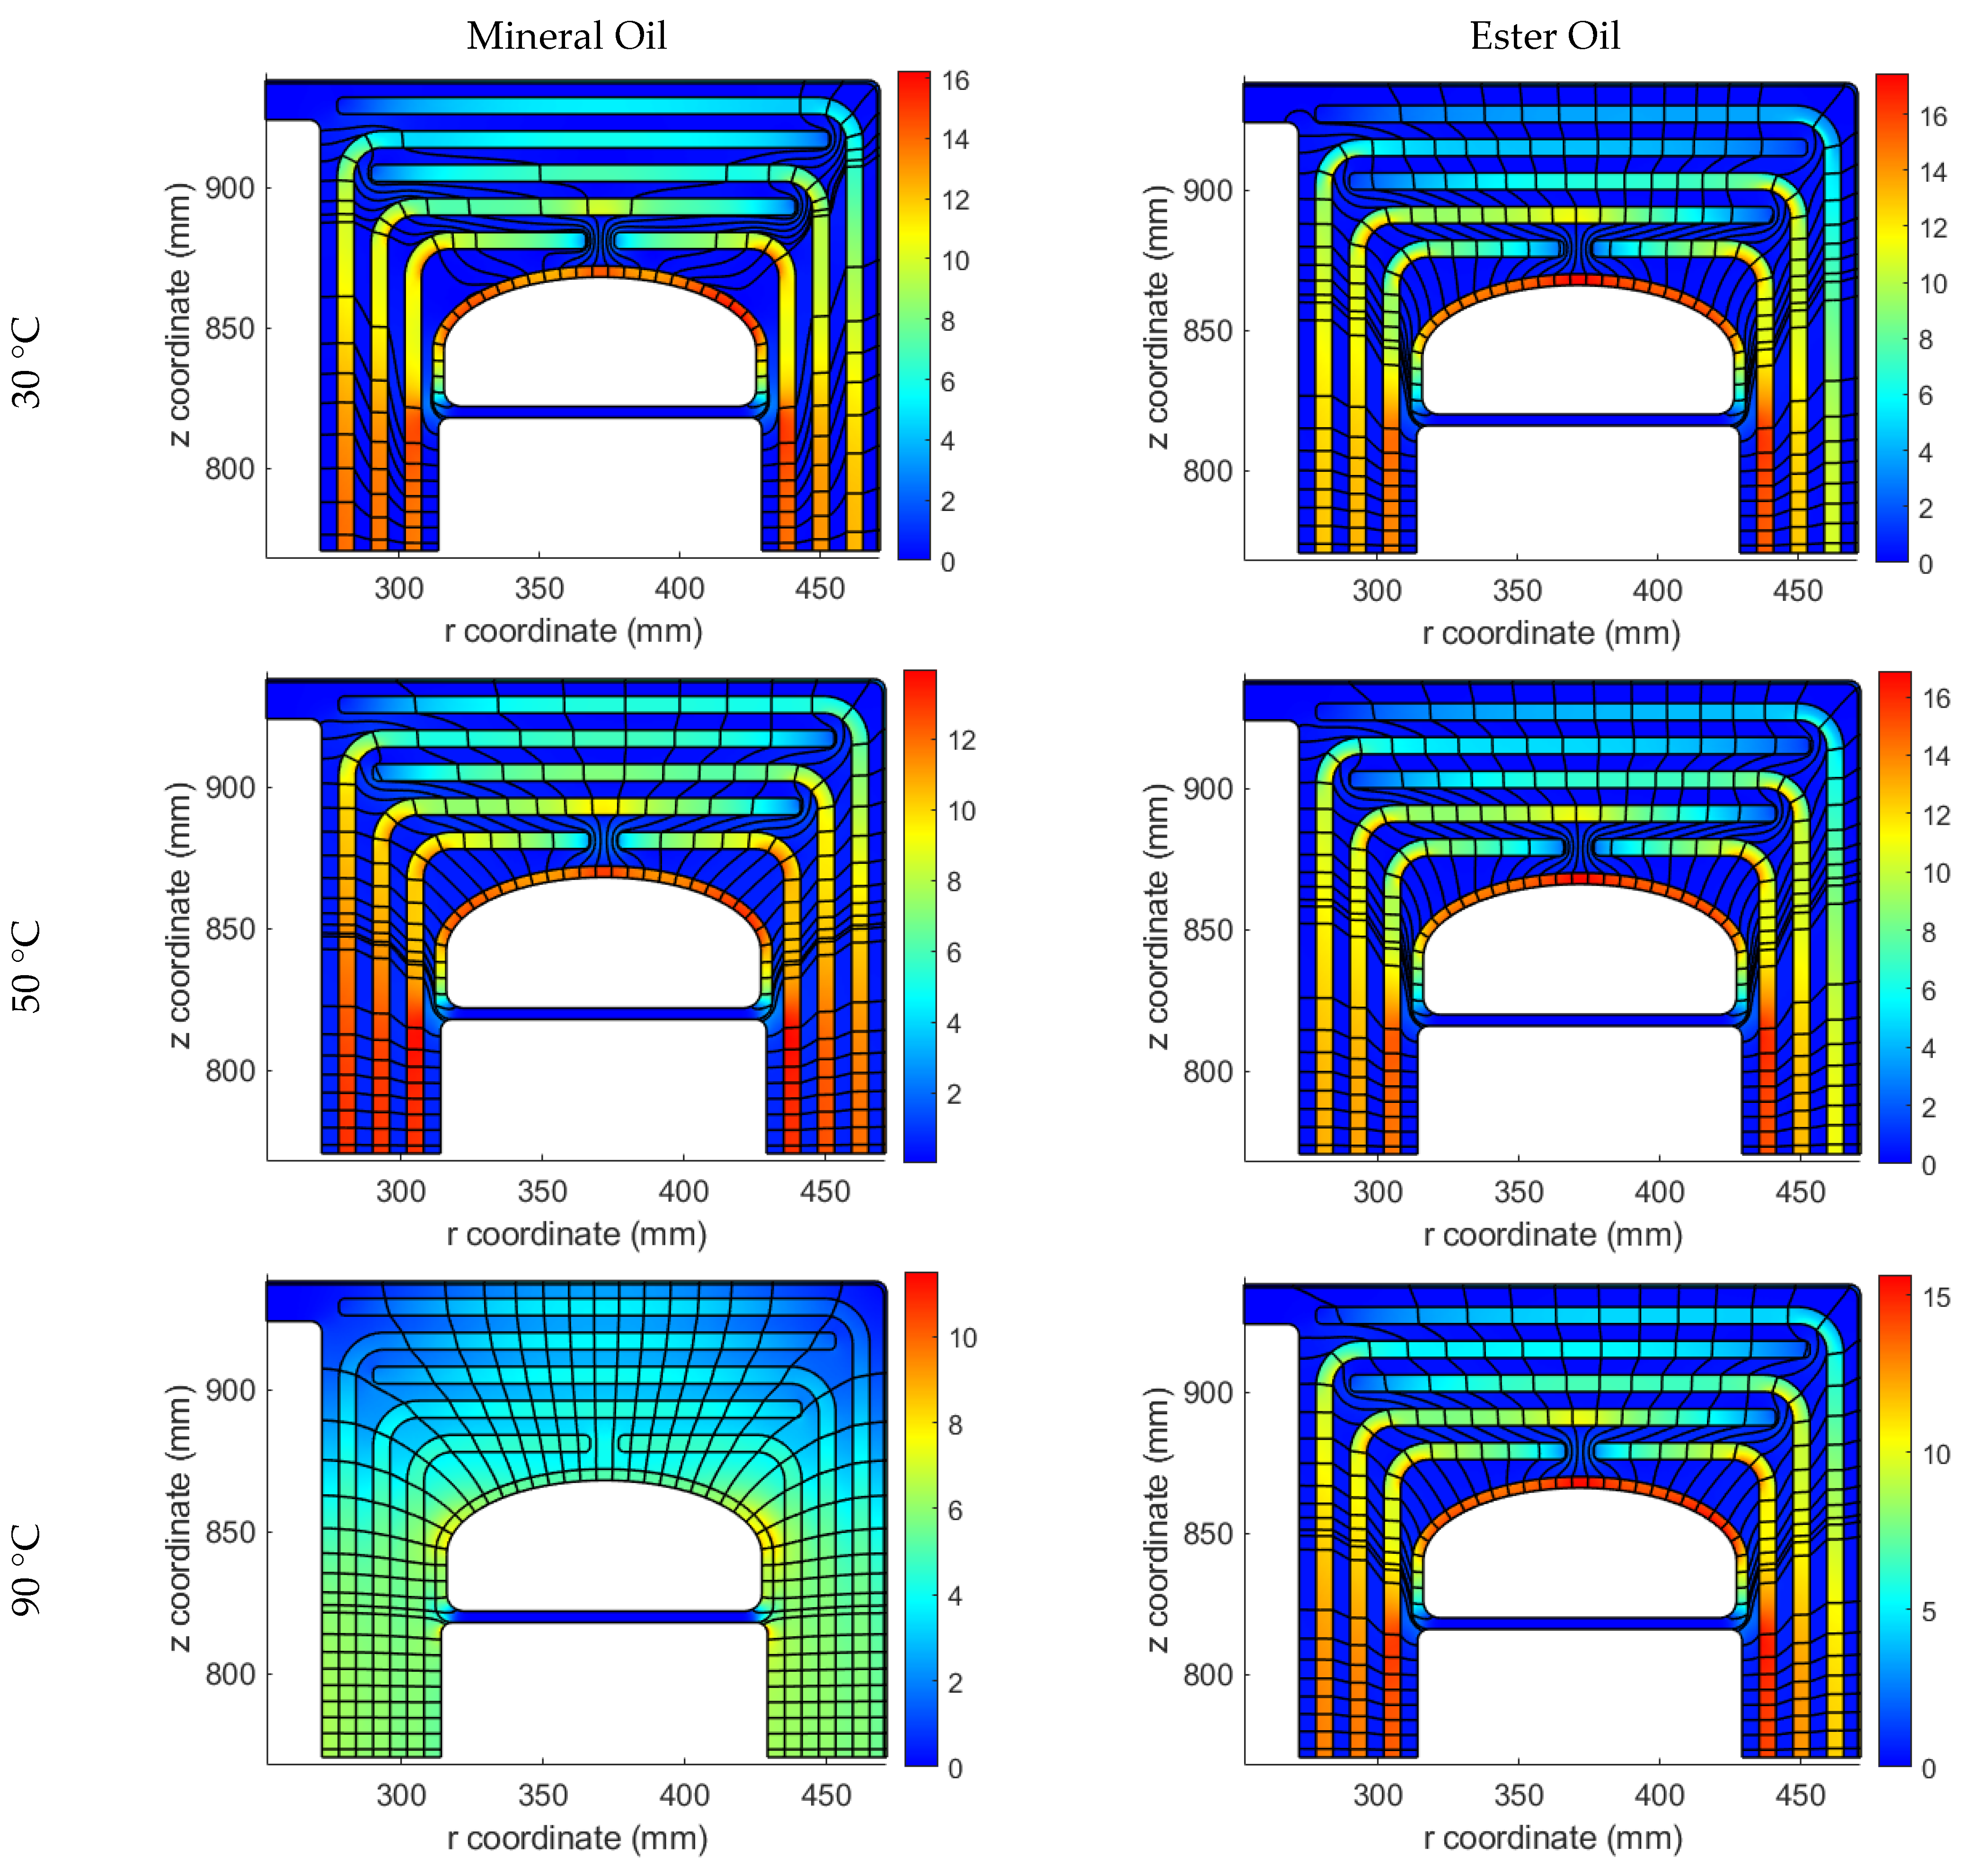
4.2. Final Stress Distribution

Figure 8 illustrates the final steady state stress distribution in the MFT insulation system by using both ester and mineral oils. It can be easily seen that they are temperature dependent due to the temperature dependence of the conductivity ratio (CR) of the oil to OIP. However, the temperature dependency of CR of the ester oil is weaker than of the mineral oil, and hence, higher consistency of stress distribution regarding the temperature variation of the operation condition can be observed in the case of ester oil usage.

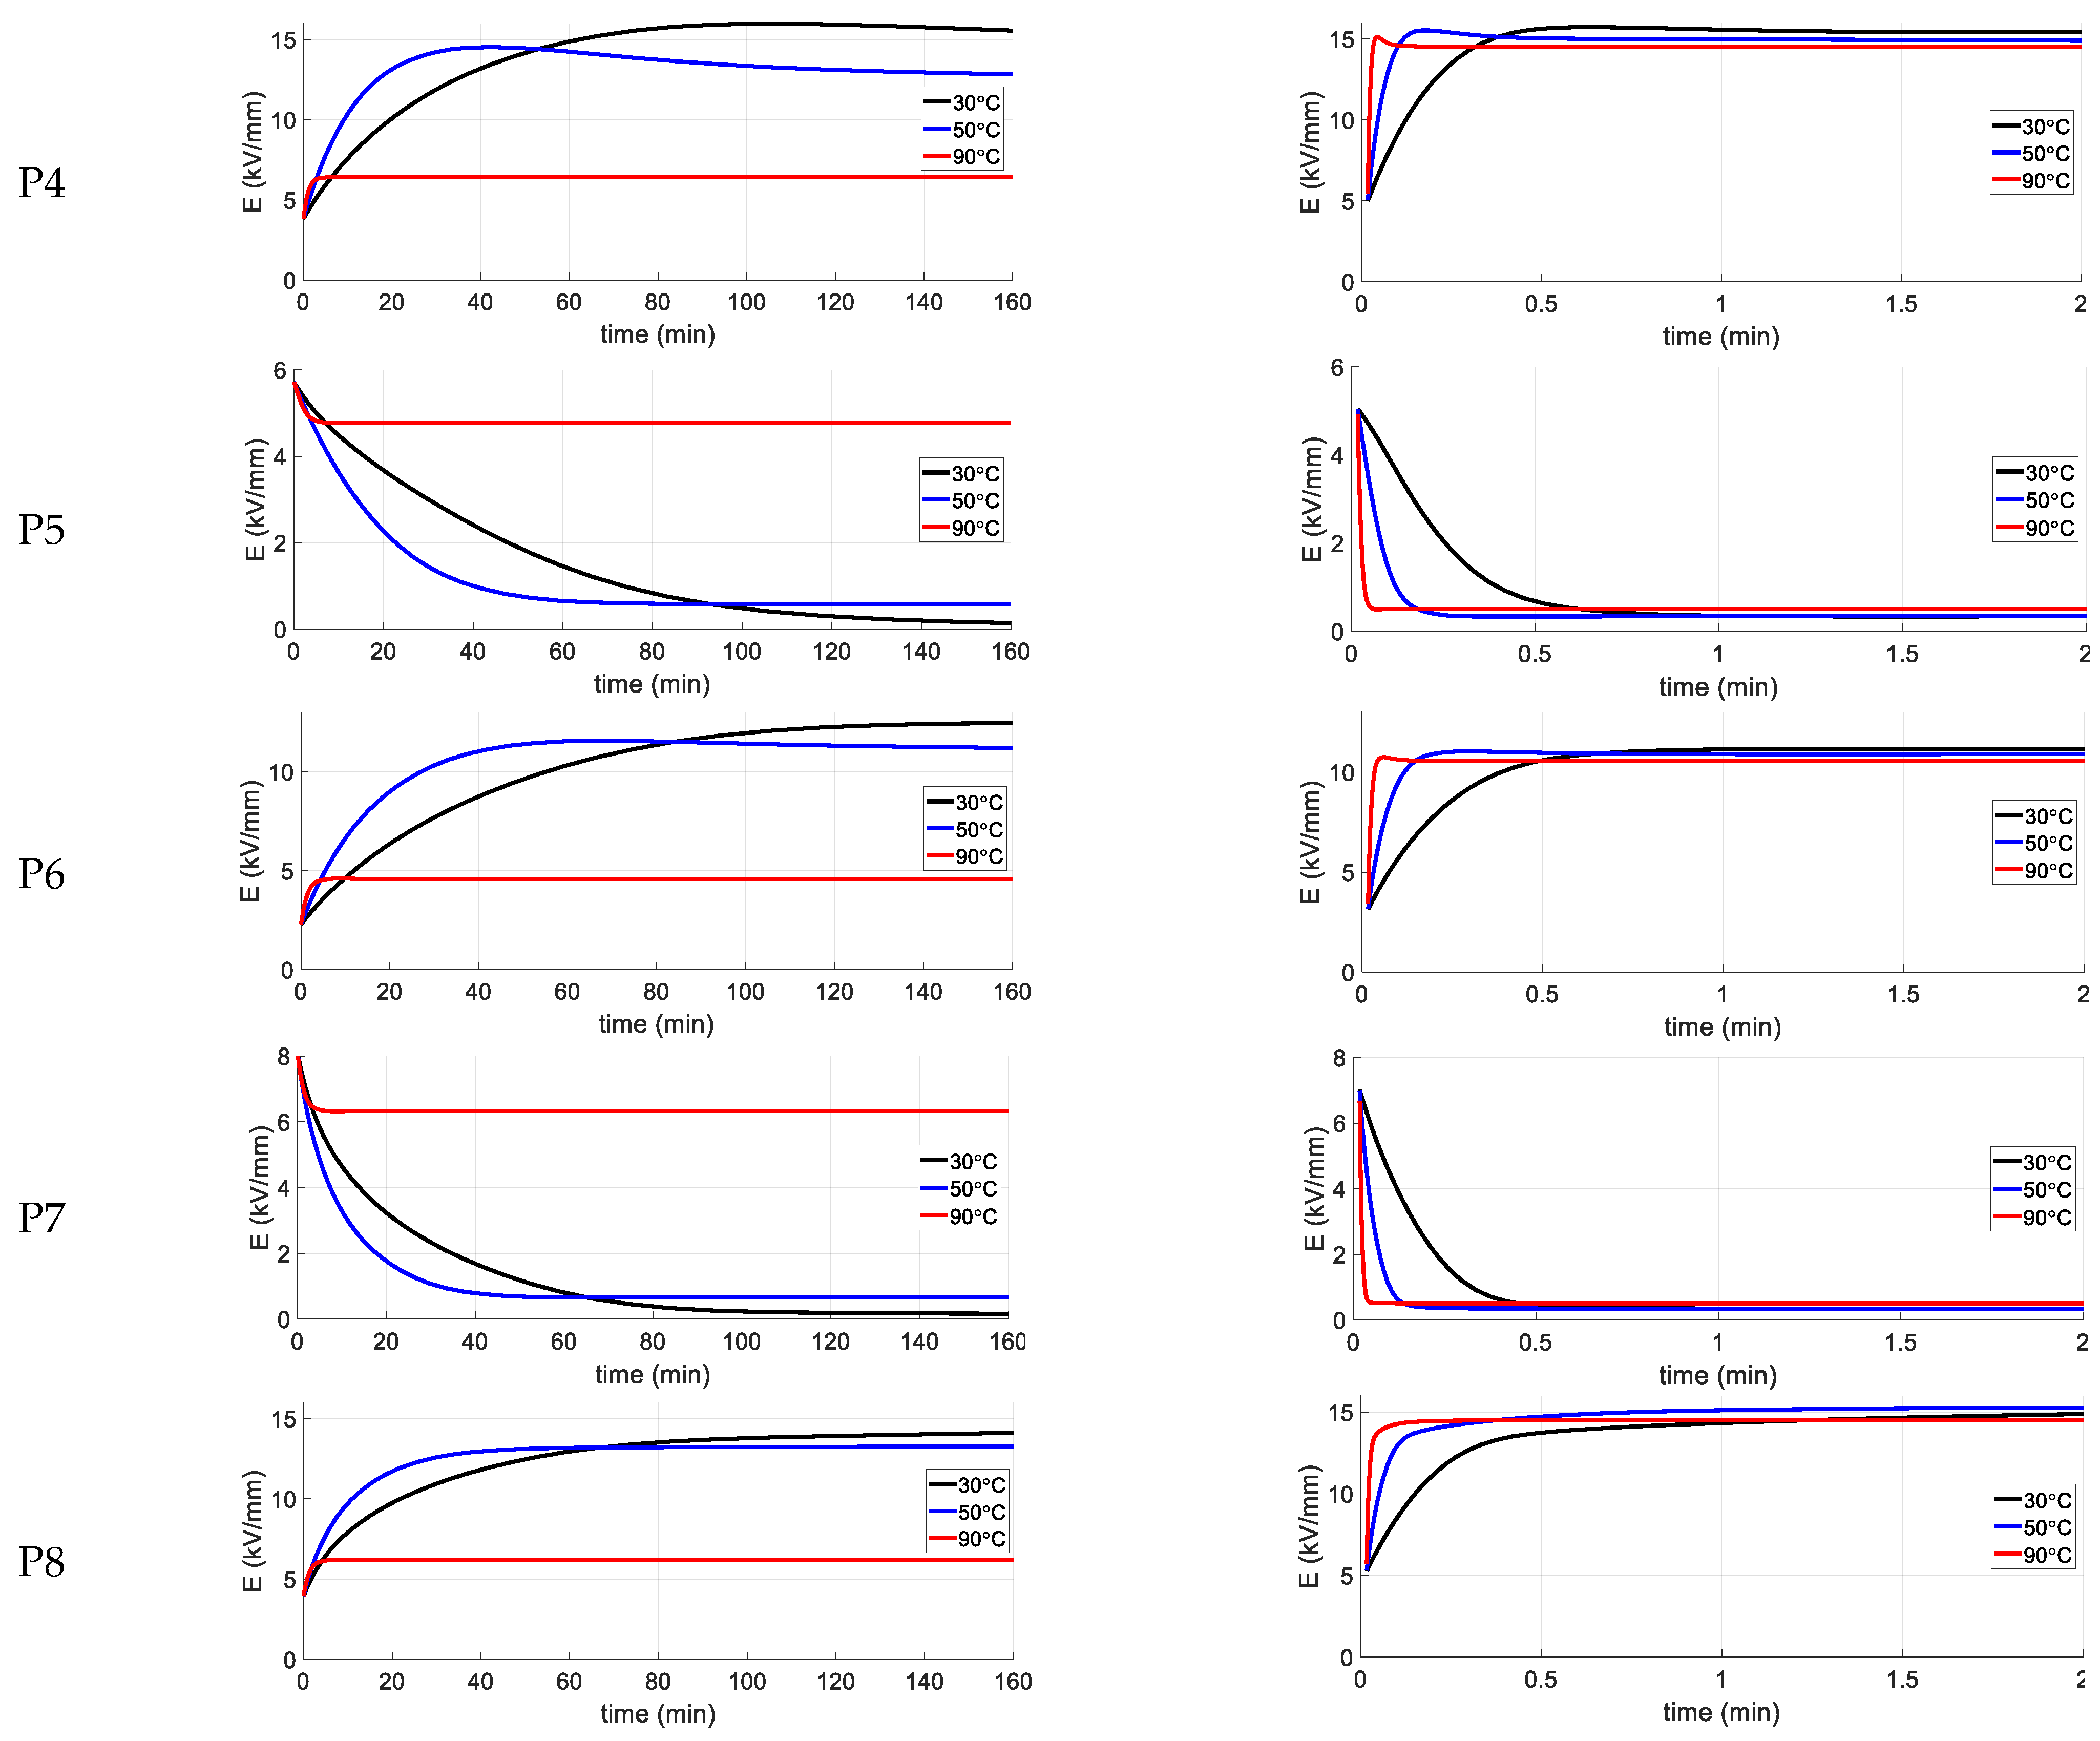
4.3. Transient Stress Distribution

The transient phase, which occurs between the initial and final states, may last for some hours. To investigate the time-dependent behavior of the stress in the dielectric structure of the MFT, seven various typical points were selected in this structure as shown in Figure 9. The points P1, P3, P4, P6 and P8 indicate the locations inside OIPs and the other remaining points are in the oil channels. The curves presenting time dependent stresses at these points are demonstrated for each temperature (30, 50 and 90 °C) in Figure 10. The time axis is plotted up to 160 min for mineral oil and 2 min for the ester oil. It can be noticed that the major differences caused by using ester and mineral oils are in the duration of the transient phase, the location of the maximum stresses, the final steady state distribution, and the effect of the temperature. As mentioned previously, the initial stress distribution immediately after the HVDC application depends on the PR of the oil to OIP, and therefore, using ester oil causes higher stresses in OIPs with respects to the mineral oil application. Moreover, using ester oil results in a shorter transient phase and faster transition to the steady state condition with respect to mineral oil. This is because of the lower time constants (the ratio of electrical conductivity to the permittivity of the insulation materials) when using the ester oil, which originates from its much higher conductivity with respect to the mineral oil. Additionally, an even faster transition can be observed at higher temperatures in both oils for the same reason.
For both oils, the stress in OIPs at the steady state is greater than their values at the initial state and the opposite is observed for stresses at oil gaps. Additionally, it can be noticed that the final steady state values for mineral oil at 90 °C differ considerably with respect to 30 and 50 °C, while this is not the case when using ester oil. This is caused by the fact that the CR of the oil to OIP has greater divergence with respect to the temperature in mineral oil than for ester oil, see Table 1 and Table 2. Moreover, at points P1, P4 and P6, it can be observed that that the local maximum stress can be higher than its initial and final values. This fact emphasizes that considering just the initial and final stress distribution is insufficient to obtain an accurate dielectric design evaluation, since the worst cases (in terms of stress in the dielectrics) may occur during the transient phase.

4.4. Dielctirc Design Evaluation

Here, the dielectric design of the real scale MFT with application of ester oil/OIP is evaluated and investigated from the dielectric withstand viewpoint, and then the design is compared with mineral oil/OIP application. To evaluate the dielectric design automatically, COMSOL Live Link with MATLAB was utilized to identify the minimum safety factors in the oil gaps and creepage surfaces and maximum stress in the OIPs at various temperatures and for all the time steps. At every single time step of each time dependent FEM simulation, the maximum stress in OIPs as well as the minimum safety factors in oil gap paths, creepage paths and combined paths were investigated.

4.4.1. The Maximum Stress in OIP

The OIPs bear a definite maximum permissible electric stress, below which they can work safely. This maximum stress is usually determined by experiments and is typically about 20 kVrms/mm according to [25]. Therefore, the maximum stress in the OIPs must be checked to be less than this value. For each streamline path of a FEM simulation and at each time step, the OIP path sections are extracted. The maximum electric field at all points of these sections are evaluated as a measure of the severity of the stress in OIPs. This procedure is illustrated in Figure 11.

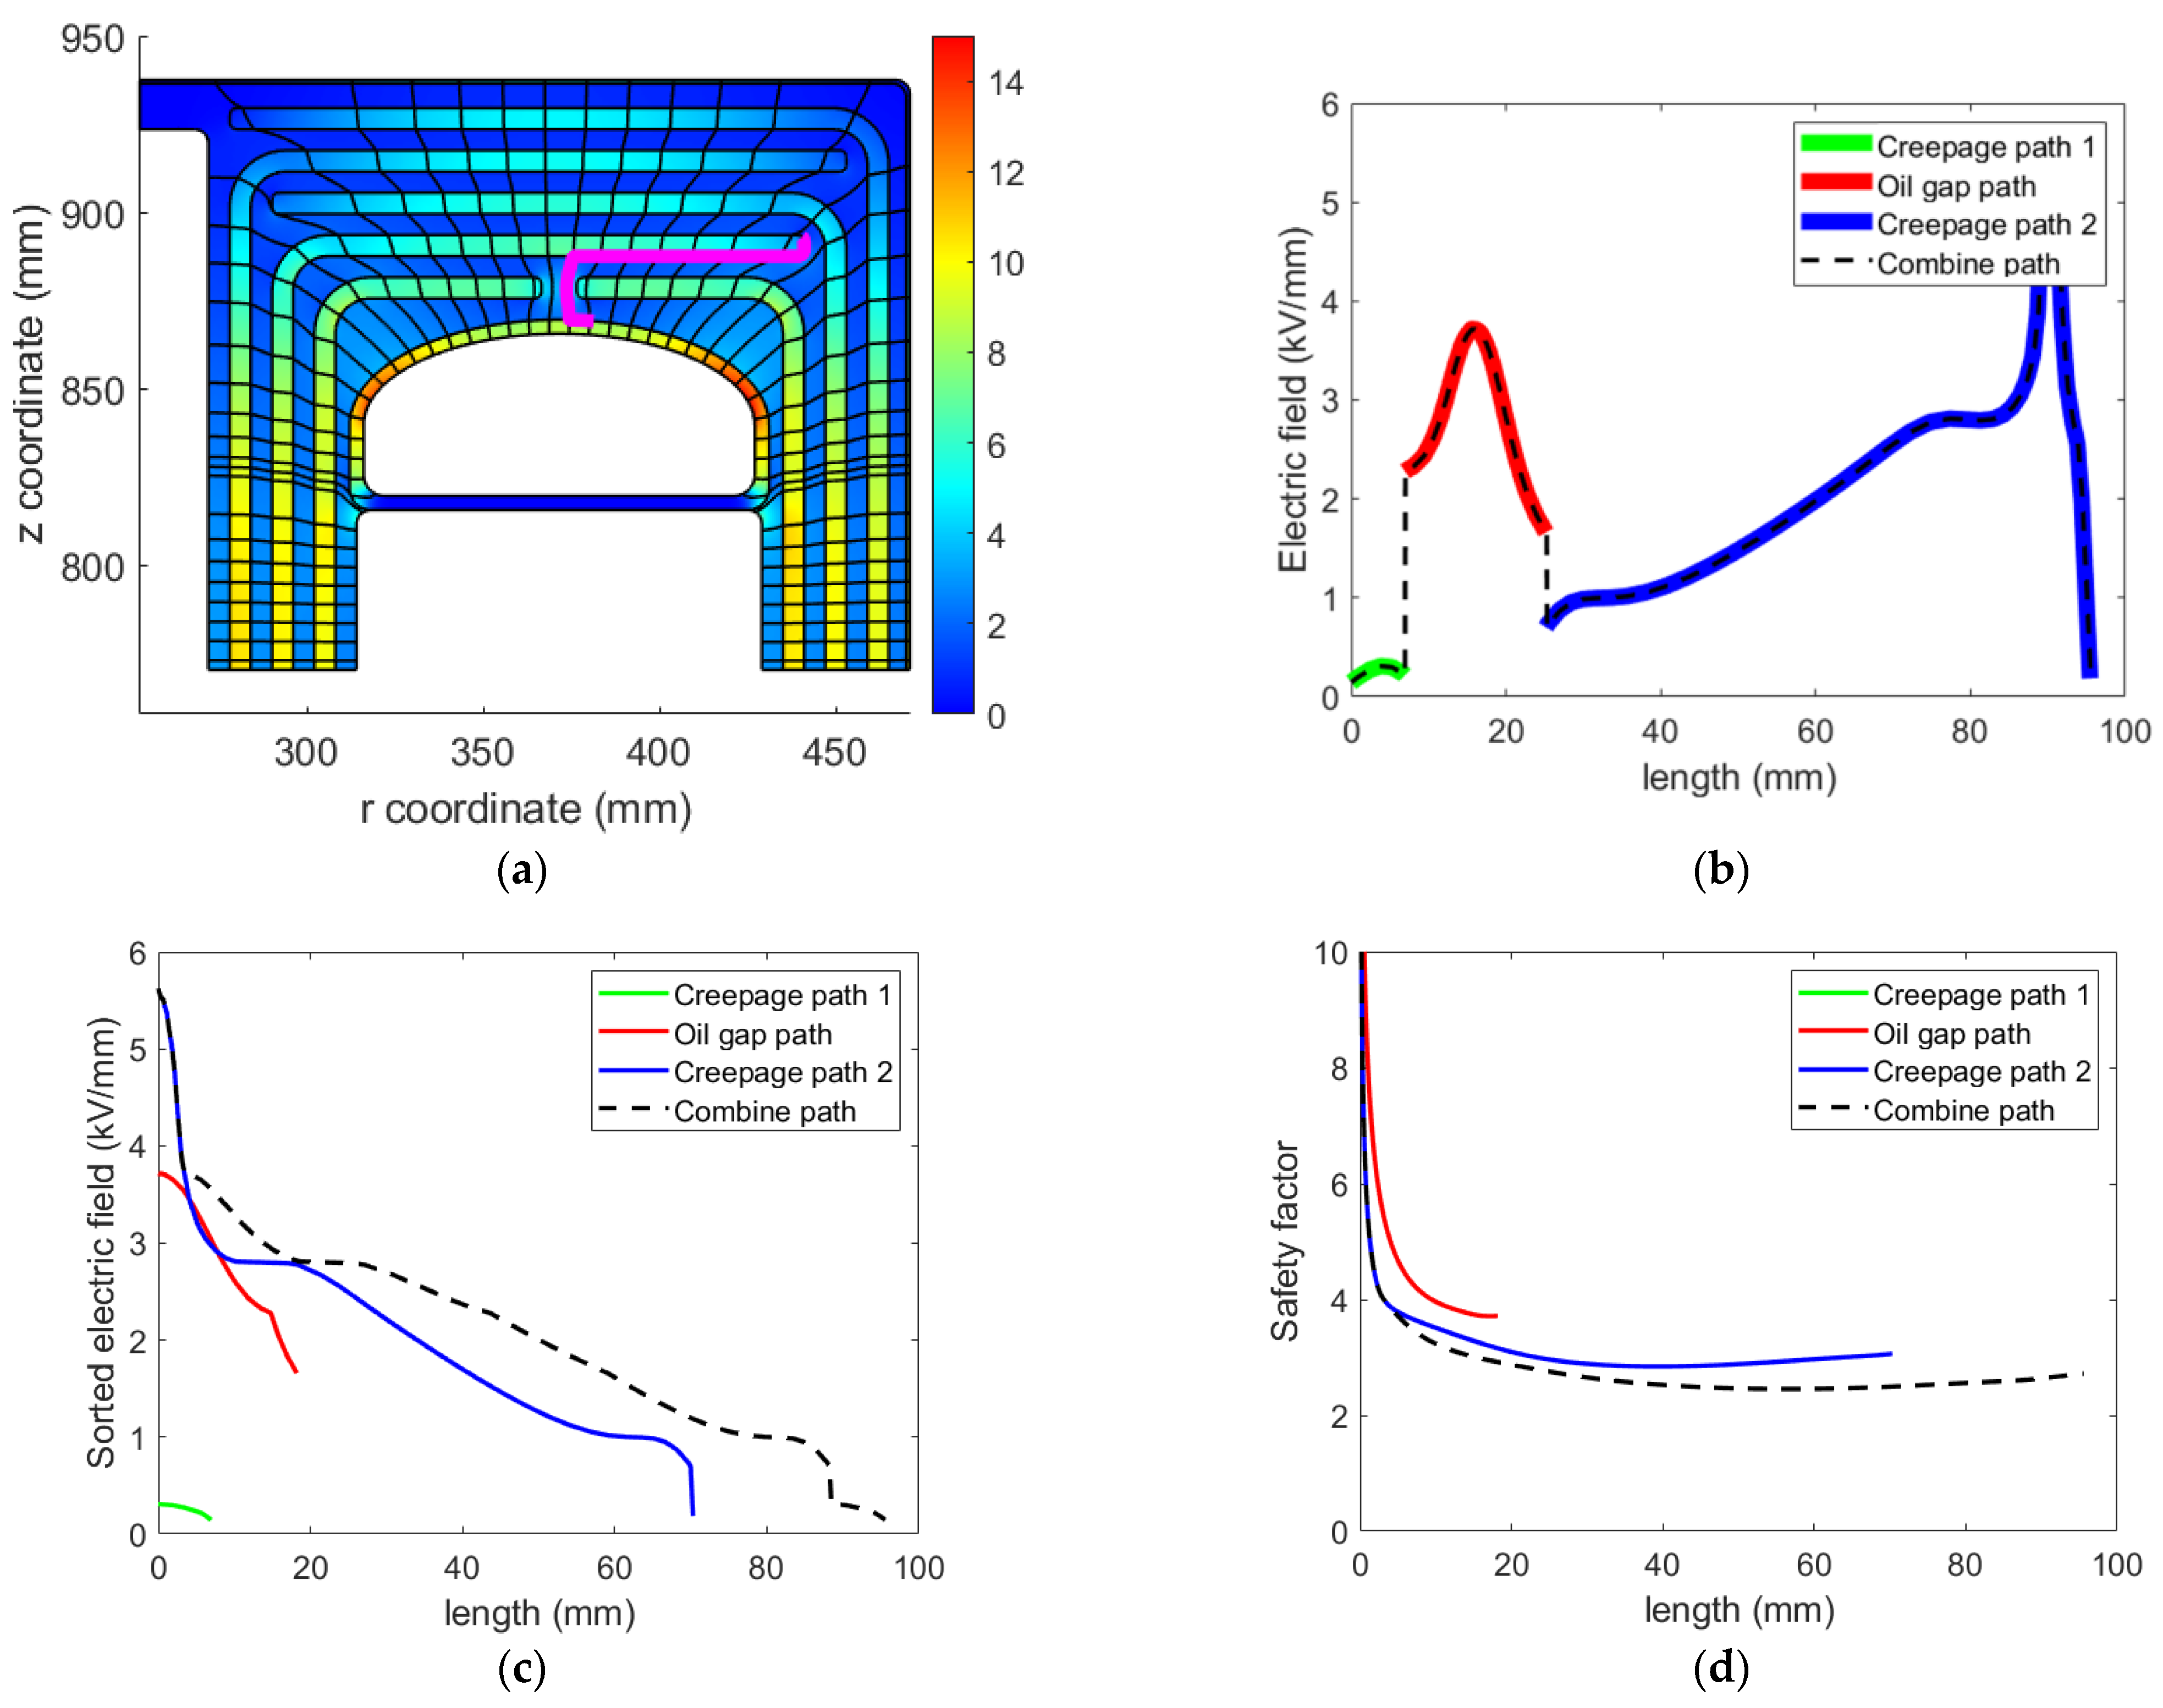
4.4.2. The Safety Factors in Oil Gaps

Similarly, for each streamline path of the FEM simulation at each time step, the oil gap path sections are extracted (Figure 11), and then, the minimum safety factor (SF) for each path is calculated using the method described in [5,25]. To obtain the SF for each oil gap path, the electric field curve along this path is extracted and rearranged in a descending order. Then, the cumulative stress curve, Eav, is obtained as follows [5,25]:
E a v = 1 z 0 z E ( z ) . d z
where E is the rearranged electric field stress curve in kV/mm in the oil gap and z is the length of the oil gap in mm. Then the safety factor curve of the oil gap is calculated by dividing the cumulative stress curve to the breakdown strength curve of the oil (Ebd) [5,25]:
SF = E bd E av
E bd = E 0 d 0.37
where E0 is 17.5 or 21.5 kVrms/mm for bare and covered electrodes, respectively, for mineral oil application, and d is distance in mm. The safety factor of an oil gap is considered as the minimum value of the related safety factor curve. It is worth mentioning that the partial discharge inception voltage and breakdown voltages of synthetic ester oil is slightly higher than mineral oil [37], and therefore, (5) is assumed to be valid for ester oil with a safer margin.

4.4.3. The Safety Factors in Creepage Surfaces

The common surfaces of the oils and OIPs are disposed to creepage discharges created by the tangential field. According to [5,25], the withstand level of such creepage surfaces can be considered as 0.7 of the oil gaps withstand level. To investigate the creepage strength of the design, the tangential electric field on the creepage surface of each barrier is extracted. Then, its related curve along the surface path is divided into multiple sections at places where its value falls below 0.2 kV/mm [26] or its direction changes (Figure 12). Afterwards, the SF of each creepage path sections is calculated using a procedure like the one discussed for oil gaps; however, the factor 0.7 is introduced to account for the weakening of the strength at the surface due to possible creepage:
SF = 0.7 E bd E av
As a replacement to (6), one can consider the same breakdown voltage for both oil gap and creepage paths, and instead, the Eav stress curve shall be divided by 0.7, giving:
SF = E bd E av / 0.7

4.4.4. The Safety Factors in the Combined Oil Gaps and Creepage Surfaces

It is known that electrical discharges can be initiated in oil gaps and then continue their path on the creepage surfaces. Additionally, the breakdown in the oil gaps and creepage surfaces along the oil gaps may be considered to have a similar mechanism. Therefore, the oil gap strength and creepage strength cannot be assumed to be completely independent. Thus, it is reasonable to calculate the safety factors in combined oil gaps and creepage paths. To explain the case, consider a section of a streamline in an oil gap that is confined between two barriers as shown in Figure 13. This streamline can be extended from two ends on the barriers, in the same direction of the tangential electric field on both surfaces. These protractions would be extended along the barriers until the tangential electric field on the surface falls below 0.2 kV/mm or its direction changes. The stress curve on this path is obtained by the stress curve for an oil gap path combined with the tangential stress curves at both creepage paths. As shown in (7), the stress curves of creepage paths shall be divided by factor 0.7 before combination with the stress curve of the oil gap.
Considering this procedure, one can perceive that the minimum SF of a combined path must be equal (in a good dielectric design) or less than to the minimum SF of its related oil gap path and the minimum SFs of the related two creepage paths. One can consider the combined path, which is illustrated in Figure 14a by a pink line, which is composed by two creepage paths connected to the two ends of an oil gap path. The stress curves along this combined path as well as on its forming sections in the oil gap and on creepage surface are shown in Figure 14b. The sorted electric field stress curves (E curve from (3)) of the mentioned paths are depicted in Figure 14c. Since the E curves of oil path and creepage paths are the rearranged form of their stress curves in descending order, the maximum of stresses in each of these paths could be adhered together in the E curve of the combined path. Therefore, it can be clearly seen that the E curve of the combined path is greater than the E curves of the oil gap and creepage paths. Consequently, the Eav curve of the combined path will be higher compared to that of the oil gap and creepage paths. Consequently, according to (4), this can lead to a lower minimum SF for combined path with respect to the SFs of its forming oil gap and creepage paths (Figure 14d).

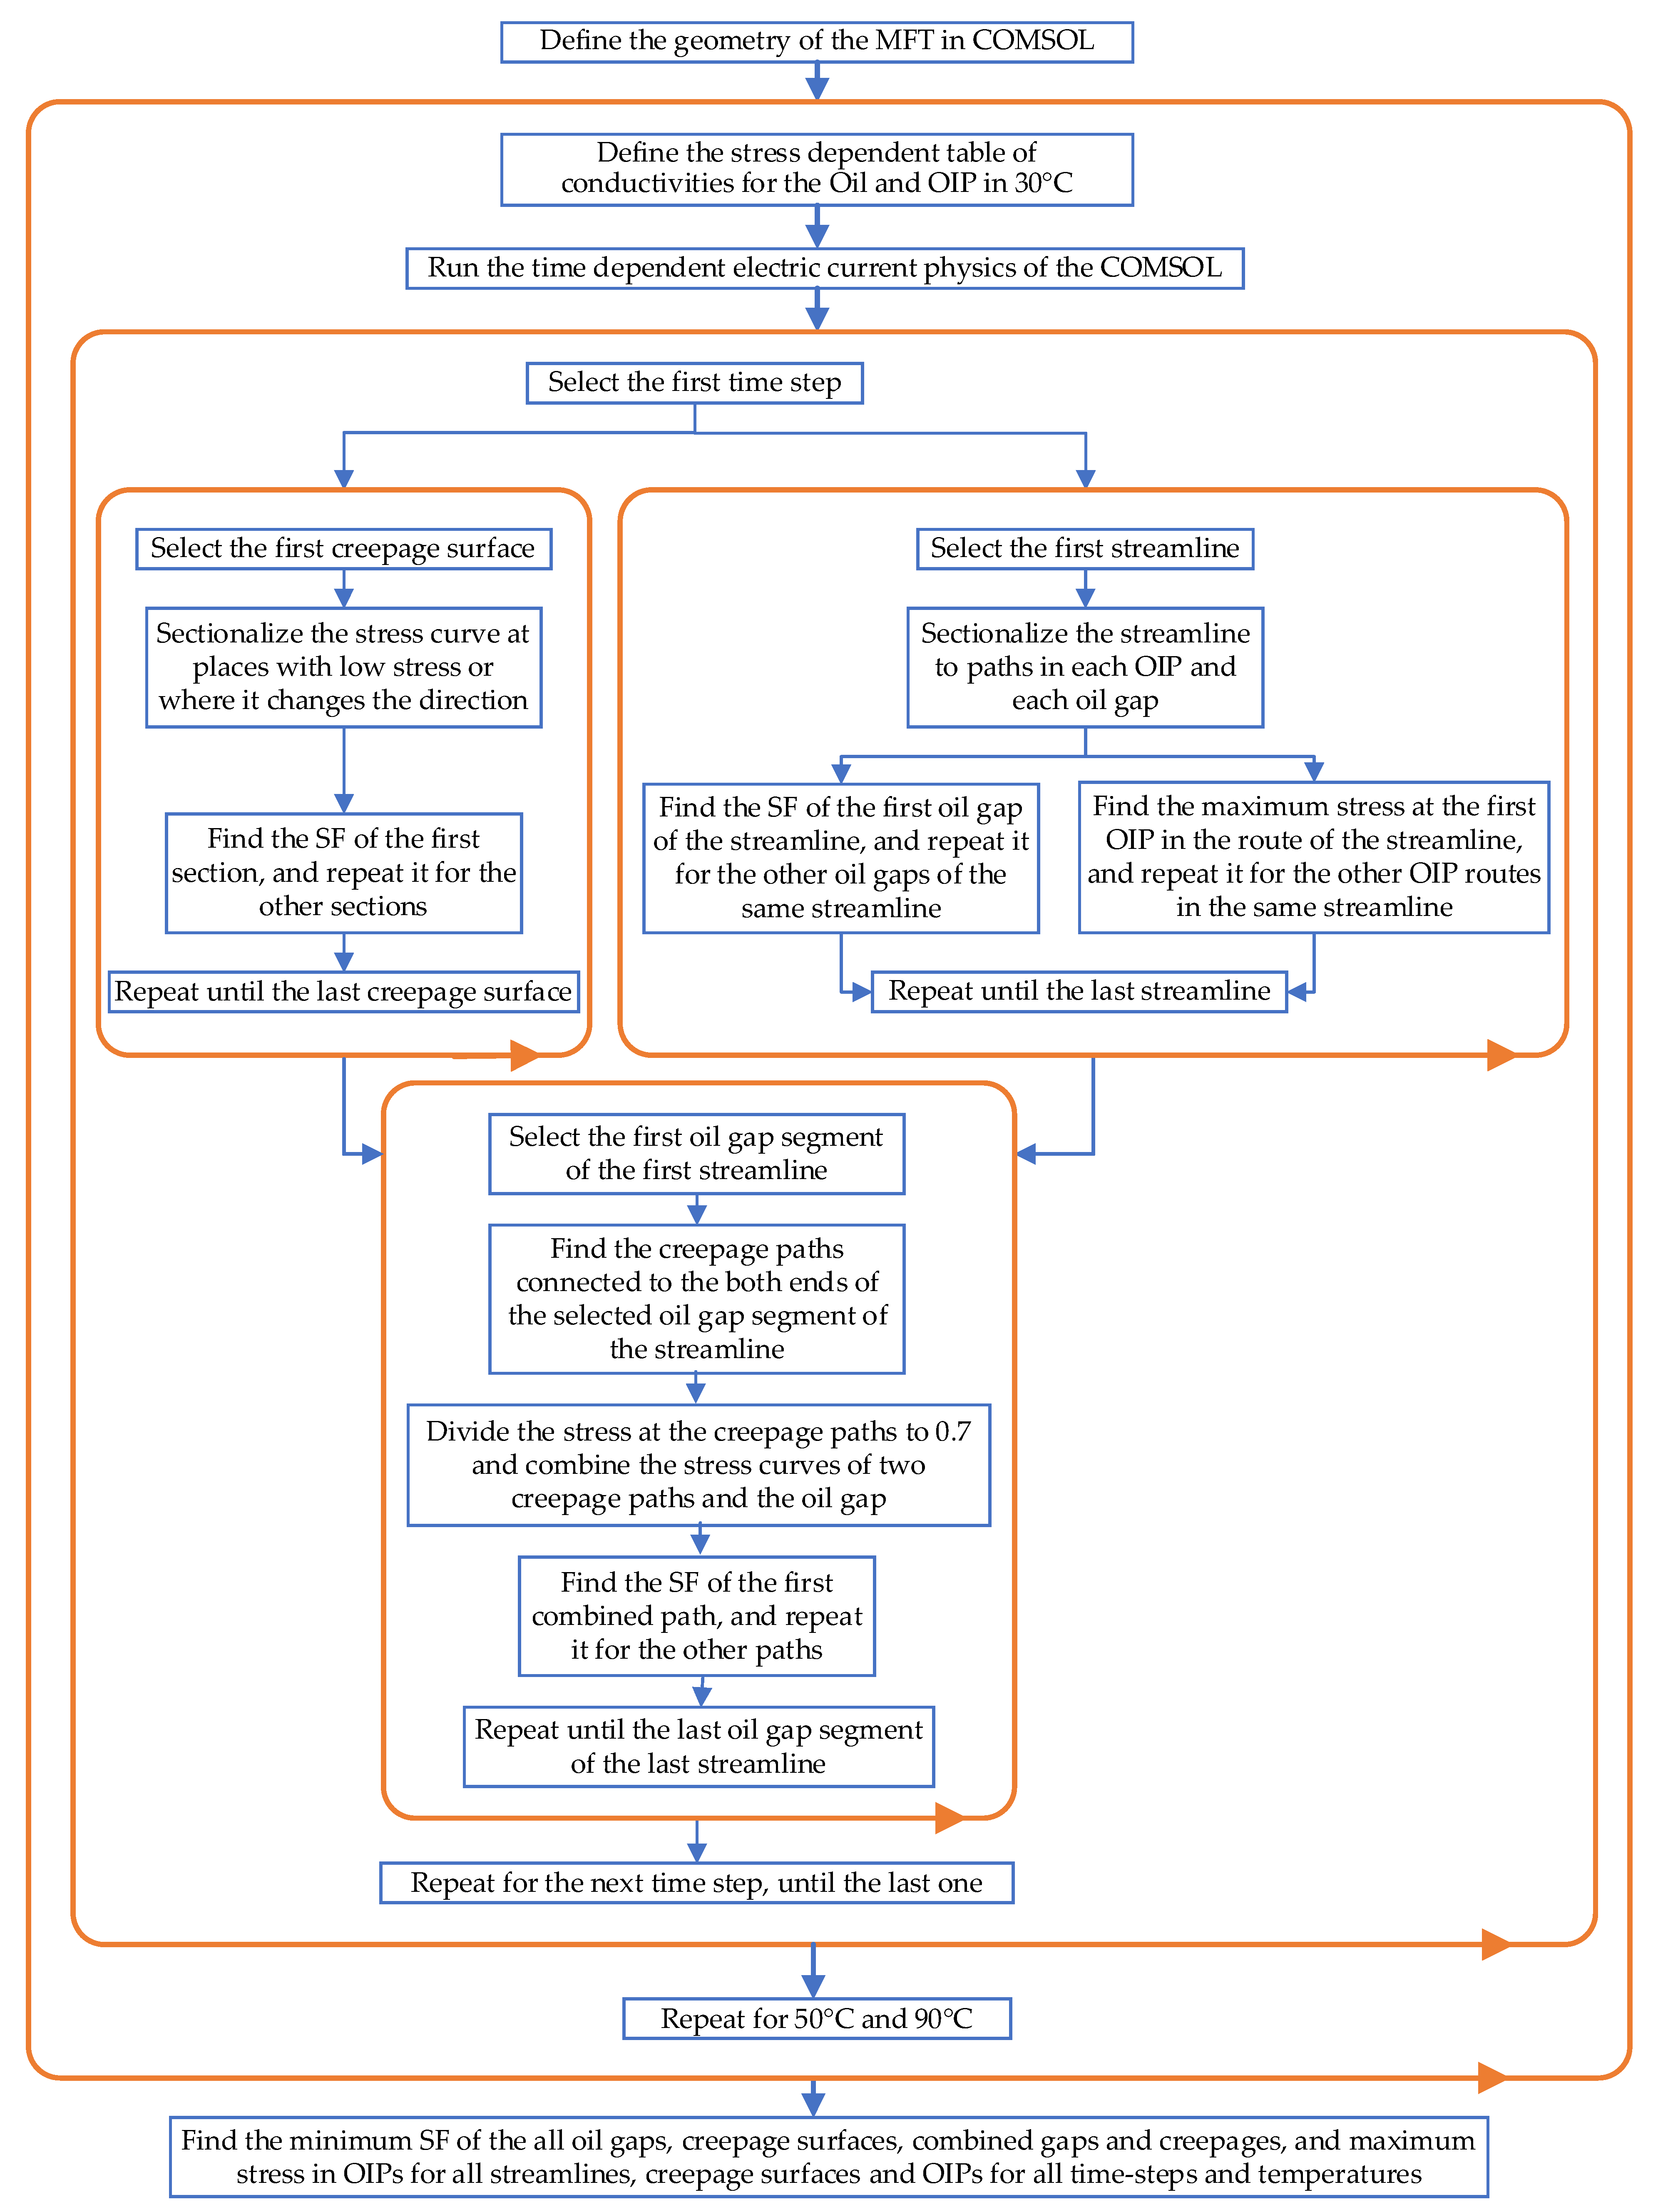
4.4.5. The Automatic Dielectric Evaluation

The above-mentioned procedure for the evaluation of the dielectric strength is implemented to be run automatically in MATLAB using COMSOL Live Link and is clarified in the flowchart in Figure 15. The final results from this automatic evaluation for ester and mineral oils at all time steps and all temperatures (30, 50 and 90 °C) are summarized in Table 3.
It can be seen in Table 3 that the maximum stresses in OIPs and minimum SFs in creepage paths occur not in the initial state nor in the final state, but rather in the transient phase. This fact again emphasizes the importance of the time dependent analysis of stresses in the dielectrics. The minimum SFs in the oil gaps happen right after the HVDC switching. The same is valid for the combined paths.
As was mentioned previously, the minimum SF of the combined paths will be equal or less than the minimum of the SFs of the oil gap paths and the SFs of a creepage paths. In Table 3, by comparing the minimum SFs of the oil gap paths, the creepage paths and combined paths and the time of their occurrences, it can be concluded that the SFs of the combined paths are generally determined by the oil gaps in the dielectric design of the real scale MFT. However, just in one of the simulations, using ester oil at 90 °C, the minimum SF of the combined path (1.7) is slightly lower than the SF of the oil gap paths (1.8).
Regarding the maximum stress in OIPs, it can be seen that by using ester oil instead of mineral oil, a slightly higher stress at 30 and 50 °C occurs. But at 90 °C, the maximum stress in mineral OIP is not much lower than that of ester OIP, even much lower than mineral OIP at 30 and 50 °C. Therefore, this issue cannot be considered as a superiority for mineral oil application.
As the final deduction from Table 3, it can be indicated that the SFs of all oil gaps, creepage paths as well as the combined paths at all temperatures and time steps are far higher than 1 and the maximum stresses in OIPs are less than 20 kV/mm. Therefore, the merit of the dielectric design of the provided MFT using the biodegradable ester oil can be verified. Additionally, the minimum SFs of all oil gaps, creepage paths and nearly all combined paths by using ester oil are higher than the case when the mineral oil is used. In addition, the maximum stress at all temperatures and all time-steps in the case of ester oil (17.7 kV/mm) is only slightly higher than the mineral oil application (17.5 kV/mm). Therefore, from the viewpoint of the dielectric withstand level, there is no restriction for using ester oil instead of mineral oil.

5. Discussion

The results of the measurements and the analysis of the electric stresses in the insulation system reveal:
  • The measured conductivity of the oil/OIP insulation materials are temperature and electric stress dependent. This fact is considered in the FEM simulations adopted for finding the insulation withstand level of the transformer design.
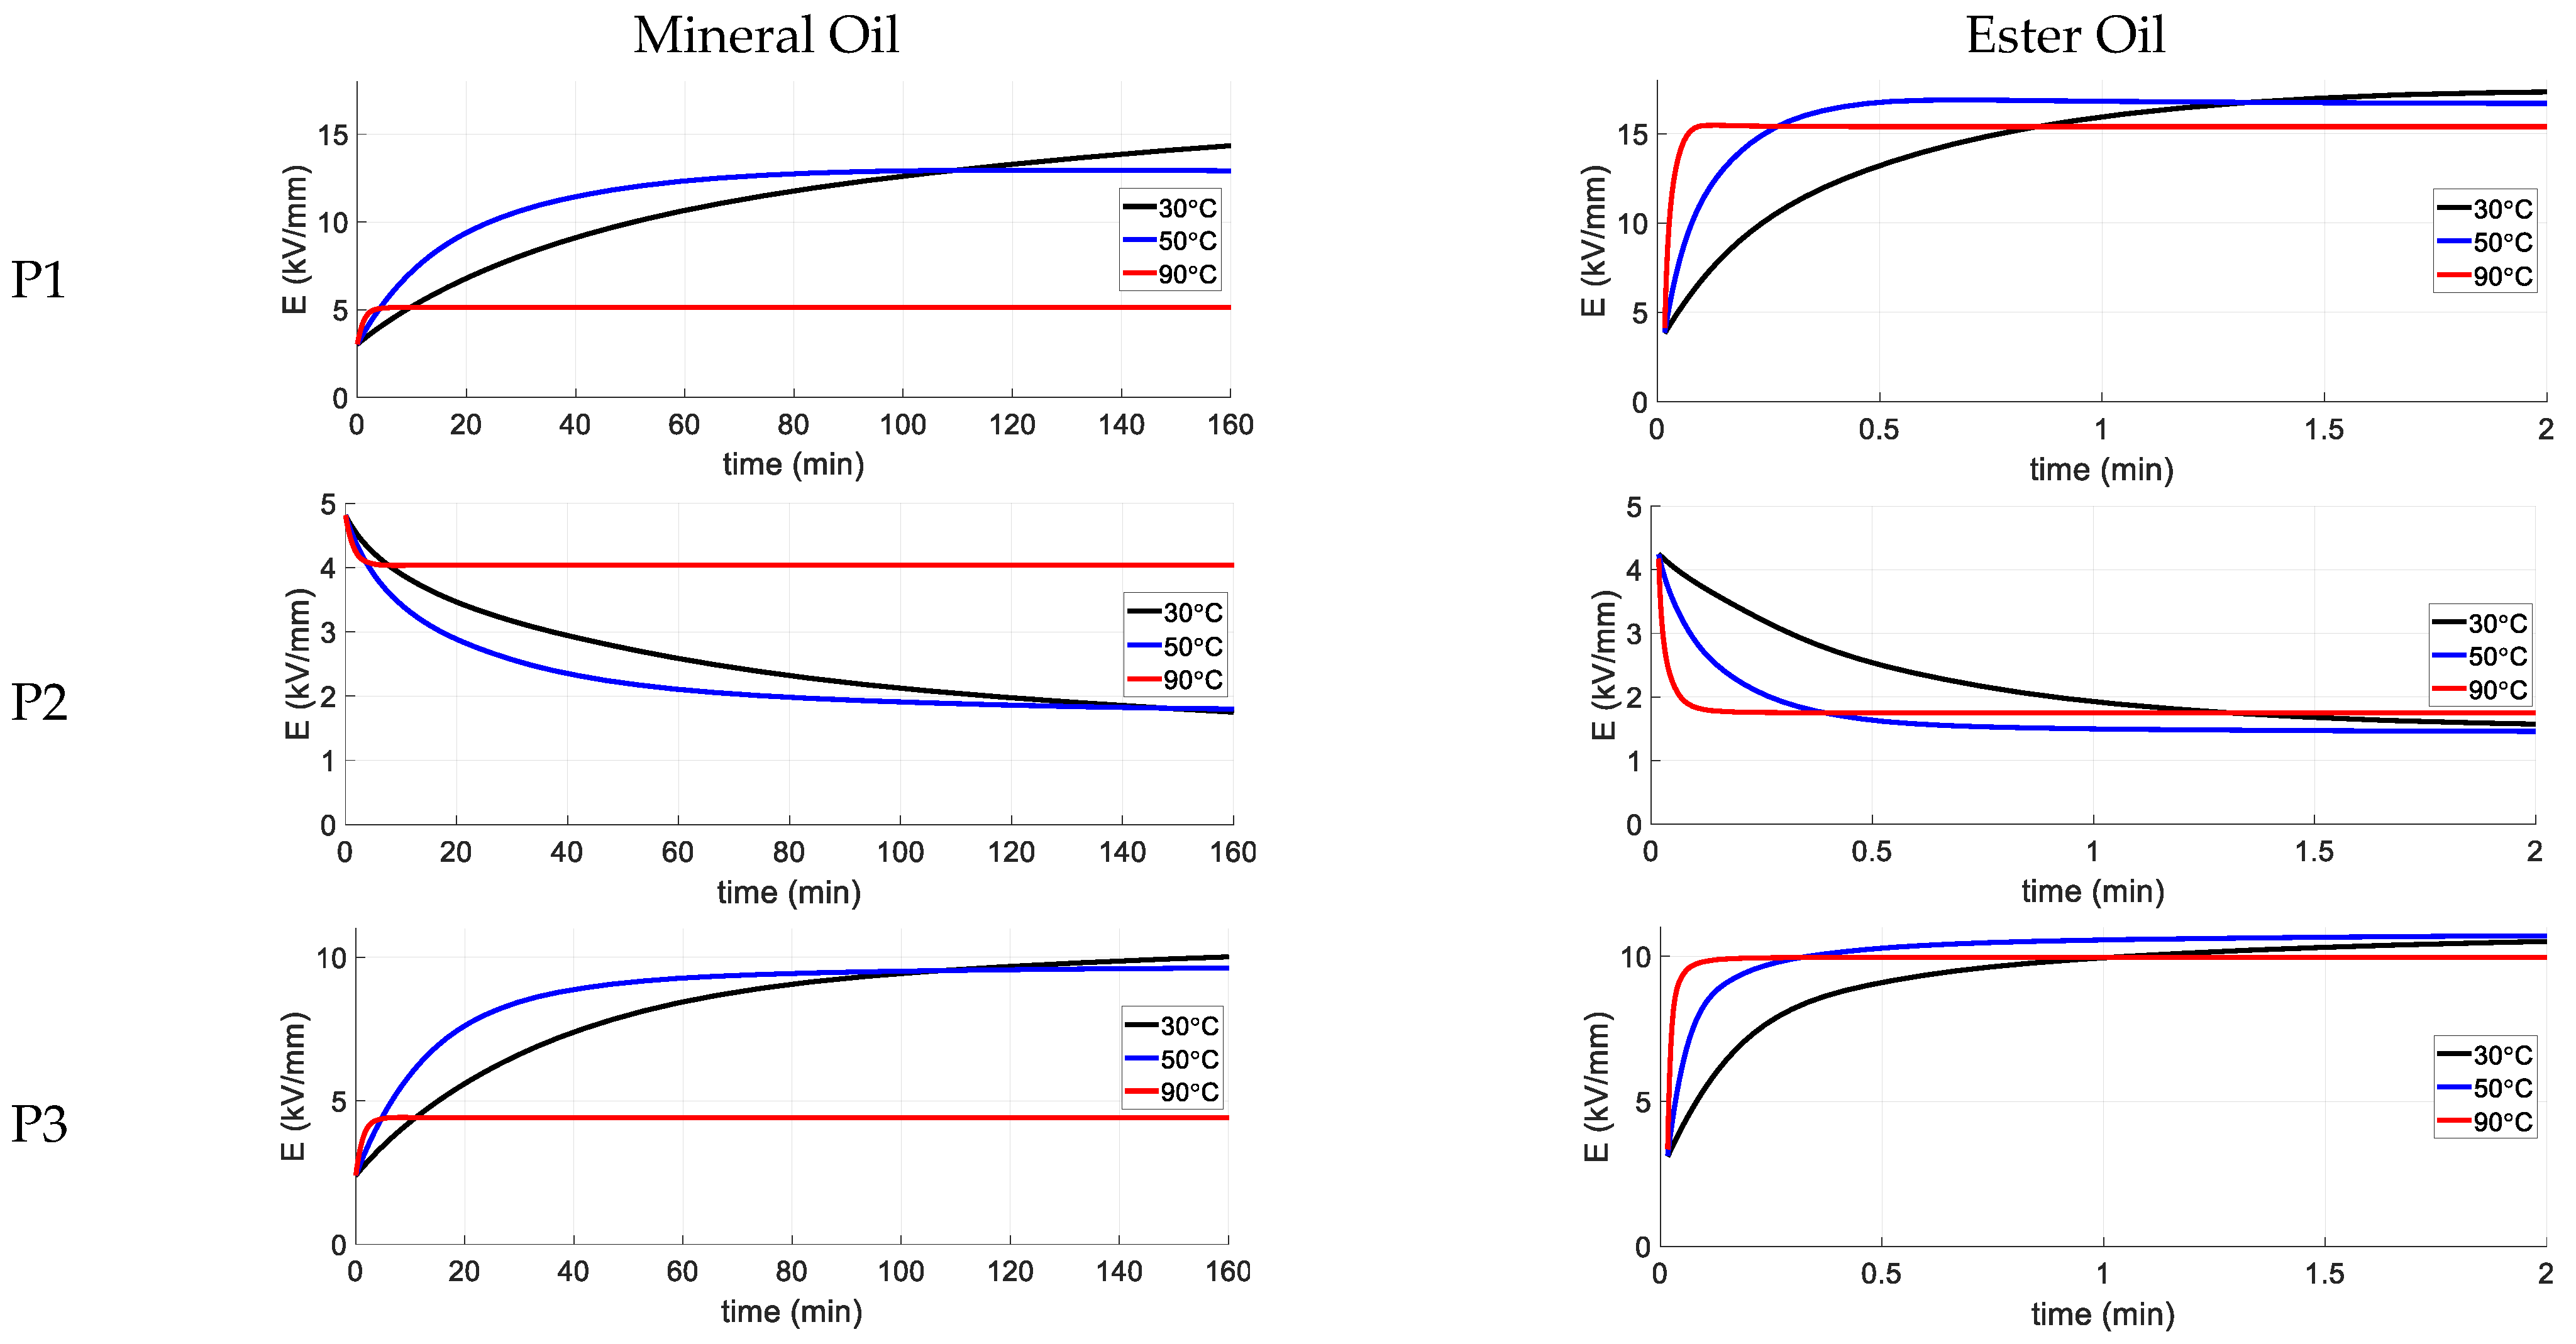
  • The conductivity values of the ester oil/OIP are generally higher than the mineral oil/OIP, which causes lower time constants for ester oil/OIP and consequently faster convergence to the steady state condition (shorter transient phase) by using ester oil.
  • For both ester and mineral oils, the lower the operational temperature, the lower the conductivity values. As a result, the transient state is longer at low temperatures.
  • The temperature dependency of ester oil/OIP conductivities are lower, which causes the transformer to be less sensitive to temperature variations during energization or variable loading conditions. As a result, the transformer filled with mineral oil behaves completely different at 90 °C compared to lower temperatures.
  • For a successful insulation design, it is insufficient to check the stress distribution only during the initial and steady state conditions, but also during the transient state when instantaneous maximums in the field strength may occur.
  • By using ester oil, the stress in the OIP at steady state condition is at the same level as for a similar transformer filled with mineral oil. Similarly, the minimum SFs at the oil gaps, creepage paths as well as the combined paths are almost at the same order for both ester and mineral oils applications.
  • The introduced combined method for safety factor calculation can be used effectively in a transformer insulation design evaluation. The SF value of an insulation design discovered by this method is equal or lower than the minimum of the SF values found by conventional methods on the independent oil gaps and creepage paths. Therefore, the new proposed method can be considered as a conservative method for insulation design evaluation.

6. Conclusions

The design aspects regarding a combined DC/AC transformer for a cost-effective integration of wind farms to land without the need for a huge and expensive power transformer and converter stations have been presented. The insulation design process of the real size medium-frequency biodegradable oil insulated transformer was introduced based on a previous study [5], where the verified method for characterizing high voltage materials and a high voltage DC insulation, manufacturing and testing a prototype transformer were reported.
The extensive measurements are performed on a biodegradable transformer oil and OIP. The article reviews the method employed by the authors for characterization measurements and reveals the measurement results of the biodegradable solid and liquid insulation materials.
The key result of the present study is the insulation design methodology for high power Medium Frequency Transformers considered for a series DC connection, filled with an environment-friendly oil. These kinds of transformers are to be subjected to a very high offset DC voltage.
An innovative solution for identifying the minimum safety factor in the insulation system is proposed. The solution is based on evaluations of the safety factor along combined paths, instead of the conventional approach when the oil gaps and creepage paths are considered separately. It is suggested that the combined path evaluation should be considered during the transformer insulation design process, in addition to the evaluation of the oil gaps and creepage paths. The developed combined design method, presented in the paper shall be verified by experimental investigations on simple insulation systems as well as more complex insulation system models.
As another future work, thermal simulations shall be constructed to provide a more exact picture of the temperature gradient in the different parts of the transformer during energization, in the transient phase, and the steady state conditions. Afterwards, more precise temperature-dependent insulation design FEM simulations can be performed.

Author Contributions

Conceptualization, T.T. and M.K.; methodology, M.K. and H.R.M.; software, M.K. and H.R.M.; validation, M.K., H.R.M. and Y.V.S.; formal analysis, M.K. and H.R.M.; investigation, M.K. and H.R.M.; resources, T.T. and M.K.; data curation, M.K. and H.R.M.; writing—original draft preparation, M.K. and H.R.M.; writing—review and editing, All authors; visualization, M.K. and H.R.M.; supervision, T.T. and Y.V.S.; project administration, T.T. and M.K.; funding acquisition, M.K. and T.T. All authors have read and agreed to the published version of the manuscript.

Funding

This research was funded by Swedish Energy Agency (Energimyndigheten, Project No. 43048-1) and Rise Research Institutes of Sweden.

Acknowledgments

Funding from the Swedish Energy Agency and financial support Rise Research Institutes of Sweden is gratefully acknowledged, as are helpful research assistance from Morteza Eslamian and Oriol Guillén Sentís and conductivity measurements assistance from Joakim Rastamo and Marcus Svensson. Any remaining errors reside solely with the authors.

Conflicts of Interest

The authors declare no conflict of interest. The funders had no role in the design of the study; in the collection, analyses, or interpretation of data; in the writing of the manuscript, or in the decision to publish the results.

Abbreviations

HVDCHigh Voltage Direct Current
MFTMedium Frequency Transformer
OIPOil Impregnated Pressboard
DABDual Active Bridge
LCCLife Cycle Cost
LMWLinear Maxwell–Wagner
NLMWNon-Linear Maxwell–Wagner
FEAFinite Element Analysis
FEMFinite Element Method
CRConductivity Ratio

References

  1. IEA. Offshore Wind Outlook 2019. Available online: https://www.iea.org/reports/offshore-wind-outlook-2019 (accessed on 20 November 2021).
  2. U.S. Department of Energy. Independent Statistics & Analysis. Assessing HVDC Transmission for Impacts of Non-Dispatchable Generation. June 2018. Available online: https://www.eia.gov/analysis/studies/electricity/hvdctransmission/pdf/transmission.pdf (accessed on 20 November 2021).
  3. Lundberg, S. Wind Farm Configuration and Energy Efficiency Studies—Series DC versus AC Layouts. Ph.D. Thesis, Chalmers University of Technology, Göteborg, Sweden, 2006. [Google Scholar]
  4. Guillén Sentís, O. Feasibility of Sea Based Wind Park. Master’s Thesis, Chalmers University of Technology, Göteborg, Sweden, 2020. Available online: https://hdl.handle.net/20.500.12380/301473 (accessed on 20 November 2021).
  5. Kharezy, M.; Mirzaei, H.R.; Serdyuk, Y.; Thiringer, T.; Eslamian, M. A Novel Oil-Immersed Medium Frequency Transformer for Offshore HVDC Wind Farms. IEEE Trans. Power Deliv. 2021, 36, 3185–3195. [Google Scholar] [CrossRef]
  6. Bahmani, M.A.; Thiringer, T.; Kharezy, M. Optimization and experimental validation of medium-frequency high power transformers in solid-state transformer applications. In Proceedings of the IEEE Applied Power Electronics Conference and Exposition APEC ’16, Long Beach, CA, USA, 20–24 March 2016; pp. 3043–3050. [Google Scholar]
  7. Kharezy, M.; Thiringer, T. Challenges with the design of cost-effective series DC collection network for offshore windfarm. In Proceedings of the 17th Wind Integration Workshop on Large Scale Integration of Wind Power into Power Systems as well as on Transmission Networks for Offshore Wind Power Plants, Stockholm, Sweden, 17 October 2018. [Google Scholar]
  8. Kharezy, M.; Eslamian, M.; Thiringer, T. Insulation Design of a Medium Frequency Power Transformer for a Cost-Effective Series High Voltage DC Collection Network of an Offshore Wind Farm. In Proceedings of the 21st International Symposium on High Voltage Engineering ISH ’19, Budapest, Hungary, 26–30 August 2019; pp. 1406–1417. [Google Scholar]
  9. Fritsche, K.L.R.; Trautmann, F.; Hammer, T. Transformers for High Voltage Direct Current Transmission—Challenge, Technology and Development. 2016. Available online: https://www.researchgate.net/publication/315657537 (accessed on 8 March 2022). (In German).
  10. Mohan Rao, U.; Fofana, I.; Jaya, T.; Rodriguez-Celis, E.M.; Jalbert, J.; Picher, P. Alternative Dielectric Fluids for Transformer Insulation System: Progress, Challenges, and Future Prospects. IEEE Access 2019, 7, 184552–184571. [Google Scholar] [CrossRef]
  11. Rozga, P.; Beroual, A.; Przybylek, P.; Jaroszewski, M.; Strzelecki, K. A Review on Synthetic Ester Liquids for Transformer Applications. Energies 2020, 13, 6429. [Google Scholar] [CrossRef]
  12. Cigré Technical Brochure 646, HVDC Transformer Insulation: Oil Conductivity. Electra ELT_285_3. 2016. Available online: https://e-cigre.org/publication/ELT_285_3-hvdc-transformer-insulation-oil-conductivity (accessed on 17 December 2021).
  13. Aakre, T.G.; Ve, T.A.; Hestad, Ø.L. Conductivity and Permittivity of Midel 7131: Effect of Temperature, Moisture Content, Hydrostatic Pressure and Electric Field. IEEE Trans. Dielectr. Electr. Insul. 2016, 23, 2957–2964. [Google Scholar] [CrossRef]
  14. Rumpelt, P.; Jenau, F. Investigation on DC conductivity of alternative insulating oils as an application for HVDC converter transformers. In Proceedings of the IEEE 19th International Conference on Dielectric Liquids ICDL ’17, Manchester, UK, 25–29 June 2017; pp. P.1–P.10. [Google Scholar]
  15. Rumpelt, P.; Jenau, F. Oil Impregnated Pressboard Barrier Systems Based on Ester Fluids for an Application in HVDC Insulation Systems. Energies 2017, 10, 2147. Available online: https://www.mdpi.com/1996-1073/10/12/2147#cite (accessed on 17 December 2021). [CrossRef] [Green Version]
  16. Kharezy, M.; Mirzaei, H.R.; Rastamo, J.; Svensson, M.; Serdyuk, Y.; Thiringer, T. Performance of Insulation of DC/DC Converter Transformer for Offshore Wind Power Applications. In Proceedings of the Conference on Electrical Insulation and Dielectric Phenomena CEIDP ‘20, Virtual, East Rutherford, NJ, USA, 18–30 October 2020; pp. 382–385. [Google Scholar]
  17. Bahmani, M.A.; Thiringer, T.; Kharezy, M. Design Methodology and Optimization of a Medium-Frequency Transformer for High-Power DC-DC Applications. IEEE Trans. Ind. Appl. 2016, 52, 4225–4233. [Google Scholar] [CrossRef]
  18. Mogorovic, M.; Dujic, D. Sensitivity Analysis of Medium-Frequency Transformer Designs for Solid-State Transformers. IEEE Trans. Power Electron. 2019, 34, 8356–8367. [Google Scholar] [CrossRef]
  19. Agheb, E.; Bahmani, M.A.; Høidalen, H.K.; Thiringer, T. Core loss behavior in high frequency high power transformers—II: Arbitrary excitation. J. Renew. Sustain. Energy 2012, 4, 033113. [Google Scholar] [CrossRef]
  20. Kharezy, M.; Eslamian, M.; Thiringer, T. Estimation of the winding losses of Medium Frequency Transformers with Litz wire using an equivalent permeability and conductivity method. In Proceedings of the 22nd European Conference on Power Electronics and Applications EPE ’20 ECCE Europe, Virtual, Lyon, France, 7–11 September 2020; pp. P.1–P.7. [Google Scholar]
  21. Bahmani, M.A.; Thiringer, T. Accurate Evaluation of Leakage Inductance in High Frequency Transformers Using an Improved Frequency-Dependent Expression. IEEE Trans. Power Electron. 2015, 30, 5738–5745. [Google Scholar] [CrossRef]
  22. Eslamian, M.; Kharezy, M.; Thiringer, T. Calculation of the Leakage Inductance of Medium Frequency Transformers with Rectangular-Shaped Windings using an Accurate Analytical Method. In Proceedings of the 21st European Conference on Power Electronics and Applications EPE ’19 ECCE Europe, Genova, Italy, 2–5 September 2019; pp. P.1–P.10. [Google Scholar]
  23. Kulkarni, S.V.; Khaparde, S.A. Transformer Engineering Design, Technology, and Diagnostics; CRC Press, Taylor & Francis Group: Boca Raton, FL, USA, 2017. [Google Scholar]
  24. Eslamian, M.; Kharezy, M.; Thiringer, T. An Accurate Method for Leakage Inductance Calculation of Shell-Type Multi Core-Segment Transformers with Circular Windings. IEEE Access 2021, 9, 111417–111431. [Google Scholar] [CrossRef]
  25. Moser, H.P. Transformerboard; Weidmann AG: Rapperswil, Switzerland, 1979. [Google Scholar]
  26. Yea, M.; Han, K.J.; Park, J.; Lee, S.; Choi, J. Design optimization for the insulation of HVDC converter transformers under composite electric stresses. IEEE Trans. Dielectr. Electr. Insul. 2018, 25, 253–262. [Google Scholar] [CrossRef]
  27. Okubo, H. HVDC electrical insulation performance in oil/pressboard composite insulation system based on Kerr electro-optic field measurement and electric field analysis. IEEE Trans. Dielectr. Electr. Insul. 2018, 25, 1785–1797. [Google Scholar] [CrossRef]
  28. Okubo, H.; Sakai, T.; Furuyashiki, T.; Takabayashi, K.; Kato, K. HVDC electric field control by pressboard arrangement in oil-pressboard composite electrical insulation systems. In Proceedings of the IEEE Conference on Electrical Insulation and Dielectric Phenomena CEIDP ’16, Toronto, ON, Canada, 16–19 October 2016. [Google Scholar]
  29. Hao, M.; Zhou, Y.; Chen, G.; Wilson, G.; Jarman, P. Space charge behavior in oil gap and impregnated pressboard combined system under HVDC stresses. IEEE Trans. Dielectr. Electr. Insul. 2016, 23, 848–858. [Google Scholar] [CrossRef]
  30. Schober, F.; Küchler, A.; Liebschner, M.; Berger, F.; Exner, W.; Krause, C.; Fritsche, R.; Wimmer, R. Dielectric Behavior of HVDC Insulating Materials, Polarization and Conduction Processes in Mineral Oil and in Pressboard Impregnated with Different Fluids. In Proceedings of the 19th International Symposium on High Voltage Engineering ISH ’15, Pilsen, Czech Republic, 23–28 August 2015. [Google Scholar]
  31. Vahidi, F.; Tenbohlen, S.; Rösner, M.; Perrier, C.; Fink, H. The investigation of the temperature and electric field dependency of mineral oil electrical conductivity. In Proceedings of the ETG Power Engineering Society Symposium, Dresden, Germany, 12 November 2013. [Google Scholar]
  32. Vahidi, F.; Tenbohlen, S.; Rösner, M.; Perrier, C.; Fink, H. Influence of electrode material on conductivity measurements under DC stresses. In Proceedings of the IEEE International Conference on Dielectric Liquids ICDL ’14, Bled, Slovenia, 29 June–3 July 2014. [Google Scholar]
  33. Jeroense, M.J.P.; Kreuger, F.H. Electrical conduction in HVDC mass-impregnated paper cable. IEEE Trans. Dielectr. Electr. Insul. 1995, 2, 718–723. [Google Scholar] [CrossRef]
  34. Schober, F.; Harrer, S.; Küchler, A.; Berger, F.; Exner, W.; Krause, C. Transient and steady-state dc behavior of oil-impregnated pressboard. IEEE Electr. Insul. Mag. 2016, 32, 8–14. [Google Scholar] [CrossRef]
  35. Kato, K.; Okubo, H.; Endo, F.; Yamagishi, A.; Miyagi, K. Investigation of charge behavior in low viscosity silicone liquid by Kerr electro-optic field measurement. IEEE Trans. Dielectr. Electr. Insul. 2010, 17, 1214–1220. [Google Scholar] [CrossRef] [Green Version]
  36. Küchler, A. Condition Assessment of Aged transformer Bushing Insulation. Sess. Pap. Cigré Study Com. A2 2006, A2-104, P.1–P.10. [Google Scholar]
  37. Dolata, B.; Borsi, H.; Gokenbach, E. Comparison of Electric and Dielectric properties of Ester Fluids with Mineral based Transformer oil. In Proceedings of the 15th International Symposium on High Voltage Engineering (ISH), Ljubljana, Slovenia, 27–31 August 2007. [Google Scholar]
Figure 1. The series DC concept where the DC outputs of the wind turbines are directly delivering the high voltage to be transferred to land.
Energies 15 01998 g001
Figure 2. Manufactured prototype: (a) Complete transformer; (b) Active part; (c) DC insulation test setup.
Energies 15 01998 g002
Figure 3. Dimensions of the real scale Ferrite 10 MW, 1.8/18 kV, 0.32 T, 5555/555 A, 12/120 Turns, 5 kHz MFT: (a) Top view; (b) Side view.
Energies 15 01998 g003
Figure 4. Conditioning and measurement cycle for: (a) ester oil; (b) ester OIP.
Energies 15 01998 g004
Figure 5. The measurement results on the ester and mineral oils/OIPs.
Energies 15 01998 g005
Figure 6. The dielectric structure of the real scale MFT.
Energies 15 01998 g006
Figure 7. The initial permittivity-based stress distribution in kV/mm and the electric field streamlines in the dielectric structure of the MFT using: (a) mineral oil; (b) ester oil.
Energies 15 01998 g007
Figure 8. The final steady state stress distribution in kV/mm and the electric field streamlines in the dielectric structure of the MFT at different temperatures using: (left) mineral oil; (right) ester oil.
Energies 15 01998 g008
Figure 9. The position of some typical points in the dielectric structure of the MFT to investigate their stresses in time domain.
Energies 15 01998 g009
Figure 10. The time variation of stress curves of P1 to P8 using: (left) mineral oil; (right) ester oil.
Energies 15 01998 g010aEnergies 15 01998 g010b
Figure 11. The streamlines by using ester oil at 10 s and 30 °C: (a) A sample streamline (thick pink line); (b) The electric field curve along this streamline starting from the rightmost point.
Energies 15 01998 g011
Figure 12. The streamlines by using ester oil at 10 s and 30 °C: (a) A sample creepage surface (thick pink line); (b) The electric field curve along this creepage surface (accounted from the right bottom).
Energies 15 01998 g012
Figure 13. Extracting a combined path from an oil gap path and the linked creepage paths.
Energies 15 01998 g013
Figure 14. The streamlines by using ester oil at 10 s and 30 °C: (a) A sample combined path in an oil gap and two creepage paths (thick pink line, creepage path 1 is on the insulation of the HV shield and creepage path 2 is on the oil duct barrier); (b) The electric field curve along this combined path; (c) the sorted electric field curves; (d) the safety factor curves (the safety factor of the creepage path 1 is higher than 40 and that is why the green line is not shown).
Energies 15 01998 g014
Figure 15. The flowchart of automatic insulation design evaluation applied in COMSOL Live Link with MATLAB.
Energies 15 01998 g015
Table 1. Conductivity measurement results for mineral oil/OIP and their conductivities ratio (CR).
1 kV/mm3 kV/mm6 kV/mm12 kV/mm
Mineral Oil30 °C5.0 × 10−143.9 × 10−145.8 × 10⁻¹⁴-
50 °C1.2 × 10−139.5 × 10−141.1 × 10⁻¹³-
90 °C5.2 × 10−134.6 × 10−133.9 × 10⁻¹³-
Mineral OIP30 °C1.7 × 10−162.2 × 10−162.7 × 10−164.0 × 10⁻¹⁶
50 °C2.6 × 10−153.3 × 10−154.0 × 10−155.8 × 10⁻¹⁵
90 °C2.6 × 10−133.0 × 10−133.8 × 10−135.1 × 10⁻¹³
CR30 °C294177215-
50 °C462927-
90 °C21.51-
Table 2. Conductivity measurement results for ester oil/OIP and their conductivities ratio (CR).
1 kV/mm3 kV/mm6 kV/mm12 kV/mm
Ester Oil30 °C1.4 × 10−111.0 × 10−110.8 × 10⁻¹¹-
50 °C5.0 × 10−113.6 × 10−113.2 × 10⁻¹¹-
90 °C2.9 × 10−102.3 × 10−102.3 × 10⁻¹⁰-
Ester OIP30 °C6.1 × 10−136.9 × 10−134.9 × 10−133.4 × 10⁻¹³
50 °C2.0 × 10−122.2 × 10−121.6 × 10−121.2 × 10⁻¹²
90 °C1.4 × 10−111.5 × 10−111.2 × 10−111.1 × 10⁻¹¹
CR30 °C231516-
50 °C251620-
90 °C211519-
Table 3. The maximum stresses in OIPs, the minimum SFs in the oil gaps, on the interface creepage paths and combined paths and the related time of occurrences.
Temp. (°C)Max. Stress in OIPs (kV/mm)Time (s)Min. SF in Oil GapsTime (s)Min. SF at Creepage SurfacesTime (s)Min. SF at Combined PathsTime (s)
mineral oil3017.544671.512.422391.51
5016.217781.512.48911.51
908.33981.512.51581.51
ester oil3017.7281.712.312.61.61
5017.781.712.441.61
9017.321.812.51.41.71
Publisher’s Note: MDPI stays neutral with regard to jurisdictional claims in published maps and institutional affiliations.

