1. Introduction
According to the last global status report, the share of fossil fuels consumption reaches 80.2% of the global energy demand, whereas the share of renewable energy sources is only 11.2%. Despite the significant efforts made in recent years for enhancing the utilization of sustainable energy sources, the share of fossil fuels exhibits a positive variation of 0.12% between 2009 and 2019. That constitutes a nominal stagnation regarding the participation of renewable sources for supplying the world’s constantly growing energy demand. In this context, concentrated solar power (CSP) and geothermal energy sources are outlined as two of the most promising technologies for sustainable and reliable electricity generation [
1]. Both, CSP and geothermal systems, are able to deliver thermal energy for driving conventional energy conversion systems or Organic Rankine cycles (ORC). Indeed, several authors have reported the compatibility between both energy sources, pointing out that hybrid Solar-Geothermal configurations can improve significantly the levelized cost of energy (LCOE) and capacity factor than stand-alone CSP or geothermal systems [
2,
3]. The low-capacity factor of CSP systems, due to the variation of the solar resource during the day, may be improved by the geothermal constant energy supply. In addition to that, CSP systems exhibit operating temperatures close to 650
[
4] that can increase significantly the low conversion efficiencies observed in geothermal applications. The efficiency improvements stated in the literature range between 2.37% and 81.13% of increment in hybrid Rankine cycles, and increments from 5.5% to 81% in ORC [
3]. In addition to that, the availability of solar thermal energy throughout the day reduces the geothermal fluid extraction, decreasing the depletion rate of the geothermal wells, and as a consequence, the operation and maintenance (O&M) costs [
5]. Moreover, the geothermal well may be used as thermal energy storage (TES) for the solar heat produced during energy oversupply intervals [
3]. In terms of
emissions, some the geothermal based power systems show a rate of emission under 500 g of
per kWh, which is the lowest range of emission index in comparison to Hydro-power, solar photovoltaic and fossil sources [
6].
Despite the aforementioned advantages of integrating Solar-Geothermal systems, there are still important challenges to be addressed for being considered a reliable solution for the industry. For instance, coupling both energy sources implies a significant increase in the complexity of the power system, and as a consequence, hampering the maintenance and challenging the control strategy during its operation. In addition, the initial costs related to the characterization of the geothermal resource, the installation of the CSP, and geothermal plants are excessively high, hindering the competitiveness of hybrid projects in the short-term [
2,
7].
Aiming to outperform solar and geothermal power plants as standalone systems, several studies have analyzed the performance of integrating both renewable sources in a hybrid Solar-Geothermal power system, considering their limitations and advantages. Lentz [
8] modelled two integration strategies for the hybridization of parabolic trough collectors (PTC) at the Cerro Prieto geothermal power plant in northern Mexico. The study analyzed the benefits of integrating solar heat from a PTC solar field in an existing geothermal power plant. The analysis considered two configurations: (a) preheating the geothermal fluid before the separator to increase the the steam quality, and (b) heating the brine downstream the separator for a second steam extraction at low pressure. The results showed that both integration strategies raise the electricity production in similar rates, however, the silica deposition could be significant if the brine presents high concentration before the first separator. Later, the same authors proposed an actualization of the previous work attending the silica precipitation risk [
9]. The authors recommend to include an electronic descaler and the injection of hydrolic acid (pH 5), also, they studied a third hybrid configuration. The approach consist in using the solar field to heat the brine flow from the cooling tower to produce steam, and return the mixture of steam and brine to the brine flow coming from the geothermal wells. This configuration allowed to increase the steam generation rate and to control the silica precipitation risk. Handal2007-wh [
10] and Alvarenga2008-rr [
11] tested a prototype of a PTC solar field deployed to generate additional steam in a geothermal plant. The system considered a cyclonic separator that extracts medium pressure steam from the two-phase mixture coming from a geothermal well. In addition, the solar system heats the remaining brine stream before it is directed to a second flash separator. Thus, the additional solar heat allows to increase the quality of low pressure steam extraction. The authors concluded that the system is technically feasible at large-scale if a commercial solar field can ensure efficiencies over 50% with an annual capacity factor around 30%. Greenhut2009-tw [
12] analyzed the hybridization of a geothermal plant by integrating a solar system to heat the low enthalpy geothermal fluid. The authors reported that the LCOE of the solar system and the geothermal stand-alone plant are similar if the cost of the geothermal well are included. The results show that the electricity generation in the hybrid configuration could be increased, and even double the geothermal generation as a standalone plant. It was also conclude that the unit capacity cost of the plant increases in 100
/ per every percent of additional solar heat from the total heat input. In a further study considering the same system Greenhut2010 [
13] estimated the LCOE in a range of 190 and 250
/
.
Astolfi2011-nc [
14] analyzed the economic feasibility of a hybrid solar geothermal plant deployed in four locations: Pisa, and Palermo in Italy, and San Diego and Imperial in USA. The proposed cycle considers a PTC solar field coupled to a geothermal field to drive a binary transcritical ORC. The results reported LCOE values in a range of 145 to 280
/
, allowing to identify Imperial as the location showing the lowest LCOE among the locations analyzed, with a yearly incident solar energy of
. Boghossian2011-dw [
15] analyzed the economic feasibility of an hybrid solar-geothermal Kalina power cycle. The analysis considered a variation on the percent relation between the solar and geothermal input to generate
as the cycle output. In that study no synergies were found between the solar geothermal systems. In fact, the author pointed out that the hybrid plant delivers 29% less power than the solar and geothermal systems in stand-alone configurations. A different thermodynamic and economic analysis of a hybrid solar-geothermal plant was conducted by Manente2012-nx [
16]. The authors studied two operation strategies in order to maximize the power output of a subcritical isobutane ORC driven by solar and geothermal sources. The analysis was carried out considering transient environmental conditions, featured by a typical meteorological year database. The first strategy analyzed consist in separate the geothermal heat input in equivalent parts for two expander-generators. The second strategy considers a relation of 33.38–66.62%, to split the mass flow from the steam generator to each expander-generator. The authors recommended to not deploy such systems in regions with relatively low solar resource, since the LCOE of the hybrid ranges between 182 to 191
/
, higher than the costs of a geothermal stand-alone plant. In 2011, Zhou2011-lx [
17] studied the yield of two hybrid solar-geothermal concepts based on ORC, in order to asses the effects of diurnal temperature changes on the performance of air-cooled condensers. The first concept (A) considers a solar system to heat directly the ORC HTF without disregarding the use of a TES. The second concept (B) includes an indirect heating solar system with a synthetic-oil TES to supply thermal energy to the ORC. The authors reported that the system (A) presents better performance in terms of the net power generation and thermal efficiency. The study showed that the hybridization could achieve a stable performance and increase the electric power generation in about of 29%, and an additional 16.6% in the overall system’s thermal efficiency during peak hours. Later, in 2013, Zhou2013-np [
18] studied a subcritical regenerative ORC driven by an hybrid solar geothermal scheme. The solar field considers a TES and supply heat to superheat the steam from the geothermal steam generator. The results stated a net exergy efficiency of 12.36% for the hybrid plant, and LCOE values in a range of 165 to 222
/
(depending on the solar field size and geothermal well conditions). Zhou2014-pv [
19] analyzed a hybrid solar-geothermal plant coupled to a supercritical ORC, and compared its performance with a subcritical ORC and stand-alone solar and geothermal plants. The results show an outperformance in the supercritical ORC when 66% of energy is supplied by the solar system, increasing the exergy efficiency in a range of 2–4% over the subcritical ORC configuration. in addition, the authors reported LCOE values between 105 to 160
/
for the supercritical cycle, and values between 101 to 165
/
for the subcritical cycle.
In 2014, Ghasemi2014-lc [
20] examined the hybridization of an existing ORC utilizing a low-temperature geothermal source coupled to a PTC solar field to enhance the vaporization of the the working fluid in the ORC. The study shows that the hybridization offers better thermodynamic performance in comparison to geothermal stand-alone plants, reaching a 5.5% boost in annual power generation and an increment of 3.4% in terms of the exergy efficiency. Based in the previous system, Ayub2015-sp [
21] analyzed an ORC driven by a low-temperature geothermal well and a solar trough system, to maximize the net power output in representative days. The authors concluded that a hybrid solar-geothermal could reach efficiencies between 5.5–6.3% higher than a geothermal stand-alone systems. However, in terms of the LCOE, geothermal stand alone plants show lower values (
/
) than the hybrid solar-geothermal scheme (
/
). This result is explained mainly by the high costs of deploying the solar system. In 2016, a thermoeconomic analysis was performed by Calise2016-ye [
22] to assess a hybrid solar-geothermal polygeneration plant. The proposed system aims to produce fresh water, electricity, and thermal and cooling energy for a small community located in southern of Italy. The results report a LCOE in the range of 175.2 to 204.5
/
, to produce chill water between 221.2 to 224.2
/
, and hot water for space heating of 19.2 to 20.2
/
. The same year, Cardemil2016-jr [
5] conducted a thermodynamic and economic assessment of two hybrid geothermal plants assisted by a PTC solar field. The proposed schemes consist in a single and double flash geothermal systems. The single flash scheme considers the supply of solar heat to superheat the saturated steam coming from the geothermal separator, and to produce additional steam from the geothermal brine outlet from the separator. The double-flash scheme, considers the equivalent processes than the single-flash system, but including an additional solar input to superheat a medium pressure steam from a second separator. The study concludes that both configurations could reduce the mass flow from the geothermal well, and in consequence, it could increase the life time of the geothermal source. In addition to that, the double flash option takes advantage of the first separation brine to exploit its high enthalpy for a second expansion process. The results show an LCOE of 64
/
and 56
/
, for a single and double flash systems, respectively. Jiang2017-qs [
23] studied a hybrid solar-geothermal power plant coupled to a supercritical CO
Brayton cycle. The geothermal reservoir stores pressurized supercritical CO
heated from a CSP cycle. The geothermal resource provides the base load electricity and solar energy boost the energy generation in daylight hours. The authors stated that the system does not offer advantages for the utilization of the geothermal energy. Nevertheless, the integration simplifies the solar system and reduce the low pressure level of the cycle, helping to conduct CO
geological sequestration. Bonyadi2018-jp [
24] conducted a thermoeconomic and exergy analysis of a solar Rankine cycle hybridized with an existing geothermal power plant based in an ORC. Increases in solar efficiency and decreases in geothermal brine could be reached with the proposal. Also, the results show a LCOE between 163 to 172
/
. Later, an economic analysis was reported by McTigue2018-mv [
25], where five hybridization strategies were analyzed, considering a double flash geothermal plant coupled to a solar field of lineal Fresnel reflectors. The results show an increase on the electricity generation within the range of 22 to 24
, which presents LCOE values in a range of 70 to 80
/
for a plant located in Coso geothermal area, USA.
The first actual solar geothermal hybrid plant is the Stillwater Power Plant, located in Nevada, USA. Stillwater started its operations in 2009 with 26
of geothermal power capacity. Two years later, 33
of PV capacity was added to the plant. Then, in 2014, 17
of PTC were installed to increase its electric capacity in 2
. In 2018, Ciani_Bassetti2018-ni [
26] analyzed the integration of solar TES in Stillwater, considering two cases: a solar multiple of 1.6, with and without TES system. The results show that the first case increased the electricity generation in 6.3%, regarding the geothermal plant as stand-alone system, whereas the system without TES showed an increase of 5.3% in terms of electricity generation.
As described above, the literature review shows that the hybridization of solar and geothermal energy sources has been an active research topic during the last decade. However, the integration of solar thermal collectors does not present a positive impact in all scenarios analyzed in the literature. It has been observed that the best results are observed when the location of the geothermal reservoir is in a region with particularly high solar resource, such as in Chile and USA. The present study presents the assessment of the hybridization of an existing geothermal plant, which is located in one of the best locations worldwide, in terms of solar radiation availability. The analysis is based on energy and exergy assessment and considers several design constraints associated with silica precipitation, as well as environmental and cultural constraints since it is located in a protected area. Hence, the analysis presented herein goes one step further on the assessment of solar geothermal systems, by conducting an assessment restricted to actual operating conditions.
2. System Description
Cerro Pabellón plant is a geothermal power plant developed by Enel S.A., and in operation since 2017. The power plant is located at 4500 m.a.s.l in a place called Pampa Apacheta in Andean region of the Atacama Dessert (Chile) (21°51
29.0
S 68°09
08.3
W) [
27] (see
Figure 1). This power plant is the first and unique geothermal power plant in South America. Pampa Apacheta belongs to a volcanic arc of Andes mountains, whose magma chambers and groundwaters give excellent conditions to exploit hydrothermal systems.
Several explorations have been made around the Pampa Apacheta region to evaluate the geothermal potential for energetic purposes, which were reported in scientific studies and technical reports. In 2014 Procesi2014-vn [
28] reported that the temperature of the geothermal fluid could reach 260
. Then, according to the environmental impact assessment reported by Geothermics2010-um [
29,
30], the enthalpy of the geothermal resource at the well-head could drive three different geothermal power technologies: single flash cycle, binary cycle, and a combination of both technologies. In 2017, Cerro Pabellón started to operate with two power modules of binary ORC of 24
, driven by eleven production wells with depth ranging between 2000 to 2500
[
30]. One of these modules was selected as the base case for the present study. The binary ORC allows the reinjection of the geothermal fluid at higher temperatures than expected in a flash scheme, allowing to preserve the conditions of the reservoir.
The meteorological conditions in Pampa Apacheta are in general severe, showing a yearly mean thermal amplitude of about
and a maximum of
, while mean ambient temperature varies between
and
in daylight hours. Regarding to the solar resource, Pampa Apacheta presents a daily mean global horizontal irradiation (GHI) of
/
, and a daily direct normal irradiation (DNI) of
/
[
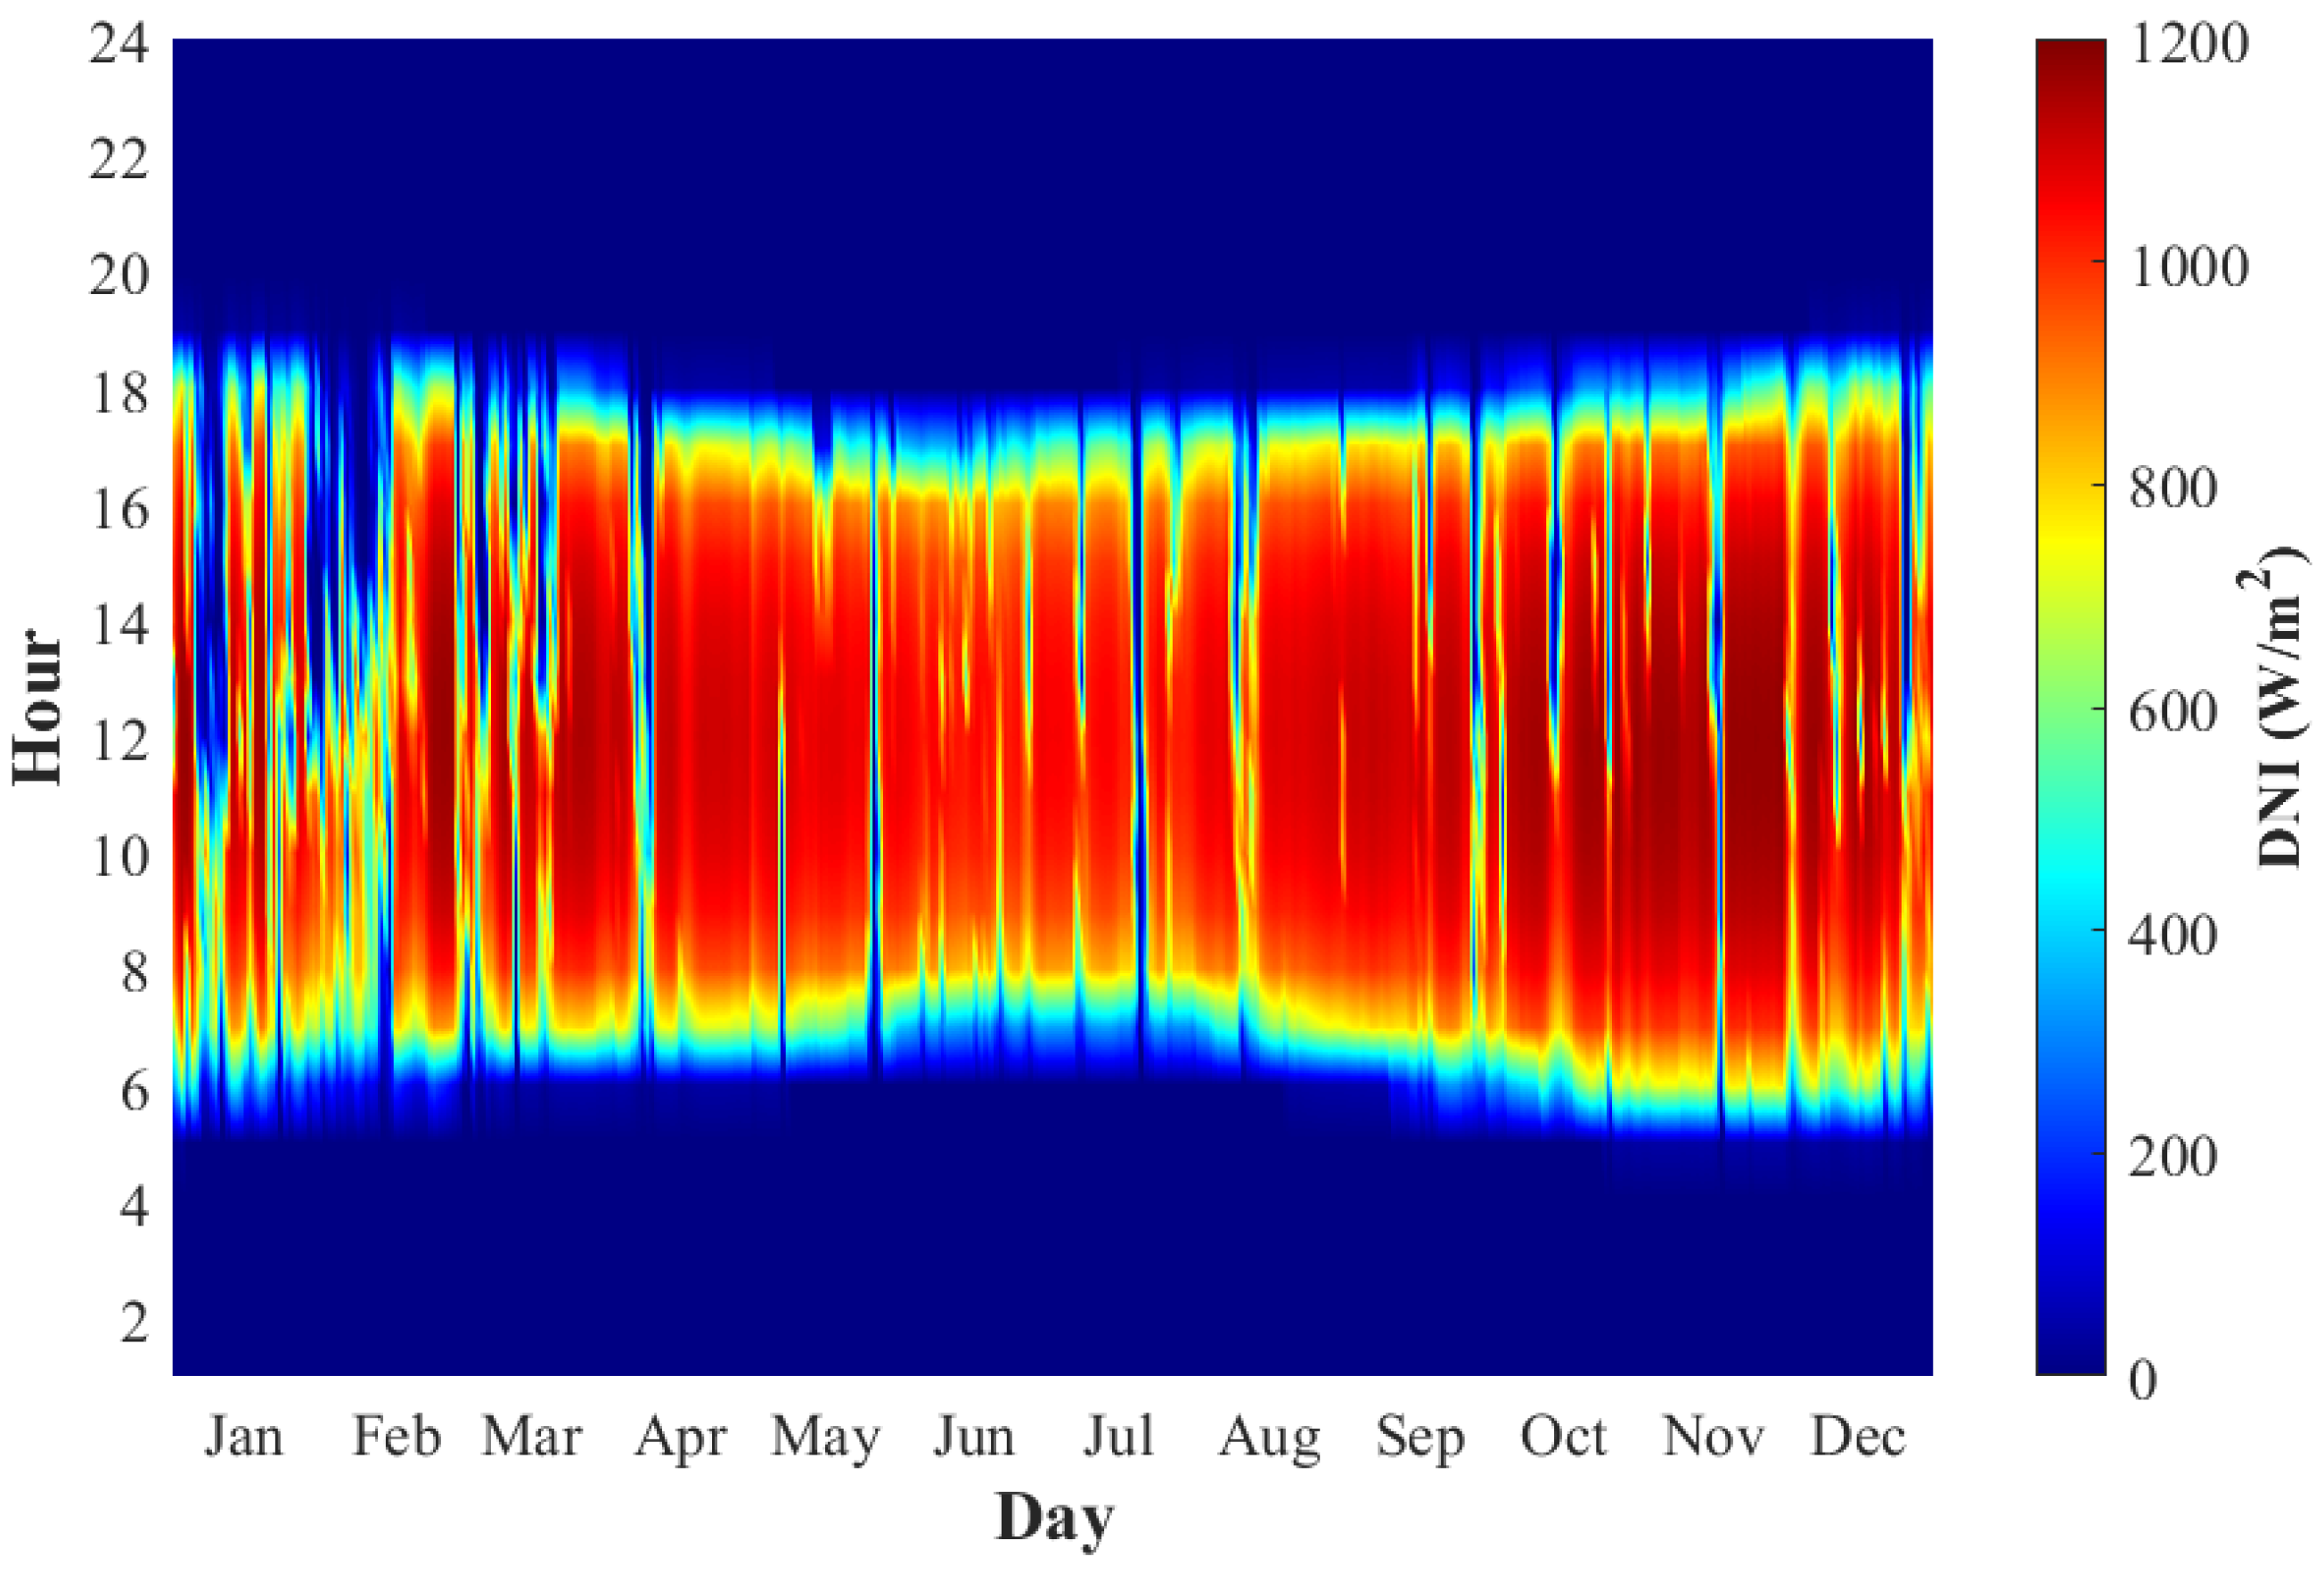
31]. Those irradiation levels are among the highest levels in the Chilean territory. The temperature and the irradiation profiles were obtained from the typical meteorological year (TMY) database developed by GeoModel-Solar2019. The temperature and DNI profiles are shown in
Figure 2 and
Figure 3, respectively.
Some cloudy periods are observed in
Figure 2, especially between January and February, reducing DNI and temperature peaks. This seasonal phenomenon is called altiplanic winter, when the high level of atmospheric attenuation decrease, the daily averaged DNI decreases to
/
in January, and
/
in February. On the other hand, on November and December the daily averaged DNI can reach impressive levels as 12.4 and
/
, respectively. The high DNI is explained by the clear skies observed during that period of the year, as well as by the high altitude of the location, which reduced the atmospheric attenuation of the solar radiation.
The present work is focused on the analysis of possible integration schemes for coupling a PTC solar field and the existing geothermal system to increase the electricity production. In this context, two integration schemes were considered for the hybridized solar geothermal plant, using as a starting point the installed binary ORC of 24 located at Cerro Pabellón. Finally, to ensure the proper match between both technologies without harming the original configuration and its effects within the reservoir, the environment, and the community, it is imposed as a restriction to keep constant the temperature levels of the ORC, as well as the reinjection temperature of the geothermal fluid. Such constraints bring the additional benefit of avoiding the incrustation and corrosion by silica precipitation in the geothermal system.
2.1. Base Case
The binary ORC uses geothermal fluid to preheat and evaporate the organic HTF, which in the case of the present study is isopentane. The diagram of the current geothermal cycle in Cerro Pabellón is shown in
Figure 4, where the blue lines represent the geothermal fluid and the green lines the isopentane flowing in the ORC. Due to the high enthalpy levels in the geothermal well, it is possible to observe a two-phase flow from the well in state (WC.2). Hence, the flow goes to a separator (SC101), from where two products are obtained: liquid brine (WC.6), and saturated steam (WC.3). The steam stream goes to a heat exchanger (IC201) to vaporize the isopentane, which goes from the subcooled state in (OC.7) to saturated steam (OC.1). The geothermal steam in the heat exchanger (IC201) is condensed (OC.4), and later pumped (WC.5) and mixed with geothermal brine (WC.7), resulting in the state WC.8. The flow at state (WC.8) preheats the ORC HTF from (OC.6) to (OC.7) in the heat exchanger (IC202). Then, in (IC202), the cooled geothermal fluid output (WC.9) is pumped back to the geothermal reservoir in a reinjection well. The turbine (G201) is driven by saturated steam (OC.1), where the expansion process is carried out, resulting in the expected power output. Once the organic HTF is expanded (OC.2), it is carried towards the (IC203) heat exchanger (acting as a recuperator) which is cooled through an air-cooled condenser (AC201). Finally, the outlet of organic fluid from air-cooled condenser (OC.4) is pumped and preheated in the recuperator, closing the cycle in (OC.6).
2.2. Hybrid Configurations
The main objective of hybridizing solar and geothermal resources is to increase the electricity generation by coupling a PTC solar field with the existing binary ORC in Cerro Pabellón geothermal project. To assess the hybridization, four solar thermal capacities were evaluated, 30, 40, 50 and 60 . Likewise, the analysis ranges the solar multiple and the size of the TES system to find the best configuration for the solar system. The hybrid configurations evaluated are denominated CH01, which considers a solar field of 30 and 40 , and, CH02, which comprehends a solar thermal capacity of 50 and 60 .
2.2.1. Hybrid Scheme CH01
This configuration considers the inclusion of three additional heat exchangers to transfer heat from the solar field to a new power block. The heat exchangers are denominated (IC101), (IC102), and (IC103), which are employed for preheating, evaporating, and overheating, respectively. In addition, a separator (SC102), a steam turbine (T101), an electric generator (G101), a pump (B104), and an air-cooled condenser (AC101) are also integrated to complete the hybrid scheme. The hybrid configuration CH01 is depicted in
Figure 5, where blue and green lines, as in
Figure 4, represent the geothermal and organic fluids, respectively. In addition, two new classes of streams are introduced: red lines indicate the solar heat transfer fluid, and the orange lines represent the streams of the steam power system.
The proposed scheme was evaluated under two nominal thermal capacities, 30 and 40
. In addition to that, the nominal cold and hot temperatures of the HTF were ranged from 200 to 240
, and from 370 to 390
, respectively, in 15 different configurations of solar field and TES size (see
Table A3). In particular, the configuration CH01 with a thermal capacity of 40
considers that the GSC.17 stream is null for maintaining the energy and mass balances.
2.2.2. Hybrid Scheme CH02
Associated with the increase of the thermal power available, the steam generation in (IC102) will also increase. Thereby, the condensed steam from (AC101) impacts on the mixture quality in (WC.5). Additionally, the lower brine production in (GSC.18), at higher temperatures, is useless to increase the temperature at (GSC.16), affecting the operation of (IC202). The silica precipitation risk is higher in the reinjection process. For that reason, a new configuration is proposed for solar fields larger than 50
of thermal capacity, as shown in
Figure 6. In this scheme, an additional heat exchanger (IC104) is introduced to the configuration (CH02), which allows increasing the temperature at the preheater inlet (IC202). Thus, this stream is kept near to the reference temperature.
3. Thermodynamic Analysis
A computational model was developed for analyzing the yield of Cerro Pabellón geothermal plant, considering the actual layout of the plant( courtesy of ENEL S.A.). In addition, two hybrid integration schemes coupling a PTC solar field and the geothermal system were considered. The modelling of the three configurations, the base case, and the two proposed hybrid schemes, was developed using the Engineering Equation Solver software (EES) [
32]. Likewise, the yield of the solar thermal system was modeled using the dedicated module in the System Advisor Model (SAM) [
33], which is coupled to the main computational model in EES.
Three different configurations were analyzed: (1) the base case corresponding to the actual configuration of Cerro Pabellón geothermal power plant; (2) CH01 for a solar field of 30 and 40 thermal capacity; and (3) CH02 for a solar thermal capacity of 50 and 60 . The following assumptions were enforced, associated to the current operation parameters of Cerro Pabellón power plant:
The HTF in the ORC is isopentane;
Condensation system: ACC (Air cooled condenser);
Geothermal fluid reinjection: 100%;
Geothermal fluid from the wells: two-phase mixture;
The average ambient temperature is and the atmospheric pressure is (from the TMY database).
In addition to that, to carry out the thermodynamic model, the following assumptions were also established:
The three cycles studied were simulated under quasi-steady state conditions;
Equipment and pipelines are considered adiabatic and the pressure drop is neglected, except in case (3);
Geothermal brine thermodynamic properties are represented by the demineralized water properties;
The simulation does not consider non-condensable gases;
Kinetic and potential energy were neglected in the energy conservation equations;
Turbine isentropic efficiency is 85%;
Pump isentropic efficiencies is 80%;
Turbines and pumps are adiabatic;
Generator efficiency is 98%.
The 1st law of thermodynamics is applied in each component of the cycle, as follows,
where
is the heat transfer rate from or to the system,
is the work delivered by or to the system,
is the mass flow rate,
h is the specific enthalpy, and the subscripts
and
refer to inlet and outlet, respectively.
To determine the exergy rates in each component of the hybrid system, the exergy balance was applied as suggested in [
34]. The general equation holds as follows:
where
is the exergy transfer rate by heat,
and
are the inlet and outlet exergy rates, respectively. The subscripts
and
represent the destroyed and lost exergy rate, respectively. The term
is only evaluated considering the operation of an air-cooled condenser. The exergy rate due to heat transfer rate is obtained using the following equation:
where
is the ambient temperature (dead state) and
corresponds to the heat source temperature.
The exergy rate for a state
i is expressed as:
where
is
where
and
are the enthalpy and entropy for state
i, and
and
are the enthalpy and entropy at dead state (average ambient temperature and atmospheric pressure).
To evaluate the overall thermal performance of the geothermal and solar thermal systems, the thermal efficiency is defined as follows:
where the subscript
is associated with the geothermal solar cycle, and
is the heat delivered by the solar field.
To evaluate the benefits of integrating solar and geothermal resources, the exergy efficiency is applied as an additional metric. Through this assessment, it is possible to determine, using a rational approach, the best approach to manage the energy resources to exploit its energetic potential. The exergy efficiency is defined as follows:
where
and
is expressed as:
where the subscript
corresponds to
or
, as corresponds.
3.1. Heat Exchangers
Because of the hybridization, additional heat exchangers were integrated to the system, as depicted in the diagrams of
Figure 5 and
Figure 6. IC101 and IC102 allow preheating and partially evaporating the geothermal brine, IC103 is used as a steam superheater before the turbine, and IC104 allows increasing the temperature of the geothermal fluid previous to the condensation system. IC101 and IC102 work in series, as well as the heat exchangers IC103 and IC104.
To determine the mass flow rate in the heat exchangers IC101 and IC102, it is defined a by-pass factor (
f), which is established to keep an equivalent temperature in the superheated steam before entering the turbine. Thus, the mass flow rate in IC101-102 is defined by:
while the mass flow rate in the heat exchangers IC103 and IC104 is:
In nominal conditions, a constant of proportionality
k is established between the synthetic oil (Therminol VP-1) mass flow rate
, and geothermal brine
, as is established according to the following equation:
where the constant
k is used to keep the controlled geothermal brine through the heat exchangers IC101 and IC102, when there are changes in thermal oil mass flow rate.
The sizing and rating of the additional heat exchangers considered for the hybrid schemes are determined through the following equation:
where
is the thermal power transferred,
U is the global heat transfer coefficient,
A is the heat transfer area, and
is the logarithmic mean temperature difference, which for a counter flow heat exchanger is expressed as:
where the temperature differences are defined as:
The heat transfer coefficient
U is established in the range between 100 to 450
/(
) for the oil/water heat exchangers, according to Nellis2009 [
35]. On the other hand, for the condensation system the
U value is within the range of 300 to 450
/
).
The heat exchanger effectiveness is defined as follows:
where
is the maximum heat transfer rate, expressed as:
and
, is the minimum heat capacitance of the streams in the heat exchanger, which determined using the following expression:
Likewise, the effectiveness of a counter flow heat exchanger is defined according to Nellis2009 [
35], as follows:
where
is the number of transfer unit defined as the ratio between
and
, and
is the ratio of
and
.
3.2. Air-Cooled Condenser
The power consumption associated with the operation of the fan in air-cooled condensers is set at 0.13 kW/
, according to Ciani_Bassetti2018-ni [
26]. Thus, the energy balance in the condensation process is described as:
where
is the thermal power output due to the condensation of isopentane. According to the exergy balance, the exergy flow transferred to the air is considered as exergy loss and is defined as:
3.3. Turbine
The power produced by the turbines was estimated by assuming adiabatic operation and disregarding the friction losses. Thus, the mechanical power generated in the turbine is expressed as:
where
is mechanically power generated in turbine,
is the isentropic efficiency. For determining the value of
it is employed the Baumann’s rule [
36], which describes the loss in efficiency that represents the wet expansion in terms of the engine performance. Thus, the isentropic efficiency is determined using the following equation:
where
is the efficiency in dry expansion process, which is considered 0.85 for the present study,
and
correspond to the steam quality at the inlet and outlet conditions, respectively. Finally, the turbine drives a generator with an efficiency
, so the electricity generated is expressed as:
3.4. Solar Collector Field and Thermal Energy Storage
PTC were chosen to be considered in the hybrid solar geothermal schemes, considering its availability in the market and that PTC are considered a mature technology. The yield of the solar field was simulated in SAM, which simulation considers the local meteorological conditions, the efficiency parameters of the collectors, the solar field layout, partial load performance profile, and the thermophysical properties of the HTF used in simulations. The reference irradiance was considered as 1100
/
which represents the 85% percentile of the TMY database. The aforementioned parameters are summarized in
Table 1.
A parametric evaluation was carried out to analyze the integration of the solar and geothermal systems, where the solar field nominal conditions were varied. The parameters considered in this parametric assessment are the nominal thermal power delivered from the solar field to the system, the solar multiple, the size of the storage system, and the outlet and inlet temperatures of the solar collectors. Thus, it aroused in 4620 integration strategies that were are analyzed in the parametric evaluation, which are summarized in
Table 2.
3.5. Silica Precipitation
Geothermal conversion systems are susceptible to mineral precipitation, which may affect the power cycle operation or even change the permeability conditions in the reinjection well. Because of that, considering that the hybrid schemes proposed herein would change the operation point of the geothermal system, the present study considers a verification of the silica precipitation risk. Such procedure allows determining the exposure to precipitation in each stream of the geothermal system.
Silica precipitation could occur in different structural shapes, from amorphous silica to crystalline (such as quartz). These have different solubility curves, and the temperature could affect silica precipitation. Due to the different solubility curves, each stream in the geothermal cycle has a different precipitation risk. For instance, the geothermal well may control quartz formation, while amorphous silica formation may be controlled when the geothermal fluid transfers heat to the power cycle.
Silica solubility is temperature, pH, and salinity dependent; however, for the present analysis salinity and pH are assumed as constants. Hence, the silica concentration is evaluated in temperature terms. According to DiPippo2012 [
36] the concentration at the initial state is expressed as:
where
is geothermal fluid temperature (expressed in Celsius) at extraction from the well and
corresponds to the concentration in
. Regarding the silica solubility in pure water, it is temperature dependant as described by the following equation proposed by [
37]:
where
is in mg/kg or ml/kg, and the temperature ranges between 0 to 250
.
Due to the steam generation and separation process, the silica concentration increases, as stated by the following expression [
36]:
where
x is the quality of the geothermal two-phase mixture and
S is the amorphous silica concentration.
To integrate silica precipitation risk in the simulations, it is assumed that mineral oversaturation occurs when the brine reaches temperatures lower or equal to 85
. Therewith, the value of
is
/
. This value is used as a threshold to analyze the stream where precipitation could occur. Therefore, to evaluate the precipitation risk in Cerro Pabellón is defined
as critic ratio, expressed as:
where
is the silica concentration in i, and
is the value where mineral precipitation begins, considering the temperature in this state.
In the base case configuration (see
Figure 4), states (WC.6) and (WC.9) present higher precipitation risk, 0.53 and 0.93, respectively. Due to these results, it is pointed out that higher risks are observed at the reinjection stage. In the analyses of the integration strategies, the operation of the ORC is not affected, since the state with higher precipitation risk is in (WC.10), after partial evaporation of brine, where the silica concentration increases due to the evaporation. However, the critic ratio in this stream must not exceed 0.6, reaching 0.524 in CH01-30, 0.526 for CH01-40, 0.539 in CH02-50 and 0.553 in CH02-60 integration strategy, bringing a low risk of silica precipitation in all cases analyzed.
3.6. Economic Evaluation
The comparison of the integration strategies is carried out in terms of the Levelized Cost of Energy (LCOE). This economic parameter allows assessment of the investment and operational costs associated with electricity production in the project lifetime. The LCOE definition is expressed as follows:
where
is the initial investment,
and
are operation and maintenance costs (O&M), and electric production in year
t, respectively.
j corresponds to the discount rate and
n is the project lifetime assumed in 7% and 30 years, respectively. The numerical values of the economic parameters considered for the evaluation are summarized in
Table 3, which follows the recommendations in [
38].
6. Conclusions
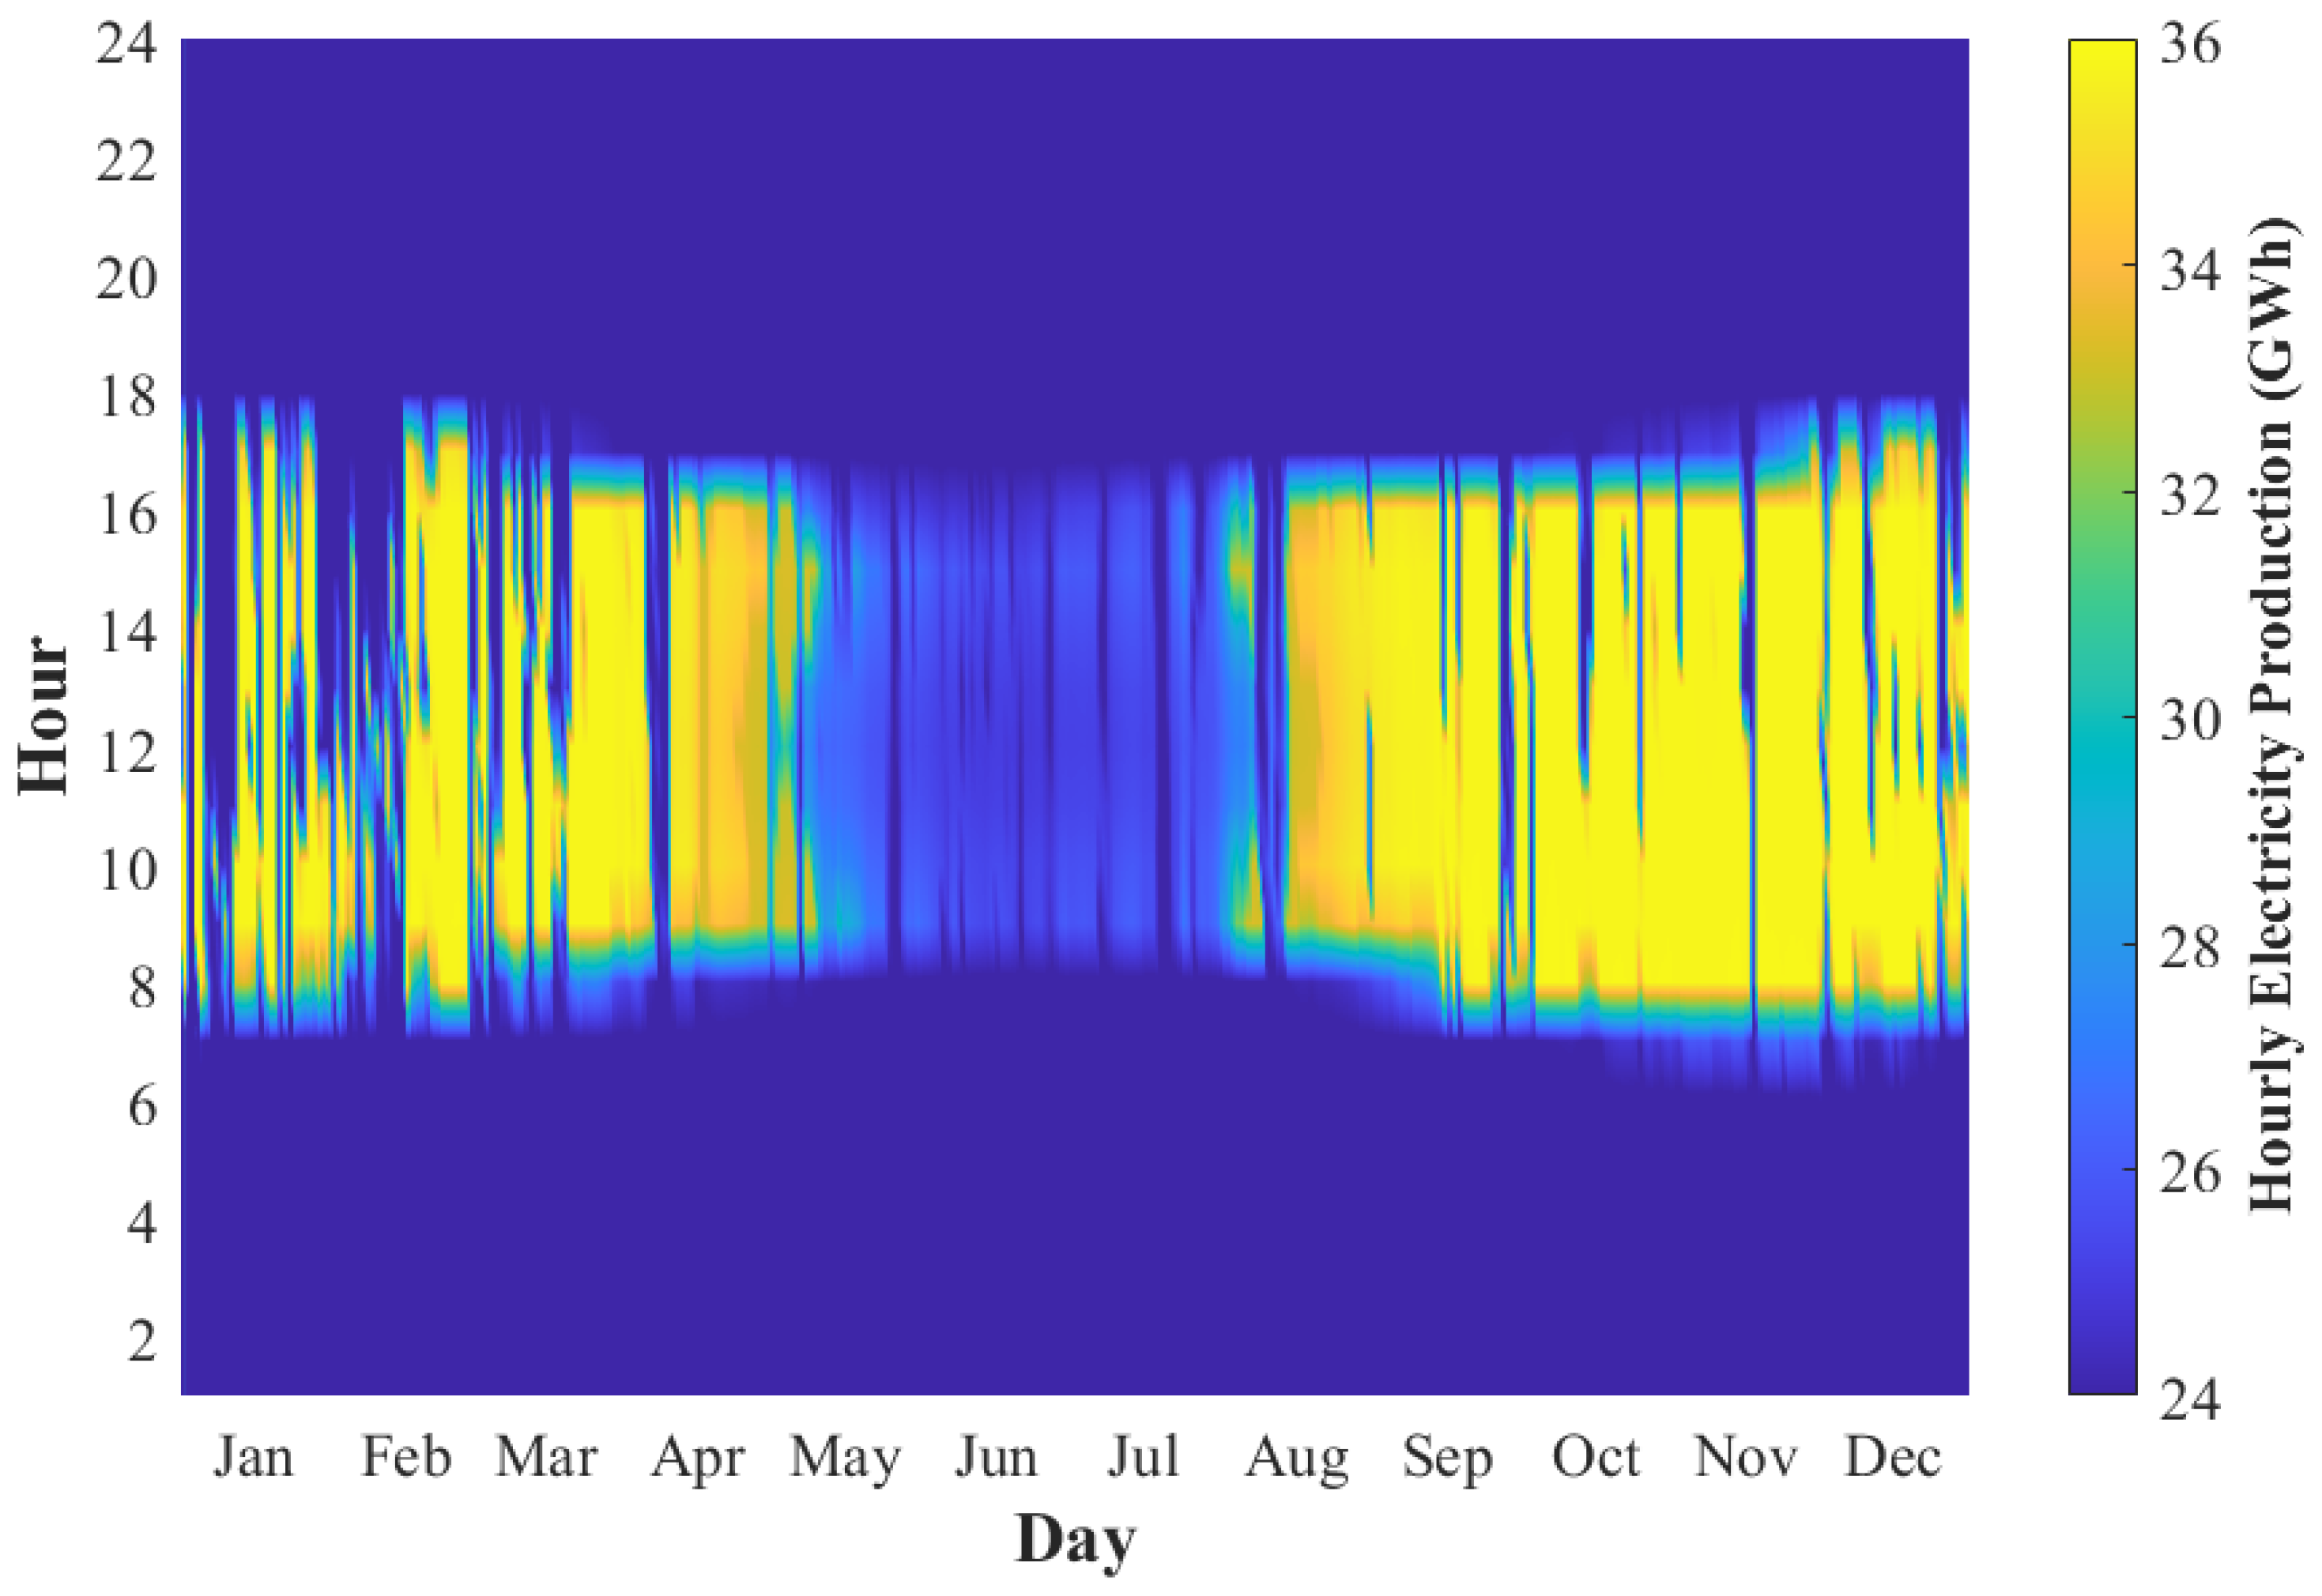
The analysis of the hybridization of solar and geothermal systems was carried out by simulating the yield of a PTC solar field coupled to a binary cycle with equivalent features as in the Cerro Pabellón geothermal plant. Novel hybrid schemes were analyzed, aiming to assess the integration between both subsystems, considering the location meteorological characteristics and environmental constraints. The introduction of such constraints enhances the analysis carried out in previous studies about hybrid solar and geothermal plants, by including restrictions associated with the actual operation conditions in a geothermal system. The proposed integration schemes consider the implementation of a new power block, ensuring to keep constant the operation conditions of the ORC, avoiding silica precipitation events and the reinjection of brines at equivalent temperatures. Furthermore, different solar thermal capacities, TES hours, solar multiple, and nominal operational temperatures were analyzed, configuring 4620 integration scenarios.
The simulations were carried out in EES and SAM software, allowing to assess the operation of the hybrid schemes in steady and transient states. As for those simulations, a solar field of 30 is able to increase the electricity generation in , while a solar field of 60 increases in , rising the plant’s capacity to 36 . regarding the thermal efficiency of the hybrid solar geothermal schemes, low changes were observed associated with the hybridization, this low effect is due to the operating constraints imposed by the silica precipitation risk, and by the restriction of preserving the original operating temperatures of the ORC, which are associated to environmental and social requirements. Those restrictions affect the exergy efficiency, where low values of efficiency were scoped, between 38% and 40%.
In the exergy analysis, the highest exergy destruction occurs at the heat exchanger devices, specifically in IC101 and IC102, where brine preheating and partial evaporation are carried out, which is a crucial factor for the value of nominal operational temperature of thermal oil. Indeed, the lowest exergy destruction rates correspond to the hotter temperature in the solar field ( 370 ) and the return temperature to solar field ( 200 ). However, heat exchanger devices with greater exergy efficiency are also more expensive, compared with heat exchangers with lower exergy efficiency.
In terms of the annual electricity production estimated for the scenarios analyzed herein, the most influential parameters are the size of the solar field (solar multiple) and the size of the TES system (TES hours), where the hybridization may increase from (solar multiple equal 1 and 2 h of TES) to (considering the solar multiple of 3.6 and 12 h of TES) annual electricity production. Those rating parameters also present an impact on the capacity factor of the solar plant, ranging from 18%, when solar multiple is 1 and no TES is considered, to 71% considering a solar multiple of 3 and 12 h of TES. Thus, the capacity factor is close to the reference values for the conventional power plants, offering high competitiveness as optimal increases in solar multiple and TES hours are evaluated.
Regarding the values of the LCOE, the optimal values were reached when the additional capacity installed is about , where the solar multiple is 2.8 and 12 h of TES is considered. Such configuration achieves an LCOE of /, which represents a reduction of 9.8% regarding a stand alone geothermal plant (about 90 / in a 20 geothermal plant). However, the LCOE can increase significantly for other configurations of solar multiple and TES sizes. The lowest LCOE values achieved in the present study could increase the competitiveness of geothermal plants in terms of high generation, high capacity factor, high reliability, low variability, and in terms of economic performance.
In future studies, the authors propose considering the integration of a PV plant, which could operate with the solar thermal plant evaluated in this work. Such a configuration could help to enhance the electricity generation from solar and geothermal sources, as implemented in the Stillwater solar geothermal plant (USA). Combining those technologies, the electricity generation could increase significantly, while operational costs may decrease, reducing LCOE levels. Consequentially, the integration of solar heat into a geothermal plant, such as Cerro Pabellón, could configure a competitive system for delivering clean, secure and reliable electricity.


 ,
, 


