
Effective Inhibition of Carbon Steel Corrosion by Waterborne Polyurethane Based on N-tert-Butyl Diethanolamine in 2M HCl: Experimental and Computational Findings

 , and
, and 
Abstract
:1. Introduction
2. Experiment
2.1. Materials
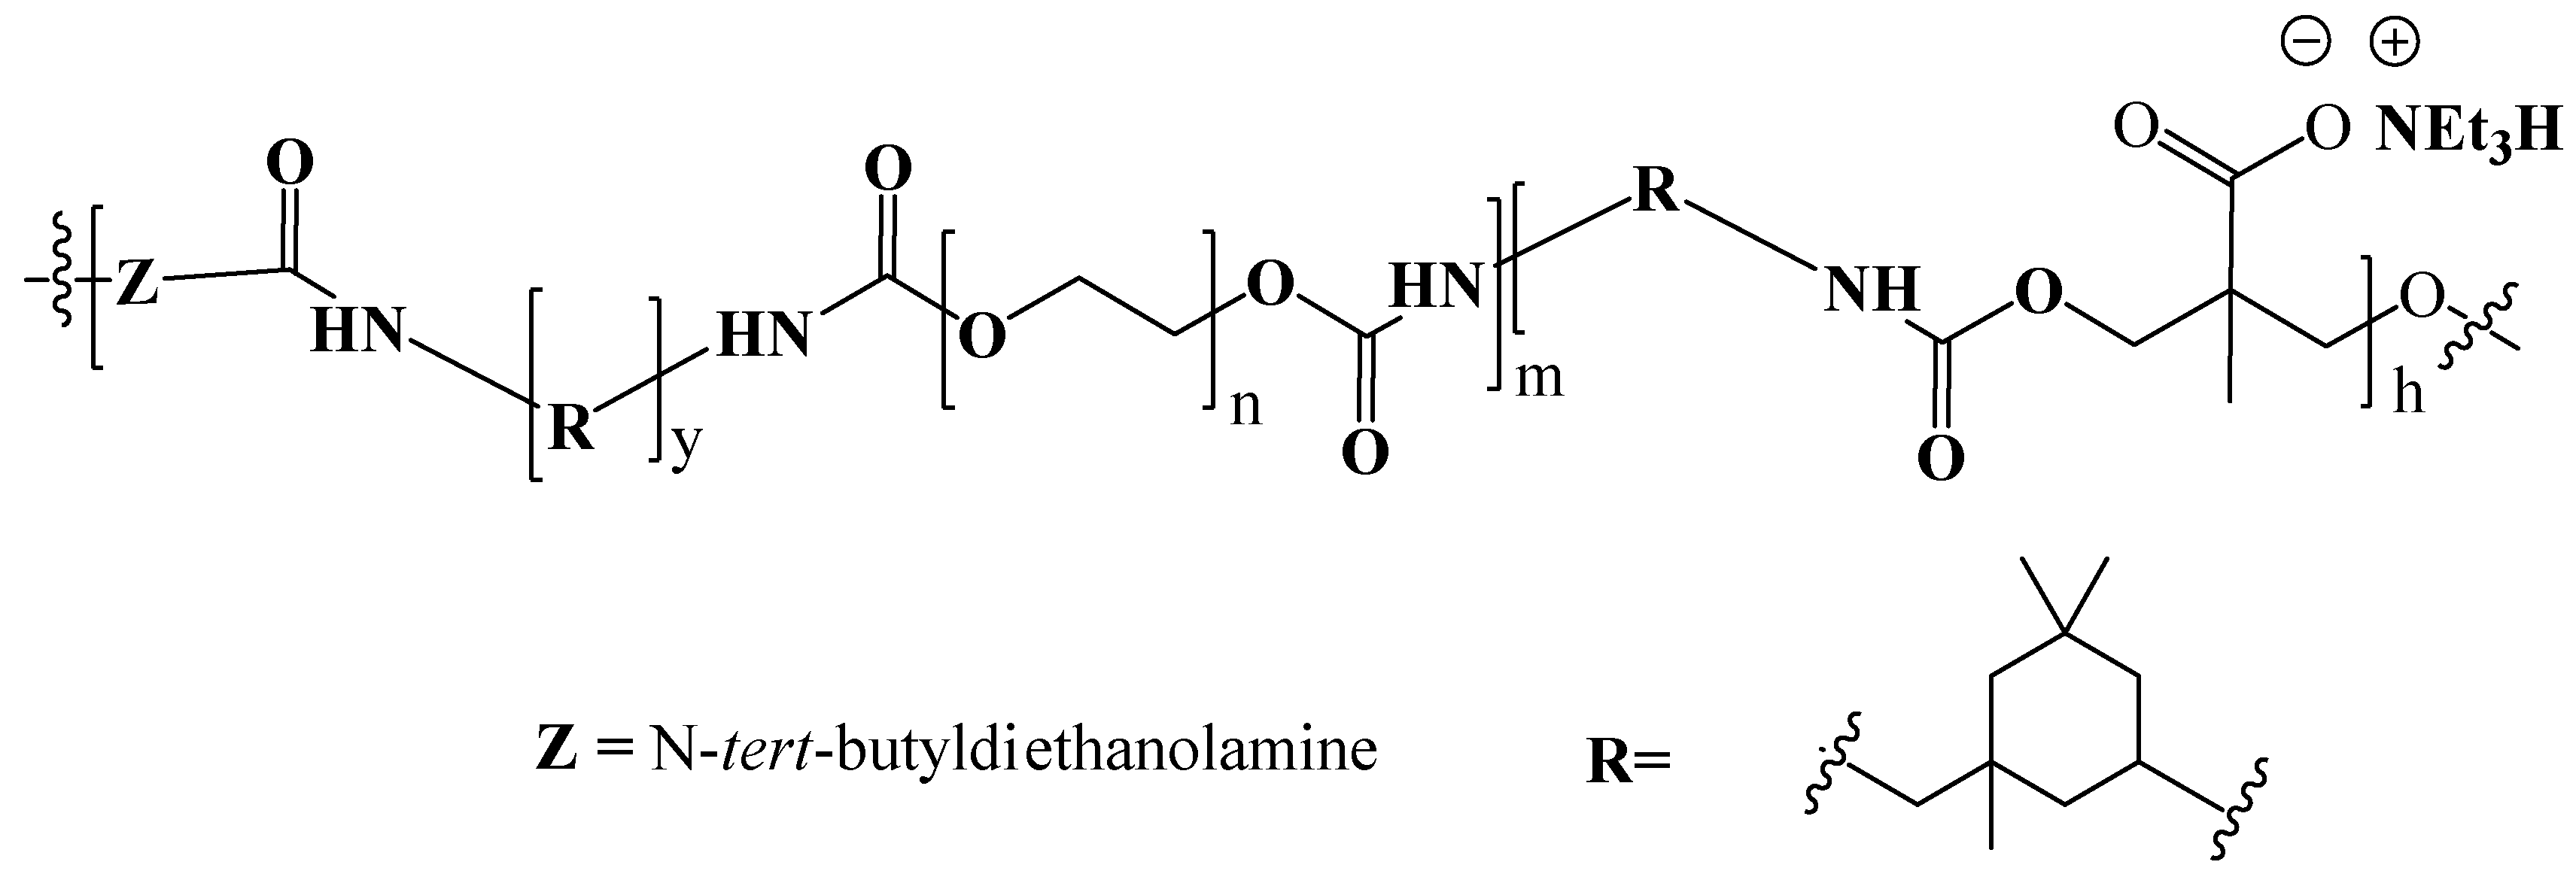
2.2. Synthesizing Waterborne Polyurethane
2.3. Corrosion Weight Loss Experiments
2.4. Electrochemical Measurements
2.5. Quantum–Chemical Calculations
2.6. Studying Surface Morphology
3. Results and Discussion
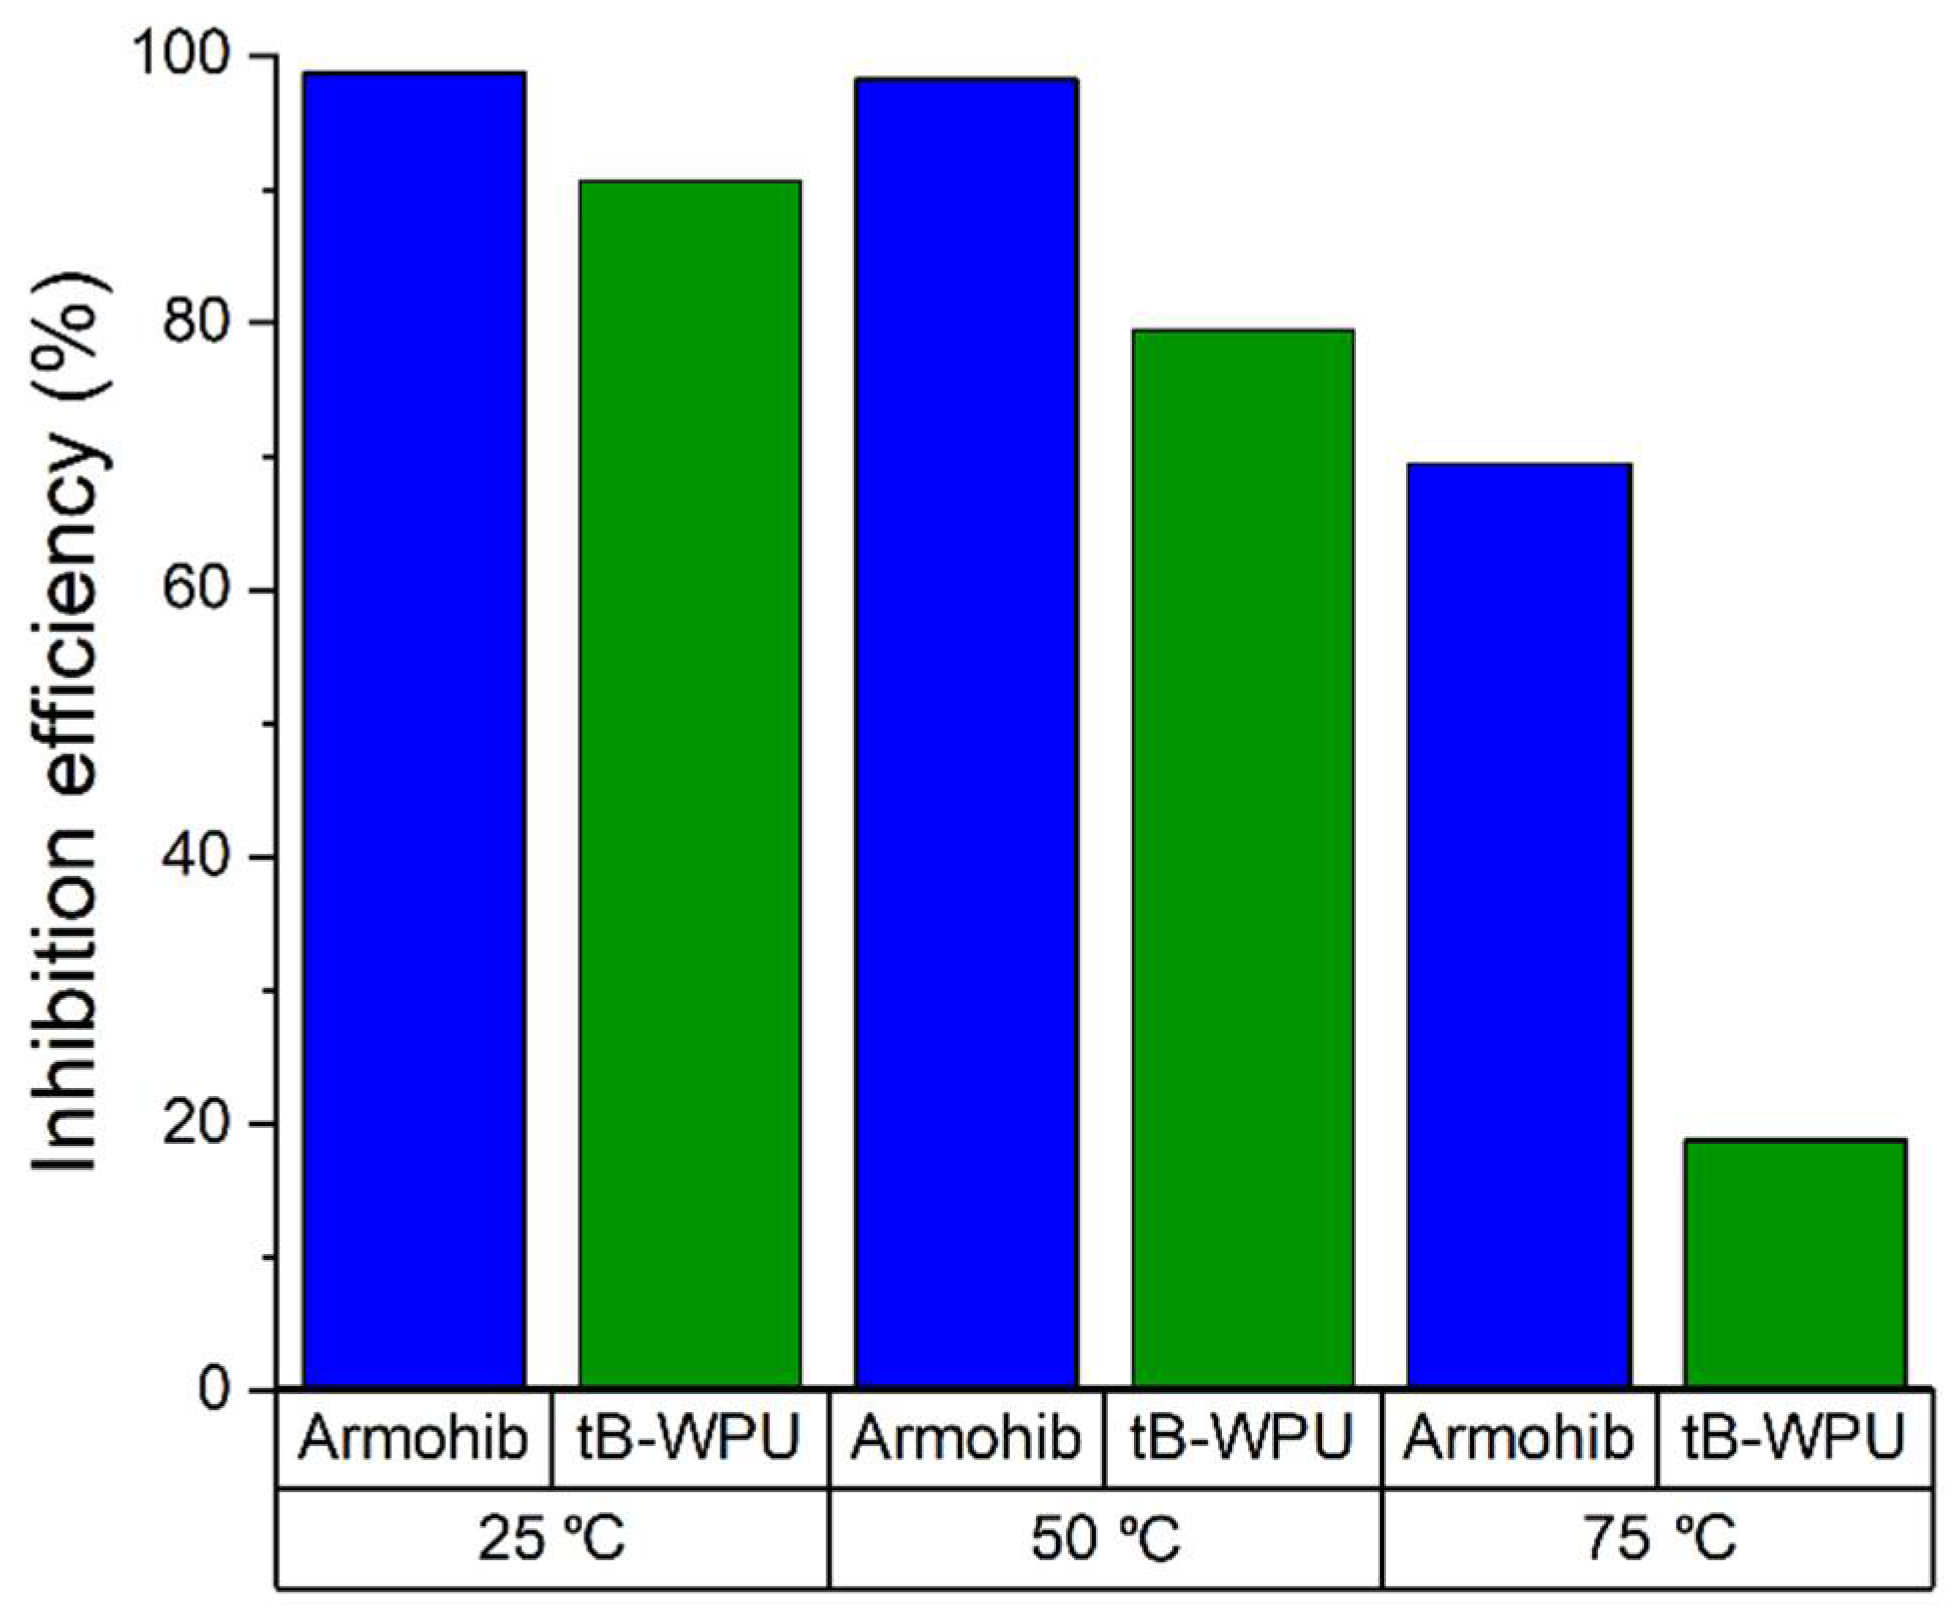
3.1. Weight Loss Experiments
3.2. Electrochemical Measurements
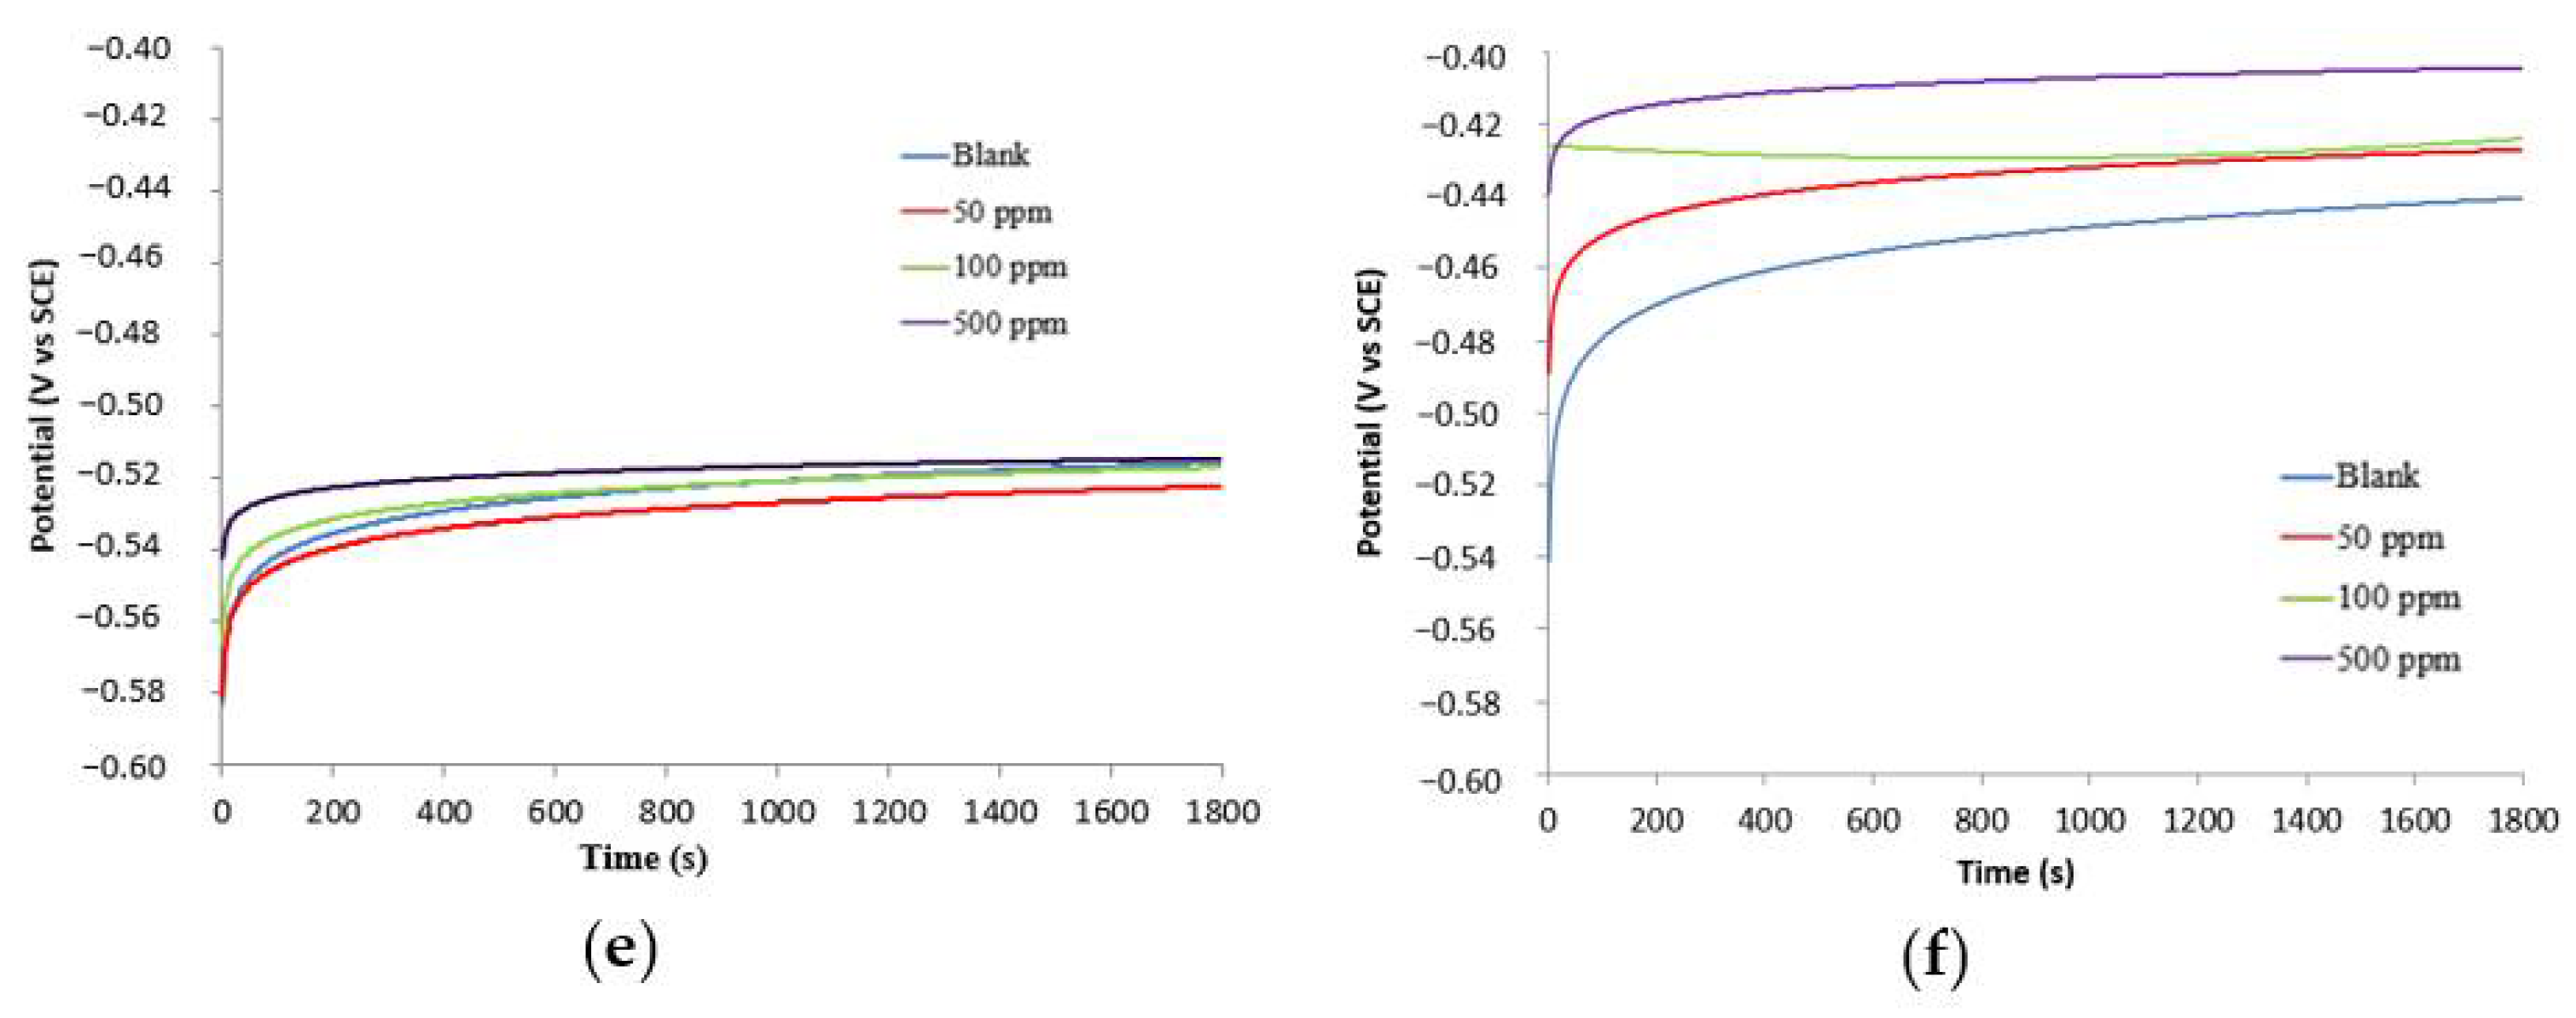
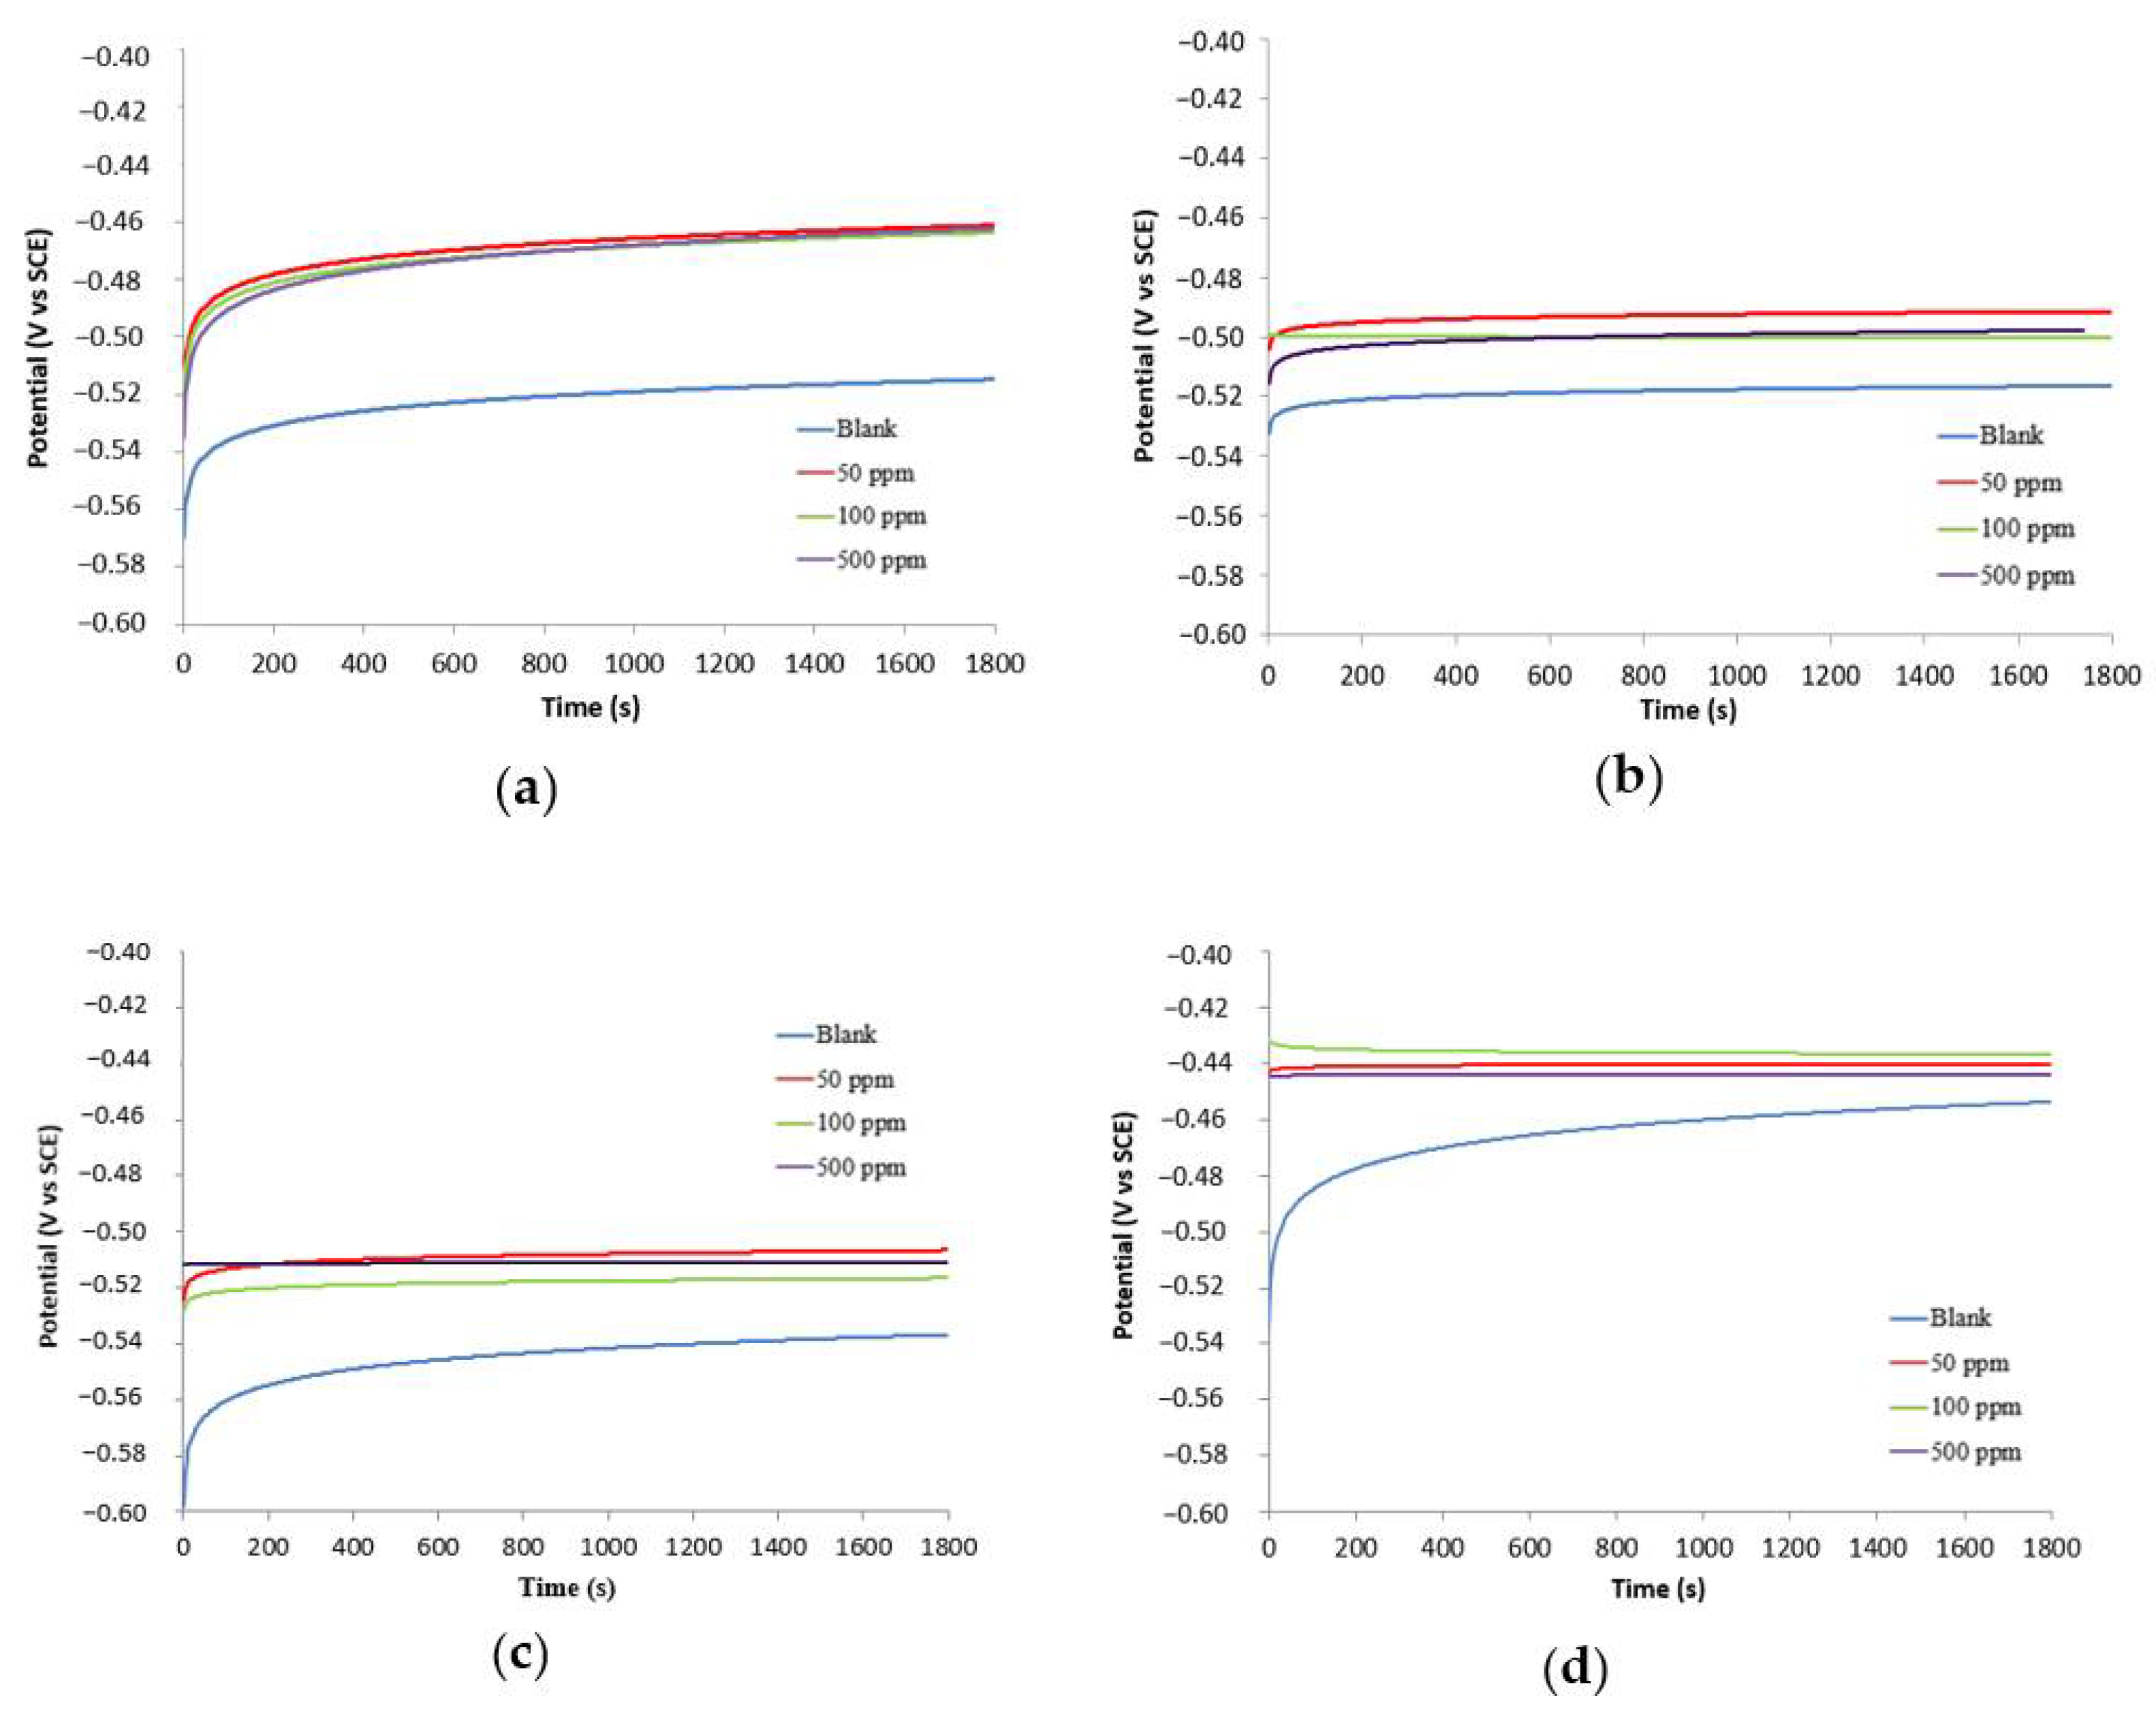
3.2.1. Open Circuit Potential (OCP) Experiments
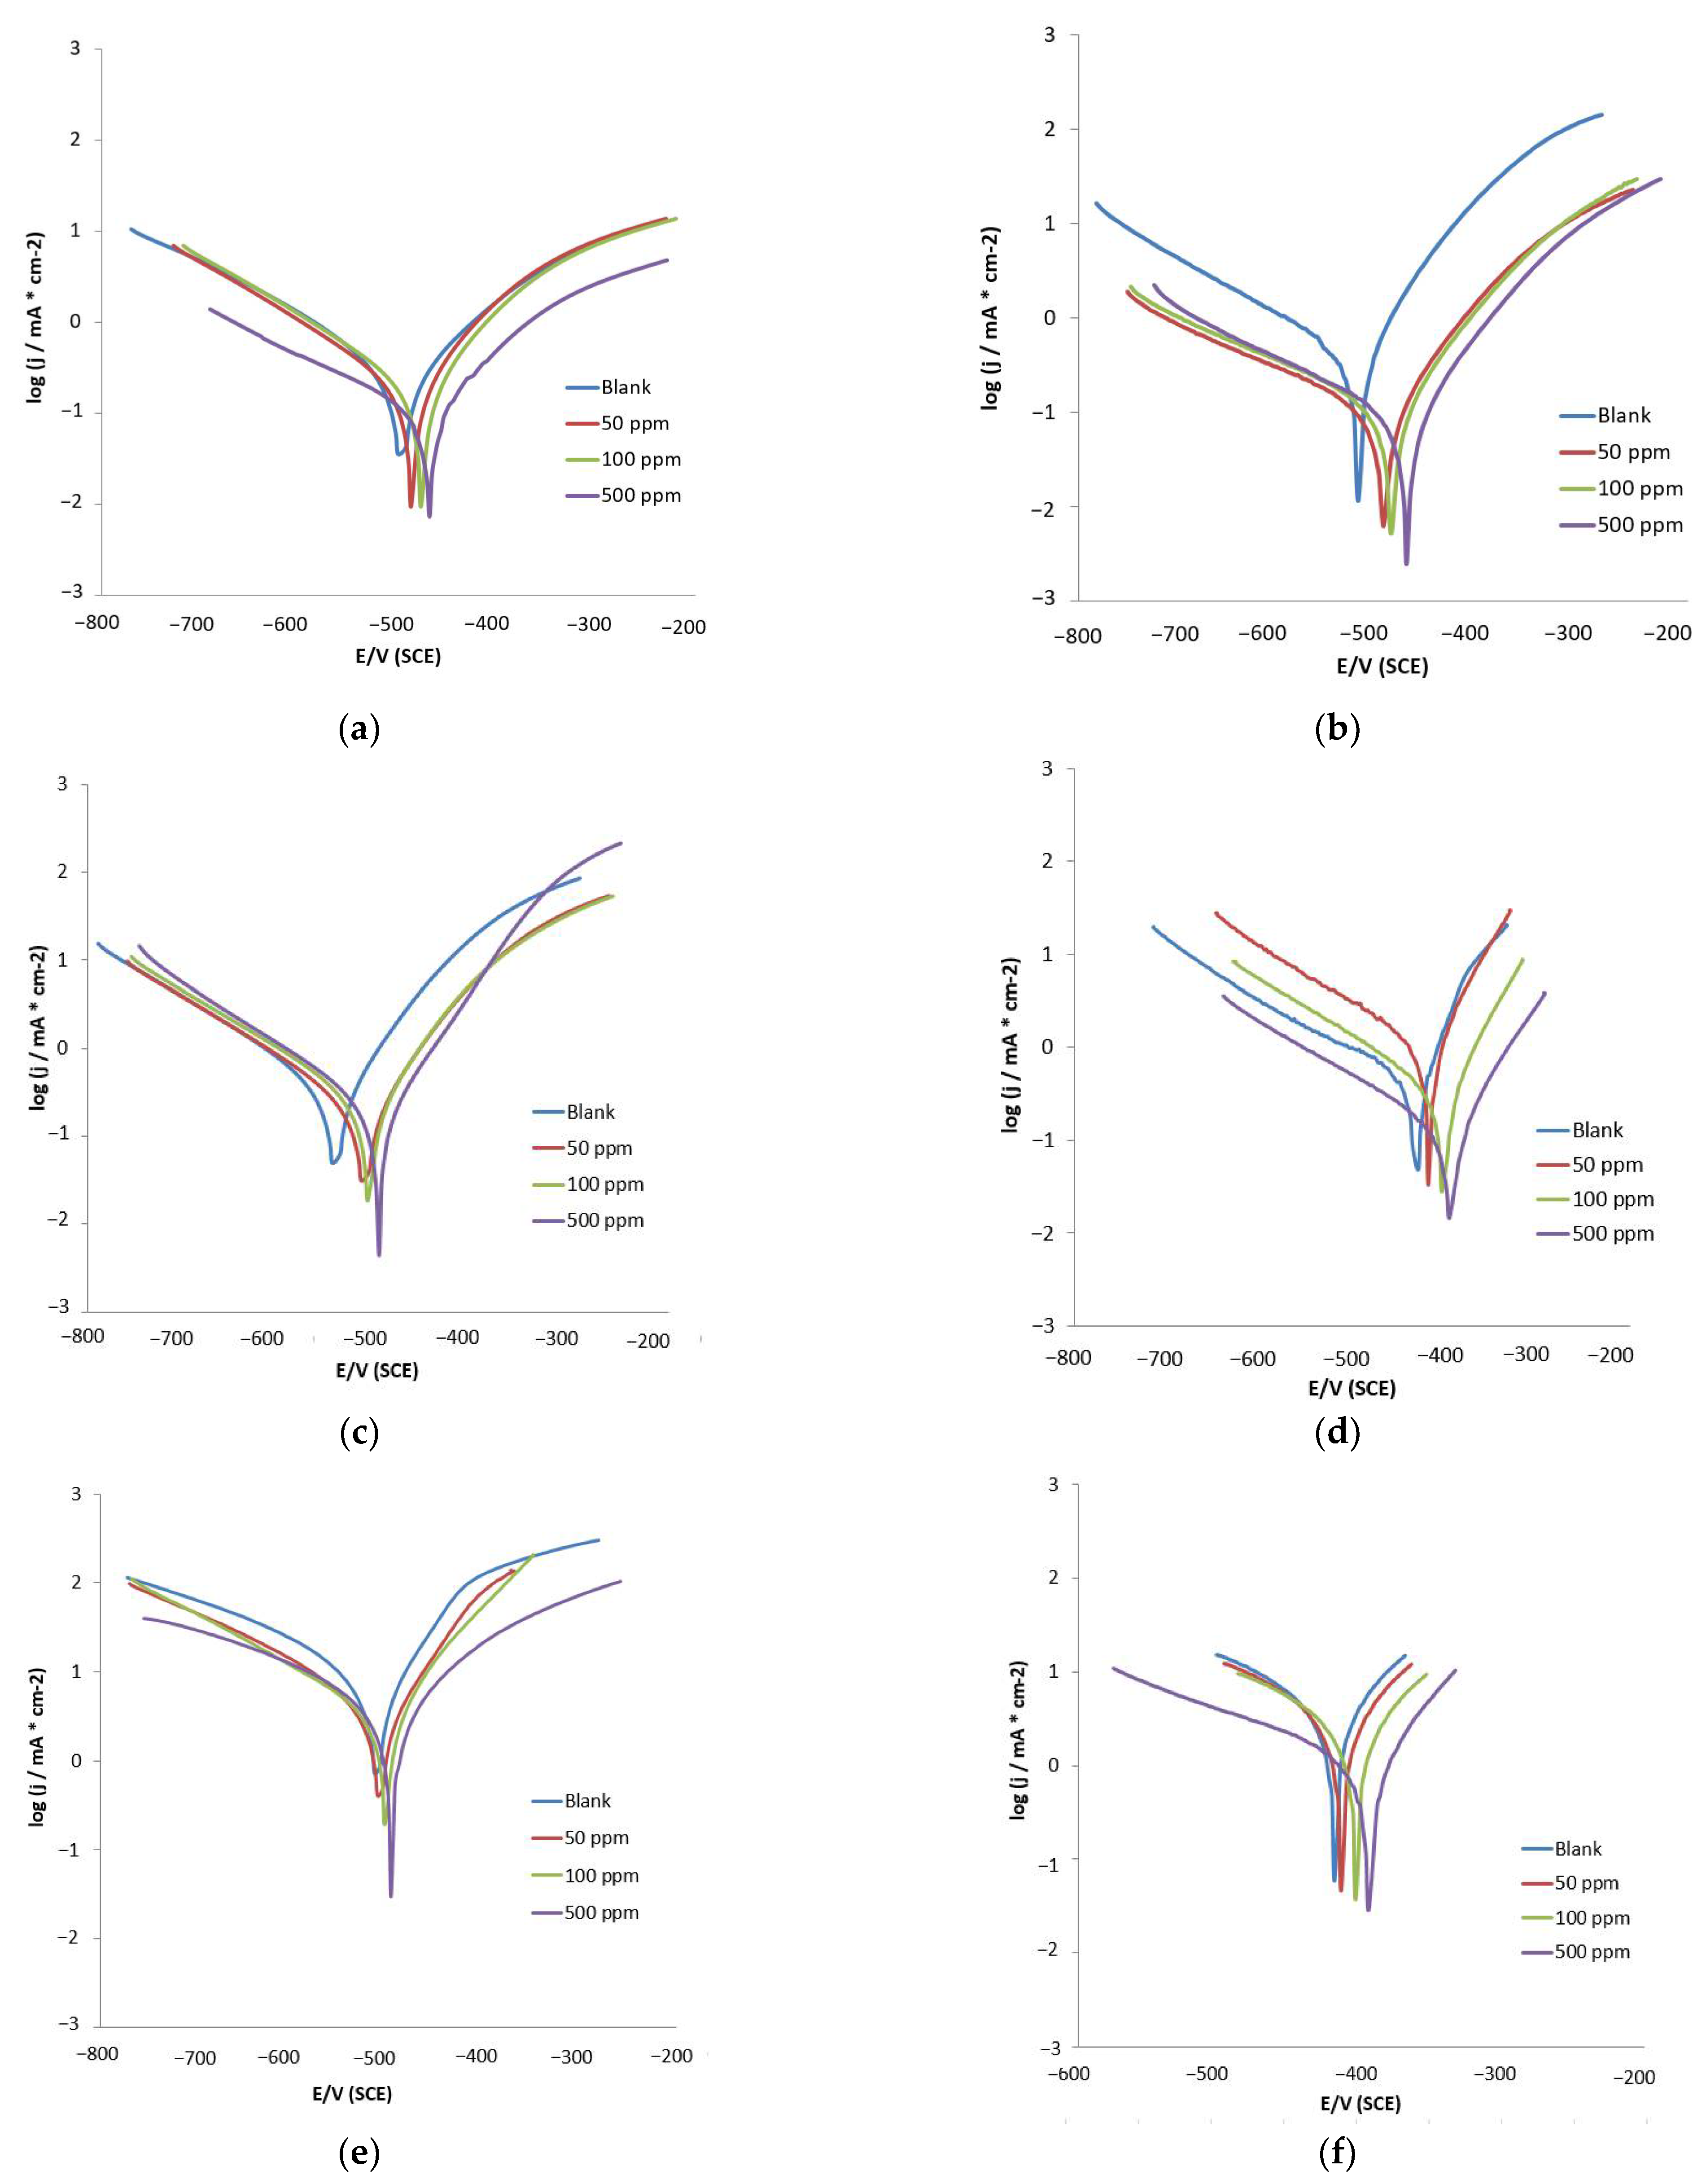
3.2.2. Potentiodynamic Polarization (PDP) Measurements
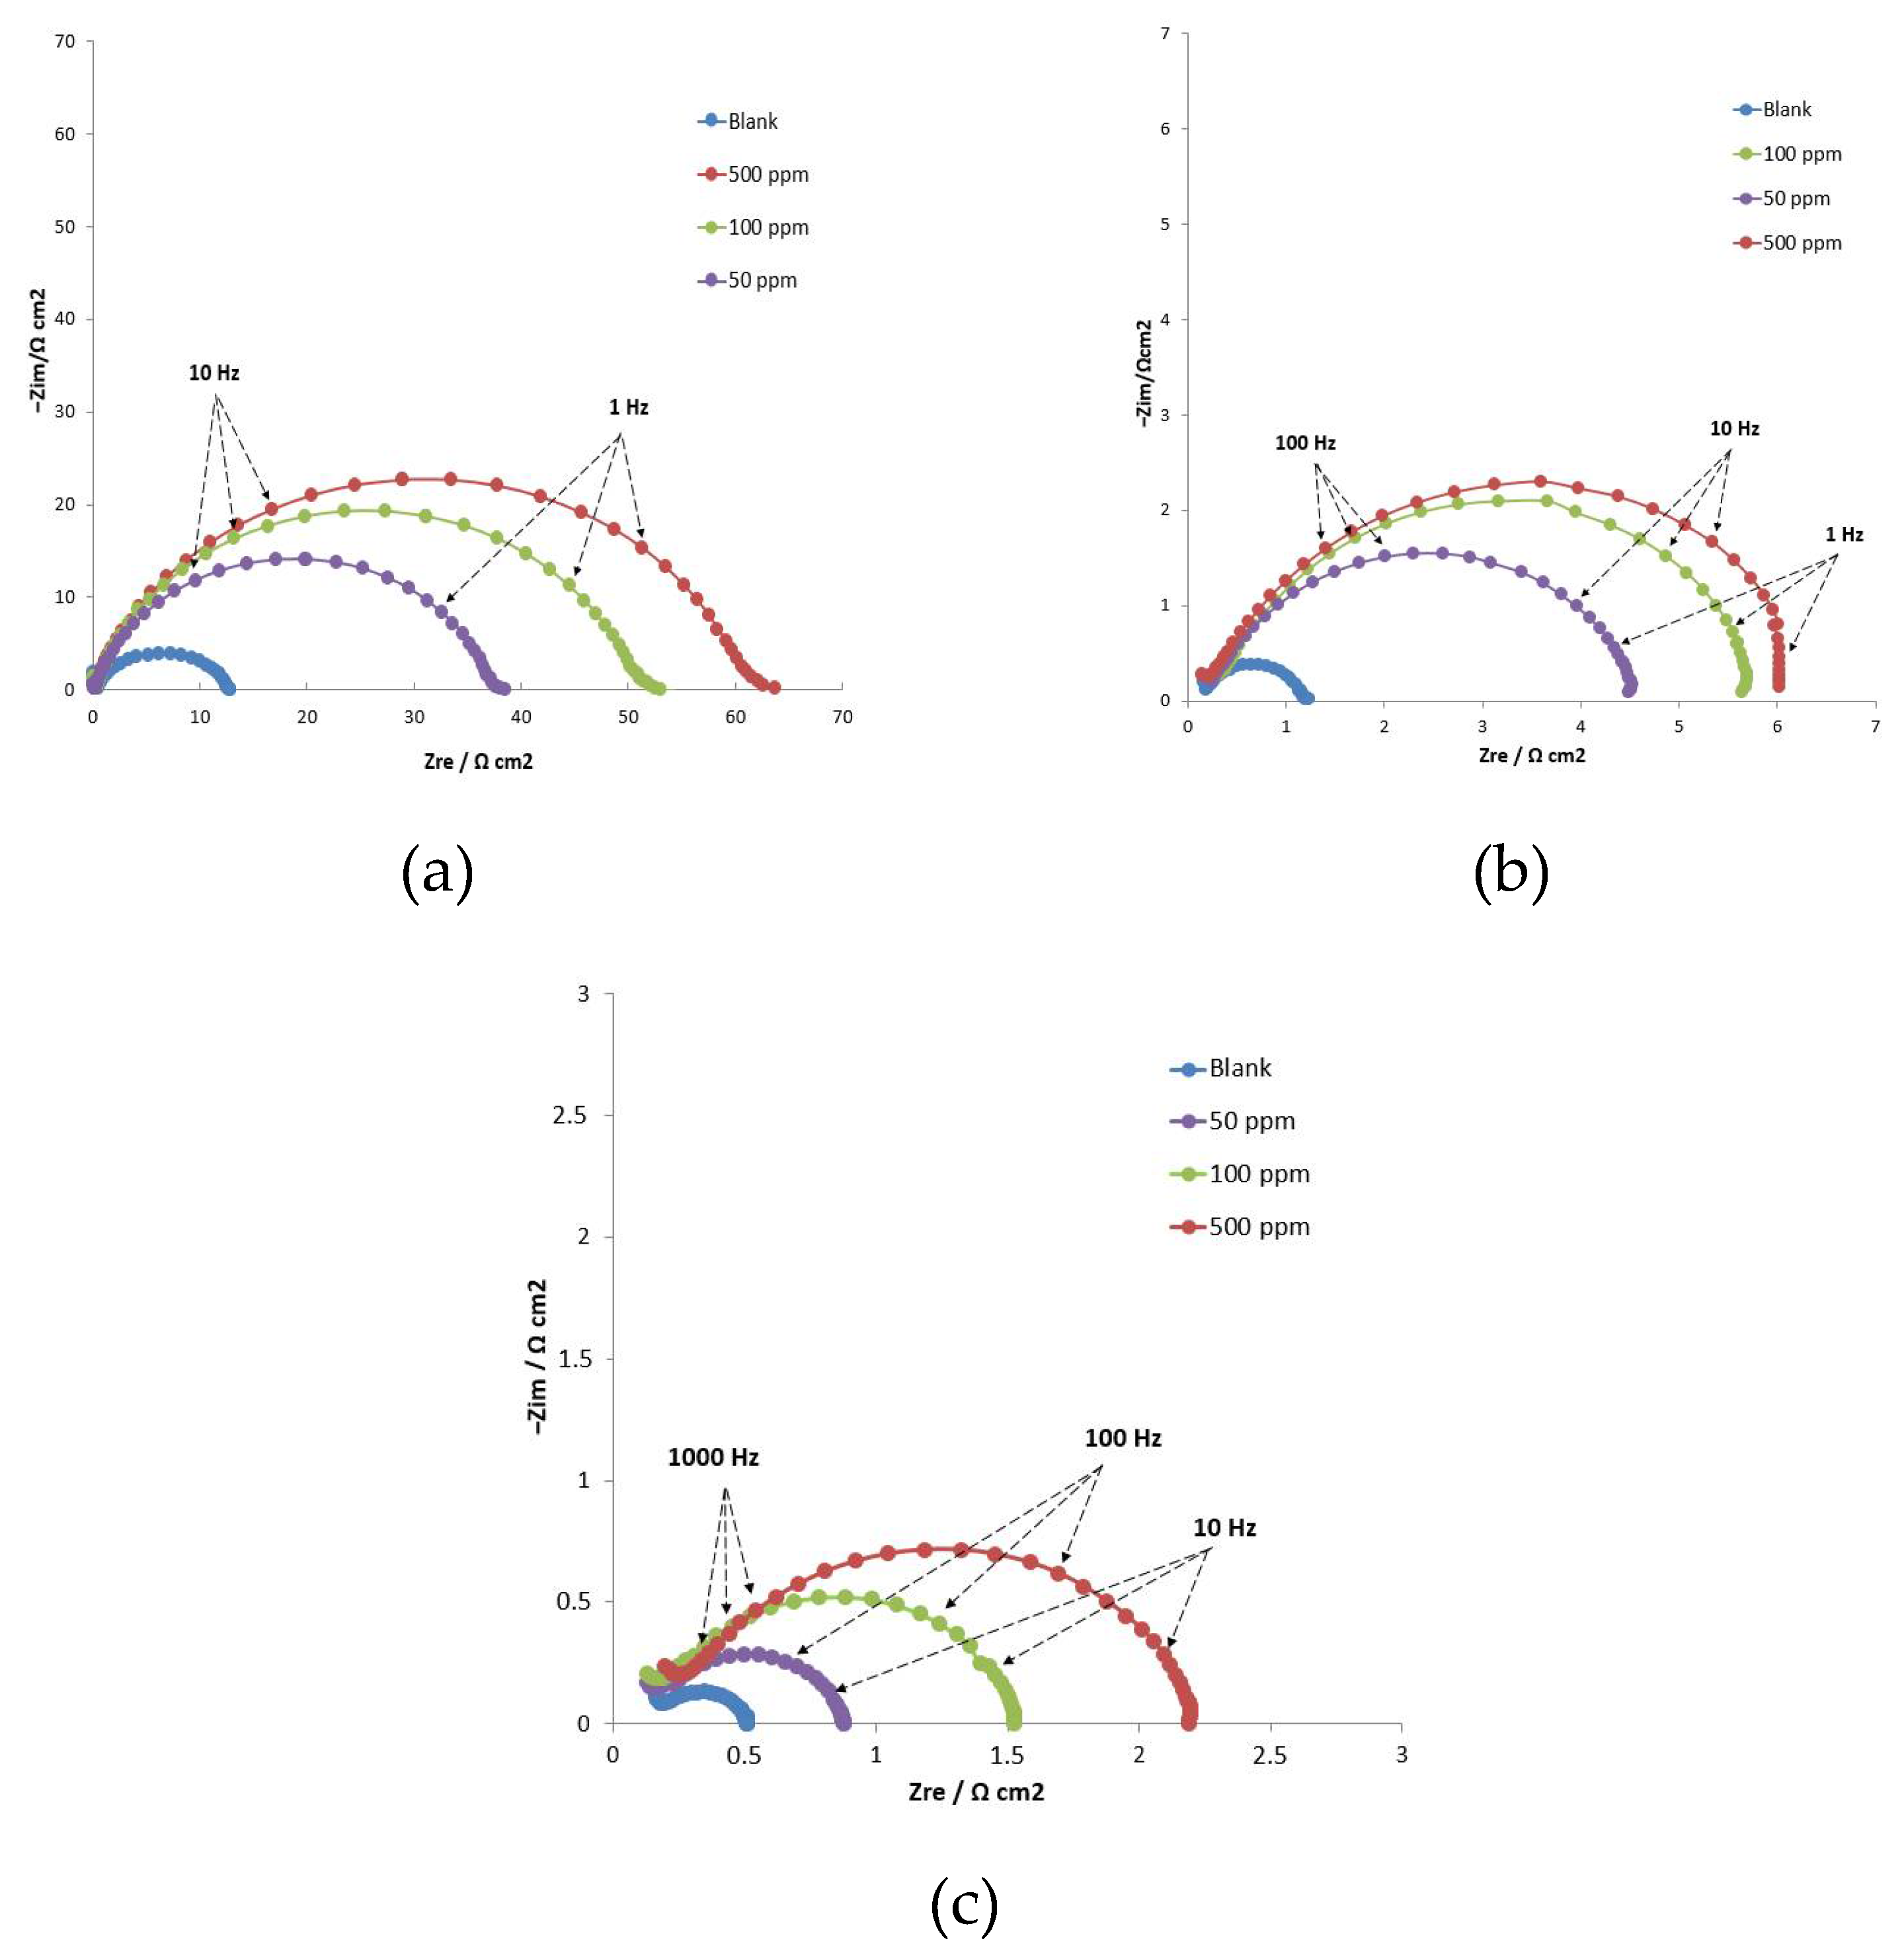
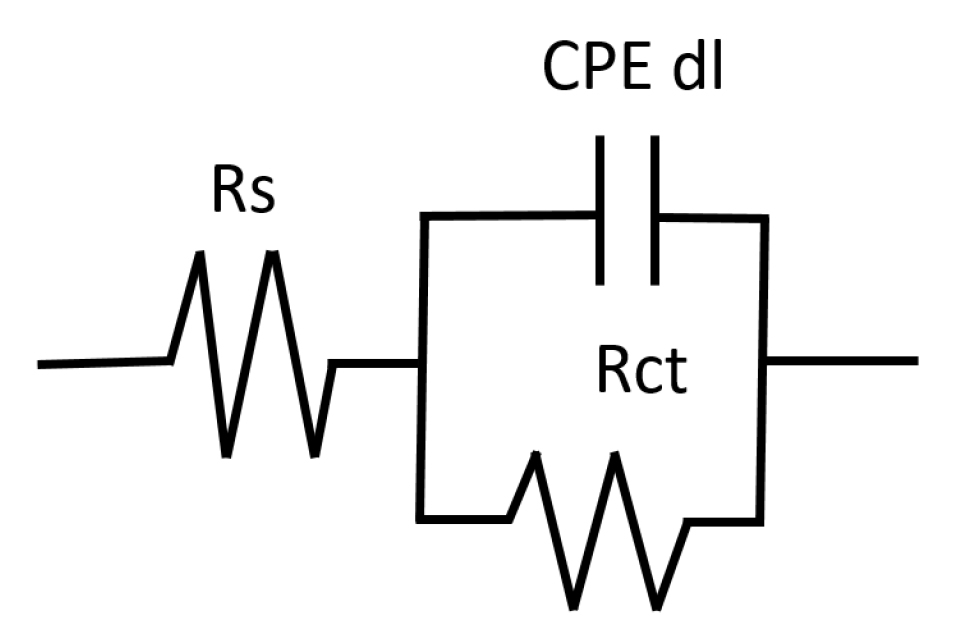
3.2.3. Electrochemical Impedance Spectroscopy (EIS)
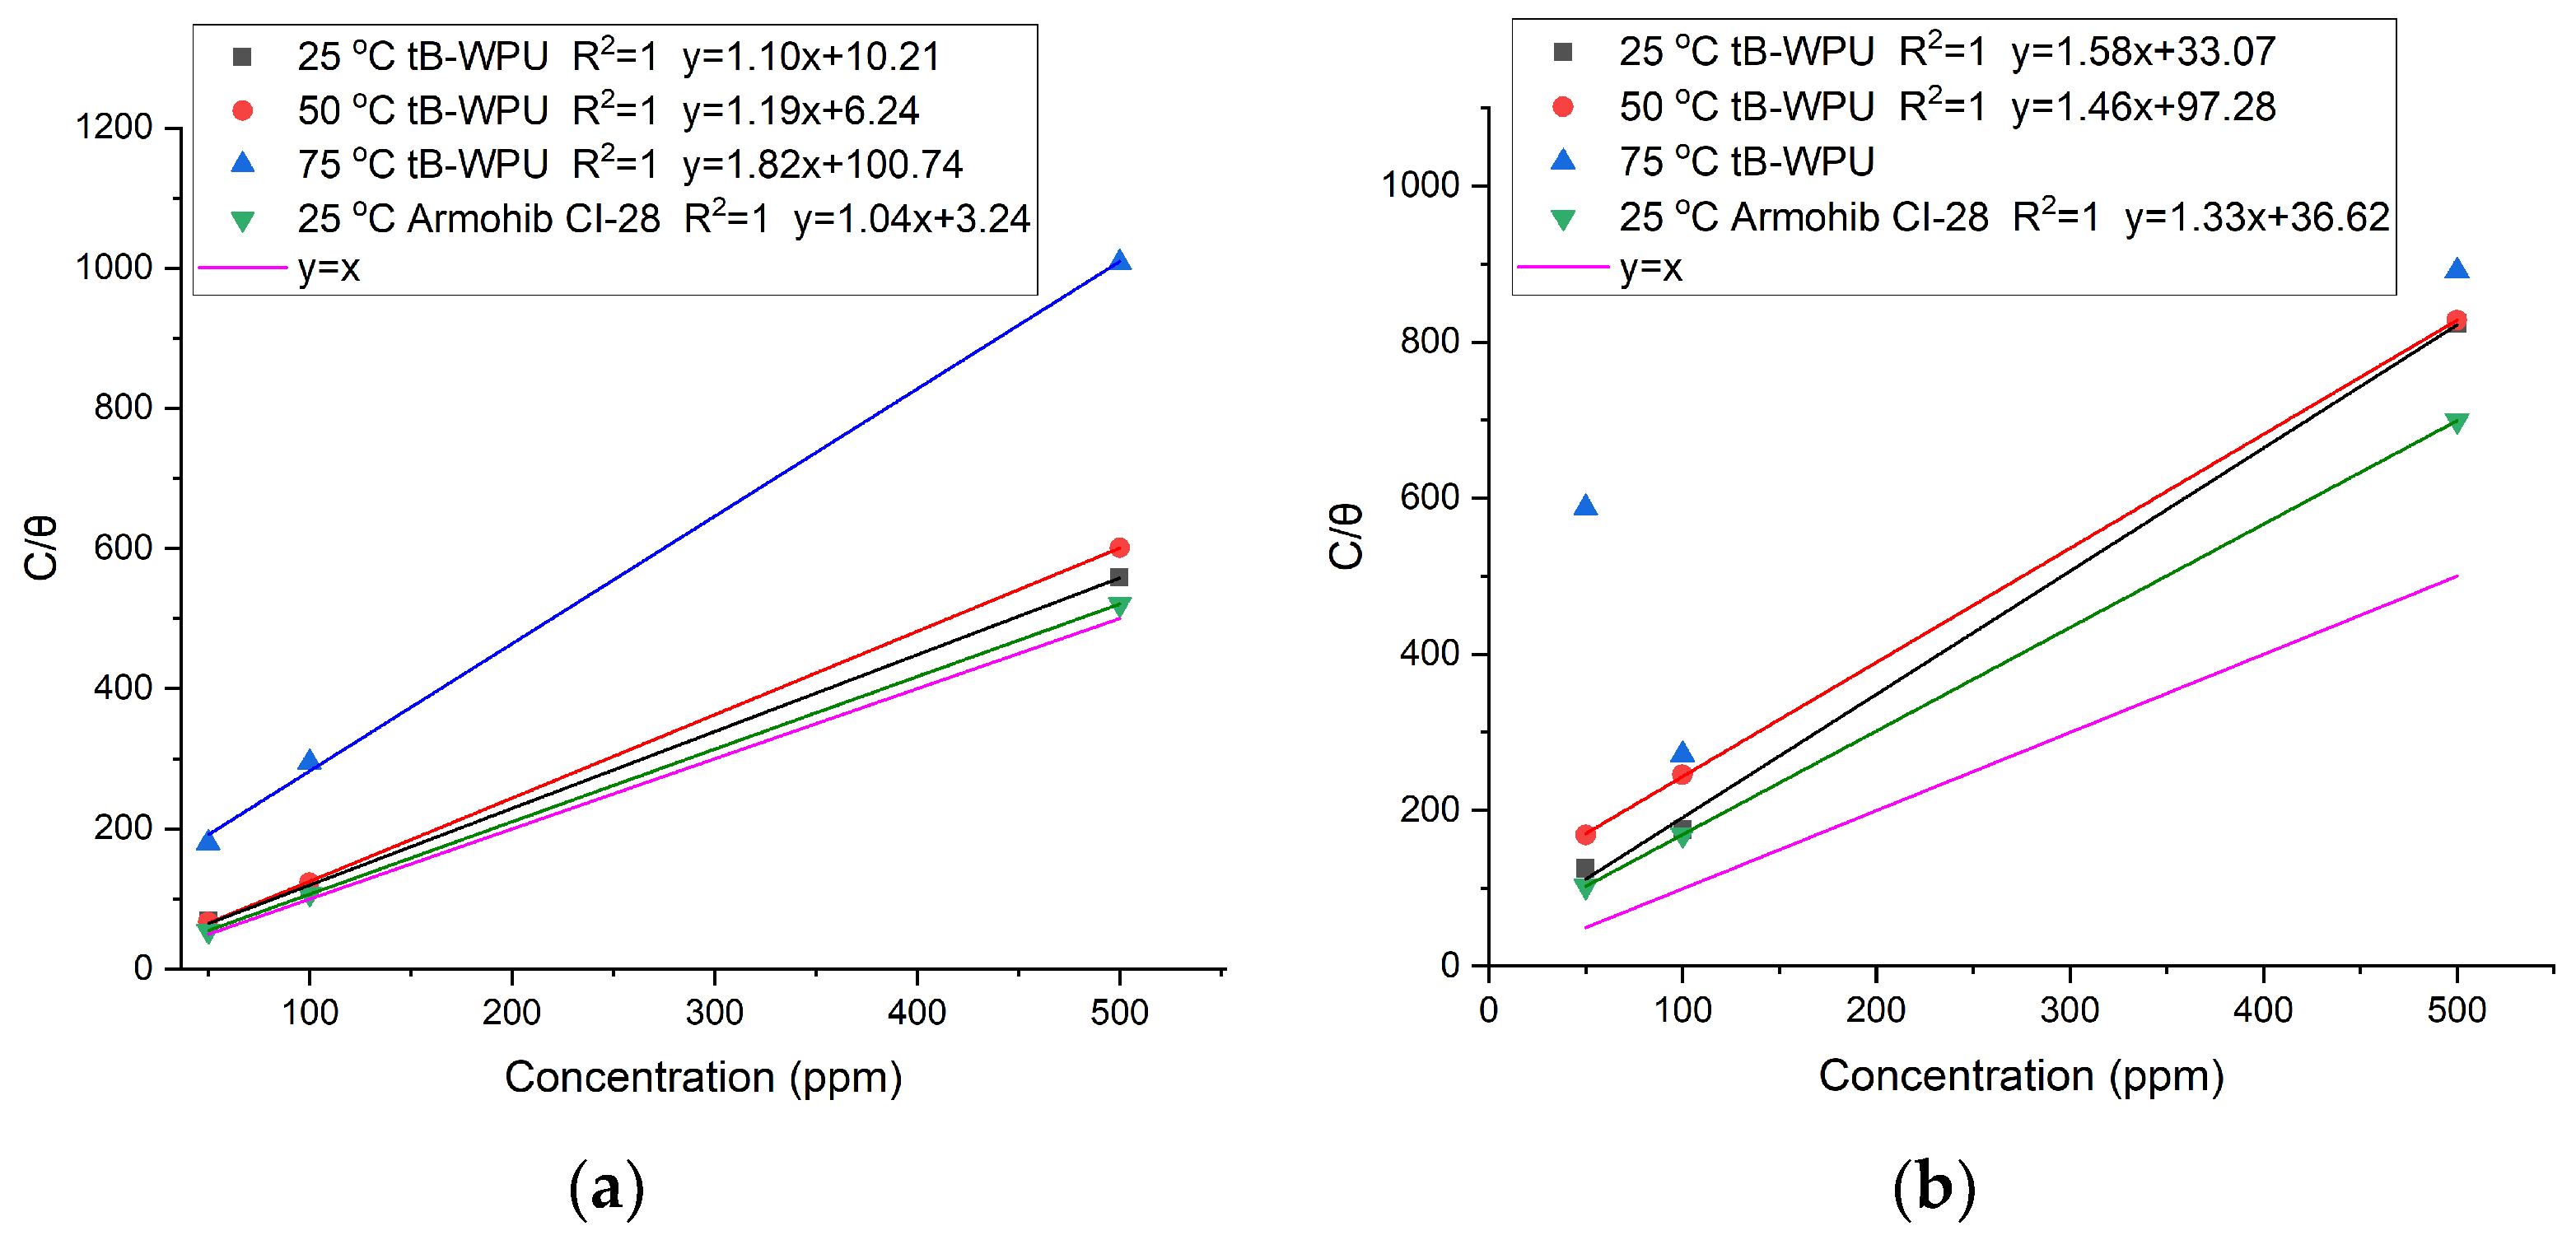
3.3. Adsorption Isotherm and Thermodynamic Calculations
3.4. Activation Energy and Temperature Effect on Corrosion Kinetics
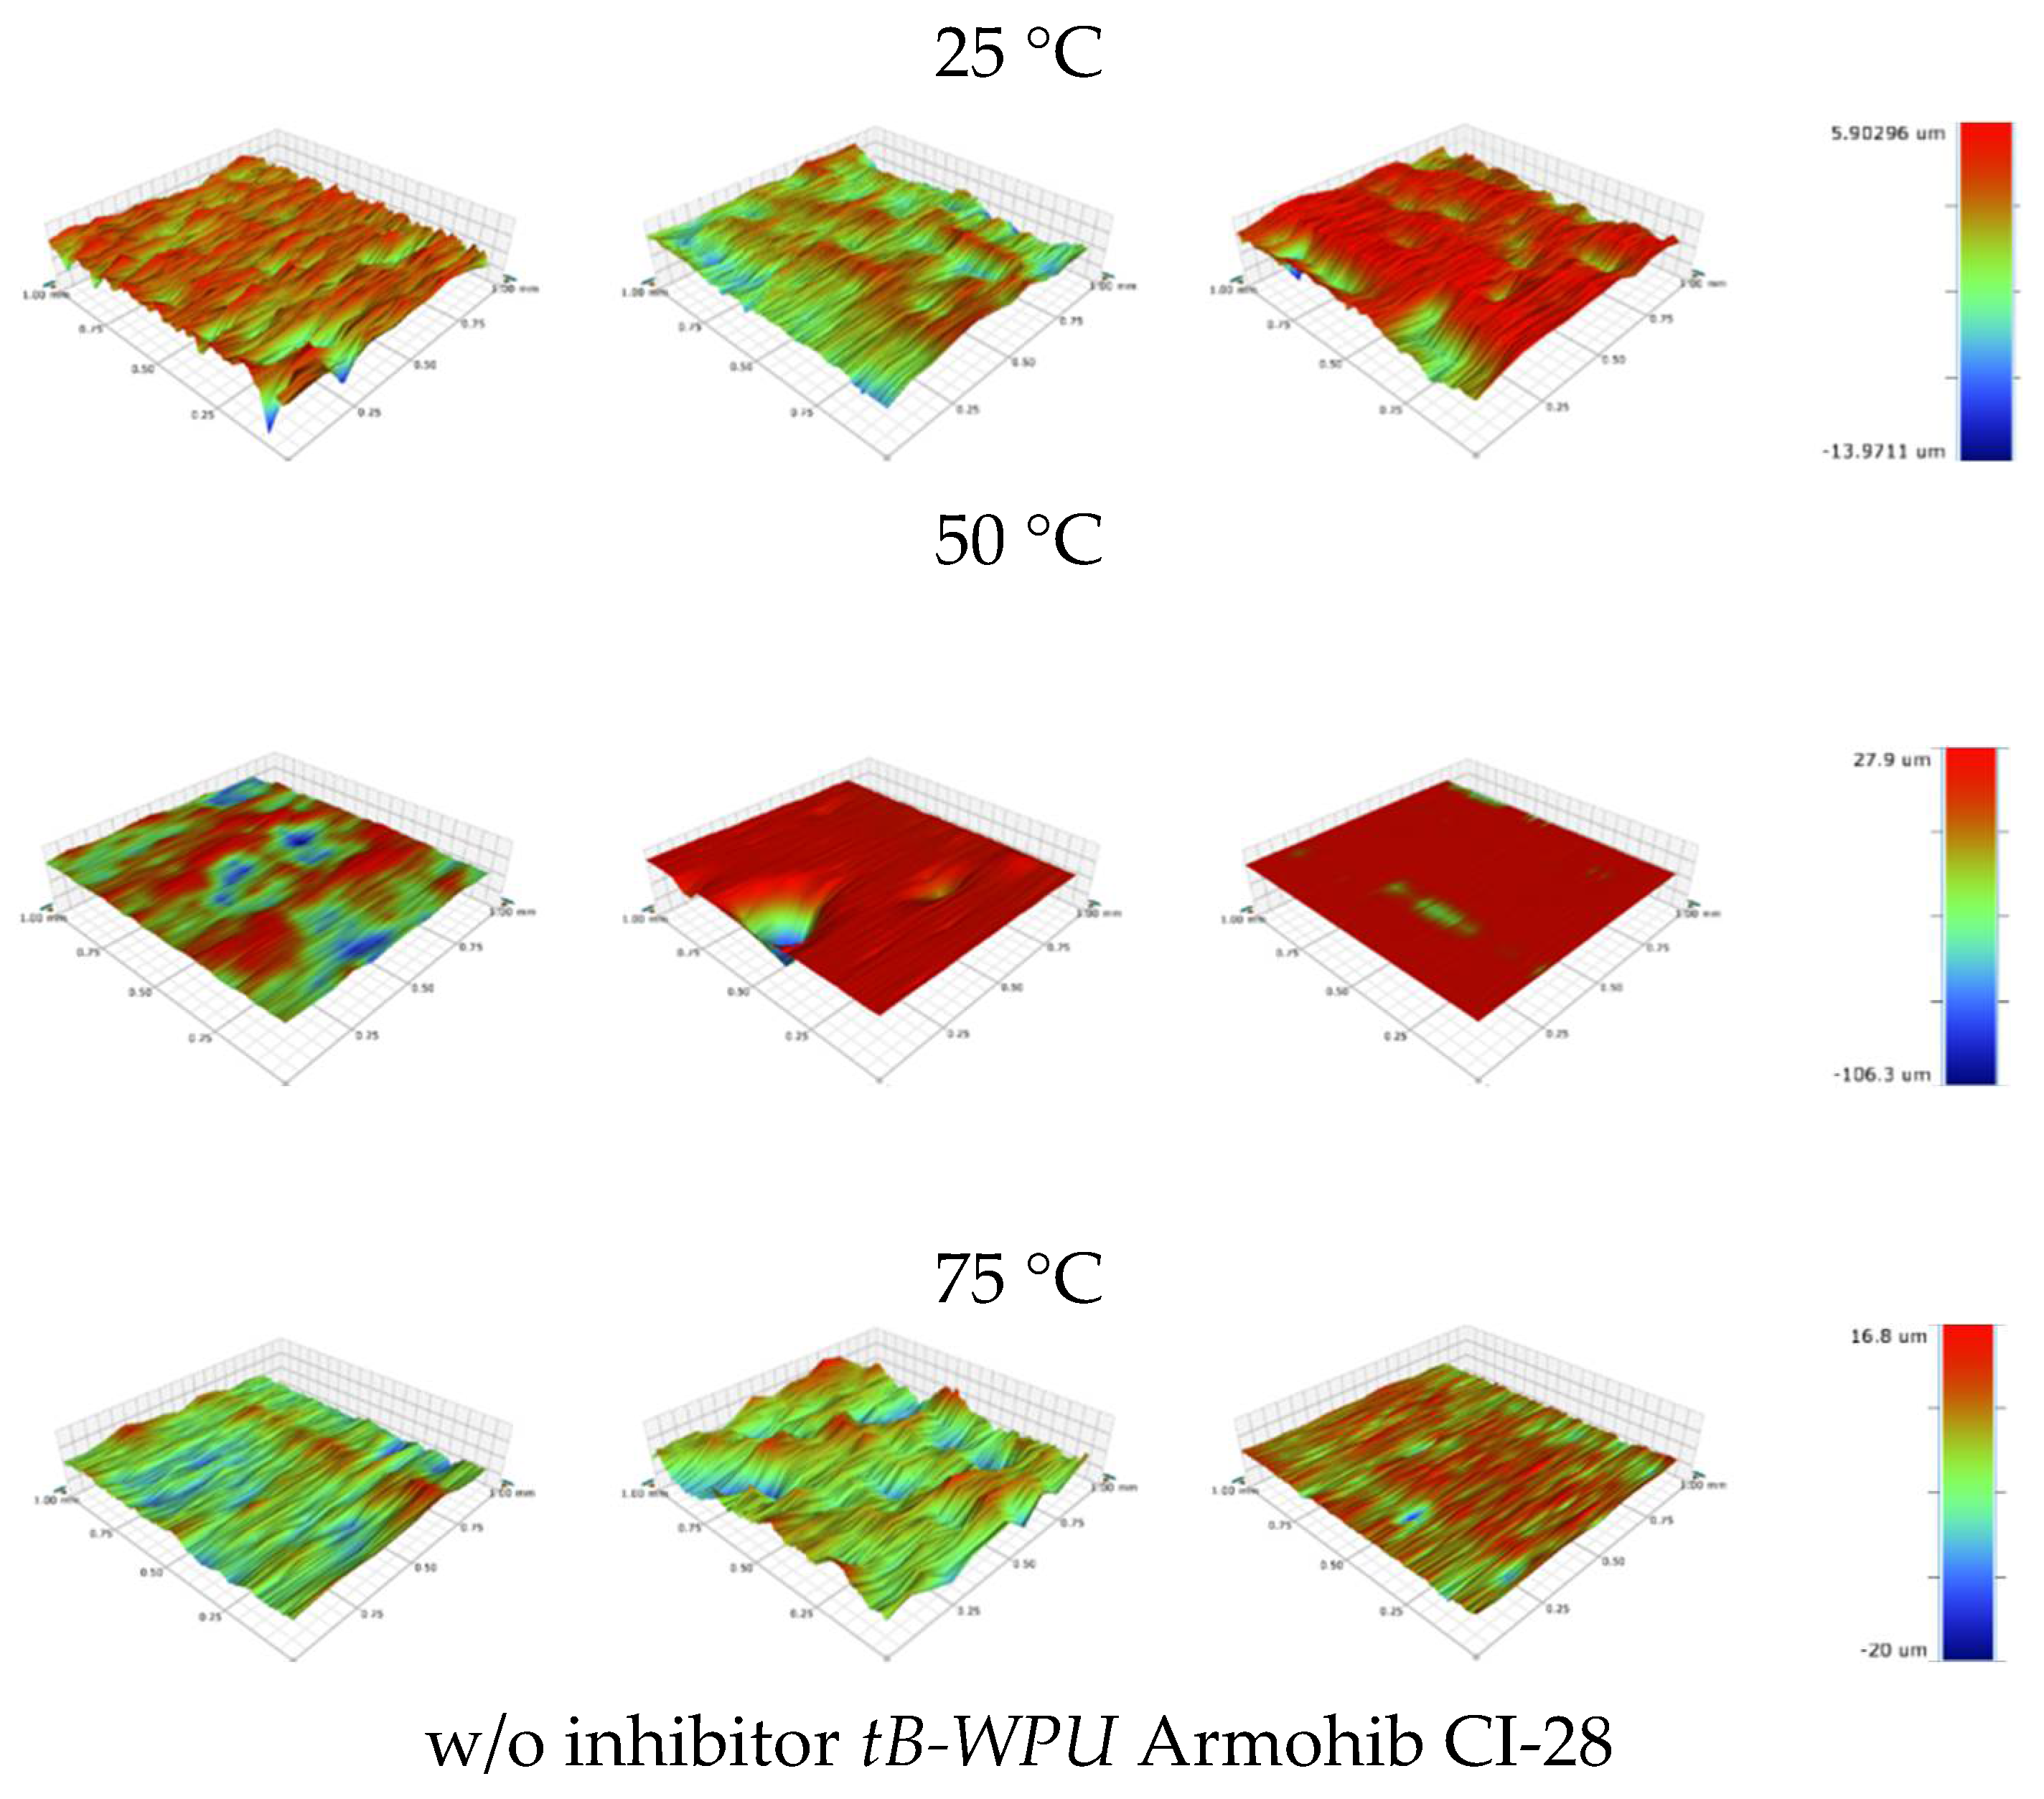
3.5. Surface Morphology Analysis
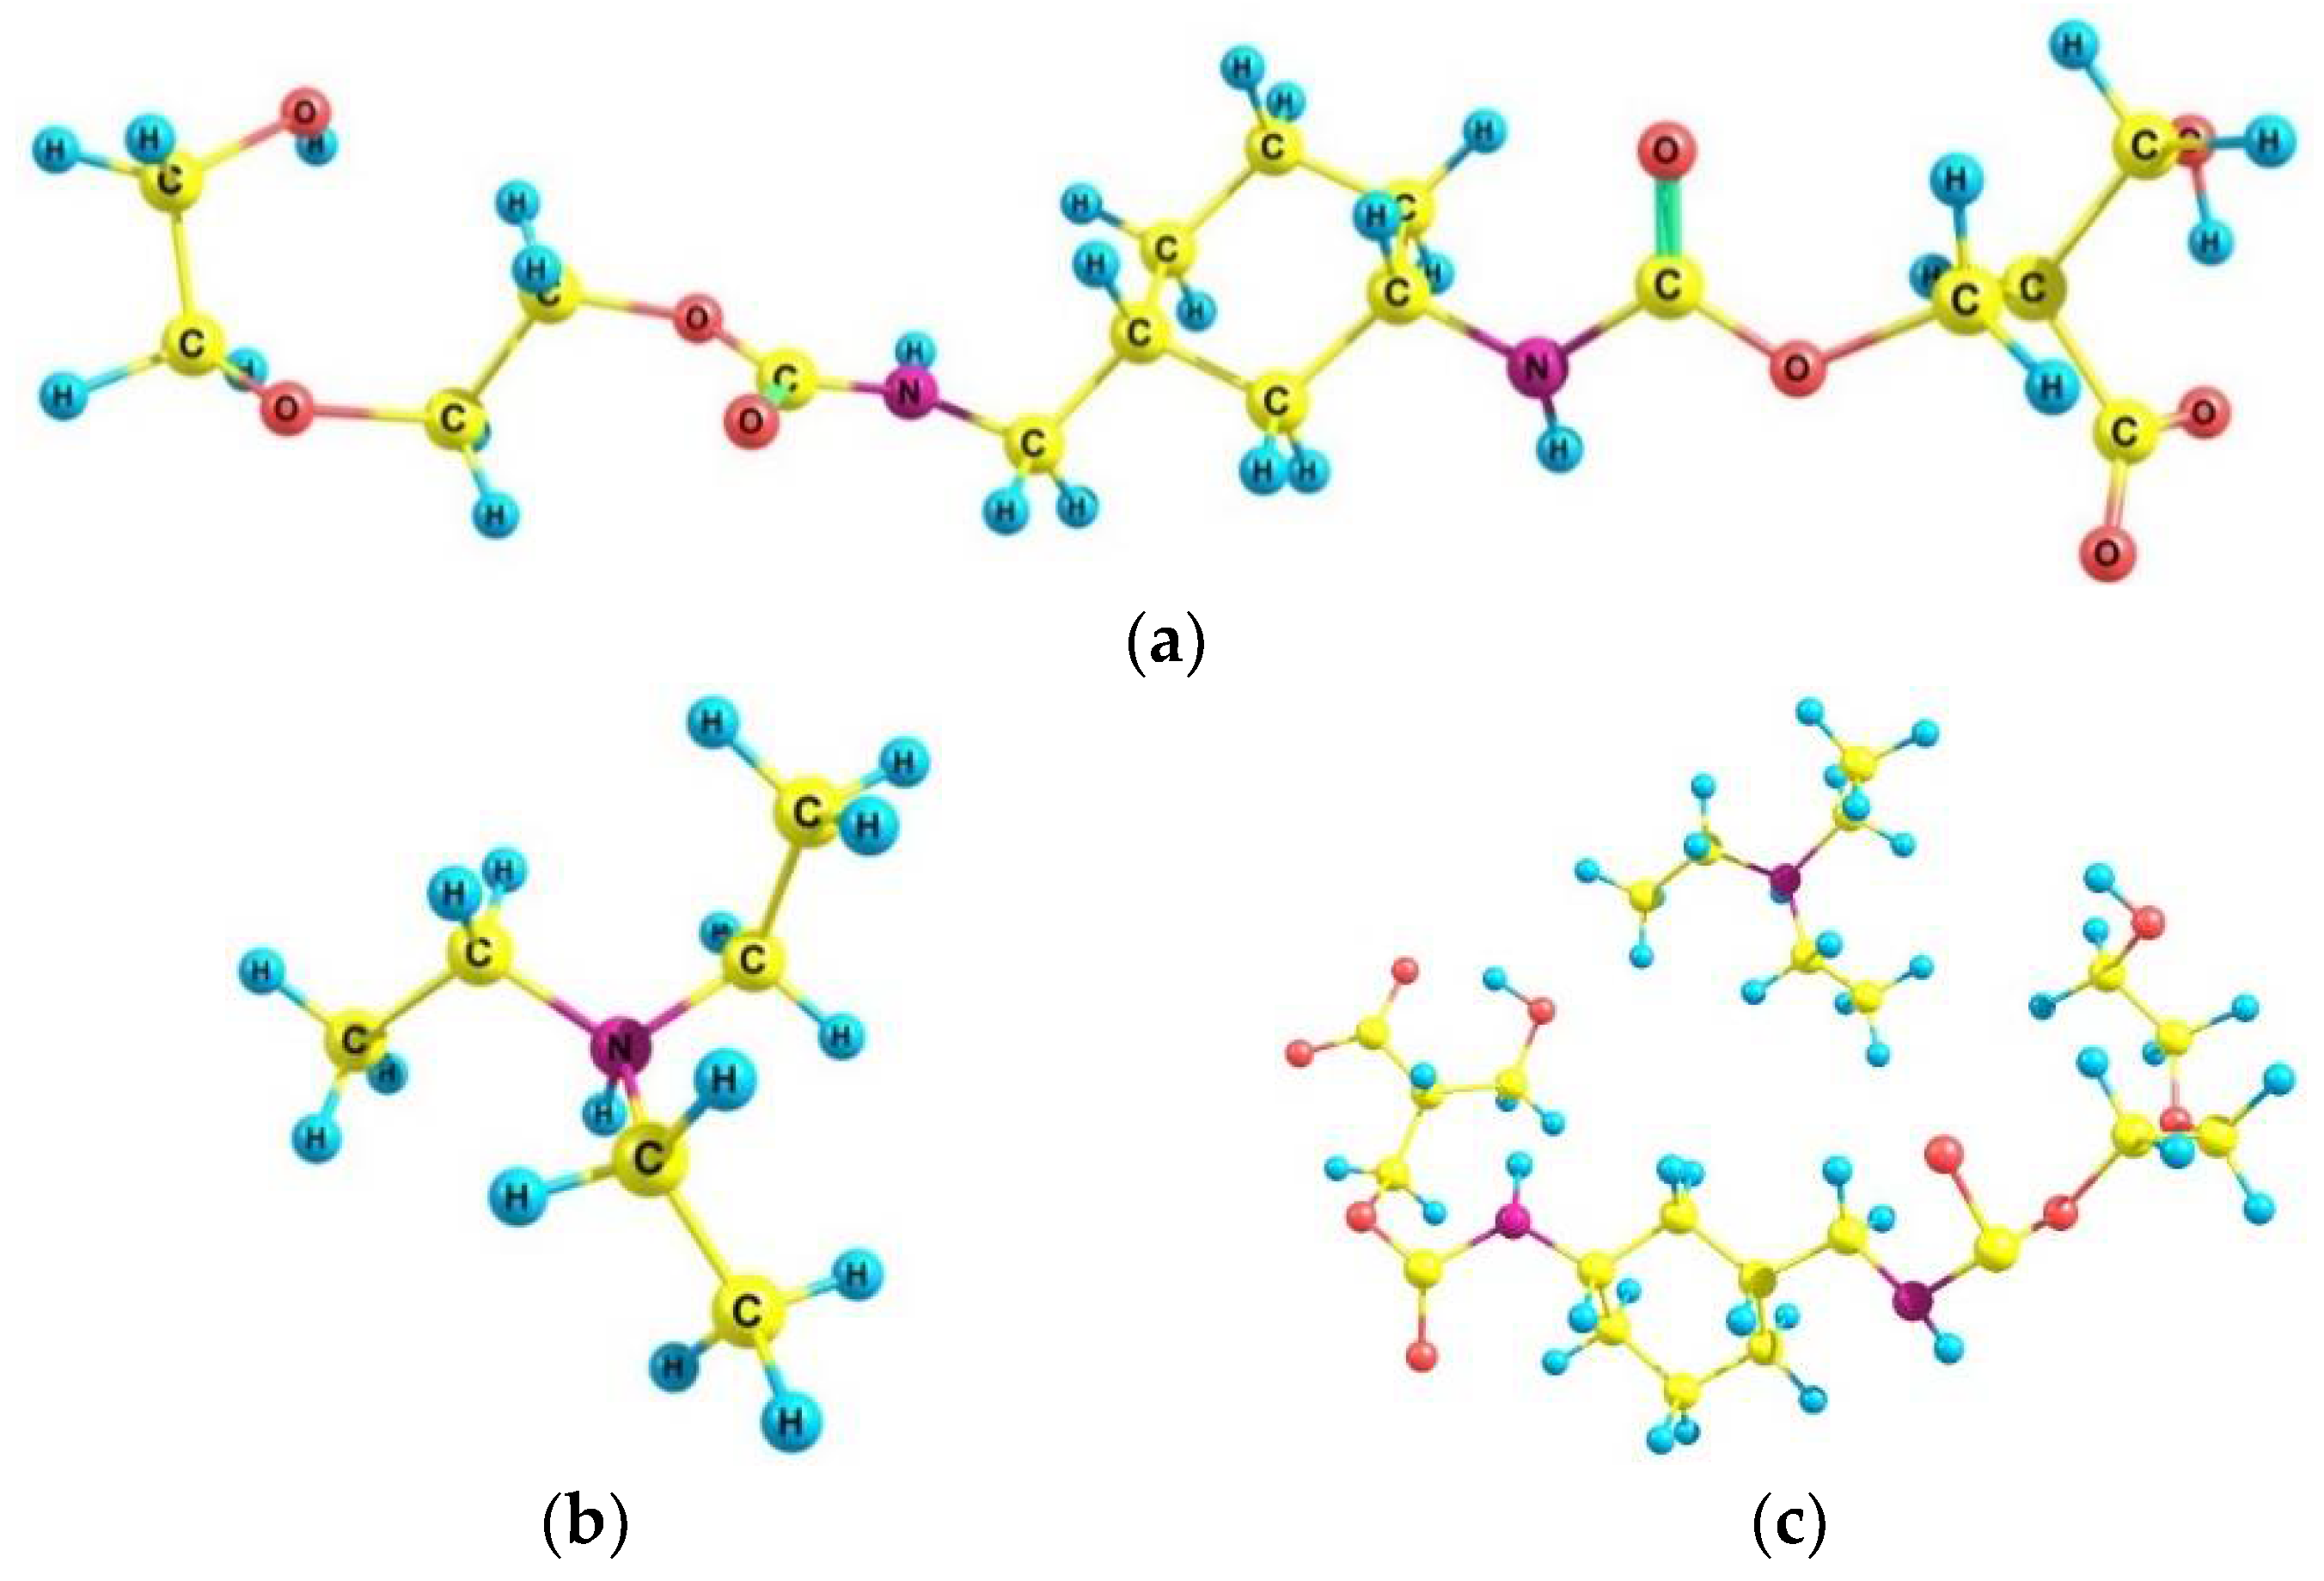
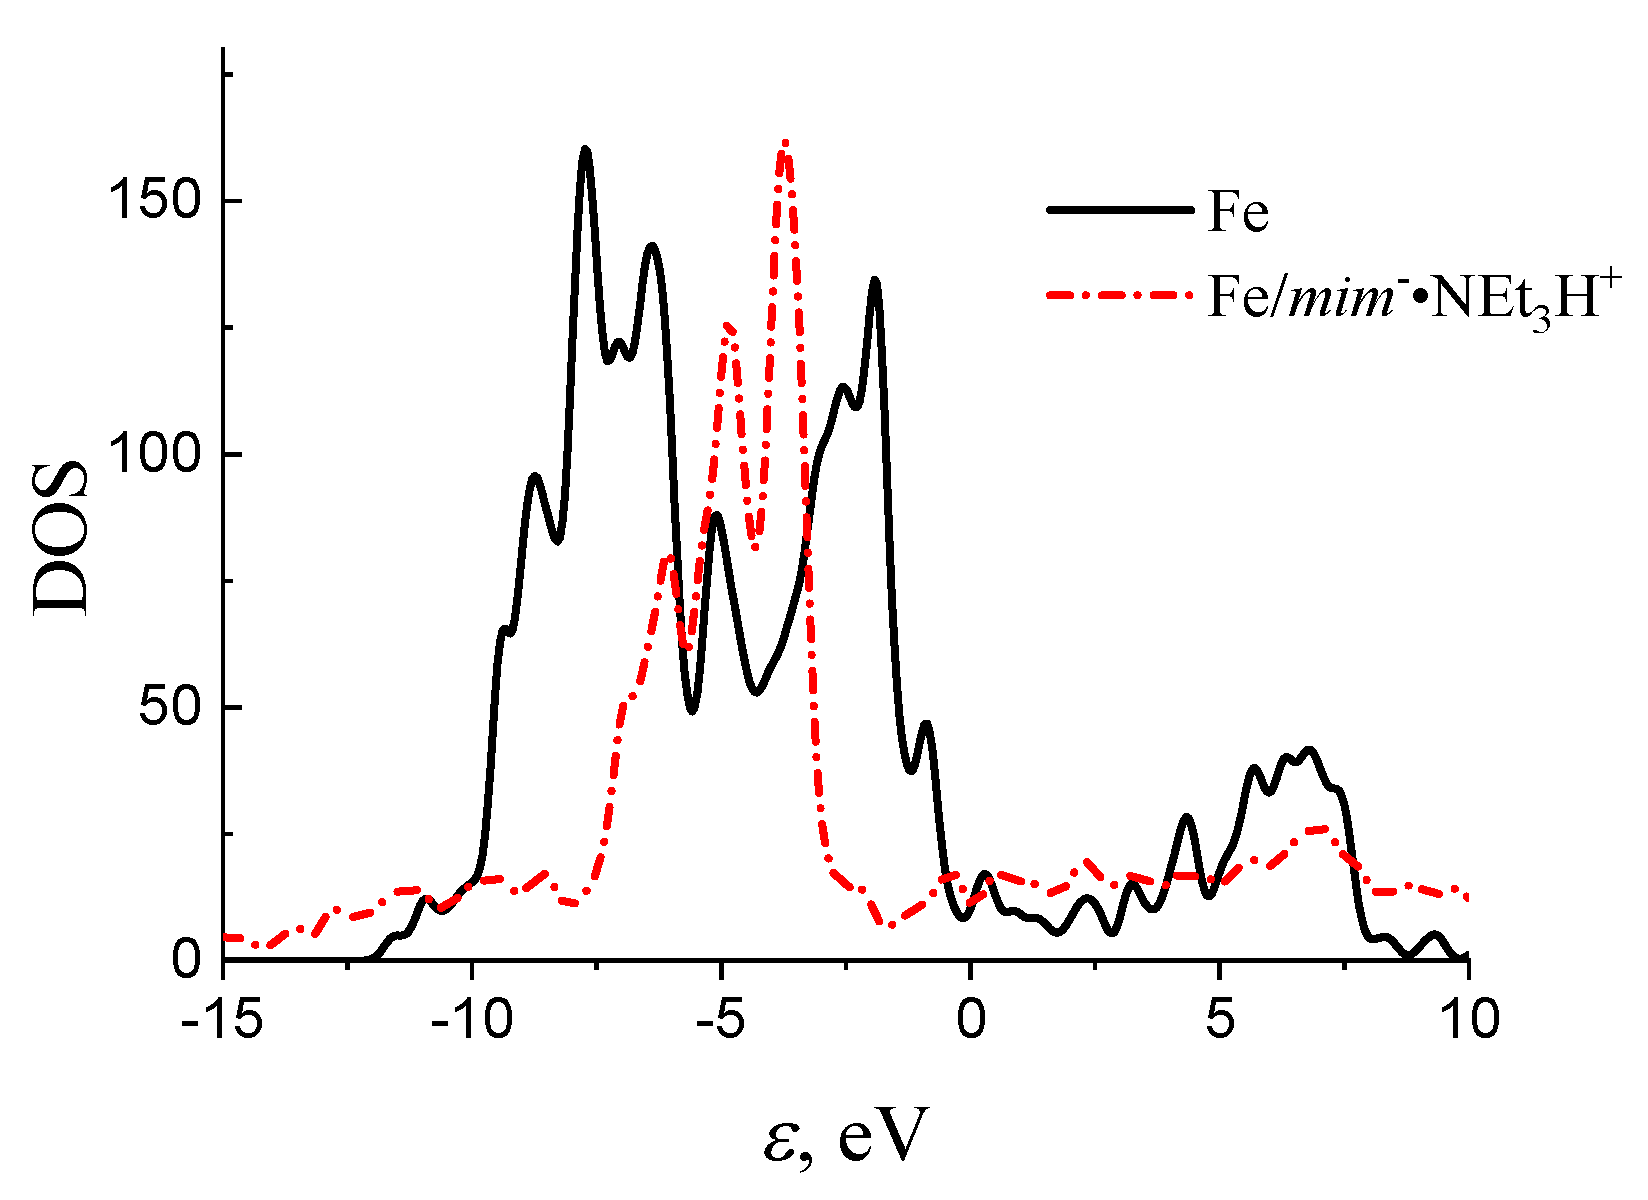
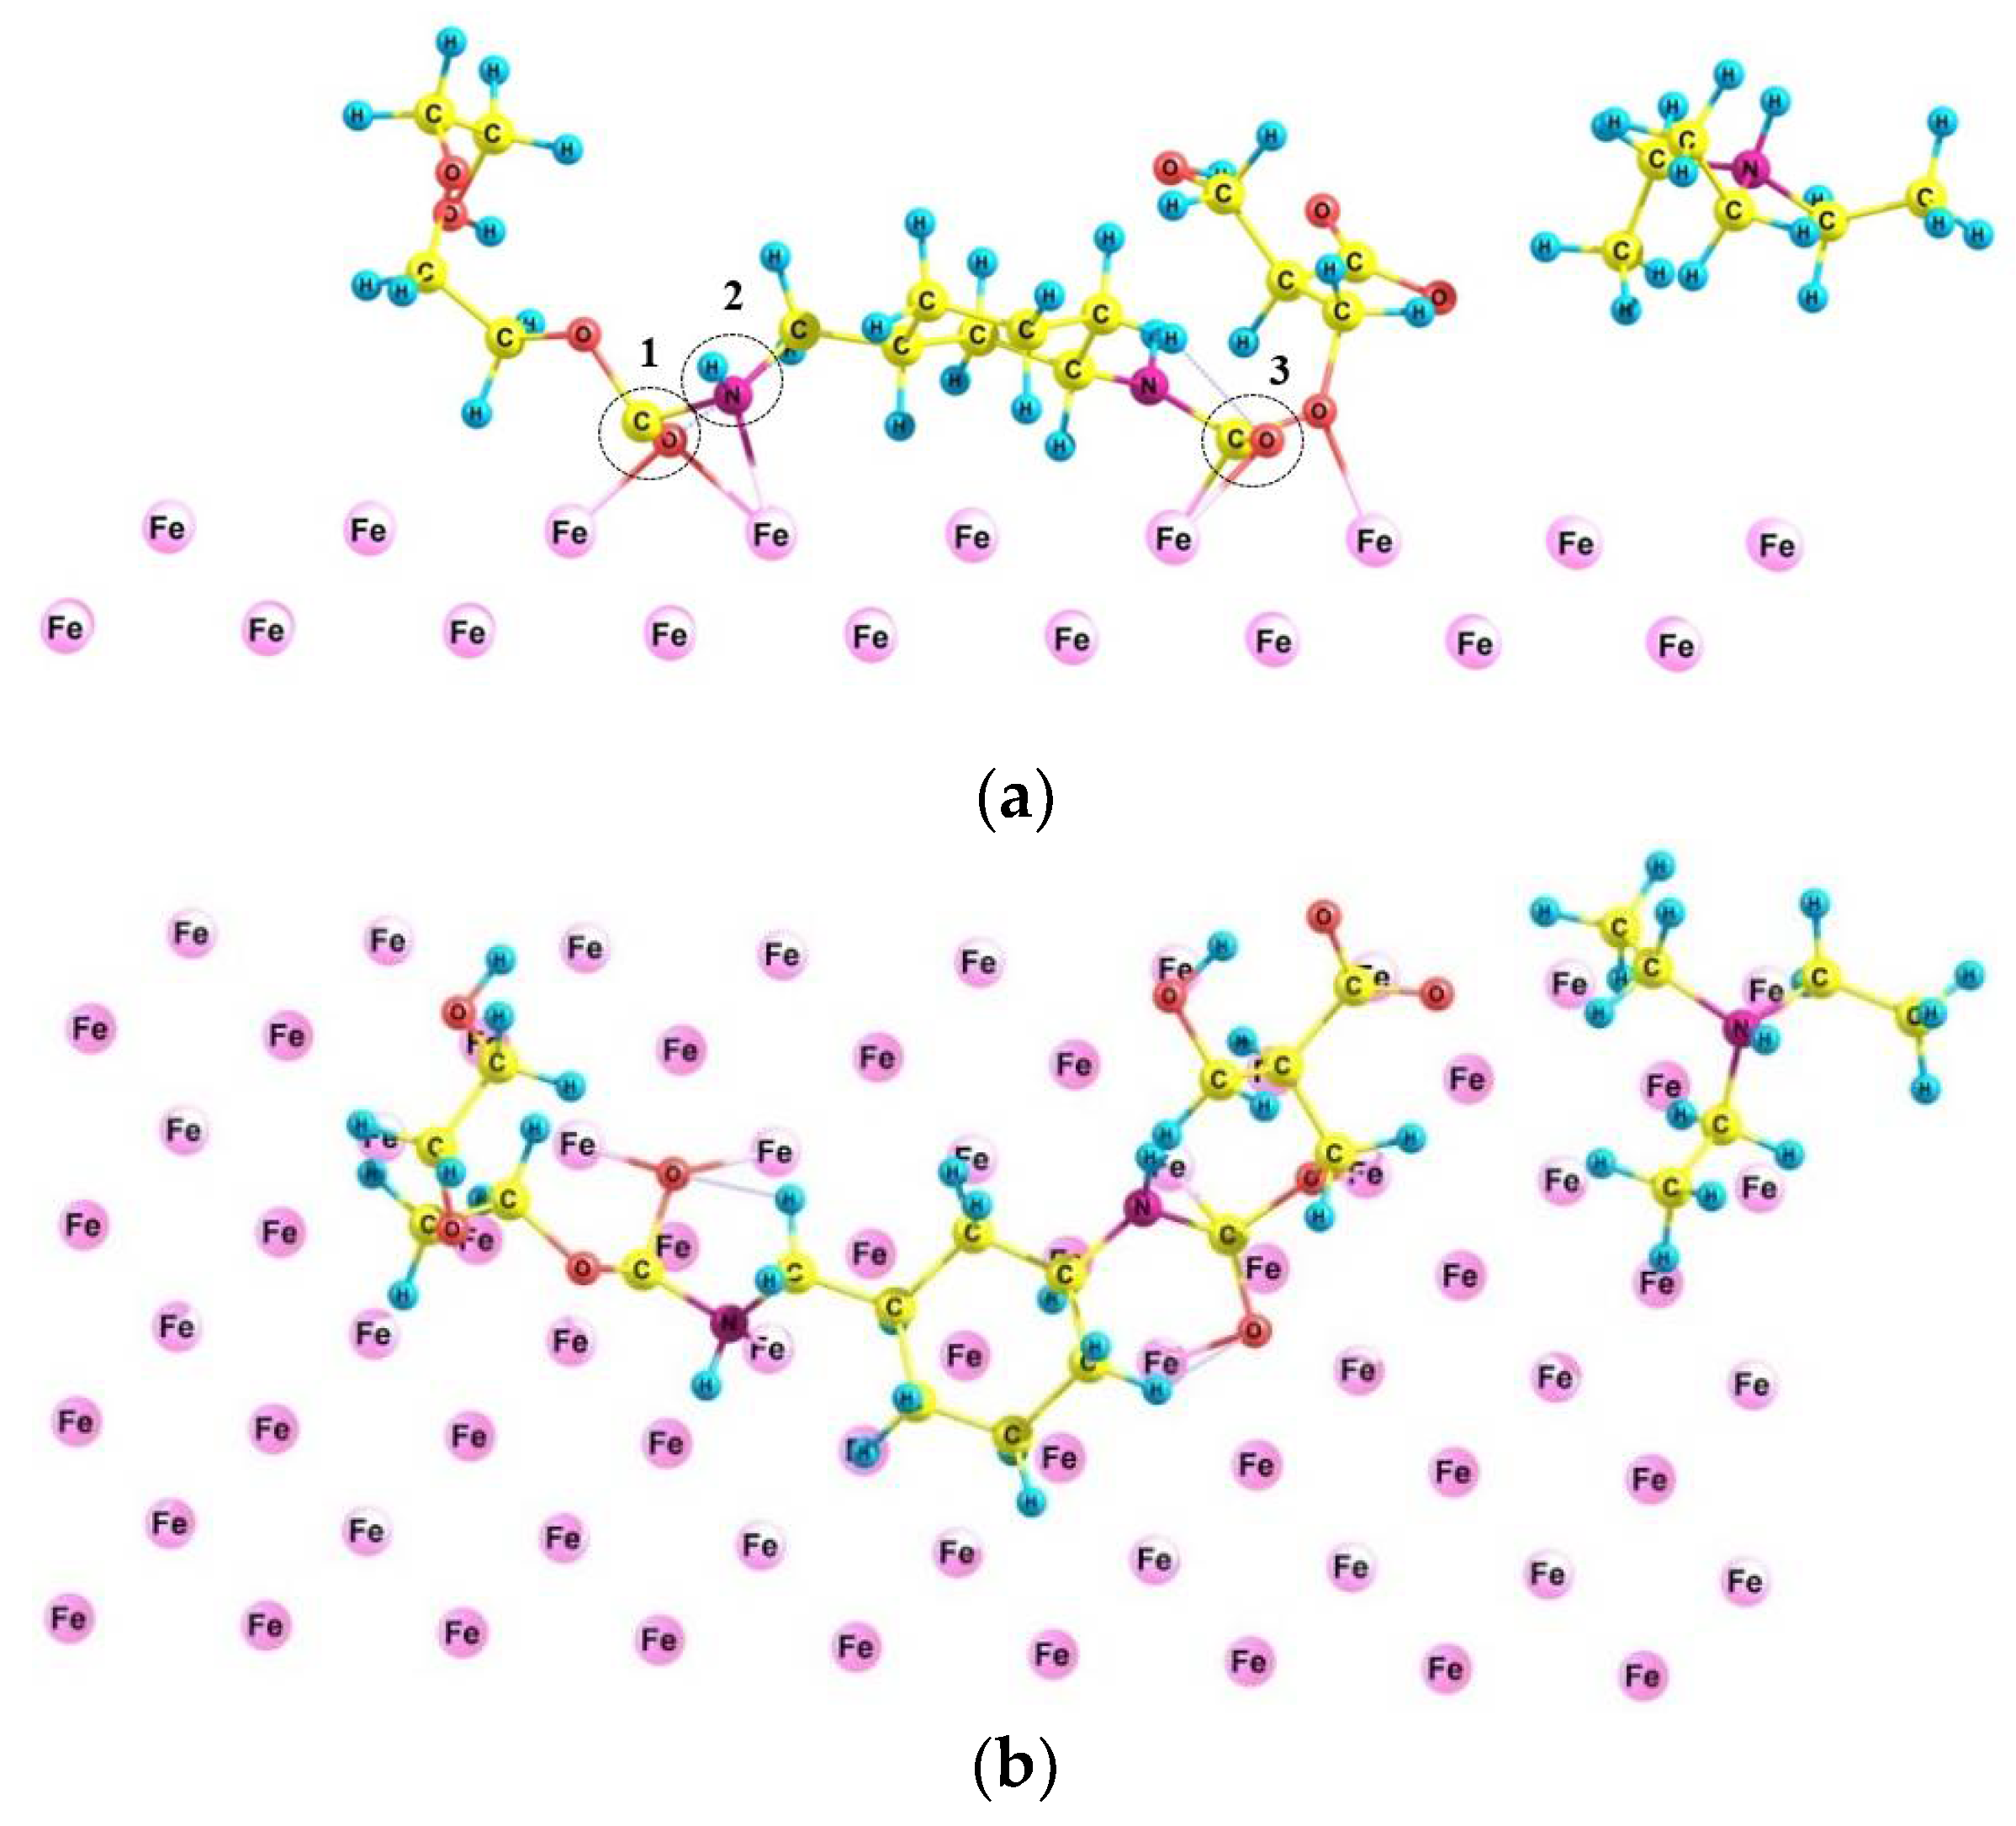
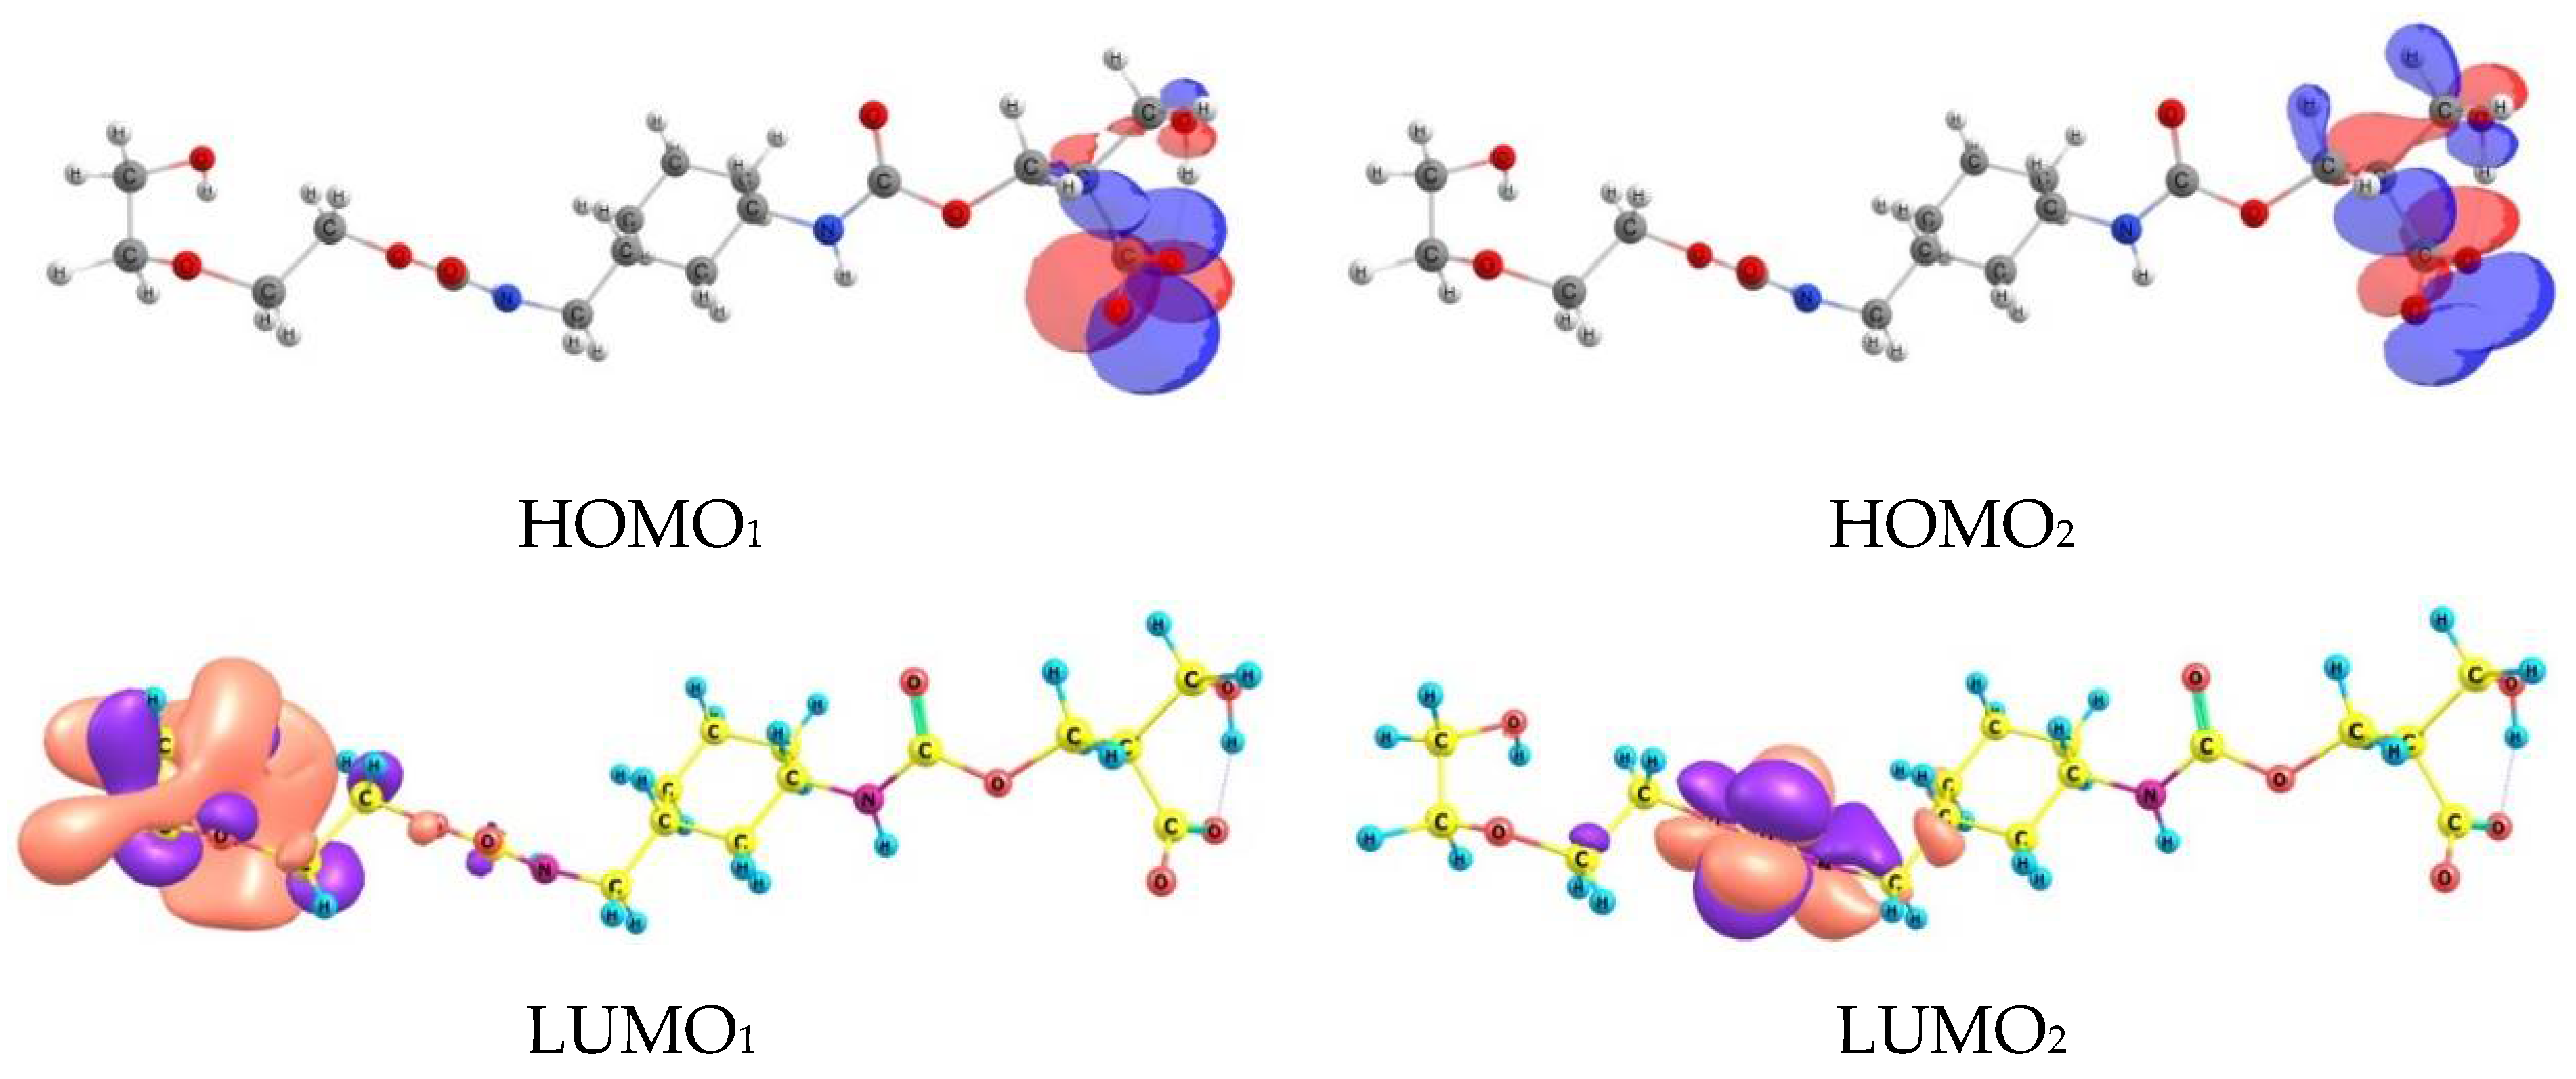
3.6. Quantum–Chemical Calculations
4. Conclusions
Supplementary Materials
Author Contributions
Funding
Institutional Review Board Statement
Informed Consent Statement
Conflicts of Interest
References
- Lei, X.; Wang, H.; Mao, F.; Zhang, J.; Zhao, M.; Fu, A.; Feng, Y.; Macdonald, D.D. Electrochemical Behaviour of Martensitic Stainless Steel after Immersion in a H2S-Saturated Solution. Corros. Sci. 2018, 131, 164–173. [Google Scholar] [CrossRef]
- Fouda, A.E.-A.S.; Motaal, S.M.A.; Ahmed, A.S.; Sallam, H.B.; Ezzat, A.; El-Hossiany, A. Corrosion Protection of Carbon Steel in 2M HCl Using Aizoon canariense Extract. Biointerface Res. Appl. Chem. 2022, 12, 230–243. [Google Scholar]
- Reynolds, M.A. A Technical Playbook for Chemicals and Additives Used in the Hydraulic Fracturing of Shales. Energy Fuels 2020, 34, 15106–15125. [Google Scholar] [CrossRef]
- Al Juhaiman, L.A. Polyvinyl pyrrolidone as a Corrosion Inhibitor for Carbon Steel in HCl. Int. J. Electrochem. Sci. 2016, 11, 2247–2262. [Google Scholar]
- Bedair, M.A.; El-Sabbah, M.M.B.; Fouda, A.S.; Elaryian, H.M. Synthesis, electrochemical and quantum chemical studies of some prepared MARK surfactants based on azodye and Schiff base as corrosion inhibitors for steel in acid medium. Corros. Sci. 2017, 128, 54–57. [Google Scholar] [CrossRef]
- Bentiss, F.; Traisnel, M.; Lagrenee, M. The substituted 1,3,4-oxadiazoles: A new class of corrosion inhibitors of mild steel in acidic media. Corros. Sci. 2000, 42, 127–146. [Google Scholar] [CrossRef]
- Obot, I.B.; Umoren, S.A.; Ankah, N.K. Pyrazine derivatives as green oil field corrosion inhibitors for steel. J. Mol. Liq. 2019, 277, 749–761. [Google Scholar] [CrossRef]
- Obot, I.B.; Onyeachu, I.B.; Wazzan, N.; Al-Amri, A.H. Theoretical and experimental investigation of two alkyl carboxylates as corrosion inhibitors for steel in acidic medium. J. Mol. Liq. 2019, 279, 199–207. [Google Scholar] [CrossRef]
- Rasheeda, K.; Vijaya Alva, D.P.; Krishnaprasad, P.A.; Samshuddin, S. Pyrimidine derivatives as potential corrosion inhibitors for steel in acid medium—An overview. Int. J. Corros. Scale Inhib. 2018, 7, 48–61. [Google Scholar]
- Rabizadeh, T.; Asl, S.K. Casein as a natural protein to inhibit the corrosion of mild steel in HCl solution. J. Mol. Liq. 2019, 276, 694–704. [Google Scholar] [CrossRef]
- Umoren, S.A.; Obot, I.B.; Madhankumar, A.; Gasem, Z.M. Performance evaluation of pectin as ecofriendly corrosion inhibitor for X60 pipeline steel in acid medium: Experimental and theoretical approaches. Carbohydr. Polym. 2015, 124, 280–291. [Google Scholar] [CrossRef] [PubMed]
- Umoren, S.A.; Al Ahmary, A.A.; Gasem, Z.M.; Solomon, M.M. Evaluation of chitosan and carboxymethyl cellulose as ecofriendly corrosion inhibitors for steel. Int. J. Biol. Macromol. 2018, 117, 1017–1028. [Google Scholar] [CrossRef] [PubMed]
- Bharatiya, U.; Gal, P.; Agrawal, A.; Shah, M.; Sircar, A. Effect of Corrosion on Crude Oil and Natural Gas Pipeline with Emphasis on Prevention by Ecofriendly Corrosion Inhibitors: A Comprehensive Review. J. Bio- Tribo-Corros. 2019, 5, 35. [Google Scholar] [CrossRef]
- Farhadian, A.; Rahimi, A.; Safaei, N.; Shaabani, A.; Abdouss, M.; Alavi, A. A theoretical and experimental study of castor oil-based inhibitor for corrosion inhibition of mild steel in acidic medium at elevated temperatures. Corros. Sci. 2020, 175, 108871. [Google Scholar] [CrossRef]
- Gece, G. Drugs: A review of promising novel corrosion inhibitors. Corros. Sci. 2011, 53, 3873–3898. [Google Scholar] [CrossRef]
- Rani, B.A.; Basu, B.J. Green inhibitors for corrosion protection of metals and alloys: An overview. Int. J. Corros. 2012, 2012, 1–15. [Google Scholar] [CrossRef]
- Idress, M.; Shahril, M.A.; Zuraidin, A.S.; Jasamai, M. Experimental Investigation of Methane Hydrate Induction Time in the Presence of Cassava Peel as a Hydrate Inhibitor. Energies 2019, 12, 2314. [Google Scholar] [CrossRef] [Green Version]
- Kang, S.-P.; Lee, D.; Lee, J.-W. Anti-Agglomeration Effects of Biodegradable Surfactants from Natural Sources on Natural Gas Hydrate Formation. Energies 2020, 13, 1107. [Google Scholar] [CrossRef] [Green Version]
- Sastri, V.S. Green Corrosion Inhibitors, Theory and Practice; Wiley: Hoboken, NJ, USA, 2011. [Google Scholar]
- Palou, R.M.; Olivares-Xomelt, O.; Likhanova, N.V. Environmentally friendly corrosion inhibitors. Dev. Corros. Protect. 2014, 19, 431–465. [Google Scholar]
- Sloan, E.D. Fundamental principles and applications of natural gas hydrates. Nature 2003, 426, 353. [Google Scholar] [CrossRef]
- Rajput, F.; Maric, M.; Servio, P. Amphiphilic Block Copolymers with Vinyl Caprolactam as Kinetic Gas Hydrate Inhibitors. Energies 2021, 14, 341. [Google Scholar] [CrossRef]
- Moore, J.; Ver Vers, L.; Conrad, P. Understanding Kinetic Hydrate Inhibitor and Corrosion Inhibitor Interactions. In Proceedings of the Offshore Technology Conference, Houston, TX, USA, 4–7 May 2009; Volume 1, pp. 477–481. [Google Scholar]
- Qasim, A.; Khan, M.S.; Lal, B.; Shari, A.M. A perspective on dual purpose gas hydrate and corrosion inhibitors for flow assurance. J. Pet. Sci. Eng. 2019, 183, 106418. [Google Scholar] [CrossRef]
- Farhadian, A.; Kudbanov, A.; Varfolomeev, M.A.; Dalmazzone, D. Waterborne Polyurethanes as a New and Promising Class of Kinetic Inhibitors for Methane Hydrate Formation. Sci. Rep. 2019, 9, 9797. [Google Scholar] [CrossRef] [PubMed]
- Farhadian, A.; Varfolomeev, M.A.; Kudbanov, A.; Rezaeisadat, M.; Nurgaliev, D.K. Waterborne polymers as kinetic/anti-agglomerant methane hydrate and corrosion inhibitors: A new and promising strategy for flow assurance. J. Nat. Gas Sci. Eng. 2020, 77, 103235. [Google Scholar] [CrossRef]
- Farhadian, A.; Varfolomeev, M.A.; Kudbanov, A.; Gallyamova, S.R. A new class of promising biodegradable kinetic/anti-agglomerant methane hydrate inhibitors based on castor oil. Chem. Eng. Sci. 2019, 206, 507–517. [Google Scholar] [CrossRef]
- Pavelyev, R.S.; Zaripova, Y.F.; Yarkovoi, V.V.; Vinogradova, S.S.; Razhabov, S.; Khayarov, K.R.; Nazarychev, S.A.; Stoporev, A.S.; Mendgaziev, R.I.; Semenov, A.P.; et al. Performance of Waterborne Polyurethanes in Inhibition of Gas Hydrate Formation and Corrosion: Influence of Hydrophobic Fragments. Molecules 2020, 25, 5664. [Google Scholar] [CrossRef]
- Cui, G.; Guo, J.; Zhang, Y.; Zhao, Q.; Fu, S.; Han, T.; Zhang, S.; Wu, Y. Chitosan oligosaccharide derivatives as green corrosion inhibitors for P110 steel in a carbon-dioxidesaturated chloride solution. Carbohydr. Polym. 2019, 203, 386–395. [Google Scholar] [CrossRef]
- WonATech Electrochemical Instruments. Gateway to Electrochemistry, 2nd ed.; WonATech Co. Ltd.: Seoul, Korea, 2014; Available online: http://www.zivelab.com/ctlg/WonATech.pdf (accessed on 20 November 2020).
- Frisch, M.J.; Trucks, G.W.; Schlegel, H.B.; Scuseria, G.E.; Robb, M.A.; Cheeseman, J.R.; Scalmani, G.; Barone, V.; Petersson, G.A.; Nakatsuji, H.; et al. Gaussian 16, Revision B.01; Gaussian, Inc.: Wallingford, CT, USA, 2016. [Google Scholar]
- Chemcraft Graphical Software for Visualization of Quantum Chemistry Computations. Available online: https://www.chemcraftprog.com (accessed on 12 November 2021).
- Soler, J.M.; Artacho, E.; Gale, J.D.; García, A.; Junquera, J.; Ordejón, P.; Sanchez-Portal, D. The SIESTA method for ab initio order-N materials simulation. J. Phys. Cond. Matt. 2002, 14, 2745. [Google Scholar] [CrossRef] [Green Version]
- García, A.; Papior, N.; Akhtar, A.; Artacho, E.; Blum, V.; Bosoni, E.; Brandimarte, P.; Brandbyge, M.; Cerdá, J.I.; Corsetti, F.; et al. SIESTA: Recent developments and applications. J. Chem. Phys. 2020, 152, 204108. [Google Scholar] [CrossRef]
- Perdew, J.P.; Burke, K.; Ernzerhof, M. Generalized Gradient Approximation Made Simple. Phys. Rev. Lett. 1996, 77, 3865–3868. [Google Scholar] [CrossRef] [Green Version]
- Troullier, N.; Matrins, J.L. Efficient Pseudopotentials for Plane-Wave Calculations. Phys. Rev. B. 1991, 43, 1993–2006. [Google Scholar] [CrossRef] [PubMed]
- Solomon, M.M.; Umoren, S.A.; Quraishi, M.A.; Salman, M. Myristic acid based imidazoline derivative as effective corrosion inhibitor for steel in 15% HCl medium. J. Colloid Interface Sci. 2019, 551, 47–60. [Google Scholar] [CrossRef] [PubMed]
- Yadav, M.; Behera, D.; Kumar, S.; Sinha, R.R. Experimental and quantum chemical studies on the corosion inhibition performance of benzimidazole derivatives for mild steel in HCl. Ind. Eng. Chem. Res. 2013, 52, 6318–6328. [Google Scholar] [CrossRef]
- Yadav, M.; Behera, D.; Kumar, S. Experimental and theoretical investigation on adsorption and corrosion inhibition properties of imidazopyridine derivatives on mild steel in hydrochloric acid solution: Corrosion inhibition of mild steel in hydrochloric acid solution. Surf. Interface Anal. 2014, 46, 640–652. [Google Scholar] [CrossRef]
- Zhang, H.H.; Chen, Y. Experimental and theoretical studies of benzaldehyde thiosemicarbazone derivatives as corrosion inhibitors for mild steel in acid media. J. Mol. Struct. 2019, 1177, 90–100. [Google Scholar] [CrossRef]
- Ferreira, E.S.; Giacomelli, C.; Giacomelli, F.C.; Spinelli, A. Evaluation of the inhibitor effect of L-ascorbic acid on the corrosion of mild steel. Mater. Chem. Phys. 2004, 83, 129–134. [Google Scholar] [CrossRef]
- Awad, M.I. Eco friendly corrosion inhibitors: Inhibitive action of quinine for corrosion of low carbon steel in 1 m HCl. J. Appl. Electrochem. 2006, 36, 1163–1168. [Google Scholar] [CrossRef]
- Luo, X.; Ci, C.; Li, J.; Lin, K.; Du, S.; Zhang, H.; Li, X.; Cheng, Y.F.; Zang, J.; Liu, Y. 4-Aminoazobenzene modified natural glucomannan as a green eco-friendly inhibitor for the mild steel in 0.5M HCl solution. Corros. Sci. 2019, 151, 132–142. [Google Scholar] [CrossRef]
- Wang, X.; Yang, H.; Wang, F. An investigation of benzimidazole derivative as corrosion inhibitor for mild steel in different concentration HCl solutions. Corros. Sci. 2011, 53, 113–121. [Google Scholar] [CrossRef]
- Solomon, M.M.; Gerengi, H.; Kaya, T.; Kaya, E.; Umoren, S.A. Synergistic inhibition of St37 steel corrosion in 15% H2SO4 solution by chitosan and iodide ion additives. Cellulose 2017, 24, 931–950. [Google Scholar] [CrossRef]
- Solomon, M.M.; Gerengi, H.; Kaya, T.; Umoren, S.A. Performance evaluation of a chitosan/silver nanoparticles composite on St37 steel corrosion in a 15% HCl solution. ACS Sustain. Chem. Eng. 2017, 5, 809–820. [Google Scholar] [CrossRef]
- El-Haddad, M.A.M.; Radwan, A.B.; Sliem, M.H.; Hassan, W.M.I.; Abdullah, A.M. Highly efficient eco-friendly corrosion inhibitor for mild steel in 5M HCl at elevated temperatures: Experimental & molecular dynamics study. Sci. Rep. 2019, 9, 3695. [Google Scholar] [PubMed] [Green Version]
- Feng, R.; Beck, J.; Ziomek-Moroz, M.; Lvov, S.N. Electrochemical corrosion of ultra-high strength carbon steel in alkaline brines containing hydrogen sulfide. Electrochim. Acta 2016, 212, 998–1009. [Google Scholar] [CrossRef] [Green Version]
- Yan, Y.; Li, W.; Cai, L.; Hou, B. Electrochemical and quantum chemical study of purines as corrosion inhibitors for mild steel in 1M HCl solution. Electrochim. Acta 2008, 53, 5953–5960. [Google Scholar] [CrossRef]
- El-Haddad, M.N. Chitosan as a green inhibitor for copper corrosion in acidic medium. Int. J. Biol. Macromol. 2013, 55, 142–149. [Google Scholar] [CrossRef] [PubMed]
- Syed, J.A.; Tang, S.; Lu, H.; Meng, X. Water-soluble Polyaniline_Polyacrylic acid composites as efficient corrosion inhibitors for 316SS. Ind. Eng. Chem. Res. 2015, 54, 2950–2959. [Google Scholar] [CrossRef]
- Hosseini, M.; Mertens, S.F.L.; Ghorbani, M.; Arshadi, M.R. Asymmetrical Schiff bases as inhibitors of mild steel corrosion in sulphuric acid media. Mater. Chem. Phys. 2003, 78, 800–808. [Google Scholar] [CrossRef]
- Ashassi-Sorkhabi, H.; Shaabani, B.; Seifzadeh, D. Effect of some pyrimidinic Shciff bases on the corrosion of mild steel in hydrochloric acid solution. Electrochim. Acta 2005, 50, 3446–3452. [Google Scholar] [CrossRef]
- Ghareba, S.; Omanovic, S. 12-Aminododecanoic acid as a corrosion inhibitor for carbon steel. Electrochim. Acta 2011, 56, 3890–3898. [Google Scholar] [CrossRef]
- Shenoy, V.V.; Venugopal, P.P.; Kumari, P.D.R.; Chakraborty, D. Effective inhibition of mild steel corrosion by 6-bromo-(2,4-dimethoxyphenil)methylidene]imidazo[1,2-a]pyridine-2-carbohydrazide in 0.5M HCl: Insights from experimental and computational study. J. Molecul. Struct. 2021, 1232, 130074. [Google Scholar] [CrossRef]
- Fernandes, C.M.; Alvarez, L.X.; dos Santos, N.E.; Maldonado Barrios, A.C.; Ponzio, E.A. Green synthesis of 1-benzyl-4-phenyl-1h-1,2,3-triazole, its application as corrosion inhibitor for mild steel in acidic medium and new approach of classical electrochemical analyses. Corros. Sci. 2019, 149, 185–194. [Google Scholar] [CrossRef]
- Yadav, M.; Kumar, S.; Kumari, N.; Bahadur, I.; Ebenso, E.E. Experimental and theoretical studies on corrosion inhibition effect of synthesized benzothiazole derivatives on mild steel in 15% HCl solution. Int. J. Electrochem. Sci. 2015, 10, 23. [Google Scholar]
- Fares, M.M.; Maayta, A.K.; Al-Qudah, M.M. Pectin as promising green corrosion inhibitor of aluminum in hydrochloric acid solution. Corros. Sci. 2012, 60, 112–117. [Google Scholar] [CrossRef]
- Farhadian, A.; Varfolomeev, M.A.; Shaabani, A.; Nasiri, S.; Vakhitov, I.; Zaripova, Y.F.; Yarkovoi, V.V.; Sukhov, A.V. Sulfonated chitosan as green and high cloud point kinetic methane hydrate and corrosion inhibitor: Experimental and theoretical studies. Carbohydr. Polym. 2020, 236, 116035. [Google Scholar] [CrossRef] [PubMed]
- Luo, X.; Pan, X.; Yuan, S.; Du, S.; Zhang, C.; Liu, Y. Corrosion inhibition of mild steel in simulated seawater solution by a green eco-friendly mixture of glucomannan (GL) and bisquaternary ammonium salt (BQAS). Corros. Sci. 2017, 125, 139–151. [Google Scholar] [CrossRef]
- Wysocka, J.; Cieslik, M.; Krakowiak, S.; Ryl, J. Carboxylic acids as efficient corrosion inhibitors of aluminium alloys in alkaline media. Electrochim. Acta 2018, 289, 175–192. [Google Scholar] [CrossRef]
- Popova, A.; Sokolova, E.; Raicheva, S.; Christov, M. AC and DC study of the temperature effect on mild steel corrosion in acid media in the presence of benzimidazole derivatives. Corros. Sci. 2003, 45, 33–58. [Google Scholar] [CrossRef]
- Ebenso, E.E.; Kabanda, M.M.; Murulana, L.C.; Singh, A.K.; Shukla, S.K. Electrochemical and quantum chemical investigation of some azine and thiazine dyes as potential corrosion inhibitors for mild steel in hydrochloric acid solution. Ind. Eng. Chem. Res. 2012, 51, 12940–12958. [Google Scholar] [CrossRef]
- Bentiss, F.; Lebrini, M.; Lagrenée, M. Thermodynamic characterization of metal dissolution and inhibitor adsorption processes in mild steel/2,5- Bis(n-Thienyl)-1,3,4-thiadiazoles/hydrochloric acid system. Corros. Sci. 2005, 47, 2915–2931. [Google Scholar] [CrossRef]
- Radwan, A.B.; Sliem, M.H.; Okonkwo, P.C.; Shibl, M.F.; Abdullah, A.M. Corrosion inhibition of API X120 steel in a highly aggressive medium using stearamidopropyl dimethylamine. J. Mol. Liq. 2017, 236, 220–231. [Google Scholar] [CrossRef]
- Ansari, K.R.; Quraishi, M.A.; Singh, A. Schiff’s base of pyridyl substituted triazoles as new and effective corrosion inhibitors for mild steel in hydrochloric acid solution. Corros. Sci. 2014, 79, 5–15. [Google Scholar] [CrossRef]
- Obi-Egbedi, N.O.; Obot, I.B.; Eseola, A.O. Synthesis, characterization and corrosion inhibition efficiency of 2-(6-methylpyridin-2-Yl)-1H-imidazo[4,5-f][1,10] phenanthroline on mild steel in sulphuric acid. Arab. J. Chem. 2014, 7, 197–207. [Google Scholar] [CrossRef] [Green Version]
- Rbaa, M.; Lakhrissi, B. Novel oxazole and imidazole based on 8- hydroxyquinoline as a corrosion inhibition of mild steel in HCl solution: Insights from experimental and computational studies. Surf. Interfaces 2019, 15, 43–59. [Google Scholar] [CrossRef]
- Jiang, L.; Qiang, Y.; Lei, Z.; Wang, J.; Qin, Z.; Xiang, B. Excellent corrosion inhibition performance of novel quinoline derivatives on mild steel in HCl media: Experimental and computational investigations. J. Mol. Liq. 2018, 255, 53–63. [Google Scholar] [CrossRef]
- Govender, A.; Ferré, D.C.; Niemantsverdriet, J.W. The surface chemistry of water on Fe(100): A density functional theory study. Chem. Phys. Chem. 2012, 13, 1583. [Google Scholar] [CrossRef]
- Freitas, R.R.Q.; Rivelino, R.; de Brito Mota, F.; de Castilho, C.M.C. Dissociative adsorption and aggregation of water on the Fe(100) surface: A dft study. J. Phys. Chem. C 2012, 116, 20306–20314. [Google Scholar] [CrossRef]
- Jung, S.C.; Kang, M.H. Adsorption of a water molecule on Fe(100): Density functional calculations. Phys. Rev. B 2010, 81, 115460. [Google Scholar] [CrossRef] [Green Version]
- Nazmutdinov, R.R.; Bronshtein, M.D.; Zinkicheva, T.T.; Glukhov, D.V. Modeling of Electron Transfer Across Electrochemical Interfaces: State-of-the Art and Challenges for Quantum and Computational Chemistry. Int. J. Quantum Chem. 2016, 116, 189–201. [Google Scholar] [CrossRef] [Green Version]


| Sample | Concentration | Corrosion Rate (mm/Year) | %IEw |
|---|---|---|---|
| 25 °C | |||
| W/o inhibitor | − | 9.19 | − |
| tB-WPU | 100 ppm | 0.41 | 90.6 |
| Armohib CI-28 | 100 ppm | 0.058 | 98.7 |
| 50 °C | |||
| W/o inhibitor | − | 61.85 | − |
| tB-WPU | 100 ppm | 12.7 | 79.47 |
| Armohib CI-28 | 100 ppm | 1.09 | 98.23 |
| 75 °C | |||
| W/o inhibitor | − | 91.2 | − |
| tB-WPU | 100 ppm | 74.07 | 18.78 |
| Armohib CI-28 | 100 ppm | 27.84 | 69.47 |
| Inhibitor Concentration | Eocp (mV SCE) | βa (V/div) | βc (V/div) | Ecorr (mV) | Icorr (mA∙cm−2) | %IE |
|---|---|---|---|---|---|---|
| 25 °C w/o stirring (tB-WPU) | ||||||
| 500 ppm | −460.8 | 0.090 | 0.205 | −459.099 | 0.036 | 89.5 |
| 100 ppm | −462.6 | 0.138 | 0.179 | −497.252 | 0.044 | 87.2 |
| 50 ppm | −464.2 | 0.090 | 0.154 | −486.421 | 0.097 | 71.9 |
| 0 ppm | −511.5 | 0.118 | 0.192 | −504.618 | 0.347 | − |
| 25 °C w/o stirring (Armohib CI-28) | ||||||
| 500 ppm | −483.1 | 0.09 | 0.208 | −478.083 | 0.014 | 96.0 |
| 100 ppm | −484.1 | 0.095 | 0.204 | −481.736 | 0.024 | 93.2 |
| 50 ppm | −491.2 | 0.091 | 0.10 | −484.843 | 0.029 | 91.7 |
| 0 ppm | −511.5 | 0.118 | 0.192 | −504.618 | 0.347 | − |
| 25 °C with stirring (tB-WPU) | ||||||
| 500 ppm | −426.8 | 0.067 | 0.139 | −478.309 | 0.062 | 60.7 |
| 100 ppm | −449.9 | 0.075 | 0.188 | −481.106 | 0.068 | 57.1 |
| 50 ppm | −492.9 | 0.079 | 0.231 | −486.537 | 0.096 | 39.7 |
| 0 ppm | −516.2 | 0.037 | 0.177 | −528.6 | 0.161 | - |
| 25 °C with stirring (Armohib CI-28) | ||||||
| 500 ppm | −401.6 | 0.080 | 0.123 | −392.629 | 0.037 | 71.5 |
| 100 ppm | −405.8 | 0.099 | 0.183 | −398.484 | 0.053 | 59.2 |
| 50 ppm | −413.8 | 0.117 | 0.274 | −405.013 | 0.067 | 48.5 |
| 0 ppm | −516.1 | 0.068 | 0.177 | −494.276 | 0.130 | − |
| 50 °C w/o stirring (tB-WPU) | ||||||
| 500 ppm | −517.6 | 0.078 | 0.153 | −509.5 | 0.219 | 83.2 |
| 100 ppm | −522.2 | 0.08 | 0.151 | −514.6 | 0.247 | 81.0 |
| 50 ppm | −528.1 | 0.063 | 0.083 | −517.064 | 0.282 | 74.4 |
| 0 ppm | −536.2 | 0.071 | 0.135 | −525.7 | 1.30 | − |
| 50 °C with stirring (tB-WPU) | ||||||
| 500 ppm | −437.3 | 0.045 | 0.071 | −399.706 | 0.113 | 60.4 |
| 100 ppm | −441.6 | 0.044 | 0.077 | −411.709 | 0.169 | 40.7 |
| 50 ppm | −443.4 | 0.048 | 0.101 | −417.126 | 0.200 | 29.7 |
| 0 ppm | −450.4 | 0.047 | 0.208 | −423.885 | 0.285 | − |
| 75 °C w/o stirring (tB-WPU) | ||||||
| 500 ppm | −513.3 | 0.097 | 0.254 | −494.281 | 1.301 | 49.6 |
| 100 ppm | −518.2 | 0.056 | 0.094 | −502.227 | 1.702 | 33.9 |
| 50 ppm | −519.7 | 0.062 | 0.088 | −508.754 | 1.860 | 27.7 |
| 0 ppm | −523.4 | 0.062 | 0.093 | −511.388 | 2.600 | − |
| 75 °C with stirring (tB-WPU) | ||||||
| 500 ppm | −505.3 | 0.042 | 0.075 | −384.638 | 0.537 | 56.1 |
| 100 ppm | −524.5 | 0.033 | 0.040 | −404.285 | 0.773 | 36.8 |
| 50 ppm | −527.6 | 0.026 | 0.035 | −412.309 | 1.119 | 8.5 |
| 0 ppm | −532.7 | 0.034 | 0.043 | −422.128 | 1.223 | − |
| Inhibitor Concentration | Rs (Ω cm2) | Rct (Ω cm2) | CPE | x2 (10−3) | η% | |
|---|---|---|---|---|---|---|
| Y0 × 10−3 (Ω−1sn cm−2) | n | |||||
| 25 °C w/o Stirring | ||||||
| 500 ppm | 0.39 | 63.05 | 1.154 | 0.837 | 5.2 | 83.04 |
| 100 ppm | 0.40 | 42.11 | 1.203 | 0.842 | 2.9 | 74.61 |
| 50 ppm | 0.37 | 38.18 | 1.557 | 0.880 | 3.9 | 72.00 |
| 0 ppm | 0.92 | 10.69 | 1.898 | 0.825 | 1.6 | - |
| 25 °C with stirring | ||||||
| 500 ppm | 0.87 | 45.12 | 1.38 | 0.885 | 3.5 | 59.51 |
| 100 ppm | 0.42 | 42.03 | 1.63 | 0.815 | 2.7 | 56.53 |
| 50 ppm | 0.54 | 28.7 | 1.93 | 0.841 | 4.9 | 36.34 |
| 0 ppm | 0.54 | 18.27 | 2.11 | 0.821 | 2.6 | - |
| 50 °C w/o stirring | ||||||
| 500 ppm | 0.44 | 5.98 | 0.9 | 0.846 | 9.2 | 79.26 |
| 100 ppm | 0.29 | 5.69 | 1.4 | 0.839 | 7.9 | 78.21 |
| 50 ppm | 0.17 | 4.95 | 1.5 | 0.852 | 3.7 | 74.95 |
| 0 ppm | 0.24 | 1.24 | 1.9 | 0.840 | 1.3 | - |
| 50 °C with stirring | ||||||
| 500 ppm | 0.32 | 1.83 | 3.1 | 0.845 | 5.1 | 59.02 |
| 100 ppm | 0.23 | 1.43 | 4.0 | 0.855 | 4.5 | 47.55 |
| 50 ppm | 0.16 | 1.03 | 4.9 | 0.860 | 3.8 | 27.18 |
| 0 ppm | 0.22 | 0.75 | 6.8 | 0.832 | 1.4 | - |
| 75 °C w/o stirring | ||||||
| 500 ppm | 0.22 | 2.01 | 1.02 | 0.849 | 3.2 | 63.68 |
| 100 ppm | 0.13 | 1.5 | 1.21 | 0.851 | 6.8 | 51.33 |
| 50 ppm | 0.11 | 0.85 | 1.52 | 0.865 | 5.3 | 14.12 |
| 0 ppm | 0.15 | 0.73 | 1.56 | 0.841 | 9.8 | - |
| 75 °C with stirring | ||||||
| 500 ppm | 0.65 | 1.24 | 1.01 | 0.839 | 0.1 | 54.84 |
| 100 ppm | 0.15 | 0.92 | 1.3 | 0.841 | 2.1 | 39.13 |
| 50 ppm | 0.54 | 0.64 | 1.21 | 0.850 | 8.4 | 12.50 |
| 0 ppm | 0.43 | 0.56 | 1.6 | 0.835 | 9.3 | - |
| Sample | Temperature, °C | Kads | ΔGads, kJ/mol | R2 | Slope |
|---|---|---|---|---|---|
| Without stirring | |||||
| tB-WPU | 25 | 0.10 | −28.54 | 1 | 1.10 |
| 50 | 0.16 | −32.19 | 1 | 1.19 | |
| 75 | 0.01 | −26.66 | 1 | 1.82 | |
| Armohib CI-28 | 25 | 0.31 | −31.34 | 1 | 1.04 |
| With stirring | |||||
| tB-WPU | 25 | 0.03 | −25.55 | 1 | 1.58 |
| 50 | 0.01 | −24.75 | 1 | 1.46 | |
| 75 | - | - | - | - | |
| Armohib CI-28 | 25 | 0.03 | −25.55 | 1 | 1.33 |
| Sample | Ea (kJ mol−1) | ΔH0ads (kJ mol−1) | ΔS0ads (J mol−1K−1) | R2 |
|---|---|---|---|---|
| Blank | 54.51 | 16.38 | −142.12 | 0.98 |
| tB-WPU | 91.16 | 39.60 | −74.54 | 0.96 |
| Armohib CI-28 | 106.20 | 46.10 | −62.20 | 0.99 |
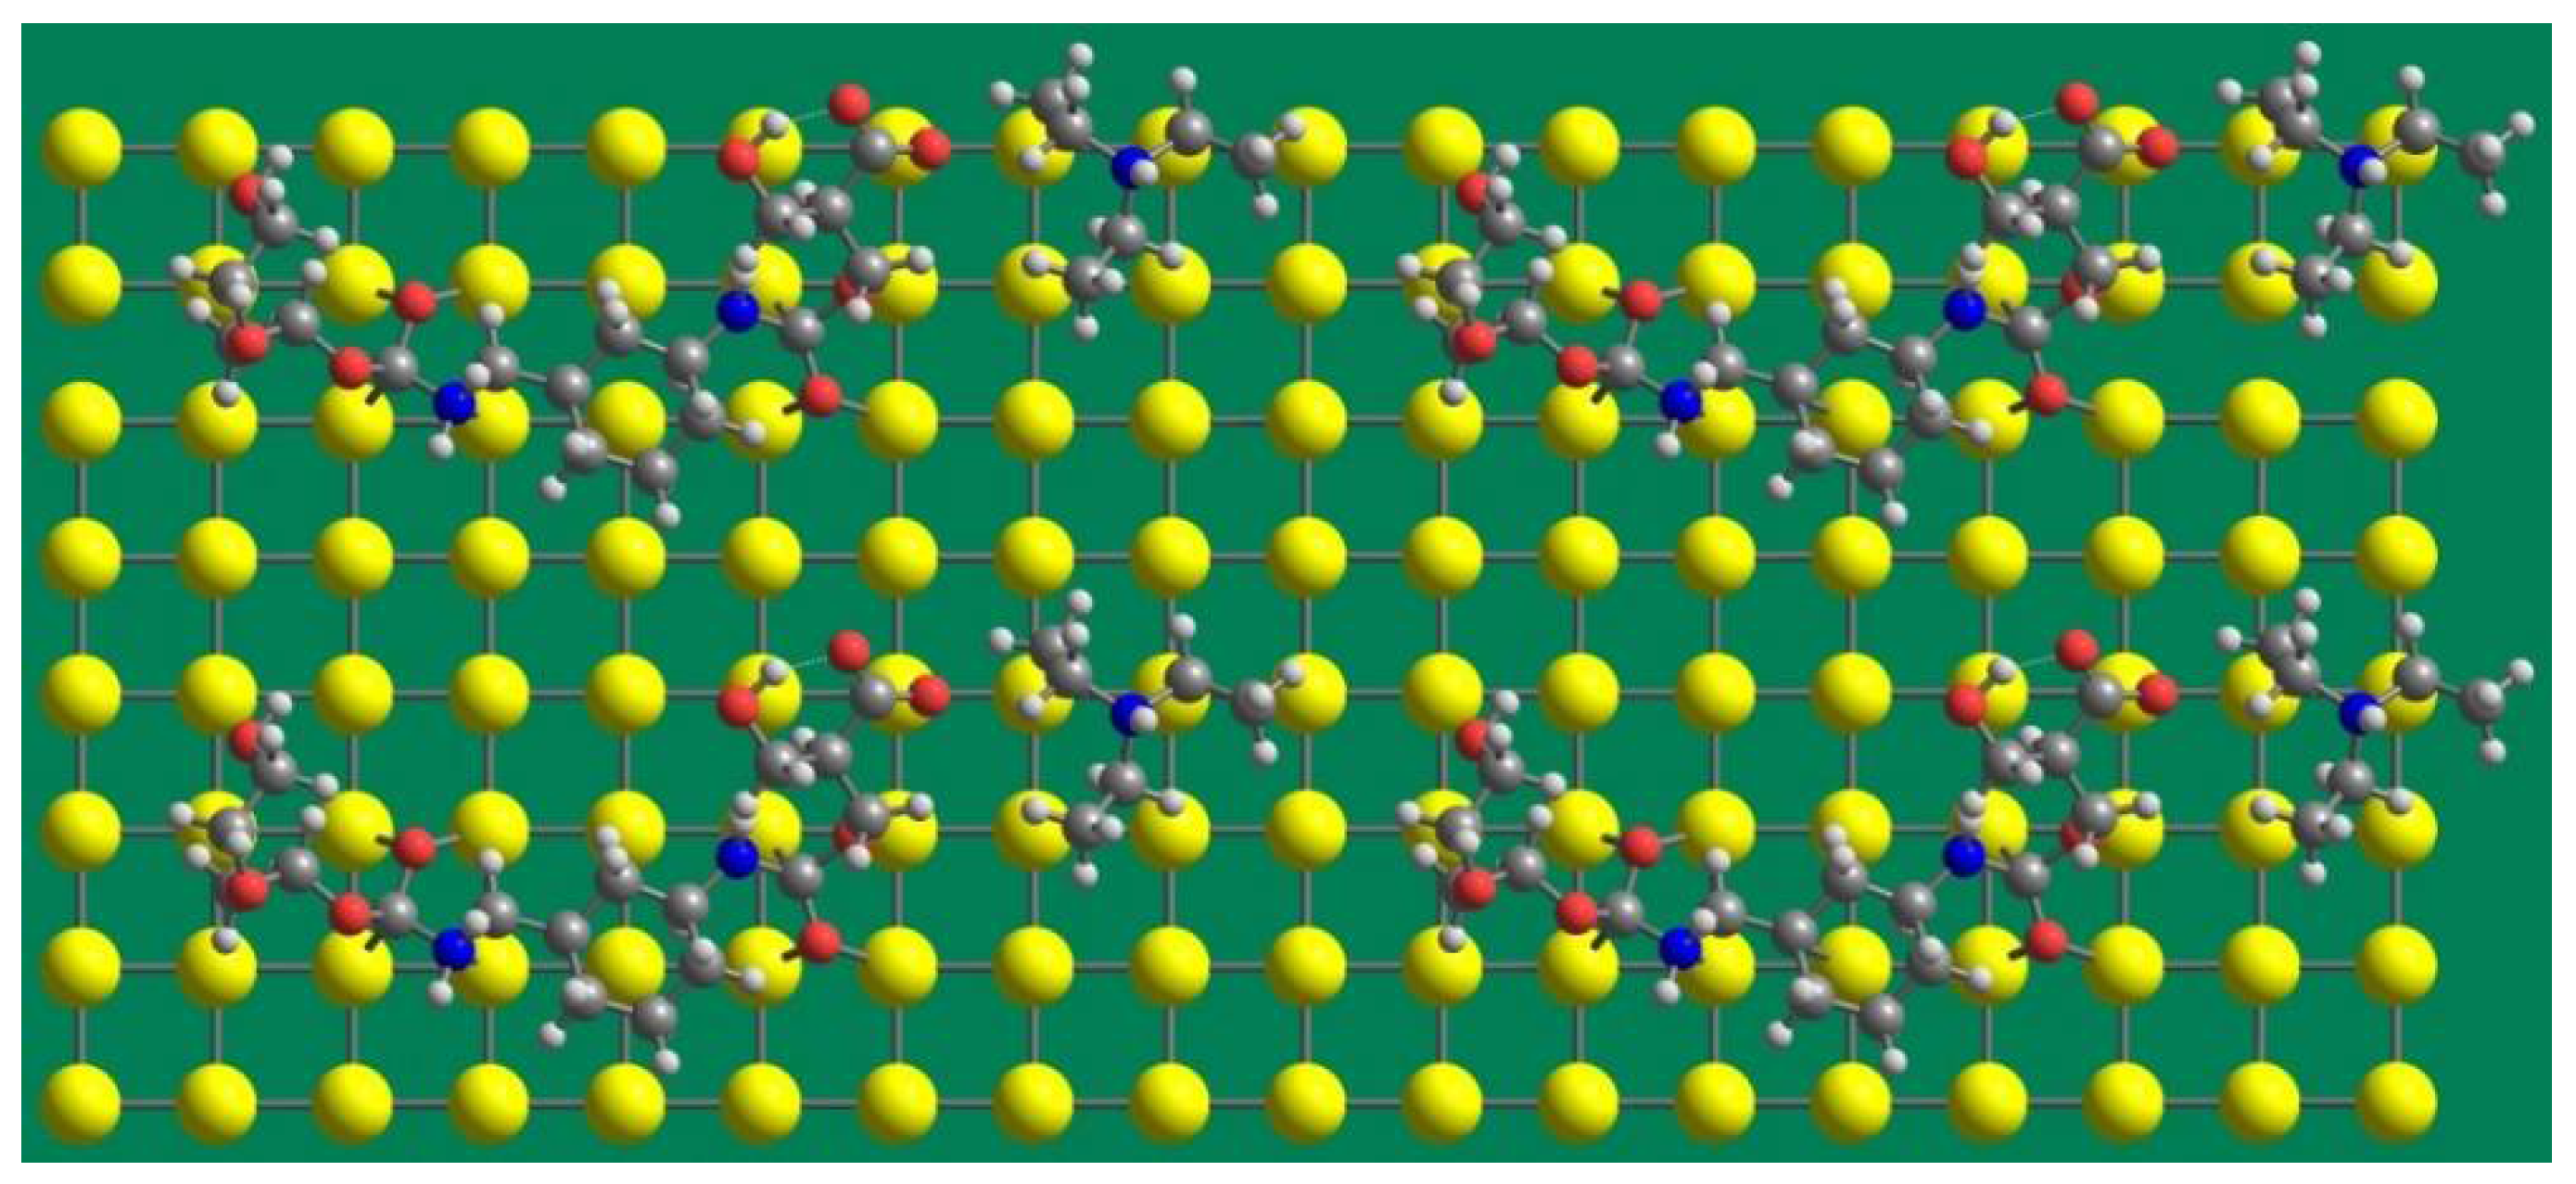
| 1 (See Figure 11) | 2 (See Figure 11) | 3 (See Figure 11) | ||||
|---|---|---|---|---|---|---|
| carboxyl group in the ether fragment | amino group | carboxyl group in the ether fragment | ||||
| r(Fe-O) = 1.95 Å–1.99 Å (bridge position) | r(Fe-O) = 2.07Å (distorted in the on-top position) | r(Fe-O) = 2 Å–2.114 Å (distorted bridge position) r(Fe-C) = 1.93 Å (distorted hollow position) r(Fe-O *) = 1.98 Å (distorted on top position) | ||||
| −15 | −10 | −5 | 0 | 5 | 10 | |
| *, eV | |||
|---|---|---|---|
| −6.5 | −2.92 (mim−) −2.11 (NEt3H+) | 10 | 0.4 ** |
Publisher’s Note: MDPI stays neutral with regard to jurisdictional claims in published maps and institutional affiliations. |
© 2022 by the authors. Licensee MDPI, Basel, Switzerland. This article is an open access article distributed under the terms and conditions of the Creative Commons Attribution (CC BY) license (https://creativecommons.org/licenses/by/4.0/).
Share and Cite
Zaripova, Y.F.; Razhabov, S.; Pavelyev, R.S.; Vinogradova, S.S.; Nazmutdinov, R.R.; Vakhitov, I.R.; Varfolomeev, M.A. Effective Inhibition of Carbon Steel Corrosion by Waterborne Polyurethane Based on N-tert-Butyl Diethanolamine in 2M HCl: Experimental and Computational Findings. Energies 2022, 15, 1939. https://doi.org/10.3390/en15051939
Zaripova YF, Razhabov S, Pavelyev RS, Vinogradova SS, Nazmutdinov RR, Vakhitov IR, Varfolomeev MA. Effective Inhibition of Carbon Steel Corrosion by Waterborne Polyurethane Based on N-tert-Butyl Diethanolamine in 2M HCl: Experimental and Computational Findings. Energies. 2022; 15(5):1939. https://doi.org/10.3390/en15051939
Chicago/Turabian StyleZaripova, Yulia F., Sherzod Razhabov, Roman S. Pavelyev, Svetlana S. Vinogradova, Renat R. Nazmutdinov, Iskander R. Vakhitov, and Mikhail A. Varfolomeev. 2022. "Effective Inhibition of Carbon Steel Corrosion by Waterborne Polyurethane Based on N-tert-Butyl Diethanolamine in 2M HCl: Experimental and Computational Findings" Energies 15, no. 5: 1939. https://doi.org/10.3390/en15051939
APA StyleZaripova, Y. F., Razhabov, S., Pavelyev, R. S., Vinogradova, S. S., Nazmutdinov, R. R., Vakhitov, I. R., & Varfolomeev, M. A. (2022). Effective Inhibition of Carbon Steel Corrosion by Waterborne Polyurethane Based on N-tert-Butyl Diethanolamine in 2M HCl: Experimental and Computational Findings. Energies, 15(5), 1939. https://doi.org/10.3390/en15051939