Article

A Strategy for Grid-Connected PV-Battery System of Mongolian Ger

by
Baigali Erdenebat
1,*,
Naomitsu Urasaki
1 and
Sergelen Byambaa
2
1
Graduate School of Engineering and Science, University of the Ryukyus, 1 Senbaru Nishihara-cho, Okinawa 903-0213, Japan
2
Department of Electrical Engineering, Power Engineering School, Mongolian University of Science and Technology, Sukhbaatar Disctrict, Ulaanbaatar 14191, Mongolia
*
Author to whom correspondence should be addressed.
Energies 2022, 15(5), 1892; https://doi.org/10.3390/en15051892
Submission received: 29 December 2021 / Revised: 27 January 2022 / Accepted: 2 March 2022 / Published: 4 March 2022
(This article belongs to the Section A: Sustainable Energy)

Abstract

:
One of the main sources of energy utilized in the Mongolian Gers is coal and wood mainly for the purpose of heating and other domestic use. This heavily increases the air pollution levels. A viable solution for handling the air pollution is switching to renewable energy sources (RES). Grid-connected photovoltaic (PV) systems with battery back-up provide a reliable solution to the problem addressing the energy demand and pollution control. This paper proposes a grid-connected PV–second-life battery system and its operation strategy. A single Ger, which consists of a PV array, battery energy storage system (BESS), and an electric heater (EH), is modeled and tested. The trading coefficient and selling unit price are calculated based on variables such as loan, selling price, and purchasing price. The advantages of the proposed strategy are its simple design and easy implementation. The economic result shows that there is a significant reduction in the electricity bill during winters, while the bill can be reduced to zero during summers. Furthermore, the annual profit from the proposed system is USD 15. The CO 2 emissions are reduced from 32 to 7 tCO 2 .

1. Introduction

The Ger district of Ulan Bator, Mongolia uses a large amount of coal for heating during the extremely cold winters. This has exacerbated the air pollution and thereby poses a threat to the health of the local population [1,2]. To mitigate this situation, residential houses are encouraged to use an electric heater as an alternative to raw coal. However, there is a significant shortage of supply while the demand continues to rise. Reports state that around 20% of power is imported from China and Russia to compensate for local energy deficits, especially during winters [3,4].
The direct solution to addressing this shortage is to build new thermal power plants. However, this directly increases the dependency on coal and further increases emissions. Therefore, renewable energy sources remain the most viable, environment-friendly approach to solving the energy crisis and excessive emissions in Mongolia. The share of renewable energy is rising, and currently, 9.1% of the total power generated is from renewable energy sources. The situation in Mongolia is unique due to the environmental and financial constraints presented. The problem is to provide a viable renewable energy based solution that addresses both the shortage of power and the excessive dependency on fossil fuels, thereby reducing air pollution. Most households in Mongolia use a conventional electricity net-meter. These net-meters only show the total monthly load. Using an electric heater as an alternative results in a total monthly load of over 150 kWh. This is detrimental to the domestic consumer, as they have to pay a higher tariff. For RES to be deployed successfully, the tariff system has to be modified to meet the viable operation of RES in the Gers. The Mongolian government, in an effort to popularize renewable energy installation, has approved of a new renewable energy policy known as Feed-In Tariff (FIT). This focuses on small rooftop installations of PV-BESS or wind turbines for the residents of the Ger District [5]. This policy enables the consumer to sell extra energy to the distribution company. This offers an incentive for domestic consumers to install these renewable energy systems. For proper utilization of this new FIT, a suitable operation strategy has to be designed. The multiple PV sources impacted the negative side to the distribution network. These challenges are reverse power flow and voltage rise in LV networks [6]. Grid consolidation, demand-side management (DSM), and reactive power absorption by inverters are approaches for mitigating the rise in voltage produced by high PV adoption. On the other hand, the concept of deploying an energy storage system (ESS) for over-voltage protection under high PV guidance settings has been considered over the years [7,8]. The combination of PV and battery (ESS) has advantages to improve the self-consumption rate and mitigate the peak load in the morning and afternoon. The grid-connected PV–battery storage system structure and its strategy to optimize the size of the system, with FIT schemes and an energy management system, have been studied in the related research works [9,10,11,12,13,14].
In-depth research has been conducted studying the inclusion of RES into the Mongolian grid. Various operation strategies for a PV hybrid system for domestic use have been compared aiming at mitigating peak demand and presenting the techno-economic results in [15]. Battuvshin et al. [16] presents that economic analysis is important to determine the PV and battery size due to capital cost and investment in Mongolia. Thus, the best solution to reduce the installation cost is to use SLBs with nickel–metal (NiMH) batteries from the imported HEVs, which are widely used in Mongolia. It is expected that SLBs are still able to utilize in residential houses because these SLBs have dropped their capacity to 80% [17].
This paper presents a simple operation strategy for a grid-connected PV–SLB system to be deployed in the Mongolian Gers. The following are features of this work: (i) the BESS consists of second-life batteries sourced from electric vehicles to reduce the capital cost; and (ii) the simple design is easy to implement. The proposed work aims to mitigate the Ger district’s dependency on coal and reduce the air pollution arising from the same. This work has two major parts: first, a operation strategy to be used with the feed-in tariff is presented, and secondly, the available economic benefits from variable parameters such as loan, selling price, and purchasing price are evaluated to compute a trading coefficient that shows the effectiveness of this idea. The details of the proposed operation strategy are presented subsequently. The system configuration on which the proposed operating strategy is applied is described in Section 2. Section 3 presents the mathematical model and operation of the proposed strategy. Section 4 elucidates the techno-economic expression of the problem statement. Section 5 and Section 6 present the results and conclusion, respectively.

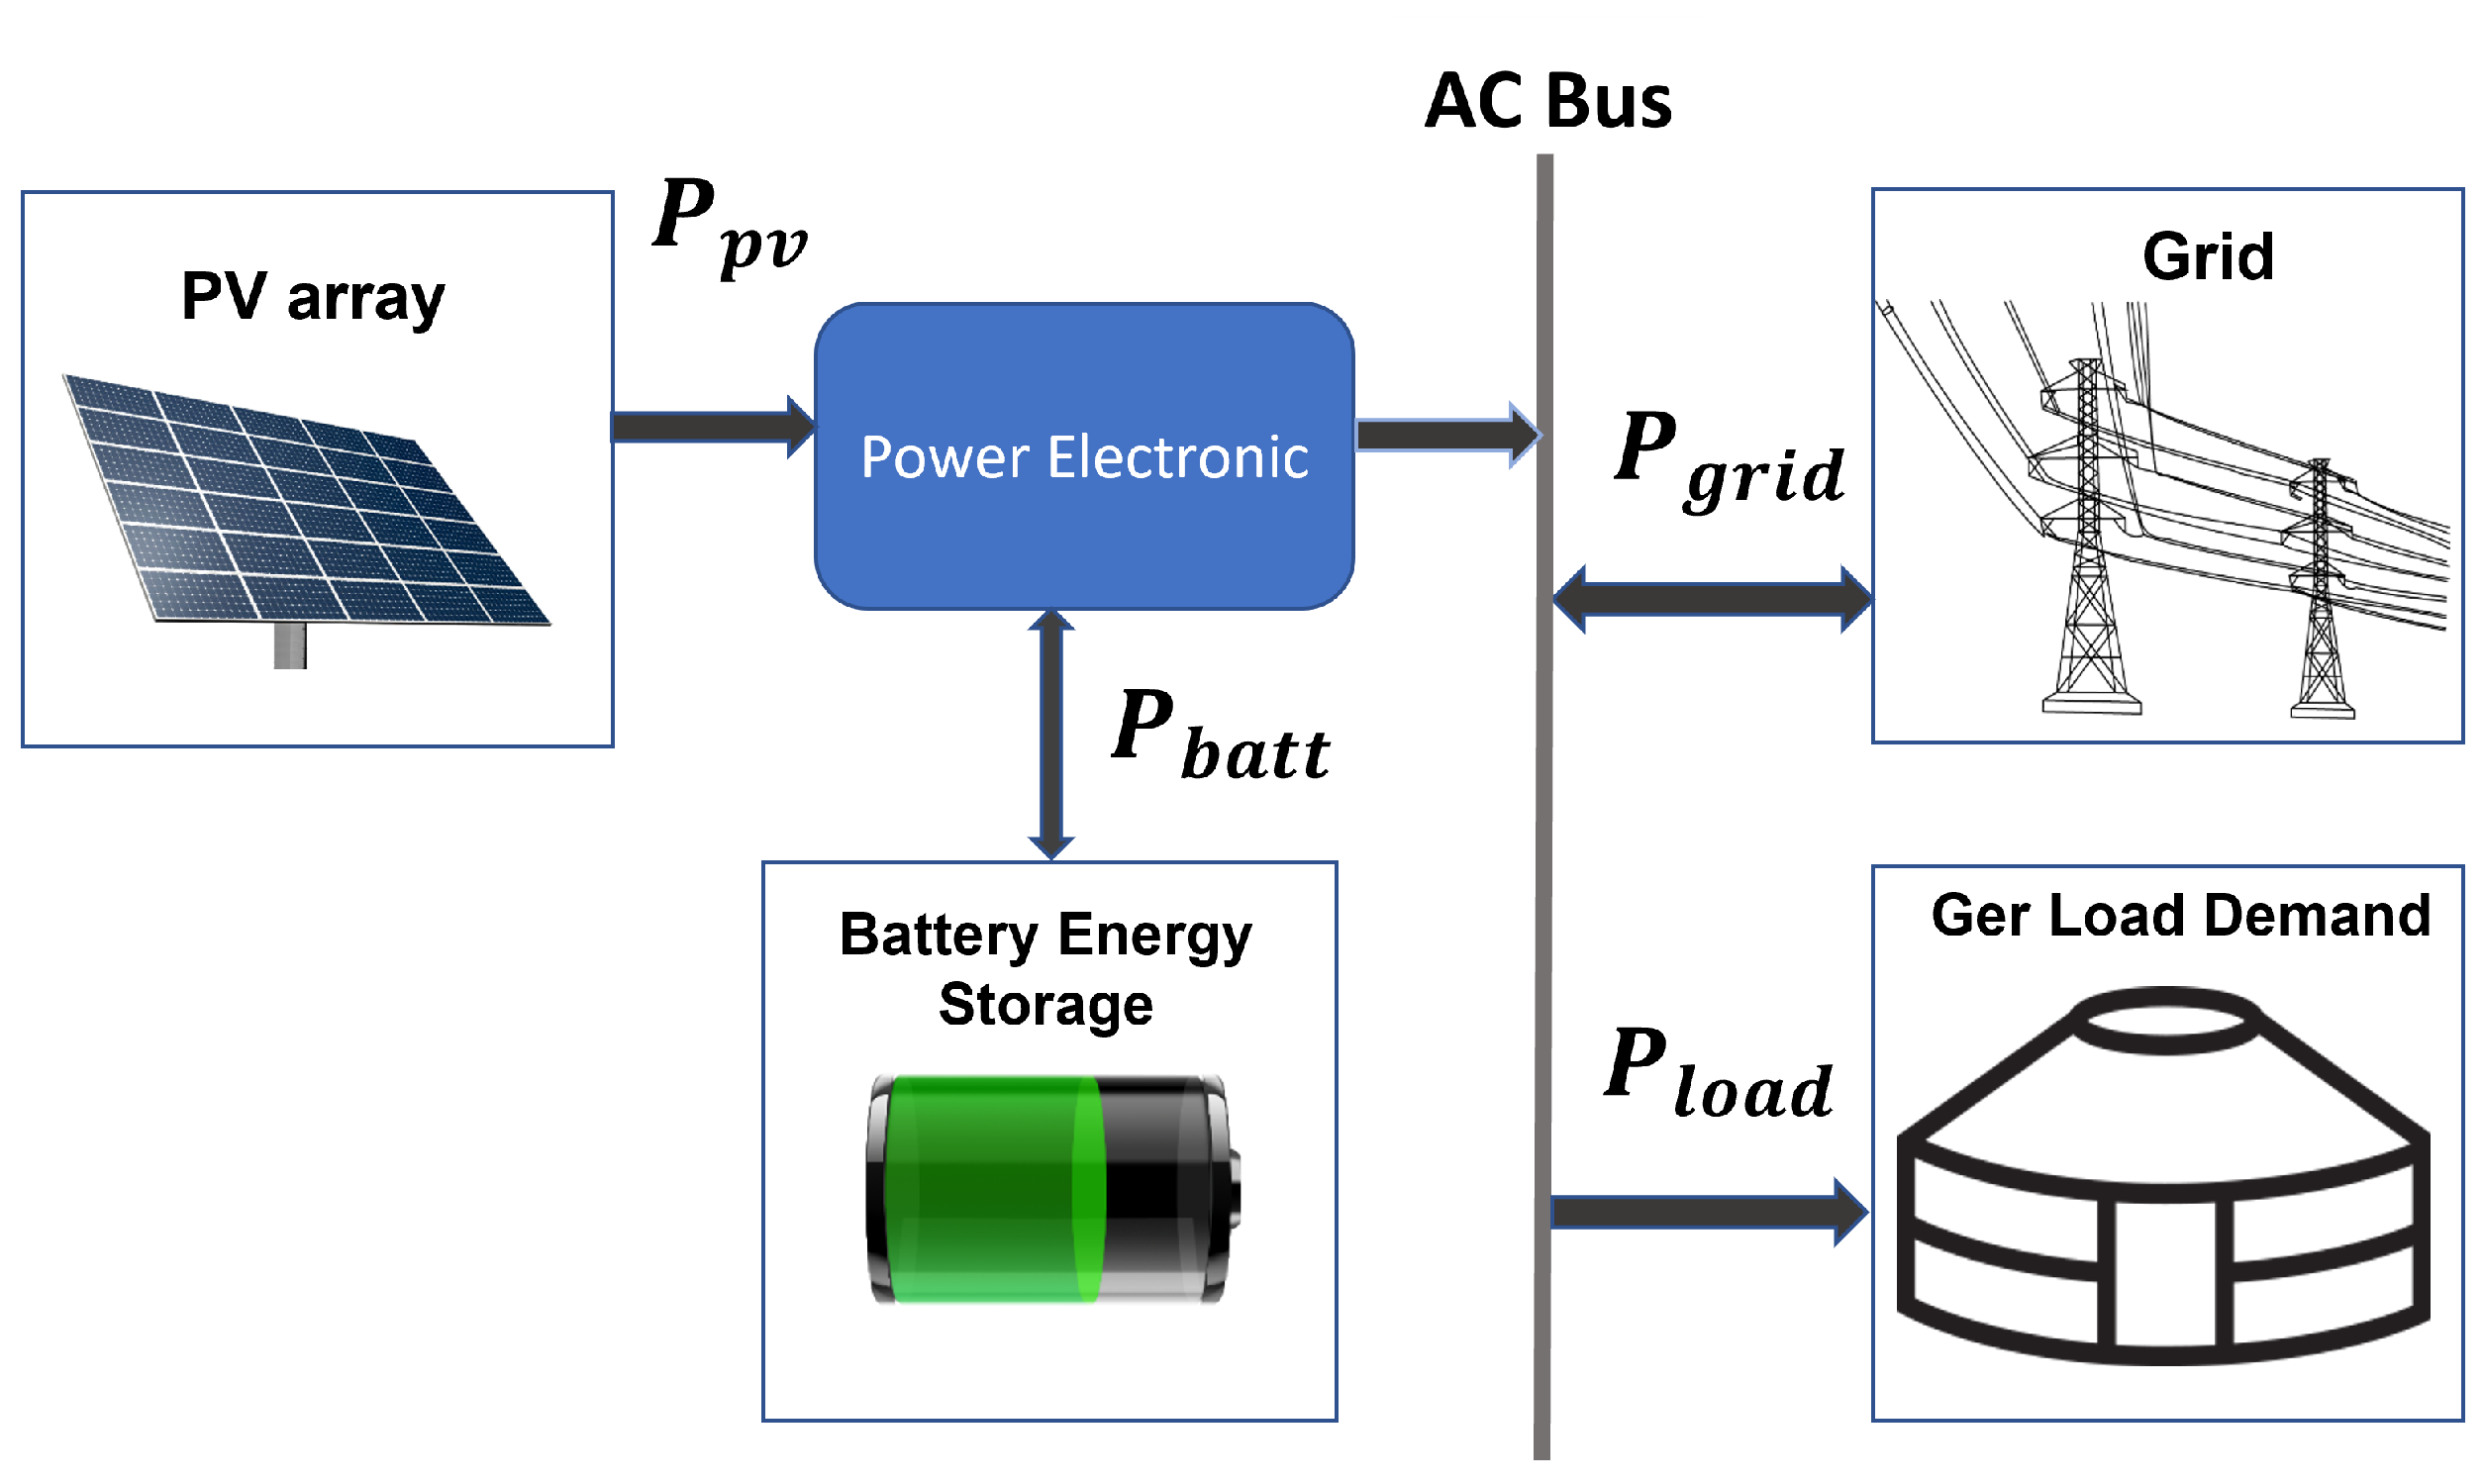
2. Description of System

2.1. System Configuration

The schematic layout of the grid-connected PV–SLB system is illustrated in Figure 1. A hybrid operation is used to manage electricity consumption in Ger connected to a hybrid system including the grid, PV, and BESS with electronic devices by scheduling the operation time of the battery for absorbing the peak demand and selling the extra energy. The sizing of the hybrid system was determined by maximum power in the peak demand of winter. For the BESS, batteries can smooth the PV output and mitigate the technical challenges as well as increase the economic benefits. Thus, BESS with 12 kWh of battery capacity is involved in this hybrid system. From Figure 1, P g r i d , P l o a d , P b a t t , and P p v represent power flow from the power supply to the Ger, which are grid power, power consumption of the electric loads, charge/discharge power of the battery, and PV output power, respectively. The power balance between the supply and demand sides refers to:
Power balance:
P g r i d = P l o a d P b a t t P p v

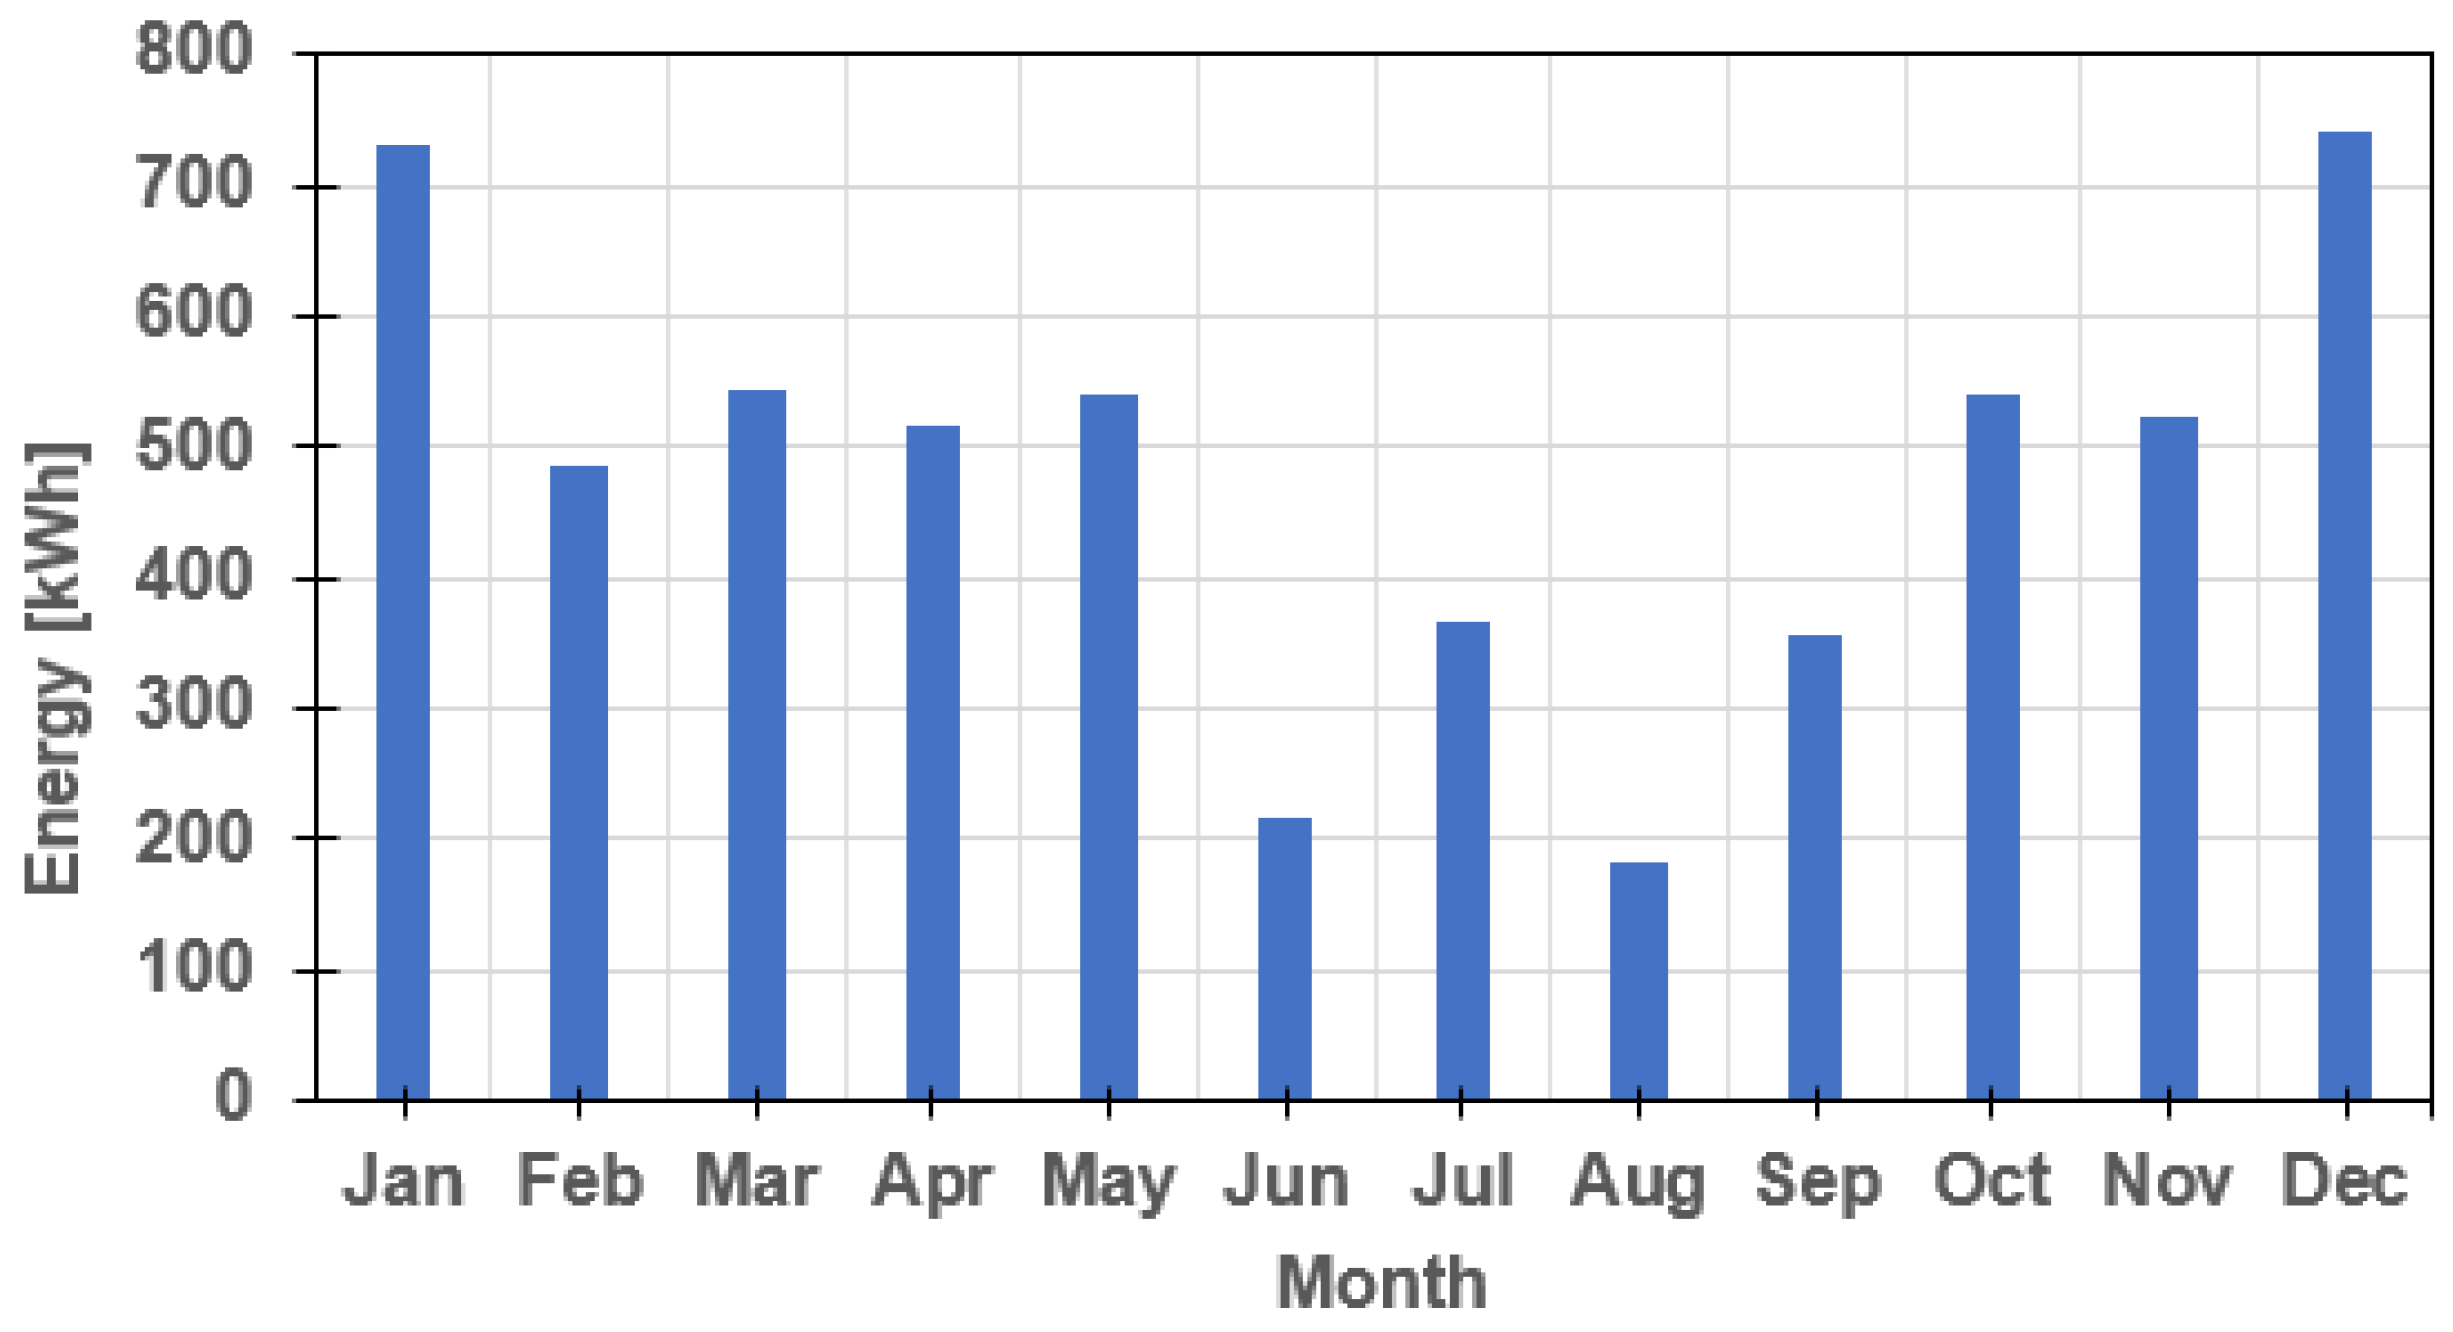
2.2. Data Collection and Analysis

The survey conducted by the National Statistic Center of Mongolia reported that there are 206,700 households including 87,700 Gers and 119,000 houses in the Ger district [18]. The main problem that occurs in the winter season is to supply an electric heater due to energy shortage and economic issues. It tends to increase the power consumption among houses. Figure 2 depicts three types of daily load curves: high, medium, and low. Ger-3 was chosen as a target in this research work. Ger-3 is a completely standard-sized residence among the Gers in which many users reside, with the lowest electrical load, as depicted in Figure 3. Since the electric heater is running, peak load time occurred, in winter, at 5–6 a.m., 3–5 p.m., and 9–10 p.m., respectively. The working time of the electric heater depends on not only weather but also on the residents’ comfort. The monthly electricity consumption of target Ger is represented in Figure 3. The PV output power depends on several factors such as geographical location and solar intensity, which is shown in Figure 4. Ger demand consumption is obtained from the Local Electrical Distribution Company.

3. Mathematical Model

3.1. PV and BESS Mathematical Models

3.1.1. Photovoltaic Output Power Model

The current–voltage (I–V) characteristic which determines the maximum power of PV is affected by the solar intensity and PV–module temperature. In [19], the maximum output power of the PV is estimated as Equation (2):
P D C = P n · G m G n · η
where G n is the nominal solar irradiation (1000 W/ m 2 ), G m is the measured solar irradiance (W/ m 2 ), and P n is the maximum power, in k W p , and η is the temperature coefficient.

3.1.2. Battery Energy Storage Model

Since batteries are a chemical-based storage device, the SoC of the battery is the main challenge to estimate [20,21]. The battery is modeled based on SoC, which determines the remaining capacity of the battery. The (SoC) of the battery refers to:
S o C ( t ) = 1 0 t I d ( t ) d t Q 0
where I d is the discharging current, and the charge delivered from the battery is 0 t I d ( t ) d t , and Q 0 is the maximum capacity of the battery.
Battery constraints include two various constraints to avoid overcharge and deep discharge. S o C m i n is equal to 20% and S o C m a x is equal to 90% as follows:
Constraint for state of charge (SoC):
S o C m i n S o C S o C m a x
Constraint for charging time:
09 t 17

3.2. Energy Management System Algorithm

Based on the basic operational strategy described in Figure 5, the operation performance of the PV-SLB system throughout the year is simulated.
The basic principle of this technique is when the PV power output exceeds load demand, the PV energy charges the battery first, and then excess energy is sold to the grid. When the PV generation is less than the load demand, the battery empties first to fulfill the load demand. If neither the PV nor the battery can fulfill the load demand, power will be purchased from the utility grid to meet the load demand.

4. Problem Formulation

The main objective of this paper is to obtain economic benefit by not only trading power but also scheduling controllable appliances for reducing peak demand. Thus, the total income is presented in this section.

4.1. Grid Electricity Price

The grid electricity bill depends on two types of net-metering [22]. First, the normal net-metering is determined by their demand consumption. If the monthly electricity consumption of the household is higher than 150 kWh, it is calculated by 0.038 USD per kWh. While if the monthly consumption is lower than 150 kWh, it is calculated by 0.045 USD per kWh. On the other hand, for two tariff net-metering, it is determined by time periods. Thus, the price is high at 0.04 USD per kWh when the time is between 6 a.m. and 9 p.m., and the price is low with 0.031 USD per kWh. In this work, first option should be chosen to calculate the total cost.

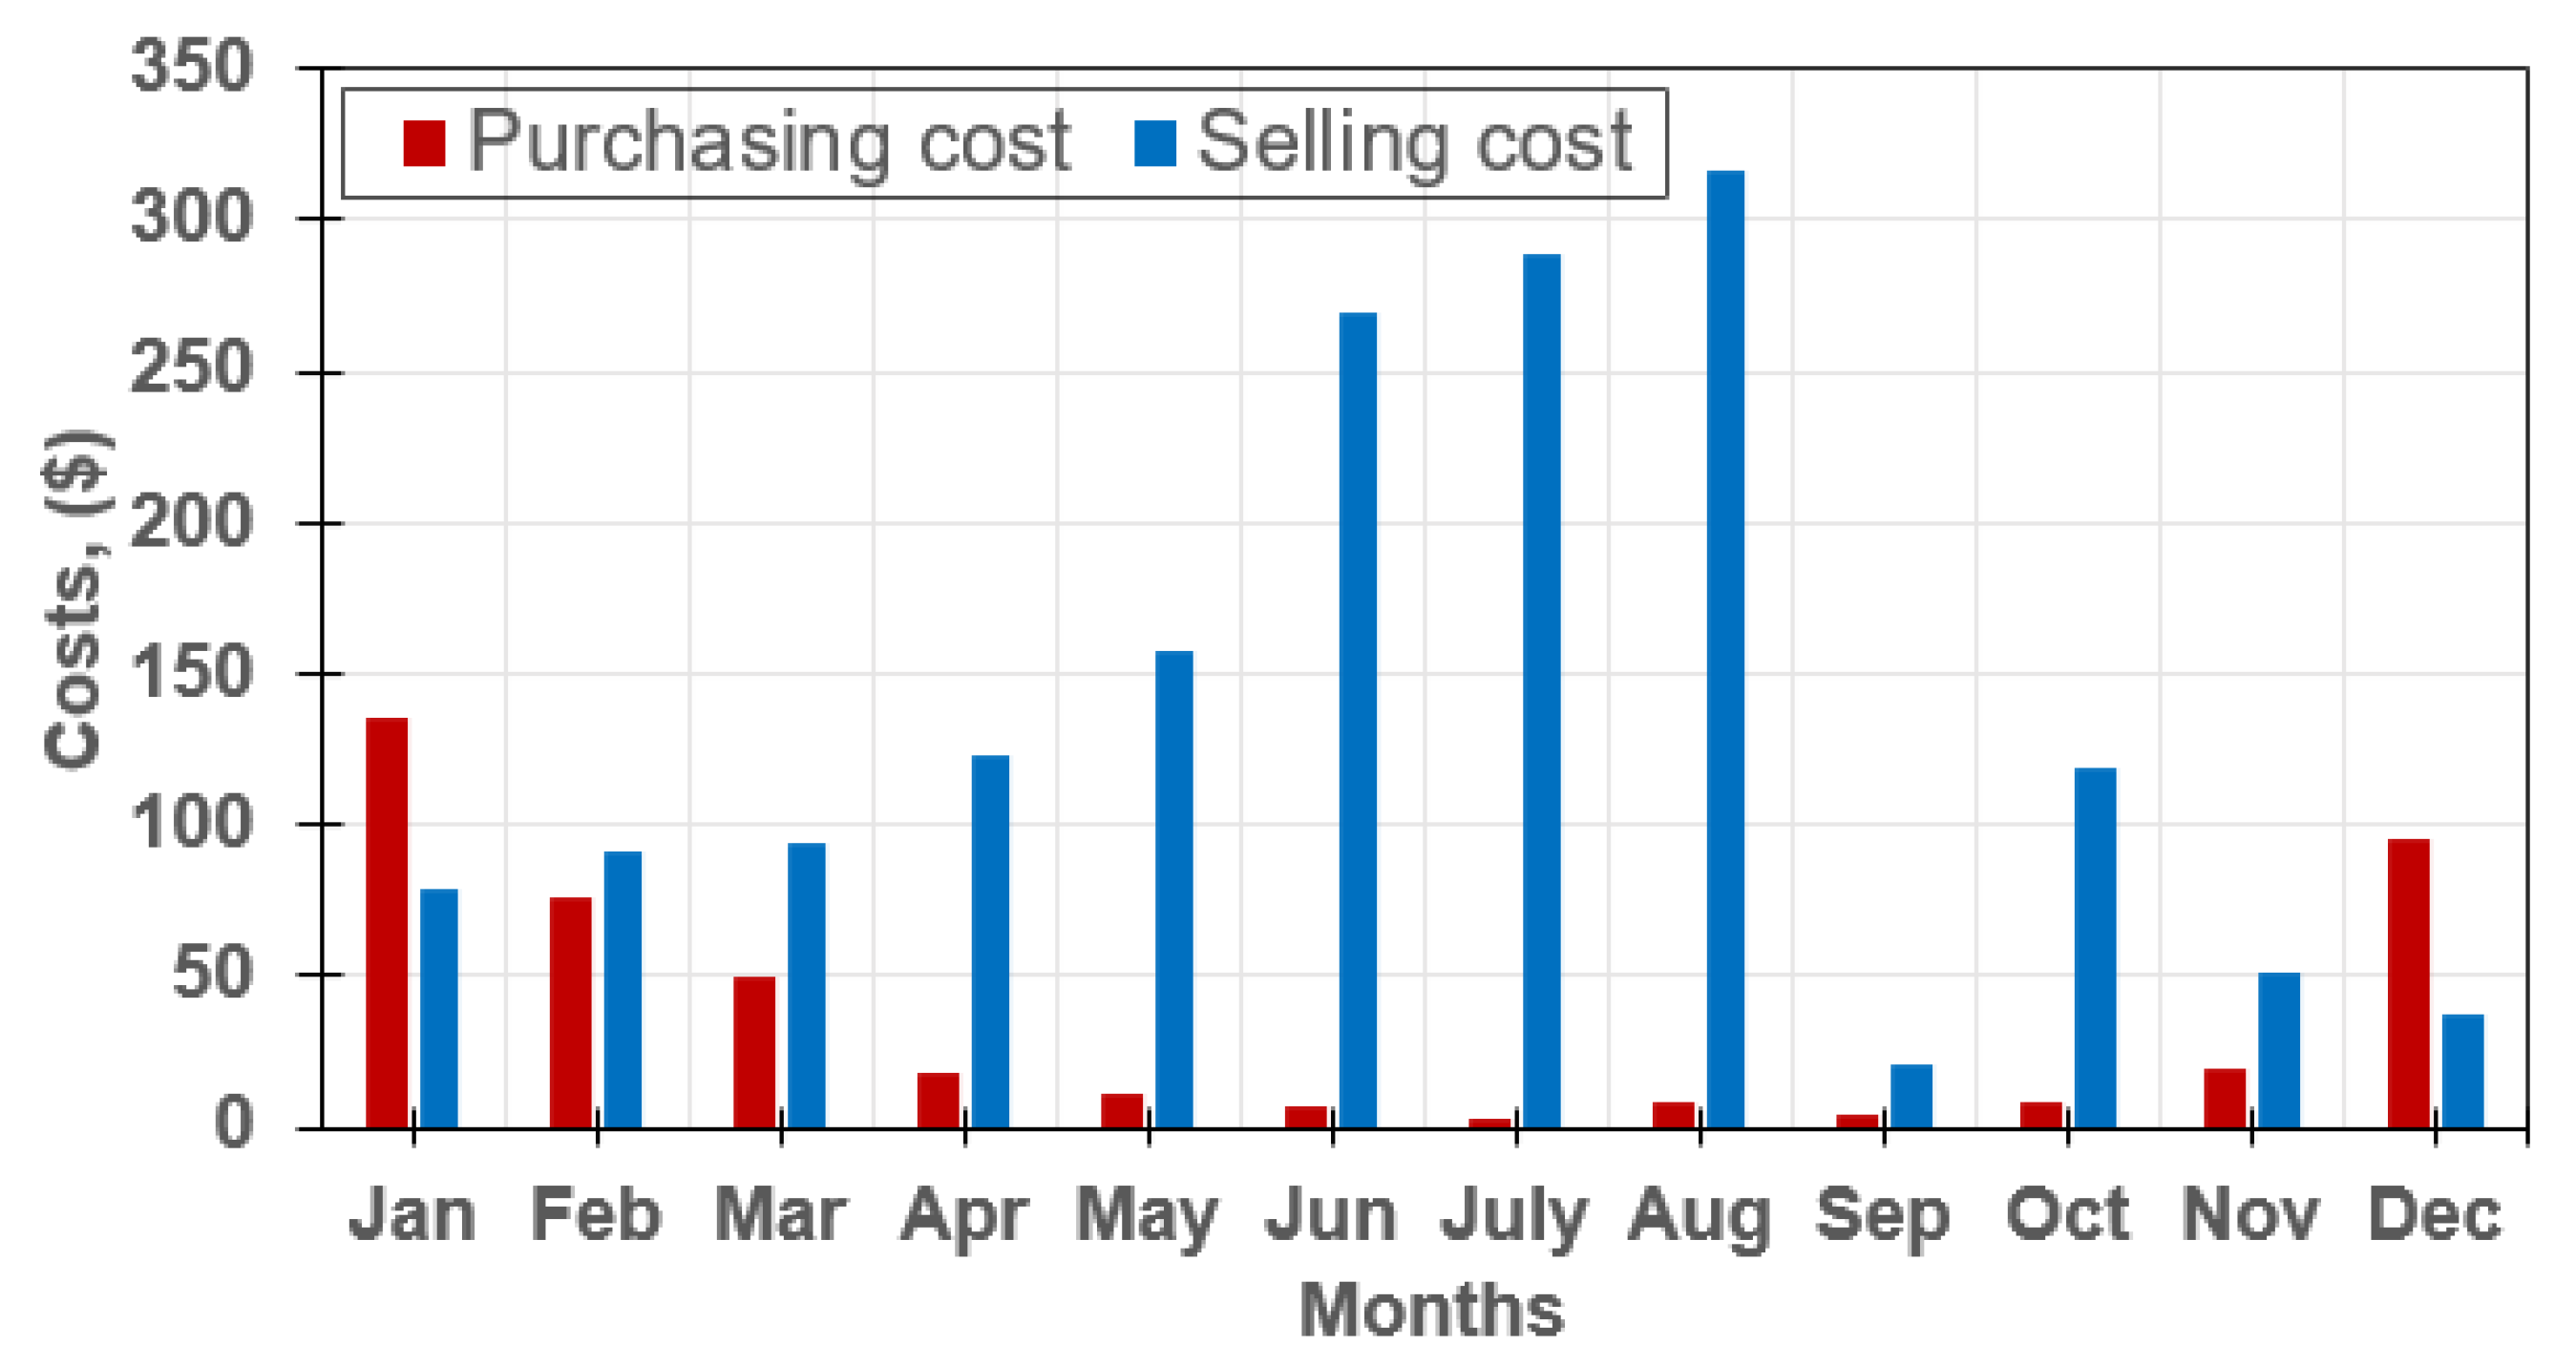
4.2. Hybrid System Cost

The main problem is assumed to be that the users are unable to install the hybrid system due to the high installation cost. Thus, the total cost of the capital M(cap) is the sum of all the components costs including the bank loan’s interest rate. The payment is assumed to be returned over 10 years with an interest rate of i L . Then, the total capital cost [23] is calculated in Equation (6)
M ( c a p ) = c o T ( C A P c o ) · C R F · 10
C R F = i L ( i L + 1 ) 10 ( i L + 1 ) 10 1
CRF represents the Capital Recovery Factor, allowing the determination of the value of an annuity according to the interest rate and the period of the payment. co represents the components of the hybrid system and C A P c o is the capital cost of a specific component.
The hybrid system components are shown in Table 1.
General objectives:
According to FIT from the Mongolian government, the operation year when the user will sell its extra power to grid is applied by at least 3 years. In other countries’ experiences [5], it is better to have long years: about 10–20 years. Thus, in this paper, the operation year of the hybrid system will be 10 years. In addition, coefficient (k) is applied to determine the price of the selling power [24]. The selling price is a lower price compared to the purchasing price from the local utility company. It is limited from 0 to 1 and increased based on the annuity net cost.
G s e l l = ( 0 < k < 1 ) G p u r c h a s e
The total electricity cost M(t) is expressed by Equation (9) [25]. Herein, G ( t ) means that the user will pay money to the grid or get money from the grid. P ( t ) means the power consumed by the grid or the power sold to grid.
M ( t ) = t = 1 T G ( t ) · P ( t ) d t
G ( t ) = G p u r c h a s e , i f P ( t ) > 0 G s e l l , i f P ( t ) < 0
Herein, P ( t ) > 0 means the user purchases power from the local utility company and P ( t ) < 0 means the user sells power to the utility company.
M ( n e t ) = M ( c a p ) + t = 1 8760 M ( t )
The total net cost in Equation (10) is divided into two expressions: the capital cost includes the loan rate shown in Equation (6) and the total electricity bills shown in Equation (9).

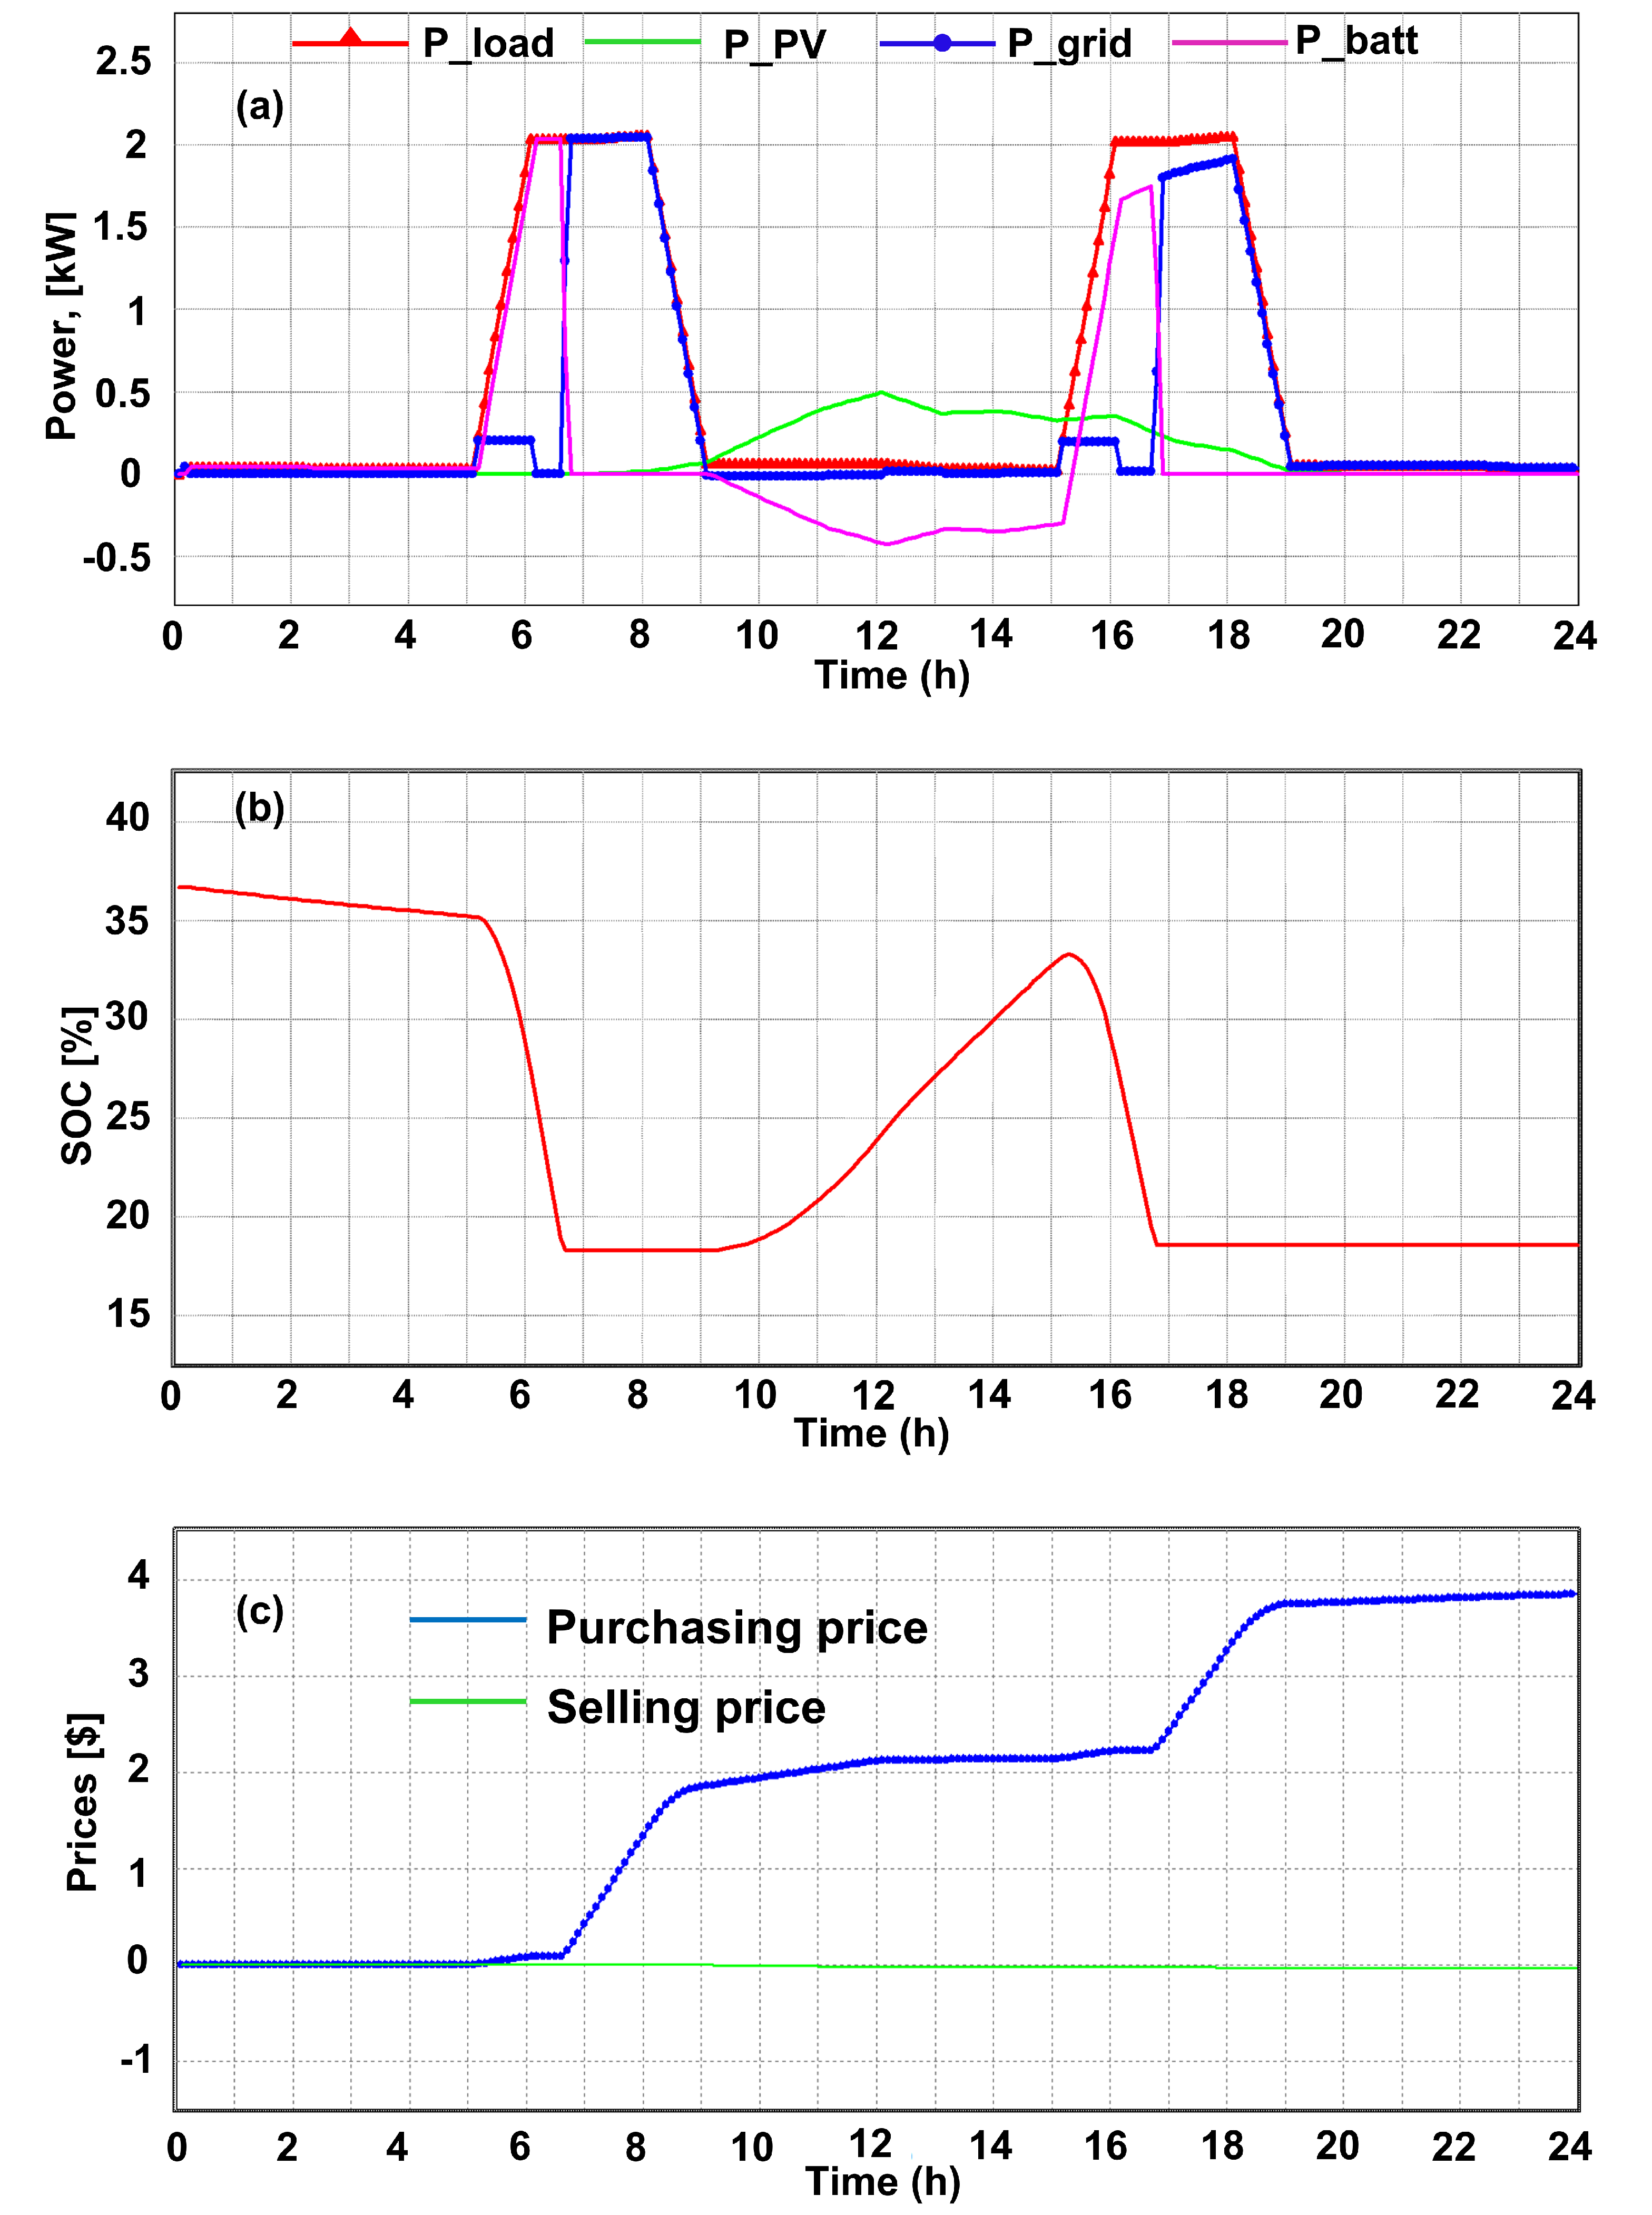
5. Simulation and Discussion

In this section, the simulation results of the proposed model are presented. The results of the management system and economy evaluation in three weather conditions (cloudy, sunny winter, and summer) are detailed in Figure 6, Figure 7 and Figure 8. Since most households in the Mongolian Gers use a conventional electricity net-meter, it cannot get an exact hourly load curve. So, the load curve is obtained from the monthly load information by assuming that an electric heater is used at morning and night. To demonstrate the technical performance, the operation algorithm is described in Figure 6a as an example. It includes the four modes A, B, C, and D based on Figure 5. Mode-A means that the purchased PV generation power and battery power are empty, so the power is purchased by the grid, while mode-B means that the PV generation is higher than the load demand, so the battery is also charging by PV generation. Mode-C means that PV generation supplies the load demand and battery sufficiently, so excess energy is sold to the grid, while mode-D means that the PV generation is empty, so the battery is discharged to fulfill the load demand. As a result, the PV-SLB system not only meets the load requirement but also allows users to sell extra energy. The time horizon is 24 h. The electricity consumption reaches peak power at some hours (5–6 a.m. and 4 p.m. as well as 10 p.m.) in sunny winter. The PV production is around 3.8 kW, and battery is sufficiently able to charge to 90% in off-peak hours. Battery power may be positive or negative. A positive value means that the battery is being discharged. Conversely, a negative value indicates that the battery is being charged. Furthermore, the grid electricity price is around USD 1.8/day, whereas the excess energy price is around USD 3/day. The result finds that the occupants are able to minimize electricity price. The Mongolian tugrik is converted to US dollar.
Figure 7 shows power production during a cloudy winter. The PV output power is negligible, just 500 W, and the peak power is the highest around 2.1 kW. Therefore, the grid is the main source in this condition, as illustrated in Figure 7a. The battery is charged to just 33%, as given in Figure 7b. Since the PV production is lower, it is required that the occupant has to purchase electricity from the grid. The grid electricity price on a cloudy day is higher at about USD 4/day compared with a sunny winter.
In Figure 8, the demand is decreased in the summer. In detail, electrical demand shows the lowest point around 500–800 W, while PV production reaches around 5 kW, as shown in Figure 8a. It is clear that the occupants are capable of earning money from the market of selling energy. It is around USD 10/day.
The result of annuity electricity bills including purchasing and selling costs in Figure 9 illustrates that the highest amount of money for purchasing electricity from the grid was spent, about USD 135 and 95, in January and December, respectively. Whereas in the summertime, the total amount of profit selling extra energy to the grid was about a three times increase to nearly USD 310 compared to wintertime.
Figure 10 illustrates the variation of total annual cost M(net) for target Ger. Consumers can be paid much money, ranging from around USD 80 to 296, at the beginning of the year. Starting in July, the consumer can obtain profit of about USD 105 by selling excess energy from the proposed system. The maximum profit of about USD 314 can be obtained in August. Then, it decreased from about USD 299.22 to around USD 15 in December. The coefficient (k) which achieved profit starts from 0.95 when the payment period of the loan is over 10 years. Although the consumer obtains sufficient benefit by selling excess energy, the distribution company has to consider the stability of the grid.
The amount of greenhouse gases ( CO 2 ) -produced energy from the grid is demonstrated in Equation (11). Herein, E represents the total energy (kWh) in a year, C represents carbon footprints of 1.5 Ibs/kWh, and t represents the amount of tons for footprints equal to 1 t/2000 Ib. As can be seen, Figure 11 illustrates how much the CO 2 is able to decrease depending on the PV sizes. The highest amount of CO 2 is around 32 tCO 2 / year when the PV system is not installed.
Although the CO 2 significantly decreases when the PV system with 3 kW is installed, it is unlikely to be installed in terms of Ger’s consumption. Upon increasing the size of the PV to 12 kW, the CO 2 reduction is less compared with the capacity of 3 kW. The capacity of PV with 6 kW is the optimal size for Ger because of their electricity consumption and reduction of CO 2 .
CO 2 = E · C · t

6. Conclusions

The operation strategy and trading coefficient for a grid-connected PV-SLB system with FIT are performed with FIT to achieve our goals: to decrease air pollution and to obtain economic benefits. As a result, the Ger selected in this paper emits around 32 t CO 2 /year when the PV-battery system is not included. In comparison, the amount of the air pollution will be decreased from about 25 t CO 2 /year to 7 t CO 2 /year for the proposed system. As a result of economic profit, the users pay the highest amount of money to the grid during the wintertime, whereas they sold the highest amount of power to the grid during the summertime. From comparing the cost rates of the purchasing and selling cost, although the selling cost is higher than the purchasing cost, the total annual net cost is less due to the loan payments for the initial cost of the hybrid system. However, when coefficient (k) equals 0.95, its benefit will start from a positive value. According to the results, the proposed system could have a favorable influence. This research would obtain significant development for the current Mongolian situation. Thus, in the following study, we will discuss a group of Mongolian households (Gers and houses) with grid-connected PV-SLB systems by evaluating the techno-economic results.

Author Contributions

Conceptualization and investigation, N.U. and B.E.; Resources, B.E. and S.B.; Methodology, N.U. and B.E.; Supervision, N.U. and S.B.; writing—original draft and revision, B.E. All authors have read and agreed to the published version of manuscript.

Funding

This research received no external funding.

Institutional Review Board Statement

Not applicable.

Informed Consent Statement

Not applicable.

Data Availability Statement

Not applicable.

Acknowledgments

This research was supported by “Higher Engineering Education Development” Project—Research on Innovation of Electrical Distribution and Transmission (J222C15).

Conflicts of Interest

The authors declare no conflict and interest.

References

  1. Air Quality Agency. 2021. Available online: http://tsag-agaar.gov.mn/observation/environment-monitoring/air (accessed on 15 December 2021).
  2. Nakao, M.; Yamauchi, K.; Ishihara, Y.; Omori, H.; Ichinnorov, D.; Solongo, B. Effects of air pollution and seasons on health-related quality of life of Mongolian adults living in Ulaanbaatar: Cross-sectional studies. BMC Public Health 2017, 17, 594. [Google Scholar] [CrossRef] [PubMed] [Green Version]
  3. Oyunchimeg, C.; Tuya, N.; Zorigt, D.; Sukhbaatar, T.; Bayarkhuu, C. Energy Sector Current Status, Recent Developments and Energy Policies in Mongolia. 2021. Available online: https://nautilus.org/napsnet/napsnet-special-reports/energy-sector-current-status-recent-developments-and-energy-policies-in-mongolia-2/ (accessed on 6 September 2021).
  4. Adiyabazar, C.; Acosta, M.N.; Gonzalez-Longatt, F.; Rueda, J.L.; Palensky, P. Under-Frequency Load Shedding in Mongolia: Simulation Assessment Considering Inertia Scenarios. In Proceedings of the 2020 IEEE 29th International Symposium on Industrial Electronics (ISIE), Delft, The Netherland, 17–19 June 2020; pp. 1256–1261. [Google Scholar]
  5. Mongolian Government. Renewable Energy Policy. 2021. Available online: http://https://https://legalinfo.mn/en (accessed on 17 September 2021).
  6. Alam, M.J.E.; Muttaqi, K.M.; Sutanto, D. Mitigation of Rooftop Solar PV Impacts and Evening Peak Support by Managing Available Capacity of Distributed Energy Storage Systems. IEEE Trans. Power Syst. 2013, 28, 3874–3884. [Google Scholar] [CrossRef] [Green Version]
  7. Hongbin, W.; Wang, S.; Bo, Z.; Chengzhi, Z. Energy management and control strategy of a grid-connected PV/battery system. Int. Trans. Electr. Energy Syst. 2015, 25, 1590–1602. [Google Scholar]
  8. Jain, D.; Sandeep, N.; Kumar Verma, A.; Yaragatti, U.R. A Simple Methodology for Sizing of Stand-Alone PV-Battery System. In Proceedings of the 2019 8th International Conference on Power Systems (ICPS), Jaipur, India, 20–22 December 2019; pp. 1–5. [Google Scholar] [CrossRef]
  9. Li, J. Optimal sizing of grid-connected photovoltaic battery systems for residential houses in Australia. Renew. Energy 2019, 136, 1245–1254. [Google Scholar] [CrossRef]
  10. Zou, B.; Peng, J.; Li, S.; Li, Y.; Yan, J.; Yang, H. Comparative study of the dynamic programming-based and rule-based operation strategies for grid-connected PV-battery systems of office buildings. Appl. Energy 2022, 305, 117875. [Google Scholar] [CrossRef]
  11. Guidara, I.; Tina, G.M.; Souissi, A.; Chaabene, M. Techno-economic adequacy for PV-Battery sizing of a residential grid-connected installation. In Proceedings of the 2020 11th International Renewable Energy Congress (IREC), Hammamet, Tunisia, 29–31 October 2020; pp. 1–5. [Google Scholar] [CrossRef]
  12. Yoza, A.; Yona, A.; Senjyu, T.; Funabashi, T. Optimal capacity and expansion planning methodology of PV and battery in smart house. Renew. Energy 2014, 69, 25–33. [Google Scholar] [CrossRef]
  13. Bouakkaz, A.; Mena, A.J.G.; Haddad, S.; Ferrari, M.L. Efficient energy scheduling considering cost reduction and energy saving in hybrid energy system with energy storage. J. Energy Storage 2021, 33, 101887. [Google Scholar] [CrossRef]
  14. Zhang, Y.; Lundblad, A.; Campana, P.E.; Benavente, F.; Yan, J. Battery sizing and rule-based operation of grid-connected photovoltaic-battery system: A case study in Sweden. Energy Convers. Manag. 2017, 133, 249–263. [Google Scholar] [CrossRef]
  15. Munkhtur, Z.; Bat-Orshikh, B.; Bat-Orgil, T.; Dugarjav, B. Technical Evaluation of Utility-Interactive Photovoltaic Power Generation System with Energy Storage based on the Experimental Setup. In Proceedings of the 2019 IEEE Transportation Electrification Conference and Expo, Asia-Pacific (ITEC Asia-Pacific), Seogwipo, Korea, 8–10 May 2019; pp. 1–5. [Google Scholar] [CrossRef]
  16. Battuvshin, B.; Turmandakh, B.; Park, J.H.; Bayasgalan, D. The Study on Development of PV-ES hybrid system for Mongolian Household. Trans. Korean Inst. Electr. Eng. 2017, 66, 1905–1912. [Google Scholar]
  17. Saez-de Ibarra, A.; Martinez-Laserna, E.; Koch-Ciobotaru, C.; Rodriguez, P.; Stroe, D.I.; Swierczynski, M. Second life battery energy storage system for residential demand response service. In Proceedings of the 2015 IEEE International Conference on Industrial Technology (ICIT), Seville, Spain, 17–19 March 2015; pp. 2941–2948. [Google Scholar] [CrossRef]
  18. Zorig Foundation and Konrad Adenauer Stiftung. Statistical Information of Air Pollution. 2021. Available online: https://www.kas.de/de/web/mongolei (accessed on 19 October 2021).
  19. Arab, A.H.; Taghezouit, B.; Abdeladim, K.; Semaoui, S.; Razagui, A.; Gherbi, A.; Boulahchiche, S.; Mahammed, I.H. Maximum power output performance modeling of solar photovoltaic modules. Energy Rep. 2020, 6, 680–686. [Google Scholar] [CrossRef]
  20. Wahyuddin, M.I.; Priambodo, P.S.; Sudibyo, H. State of charge (SOC) analysis and modeling battery discharging parameters. In Proceedings of the 2018 4th International Conference on Science and Technology (ICST), Yogyakarta, Indonesia, 7–8 August 2018; pp. 1–5. [Google Scholar]
  21. Homan, B.; Marnix, V.; Hurink, J.L.; Smit, G.J. A realistic model for battery state of charge prediction in energy management simulation tools. Energy 2019, 171, 205–217. [Google Scholar] [CrossRef]
  22. Energy Regulation Commission of Mongolia. Electricity Tariff. 2021. Available online: http://https://erc.gov.mn/web/en/ (accessed on 25 November 2021).
  23. Khoury, J.; Mbayed, R.; Salloum, G.; Monmasson, E. Comparison of the water heating technique’s impact on the sizing of a standalone PV-battery backup system assisting an intermittent primary energy source. In Proceedings of the IECON 2015—41st Annual Conference of the IEEE Industrial Electronics Society, Yokohama, Japan, 9–12 November 2015; pp. 857–862. [Google Scholar] [CrossRef]
  24. Dinh, H.T.; Kim, D. An Optimal Energy-Saving Home Energy Management Supporting User Comfort and Electricity Selling With Different Prices. IEEE Access 2021, 9, 9235–9249. [Google Scholar] [CrossRef]
  25. Rahmani-andebili, M.; Shen, H. Cooperative distributed energy scheduling for smart homes applying stochastic model predictive control. In Proceedings of the 2017 IEEE International Conference on Communications (ICC), Paris, France, 21–25 May 2017; pp. 1–6. [Google Scholar] [CrossRef]
Figure 1. Layout of the grid-connected PV–SLB system.
Energies 15 01892 g001
Figure 2. Daily load curves of Mongolian Gers.
Energies 15 01892 g002
Figure 3. The monthly consumption of the selected Ger-3 in Figure 2.
Energies 15 01892 g003
Figure 4. Solar irradiation.
Energies 15 01892 g004
Figure 5. The flowchart for operation algorithm.
Energies 15 01892 g005
Figure 6. Power flow in a sunny winter: (a) PV output power, grid, battery power, and power demand; (b) State of charge; (c) Prices.
Energies 15 01892 g006
Figure 7. Power flow in a cloudy winter: (a) PV output power, grid, battery power, and power demand; (b) State of charge; (c) Prices.
Energies 15 01892 g007
Figure 8. Power flow in summer: (a) PV output power, grid, battery power, and power demand; (b) State of charge; (c) Prices.
Energies 15 01892 g008
Figure 9. Monthly electricity bills, M(t).
Energies 15 01892 g009
Figure 10. Variation of the total annual cost with k = 0.95, M(net).
Energies 15 01892 g010
Figure 11. Greenhouse gases reduction.
Energies 15 01892 g011
Table 1. System components characteristics.
ComponentSpecs.Capital Cost ($)
PV panels6000 W9600
Battery ES12 kWh
Inverter6000 W
Electric heater2000 W
Publisher’s Note: MDPI stays neutral with regard to jurisdictional claims in published maps and institutional affiliations.

