Abstract
This study applies the Physical Optimum (PhO) as a reference value to rate the efficiency of two technical options for the oxygen supply of a hospital. The systematic comparison of the alternative processes using the PhO as a benchmark for the minimum input (exergy in this case) required to run a process with a certain benefit allows to determine the potential for optimization of each technology. Differences are analyzed by visualizing the losses of each individual production step in a process as well as by the resulting overall energy demand, including the primary energy. Possible alternatives are purchasing liquid oxygen from a cryogenic process or the production by means of Pressure Swing Adsorption (PSA) on site. The cryogenic production shows a lower exergy demand even though it also has a higher potential for optimization. Yet, the total losses, significantly impacted by the unavoidable transportation, sum up, resulting in the conclusion that the PSA is the preferable option overall, considering energy aspects. Finally, additional criteria such as economic, legal, and structural consequences of the respective choices are briefly outlined.
1. Introduction
The Covid pandemic has recently set a public focus on the relevance of a reliable oxygen supply for medical purposes. Yet, while medical care must be guaranteed, clinics also have to operate economically. Efficiency measures are an option to reduce energy costs. This work aims at analyzing the technical strategy of producing the medical oxygen for a hospital currently in the planning phase in order to point out the more efficient option. Using the method of the Physical Optimum (PhO), saving potentials are outlined precisely referencing a theoretical ideal process to classify the efficiency of a real existing process.
Volta [1] gives the definition of the PhO in his dissertation for the first time. Keichel [2] edits the definition in his dissertation expanding particular aspects. The VDI 4663 [3] is mainly based on the findings of these works. Wenzel [4] compares the PhO to other methods for process evaluation such as the exergy method. Kerpen [5] analyzes differences between the PhO and the exergy evaluation pointing out the advantages of each method. Volta and Weber [6] additionally explain the integration of the state variable exergy into the evaluation with the PhO.
This study gives a practical example of the application of the PhO. Unlike other methods for process evaluation, the PhO distinguishes between avoidable and unavoidable losses. This study explains the relevance of this distinction. A general ultimate value for air separation is defined with the process independent PhOind. Furthermore, the PhO of a specific process, which includes further unavoidable losses in this case, enables the process evaluation. The study aims to outline the advantage of an ultimate reference value for the evaluation of a process as well as the comparison of different technologies, respectively, processes with the same benefit.
2. Materials and Methods
The standard VDI 4663 [3] describes the purpose of the PhO. In the following section, this method is explained. Furthermore, information on the production of medical oxygen is provided.
2.1. The Physical Optimum
The PhO serves as a benchmark for processes. From thermodynamics, two kinds of efficiency are known: energy efficiency, also known as first law efficiency, and exergetic efficiency or second law efficiency. Energy efficiency is the ratio between the useful energy output of an energy conversion process and the energy input, while exergetic efficiency is the ratio between the useful exergy output and the exergy input. Exergy efficiency may only become unity in case of a completely reversible process.
The shortcomings of the concept of energy efficiency are well known: energy efficiency does not account for the value of the respective input and output energies, and therefore a simple heating boiler yields a higher energy efficiency than a sophisticated combined cycle power plant. On the other hand, exergetic efficiency of many processes have very poor values, suggesting high improvement potentials, which very often are simply impossible to realize with a given process.
In order to provide operational practitioners with a tool that gives them a realistic benchmark and to distinguish between unavoidable losses (U) and avoidable losses (ΔΩ), with respect to a given process, the PhO concept was developed. The PhO gives the ideal state of a given process, which does not have to be reversible in thermodynamic terms. To determine it, firstly, a process is chosen. Secondly, an ideal version of this process is defined, for thermal processes meaning in particular operation with temperature differences of zero within the process, wherever possible.
The differences from the exergetic efficiency are obvious: neither a combustion process, a common part of industrial processes, can ever be thermodynamically reversible, nor a heat-exchanger with different capacitance currents on both sides, even if it is operated in counterflow.
The well-known Betz factor in the use of wind energy may serve as another example. Both the energetic and the exergetic efficiency of a wind turbine are 16/27 in the best case, i.e., with a deceleration of the wind speed to 1/3 of the speed of the free inflow. The PhO factor, on the other hand, would be related to this value and could assume the value “one” for a completely loss-free turbine with swirl-free outflow.
The PhO is a calculated, theoretical value [3] 5. Two different processes can have different PhOs, even if the benefit is the same in both cases [3]. There are two different perspectives for the application of the PhO. In this case, the demand perspective was chosen because the output (the consumed amount of oxygen) is definite, while the consumption perspective focuses on a definite input. For the demand perspective (B), the PhO factor can be calculated to estimate the efficiency of a process as given in Equation (1) [3]. No value smaller than one can be reached [3], so the closer the value is to one, the more efficient the process.
In the ideal case, the demand can be limited to the unavoidable losses U. In the real case, further losses ΔΩ cause a higher demand. Only the latter are the subject of process optimization.
The exception for which the efficiency gives the avoidable losses ΔΩ only, is a process with a limit value of 100% (ηideal → 1), for which no unavoidable losses occur in the ideal case. For any case showing an ideal efficiency of less than one ηideal < 1 or even more than one ηideal > 1 (e.g., heat pumps), the PhO gives a higher degree of detail concerning the losses, focusing ΔΩ.
Unlike other efficiency indicators, for the PhO the Equation (1) is generally valid. The result does not depend on the process. For example, Lucia and Grisolia [7] recently introduced the concept of the “unavailability percentage”. For this concept, the amount of energy not convertible into exergy is calculated. The smaller the value, the higher the efficiency [7]. However, a limit value is not considered. Therefore, one application could be highly efficient showing an unavailability percentage of 60% (e.g., wind turbines) while another shows a value of 1% (electric motor). The minimum value of the unavailability percentage could change with technical development. The approach is therefore more suitable for experts in the field, because the results need a skilled interpretation.
Another characteristic of the PhO, however, is the ultimate definition showing avoidable losses in a PhO factor exceeding the value of one for any application. The PhO is therefore a user-oriented method enabling a wide range of applicants to present their results to others, also laypersons, in an understandable way.
2.2. Application of the PhOind
This section introduces the ideal gas separation by reversible isothermal partial compression, which defines the minimum amount of energy necessary (PhOind). In this study, the value for the PhOind is calculated as the process independent theoretical minimum needed to separate oxygen from air.
For energetic processes, the minimum demand often equals the minimum amount of exergy needed. In gas separation, the reversible isothermal partial compression of the components describes the ideal process causing the minimal demand of exergy [8] (p. 307). The amount of exergy that is calculated to separate the components equals the exergy of the pure components in relation to the mixture (both at ambient state). The principle of reversible isothermal partial compression as an ideal standard cycle for air separation is described below. The value of the PhOind is calculated for this application. Additionally, the utilization of the PhOind in general is explained using the example of the removal of CO2 from the atmosphere.
2.2.1. Energy Demand of Air Separation by Reversible Isothermal Partial Compression
Air shall be considered as consisting of rO2 = 21% oxygen and rN2 = 79% nitrogen (volume fraction). Ideal gas behavior is assumed, meaning that the partial pressure of each component equals the ambient pressure multiplied with this fraction. The database for the material properties is CoolProp [9]. To separate the mixture, the partial pressure of each component is increased by reversible isothermal compression until the partial pressure equals the ambient pressure. The input of specific work can be calculated according to Equation (2). The property values and results are given in Table 1. The product would be the components (pure oxygen and nitrogen only for this analysis) at ambient state.

Table 1.
Property values and results of the rev. isothermal partial compression for oxygen generation at 293.15 K (Database: [9]).
Figure 1 shows the volume fraction of the components before and after reversible isothermal partial compression, as well as the resulting energy demand.
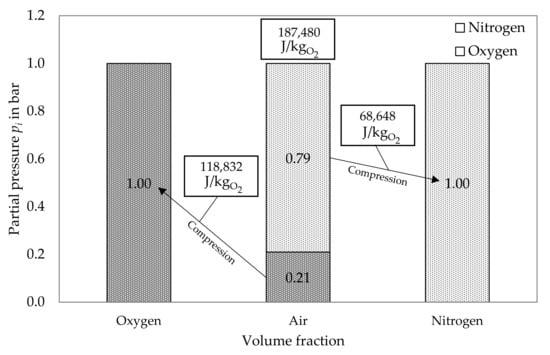
Figure 1.
Reversible isothermal partial compression for air separation: energy consumption.
To produce one kilogram of oxygen, a higher amount of air, depending on , has to be separated, as given in Equation (3).
Further, taking into account the standard density (1.429 kg/), the necessary amount of energy to produce one standard cubic meter of oxygen results in 0.0744 kWh/, as shown in Equation (4).
The specific energy demand for oxygen generation with reversible isothermal partial compression over the initial partial pressure of the oxygen is given in Figure 2. The energy demand is significantly higher for lower concentrations of oxygen in the initial mixture. For a concentration of 100% oxygen, the demand logically equals zero. As an example, which could gain in importance in the future due to an increase in hydrogen production, the waste gas of electrolysis with a concentration of about 99.99% oxygen is illustrated. This method is not investigated any further in this study, because it has not yet been considered for the oxygen production for medical purposes.
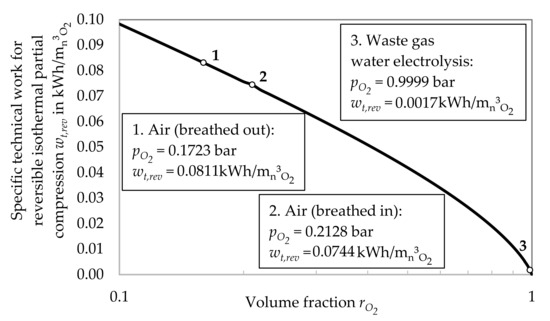
Figure 2.
Energy demand for oxygen generation with rev. isothermal partial compression over rO2.
2.2.2. Process Evaluation with the PhOind by the Example of CO2 Removal
As explained, the PhOind is defined for a certain application scenario with a specific benefit. Apart from the function of the PhOind to compare different processes with the same benefit, the PhOind allows for a quick evaluation of any application based on the same principle. Another example for gas separation would be the technological approach to split off CO2 from the mixture in the atmosphere to reduce the CO2 content (so-called “negative emissions”). Table 2 lists the values for the CO2 removal from air in the same manner as for the oxygen production in Table 1. The concentration of CO2 in air is currently about rCO2 = 400 ppm [10].
Table 2.
Property values and results of the reversible isothermal partial compression for CO2 removal at 293.15 K (Database: [9]).
Again, the minimum amount of energy can be calculated as given in Equation (5).
No value smaller than this can be reached in any process, neither real nor ideal, no matter which technology is chosen. The result allows to roughly evaluate the potential for an implementation of the technology in question. In Germany, 754,112 thousand tons of CO2 was emitted in 2018 [11]. This equals an amount of 102 TWh/a of exergy input, which would have been necessary to compensate the emission for the PhOind, for which no losses occur at all. As this is the model with the highest degree of idealization possible, the real demand would highly exceed this value. In 2018, the electric energy consumption in Germany was 513 TWh [12] (p. 20). Thus, if the overall efficiency of the CO2 separation and storage process was about 20%, the electric demand of Germany would already be doubled for this concept. To avoid further CO2 emissions, the electric production would have to be based exclusively on renewable sources.
The approach is more realistic for an intake gas mixture with a higher concentration of CO2. Figure 3 shows the energy demand for CO2 removal with reversible isothermal partial compression over the volume fraction rCO2. As realistic examples, the separation of CO2 from exhaust gas of a natural gas combustion and of a wood pellet fired boiler both working with an air ratio λ of 1.5 are added. In both cases, as the gas would be cooled down to ambient temperature before separating the CO2, thus losing its water content due to condensation. Therefore, the remaining components are treated as dry air to simplify the calculation.
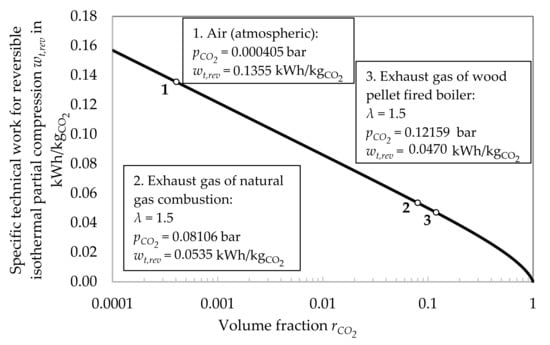
Figure 3.
Energy demand for CO2 removal with rev. isothermal partial compression over rCO2.
The example illustrates the application of the PhOind. By determining the minimum input, the feasibility of the method can be evaluated. To conclude, the PhOind is suitable for the evaluation of a technical application in general. The comparison of two processes with the same benefit is a special case of this approach.
2.3. Legal Requirements of Oxygen Production for Medical Purposes
“Pure oxygen” contains at least 99.5% of O2 [13] (p. 466). Only cryogenic processes reach concentrations that high [13] (p. 466). Meanwhile the ‘Oxigenium 93 per centum’ (O2 93) has been registered in the European Pharmacopoeia. Using O2 93 as an alternative to O2 100 is possible [13] (p. 466). For O2 93, PSA continuously produces a product with a ratio of 90 to 96% oxygen [13] (p. 466). From a medical point of view, no objections have been raised against O2 93 [13] (p. 472). On the other hand, technical devices such as the calibration and measurement units would need to be modified. This results in the necessity of adjusting the operating license, as liability and responsibility are otherwise transferred to the operator, namely the hospital [13] (p. 470). On the technical side, these modifications are feasible [13] (p. 472). This work analyses the energetic aspects.
3. Results
In comparison to the PhOind, even under ideal conditions, the two methods in question for supplying the hospital show further unavoidable losses (PhOind + U = PhO). Thus, the PhO for a specific process can differ from the ultimate theoretical minimum PhOind, in this case mainly because the final thermodynamic state of the oxygen varies between the different processes (liquid for the cryogenic process, gaseous, and pressurized after PSA). For each case, the ideal and real processes are analyzed in order to highlight the more efficient option. The PhO for a specific process gives the potential for optimization of this particular process, whereas the PhOind allows to compare two different processes (under ideal or real conditions) with the same benefit. The difference is explained by the examples for separation processes below.
3.1. Oxygen Extraction with Cryogenic Processes
The distillation of cryogenically liquefied gases enables the separation of gas components. Firstly, the PhO of liquefaction processes is described. The expense is the input exergy in form of electric energy per unit of produced oxygen. Secondly, a real plant is analyzed to compare the actual demand to the ideal process. The exergy of gaseous oxygen is the potential a pure gas (O2) shows in comparison to a mixture (air). When the oxygen is extracted in liquid state, additional exergy is stored in the liquefied gas due to a temperature below ambient state. Therefore, the input must be higher than for gaseous oxygen. In general, the cryogenic production is favorable for high production rates, while the less efficient methods like PSA are advantageous for lower demand [14] (pp. 123–124). Ebrahimi concludes that a cryogenic Air Separation Unit (in this case, the common two-column design) is economically feasible for an oxygen production rate of 9 kg/s, or higher [15] (p. 1316). For the regarded hospital, the average demand is about 0.004 kg/s. Thus, a cryogenic production on site is not feasible. Liquid oxygen is only an option if produced externally.
3.1.1. Ideal Process of Oxygen Liquefaction (Definition of the PhOcryo)
Figure 4 shows the process for the ideal liquefaction of a real gas. In the cryogenic liquefaction machine, the aim is the removal of, firstly, sensible and, subsequently, latent heat from the gas in ambient state (state 1) leading to the complete liquefaction (state 3) [16] (p. 324).
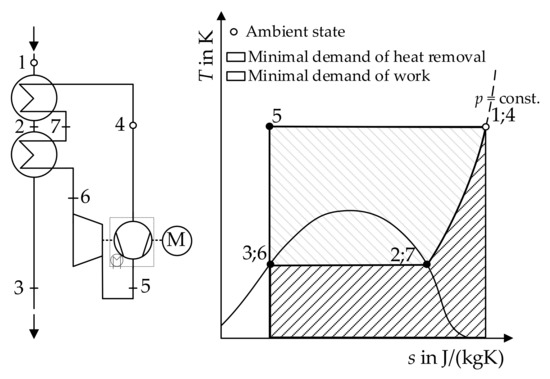
Figure 4.
Flow chart and T-s-diagram of the ideal gas liquefaction, emulated from [16] (p. 326).
The mass flow of the gas in the chiller cycle equals the outer mass flow of the gas intended to be liquefied [16] (p. 324). The compression (state 4 to state 5) is isothermal in the ideal case. The compressed gas subsequently passes the isentropic expansion machine, reaching the boiling point curve (state 6) on the same isobar as state 1. In two ideal heat-exchangers, the heat transfer from the outer mass flow to the mass flow in the cycle results in the complete liquefaction of the outer flow (state 1, 2, and 3) while the gas in the cycle reaches ambient state again (state 6, 7, and 4) [16] (p. 324).
The minimal specific work necessary to run the process is the input for the compression reduced by the amount, which is recovered by the expansion machine. Furthermore, it has to be taken into account that h3 = h6, h1 = h4, and s5 = s3 [16] (p. 326), resulting in Equation (6).
Therefore, the minimum amount of work for the liquefaction depends on state 1 and state 3 [16] (p. 326) only and equals the amount of exergy of the liquefied oxygen in relation to pure oxygen at ambient state (state 1). Table 3 lists the state variables necessary for the calculation based on [9].
Table 3.
State variables for oxygen liquefaction.
The specific work for the liquefaction of one standard cubic meter of oxygen can be determined, resulting in 0.2433 kWh/. Summarizing, the production of liquid oxygen demands at least the sum of the work for the reversible isothermal partial compression and the subsequent liquefaction, adding up to the PhO of 0.3178 kWh/ for this process. No cryogenic air separation site producing liquefied oxygen can reach lower values. Thus, this value is a reference to evaluate the efficiency of real processes. As mentioned before, the minimum energetic expense necessary equals the exergy of the product.
3.1.2. Energetic Analysis of the Cryogenic Oxygen Production
Generally, for the real demand of the production of gaseous oxygen, literature provides a value of 0.35 kWh/ [17] (p. 63), [18] (p. 277), while the demand for liquid oxygen is estimated to be 0.86 kWh/ [18] (p. 277). The data given by an exergetic analysis of an oxygen production plant, outlining the minimum necessary input as well as the losses of the production process [17] (p. 63), is used to evaluate the process in comparison to the PhO in Figure 5.
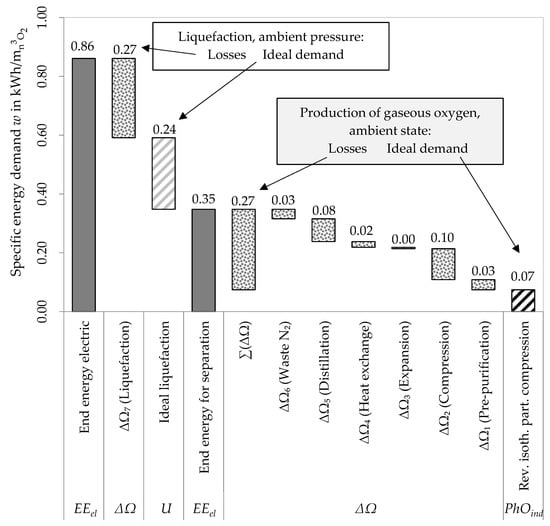
Figure 5.
Evaluation of the cryogenic air separation process with the PhO method.
Firstly, only the production process of gaseous oxygen is analyzed. The PhOind is shown on the right. To the left, the unavoidable losses of each step add up to the actual demand. The additional demand for the liquefaction in the physically optimal and real case follow. This leads to the conclusion, that the necessity of liquefying the oxygen for transportation causes nearly 60% of the energy demand. Additionally, the PhO factor, which outlines the overall efficiency, can be calculated as shown in Equation (7).
- For the liquefied oxygen (), the PhO is the sum of the demand for separation and for liquefaction (). The PhO factor puts the real demand of electric end energy ( in relation to and results in 2.77; and
- It is also possible to compare the overall demand EEel to the PhOind, resulting in a PhO factor ( of 12.3. So, over 12 times the amount of the ultimate optimum is consumed for the cryogenic production.
This example highlights the importance of defining the PhO in a suitable way. For the evaluation of a specific process, the PhO describes the efficiency. The value of 2.77 on the one hand gives the potential for optimization of the cryogenic liquefaction and separation process. This value can therefore function as the starting point for the optimization process. To determine effective efficiency measures, a detailed analysis of the losses with regard to their share of the overall losses should be done as given in Figure 5. The avoidable losses are highest for the liquefaction, compression, and distillation. These steps of the process should therefore be addressed first in the optimization process. Using the PhO, the conclusion can be drawn that the major part of the energy input for liquefaction is an unavoidable loss for this process. To lower this specific input, the process must be changed (see PSA as an option below). If this is impossible, the losses for this step must be accepted as a fixed with no potential for improvement. Therefore, the essential characteristic of the PhO, the distinction between avoidable and unavoidable losses, facilitates the optimization process and enables it to be strategically directed.
The value of 12.3 on the other hand gives the potential for optimization of any conceivable air separation process. The process independent PhOind is applicable, but does not necessarily (if PhOind PhO) outline the avoidable losses of a specific process. The PhOind is defined for a process with a specific benefit without giving further information on the technology. Thus, the PhOind is more general, yet it can be over-idealized to outline the avoidable losses only. In this case, if the process is evaluated using PhOind, losses, which are actually unavoidable for the given process, are indicated as avoidable ones. Nevertheless, the PhOind is suitable for process comparison as shown below.
Furthermore, the transport of the liquefied oxygen from the plant to the hospital is considered. Table 4 lists relevant values to calculate the energy input for the transportation taking the primary energy into account as well. For Diesel, properties of “ultra-light” heating oil are used. The exemplary hospital is sited in a remote area, so the distance is comparatively high. In this case, the end energy consumption for the transport almost equals the input for production.
Table 4.
Relevant values of the transport of liquid oxygen to the hospital.
Figure 6 shows the influence of the distance by a comparison of the primary and end energy consumption for the production and transport of the liquid oxygen as a function of the distance to the production site. The distance for which the amounts are equal is indicated in both cases. For electric energy in Germany, the primary energy factor is assumed to be 1.9 [19] (p. 9). Considering, that the lorry has to go both directions and that it is likely to be empty on the way back, the distances could be halved for a conservative analysis. The significance of the transport would be almost doubled (an empty lorry probably shows lower consumption). This aspect was not considered in the figure, but outlines the significance of PSA for the reduction of energy consumption.
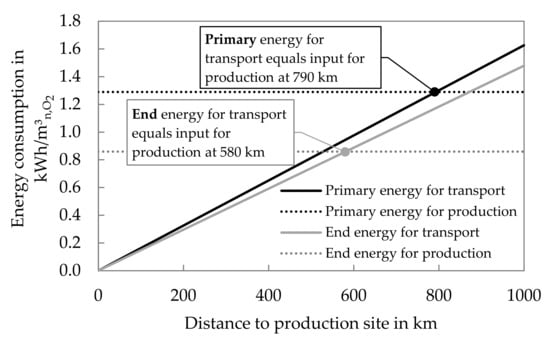
Figure 6.
Comparison of energy consumption for transport and production of liquid O2.
3.2. Oxygen Generation with Pressure Swing Adsorption (PSA)
An alternative to the cryogenic extraction of oxygen is the application of Pressure Swing Adsorption (PSA). Firstly, the physical principles are briefly explained. Secondly, the physically optimal process is defined. A comparison to the real process follows.
Figure 7 illustrates the principle of the PSA. Adsorption isotherms for the equilibrium load an adsorbent can hold of a specific substance are plotted against the partial pressure of this substance [20] (p. 4). For a higher partial pressure, the amount, which can be adsorbed at a certain temperature, increases. The adsorption process therefore demands an increased pressure, the adsorption pressure pA [20] (p. 4). The equilibrium load under these conditions is called adsorption load. To regenerate the adsorbent, the pressure is lowered to desorption pressure pD [20] (p. 4). The load difference between adsorption and desorption equals the amount of substance which can be removed in every adsorption cycle [20] (p. 4).
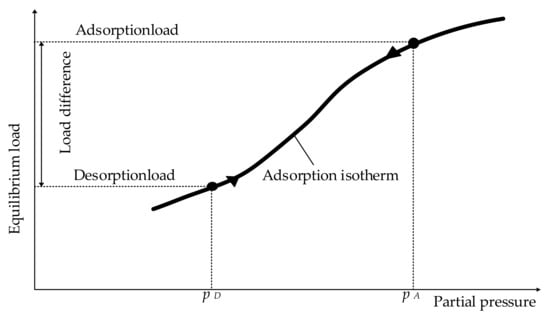
Figure 7.
Adsorption and regeneration by pressure swing, emulated from [20] (p. 5).
3.2.1. Ideal Process of the PSA (Definition of the PhOPSA)
In hospitals, although a high product purity is vital, the mole fraction of the oxygen does not have to be 100% (see Section 2.3). For the ideal process no safety margin is necessary, so the fraction of 90% oxygen required by law is sufficient. Generally, the yield Y, given by the fraction of O2 flow in the product and the feed O2 flow as given in (8), determines the energetic efficiency of the process [21] (p. 126).
With decreasing Y, the amount of air to be compressed increases, causing a higher demand of energy. An increased product purity is only achievable at the expense of a lower Y. The reason is mainly the increase of the recirculation of product for rinsing the adsorbent (rinsing losses, RL) [21] (p. 121). Furthermore, the amount of product extracted when the pressure is lowered for desorption (pressure-relieving losses, PL) lowers Y [21] (p. 126). As the regeneration of an adsorbent of limited capacity is unavoidable, these losses influence the determination of the PhO. PL and RL are defined by the amount of oxygen that is emitted unused to the environment during regeneration [21] (p. 126) in relation to the feed O2 flow as given in (9).
In this case, pA is 6 bars. For the isothermal compression, the energy demand reaches its minimum and again equals the exergetic content of the compressed air. A study [21], analyzing the improvement of fuel cell efficiency by means of oxygen supply via air separation with PSA, determines an optimal process. For this, Y is given over the product purity as shown in Figure 8.
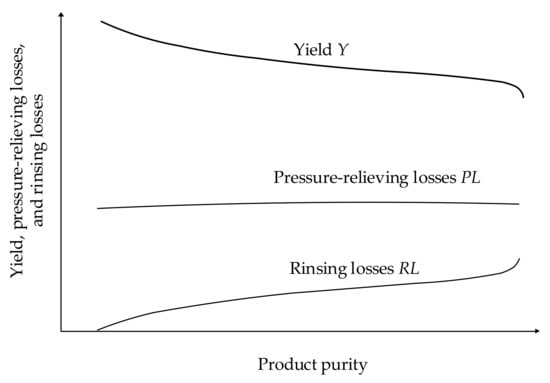
Figure 8.
Qualitative development of Y, PL, and RL over the product purity, emulated from [21] (p. 127).
Under ideal conditions, a Y of 60.3% is reached for a product purity of 90% [21] (p. 129). Table 5 contains the process conditions and results. The minimum input of energy, which is the PhO for the PSA process, results in 0.4291 kWh/. The necessary expense of exergy exceeds the exergy in the product by the losses due to the limited Y. Y therefore represents an unavoidable exergetic loss equalling the exergy which exits the process with the loss flow of product. Therefore, in contrast to the ideal cryogenic process, the minimum exergy input exceeds the exergy content of the product.
Table 5.
Process conditions and energy demand of the ideal Pressure Swing Adsorption.
3.2.2. Energetic Analysis of the Oxygen Production with PSA
As given in literature, applications for oxygen enrichment using PSA consume about 0.9 kWh/ of electric energy [22] (p. 76). Establishing an exact model in order to simulate the PSA exceeds the aim of this work. Thus, the results of [21] are used for the evaluation, mainly focusing on the reasons for the losses, which are explained briefly.
In order to evaluate the effect of the losses, the impact on Y must be specified. If the total energy demand is defined, the additional demand caused by a specific loss can be calculated as given in (10) by the resulting decrease of Y.
Reference is a purity of 90%. Firstly, the influence of limited kinetics, namely, the resistance against mass transfer, inhibits oxygen transportation [21] (p. 133). The study concludes that Y reaches 57% taking limited kinetics into account [21] (p. 135).
Secondly, as in every flow process, friction causes pressure losses. The decisive factor is the diameter of the pellets in the bulk material as well as the flow velocity [21] (p. 135). Considering the pressure losses for this application, Y reaches about 56% [21] (p. 135).
Thirdly, the reaction heat causes an increase of temperature for adsorption and a decrease for desorption processes [21] (p. 141). The heat transfer in the direction of flow causes a change in temperature in following layers before the load changes [21] (p. 143), lowering Y to 50% [21] (p. 145).
For the value of 0.9 kWh/ [22] (p. 76), as stated in literature, the amount of energy for air compression and treatment can be calculated, accounting for the losses of this step in the process. In total, the PhO factor in relation to the reversible isothermal partial compression ( and in relation to the PhO of the PSA process ( can be determined as given in (11).
Again, the PhO factor for the PSA describes the amount of avoidable losses for this specific process. The PSA shows less potential for optimization ( than the cryogenic process (. It is closer to the ideal reference and, thus, the more efficient process.
Figure 9 shows the PSA process, including the PhO and PhOind as well as the occurring losses. In contrast to the cryogenic option, the hospital itself can intervene to carry out optimization measures. Whereas the PSA itself only accounts for a limited share of the avoidable losses, the compression significantly increases the energy demand. This, however, is a process step which can be influenced by the operator. For example, an improved cooling of the process would lead to a lower demand and can increase the exergetic benefit at the same time if a heat recovery is implemented. However, the input of 0.26 kWh/mn3O2 is a fixed value. No optimization measure can lower this input any further. After a reduction of the input, the new consumption should be compared to this value again. If the PhO factor for the compression approaches the value one, further measures are not purposeful any more. Again, the distinction between avoidable and unavoidable losses enables a more strategical orientation of the optimization measures.
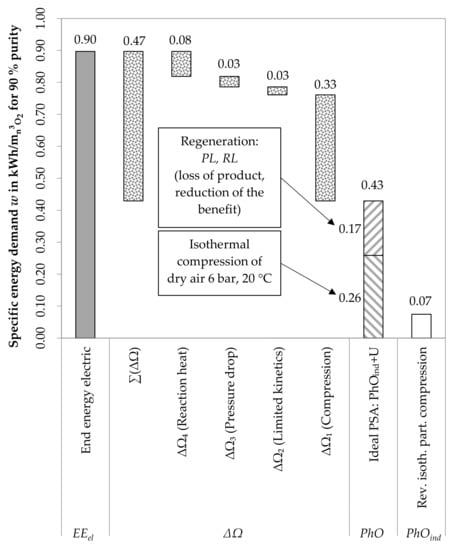
Figure 9.
Evaluation of the oxygen purification using PSA with the PhO method.
Yet, overall, a higher amount of energy is consumed in comparison to the cryogenic process, as shown by , which exceeds the value for the cryogenic production (). As said before, the PhOind should be used for process comparison.
3.3. Comparison of the Production Methods
The cryogenic oxygen production is compared to the PSA process in the following section. Primary energy consumption as well as the necessary transport for the cryogenic production are taken into account in addition to the results already given. Figure 10 shows the respective PhO as well as the total losses for each option. With the PhOind, both options are compared directly.
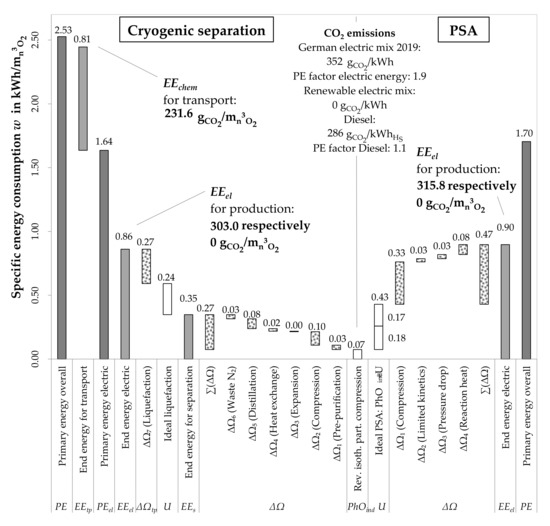
Figure 10.
Comparison of the oxygen production processes with PhO method.
Centered, the PhOind gives the ultimate minimum energy demand. To the left and right, the unavoidable losses U and the avoidable losses ΔΩ sum up to the real demand.
Comparing the PhOs for the production of gaseous oxygen, a surplus of 0.36 kWh/ is consumed using PSA. Furthermore, the purity of the product is lower in this case. In theory, the cryogenic option is more efficient, because the unavoidable losses are higher for PSA. The real energy consumption, for which the losses are considered additionally, is lower as well for cryogenic production.
Figure 11 shows the more common analysis with an energy-flow diagram enabling an illustration of the inner process back-coupling of the expansion machine for the cryogenic process. Eventual balancing differences in Figure 11 are due to rounding imprecision.
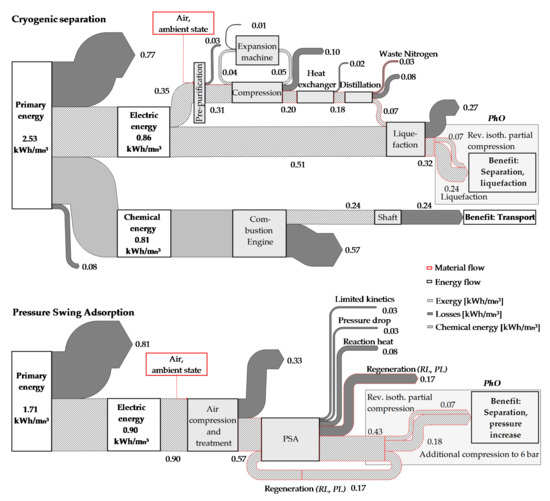
Figure 11.
Comparison of oxygen production options with energy-flow diagrams.
Comparing the PhOs for liquefied oxygen and the gaseous product of PSA, the advantage of cryogenic production is lowered to 0.12 kWh/. The real demand for the cryogenic production (0.86 kWh/) is a little lower than production with PSA (0.9 kWh/).
Considering the primary energy factors and including the transport for the cryogenic option, the result is in favor of the PSA. For delivering, additional primary energy is used. Thus, the demand for cryogenic production exceeds that of PSA over 0.82 kWh/, respectively 49%. In this case (due to a long distance to the production plant), PSA is preferable.
To sum up, the cryogenic process theoretically has a lower demand of energy for production. However, it is the less efficient process. In total, with significant influence of the transport, PSA uses less energy.
Additionally, the specific CO2 emissions are determined. Firstly, regarding the German electric mix with 352 /kWh [23], and including the transport (for cryogenic only: Diesel 285 /kWh [8] (p. 538), [24] (p. 35)), 215 / can be avoided. If renewable energies are used, the CO2 emissions are considered as zero. However, it is currently unlikely, due to economic reasons, that an industrial company would use renewable energies exclusively. Especially, changing the fuel for the transport is, momentarily, unrealistic. Thus, the PSA is again preferable under the aspect of CO2 emissions. Overall, the conclusion is, that in this case, with respect to energetic aspects, the PSA is advantageous.
Additionally, the running costs of liquid oxygen and the PSA are compared in Table 6 and Table 7. For the liquid oxygen, the actual values of the hospital are given. For the PSA, the investment has been assumed to be 40,000 € with a payback period of 10 years. Maintenance costs were considered to be identical for both options. Only the adsorption itself is a process uncommon for a hospital. Therefore, the size of the compression unit would change, but the personnel and spare parts do not depend on the implementation of the adsorber. It is therefore assumed that an external company charges the same amount for monthly maintenance of the adsorber as is charged for the liquid oxygen.
Table 6.
Running costs for liquid oxygen.
Table 7.
Running costs for oxygen from PSA.
The comparison results in an advantage for the PSA for the running costs as well as for the energetic evaluation.
4. Discussion
The results presented here are based on exemplary data found in literature. For the application of the PhO, actual measured data would give a more realistic evaluation. Since the hospital has not been built yet, the data could not be collected. Therefore, certain simplifications, as well as assumptions, are made, resulting in the typical uncertainty of predictions. In the following section, the methods used in this study are discussed. Moreover, aspects influencing the decision process for one of the options are explained.
Firstly, certain simplifications are made. For example, additional losses would occur in reality, which are not quantified in this study. The storage of liquid oxygen causes boil-off losses. As the heat flow from the environment to the liquid oxygen cannot be avoided completely, a particular amount of oxygen evaporates, which is usually blown off periodically to reduce pressure.
The boil-off losses do not occur for compressed oxygen. This, again, is an advantage of PSA. Furthermore, the cryogenic oxygen plant produces in large scales. For a smaller plant, the losses would increase due to scale effects. A study [25] concludes, that for a production flow of only 350 m3/h of oxygen, the power intake of a PSA plant can be lower than for a cryogenic plant [25] (p. 1378). Therefore, the PSA is preferable for small-scale production.
Another relevant simplification is the assumption of a stationary process. In the actual case, the demand for oxygen can be a very dynamic variable. Over daytime, the oxygen supply is increased, for example, for operations taking place. During the night, only the clients constantly in need of a surplus of oxygen cause a demand. Therefore, either the production of the PSA would have to meet the exact demand or a storage would be obligatory to buffer the changes. For the cryogenic option in the hospital, the only limitation is the maximum heat transfer in the evaporator limiting the amount of oxygen which can be fed to the system. The dynamic behavior as well as the resulting losses are not analyzed in this study and therefore a potential aspect of further investigation.
Furthermore, the coupling of the potential oxygen processes with other applications in the hospital is not considered. As shown, the evaporation of liquid oxygen causes a demand for heat. It is also possible to interpret this as a potential for cooling applications. The exergy of the liquefied oxygen might be integrated into the supply system to contribute to the demand for refrigeration in the building. For the PSA, the waste heat of the compression is a potential source for heating purposes. By process coupling, the advantages of the options could be increased, resulting in a more detailed evaluation of the efficiency.
Besides, the study used for the evaluation of PSA refers to the application of PSA as a method to purify oxygen for the more efficient operation of fuel cells. As the common method to realize the oxygen supply is the purchase of liquefied oxygen, the data specification in literature for the application of PSA is not sufficient. The possible degree to which the results deviate would have to be examined more closely. To ensure the accuracy of the results, the value for the end energy consumption taken from literature is used to calculate backwards the energy demand for the compression and conditioning of the air. As the calculated value complies with the expected value, only the percentage distribution of the losses would possibly differ for the production of medical oxygen. Yet, more accurate data would refine the results.
In addition, there are further options for the production of oxygen. The current debate about the integration of hydrogen into the energy supply chain outlines the possibility of using the waste oxygen, which is generated as a by-product in electrolysis. As an additional field of research, this option could be compared to the two methods analyzed in this study.
Lastly, a prioritization within the relevant aspects is necessary for the hospital’s decision process. One of the key issues in this study is the impact of the supply options on the climate. A good example is the purchase of strictly renewable electric energy. The CO2 emissions are immediately reduced to zero, while the energy costs exceed those of the general electric mix in the grid.
An economical evaluation would ideally supplement the study, as this factor is highly significant for the hospital as a business enterprise. The given comparison is simplified. For example, the installation space should be considered. The PSA is economically advantageous if the savings in comparison to the purchase of liquid oxygen justify the additional costs. An adequate economic feasibility study demonstrates the practicability of the technological option. The oxygen demand is substantial in this case. Scale effects increase not only the efficiency of the process, the payback time is lowered as well. Future energy prices as the main influence on the costs of the oxygen should be taken into account. Thus, the main question is which aspect is prioritized. For the external cryogenic production, no effective influence can be exercised on the purchase of the energy. In addition to the emissions of the production, the transport is unavoidable. For the in-house production with PSA, the decision lies with the hospital operators. It can be taken leaning to either economical or climate advantages.
Additional factors, namely an emergency reserve argue against the PSA. The liquid oxygen can easily be stored in capacities sufficient for a month of supply. For the PSA, an oxygen reserve could be realized by the storage in pressure cylinders, but not an amount sufficient for a month. Furthermore, for the case of a blackout, the emergency generator must be dimensioned to also maintain the oxygen supply. Therefore, other supply units are influenced as well. A redundant PSA installation should also be considered. On the other hand, problems in the supply chain are less likely for PSA, because the transport is not necessary.
It is shown that the distance of the hospital from the production plant of the liquid oxygen is the decisive factor that categorizes the PSA as advantageous. The long distance is the reason for the liquefaction as well as the necessity of storage. For a hospital closer to the production site, the picture might change. The significance of the distance and the method of transport must therefore be highlighted. Especially for a hospital in a remote location, the comparison should be performed. A direct transfer of the results to another hospital is not possible without verification of the data.
Furthermore, legal consequences as given in Section 2.3 cause an increased effort for the quality management and a risk of liability. This study outlines the more efficient option in terms of energetic aspects only. Yet, the decision must take all the consequences such as the named into account. For another hospital, the individual conditions of the site must be considered. Table 8 contains the presented results and further criteria leading to a decision.
Table 8.
Comparison of options for medical oxygen supply.
5. Conclusions
By the application of the PhO, it is shown that the cryogenic production method depicts more potential for optimization, although it uses less energy in comparison to PSA.
The concept of the PhO is to define an ultimate reference value for process evaluation in order to distinguish between avoidable and unavoidable losses. This study gives an example for the application of the PhO to a real industrial process, namely, the production of oxygen for medical purposes. Comparing the process independent PhOind and the PhO of a specific process, the particularities of the method are outlined. The application enables a detailed analysis of losses to determine relevant options for efficiency measures. The more general PhOind allows to compare different processes with the same benefit, while the PhO of a specific process defines the potential for optimization, i.e., the avoidable losses.
The PhO method enables a process evaluation which allows to integrate a wide range of boundary conditions. An analysis of losses is the key to process efficiency. The goal of reaching 100% renewable energy supply can only be reached by significantly increasing energy efficiency. The PhO is a user-oriented method contributing to resource efficiency by the concept of reducing the input of a process to the unavoidable minimum amount.
Author Contributions
Conceptualization, S.A.W. and D.V.; methodology, S.A.W., D.V. and J.K.; software, S.A.W.; validation, S.A.W., D.V. and J.K.; formal analysis, S.A.W. and D.V.; investigation, S.A.W. and D.V.; resources, D.V.; data curation, S.A.W.; writing—original draft preparation, S.A.W.; writing—review and editing, S.A.W., D.V. and J.K.; visualization, S.A.W. and D.V.; supervision, S.A.W. and D.V.; project administration, D.V.; funding acquisition, D.V. All authors have read and agreed to the published version of the manuscript.
Funding
This research was funded by the Evangelical Lutheran Deaconess Hospital Flensburg and the Society for Energy and Climate Protection Schleswig-Holstein (Gesellschaft für Energie und Klimaschutz Schleswig-Holstein GmbH, EKSH), grant number 8/12-40. We acknowledge financial support by Land Schleswig-Holstein within the funding program Open Access-Publikationsfonds.
Institutional Review Board Statement
Not applicable.
Informed Consent Statement
Not applicable.
Data Availability Statement
No new data were created or analyzed in this study. Data sharing is not applicable to this article.
Acknowledgments
The authors gratefully acknowledge the support of the proofreaders, in particular, for language support.
Conflicts of Interest
The authors declare no conflict of interest.
Nomenclature
| Roman Symbols | ||
| Symbol | Unit | Description |
| B | e.g., kWh/kg | Demand |
| PhO factor, based on demand | ||
| h | J/kg | Specific enthalpy |
| pi | Pa | Partial pressure |
| PL | Pressure-relieving losses | |
| ri | Volume fraction | |
| RL | Rinsing losses | |
| s | J/(kg K) | Specific entropy |
| T | K | Temperature |
| U | e.g., kWh/kg | Unavoidable losses |
| w | J/kg | Specific work |
| Y | Yield | |
| Greek Symbols | ||
| λ | Air ratio | |
| e.g., kWh/kg | Avoidable losses | |
| Sub- and Superscript | ||
| Symbol | Description | |
| A | Adsorption | |
| chem | Chemical | |
| cryo | Cryogenic | |
| D | Desorption | |
| el | Electric | |
| Feed | Feed flow | |
| ind | Process independent | |
| isen | Isentropic | |
| ith | Isothermal | |
| liqu | Liquefied | |
| min | Minimum | |
| n | Standard | |
| PhO | Physical optimum | |
| PL | Pressure-relieving losses | |
| Prod | Product flow | |
| PSA | Pressure swing adsorption | |
| rev | reversible | |
| RL | Rinsing losses | |
| s | Separation | |
| t | Technical | |
References
- Volta, D. Das Physikalische Optimum als Basis von Systematiken zur Steigerung der Energie- und Stoffeffizienz von Produktionsprozessen. Ph.D. Thesis, TU Clausthal, Clausthal-Zellerfeld, Germany, December 2014. [Google Scholar]
- Keichel, C. Methode der Grenzwertorientierten Bewertung—Energie- und Ressourceneffizienz von Gesamtbetriebsweisen. Ph.D. Thesis, TU Clausthal, Clausthal-Zellerfeld, Germany, April 2017. [Google Scholar]
- VDI. Fachbereich Energietechnik 4663, Blatt 1: Bewertung von Energie- und Stoffeffizienz—Methodische Anwendung des Physikalischen Optimums; Verein Deutscher Ingenieure: Düsseldorf, Germany, 2019. [Google Scholar]
- Wenzel, P.; Radgen, P.; Westermeyer, J. Comparing Exergy Analysis and Physical Optimum Method Regarding an Induction Furnace. Energies 2021, 14, 1621. [Google Scholar] [CrossRef]
- Kerpen, L.; Schmidt, A.; Sankol, B. Differentiating the Physical Optimum from the Exergetic Evaluation of a Methane Combustion Process. Energies 2021, 14, 3419. [Google Scholar] [CrossRef]
- Volta, D.; Weber, S.A. The Physical Optimum as an Ideal Reference Value for Balancing Thermodynamic Processes Integrating the Exergetic Evaluation by the Example of Heat Supply. Energies 2021, 14, 4426. [Google Scholar] [CrossRef]
- Lucia, U.; Grisolia, G. Unavailability percentage as energy planning and economic choice parameter. Renew. Sustain. Energy Rev. 2017, 75, 197–204. [Google Scholar] [CrossRef]
- Cerbe, G.; Wilhelms, G. Technische Thermodynamik—Theoretische Grundlagen und Praktische Anwendungen, 17th ed.; Carl Hanser Verlag: Munich, Germany, 2017; pp. 319–538. [Google Scholar]
- Bell, I.; The CoolProp Team. CoolProp. Available online: //www.coolprop.org/ (accessed on 9 January 2022).
- Umweltbundesamt Kohlendioxid-Konzentration in der Atmosphäre (Monatsmittel). (Schauinsland, Zugspitze), NOAA Global Monitoring Division and Scripps Institution of Oceanography (Mauna Loa, Hawaii), World Meteorological Organization, WDCGG (World Trend). Available online: https://www.umweltbundesamt.de/sites/default/files/medien/384/bilder/dateien/2_abb_kohlendioxid-konz_2021-05-26.pdf (accessed on 28 July 2021).
- Umweltbundesamt Nationale Treibhausgas-Inventare 1990 bis 2019 (Stand 12/2020) sowie Vorjahresschätzung (VJS) für das Jahr 2020. Available online: https://www.umweltbundesamt.de/sites/default/files/medien/384/bilder/dateien/3_tab_emi-direkt-indirekt-thg_2021.pdf (accessed on 14 October 2021).
- AG Energiebilanzen e.V. Auswertungstabellen zur Energiebilanz Deutschland—Daten für die Jahre von 1990 bis 2018—Stand: März 2020 (endgültige Ergebnisse bis 2018); AG Energiebilanzen e.V.: Bergheim, Germany, 2020; p. 20. [Google Scholar]
- Prien, T.; Meineke, I.; Züchner, K.; Rathgeber, J. Sauerstoff 93–Eine neue Option auch für deutsche Krankenhäuser. Anästhesiol. und Intensivmed. 2013, 54, 466–472. [Google Scholar]
- Smith, A.R.; Klosek, J. A review of air separation technologies and their integration with energy conversion processes. Fuel Processing Technol. 2001, 70, 115–134. Available online: https://www.sciencedirect.com/science/article/pii/S037838200100131X (accessed on 9 November 2021). [CrossRef]
- Ebrahimi, A.; Meratizaman, M.; Reyhani, H.A.; Pourali, O.; Amidpour, M. Energetic, exergetic and economic assessment of oxygen production from two columns cryogenic air separation unit. Energy 2015, 90, 1298–1316. Available online: https://www.sciencedirect.com/science/article/pii/S0360544215008397 (accessed on 9 November 2021). [CrossRef]
- Maurer, T. Kältetechnik für Ingenieure, 1st ed.; VDE Verlag GmbH: Berlin, Germany, 2016; pp. 324–326. [Google Scholar]
- Fu, C.; Gundersen, T. Using exergy analysis to reduce power consumption in air separation units for oxy-combustion processes. Energy 2012, 44, 60–68. [Google Scholar] [CrossRef]
- Blesl, M.; Kessler, A. Energieeffizienz in der Industrie, 2nd ed.; Springer: Berlin/Heidelberg, Germany, 2018; p. 277. [Google Scholar]
- Pehnt, M.; Mellwig, P.; Blöhmer, S.; Hertle, H.; Nast, M.; von Oehsen, A.; Lempik, J.; Langreder, N.; Thamling, N.; Hermelink, A.; et al. 7-03-17 Untersuchung zu Primärenergiefaktoren–Endbericht–Leistung gemäß Rahmenvertrag zur Beratung der Abteilung II des BMWi; Bundesministerium für Wirtschaft (BMWi): Berlin/Heidelberg, Germany, 2018; p. 9.
- Linde Group: Hydrogen Recovery by Pressure Swing Adsorption. Available online: https://www.linde-engineering.com/en/images/HA_H_1_1_e_09_150dpi_NB_tcm19-6130.pdf (accessed on 6 July 2021).
- Lengerer, W. Sauerstoffanreicherung durch Druckwechseladsorption für Membran-Brennstoffzellensysteme, 1st ed.; Logos Verlag Berlin GmbH: Berlin, Germany, 2008; pp. 121–145. [Google Scholar]
- Kriegel, R. Energiebedarf von Sauerstoff-Membrananlagen und Technologievergleich. Fraunhofer; IKTS Annual Report; Fraunhofer-Institut für Keramische Technologien und Systeme IKTS: Dresden, Germany, 2013; pp. 76–77. [Google Scholar]
- Stadtwerke Flensburg GmbH. Stadtwerke Flensburg Strommix-SWFL-2019; Stadtwerke Flensburg GmbH: Flensburg, Germany, 2020; Available online: https://www.stadtwerke-flensburg.de/fileadmin/user_upload/Strommix-SWFL-2019.pdf (accessed on 6 July 2021).
- Juhrich, K. CO2-Emissionsfaktoren für Fossile Brennstoffe; Umweltbundesamt, Fachgebiet Emissionssituation (I 2.6): Dessau-Roßlau, Germany, 2016; p. 35. [Google Scholar]
- Banaszkiewicz, T.; Chorowski, M.; Gizicki, W. Comparative analysis of cryogenic and PTSA technologies for systems of oxygen production. AIP Conf. Proc. 2014, 1573, 1373–1378. [Google Scholar]
Publisher’s Note: MDPI stays neutral with regard to jurisdictional claims in published maps and institutional affiliations. |
© 2022 by the authors. Licensee MDPI, Basel, Switzerland. This article is an open access article distributed under the terms and conditions of the Creative Commons Attribution (CC BY) license (https://creativecommons.org/licenses/by/4.0/).