Article

Study on Overburden Movement and Fissure Evolution Law of Protective Layer Mining in Shallow Coal Seam

College of Mining, Guizhou University, Guiyang 550025, China
*
Authors to whom correspondence should be addressed.
Energies 2022, 15(5), 1831; https://doi.org/10.3390/en15051831
Submission received: 28 January 2022 / Revised: 24 February 2022 / Accepted: 26 February 2022 / Published: 2 March 2022
(This article belongs to the Special Issue Rock Burst Disasters in Coal Mines)

Abstract

:
This study aims to effectively solve the problem of the destruction of the coal roof and floor overlying rock after mining the protective layer, and determines whether the gas in the protected layer can be effectively released. We do this based on the engineering background of the Weng’an Coal Mine; research and analysis of the movement of the roof and floor overlying rocks; the evolution of cracks and the pressure relief characteristics of the protected layer after mining the protective layer; and through theoretical analysis and similar simulation experiments. Through numerical simulation, it was found that the protected layer was depressurized due to the mining of the protective layer, and the decompression rate of the protected layer was 0.2–0.8. In addition, the overall expansion rate of the protected layer was greater than the requirements of the “Detailed Rules for Prevention and Control of Coal and Gas Outbursts” for coal mines, and the investigation of the residual gas pressure and content of the protected layer revealed that the protected coal seam had been mined in the upper protective layer coal face. The gas pressure dropped to 50.7% of the original coal seam gas pressure, the rate of decrease was 49.3%, the residual gas content dropped by 68.67%, and the gas concentration in the return airway was 0.31% on average, meeting the national regulations that require its value to be less than or equal to 1%. The study comprehensively demonstrates that mining of the protective layer is beneficial to the release of gas from the protected layer, and provides a practical reference for coal and gas outbursts in mines.

1. Introduction

The southwest region, represented by Yunguichuan, has always been the main area of coal mining in China. However, due to the complex storage conditions of the coal mines in the area, a weak roof and floor, and mostly thin coal seams, after the coal seam is mined, the overburden space of the coal seam roof and floor is destroyed, causing many surface disasters [1]. Therefore, studying the movement of the roof and floor overlying rocks after coal seam mining is of great significance to the control of the roof and floor.
The current research and achievements on overburden movement include the following. Qian et al. [2] first proposed the key layer theory of overburden movement in stopes, and the “O” circle theory related to fracture development. Zuo et al. [3] organically combined stope strata control and geosurvey engineering, based on mechanical models of bedrock initial fracture and periodic fracture, combined with the probability integral method and shear slip theory, finding that the overall movement of thick unconsolidated overlying rock presents a hyperbolic feature. Jena et al. [4] built a model to estimate formation behavior during side pillar mining in underground coal mining. This study was mainly focused on predicting a critical strata movement value for the safety of the bord-and-pillar method of mining, particularly depillaring. Kong et al. [5,6] found, through his research, that the stress of the overlying strata is broken and redistributed after coal mining, which causes the overlying strata to move, deform, and fracture, thus producing cracks. Kumar et al. [7] found, through field research, that the elastic modulus and thickness of a direct roof are important parameters to determine the warning value of roof sag. These studies also indicated that the variation in size of the left-out ribs and goaf span influence the warning value. Jena et al. [8] found that strata movement exhibits dynamism on loading effect during bord-and-pillar extraction in proportion to an increase in goaf span and area, leading to the formation of a dynamic loading zone and effect within working areas, including at goaf edges. Yu et al. [9] concluded that the nature of protecting the protected layer in protective layer mining technology is the expansion, deformation, and movement of coal and rock mass, proposing the theory of “pressure relief effect and flow increase”.
In summary, experts have used different research methods to analyze coal seam overburden movement according to their different engineering backgrounds. Therefore, this study uses a combination of theoretical analysis, UDEC numerical simulation, similar simulation experiments, and field measurements to analyze the Weng’an Coal Mine, and summarizes the overburden movement, caving characteristics, displacement, and pressure relief laws after coal seam mining.

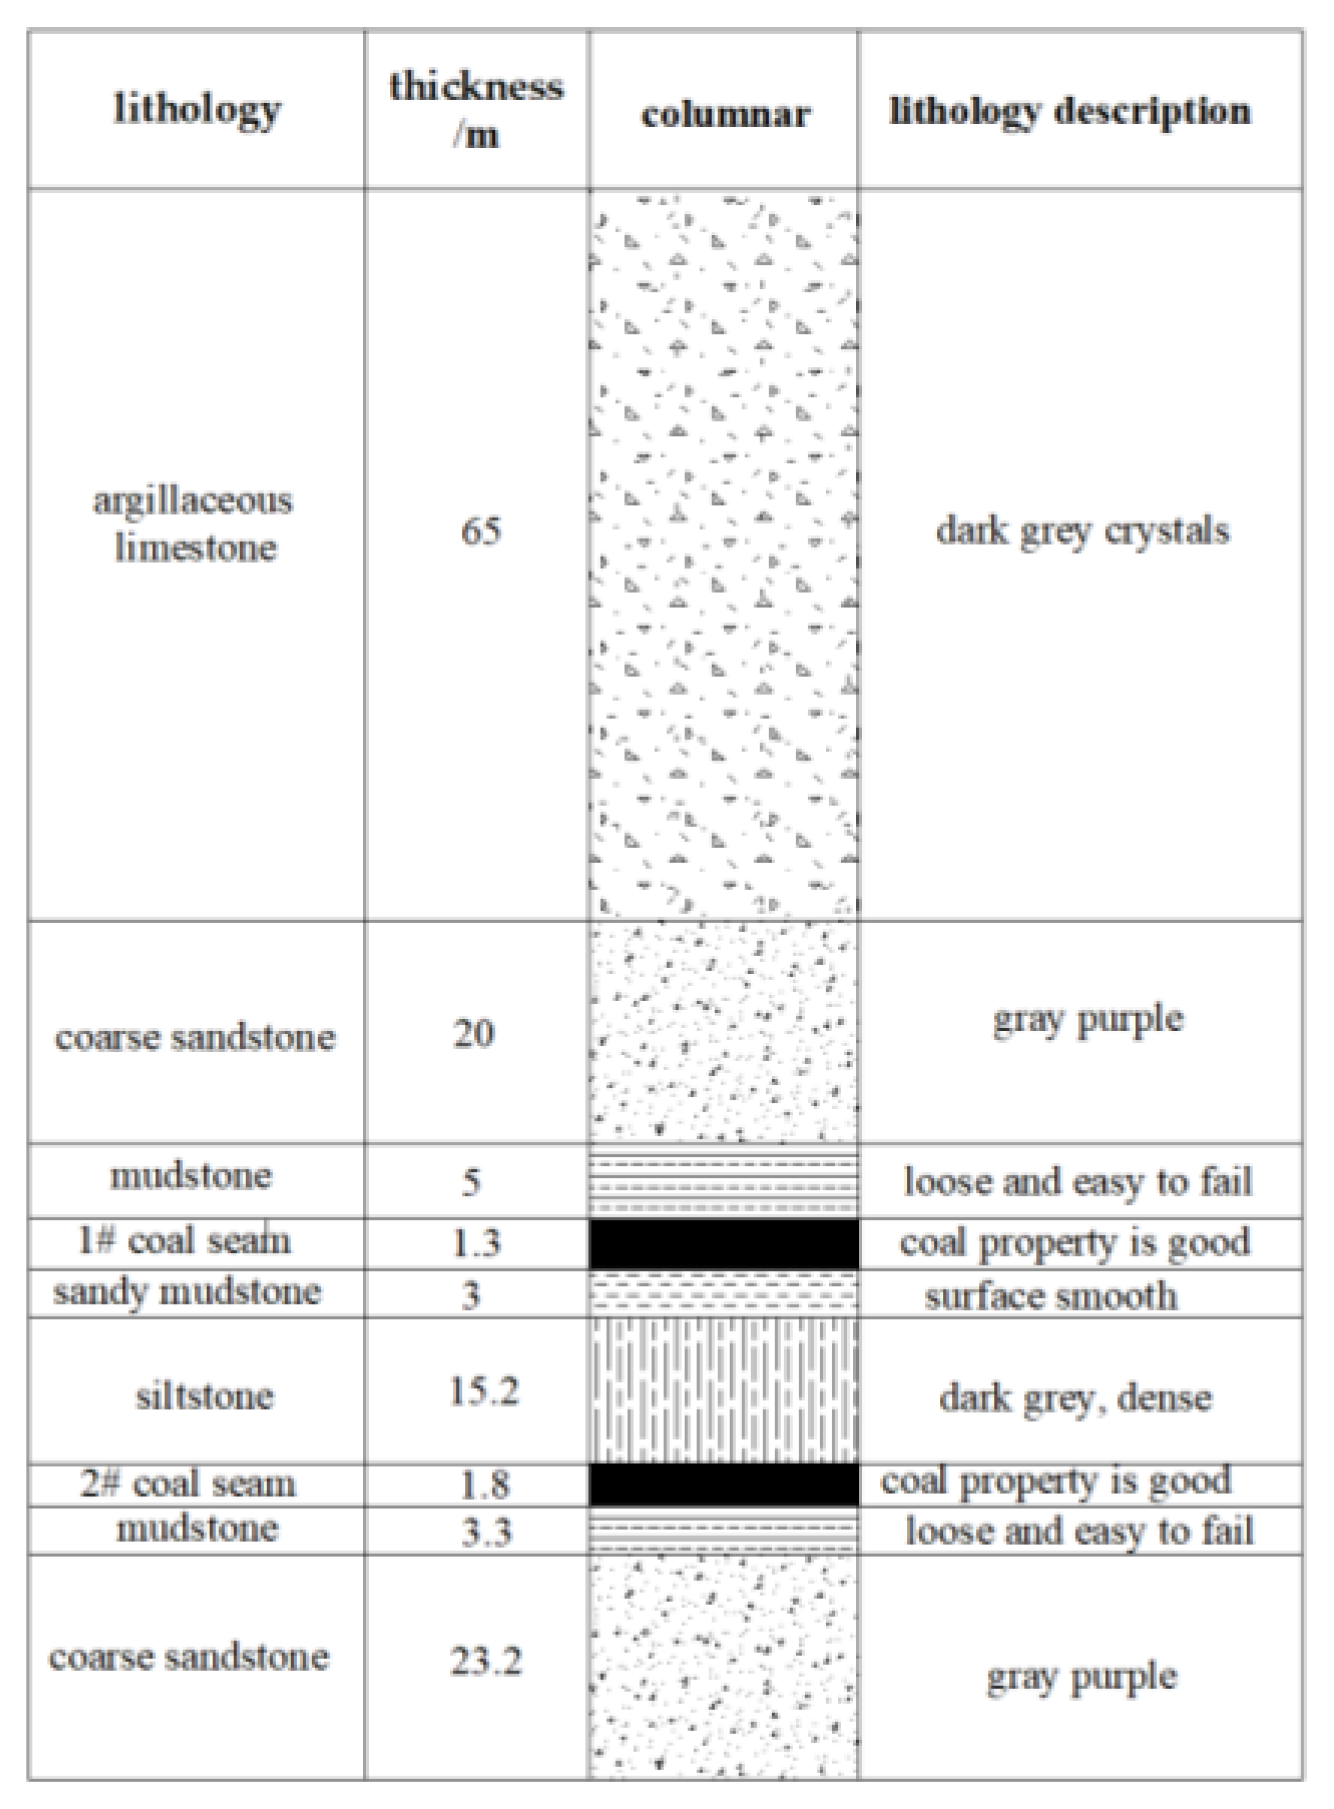
2. Engineering Background

The Weng‘an Coal Mine is located in the area of Weng‘an County, about 12 km away from the 27.5081 km2 mining area. The well field system is located at the second level of the hillside in the Yunnan–Guizhou Plateau, belonging to the karst lowland in the plateau region in north-central Guizhou province. The terrain cutting is moderate, and the mine field is a single layer coal seam. The coalbed number is D, and coal seam D is located in the upper part of the first member of the Wujiaping Formation, directly in contact with the bottom of the second member of the Wujiaping Formation, 13.11–26.89 m below the top of the Maokou Formation or Emeishan basalt, with an average of 20.64 m. The thickness of coal seam D in the well field is 0.60–2.91 m, with an average of 1.32 m, which is a thin coal seam. The lithologic characteristics of the coal roof and floor are shown in Figure 1.
This is a coal and gas outburst mine. In 2016, the mine gas grade identification results were as follows: the absolute and relative gas emission amounts of the mine were 91.58 m3/min and 131.88 m3/min, respectively. The original gas pressure was 1.32 MPa, and the original gas content was 13.15 m3/t.

3. Motion Analysis of Roof and Floor Overlying Rock in Goaf

3.1. Influence of Mining on Overlying Strata Separation

Before mining, the top and bottom rock layers are all primitive rock masses, and the stress existing in the top and bottom rock layers is the original rock stress. After mining, the original stress balance is broken, and the stress is redistributed along with the movement and deformation of the roof and floor rocks, forming two zones: the supporting pressure zone and the unloading pressure zone. In the supporting pressure zone, the goaf is affected by pressurization, coal pillars and rock formations are crushed, and the pressure-bearing capacity gradually decreases. Under the dual impact of pressurization and the pressure-bearing capacity of the rock formation, the strata will be separated, expanded, and there will be slippage [10,11,12]. The separation model of the overlying strata in the goaf is shown in Figure 2.

3.2. Influence of Mining on Underlying Strata

During the process of mining the protective layer, the floor rock layer moves up and deforms under the action of the pillar supporting the stress and the elastic expansion of the floor rock layer. At the same time, cracks develop. With the increase in the interbedded spacing, fractures develop in the gradually weakened floor rock [13,14,15].

3.3. Height Determination of Falling Zone and Fracture Zone

Affected by mining, the rock formations are destroyed and the volume becomes larger and swollen. The overlying rock layers in the mined-out area begin to fall. After reaching a certain level, the mined-out area is filled up and the upper rock strata enters the fissure development zone. That is, the height of the caving zone is the thickness of the rock strata that fills the goaf after the caving. According to the “Buildings, Water Body, Railway and Main Roadway Coal Pillar Setting and Coal Mining Specifications” [16], the overlying strata of the 1# coal seam in this coal mine is mudstone, and the overlying strata are weak. The height of the caving zone and the height of the fracture zone can be calculated using the following formula [17]:
H k = 100 M 6.2 M + 10 ± 2.5
H l i = 100 M 3.1 M + 6.0 ± 6.5
where: H k is the height of the caving zone, H l i is the height of the fracture zone, M is the accumulated mining thickness, the single-layer mining thickness is 1–3 m, the accumulated mining thickness is less than 15 m, ± is the error, substituting the data, H k is 4.70–9.70 m, and H l i is 6.46–19.46 m.

4. Numerical Simulation Analysis

In order to further study and analyze the overburden movement of the roof and floor of the coal seam after the protection layer is mined, according to the occurrence conditions of the coal mine and the mechanical properties of the coal and rock mass, UDEC numerical simulation software is used to simulate the overlying rock movement of the roof and floor of the coal seam, to obtain clearer observations of the overlying rock movement.

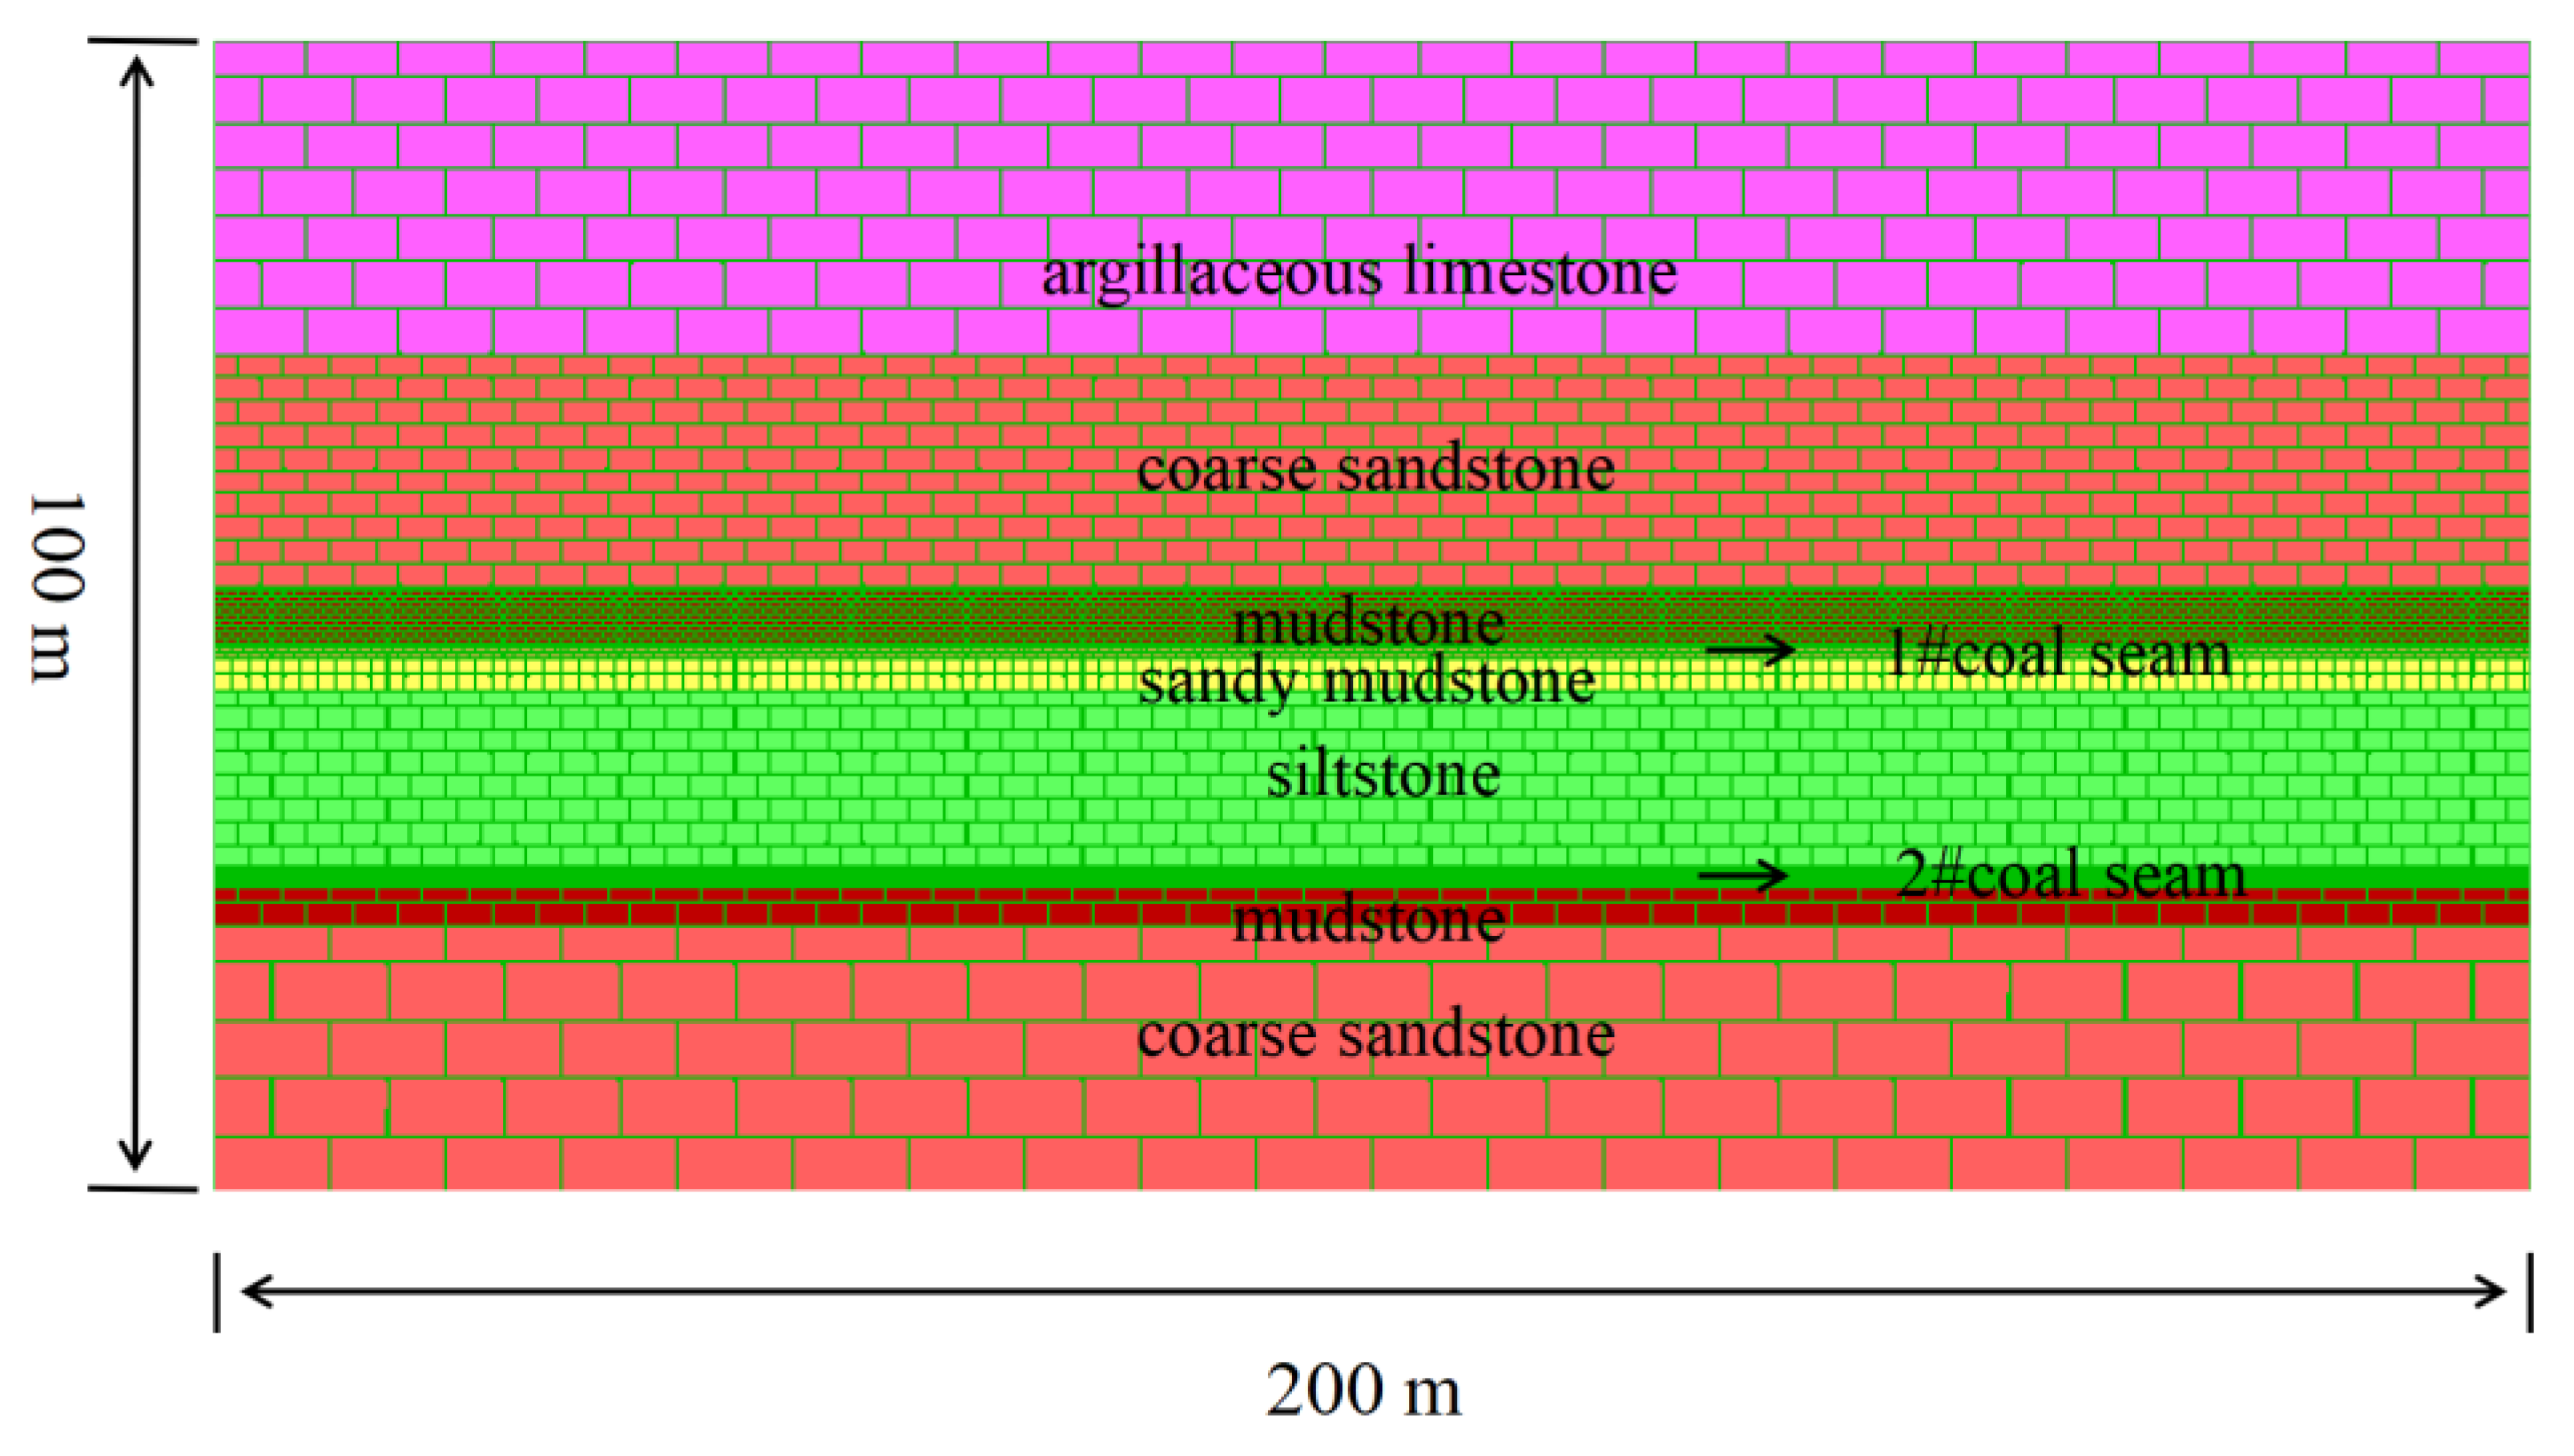
4.1. Establishment of Numerical Model

Due to the difference in seams and mechanical properties, the overburden movement caused by mining is obviously inconsistent. The universal unique meta code UDEC based on the discrete element method has been proven to be feasible and suitable for solving the discontinuous process of bed separation and rock formation in the mining process [18,19].
A UDEC numerical simulation model with length (x) × height (y) = 200 m × 100 m can be established based on the field measurements and basic occurrence conditions of the coal mine, in which the inclination of the working face is the length direction and the strike is the width direction. Blocks in the model use Mohr–Coulomb criterion to describe the deformation and failure process of the rock material [20]. The basic physical parameters of each rock layer were determined according to field measurements, as shown in Table 1, and the model was established as shown in Figure 3 below.

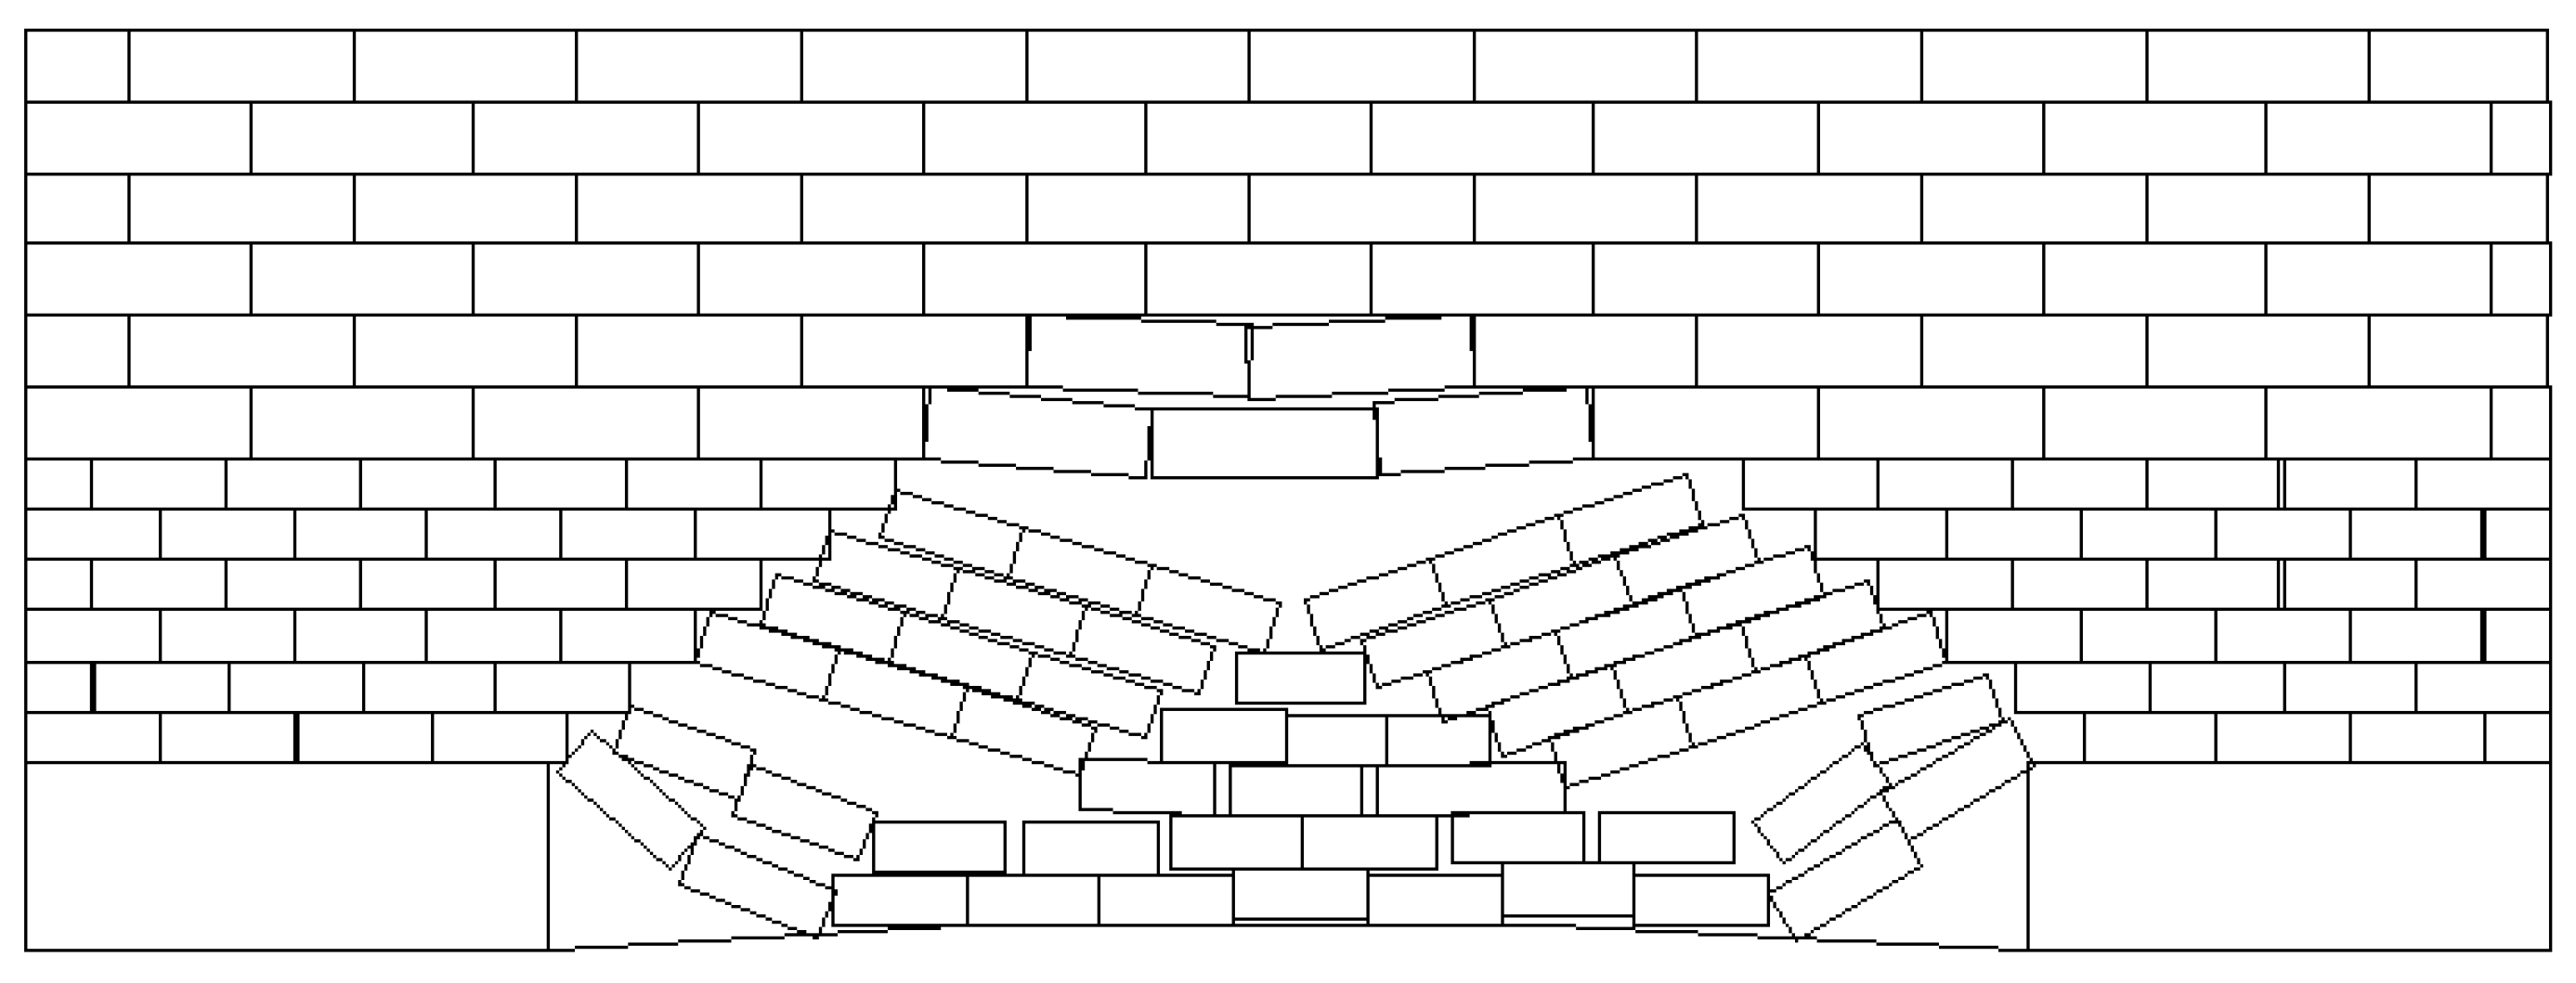
4.2. Analysis of Collapse Characteristics of Working Face Advancing at Different Distances

After the upper protective layer is mined, the roof and floor coal strata in the goaf will periodically appear in three stages, compression, expansion, and recovery, with the advancement of the working face [21]. In order to better study the characteristics of the bottom and roof collapse, the collapse characteristics when the working face is advanced to 30 m, 50 m, 80 m, and 140 m were selected for analysis.
As shown in Figure 4a, when the working face advanced to 30 m, the overlying rock strata were exposed and directly supported by excavation, resulting in pressure relief and expansion deformation. Under the action of gravity, the overlying rock strata bends to varying degrees. The underlying coal strata also swells and deforms due to pressure relief. The original equilibrium state is destroyed. The roof directly above the goaf collapses, many small cracks appear in the protective layer, and the bottom plate bulges slightly upward.
As shown in Figure 4b, the working face continued to advance 50 m or up to 50 m. At this time, the direct roof is pressed for the first time, and a larger area of collapse occurs. The basic roof above the protective layer collapses for the first time, and layer separation cracks appear in the bottom plate.
Figure 4c,d, respectively, show that when the working face advanced to 80 m and the protective layer was mined, the main failure that occurs at this time is the periodic collapse of the roof overburden, and the rock stratum gradually becomes stable and forms an articulated structure. At this time, the basic roof is bent and deformed due to the action of surrounding rock stress.

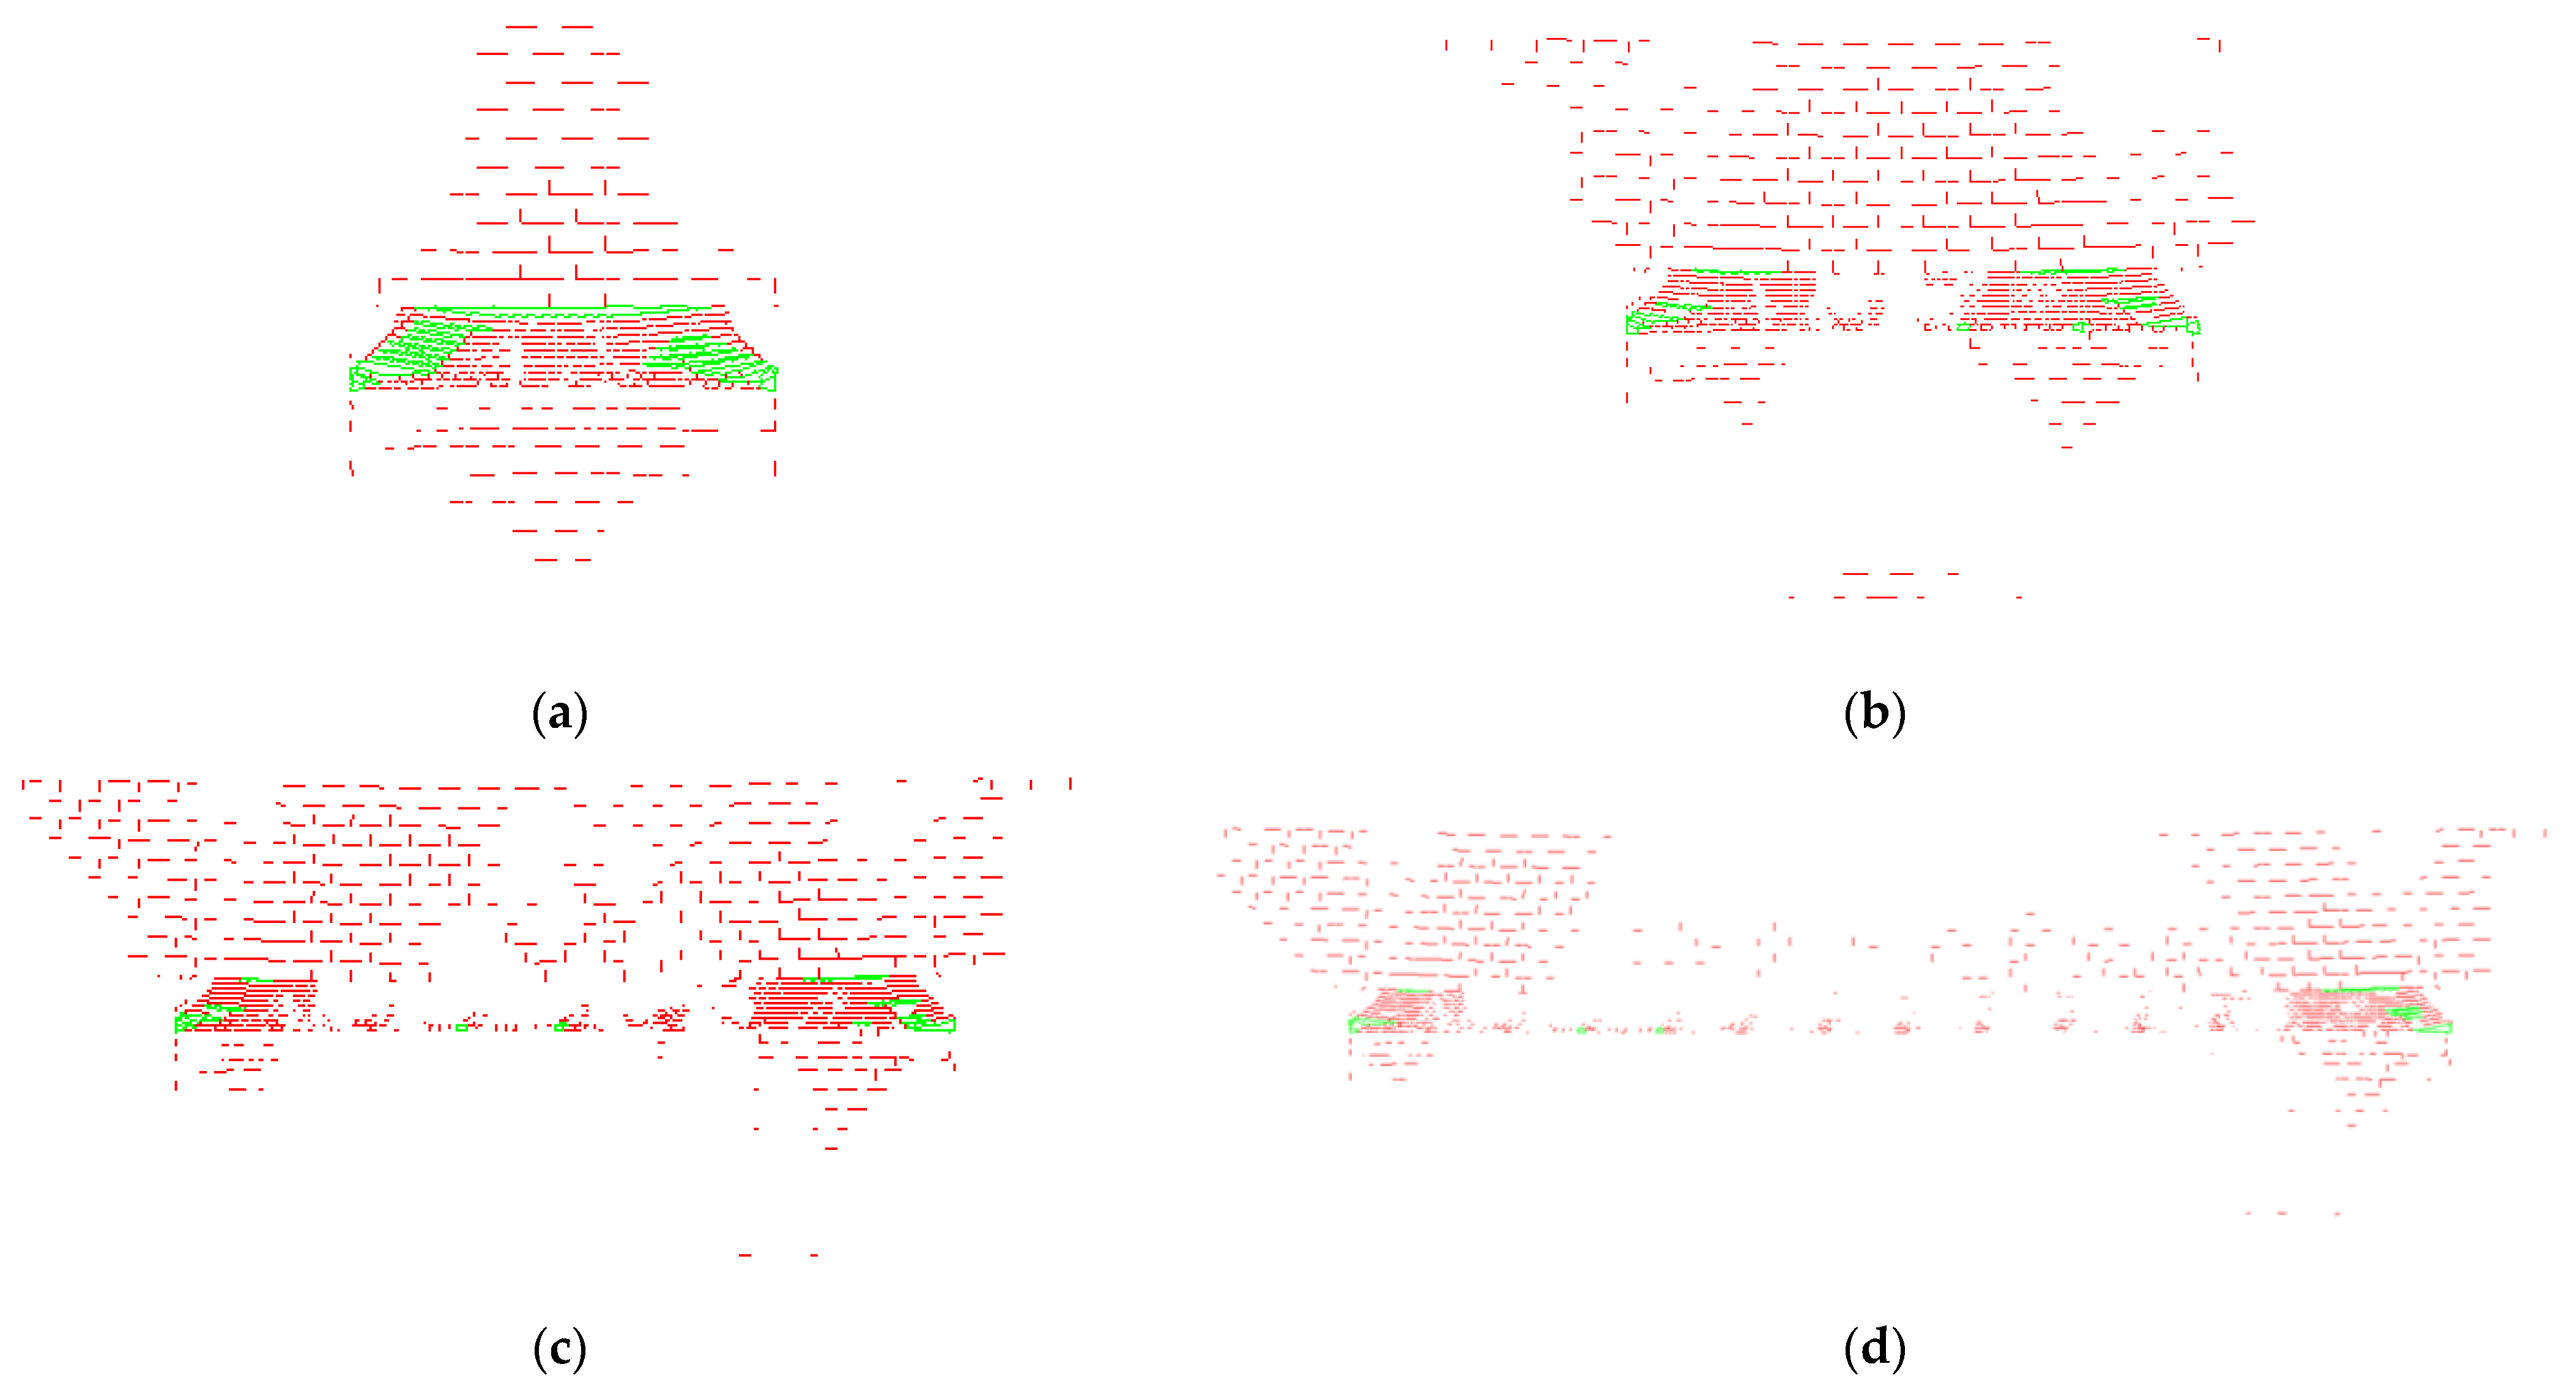
4.3. Analysis of Fracture Evolution Law of Working Face Advancing at Different Distances

After the excavation of the upper protective coal seam, the roof and floor strata will move and deform under the influence of stress, resulting in the destruction of the original rock stress of the coal and rock mass. With the increase in mining width, the fractal dimension of the fracture network generally shows a staggered increase trend, which can be divided into the stages of rapid rise in fracture dimension, slow rise in fracture dimension, and stable stage of fracture dimension [22].
As shown in Figure 5a, when the working face is advanced to 30 m, the direct roof collapses, a large number of dense and large cracks are produced above the goaf, and a few cracks are produced on the basic roof. The cracks produced by the overlying rock layer of the coal seam are mainly distributed in a trapezoid shape. The underlying rock layer has slightly fewer cracks than the overlying rock layer, and it is distributed in an inverted triangle.
As shown in Figure 5b, when the working face of the protective layer is advanced to 50 m, a small number of cracks appear on the basic top end face at this time, the large cracks between the direct top and the basic top have been stitched up, and the cracks on the upper and lower parts of the middle end of the working face begin to decrease rapidly. At this point, the cracks mainly exist in the upper and lower ends of the left and right ends of the working face. There are still more upper cracks than lower cracks, and the cracks in the protected coal seam directly below the middle end of the working face are still increasing.
As shown in Figure 5c, when the working face of the protective layer is advanced to 80 m (more than half of the mining), the cracks on the basic top end face gradually increase as the working face continues to advance, and they are mainly directly above the working face. The cracks at the middle end of the working face are also gradually becoming scattered. The cracks mainly continue to approach the two ends of the working face, the protected layer cracks are roughly equal, and the cracks mainly exist in the direction of mining.
As shown in Figure 5d, when the coal seam is mined, the cracks on the basic top end face begin to decrease and shift to both ends. Most of the cracks still accumulate at both ends of the working face. Part of the fissures are gathered together, the fissures of the protective layer are roughly the same, and the fissures mainly exist in the direction of mining.

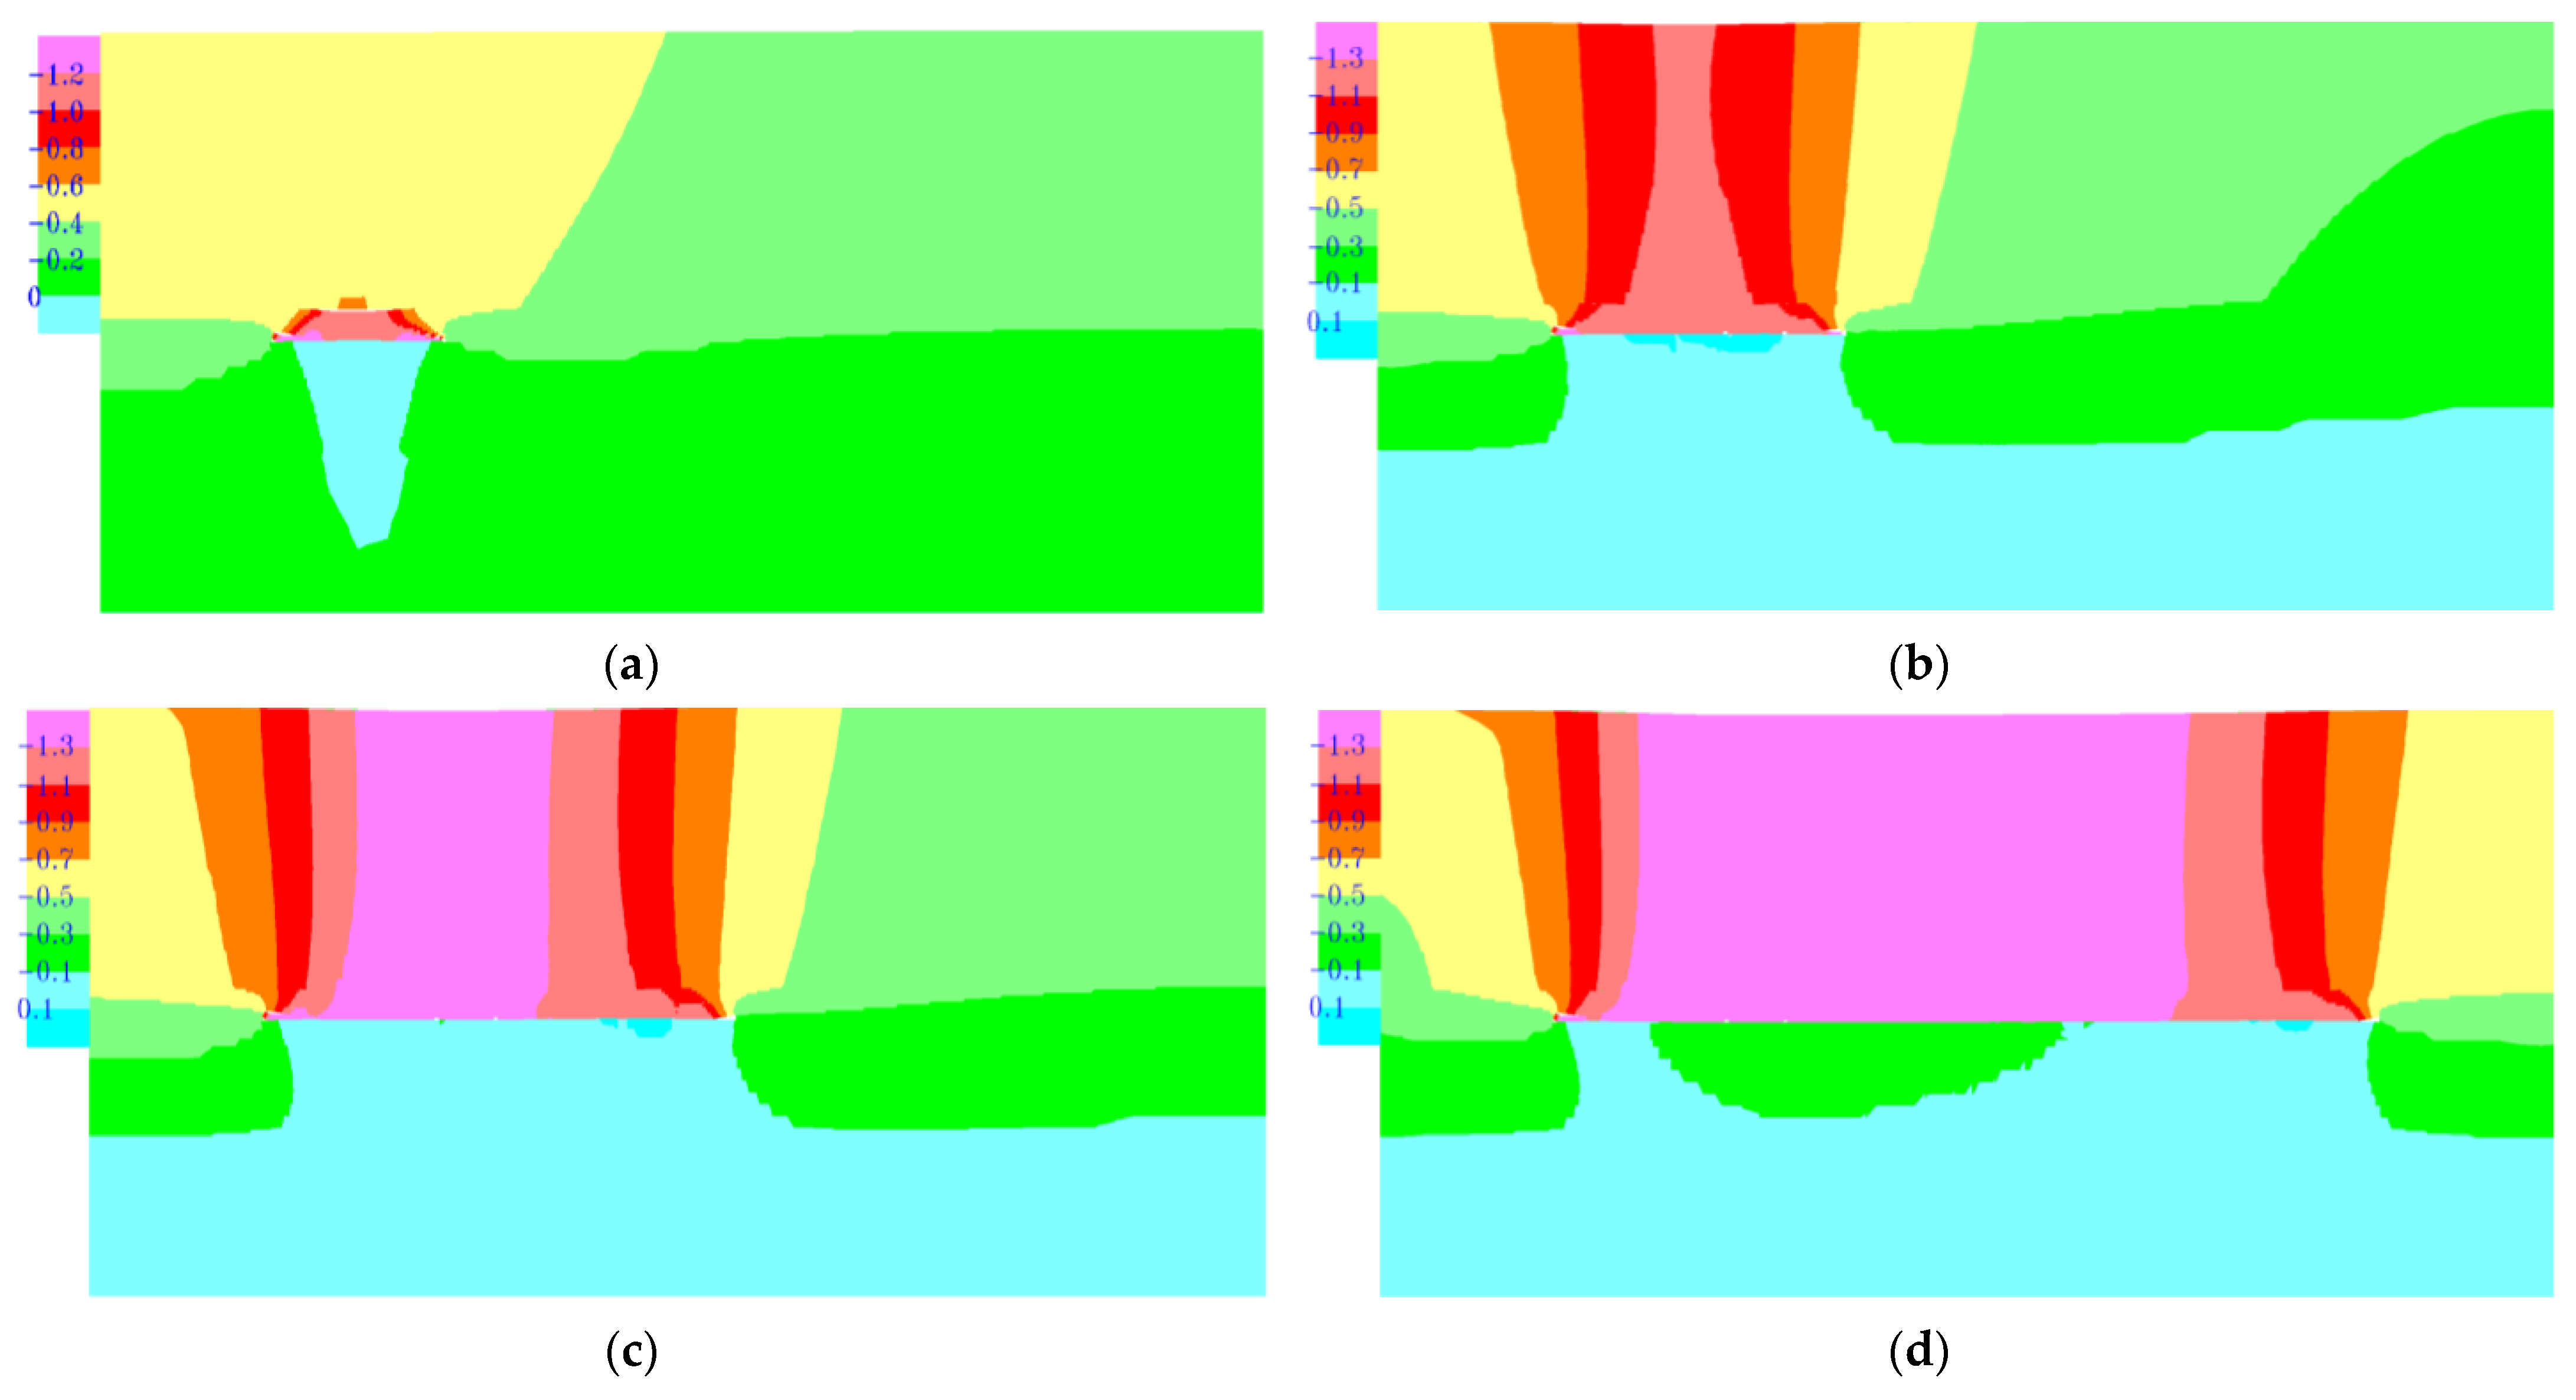
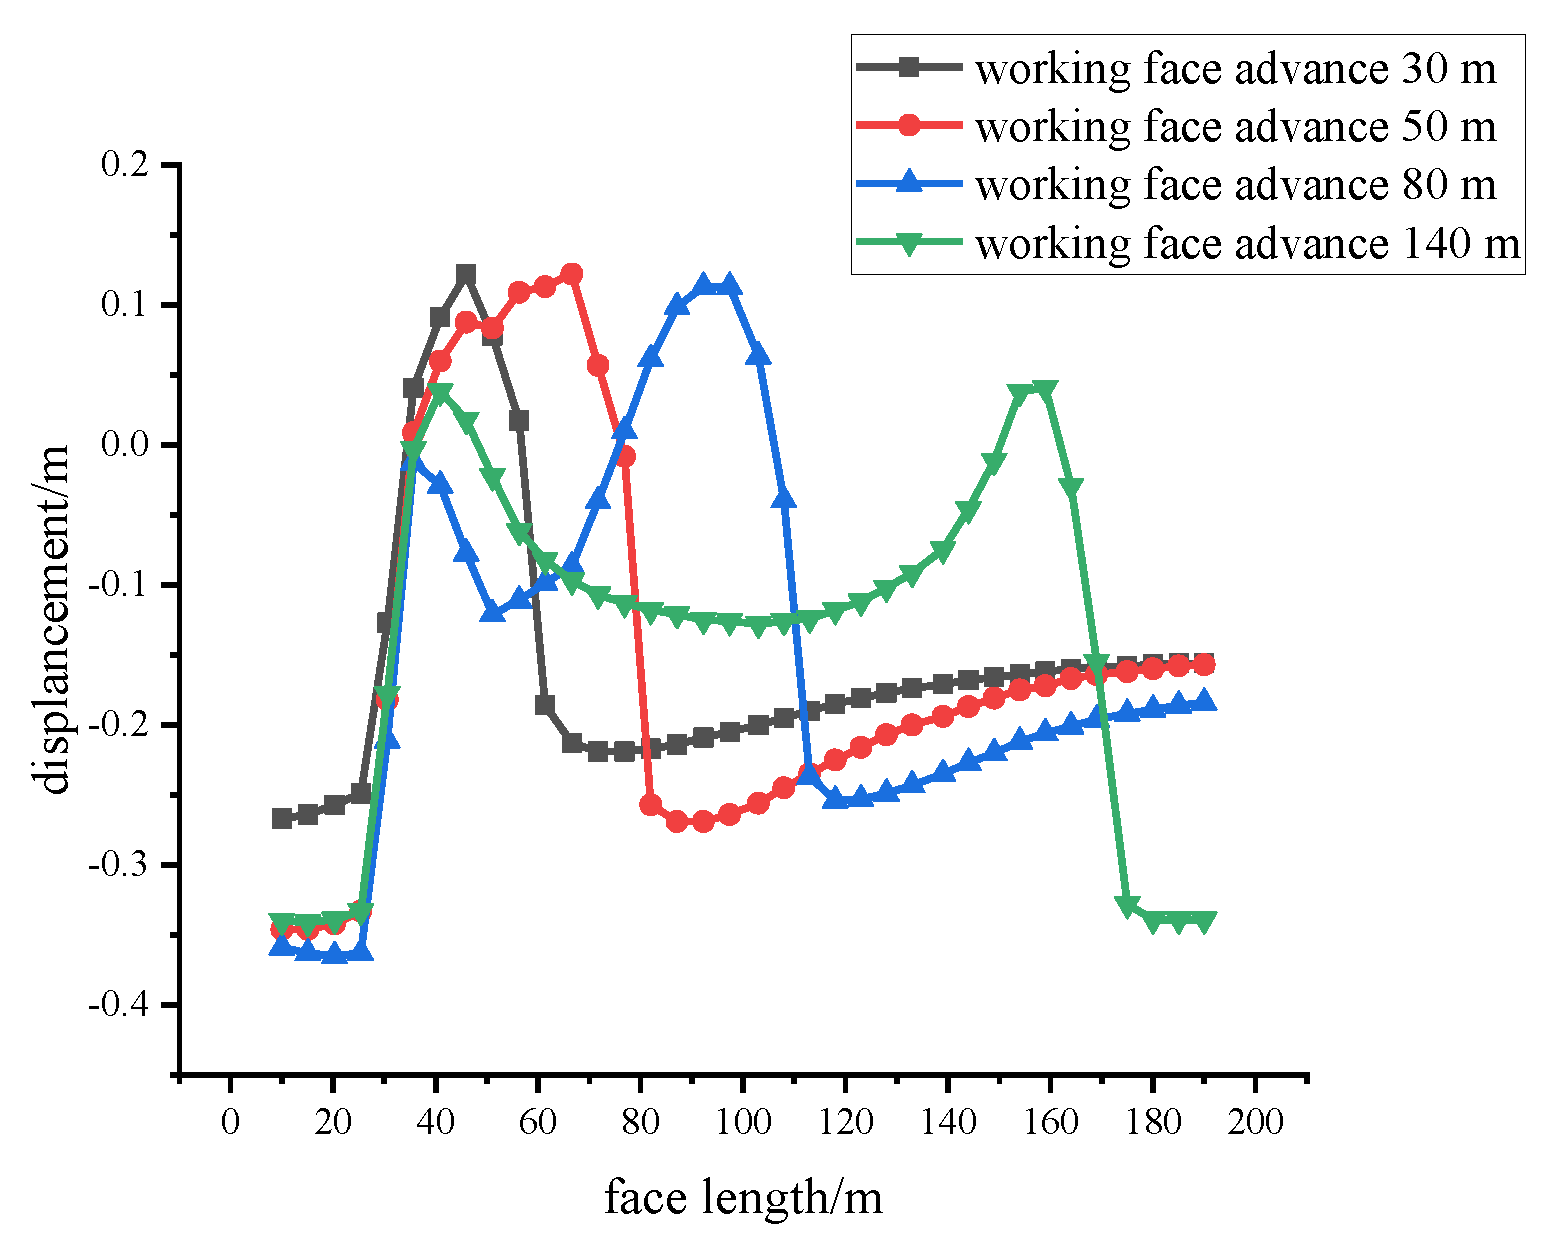
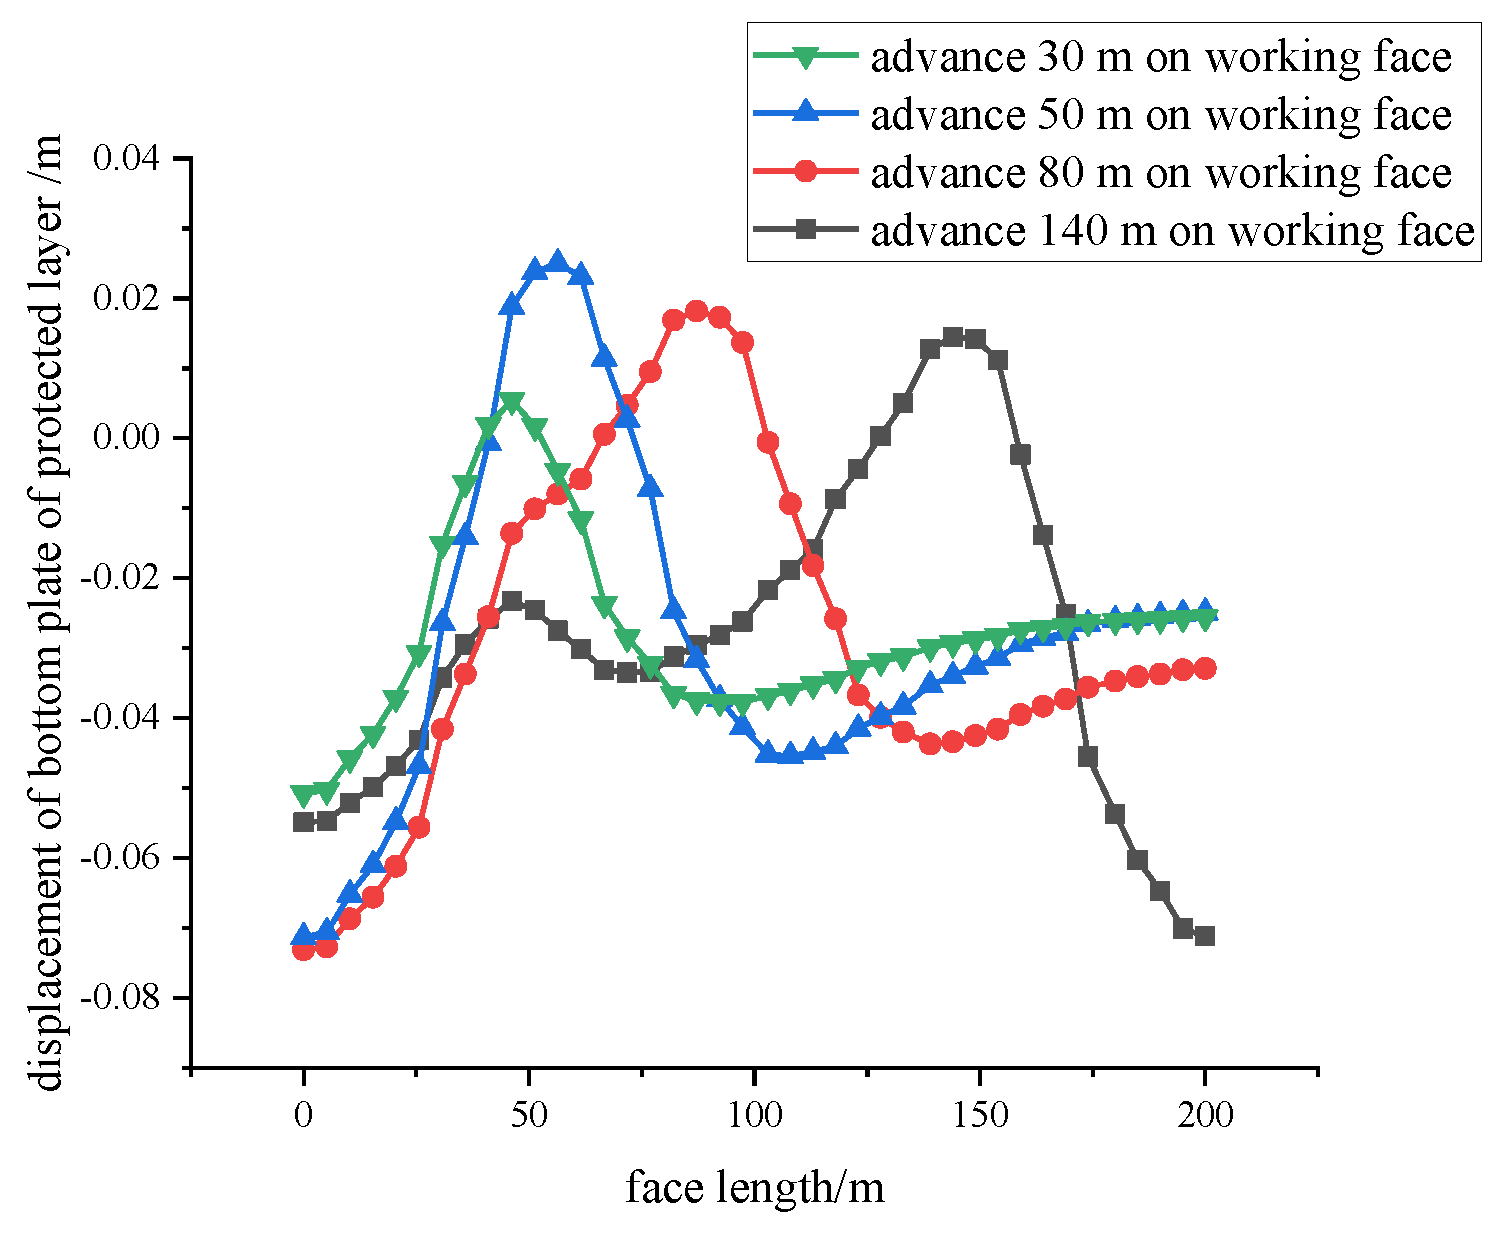
4.4. Analysis of Roof and Floor Displacement at Different Distances of Working Face Propulsion

Affected by coal seam mining, the original rock stress of the coal rock mass is destroyed, and the overlying rock layer receives downward force and starts to move downward, the underlying rock layer is affected by the pressure relief effect, and the floor bulges slightly upward.
As shown in Figure 6a, when the working face advanced to 30 m, the direct roof caved, the direct top-down displacement above the goaf was approximately −1 m, the displacement on both sides of goaf was approximately −0.8~−0.6 m, and the basic top-down displacement was approximately −0.4~−0.6 m. The underlying strata of the goaf was displaced upward due to pressure relief.
As shown in Figure 6b, when the protective layer working face is advanced to 50 m, the displacement of the strata above the goaf is approximately −1.2~−0.4 m, and the downward displacement of the overburden strata will decrease as the middle position of the goaf moves to the two ends; that is, the closer the overburden strata is to the middle position of the goaf, the greater the displacement will be. Similarly, the closer the underlying rock is to the middle of the goaf, the greater the floor heave.
As shown in Figure 6c, when the protective layer working face advanced to 80 m (half of the mining), the displacement of the strata above the goaf was approximately −1.4~−0.4 m. Similarly, the closer the overburden strata were to the middle of the goaf, the greater the displacement was. Due to the influence of coal pillars at both ends of the goaf, the displacement of the overburden strata was usually small. The goaf was gradually enriched due to the collapse of the roof, and only part of the rock bottom of the goaf was bulging.
As shown in Figure 6d, with the completion of the mining of the protective layer, the entire overlying strata were affected, and the displacement of the strata above the goaf was approximately −1.4~−0.6 m, among which the displacement of the caving zone was the largest. As the goaf was compacted, much of the underlying rock was no longer uplifted.
In order to further explore the displacement of the roof and floor when the working face advances at different distances, a displacement observation line was arranged in the roof and floor in the UDEC numerical model, and the data obtained was sorted into two point-line diagrams. Figure 7 shows the top plate displacement diagram of the working face advancing at different distances, and Figure 8 displays the bottom plate displacement diagram of the working face advancing at different distances. It can be seen from Figure 6 that, as the advancing distance of the working face continues to increase, the downward force on the overlying rock layer also increases, the downward displacement increases as well, and it continues to collapse and fill the goaf. It can be seen from Figure 8 that, as the advancing distance of the working face continues to increase, the floor swells due to the influence of the mining. When the working face advances from 0 to 80 m, the swelling position of the floor is directly below the goaf. When the advancing distance of the working face is greater than 80 m, due to the collapse of the roof, the goaf is gradually compacted, and only the floor below the two ends of the working face is slightly bulged due to the influence of the coal pillars.

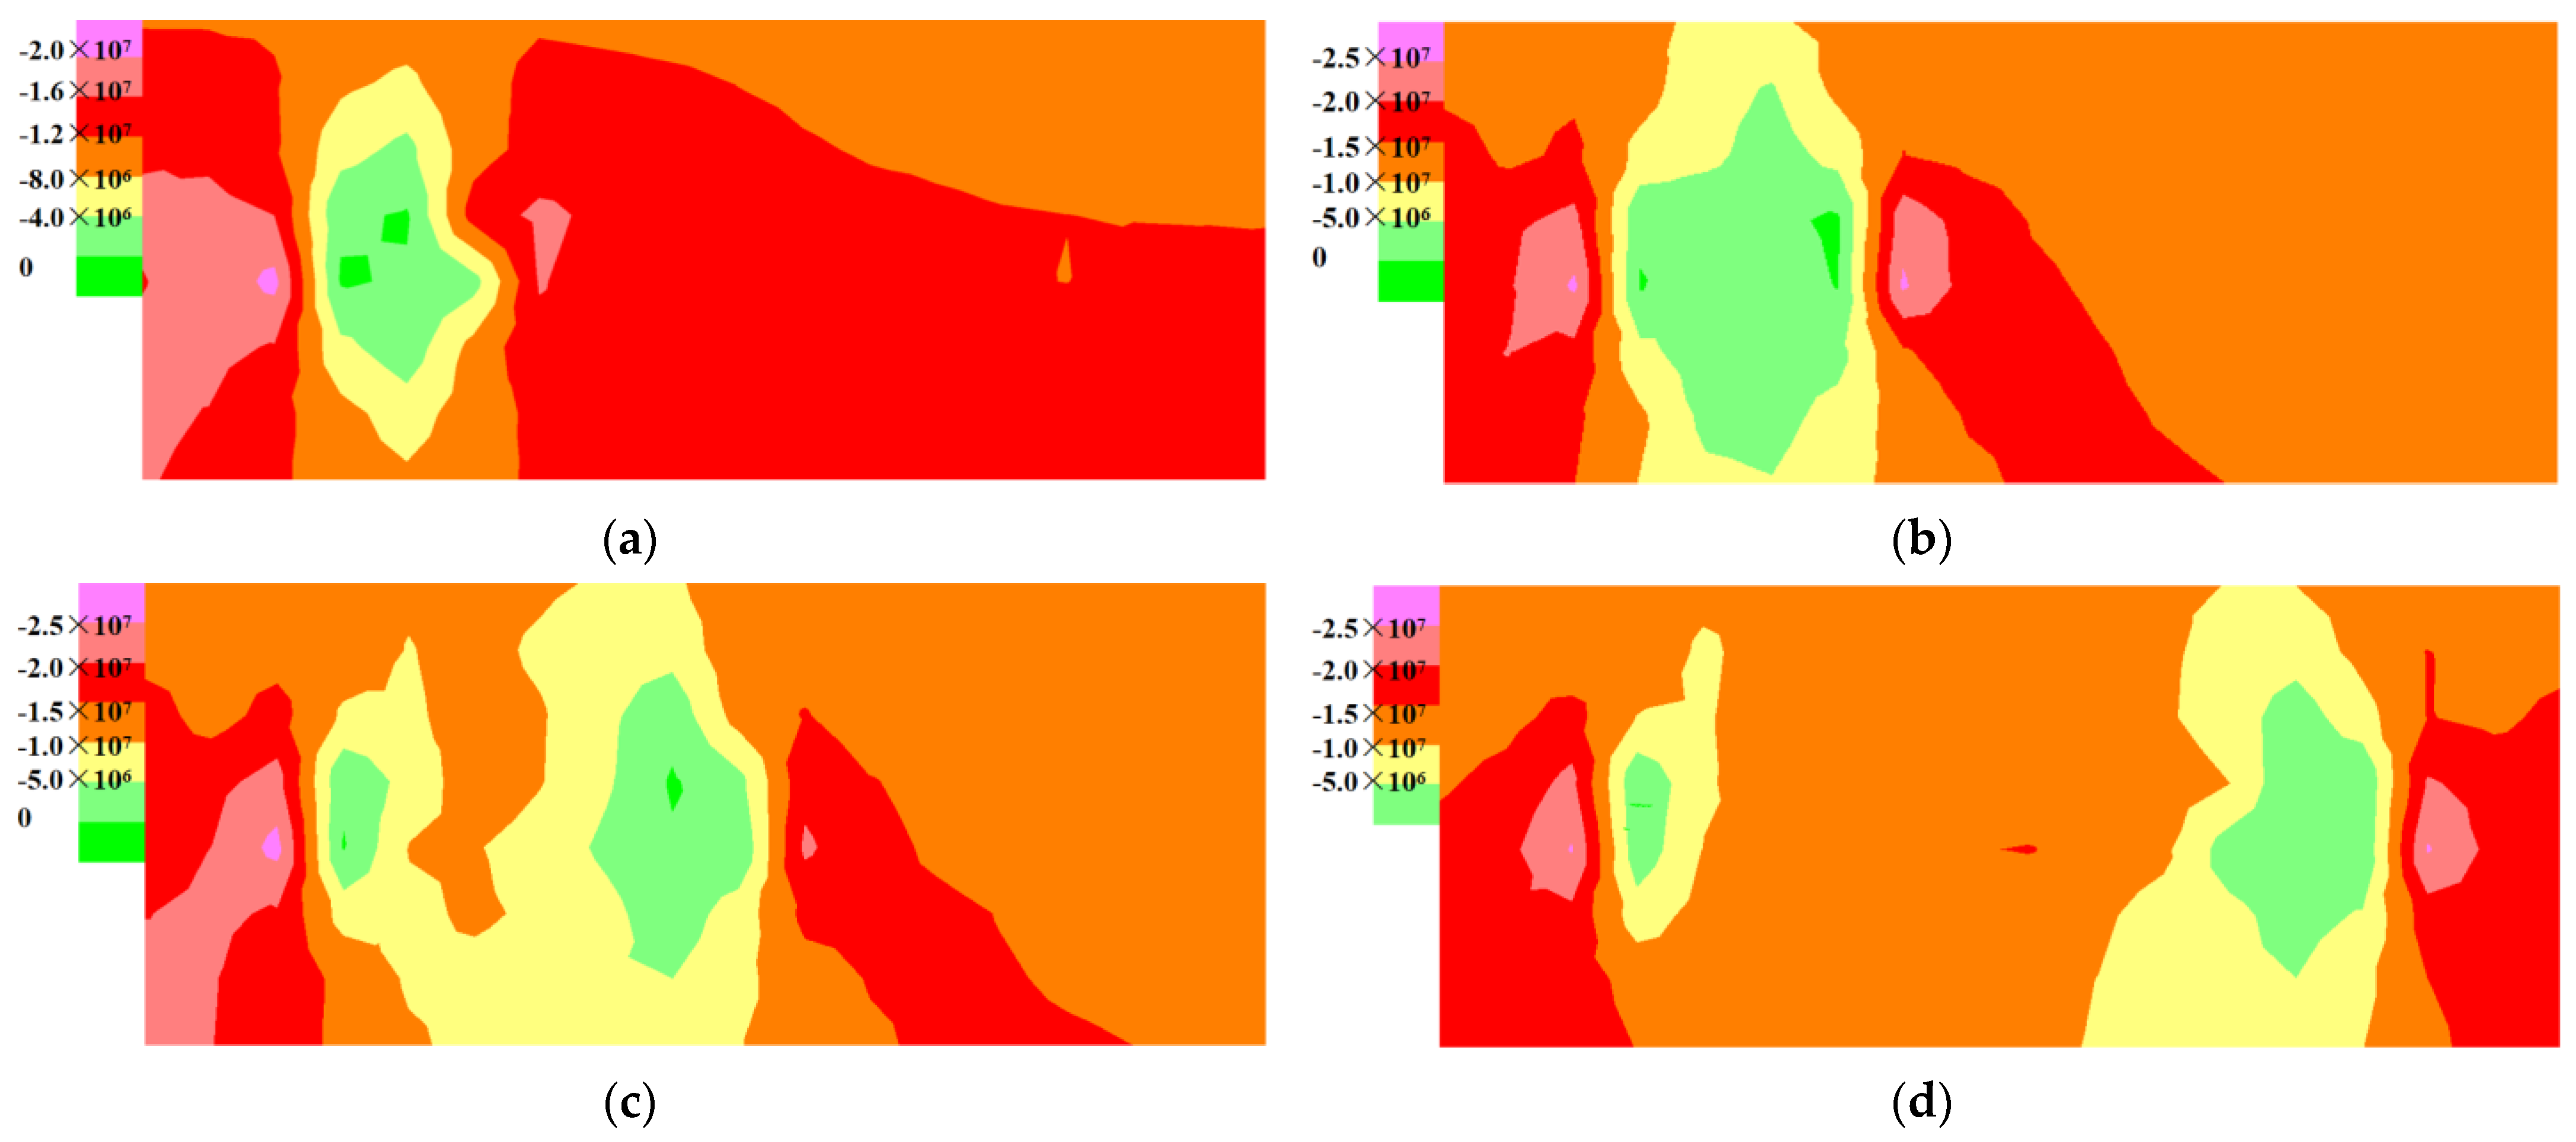
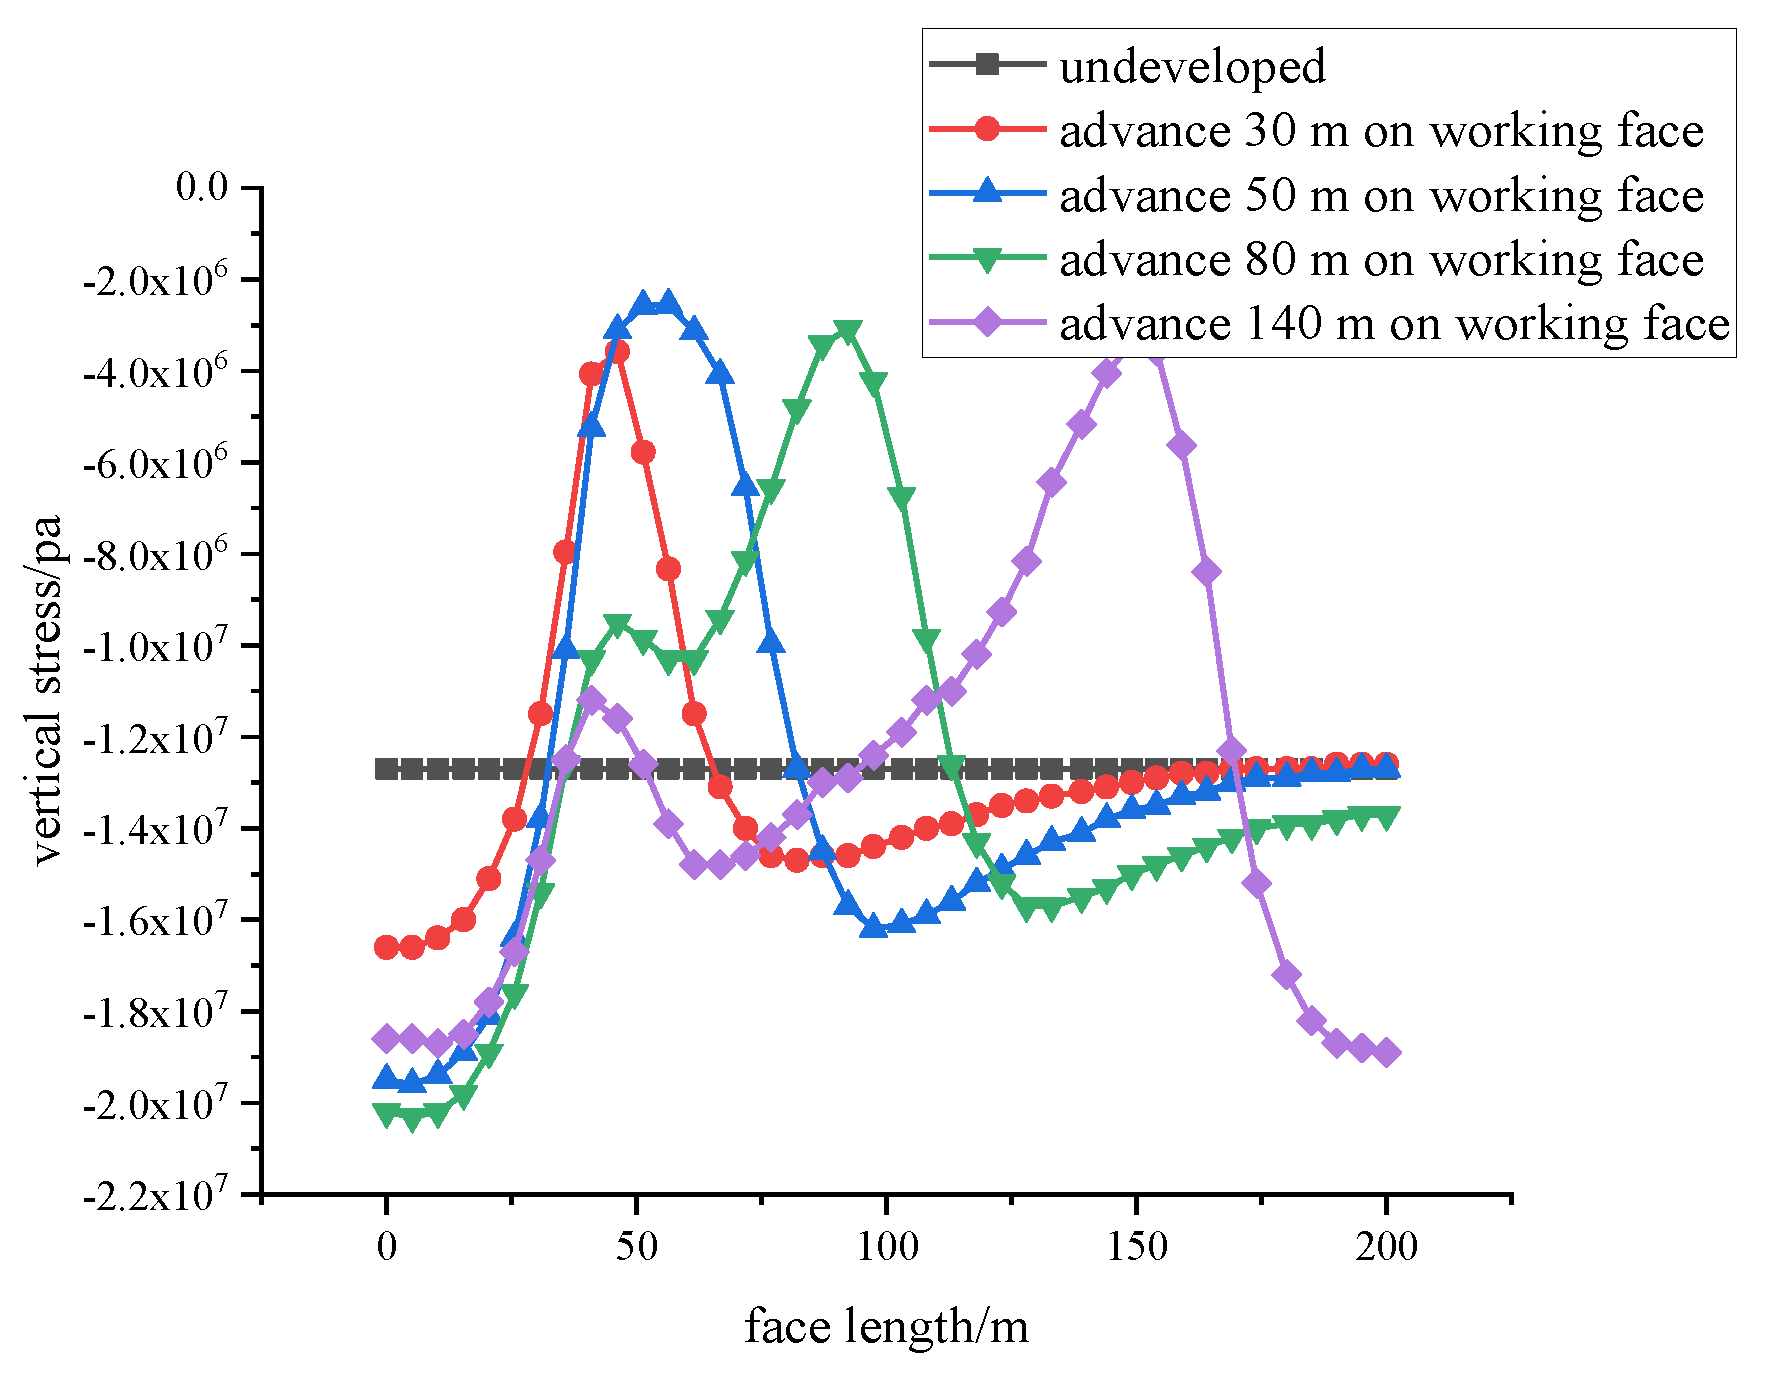
4.5. Pressure Relief Characteristics Analysis of Protected Layer Mining

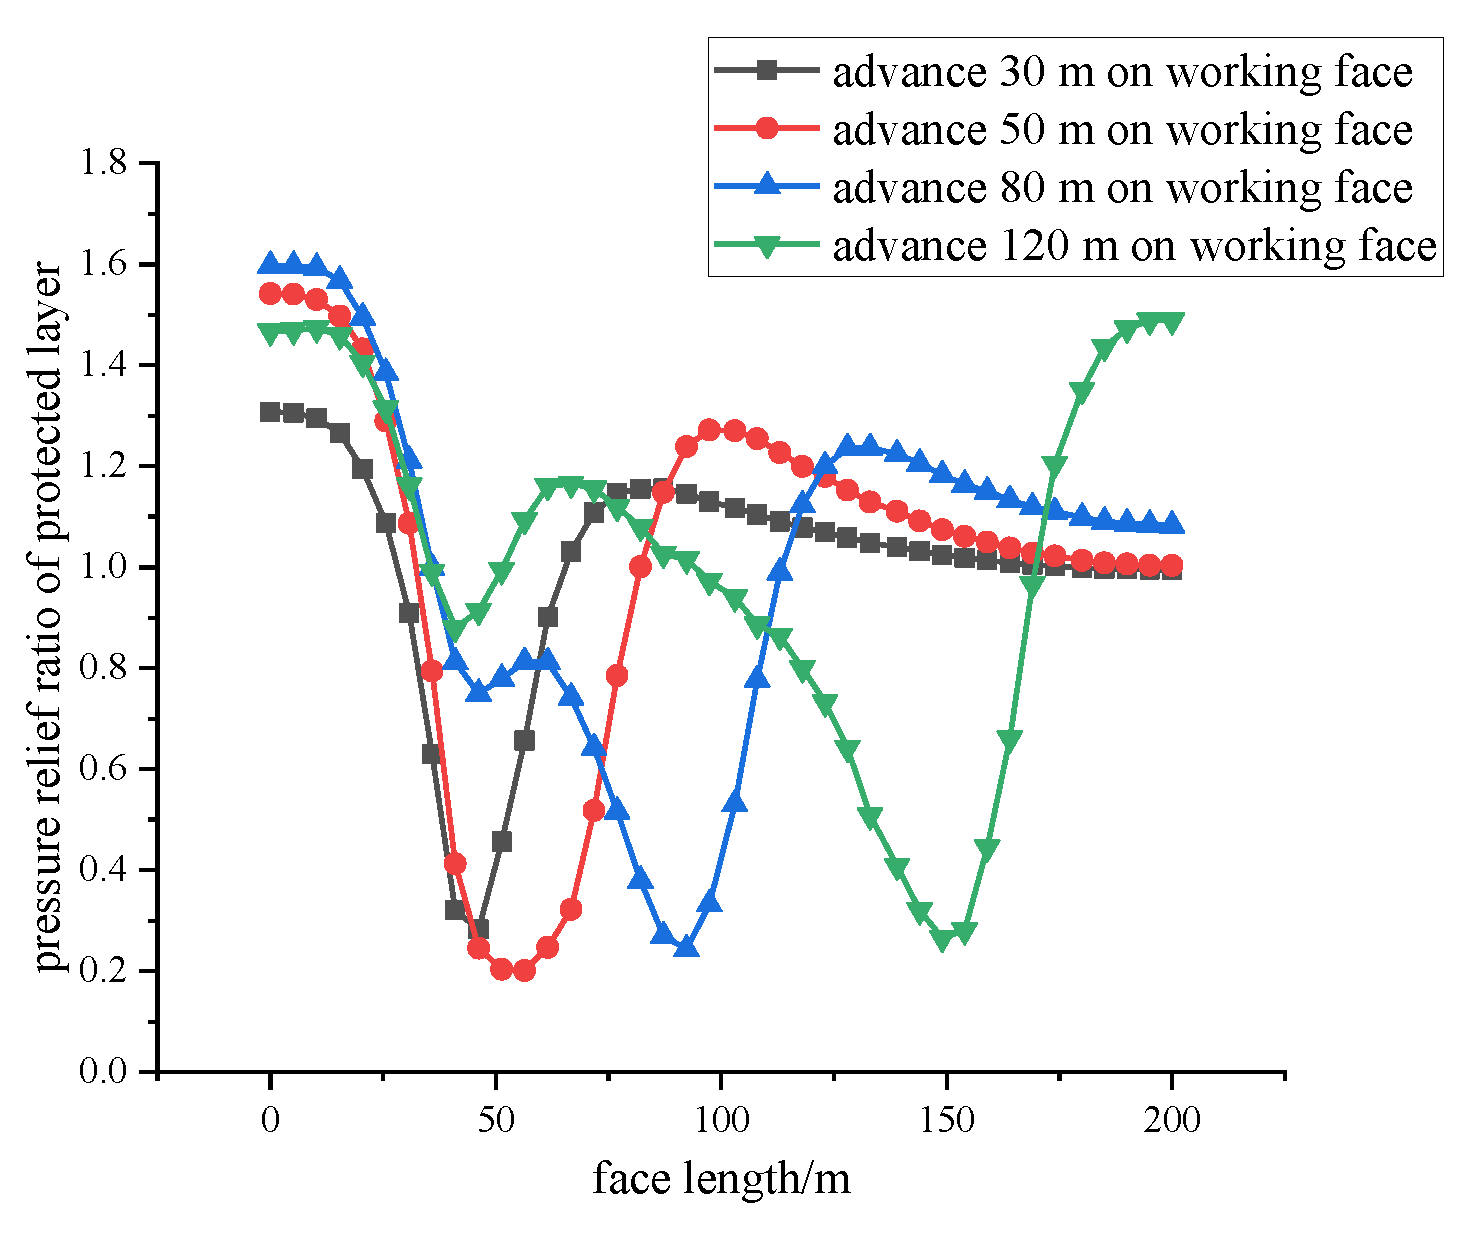
4.5.1. Pressure Relief Rate Analysis of Protected Layer Mining

After the protective seam is mined, the lower protective coal seam will be affected by the mining of the protective layer, resulting in a pressure relief effect. The pressure relief rate parameter is usually used to express the pressure relief effect. The pressure relief rate calculation formula is as follows:
η = σ Z / σ Z
where: η is the pressure relief rate of the lower protective layer, σ Z is the vertical surrounding rock pressure, and σ Z is the vertical surrounding rock pressure before mining.
Figure 9 shows the vertical stress distribution of coal and rock mass when the face is advanced at different distances. Figure 10 represents the vertical stress diagram of the protective layer when the working face is advanced at different distances. The above pressure relief rate formula is then substituted into the vertical stress value of the protective layer, and the pressure relief rate diagram of the protective layer when advancing at different distances is obtained, as shown in Figure 11.
It can be seen from Figure 11 that, when the upper protection coal seam is excavated, the protected layer will have a pressure relief effect, and with the continuous advancement of the working face, the pressure relief range of the protected layer will also increase, with the pressure relief rate remaining between 0.2 and 1. Due to the support of the coal pillars at both ends of the working face, the pressure relief effect of the protected layer under the two ends is very small, with even no pressure relief effect. In general, after the protection layer is mined, the pressure relief effect of the protected layer is very good, which is very beneficial for gas drainage.

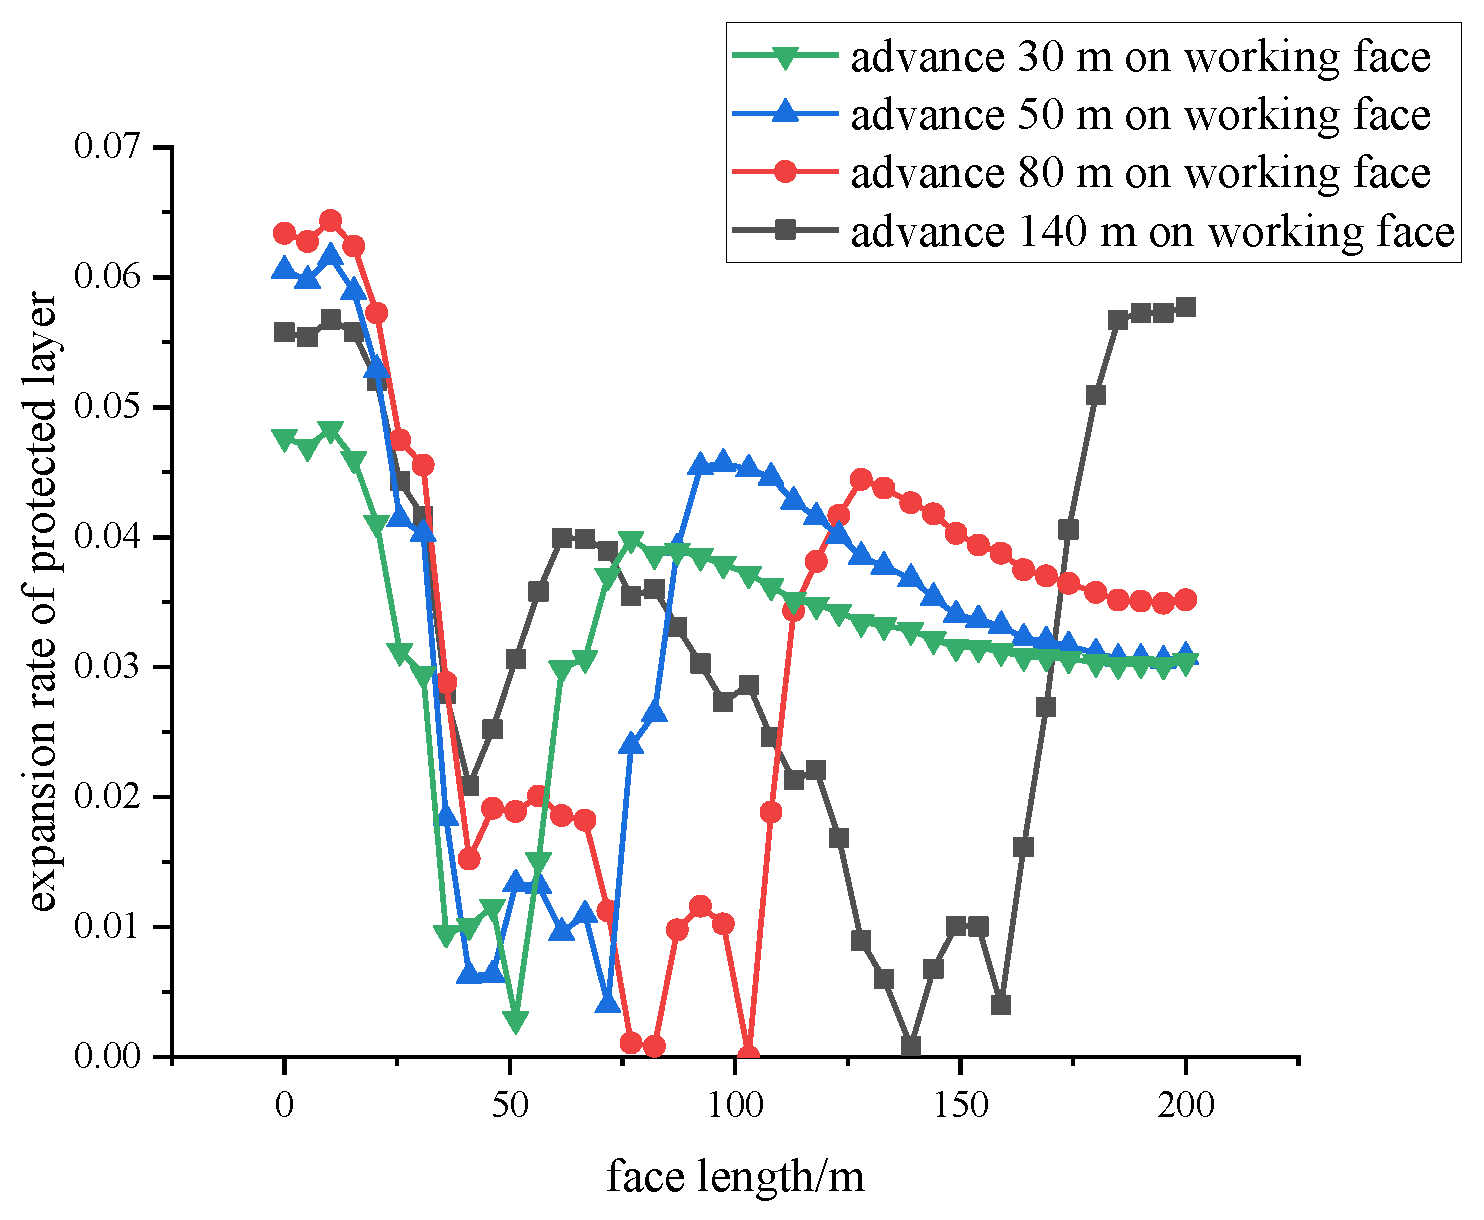
4.5.2. Analysis of Expansion Rate of Protected Layer in Mining

Due to the pressure relief caused by the exploitation of the protective layer, the top and bottom floor of the protected layer will experience displacement. The expansion rate is used to determine the expansion size of the protected layer, and the formula is as follows:
ς = L / M
where: ς represents the expansion rate of the protected layer, L represents the displacement difference between the top and bottom of the protected layer in the mining process, and M represents the thickness of the protected layer before mining.
Based on the coal and rock mass displacement diagram in Figure 6, the displacement variation diagrams of the top and bottom of the protected layer in Figure 12 and Figure 13 can be obtained. The obtained data are then substituted into the above formula, and the obtained expansion rate is used to create the expansion rate curve of the protected layer after mining, as shown in Figure 14.
It can be seen from the above figure that, in the process of mining the protective layer, the roof and floor of the coal seam under protection are subjected to pressure relief, resulting in displacement differences, and the overall expansion rate of the protected layer is greater than the requirements of the Coal and Gas Outburst Prevention Rules. It can be concluded that the mining of the protective layer of the coal mine plays a role in pressure relief and reflection improvement.

5. Rocks Like Materials Analysis

From similar simulation experiments analyzing similarity, prototype, and the simulation of all types of tests, it was concluded that a model of the stress and strain, displacement, etc. used to infer the prototype could be produced by moving parameters such as the deformation and failure characteristics [23,24,25,26]. A similar simulation experiment uses theory to solve engineering problems encountered in the actual production of a method type. It has the advantages of controllable parameters and intuitive results [27,28], but it also has the disadvantages of large discreteness, low acquisition density, poor continuity, etc. Digital image correlation can overcome the disadvantages of similar simulation experiments well.
Therefore, in order to further explore the law of roof and floor overburden movement and fracture evolution after mining, a similar simulation experiment with digital image correlation was established to analyze the stress, strain, and displacement characteristics of the roof and floor after mining.

5.1. Pressure Relief Characteristics Analysis of Protected Layer Mining

This physical experiment simulates the coal seam trend using on the similarity theory (the first law of similarity, the law of Π, the law of existence) based on the model’s geometric dimensions and the actual coal thickness, with the model and the original shape conforming to the law of similarity. According to experimental requirements and laboratory equipment limitations, combined with specific coal mine requirements, the coal and rock layers of the experimental bench were laid along the direction of the coal seam according to the physical and mechanical parameters of the coal and rock layers on site. Finally, a model with a length of 1.2 m, a width of 0.5 m, and a height of 1 m was constructed, and 10 cm coal pillars were reserved for protection on both sides.
This article mainly simulates the law of overlying strata movement and changes when the protective layer is affected by mining. If similar materials with high permeability are used, it will have a greater impact on the experimental results, so similar materials with low permeability are recommended. During the experiment, gypsum was selected as the cementing agent, and the similar materials were sand, gypsum, putty powder, and water. The selected materials were mixed in proportion to establish a two-dimensional similar simulation experimental model in the laboratory, and the material ratio is shown in Table 2. The physical and mechanical properties of the model coal strata calculated according to the similarity theorem are shown in Table 3.
The specific steps are as follows:
(1)
Clean the shelves of the experimental model and remove all the steel plates on one side.
(2)
Calculate the model material ratio of each rock layer, weigh the corresponding mass and stir evenly, and add an appropriate amount of water to ensure that the rock layer is not affected by dry humidity.
(3)
Pour the mixed material into the model shelf, smooth it evenly, and scatter mica powder to the thickness of 1 cm to achieve the effect of stratification.
(4)
Lay each layer of coal in accordance with the steps in (3) from bottom to top.
(5)
After completing the above steps, the model can be placed in the natural environment for a week, and the front and rear steel plates are then removed in accordance with this until they are completely removed.
(6)
Finally, heavy objects such as iron blocks are placed on the model to simulate the dead weight and buried depth pressure of overlying strata, so as to achieve the best experimental effect. The final object is shown in Figure 15.
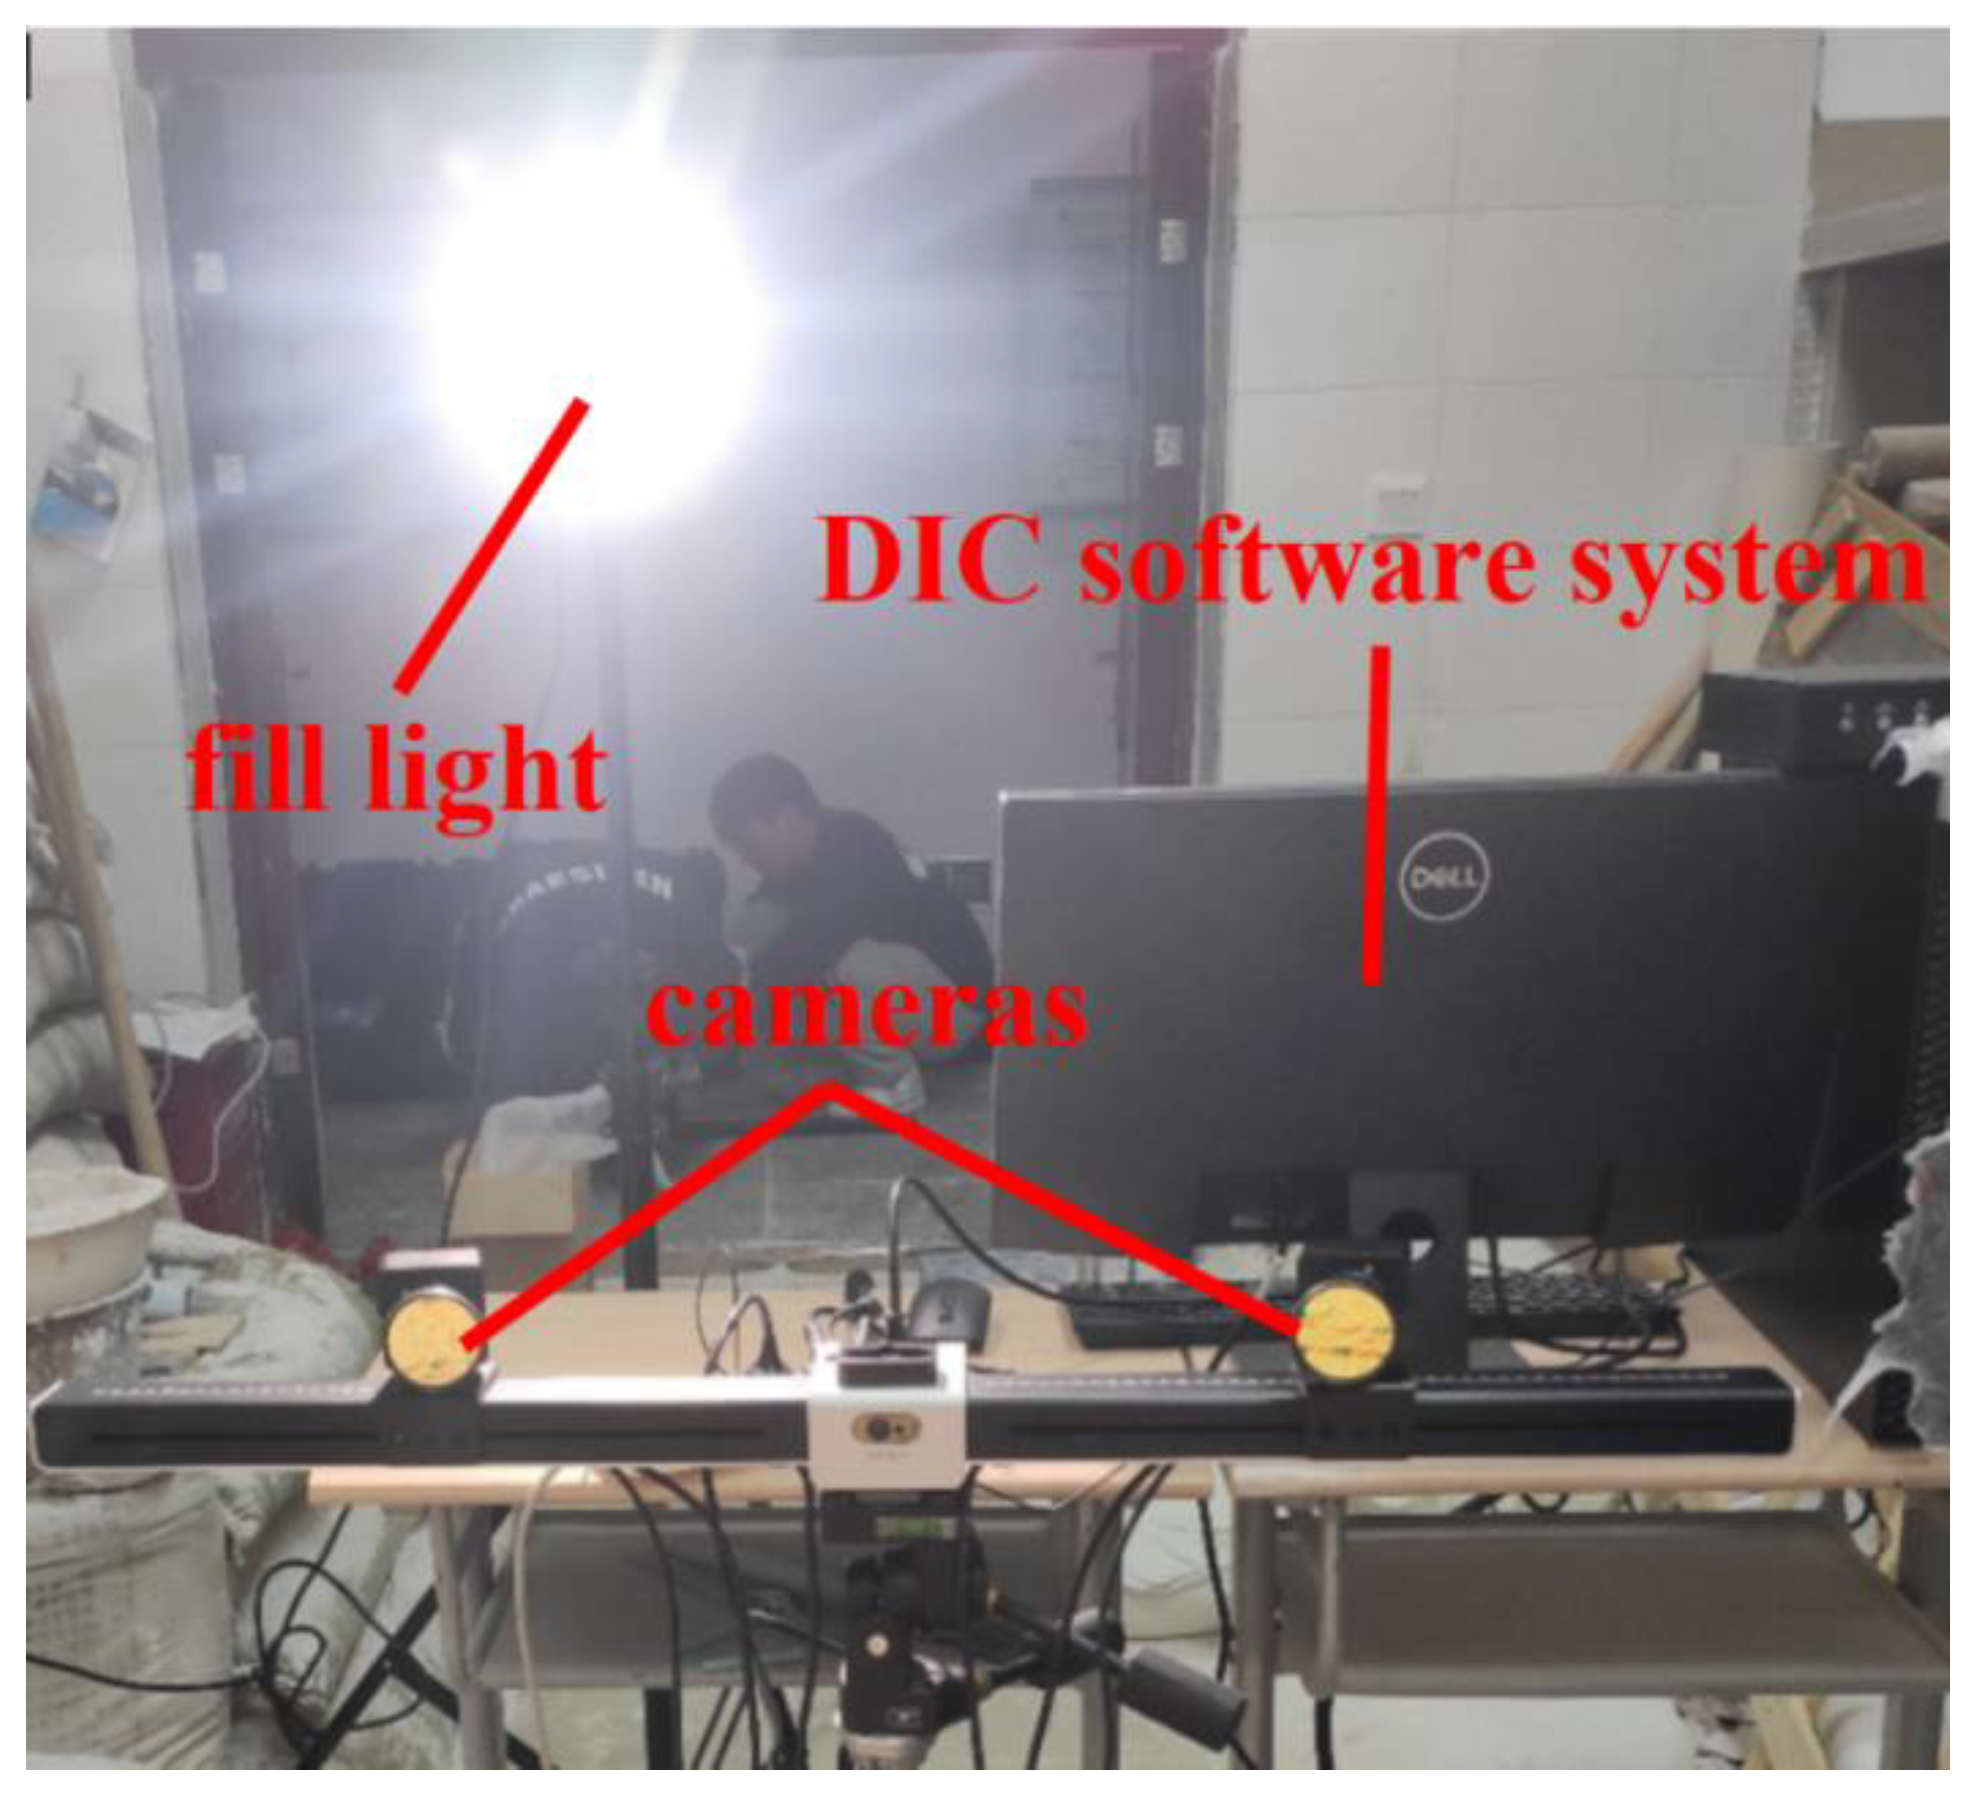
(7)
Install a fixed digital image correlation (DIC), as shown in Figure 16.

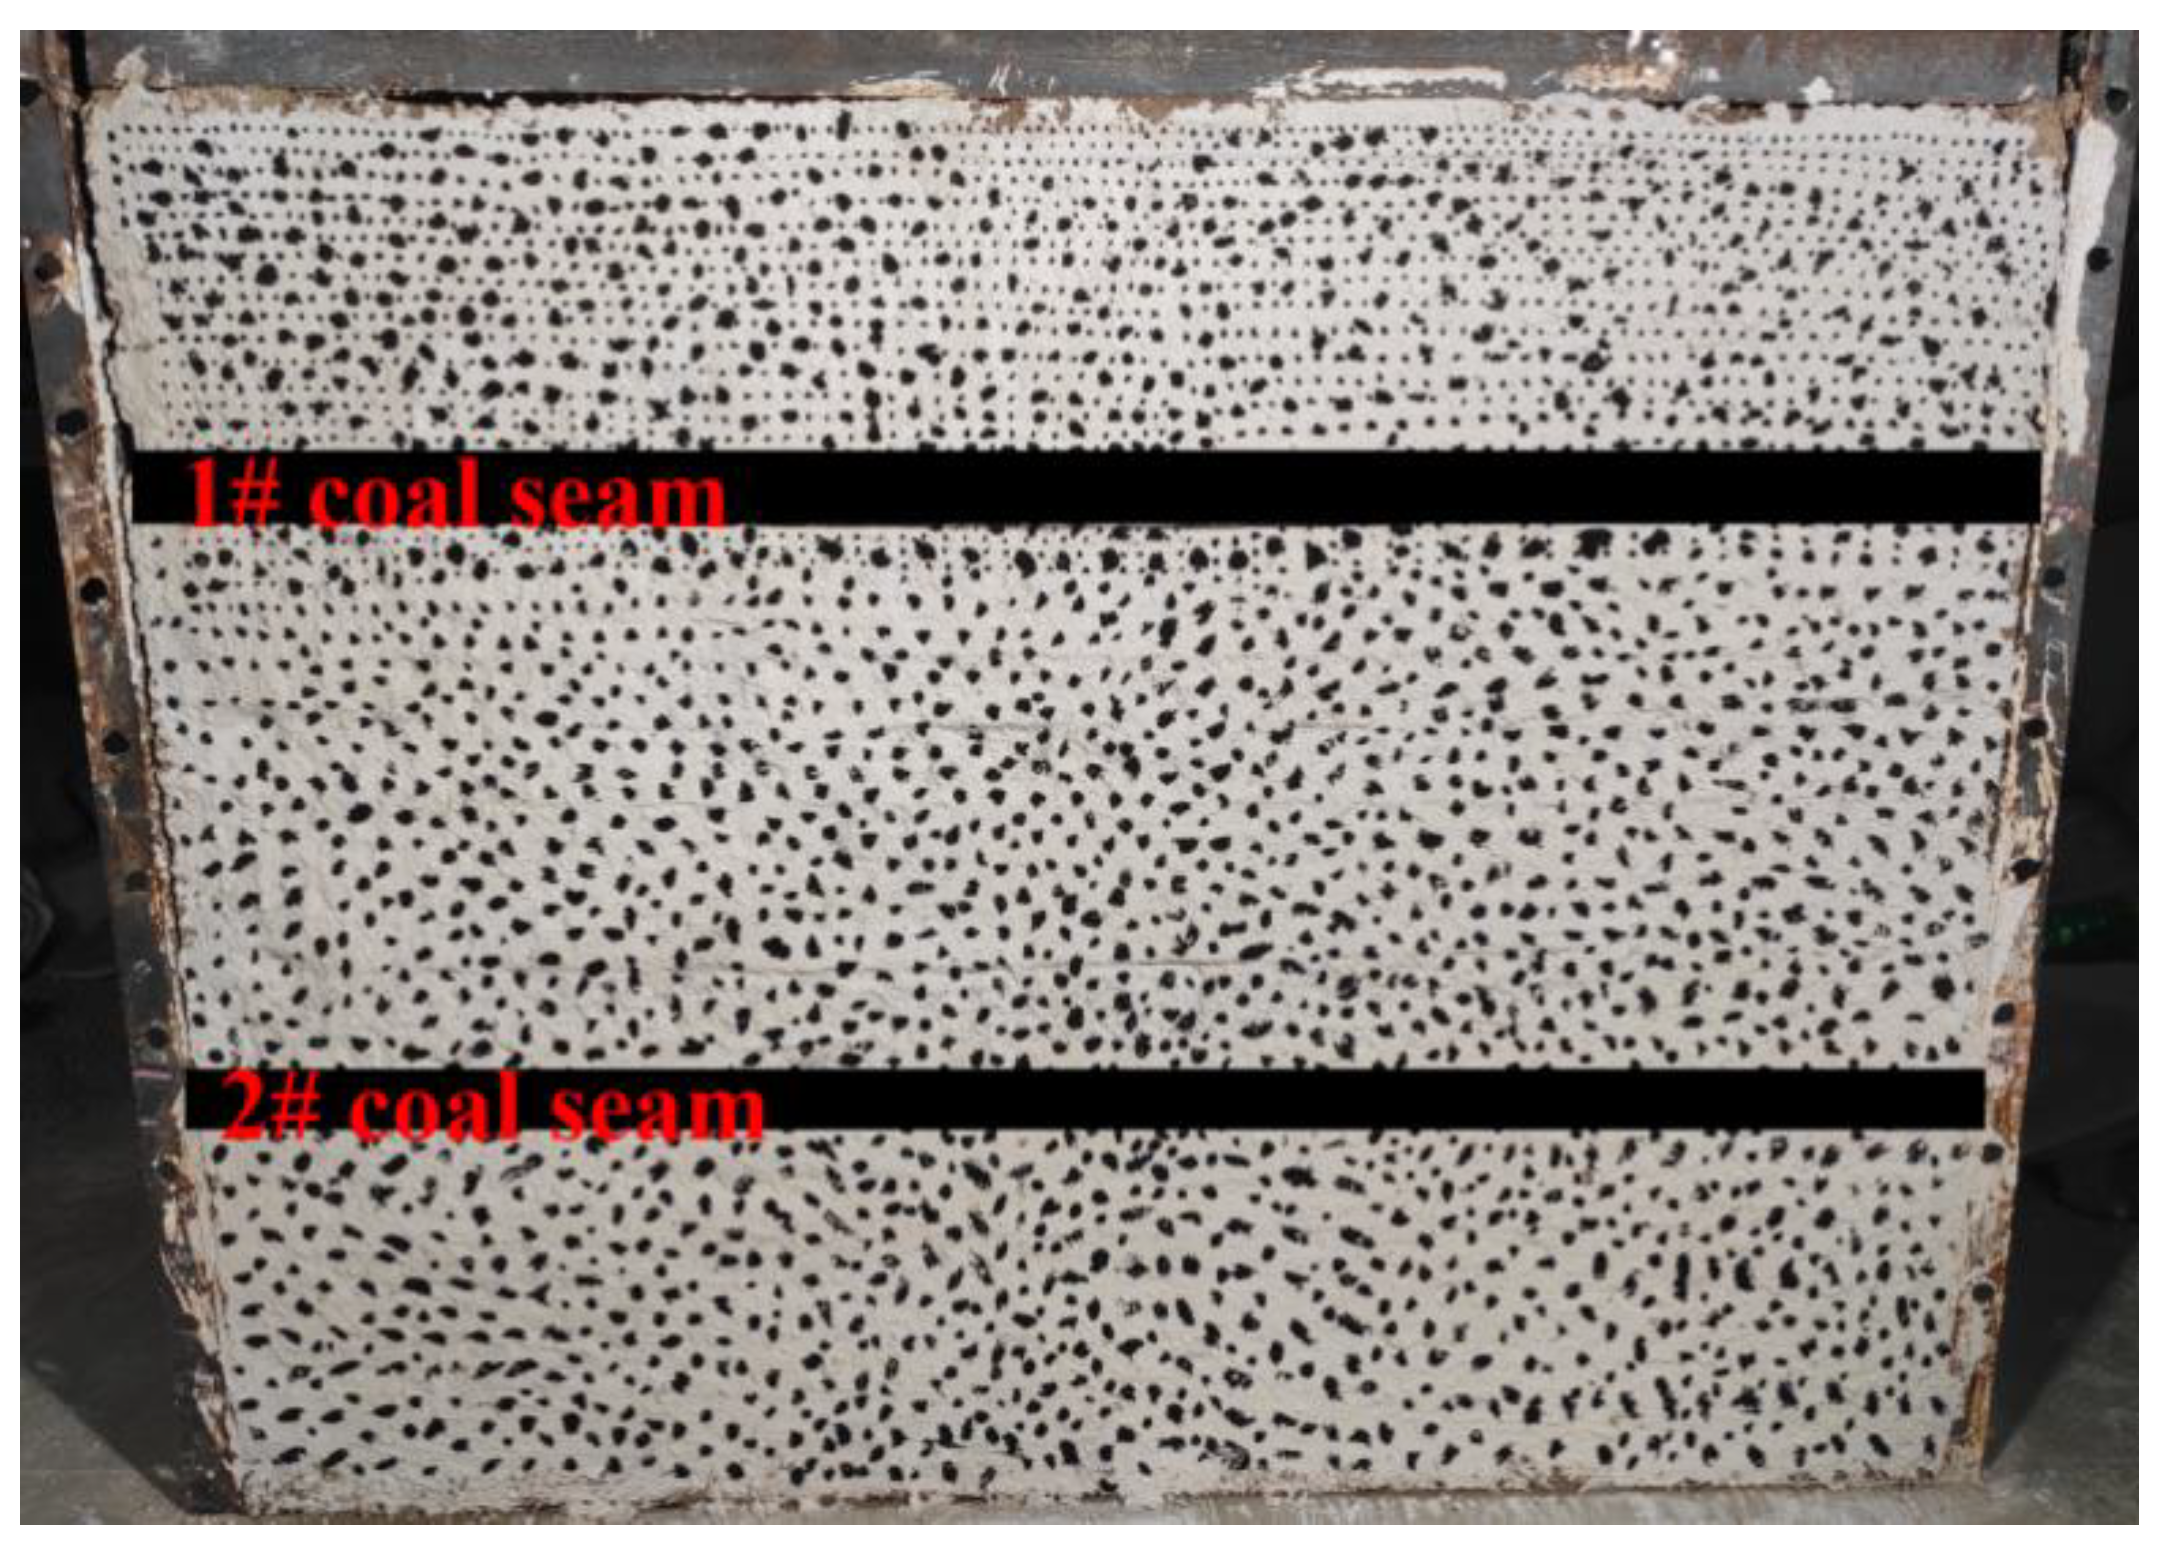
5.2. Analysis of Similarity Simulation Results

Figure 17 and Figure 18 are the overlying rock strain diagrams and displacement diagrams combined according to the digital speckle system and the protective layer advancing at different distances. From Figure 17 and Figure 18, we can obtain the following:
(1)
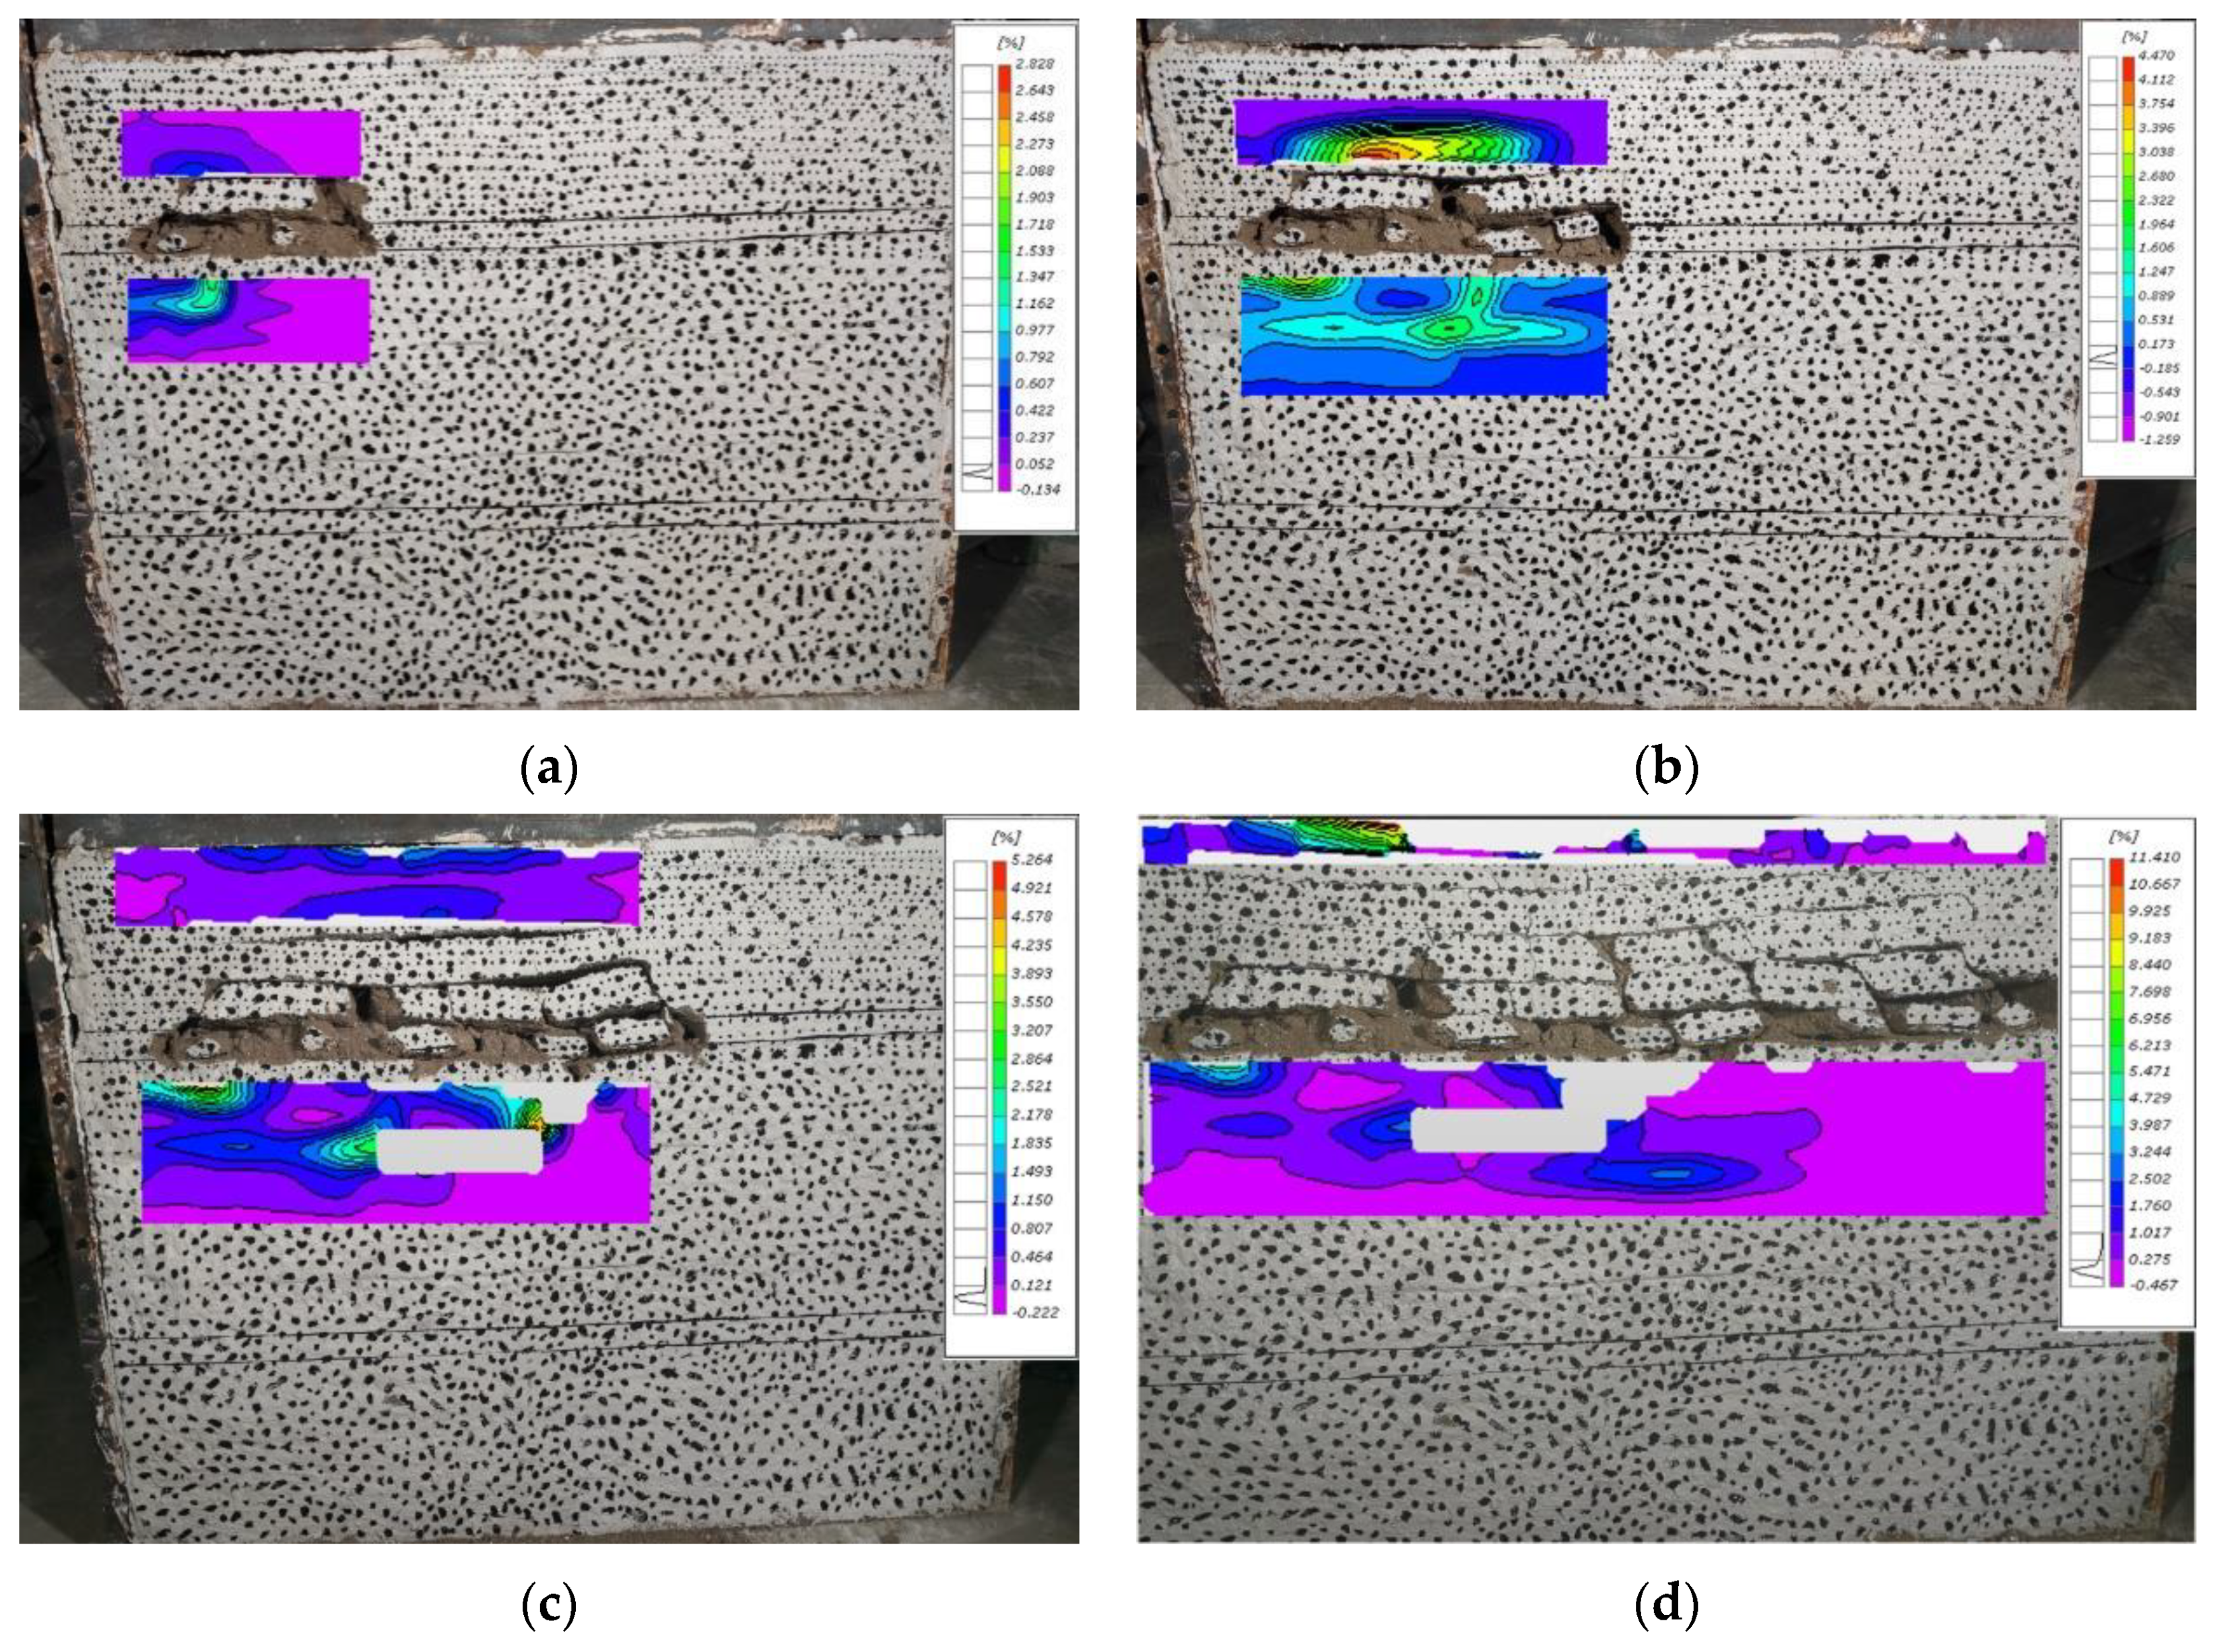
The 1# coal seam after excavation, the upper and lower strata fracture density with the advancement facing forward and becoming bigger, and the influence of the overburden is slightly greater than the impact on the underlying strata.
(2)
Under the influence of coal mining, the upper and lower strata of the protective layer move in the direction of the goaf. The closer it is to the goaf, the larger its displacement is, with the maximum displacement appearing in the middle of the goaf, indicating that the region produces the most fractures and is influenced by mining.
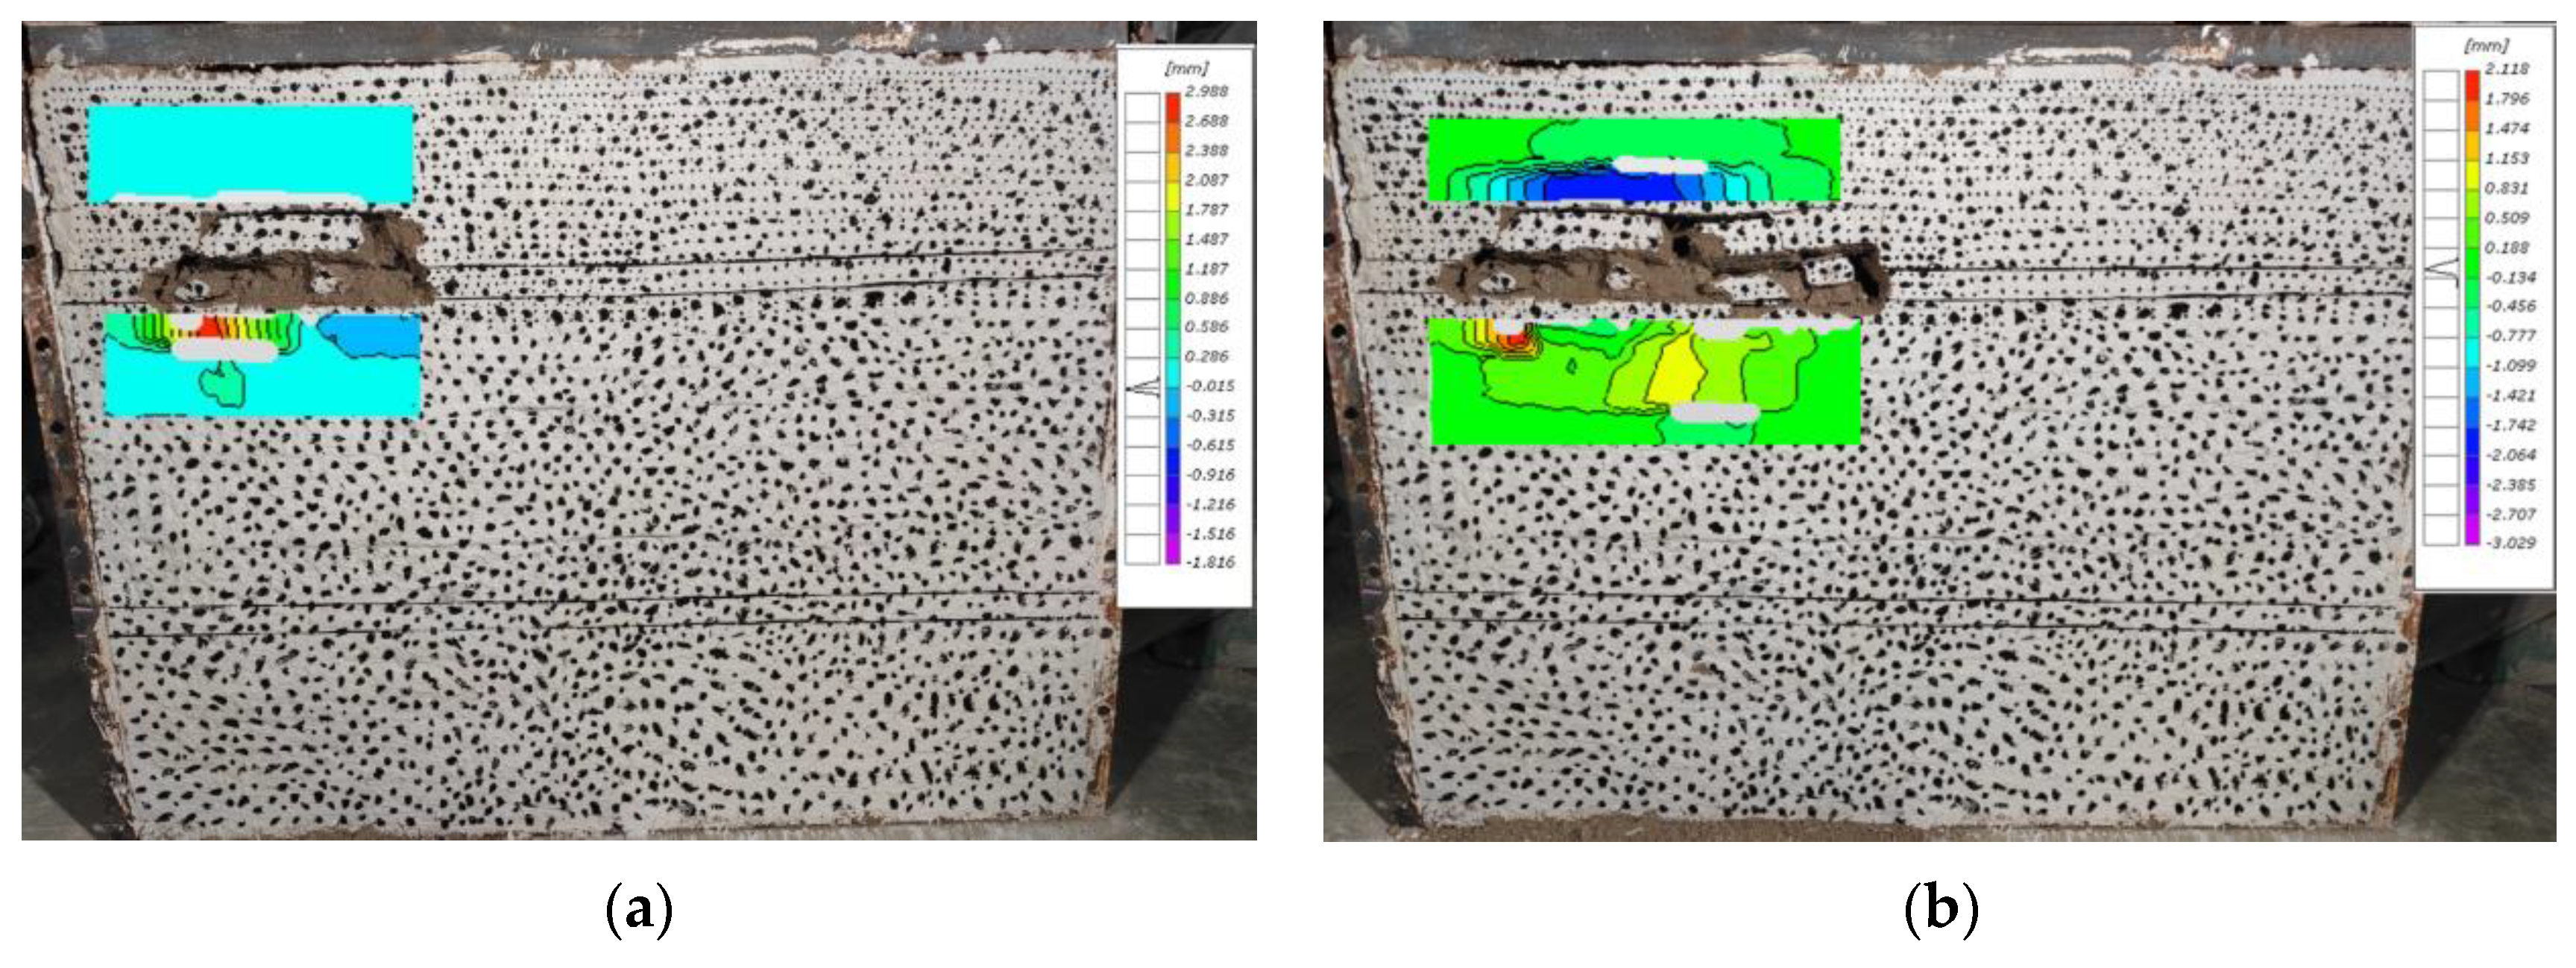
(3)
It can be seen from the displacement diagram that the maximum downward caving distance of the roof of the protective layer is 3 cm, which is 3 m according to the similarity ratio, and the maximum displacement point is approximately 6–7 cm away from the bottom plate, indicating that the height of the caving zone is approximately 6–7 m after the mining of the protective layer, which is roughly the same as the theoretical analysis.
(4)
As can be seen from the strain diagram, the maximum strain is 11.4, and the maximum strain point is approximately 20–21 cm away from the floor, so the height of the fracture zone is approximately 13–15 m, which is roughly the same as the theoretical analysis.

6. Engineering Application

6.1. The Original Gas Condition of the Protected Layer

According to the engineering geological data, this mine is a coal and gas outburst mine. In 2016, the mine gas grade identification results were as follows: the absolute and relative gas emission amounts of the mine were 91.58 m3/min and 131.88 m3/min, respectively. The original gas pressure was 1.32 MPa, and the original gas content was 13.15 m3/t.

6.2. Gas Changes in the Protected Layer

This study selected the use of residual gas pressure, roof and floor displacement, and residual gas content to test the protective effect of protective layer mining. When this method is used, the maximum gas content and maximum gas pressure need to be monitored, and, in accordance with the “Regulations on Prevention of Coal and Gas Outburst”, article 43 is used to judge the pressure relief protection area. If the result shows prominence, it can be judged that the pressure relief protection effect of the protective layer has no effect.

6.2.1. Investigation of Residual Gas Pressure in Protected Layer

In order to investigate the residual gas pressure of 2# coal seam in the protected layer, the residual gas pressure was measured by drilling a hole in the air inlet roadway of 2101 coal face. The in-situ measurement results of the residual gas pressure in the coal seam are shown in Table 4.
In order to facilitate the analysis of the changes in the coal gas pressure of the protected layer before and after mining in the coal mining face, the maximum residual gas pressure within the protection scope was taken and the maximum residual gas pressure and the original gas pressure of the coal seam were represented in a column chart, as shown in Figure 19.
According to Figure 18, after the protected layer is mined, the coal seam gas pressure drops from the original 1.32 MPa to 0.67 MPa; that is, the protected coal seam is affected by the mining of the coal mining face of the upper protection layer, and the gas pressure drops to 50.7% of the original gas pressure of the coal seam, with a decrease rate of 49.3%. This comprehensively shows that, after the coal face of the protective layer is mined, after sufficient pressure relief, the protected layer will expand and deform, causing the redistribution of ground stress. The air permeability of the coal seam is increased, the gas resolution speed is accelerated, and the emissions capacity is improved, with more gas released through the cracked channels.

6.2.2. Investigation of Residual Gas Content in Protected Layer

In order to investigate the residual gas content in the protected layer after mining at the coal face, fresh coal samples were collected at the transport passage of the 2101 working face of 2# coal seam according to the actual mining conditions on site, and the obtained coal samples were immediately sent to the laboratory for testing, as shown in Table 5.
In order to facilitate the analysis of the change in coal gas content in the protected layer before and after mining in the coal mining face, the maximum residual gas content measured in the protection scope was taken (4.12 m3/t), combined with the original gas content (from the measured maximum gas content of 13.15 m3/t), and represented as a histogram, as shown in Figure 20.
As can be seen from the figure above, the maximum original gas content of the coal seam is 13.15 m3/t. After the protection layer is exploited, the maximum residual gas content drops to 4.12 m3/t, and 9.03 m3/t of gas is released, accounting for 68.67% of the original gas content of the coal seam. It can be seen that after the mining of the coal mining face of the protective layer, the pressure of the coal mining face of the protected layer is relieved, causing the redistribution of ground stress, an increase in coal seam permeability, an acceleration of gas resolution, an improvement in the emission capacity, and more gas released through the fissure channel.
Adopting protective layer mining, while at the same time adopting U-shaped ventilation to implement gas control on the 2101 working face, the detection of gas concentration in the return air roadway for the mining period from January to June 2020 is shown in Table 6. According to Table 6, the average gas concentration in the return air roadway is 0.31%, meeting the national standard, which is that its value must be less than or equal to 1%.

7. Conclusions

This paper uses theoretical analysis, numerical simulation, similar simulation and engineering application methods to analyze the movement of the roof and floor overlying rock, the evolution of cracks, and the pressure relief effect of the protected layer after the protective layer is mined. The following conclusions are drawn:
(1)
Through the theoretical analysis of the overburden movement of the mined-out area, a separation model of the overlying rock layer of the mined-out area was established, with the height of the caving zone calculated as 4.70~9.70 m, and the height of the fracture zone as 6.46~19.46 m.
(2)
UDEC numerical simulation was used to analyze the mining of the protective layer, and it was found that the roof directly began to collapse when the working face advanced to 30 m, and when the working face advanced to 50 m, the overburden was first pressed. With the advancement of the working face, the cracks produced by the overburden initially increased, then the cracks were continuously compacted by the collapsed rock layer, which mainly existed at both ends of the working face. Affected by mining, the overlying rock layer moved downwards, the underlying rock layer bulged upwards, and the rock layers all moved to the working face. The protected layer was subjected to pressure relief due to the mining of the protective layer, and the pressure relief rate of the protected layer was 0.2~0.8. Furthermore, the overall expansion rate of the protected layer was greater than the requirements of the “Detailed Rules for Prevention of Coal and Gas Outbursts” for coal mines, indicating that the mining of the protected layer was beneficial to gas drainage.
(3)
Measured using strain and displacement cloud maps, the height of the caving zone was 6–7 m and the height of the fracture zone was 13–15 m, which is consistent with the theoretical analysis results.
(4)
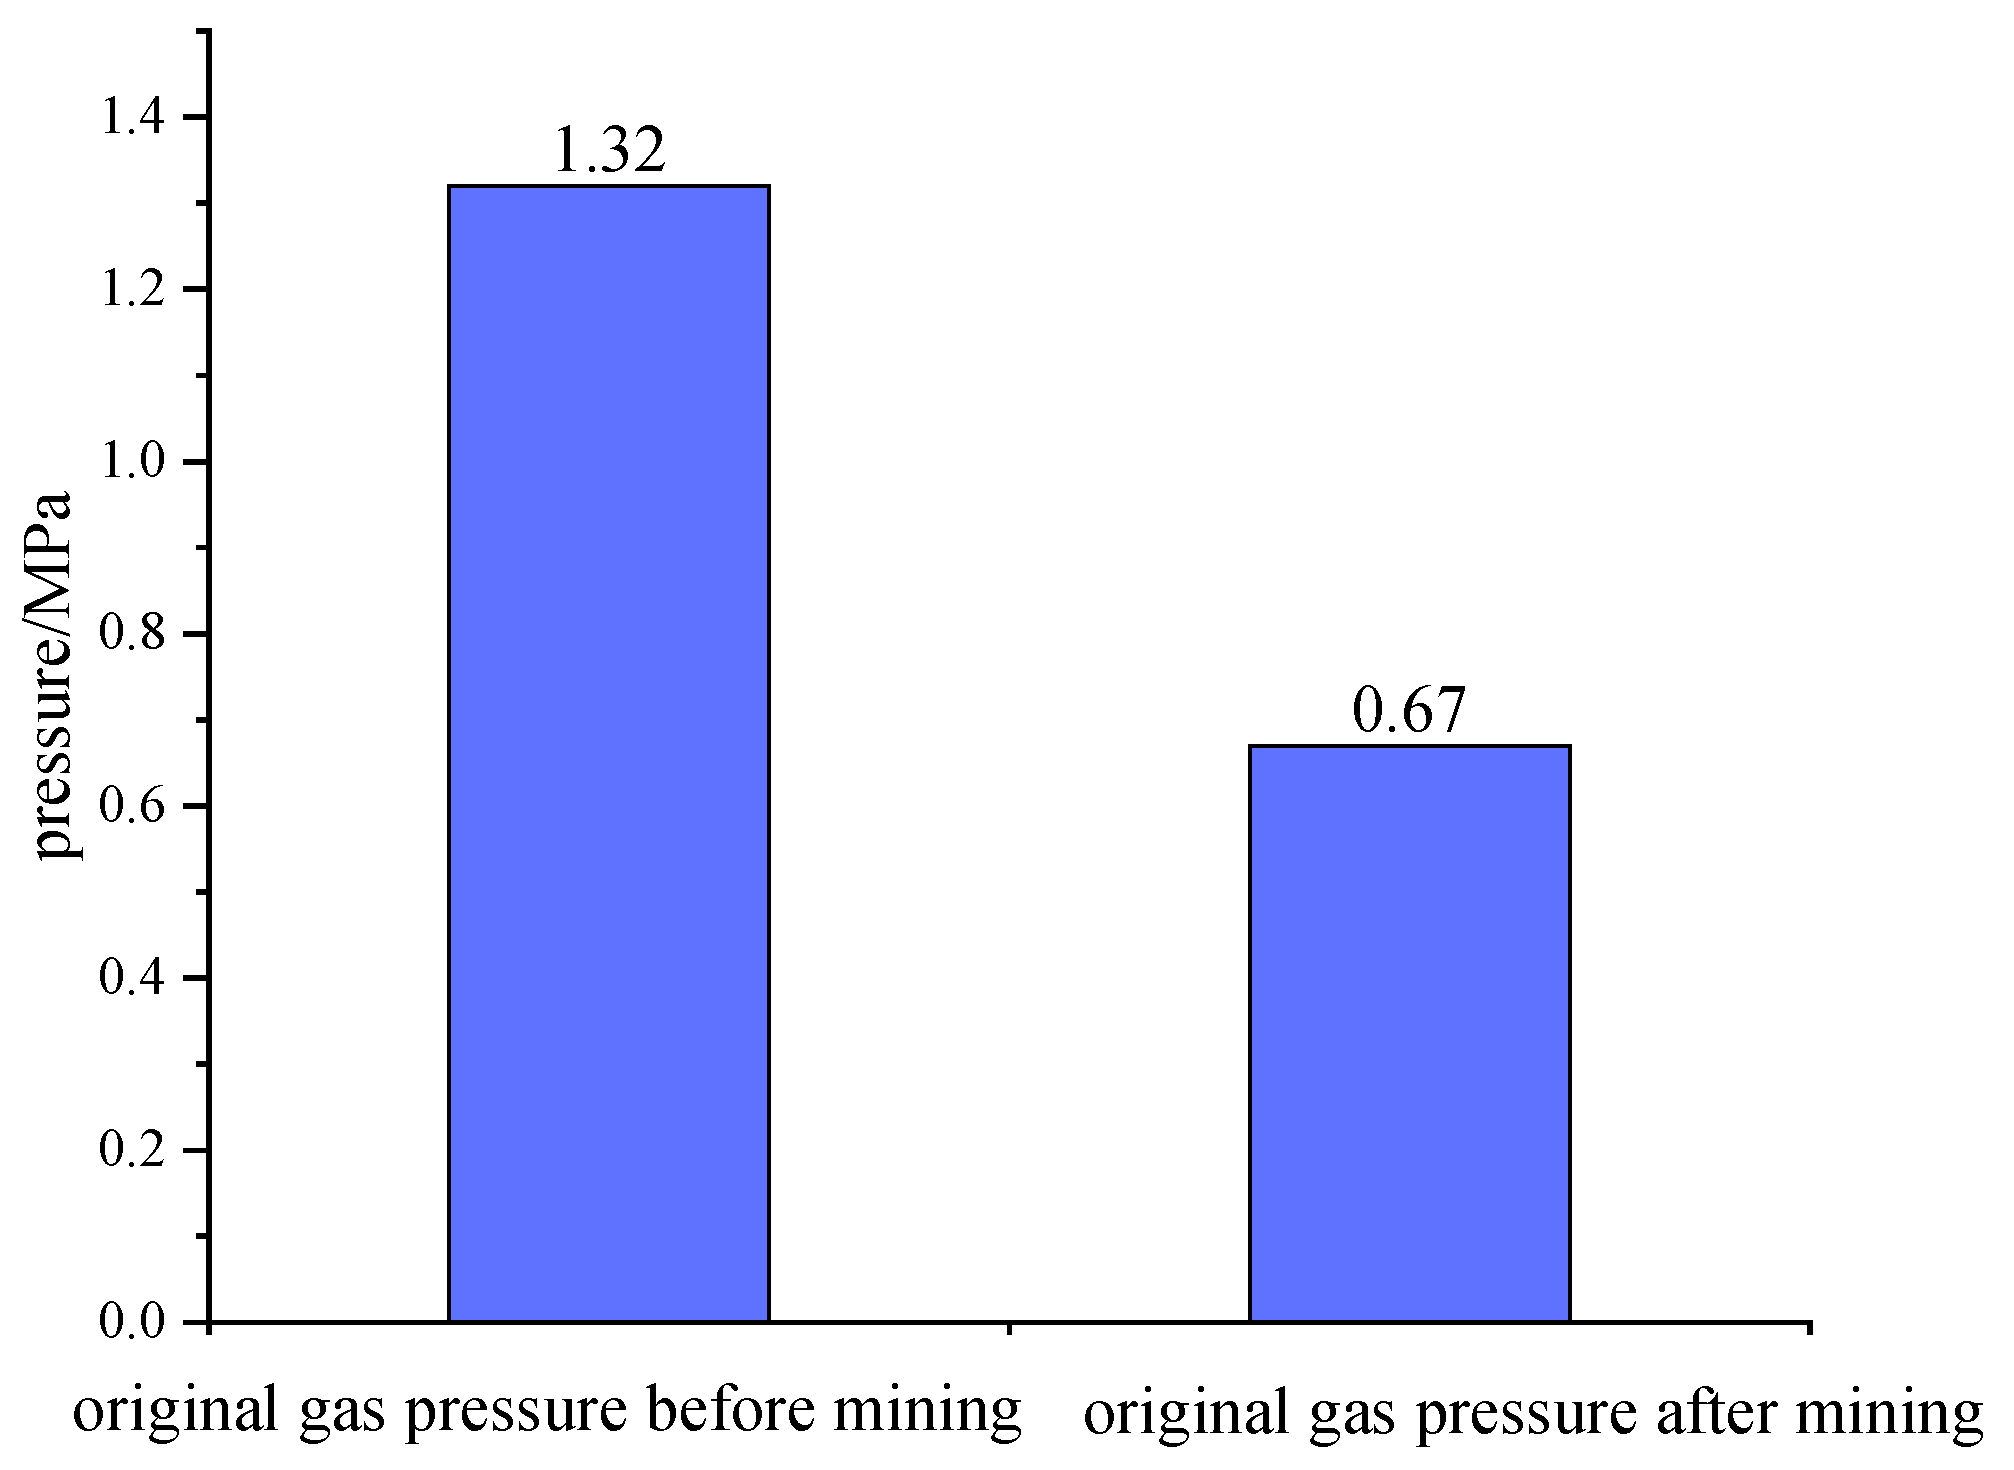
Through the investigation of the residual gas pressure and content of the protected layer, it was found that the protected coal seam was affected by the mining of the coal mining face of the upper protective layer. The gas pressure dropped to 50.7% of the original gas pressure of the coal seam, with a decrease rate of 49.3%. The residual gas content decreased by 68.67%, and the average gas concentration in the return air lane was 0.31%. In line with national regulations, this meets the national standard, which requires that its value be less than or equal to 1%.

Author Contributions

L.L.: methodology, software, formal analysis, investigation, data curation, and writing—original draft preparation. G.W.: conceptualization, data curation, writing—review and editing, visualization, project administration, and funding acquisition. Q.L.: conceptualization, validation, data curation, writing—review and editing, and visualization. All authors have read and agreed to the published version of the manuscript.

Funding

This research was funded by the National Natural Science Foundation of China Regional Fund (No. 52064005), the National Natural Science Foundation of China Regional Fund (No. 52164002), the National Natural Science Foundation of China Regional Fund (No. 52164005), and the Guizhou Province Graduate Research Fund (YJSKYJJ[2021]044).

Institutional Review Board Statement

Not applicable.

Informed Consent Statement

Informed consent was obtained from all subjects involved in the study.

Data Availability Statement

The data used to support the findings of this study are included within the article.

Acknowledgments

The authors would like to thank the Mining Engineering Laboratory of the School of Mining and Mining College of Guizhou University for its rock mechanics experimental support.

Conflicts of Interest

The authors declare no conflict of interest.

References

  1. Zhu, H.; Fang, S.; Huo, Y.; Guo, J.; Wu, Y.; Hu, L. Study of the Dynamic Development Law of Overburden Breakage on Mining Faces. Sci. Rep. 2020, 10, 6555. [Google Scholar] [CrossRef] [PubMed] [Green Version]
  2. Qian, M.G.; Miu, X.X.; Xu, J.L. Theoretical Research on the Key Stratum in Strata Control. J. China Coal Soc. 1996, 3, 2–7. [Google Scholar]
  3. Zuo, J.P.; Sun, Y.J.; Qian, M.G. Movement mechanism and analogous hyperbola model of overlying strata with thick alluvium. J. China Coal Soc. 2017, 42, 1372–1379. [Google Scholar]
  4. Jena, S.K.; Lokhande, R.D.; Pradhan, M.; Kumar, N. Development of a model to estimate strata behavior during bord and pillar extraction in underground coal mining. Arab. J. Geosci. 2019, 12, 242. [Google Scholar] [CrossRef]
  5. Kong, D.Z.; Cheng, Z.B.; Zheng, S.S. Study on the failure mechanism and stability control measures in a large-cutting-height coal mining face with a deep-buried seam. Bull. Eng. Geol. Environ. 2019, 78, 6143–6157. [Google Scholar] [CrossRef]
  6. Kong, D.Z.; Pu, S.J.; Cheng, Z.H.; Wu, G.Y.; Liu, Y. Coordinated Deformation Mechanism of the Top Coal and Filling Body of Gob-Side Entry Retaining in a Fully Mechanized Caving Face. Int. J. Géoméch. 2021, 21, 04021030. [Google Scholar] [CrossRef]
  7. Kumar, A.; Kumar, D.; Singh, A.K.; Ram, S.; Kumar, R.; Gautam, A.; Singh, R.; Singh, A.K. Roof sagging limit in an early warning system for safe coal pillar extraction. Int. J. Rock Mech. Min. Sci. 2019, 123, 104131. [Google Scholar] [CrossRef]
  8. Jena, S.K.; Ritesh, D.L.; Manoj, P.; Kuldip, P. Analysis of strata control monitoring in underground coal mine for apprehension of strata movement. In Proceedings of the Conference on Recent Advances in Rock Enginering (Rare 2016), Bengaluru, India, 16–18 November 2016; Volume 91, pp. 505–511. [Google Scholar]
  9. Yu, Q.X.; Cheng, Y.P.; Jiang, C.L.; Zhou, S.N. Principles and applications of exploitation of coal and pressure relief gas in thick and high-gas seams. Zhongguo Kuangye Daxue Xuebao/J. China Univ. Min. Technol. 2004, 33, 127–131. [Google Scholar]
  10. Wang, L.; Lu, Z.; Chen, D.-P.; Liu, Q.-Q.; Chu, P.; Shu, L.-Y.; Ullah, B.; Wen, Z.-J. Safe strategy for coal and gas outburst prevention in deep-and-thick coal seams using a soft rock protective layer mining. Saf. Sci. 2020, 129, 104800. [Google Scholar] [CrossRef]
  11. Xue, Y.; Gao, F.; Gao, Y.; Cheng, H.; Liu, Y.; Hou, P.; Teng, T. Quantitative evaluation of stress-relief and permeability-increasing effects of overlying coal seams for coal mine methane drainage in Wulan coal mine. J. Nat. Gas Sci. Eng. 2016, 32, 122–137. [Google Scholar] [CrossRef]
  12. Zhang, R.; Cheng, Y.; Zhou, H.; Yuan, L.; Li, W.; Liu, Q.; Jin, K.; Tu, Q. New insights into the permeability-increasing area of overlying coal seams disturbed by the mining of coal. J. Nat. Gas Sci. Eng. 2018, 49, 352–364. [Google Scholar] [CrossRef]
  13. Cheng, X.; Zhao, G.; Li, Y.; Meng, X.; Tu, Q. Key technologies and engineering practices for soft-rock protective seam mining. Int. J. Min. Sci. Technol. 2020, 30, 889–899. [Google Scholar] [CrossRef]
  14. Wang, L.; Chen, X.; Wang, Z.; Xu, S.; Xu, Q. Extending the protection range in protective seam mining under the influence of gas drainage. J. S. Afr. Inst. Min. Metall. 2020, 120, 211–220. [Google Scholar] [CrossRef]
  15. He, A.; Fu, H.; Huo, B.; Fan, C. Permeability Enhancement of Coal Seam by Lower Protective Layer Mining for Gas Outburst Prevention. Shock Vib. 2020, 2020, 8878873. [Google Scholar] [CrossRef]
  16. Xu, G.-S.; Li, H.-G.; Li, D.-H.; Zhang, Y.-B. Method to Calculate Mining-Induced Fracture Based on the Movement and Deformation of Overburden Strata. Shock Vib. 2021, 2021, 9965466. [Google Scholar] [CrossRef]
  17. Fu, W. Determination Method of Caving & Fracture Zone Height for Gas Drainage by High Level Borehole. Coal Technol. 2008, 27, 75–76. [Google Scholar]
  18. Sun, Y.; Zuo, J.; Karakus, M.; Wang, J. Investigation of movement and damage of integral overburden during shallow coal seam mining. Int. J. Rock Mech. Min. Sci. 2019, 117, 63–75. [Google Scholar] [CrossRef]
  19. Sun, Y.; Zuo, J.; Karakus, M.; Wen, J. A Novel Method for Predicting Movement and Damage of Overburden Caused by Shallow Coal Mining. Rock Mech. Rock Eng. 2020, 53, 1545–1563. [Google Scholar] [CrossRef]
  20. Shang, Y.; Wu, G.; Liu, Q.; Kong, D.; Li, Q. The Drainage Horizon Determination of High Directional Long Borehole and Gas Control Effect Analysis. Adv. Civ. Eng. 2021, 2021, 3370170. [Google Scholar] [CrossRef]
  21. Zhang, Y. Distribution law of floor stress during mining of the upper protective coal seam. Sci. Prog. 2020, 103, 0036850420930982. [Google Scholar] [CrossRef]
  22. Zhou, G.L.; Xu, T.; Konietzky, H.; Zhu, W.; Heng, Z.; Yu, X.Y.; Zhao, Y. An improved grain-based numerical manifold method to simulate deformation, damage and fracturing of rocks at the grain size level. Eng. Anal. Bound. Elem. 2021, 134, 107–116. [Google Scholar] [CrossRef]
  23. Lu, J.; Jiang, C.; Jin, Z.; Wang, W.; Zhuang, W.; Yu, H. Three-dimensional physical model experiment of mining-induced deformation and failure characteristics of roof and floor in deep underground coal seams. Process Saf. Environ. Prot. 2021, 150, 400–415. [Google Scholar] [CrossRef]
  24. Tan, L.; Ren, T.; Dou, L.; Yang, X.; Qiao, M.; Peng, H. Analytical stress solution and mechanical properties for rock mass containing a hole with complex shape. Theor. Appl. Fract. Mech. 2021, 114, 103002. [Google Scholar] [CrossRef]
  25. Wu, H.; Dai, B.; Cheng, L.; Lu, R.; Zhao, G.; Liang, W. Experimental Study of Dynamic Mechanical Response and Energy Dissipation of Rock Having a Circular Opening Under Impact Loading. Mining Metall. Explor. 2021, 38, 1111–1124. [Google Scholar] [CrossRef]
  26. Wu, Q.; Jiang, L.; Wu, Q.; Xue, Y.; Gong, B. A study on the law of overlying strata migration and separation space evolution under hard and thick strata in underground coal mining by similar simulation. DYNA 2018, 94, 175–181. [Google Scholar] [CrossRef] [Green Version]
  27. Kong, D.Z.; Xiong, Y.; Cheng, Z.B.; Wang, N.; Wu, G.Y.; Liu, Y. Stability analysis of coal face based on coal face-support-roof system in steeply inclined coal seam. Geomech. Eng. 2021, 25, 233–243. [Google Scholar]
  28. Fu, J.; Wen, G.; Sun, H.; Yang, X. Study on the shear movement law of overlying strata by slice mining. Energy Sci. Eng. 2020, 8, 2335–2351. [Google Scholar] [CrossRef] [Green Version]
Figure 1. Integrated histogram of coal seam D.
Energies 15 01831 g001
Figure 2. Separation model of overlying strata in goaf.
Energies 15 01831 g002
Figure 3. Numerical simulation calculation model.
Energies 15 01831 g003
Figure 4. Caving characteristics of working face advancing at different distances: (a) collapse characteristics when the working face advances 30 m; (b) collapse characteristics when the working face advances 50 m; (c) collapse characteristics when the working face advances 80 m; and (d) collapse characteristics when the working face advances 140 m.
Energies 15 01831 g004
Figure 5. Evolution of roof cracks when working face advances at different distances: (a) evolution of roof cracks when working face advances at 30 m; (b) evolution of roof cracks when working face advances at 50 m; (c) evolution of roof cracks when working face advances at 80 m; and (d) evolution of roof cracks when working face advances at 140 m.
Energies 15 01831 g005
Figure 6. Coal and rock displacements when the working face is advanced at different distances: (a) coal and rock displacements when the working face is advanced at 30 m; (b) coal and rock displacements when the working face is advanced at 50 m; (c) coal and rock displacements when the working face is advanced at 80 m; and (d) coal and rock displacements when the working face is advanced at 140 m.
Energies 15 01831 g006
Figure 7. Displacement diagram of roof of the working face advancing at different distances.
Energies 15 01831 g007
Figure 8. Displacement diagram of floor plate at different distances of working face propulsion.
Energies 15 01831 g008
Figure 9. Vertical stress distribution at different distances of working face advancement: (a) vertical stress distribution at 30 m of working face advancement: (b) vertical stress distribution at 50 m of working face advancement: (c) vertical stress distribution at 80 m of working face advancement; and (d) vertical stress distribution at 140 m of working face advancement.
Energies 15 01831 g009
Figure 10. Vertical stress diagram of working face advancement at different distances.
Energies 15 01831 g010
Figure 11. Pressure relief rate diagram of working face propulsion at different distances.
Energies 15 01831 g011
Figure 12. The working face pushes the roof displacement of the protected layer at different distances.
Energies 15 01831 g012
Figure 13. The working face pushes the floor displacement of the protected layer at different distances.
Energies 15 01831 g013
Figure 14. Expansion rate diagram of working face advancing at different distances.
Energies 15 01831 g014
Figure 15. Similarity simulation model.
Energies 15 01831 g015
Figure 16. Digital image correlation.
Energies 15 01831 g016
Figure 17. Strain diagram of working face advancing at different distances: (a) strain diagram of simulated working face advancing 30 m; (b) strain diagram of simulated working face advancing 50 m; (c) strain diagram of simulated working face advancing 60 m; and (d) strain diagram of simulated working face advancing 80 m.
Energies 15 01831 g017
Figure 18. Displacement diagram of working face propulsion at different distances: (a) displacement diagram of 30 m advancement of simulated working face; (b) displacement diagram of 50 m advancement of simulated working face; (c) displacement diagram of 60 m advancement of simulated working face; and (d) displacement diagram of 80 m advancement of simulated working face.
Energies 15 01831 g018aEnergies 15 01831 g018b
Figure 19. Gas pressure of protected layer before and after mining.
Energies 15 01831 g019
Figure 20. Gas content of protected layer before and after mining.
Energies 15 01831 g020
Table 1. Physical and mechanical property parameters of coal and rock mass.
Name of the RockDensity
(g/cm3)
Bulk Modulus
(×103 MPa)
Shear Modulus
(×103 MPa)
Angle of Internal Friction
(°)
Tensile Strength
(MPa)
Cohesion
(MPa)
argillaceous limestone23001.11.95321.41.4
coarse sandstone26002.91.6361.02.1
mudstone23002.12.95322.43.1
1# coal seam13001.30.9300.80.8
sandy mudstone26001.71.4331.81.2
siltstone25001.91.67361.01.3
2# coal seam13001.30.9300.80.8
mudstone23002.12.95322.43.1
coarse sandstone26002.91.6361.02.1
Table 2. Material ratio of similar simulation experiment.
RockThickness
(cm)
Ratio of No.Quality of the Sand
(kg)
Quality of the Lime
(kg)
Quality of the Gypsum
(kg)
argillaceous limestone10655373.083.08
coarse sandstone10564374.442.96
mudstone10773373.701.59
1# coal seam3105511.10.560.56
sandy mudstone677322.22.220.95
siltstone309551116.176.17
2# coal seam4105514.80.740.74
mudstone777325.92.591.11
coarse sandstone20564748.885.92
Table 3. Experimental physical and mechanical parameters of coal and rock layers.
RockShear Modulus
(×103 MPa)
Angle of Internal Friction
(°)
Tensile Strength
(MPa)
Cohesion
(MPa)
Poisson Ratio
argillaceous limestone1.95320.141.40.195
coarse sandstone1.6360.102.10.28
mudstone2.95320..43.10.25
1# coal seam0.9300.080.80.32
sandy mudstone1.4330.181.20.278
siltstone1.67360.101.30.235
2# coal seam0.9300.080.80.32
mudstone2.95320.243.10.25
coarse sandstone1.6360.102.10.28
Table 4. Determination results of residual gas pressure in coal seam.
Borehole NoCoal Seam Gas Pressure (MPa)Note
10.66protected area
20.67protected area
30.62protected area
40.69outside the protection area
50.63protected area
60.72outside the protection area
70.68protected area
Table 5. Residual gas content in 2# coal seam.
Borehole NoCoal Seam Gas Content (m3/t)
13.85
22.98
33.88
45.98
53.74
64.52
73.89
Table 6. Gas concentration detection.
MonthGas Concentration in Return Air Lane
10.25
20.35
30.37
40.32
50.29
60.28
Publisher’s Note: MDPI stays neutral with regard to jurisdictional claims in published maps and institutional affiliations.

