Article

Piloted Simulation of the Rotorcraft Wind Turbine Wake Interaction during Hover and Transit Flights

1
German Aerospace Center (DLR), Institute of Flight Systems, 38108 Braunschweig, Germany
2
Institute of Aerodynamics and Gas Dynamics (IAG), University of Stuttgart, 70569 Stuttgart, Germany
*
Author to whom correspondence should be addressed.
Energies 2022, 15(5), 1790; https://doi.org/10.3390/en15051790
Submission received: 19 January 2022 / Revised: 18 February 2022 / Accepted: 21 February 2022 / Published: 28 February 2022
(This article belongs to the Special Issue Rotary Wing Aerodynamics)

Abstract

:
Helicopters are used for offshore wind farms for maintenance and support flights. The number of helicopter operations is increasing with the expansion of offshore wind energy, which stresses the point that the current German regulations have not yet been validated through scientific analysis. A collaborative research project between DLR, the Technical University of Munich, the University of Stuttgart and the University of Tübingen has been conducted to examine the sizes of the flight corridors on offshore wind farms and the lateral safety clearance for helicopter hoist operations at offshore wind turbines. This paper details the results of piloted helicopter simulations in a realistic offshore wind farm scenario. The far-wake of rotating wind turbines and the near-wake of non-rotating wind turbines have been simulated with high-fidelity computational fluid dynamics under realistic turbulent inflow conditions. The resulting flow fields have been processed by superposition during piloted simulations in the research flight simulator AVES to examine the flight corridors in transit flights and the lateral safety clearance in hovering flights. The results suggest a sufficient size for the flight corridor and sufficient lateral safety clearance at the offshore wind turbines in the considered scenarios.

1. Introduction

Europe’s efforts to develop sustainable and affordable energy production are leading to the rapid expansion of offshore wind energy. Among other means, helicopters are used at offshore wind farms for maintenance and support flights, and the number of helicopter operations is increasing along with the expansion of offshore wind energy. Current German regulations for helicopter operations in offshore wind farms to protect helicopters from potentially dangerous wakes of wind turbines (WTs) underlie assumptions, which are not scientifically sound. Therefore, the HeliOW project (helicopter offshore wind) has been established to assess the suitability of the German regulations to protecting helicopters form potential safety risks. It is a collaborative national research project which includes in situ measurements of WT wakes with unmanned aircraft systems (University of Tübingen [1]), high-fidelity computational fluid dynamic (CFD) simulations of WT wakes (University of Stuttgart [2,3,4,5]), desktop helicopter simulations with mutual interaction between WT wake and helicopter (Technical University of Munich [6,7]) and piloted helicopter simulations in a research flight simulator with a superposition method (DLR [8]).
Since 2015, the average nominal power of newly installed offshore WTs has grown at an annual rate of 16% [9]. Currently, wind farms are located up to 100 km from shore in water up to 100 m deep by using bottom-fixed and floating technologies [9]. Current wind farms consist of up to 165 offshore WTs, and operational offshore WTs with nominal power generation of up to 9.5 MW can be found [9]. Newly ordered offshore WTs have reached an average nominal power lvel of 10.4 MW [10], and manufacturers have announced the development of future offshore WTs above 14 MW (https://www.ge.com/renewableenergy/wind-energy/offshore-wind/haliade-x-offshore-turbine (accessed on 21 September 2021)) or 15 MW (https://www.vestas.com/en/products/offshore%20platforms/v236_15_mw#!) (accessed on 23 September 2021).
A typical offshore wind farm consists of a number of WTs and a manned offshore substation (OSS). The OSS is used for maintenance of the wind farm and is usually located at its center. Wind farm operators use crew transfer vessels (CTVs) or helicopters to transport maintenance engineers, tools spare parts from the OSS to inoperative WTs. CTVs offer high passenger and cargo capacity, but they are typically limited to a maximum of sea state 4 ([11], Table A3) and passengers may be affected by seasickness. The benefits of helicopters are short transfer times and an operational limit of sea state 6, based on their rotorcraft flotation systems ([12], Table A3). Therefore, a helicopter is most beneficial for urgent issues (unscheduled WT maintenance, high sea states, emergency transport, etc.) and for wind farms located far from shore.
Potential risks for helicopter operations originate from bluff-body wakes in proximity of structures (OSS, WTs) and from the wakes of rotating WTs (turbulence, wind deficit, blade tip vortices). The latter may cause a so-called helicopter vortex–rotor interaction with blade tip vortices from the WTs. The influence of vortex–rotor interactions of helicopters with fixed-wing aircraft vortex wakes has been examined in the past by piloted simulations [13]. Those results are not directly transferable to WT wakes, but a promising subjective pilot rating scale has been developed.
The longitudinal vortex–rotor interaction between helicopters and WTs has been analyzed by van der Wall et al. [14]. A semi-empirical wind turbine wake model (SWM) has been developed to assess the influence of the WT vortex on a Bo105 rotor trim. The location of the vortex within the rotor disk, the nominal WT power and the distance between helicopter and WT have been varied. These examinations have been extended to examine the influences of various rotor sizes, blade flapping motions and advance ratios [15]; different vortex orientations within the rotor disk [16]; and vortex deflection [17]. Lastly, the modeling approaches for vortex–rotor interactions with a rigid line vortex and a deflected line vortex have been compared with intermediate-fidelity free-wake simulations, and guidelines for their applicability are given in [18]. Overall, these investigations give insights into the complicated effects at the helicopter’s main rotor. However, these results are limited to rotor trim, and flight dynamics are neglected.
Furthermore, an overview of Europe research on the influences of onshore/offshore WT wakes on helicopter operations is given in a report compiled by members of the GARTEUR Helicopter Action Group 23 (HC-AG23 [19]). It addresses different topics, such as WT wake experiments and computations, offline helicopter simulation, and piloted helicopter simulations. However, the results of the piloted simulations are very limited and show the need for further examinations.
The first extensive piloted simulation of transit flights in offshore farms has been performed by the authors of [8], based on flow fields from the SWM and subjective pilot rating scales. WT vortex encounters of a EC135 helicopter without any stability systems (e.g., SAS) have been examined for different airspeeds and WTs with a nominal power up to 20 MW . Overall, the results suggest sufficient safety clearance. However, the suitability of the SWM has not been proven.
This study deepens the previous efforts made by the authors by using flow fields from high-fidelity CFD instead of flow fields from the SWM for transit flights. Furthermore, a second operational scenario has been derived from helicopter hoist operations at offshore WTs and has been examined by piloted simulations. This paper proceeds as follows. Firstly, the current German regulations for helicopter operations in offshore wind farms are briefly described in regard to the flight corridor within a wind farm and the lateral safety distance for helicopter hoist operations at offshore WTs. Secondly, two typical operational scenarios for helicopters are derived from operational practice for the assessment of potential risks. Thirdly, the generation of WT wake flow fields in both operational scenarios from CFD is described and the resulting flow fields are analyzed. Fourthly, the setup, performance and assessment of the piloted simulations are described. Fifthly, the results of both operational scenarios are analyzed. In addition, results of offline simulations to compare WT wake flow fields from the previously used SWM and high-fidelity CFD are given. Finally, all results are discussed and a conclusion is given.

2. Regulations for Helicopter Operations

Maritime helicopter operations in offshore wind farms involve the transportation of maintenance engineers from the mainland to the OSS or from the OSS to single WTs. The former represents a transit flight from outside through the wind farm and a landing on the OSS. The latter represents a short distance flight to a single WT followed by a helicopter hoist operation of persons, tools and spare parts. Both helicopter operations are performed in an adverse environment with changing weather conditions, low visibility, obstacles and turbulence.
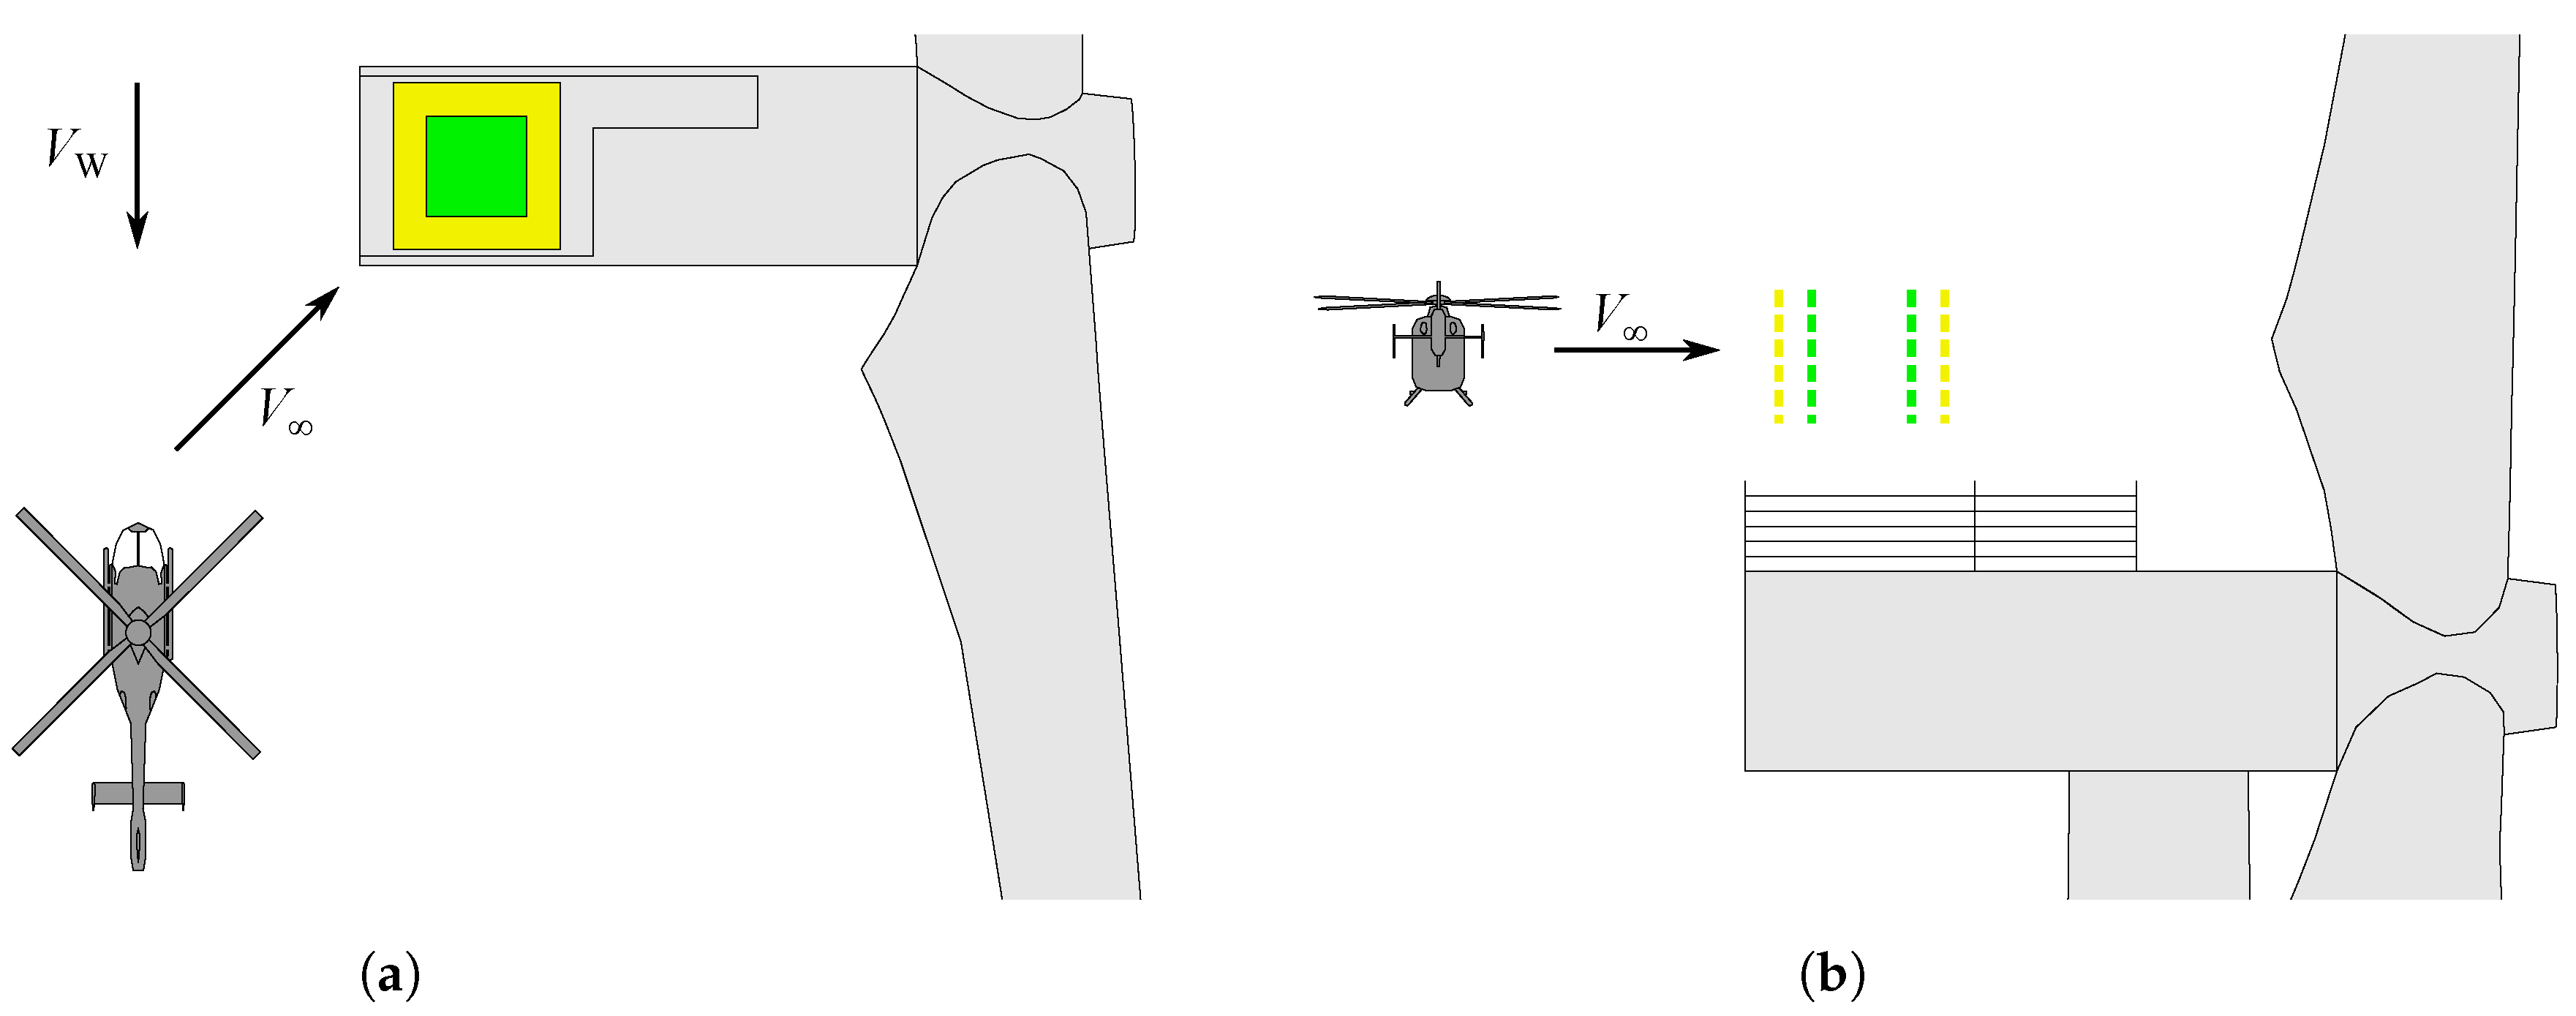
German authorities have defined regulations for an inner and outer flight corridor used for transit flights to the OSS (Figure 1a). Its dimensions are based on the geometry of WTs and empirical experience [20]. In particular, the rotor radius of the WT is used as a scaling factor, which causes an increase in the dimensions of the inner and outer flight corridor for future WTs. The influences of wind speed, its direction and the WT wake are neglected.
Furthermore, German authorities have defined regulations for helicopter hoist operations at offshore WTs [21]. An arbitrary hoist area at the top of the nacelle is required, which contains a square of 4 × 4 m as the minimum size (Figure 1b). It includes a hoist position, which is centered over the hoist area. The minimum lateral safety clearance is defined for the hoist maneuver directly above the hoist position. The distance between the helicopter rotor disk and the rear of the WT rotor disk must exceed 5 m . However, it is recommended to choose a reference helicopter and increase lateral safety clearance to half of the rotor diameter D H . Additional requirements apply for obstacles and railings and are not further discussed here. Overall, the regulations simply recommend the rotor diameter D H as a scaling factor. The influences of wind speed and the wakes of surrounding WTs are neglected as well.

3. Operational Scenarios

After consultations with the Federal Aviation Office of Germany (LBA) and the Federal Maritime and Hydrographic Agency of Germany (BSH), two potentially critical operational scenarios for the piloted simulation were derived.
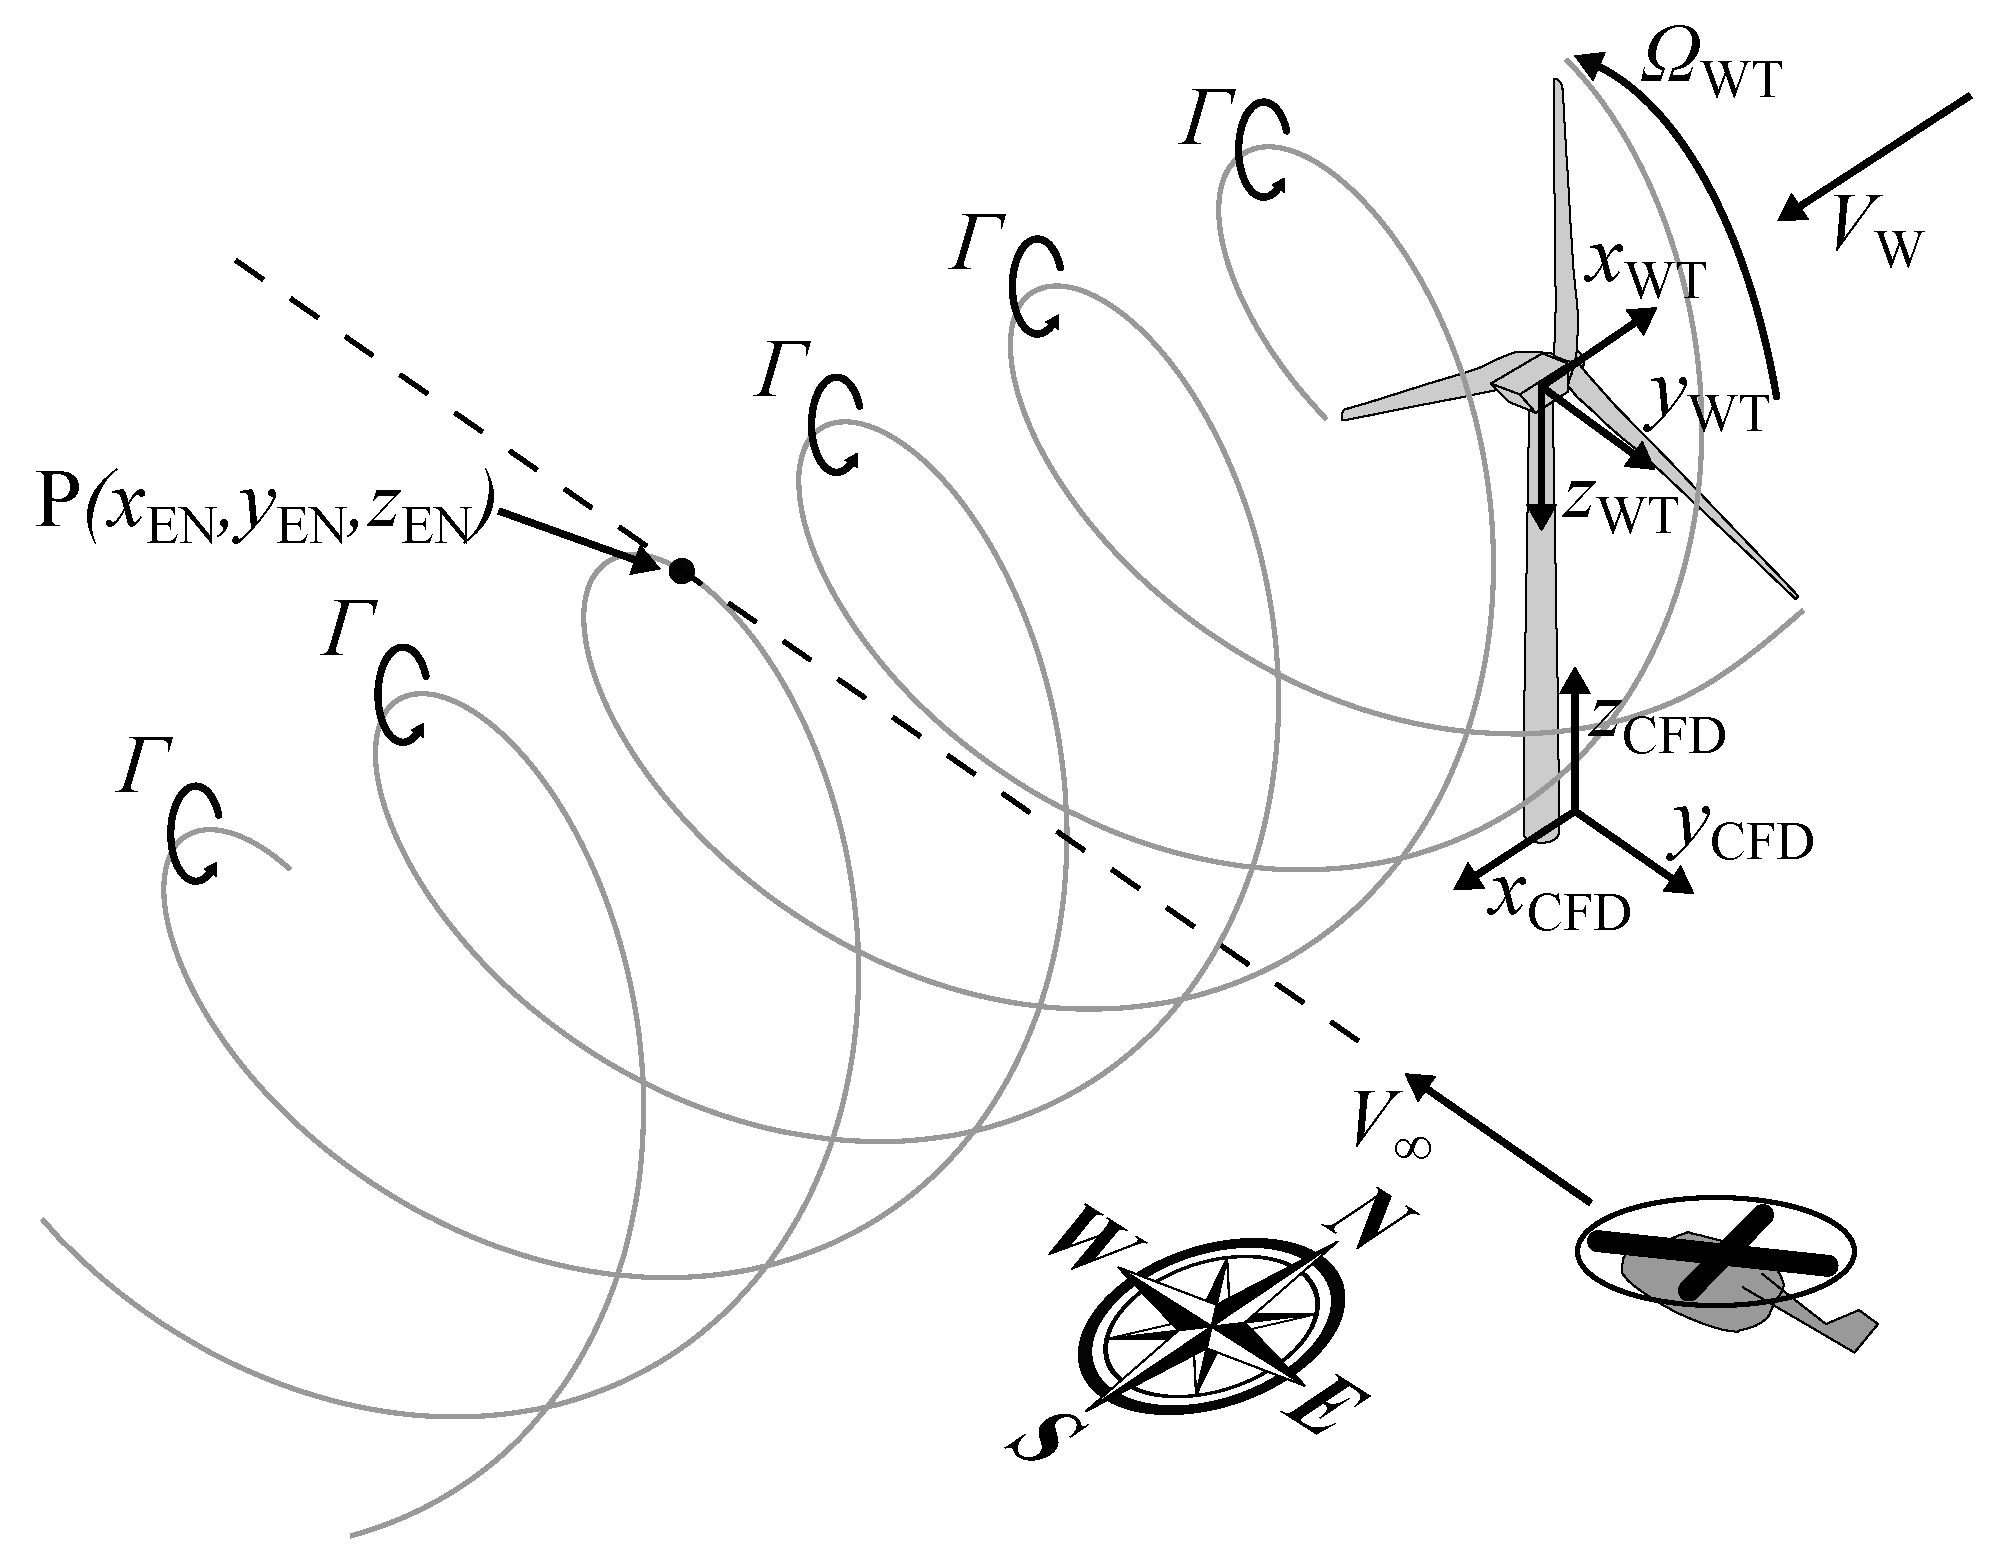
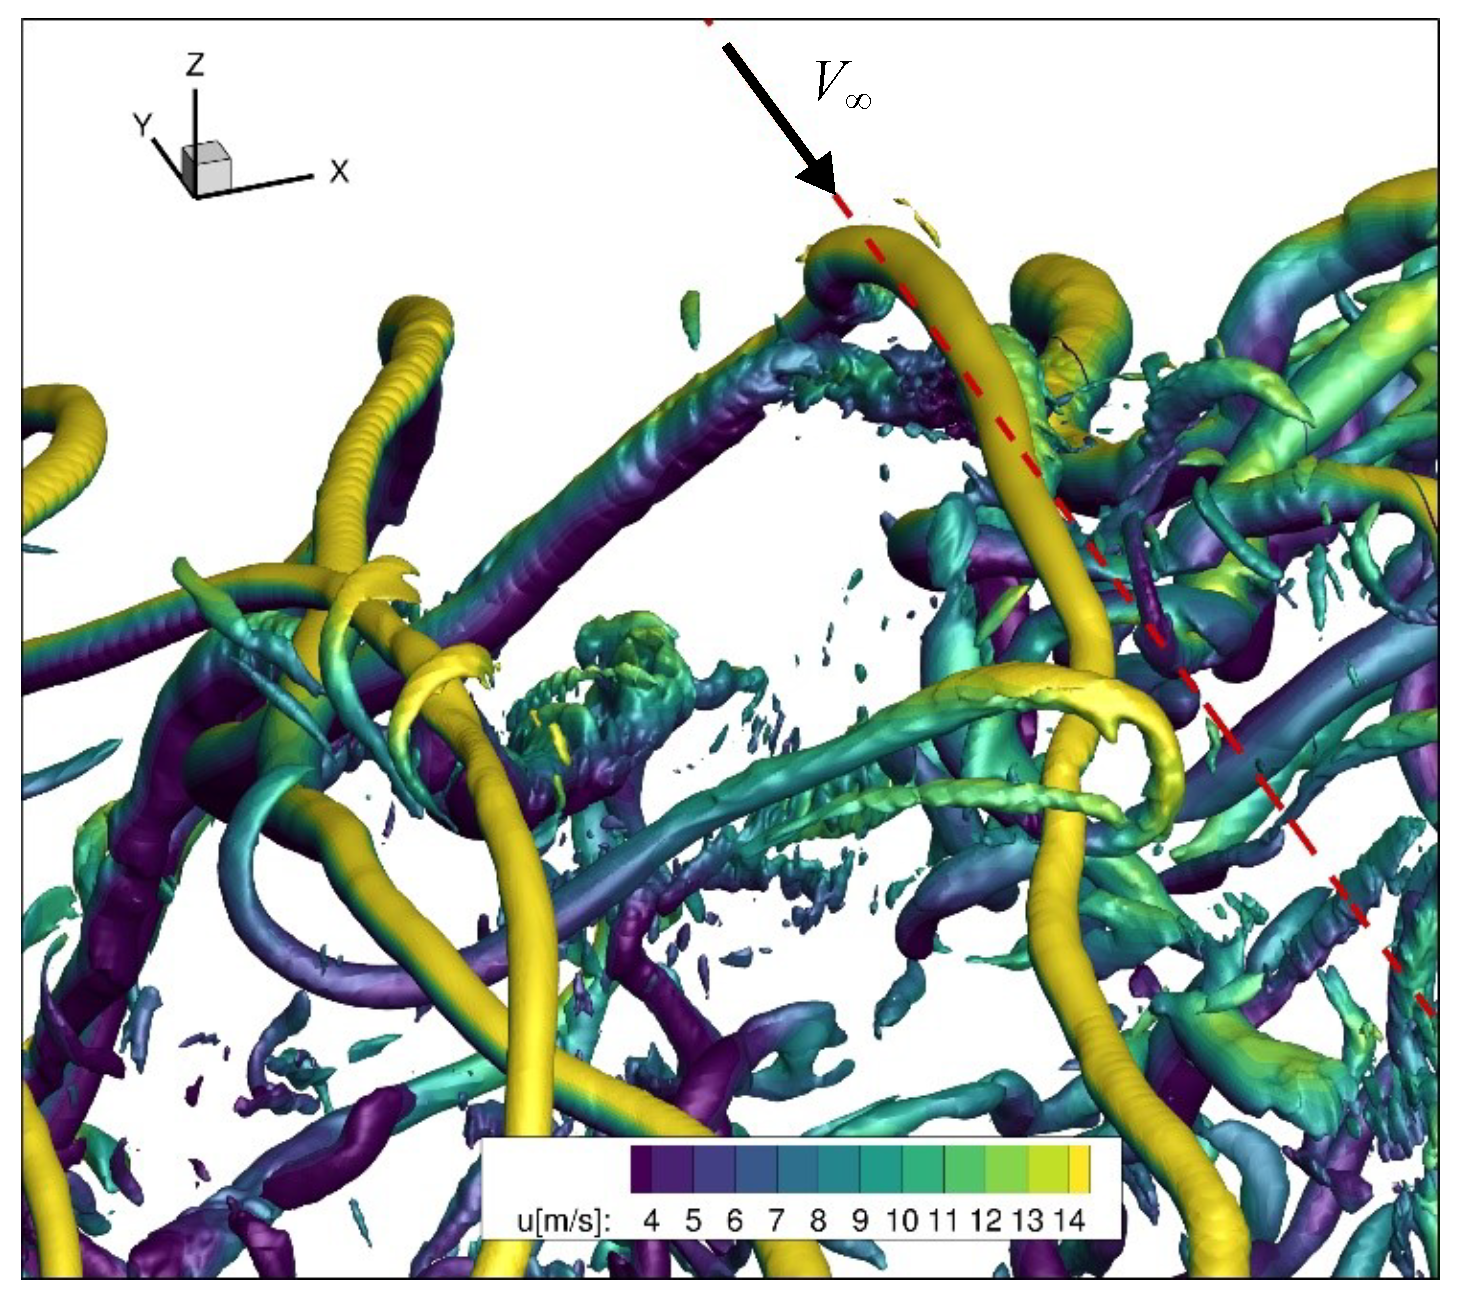
Operational Scenario 1 (OS-1) describes a transit flight in the flight corridor in proximity of rotating WTs (Figure 2) and was used to examine the size of the flight corridor (Figure 1a). A potential risk is the wake of rotating WTs, which is convected downstream by the wind and crosses the flight corridor. It contains a wind deficit surrounded by helical WT blade tip vortices, which are characterized by high velocity gradients. As depicted in Figure 2, the local vortex axis and the longitudinal helicopter axis can coincide, which causes so-called longitudinal vortex rotor interactions with primary excitation of the helicopter pitch axis [16]. For transit flights at WT hub height, so-called orthogonal vortex rotor interactions can occur [16].
Operational Scenario 2 (OS-2) describes a hover flight at a non-rotating WT (Figure 3) and was used to examine the lateral safety clearance at the helicopter hoist area (Figure 1b). It was derived from a typical helicopter hoist maneuver at an inoperative WT which needs to be maintained by engineers. The WT nacelle is perpendicular to the incoming wind V W . The WT rotor is stopped in the so-called “L-position”, resulting in one WT rotor blade facing horizontally into the incoming wind V W . In operational practice, this position is preferred by helicopter pilots, because it allows the helicopter to fly into a headwind and to use the WT rotor blade as a visual reference. During approach and hovering at the WT, the pilot is guided by a hoist operator via radio to the helicopter hoist position. The hoist operator is placed at the helicopter winch and estimates visually the distance to the hoist position. Potential risks during hover are the bluff-body wake of the WT nacelle, proximity to obstacles and wakes from neighboring WTs. Note that the WT and CFD coordinate system have changed compared to OS-1 (Figure 3).
The OS-2 is split into two subcases. The first subcase represents a hover flight at an isolated WT, which is not affected by surrounding WTs (Figure 3a). Therefore, the incoming wind V W represents typical maritime wind conditions without additional turbulence. This is typical for inoperative WTs at the edge of offshore wind farms. The second subcase represents a hover flight at a non-isolated WT, which is affected by surrounding WTs (Figure 3b). Therefore, the incoming wind V W contains the turbulent wake of one single rotating WT, which is typical for inoperative WTs within offshore wind farms.
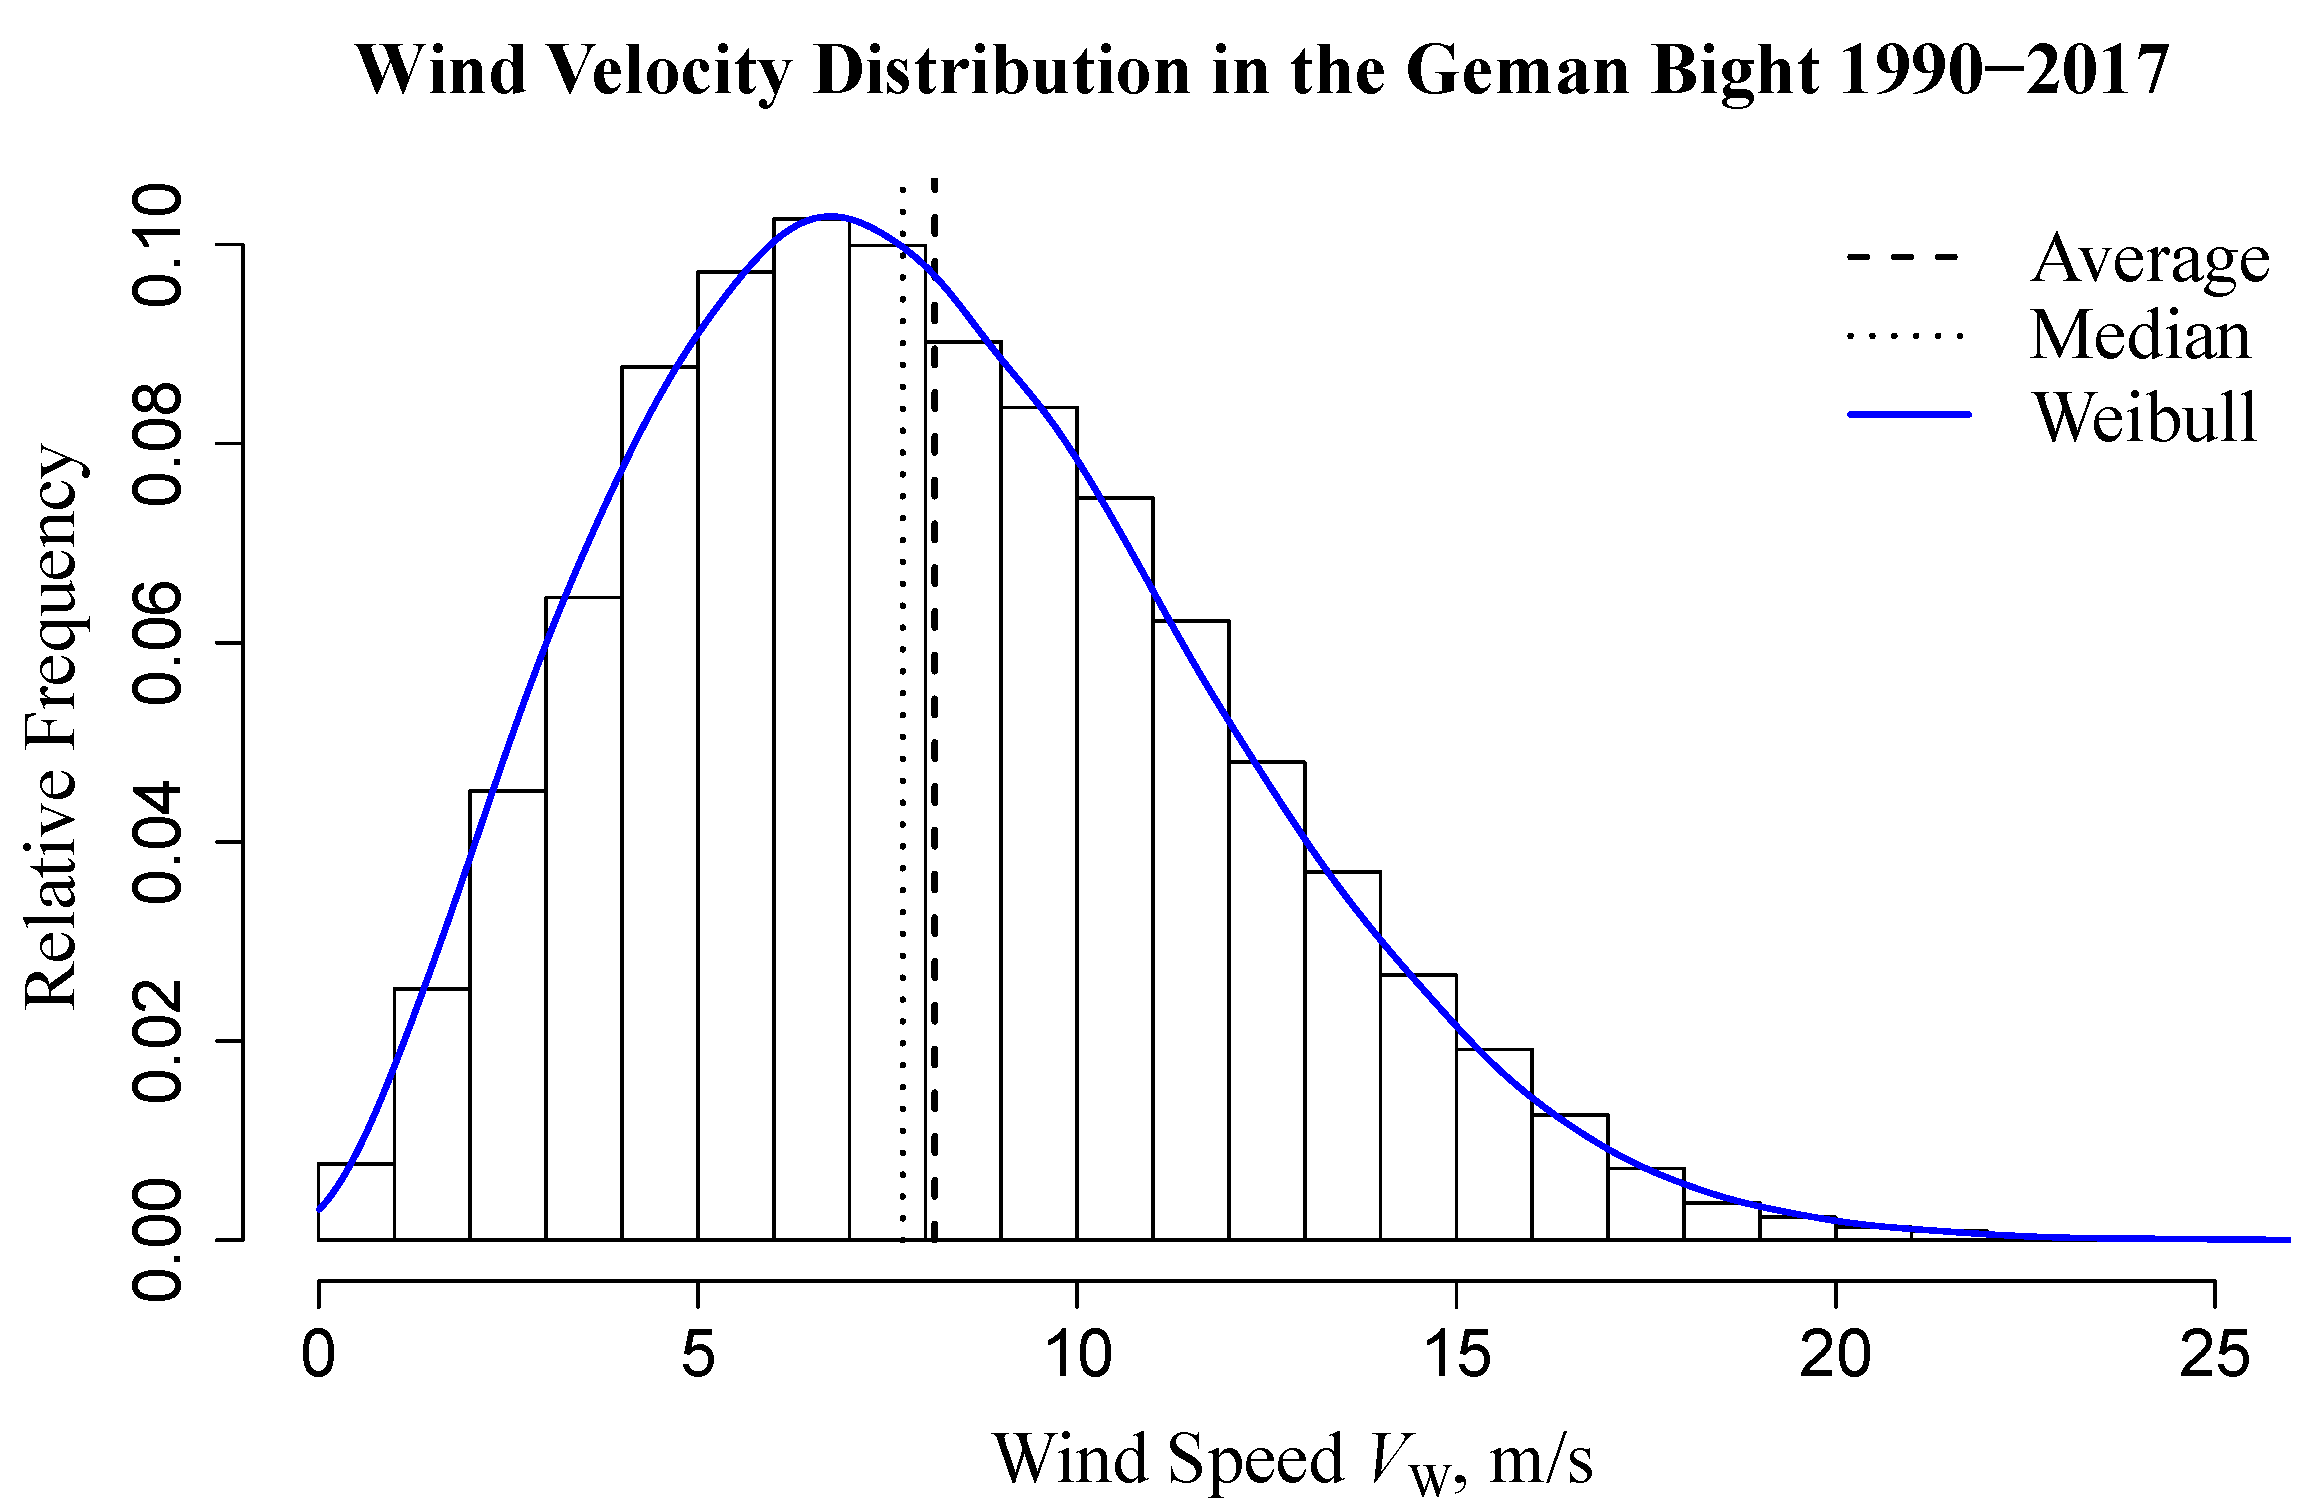
Two potentially critical wind speeds V W based on the OFFWINDTECH WT were chosen for OS-1 and OS-2. The OFFWINDTECH WT is a slightly modified version of the NREL 5 MW generic research WT [22] and resembles the real existing WTs in the offshore wind farm GTI. The first wind speed V W corresponds to the expected strong blade tip vortices. WTs reach the maximum initial blade tip vortex circulation Γ 0 in the region of the rated wind speed V W , Ω max [8], which is reached at a medium wind speed of V W = 11.3 m / s for the considered WT. The other potentially critical wind speed was chosen as V W = 25.0 m / s to represent extreme weather conditions. As helicopter hoist operations are performed until wind speeds V W between 18 21 m / s due to limitations of the wind farm operators, the cut-off wind speed of the considered WT of V W , max = 25.0 m / s was chosen as a conservative approach. Figure 4 shows the relative frequency of the wind speed V W at the German Bight. As indicated, the chosen wind speeds V W represent a common medium wind speed and a very high wind speed.
As a result, two cases for OS-1 and four cases for OS-2 have been derived. Each case needs specific WT wake flow fields obtained from CFD for the helicopter simulation, which depends on WT status (rotating, non-rotating), WT surrounding (isolated, non-isolated) and wind speed V W ( 11.3 m / s , 25.0 m / s ). A summary of the postprocessed airwake datasets is depicted in Table 1, each dataset being denoted with a name from C1 to C7. Note that based on C1, an additional airwake dataset, C3, was defined to examine the influences of the martime inflow data (Table 2) on the length and stability of the WT blade tip vortex helix, but was discarded beforehand and does not appear in Table 1. Furthermore, airwake dataset C6 was defined and scheduled for the piloted simulations, but was been examined due to time constraints.

4. Computational Fluid Dynamics

The WT wake flow fields were generated by performing time-resolved CFD computations on a high-performance computing cluster. Those were performed on structured meshes with local grid refinement and large spatial domains. In order to be processed in real-time by the helicopter flight simulator, this large amount of data had to be reduced to fit the simulator’s memory constraints. Therefore, small spatial areas of interest were extracted from the original CFD data and interpolated on an equidistant structured mesh without local grid refinement. Afterwards, the resulting postprocessed airwake data were used as a lookup table in the piloted simulation.
Table 1 shows an overview of the interpolated airwake data. OS-1 considers transit helicopter flights with an airspeed of V = 80 kt 41.2 m / s , which is much faster than the convection wind speed of the WT wake of V W = 10.3 m / s and V W = 25.0 m / s . Therefore, the temporal evolution of the WT wake was neglected, and only steady airwake data (time-independent) were used for this case. Consequently, benefits of the reduced memory consumption have been used for large spatial dimensions ( X WT , Y WT , Z WT ) with a fine spatial discretization ( Δ x WT , Δ y WT , Δ z WT ).
In contrast, the helicopter hover position remained the same for OS-2. Therefore, unsteady airwake data (time-dependent) had to be used with a temporal discretization Δ t WT and a duration T WT . For the unsteady airwake data, every 8th (C4) or every 12th (C5, C7) time step was extracted from the original WT wake flow field. A smooth time loop within the helicopter simulation was used for the airwake data to allow continuous simulations. As a consequence, spatial dimensions ( X WT , Y WT , Z WT ) were decreased and spatial discretization ( Δ x WT , Δ y WT , Δ z WT ) was coarsened compared to OS-1 due to memory consumption.
Furthermore, OS-1 and OS-2 have very different demands on the CFD methodology. OS-1 takes place at the far-wake of a rotating WT and is dependent on accurate fluid mechanical simulation of the WT blade tip vortices. In contrast, OS-2 takes place at the near-wake of a non-rotating WT and is dependent on accurate fluid mechanical simulation of the bluff-body aerodynamics associated with the flow around the nacelle.
All CFD flow fields around the WT were simulated with the finite volume flow solver FLOWer [24], which was originally developed by DLR and is continuously furthered by the University of Stuttgart for wind-energy applications. It is a block-structured solver, and the Chimera overlapping technique is used to connect the structured grids of the WT. Dual time-stepping and multigrid algorithms are applied to accelerate the numerical convergence. The 2nd order WENO scheme, the Jameson–Turkel–Schmidt (JST) scheme [25] or the 5th-order the WENO scheme [26] (spatial schemes) can be assigned block-wise in the computational domain to optimize computational time and resolution of vortical structures. The WENO scheme can better resolve the vortical structures and was thus applied in the regions of interest, except in the boundary layers regions where it was not applicable due to the high aspect ratio of the computational cells, and thus the JST scheme was applied instead.
The WT chosen for this study is the OFFWINDTECH WT, which was derived from the NREL 5 MW generic research WT and optimized for offshore conditions [27]. The main changes concern the rated operating point, with an inflow wind speed and rotational speed as defined below, and a blade pitch angle of 2 . 29 . It strongly resembles the real existing WTs in the offshore wind farm GTI. It features a rotor diameter of D WT = 126 m and a rotational frequency of f WT = 11.7 1 / min at the rated wind speed of V W , Ω max = 11.3 m / s .

4.1. Rotating WT

In this section, the computational setup and resulting flow fields of OS-1 are presented, which were postprocessed afterwards to airwake data C1 and C2 (Table 1).

4.1.1. CFD Setup

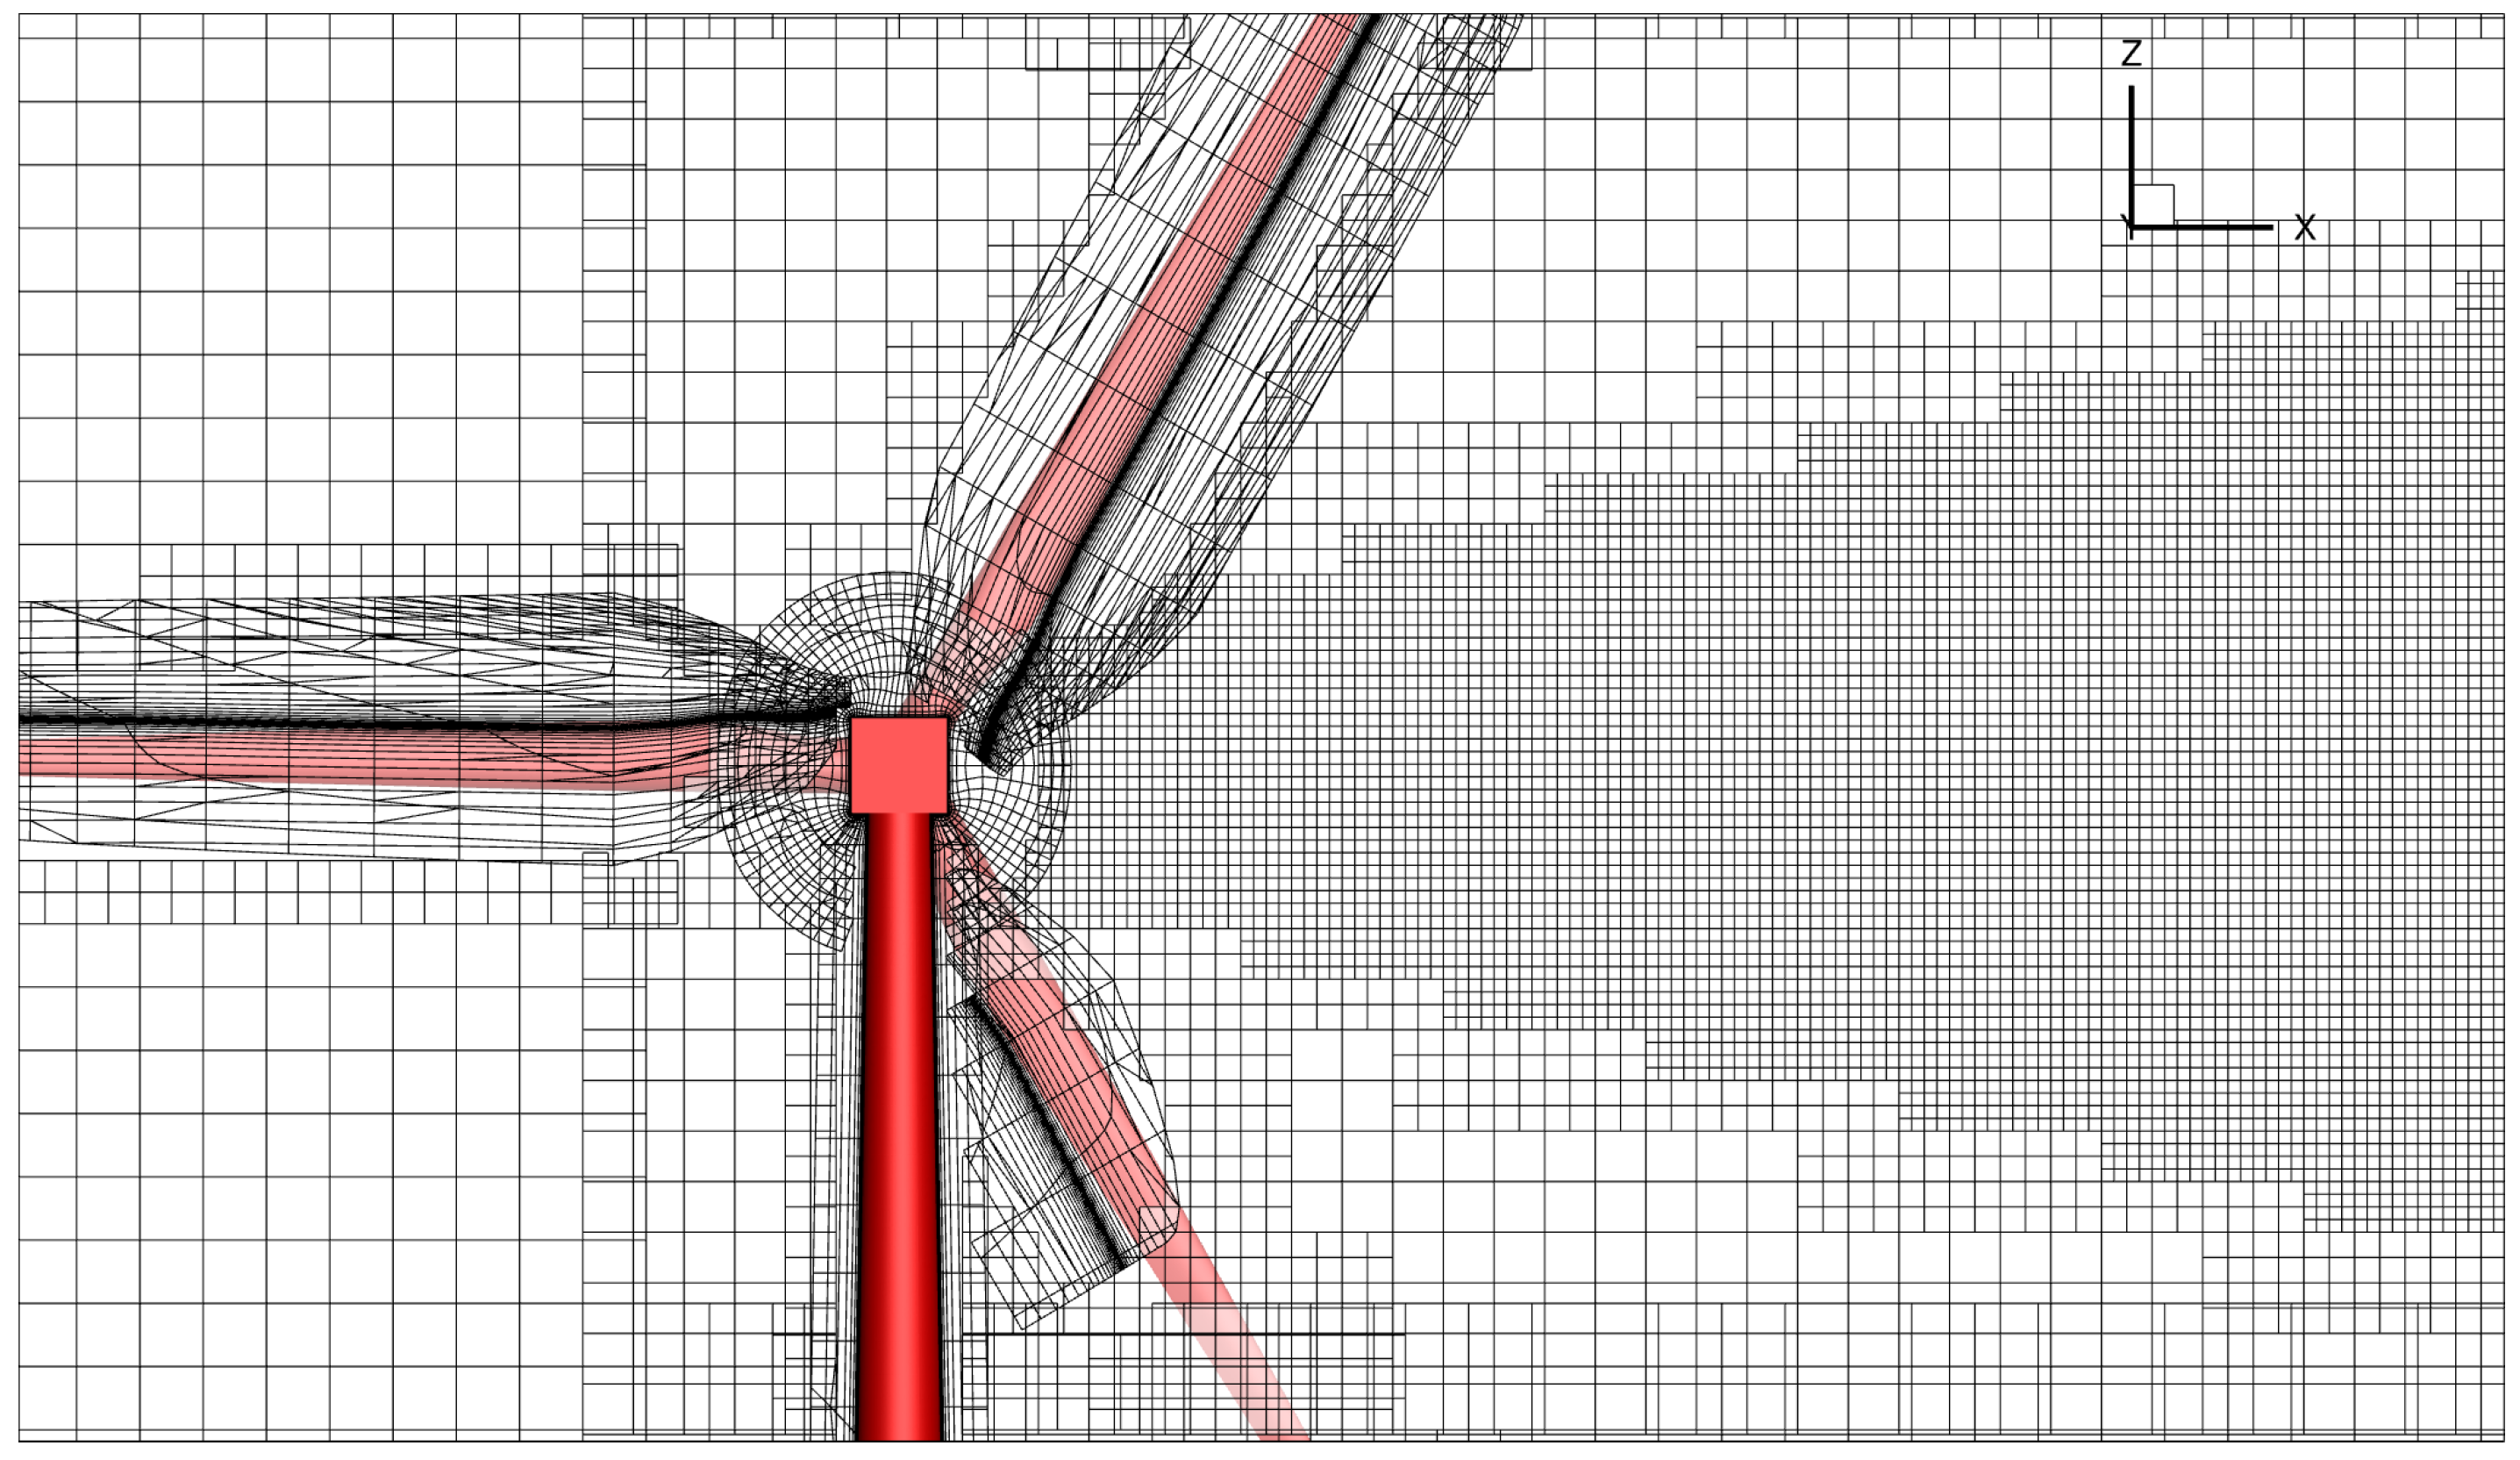
As OS-1 depends on the accurate reproduction of the dynamics of the blade tip vortices downstream of the WT, the computational demands regarding spatial resolution and transport of the vortex are relatively high. The grid requirements for the reproduction of measured viscous vortex cores in CFD simulations with FLOWer were examined in [3]. In this study, good agreement between CFD results and UAV-based in situ measurements of the blade tip vortex characteristics downstream of a full-size commercial WT was found on the fine-resolved blade tip vortex grid. Based on these findings, the grid requirement in the wake of the considered WT was estimated to Δ x CFD = 0.125 m in the blade tip vortex region, taking into account geometrical scaling between the two WTs. The refined area around the blade tip vortices, which positions were determined based on a precursor simulation, is visualized in Figure 5.
For the present study, the detailed aerodynamics of the rotor itself are of little relevance, and only the effects of tower and nacelle that have a footprint in the near-wake of the WT and in the lower part of the wake are detailed. Thus, the actuator line approach (ACL) was used to model the WT, which has proven to appropriately model the wake dynamics [28,29]. Moreover, it allows one to save computational cells in the rotor area, which can then be reinvested in the wake region. Ninety-nine actuator line elements were introduced along the blade, with a higher density at the blade tip and root region. The same polar data were used as in [2] and were generated with Xfoil. The size of the ACL regularization kernel ϵ was set proportionally to the local airfoil chord length c WT , ϵ = 0.25 c WT , according to [30]. Moreover, the well-established numerical stability criterion ϵ 2 Δ x CFD [31] was fulfilled at every point.
Synthetic inflow data were used to recreate the turbulent inflow representative of offshore conditions in the computational setup at the wind speed at hub height of V W = 11.3 m / s and V W = 25.0 m/s. The mean vertical wind profile was generated via the power law with the exponent α = 0.14 , which is representative of maritime conditions [32], and was imposed at the inlet via a Dirichlet boundary condition. Synthetic turbulent fluctuations were superposed onto this mean profile and modeled via the so-called Mann–Box approach [33], whereby they are added as volume forces downstream of the inlet plane. The turbulence statistics used as input parameters in the model were extracted from the literature data at the hub height z HUB = 90 m and are gathered in Table 2. The turbulence intensity (I) and integral length scale (L) were determined based on the large database contained in [34], except for I = 6.84 % at V W = 25.0 m / s , which was extracted from the FINO1 Offshore measurement campaign [32]. No thermal stratification effects are considered in the present study.
Far-field boundary conditions were applied at the outlet, the top and the lateral boundaries of the computational domain, and a non-slip wall was placed at the bottom. At the inlet, the mean wind velocity profile was imposed, and turbulence fluctuations were added downstream of the inlet plane as volume forces. Hanging grid nodes allowed local Cartesian grid refinement for the transport of the inflow turbulence and the capture of the wake dynamics, which extended from inlet to 9 rotor diameters D WT downstream of the WT with a resolution of Δ x CFD = 1 m . In addition, the blade tip vortex and rotor area were refined using additional structured meshes, as represented in Figure 5. The grid resolution in the rotor area and blade tip vortex region was Δ x CFD = 0.125 m , with intermediate resolutions to ensure a smooth transition to the wake refinement region. The whole computational setup consisted of about 461 Mio . cells.

4.1.2. CFD Analysis

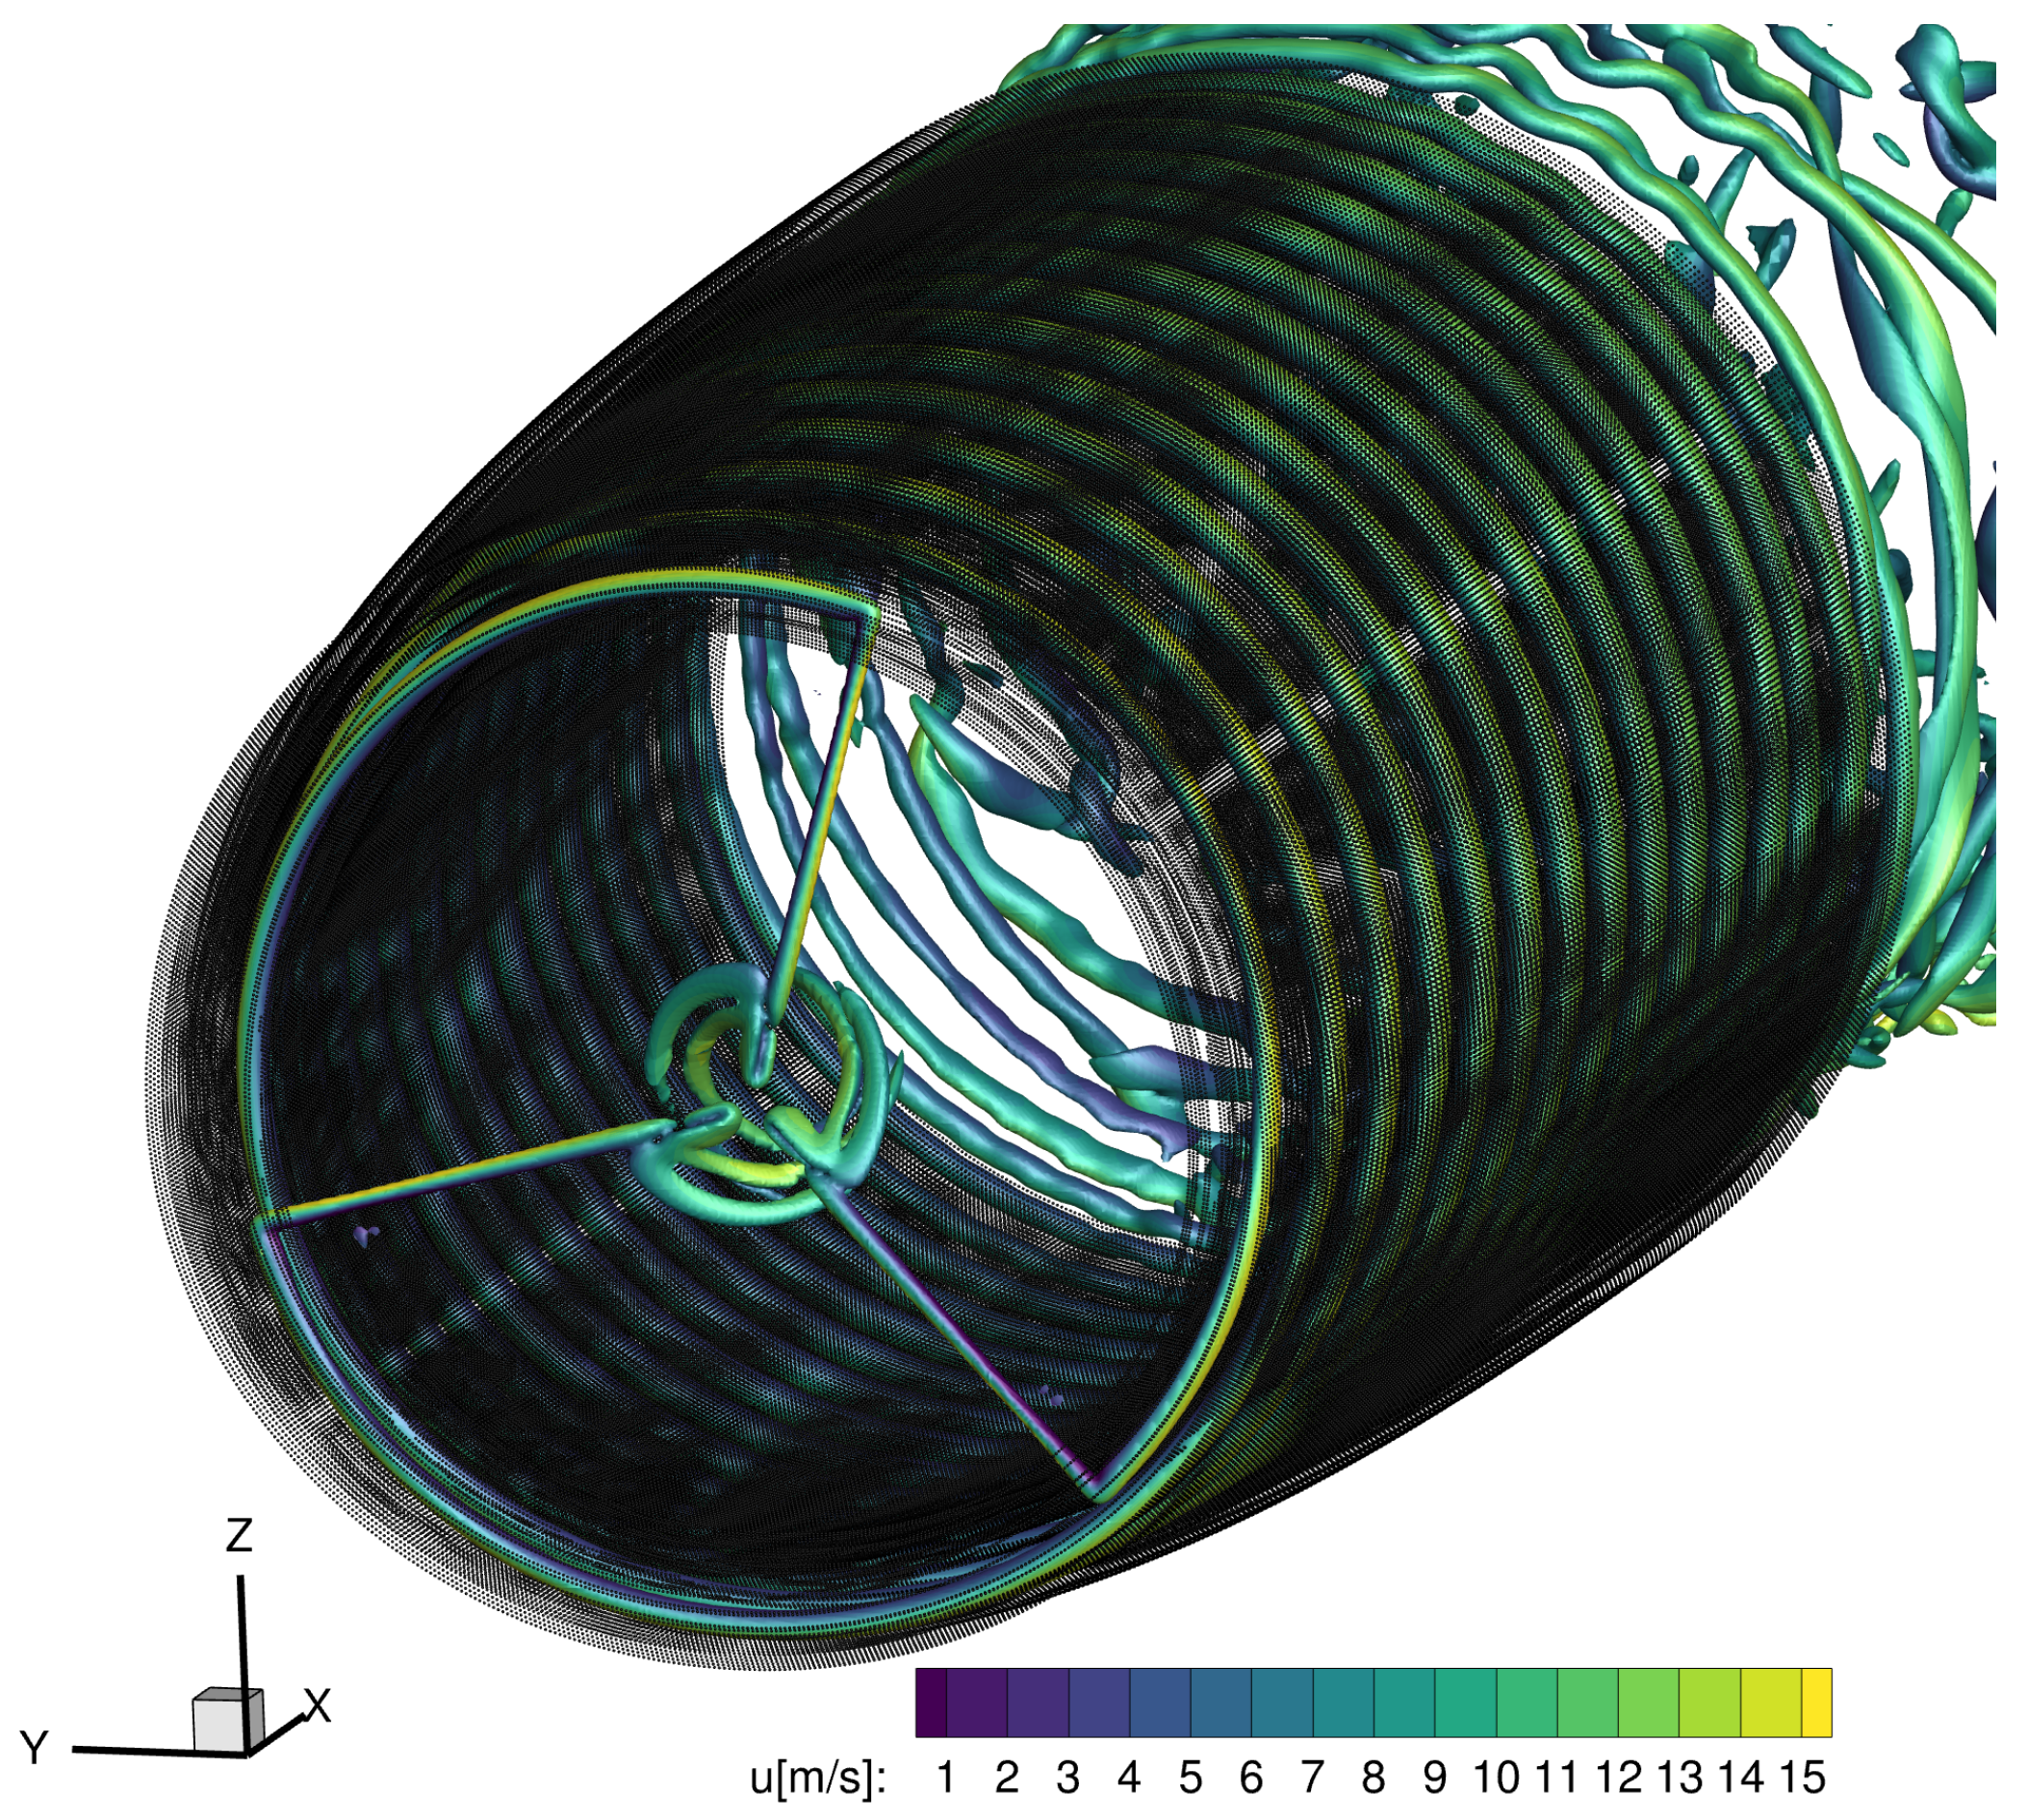
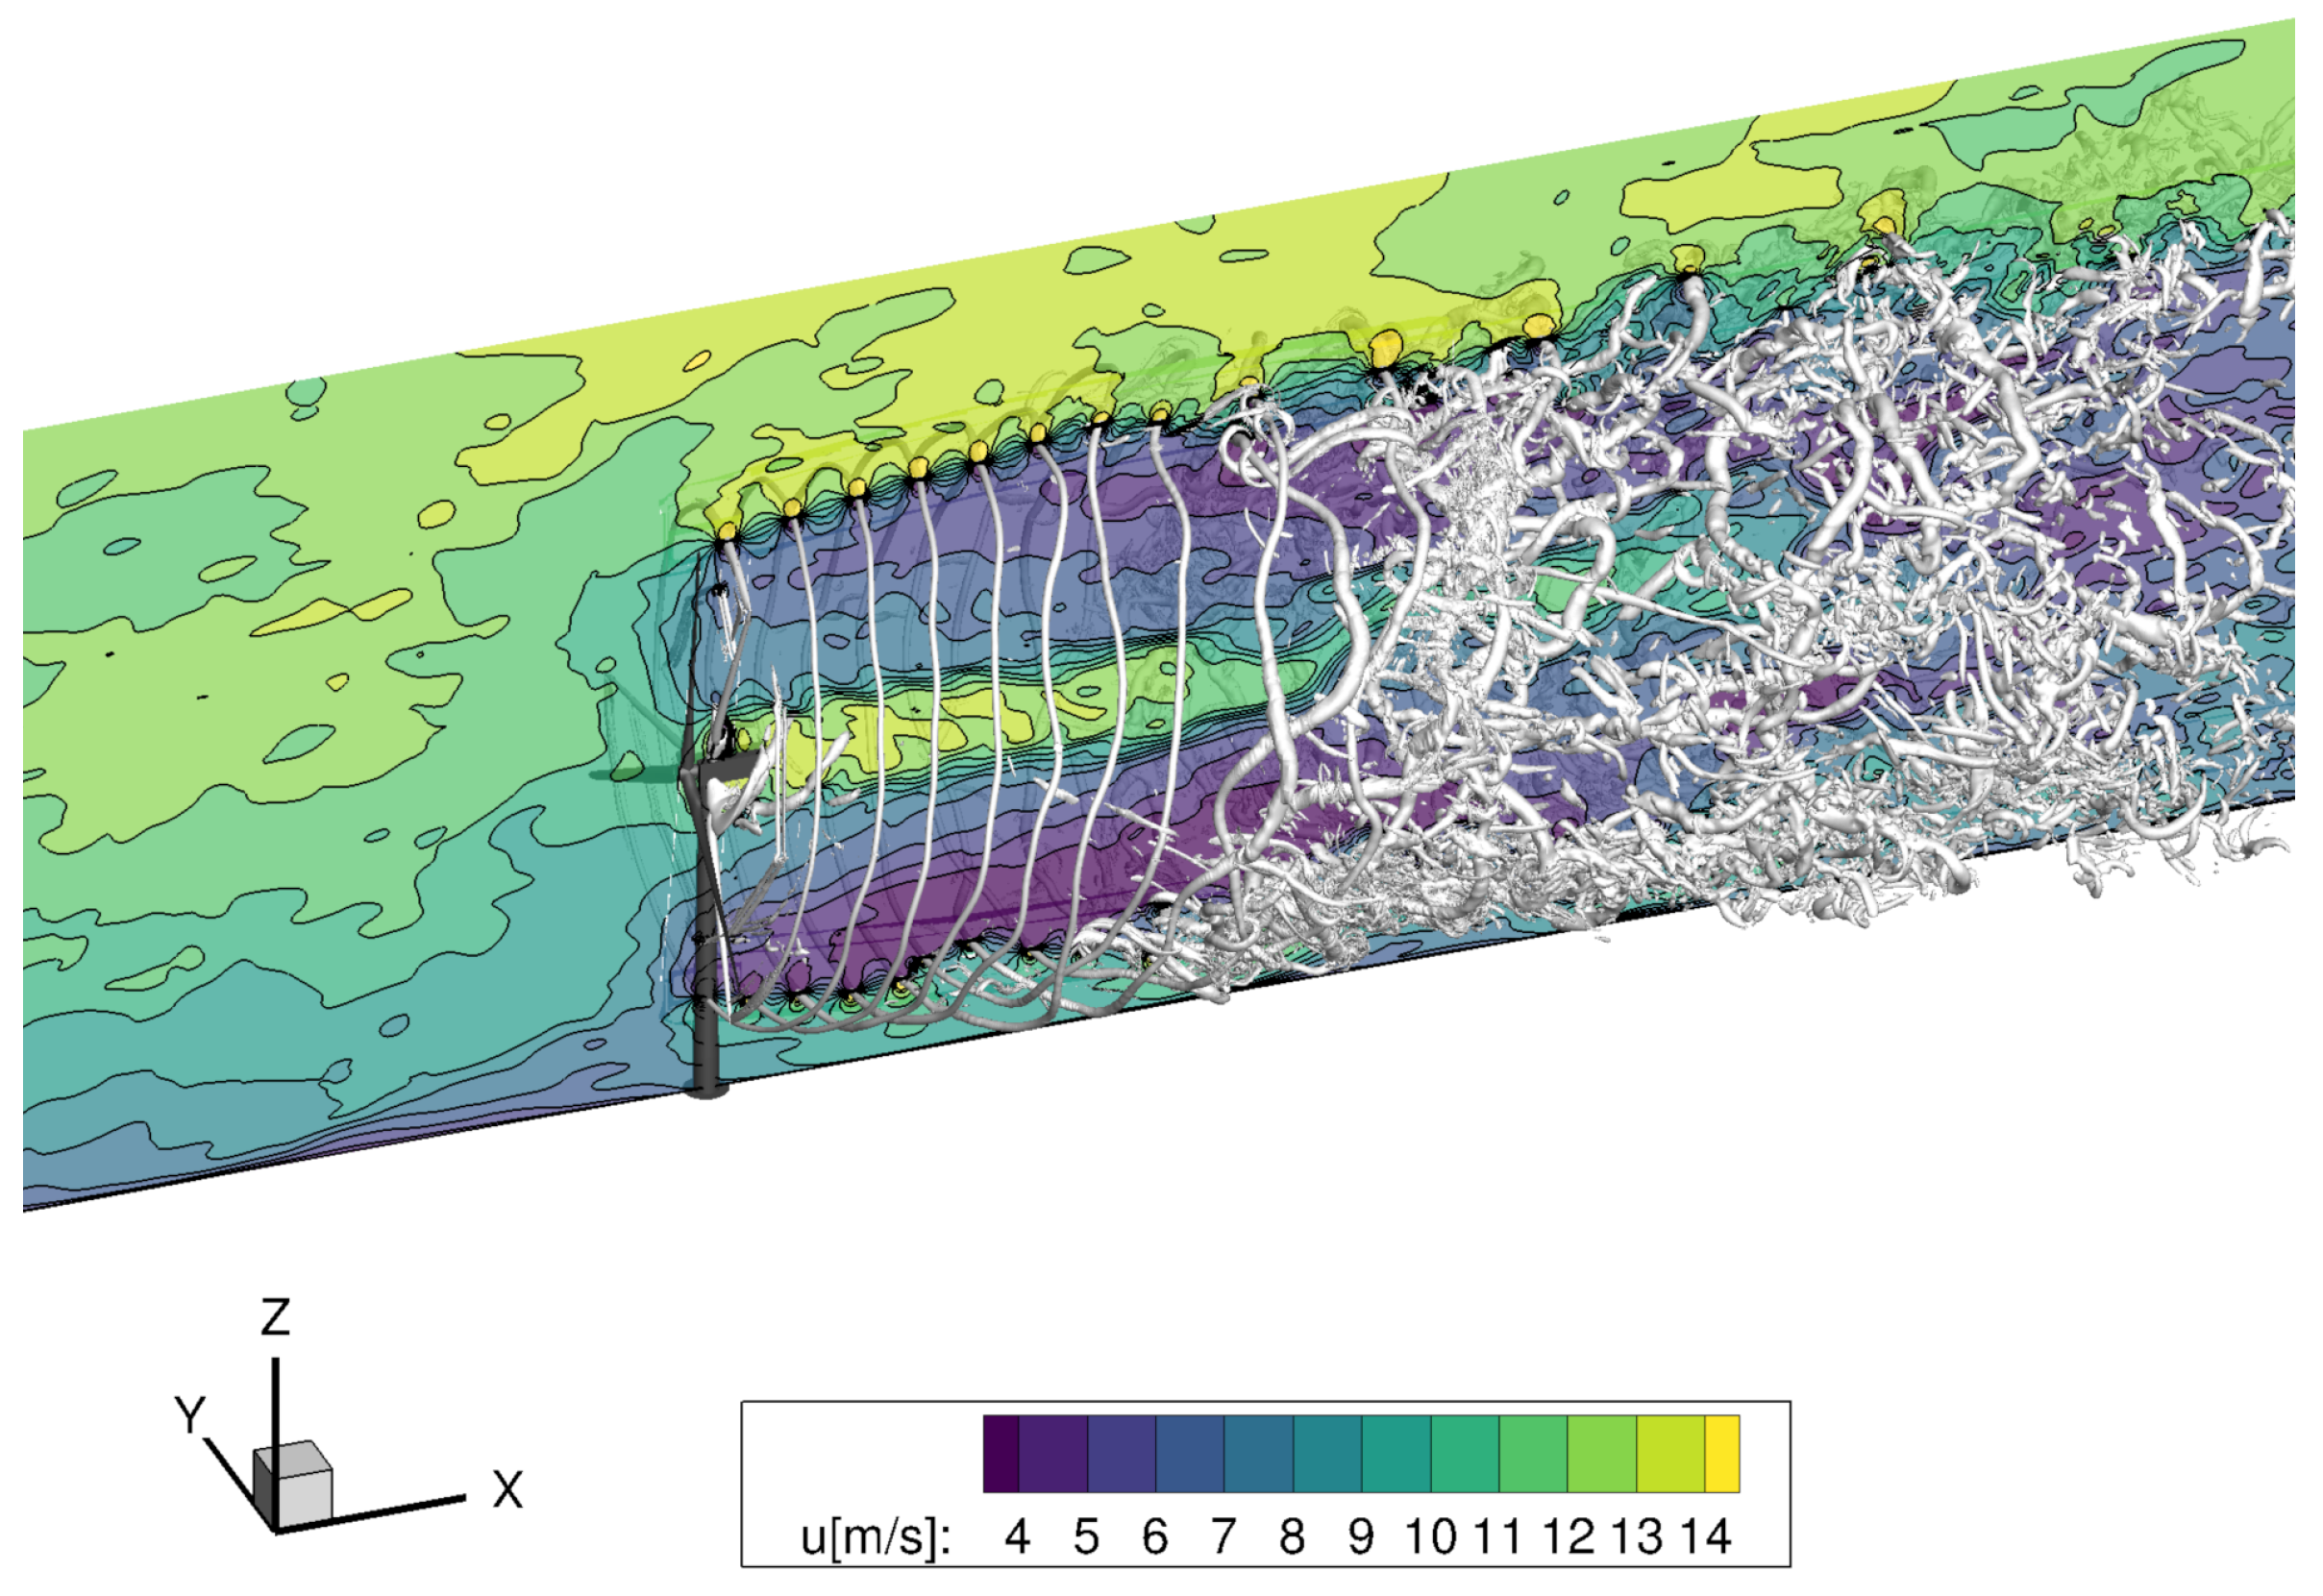
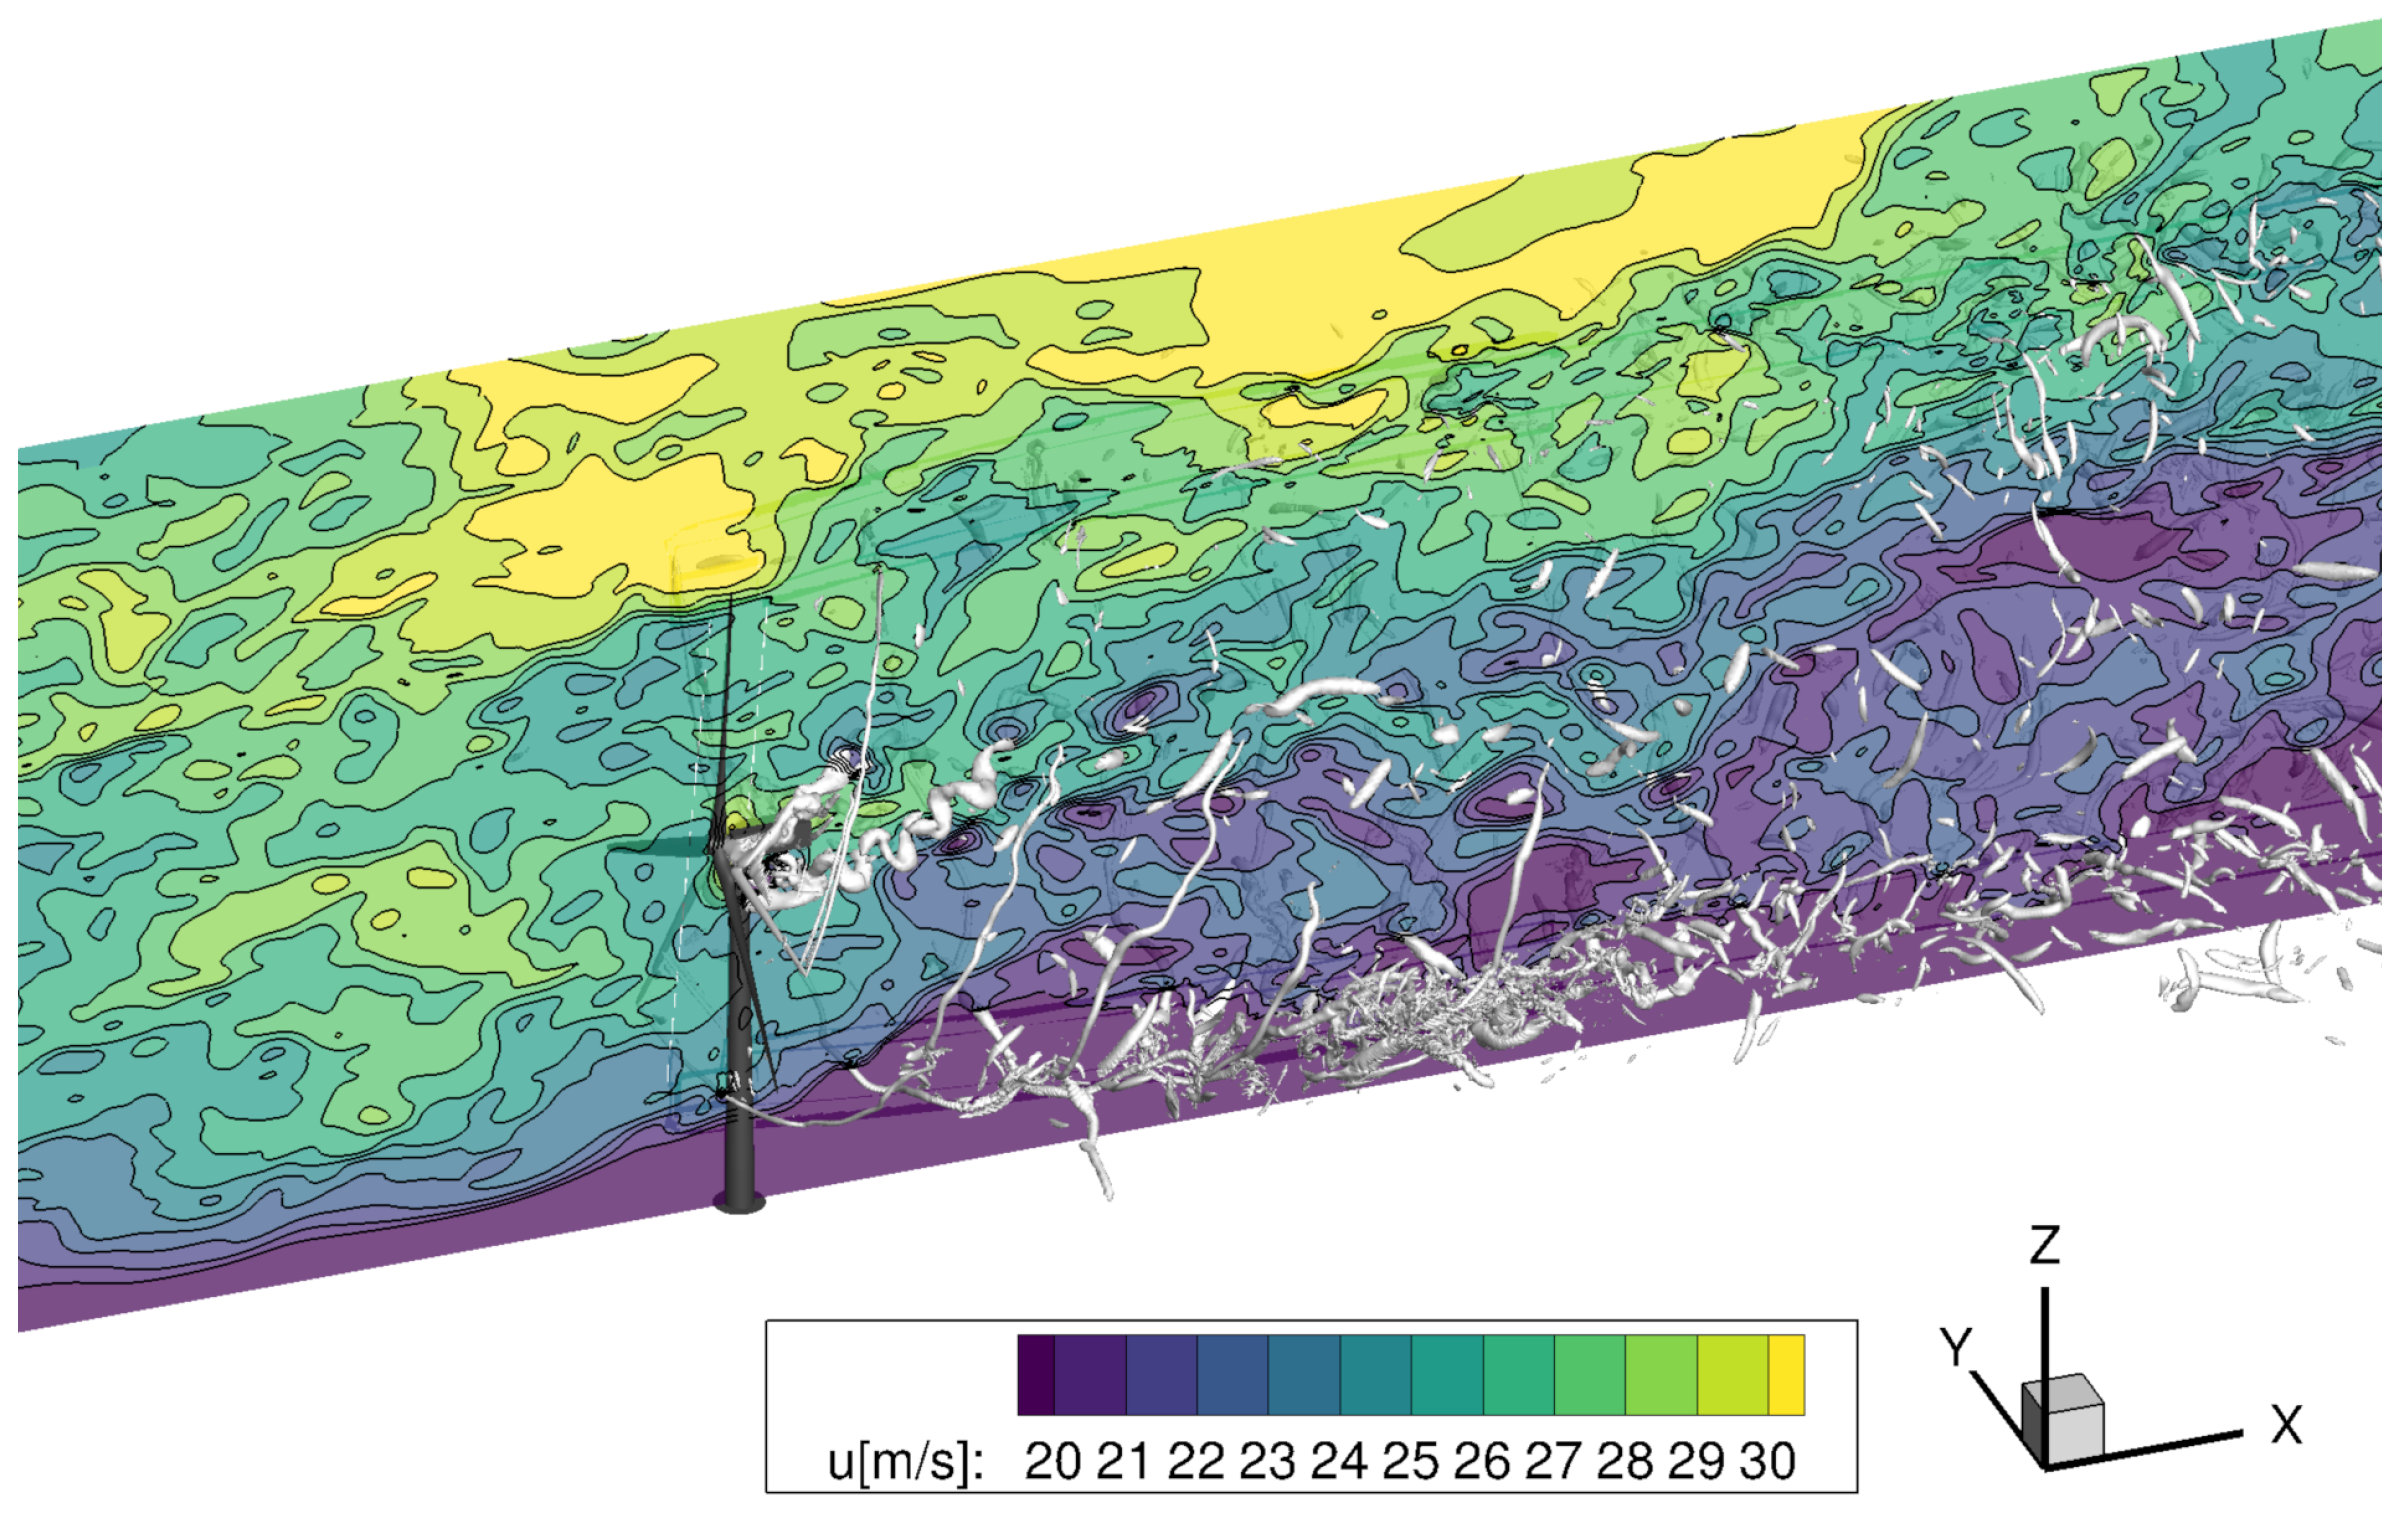
Figure 6 and Figure 7 show snapshots of the streamwise velocity distribution and the vortical structures downstream of the WT. In Figure 6, the wake velocity deficit associated with the high induction at this operating point creates a shear layer at the wake boundary. The clearly defined blade tip vortex helix in the near-wake region prevents the turbulent mixing in the wake, which sets on after the blade tip vortices begin to breakdown. In Figure 7, no such distinct shear layer can be distinguished between the wake and the ambient turbulent flow. Less distinct blade tip vortices can be observed, as they breakdown close downstream of the rotor due to interactions with the atmospheric turbulence.
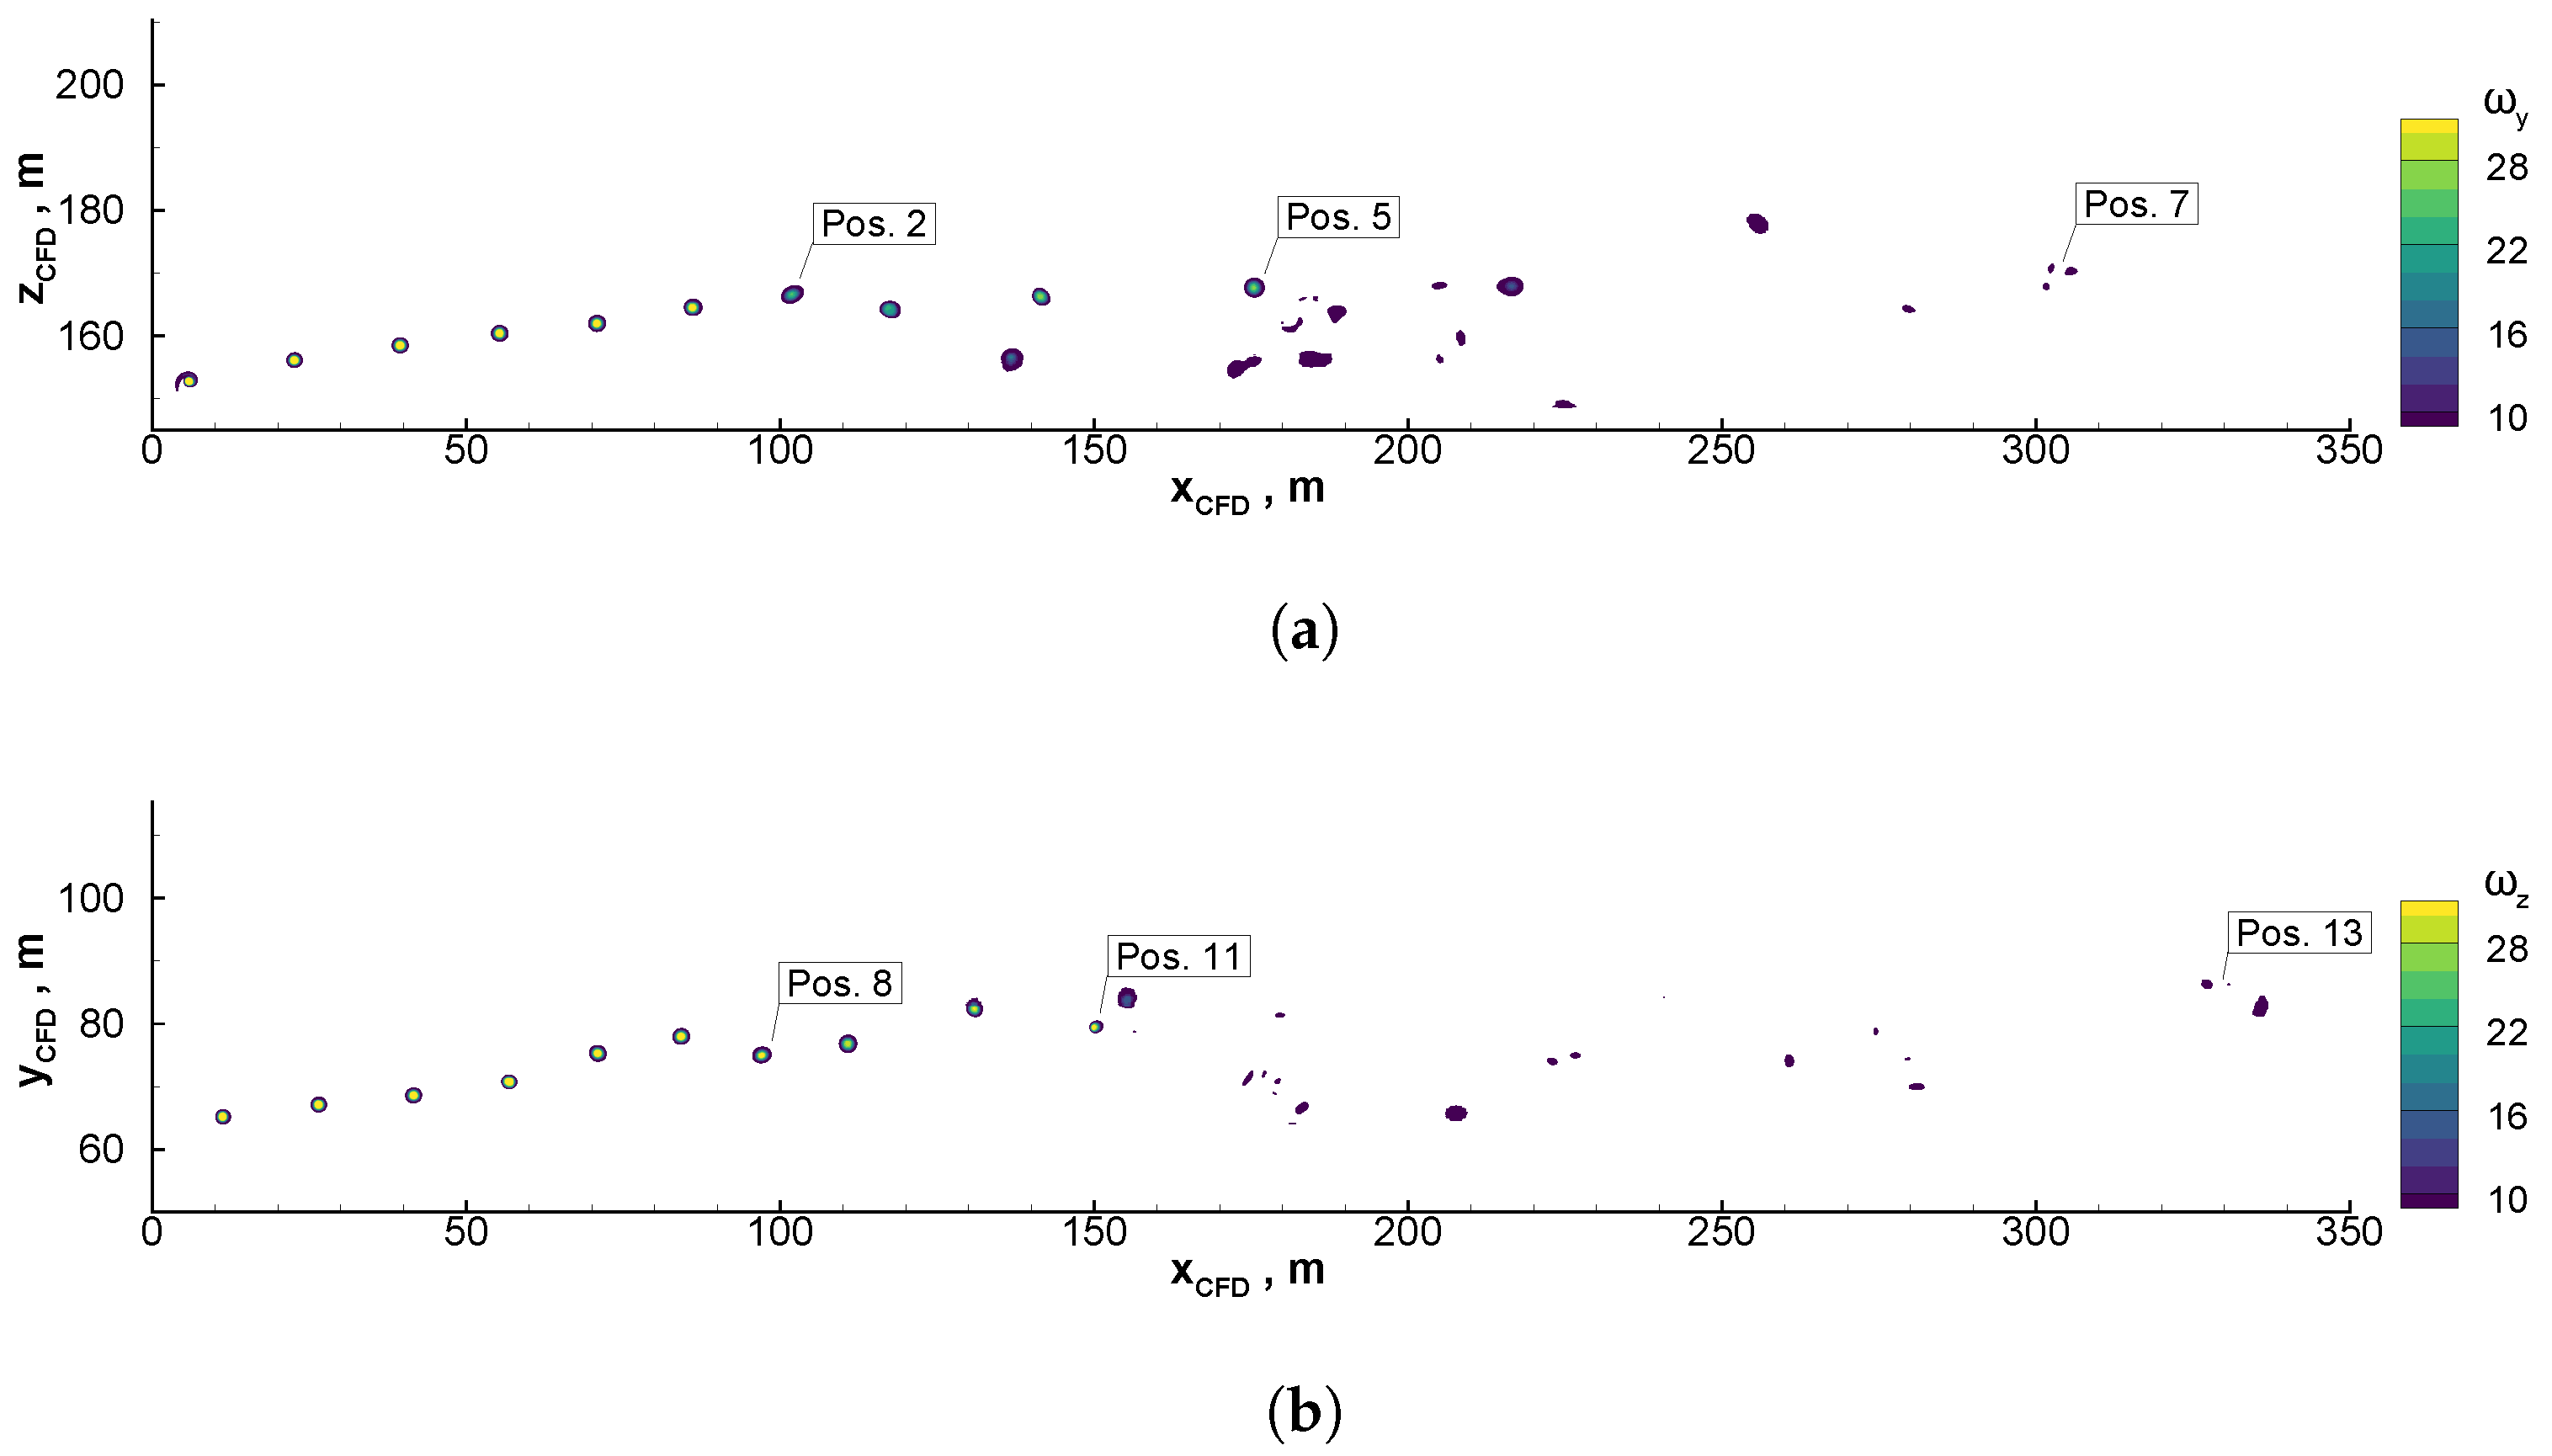
For the following piloted simulations, blade tip vortices from Figure 6 were selected for the simulation of helicopter vortex encounters and are summarized in Table 3. Close, medium and far distances from the WT were chosen to represent vortex encounters at different positions x EN of the flight corridor. The far distance corresponds approximately to the center of the flight corridor (Figure 1a). The selected blade tip vortices were located at the upper boundary of the WT (longitudinal vortex rotor interaction) and at the WT hub height (orthogonal vortex rotor interaction). Note that the blade tip vortices for the wind speed of V W = 25.0 m / s decayed rapidly (Figure 7) and could not be identified over such a far range as in C1. Therefore, the same vortex encountering positions were chosen for C2, and the severity of the stochastic non-directional turbulence was examined.
The blade tip vortex position x EN corresponds to the local maximum of vorticity, and the blade tip vortex core radius R c is the distance between the core center and the local maximal tangential speed V c . The blade tip vortex circulation Γ is the integral of the out-of-plane vorticity over a circular area around the vortex center. It shall be mentioned that at position 13 no vortex parameters could be determined, as no clear helical vortex structure could be identified, only an area of globally higher vorticity. In the WT near-wake and in ideal uniform inflow conditions, the strength of the blade tip vortices slowly decayed, and their radii increased as they were convected downstream of the WT, due to diffusivity effects. Here, however, we can observe higher circulation at position 5 than at position 7, which was located further downstream. This was due to the merging of the blade tip vortices at this position, leading to a larger region of high vorticity, a mechanism already reported in [35]. The merging process is visible in Figure 8 through an increase in both the vorticity and the distance between the neighbouring vortex cores.

4.2. Non-Rotating WT

In this section, the computational setup and resulting flow fields of OS-2 are presented, which were postprocessed afterwards to airwake data C4, C5 and C7 (Table 1).

4.2.1. CFD Setup

In order to capture the unsteady features of the flow separation in the wake of the nacelle, scale resolving DES methods (Detached-Eddy Simulation) were required. The Menter shear-stress transport (SST) k ω model [36] was used for turbulence modeling, and the 5th-order WENO spatial scheme was applied in the wake in order to reduce the numerical dissipation of vortices [26]. For numerical stability reasons, the 2nd-order Jameson–Schmidt–Turkel spatial scheme was used in the boundary-layer-resolving grids around the WT geometry, as mentioned in the previous section. Isotropic local mesh refinement with a cell size of Δ x CFD = 0.2 m was used in the wake of the nacelle, in order to cover all relevant flow dynamics in the flight region of the helicopter. All boundary layers of the WT geometry were resolved so that the dimensionless wall distance satisfied y + 1 . It shall be noted that for the considered WT, the nacelle geometry was approximated as a simple rectangular solid. The whole setup consisted of approximately 115 Mio . cells and is represented on Figure 9. The computational domain extended upstream, laterally, vertically and downstream of the WT, respectively, by 360 m , 350 m , 640 m and 340 m . The same boundary conditions were used at the inlet as for cases C1 and C2; see Table 2. Periodic boundary conditions were used laterally. A far-field boundary condition was used at the top and outlet, and a non-slip condition was imposed at the bottom.
For the WT wake flow fields C4 and C5, the same inflow data were used as in the OS-1. In order to take into account the influence of another rotating WT located upstream for the WT wake flow field C7, one further simulation at the wind speed of V W = 25.0 m / s was performed. The upstream WT was simulated with the ACL method with the same turbulent inflow as in the OS-1.

4.2.2. CFD Analysis

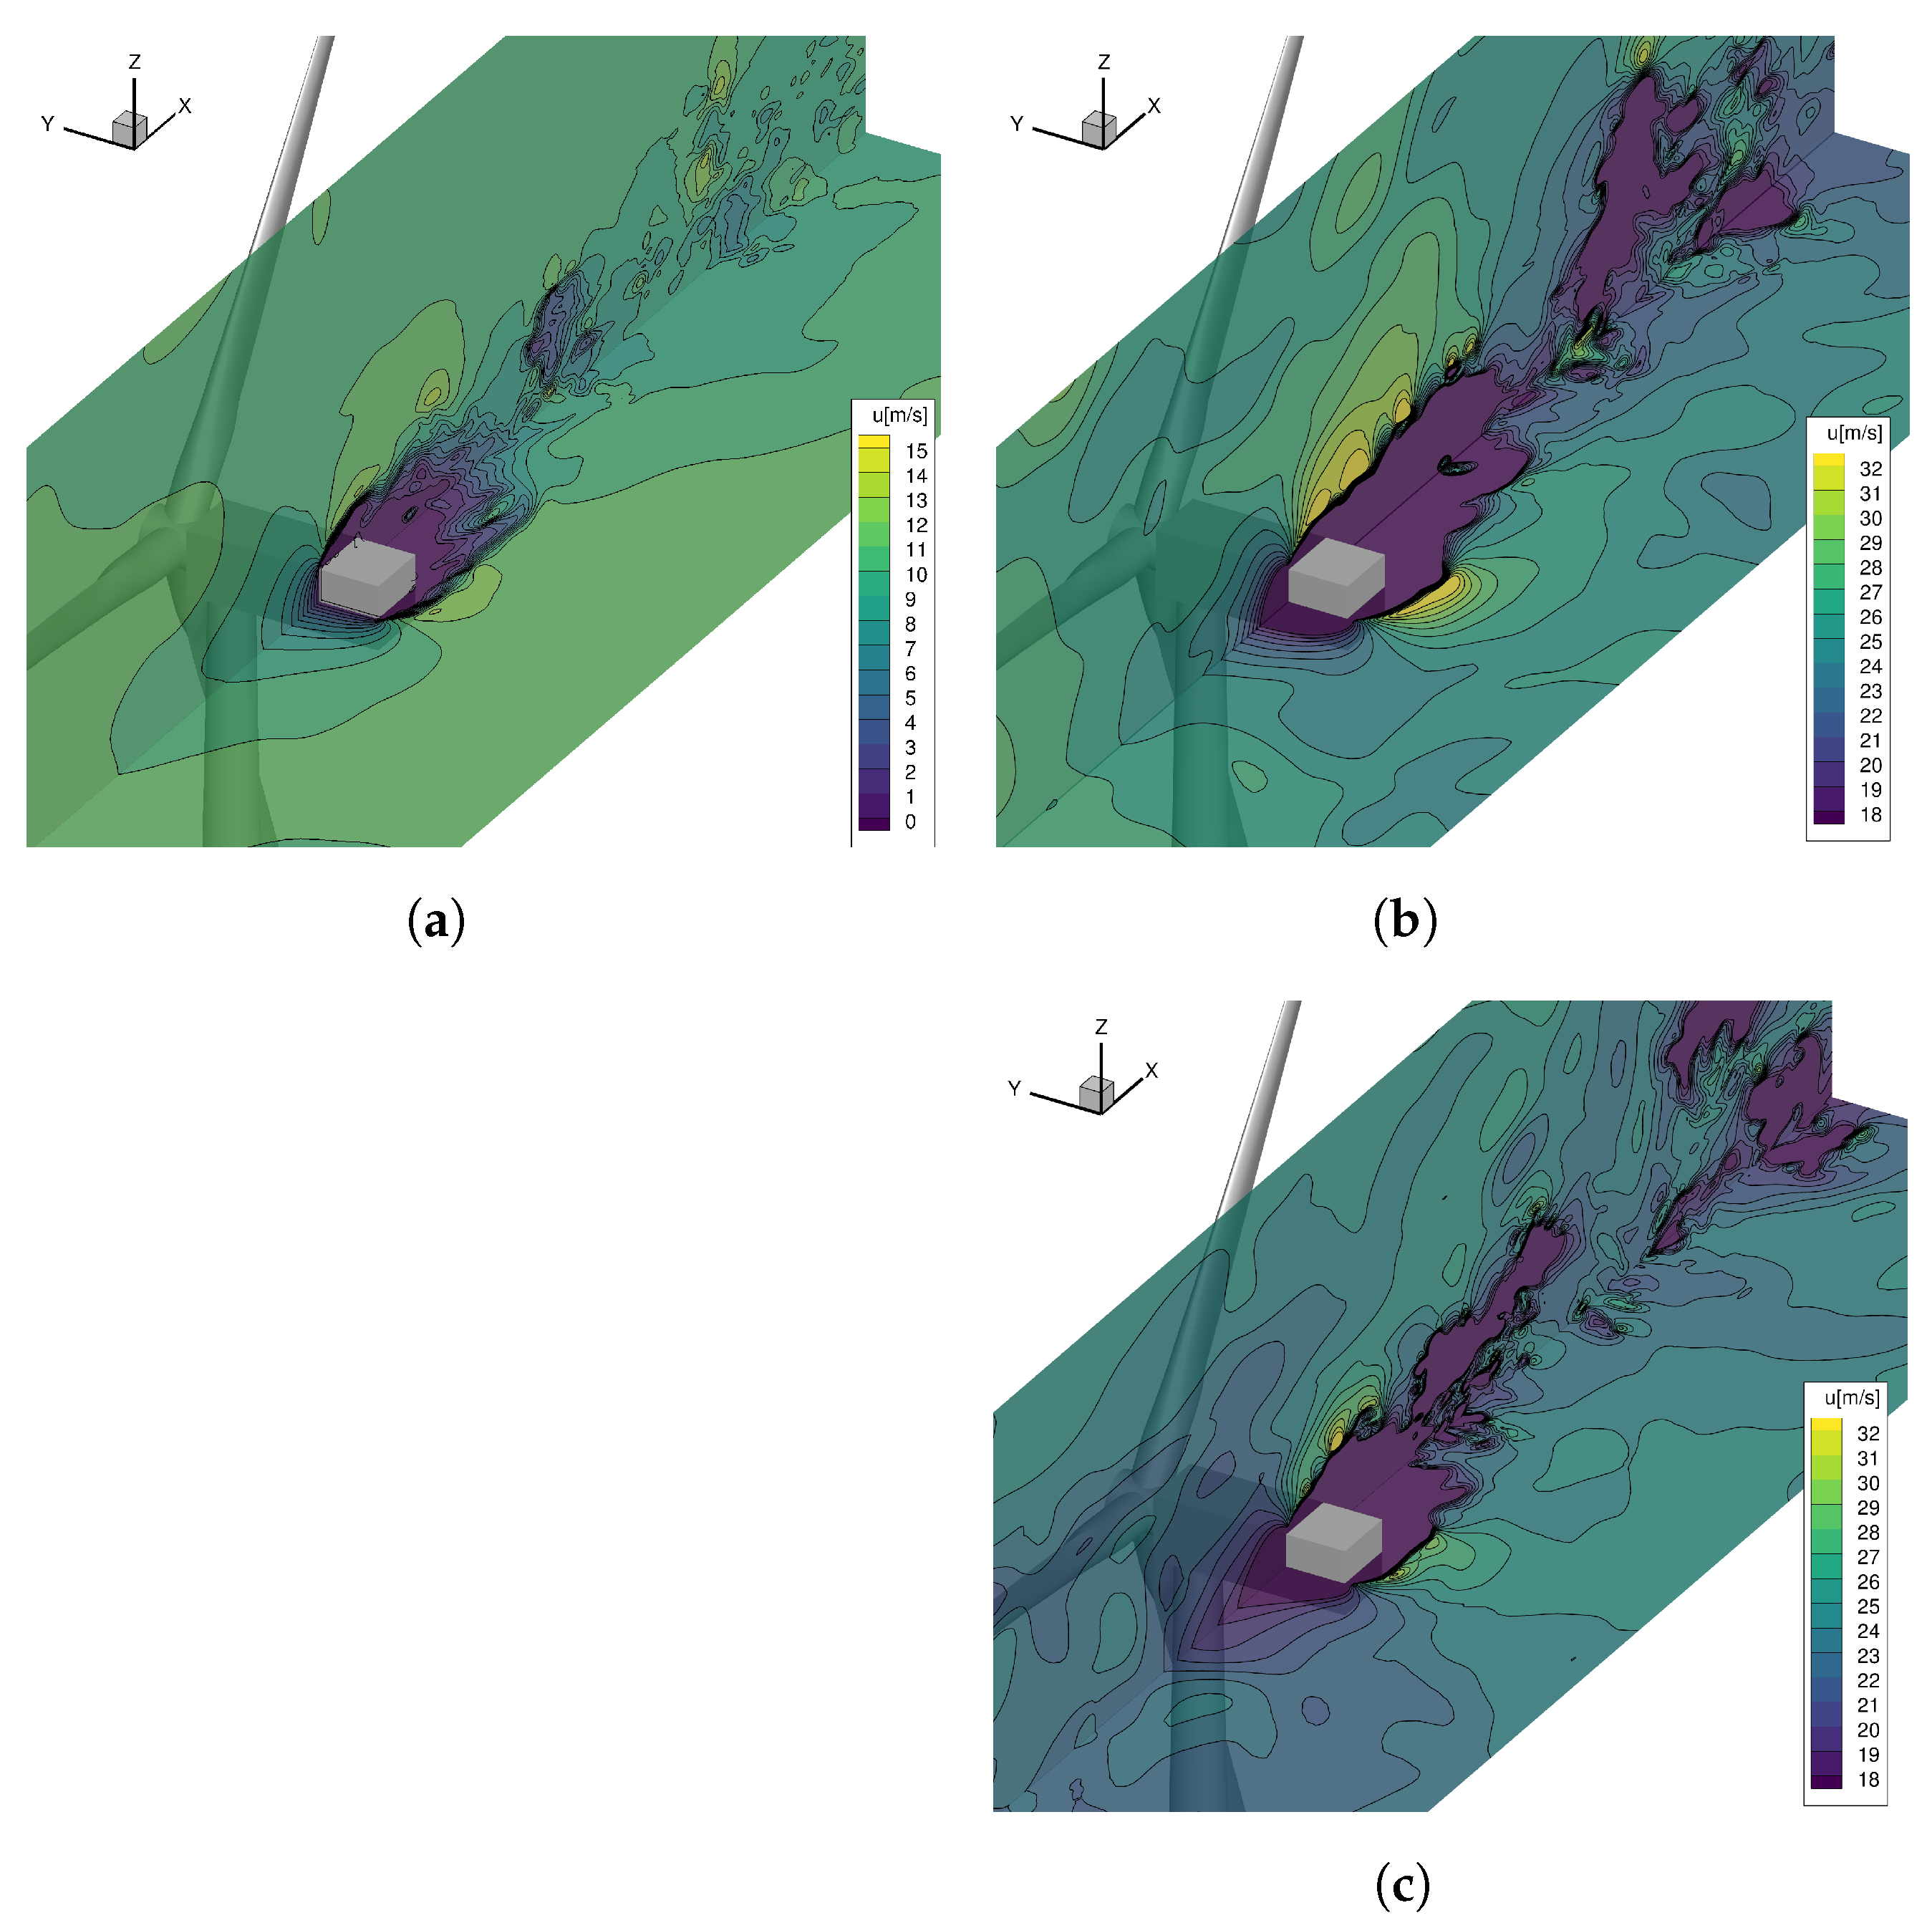
In the hover area, the bluff-body aerodynamics of the nacelle with lateral inflow shaped the unsteady flow field characteristics. Figure 10 shows the instantaneous streamwise velocities for the three non-rotating WTs. The recirculation area directly in the shadow of the nacelle appeared in all cases. More important for the helicopter approach maneuver is the vortex shedding that evolved downstream of the nacelle and the boundary layer with a strong velocity gradient and high turbulence intensity developing at the upper surface of the nacelle. The wake dynamics of the nacelle were analyzed in [4,5] along virtual approach paths and compared to a turbulence criterion for safe helicopter operations [37].
Due to its relevance for the following piloted simulation, Table 4 summarizes the average standard deviation of the vertical velocity component σ w over the five-meter-radius circular area formed by the helicopter rotor above the nacelle at an altitude above ground of z CFD = 101 m . In order to capture the effects of longitudinal movements of the helicopter during the hover maneuver, three positions of the center of the rotor area were considered. The ideal position is centered over the nacelle, and two other positions with a downstream shift of 1.5 m and 2.5 m were considered (Figure 11). The 12 s long signal of the WT wake flow field data was used, whereby a high-pass filter at 0.5 Hz and a Hann windowing function were applied before performing the Fast-Fourier Transform to remove transient low-frequency information in the signal.
Figure 11 shows the distribution of the standard deviation of the vertical velocity component σ w in a plane located at z CFD = 101 m . For all cases, vortex shedding downstream of the nacelle is visible by an area of increased values of the standard deviation of the vertical velocity component σ w . Furthermore, an increase in the standard deviation of the vertical velocity component σ w upstream of the nacelle is clearly visible between C4 and C5. For the non-isolated WT, only a slight increase in the standard deviation of the vertical velocity component σ w is visible upstream between C5 and C7.
An increase in the wind speed from V W = 11.3 m / s to V W = 25.0 m / s had a negligible influence on the vertical turbulence intensity I w = σ w / V W in the helicopter rotor area, as it was located far away enough from the nacelle’s turbulent boundary layer. The presence of an upstream WT in contrast led to an increase in the vertical turbulence intensity I w of more than 5.5 % due to the additional turbulence generated by the wake of the upstream WT. In contrast, the standard deviation of the vertical velocity component σ w in the helicopter rotor area increased strongly with an increase in the wind speed from V W = 11.3 m / s to V W = 25.0 m / s (Table 4). A slight additional increase in the standard deviation of the vertical velocity component σ w occurred due to the presence of an upstream WT. Furthermore, the standard deviation of the vertical velocity component σ w increased with a longitudinal shift in the downstream direction.
It was found that the standard deviation of the vertical velocity component σ w correlated better with the perceived turbulence of the pilots in the following helicopter simulations (Figure 25a), because it is not a normalized measure as the vertical turbulence intensity I w . The chosen longitudinal shifts of the helicopter rotor area correspond to the performance limits of the following piloted simulations (Table 7). Therefore, the helicopter was affected slightly more by turbulence if its position deviated downstream.

5. Piloted Simulation

5.1. Research Flight Simulator AVES

The simulator campaign was conducted at DLR’s research flight simulator AVES (Air Vehicle Simulator, Figure 12a [38]), which features a fixed platform and a motion platform with interchangeable cockpits. The piloted simulations were configured to represent DLR’s research helicopter ACT/FHS (Active Control Technology/Flying Helicopter Simulator [39]). It is a highly modified version of an EC135 helicopter, which features, among others, a fly-by-light full authority flight control system and is used for flight testing. Its characteristics differ from a standard EC135 helicopter, but it is considered representative of light utility helicopters, which are used in offshore wind farms. For this study, a replica of the ACT/FHS cockpit was used in the AVES motion platform.
A dedicated maritime visual environment with weather effects, dynamic waves and rotating WTs was used (Figure 12b [40]). It provides a realistic cueing environment to the pilot during the simulation campaign, which is important to take into account increased pilot workload due to the lack of available cues while flying offshore missions [41]. The maritime visual environment was configured to represent the offshore wind farm Global Tech I (GTI, Figure 1a), which is located at the German Bight. It consists of 80 WTs with a nominal power of 5 MW , whose properties are similar to the ones of the CFD-simulated WT.

5.2. Helicopter Modeling

DLR’s non-linear real-time helicopter modeling program HeliWorX was used to model the ACT/FHS. It is based on the helicopter modeling program SIMH [42], which was used originally in the former flight simulator to model a Bo105 with a hingeless rotor system, and was adapted to model an EC135 with a bearingless rotor system. The most important properties of the helicopter model can be found in Table 5.
Helicopter models in HeliWorX each consist of a set of modular components (fuselage, horizontal stabilizer, vertical stabilizer, main rotor, tail rotor, etc.). The main rotor is modeled as fully articulated with an equivalent hinge offset and spring restraint in order to represent the fundamental flapping and lagging natural frequencies. The main rotor blades are modeled as rigid blades, and 10 blade sections per blade are used to calculate the aerodynamic forces and moments. Furthermore, the dynamic inflow model of Pitt and Peters is used during the piloted simulations [43].
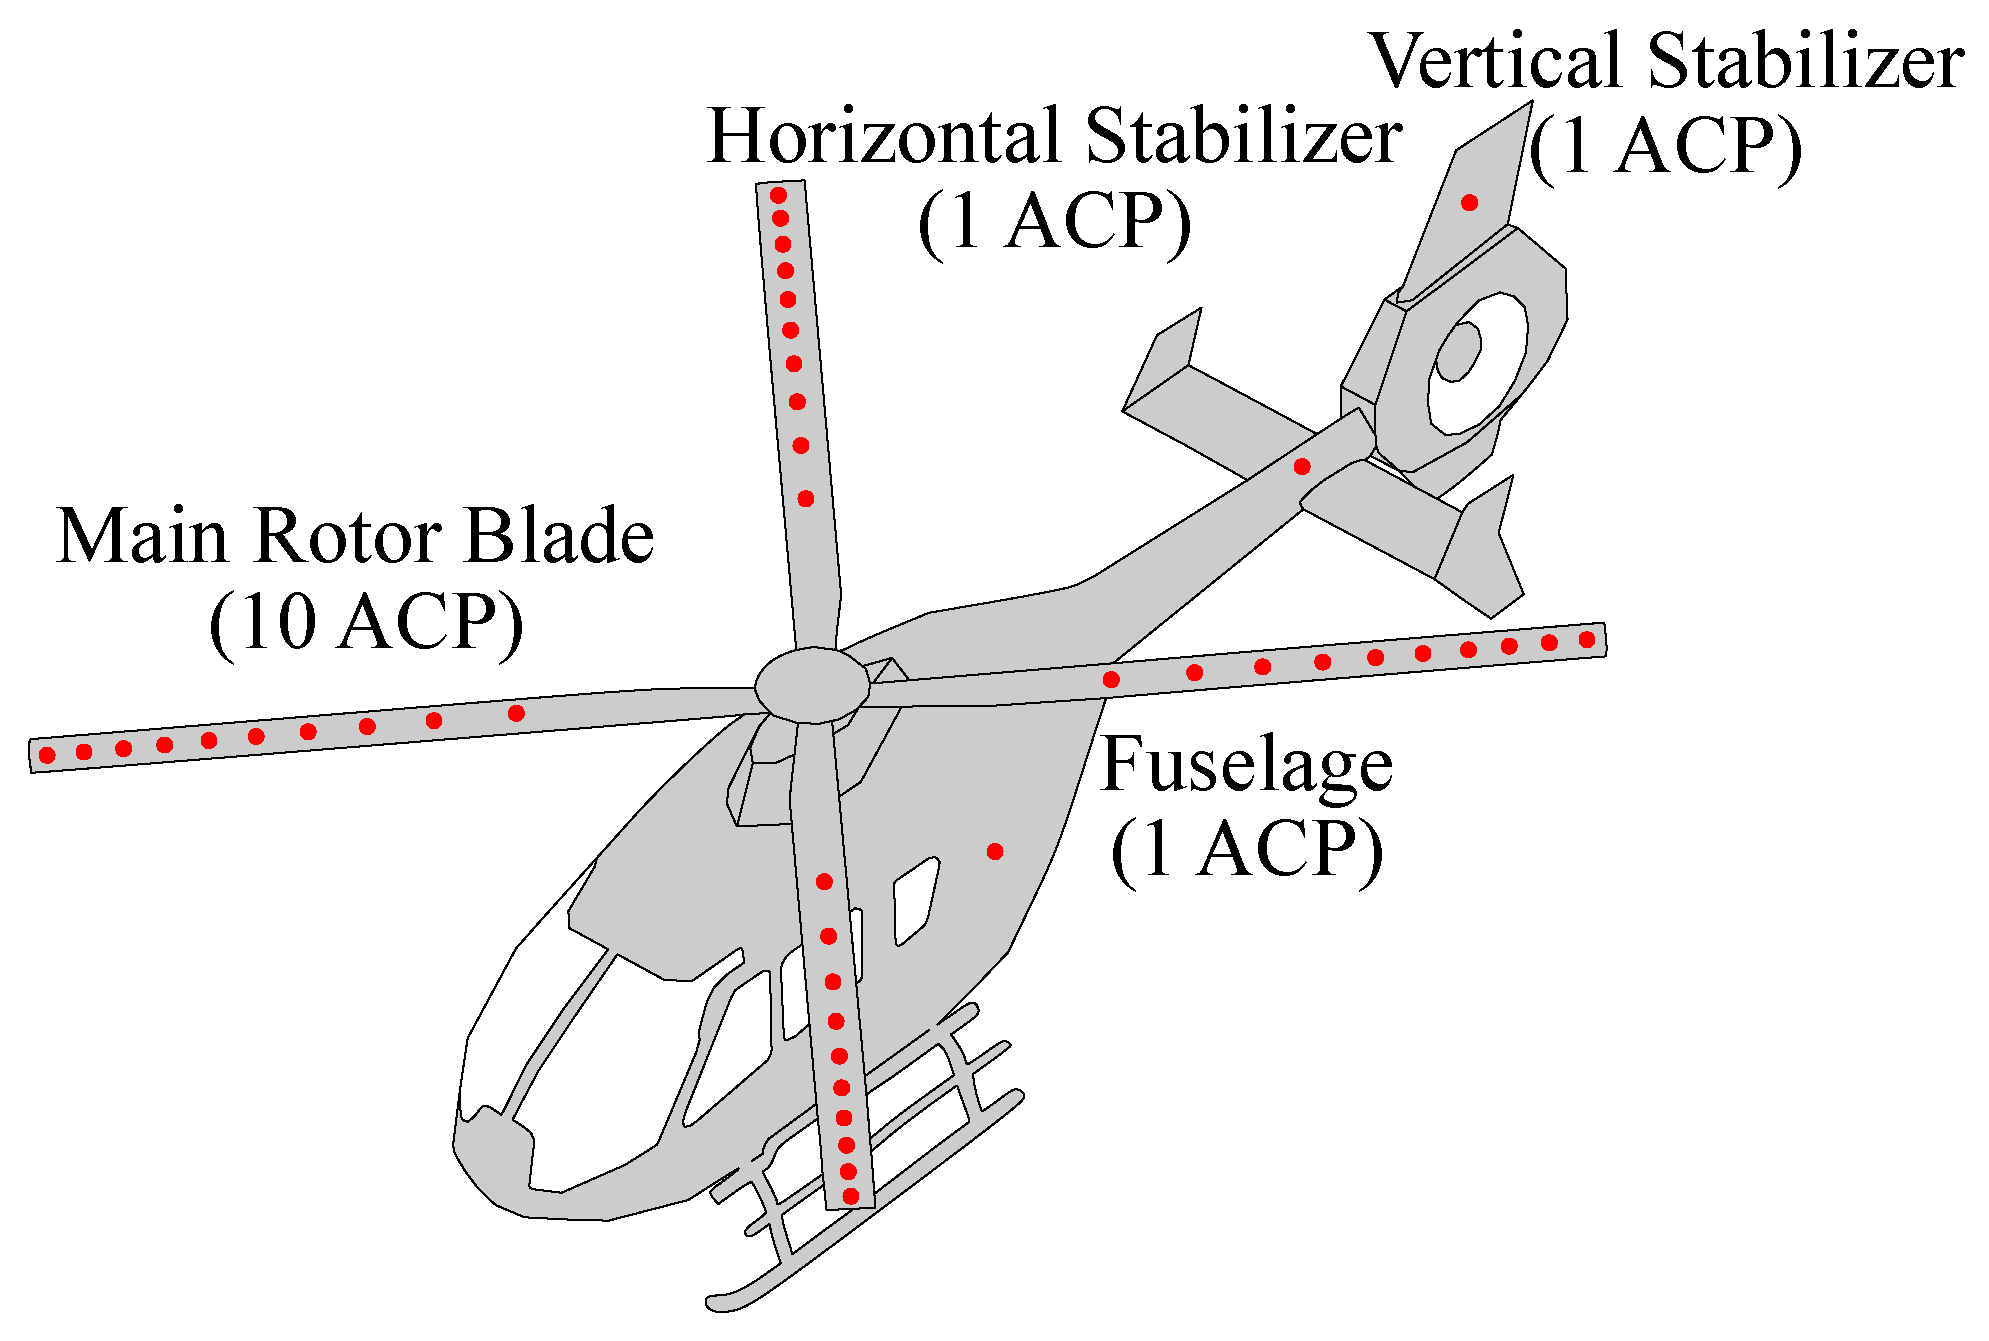
Furthermore, the helicopter model contains additional features, such as an interface for unsteady airwake data to simulate local aerodynamic effects such as wakes from rotating WTs [8]. Unsteady CFD-generated airwake data were superimposed on 43 distributed airload computation points (ACPs, Figure 13) of the helicopter model in total, using spatial and temporal linear interpolation, during the piloted simulation. The unsteady airwake data were looped in time, and temporal blending was performed to enable smooth transition. For the first approach, an interaction between airwake data and tail rotor was implemented.

5.3. Pilot Task

5.3.1. Transit Task

The transit task was performed to examine the size of flight corridor for OS-1 (Figure 1a and Figure 2). It consisted of a straight, level flight with aerodynamic disturbances, delayed pilot response and recovery to the original states. Existing mission task elements and the classification of transients following failures (Figure 8) from ADS-33 [44] were combined for this pilot task. The challenge of OS-1 was the definition of a pilot task with high reproducibility which would lead to vortex encounters between the main rotor hub and the relatively small blade tip vortex cores. It was applied for the selected vortex encounter positions from Table 3.
At the beginning of the simulation, the helicopter was trimmed with an airspeed of V = 80 kt in proximity to the blade tip vortex of the WT, and the main rotor hub encountered the vortex core after t EN 2 s without any pilot input. Therefore, the pilot was instructed to avoid any pilot input for the first 2 s of the simulation. After the vortex encounter at t EN , the pilot was instructed to avoid any pilot input for an additional 3 s to simulate a delayed pilot response. Consequently, the pilot started to pull the helicopter back to its original states at t RE = 5 s within a stabilization time limit. The start of the recovery maneuver at t RE was indicated by the simulation operator via radio to increase comparability between different simulations. All pilot task performance limits are specified in Table 6.
For this task, a helicopter with bare-airframe response type (BA) and without any stabilization was chosen as a conservative approach to take into account simulation deficiencies. The airspeed of V = 80 kt is rather low for cruise flights of helicopters and corresponds to an advance ratio of μ 0.2 . However, this advance ratio still fulfills the guidelines for rigid line vortex modeling approaches of μ 0.2 from [18].
Pilots have commented on the task: In reality they would rather gently stabilize the helicopter than fight the turbulence within the wake to recover the original state to avoid pilot-induced oscillations. This would especially be the case for vortex encounters at hub height. Furthermore, the pilots have mentioned the artificially delayed pilot response time is too large to represent reality. The artificially delayed pilot response time was used to increase the effects of the vortex encounter, to enable comparisons between offline analysis and piloted simulations after 3 s and to improve reproducibility. Therefore, the large delayed pilot response time can be considered a conservative approach.

5.3.2. Hover Task

The hover pilot task was defined to examine the lateral safety clearance at the helicopter hoist area for OS-2 (Figure 1b and Figure 3). It combined the hover mission task element from ADS-33 [44] with operational procedures of helicopter hoist operations at offshore WTs. Therefore, the communication between the helicopter pilot and the helicopter hoist operator was simulated as well. The original task consists of an approach, stabilization and precision hovering at the WT wake, but only the hover phase was used for the assessment.
At the beginning of the simulation, the helicopter was trimmed in proximity of the WT hoist position and an oblique approach was performed (Figure 14). After the helicopter was stabilized above the hoist position, precision hovering of 30 s was performed by the pilot. During all phases, the pilot received continuously directions from the hoist operator via radio for positioning the helicopter above the hoist area. The hoist operator was simulated by the simulation operator, who was aware of the exact position of the helicopter via numerical displays. As in operational practice, standardized radio messages to guide the pilot in a horizontal plane with distance information in 1 m steps (e.g., forward-2/right-1) were used.
The performance limits of the pilot task can be found in Table 7. The lateral and longitudinal limits were fitted to the size of the WT hoist area and to the step size of the coarse radio guidance. For helicopter hoist operations, gentle altitude corrections are more important for hoist crew comfort than rapid corrections within tight limits. Therefore, all pilots were instructed to hold coarsely to a fixed altitude to increase reproducibility, but no hard altitude performance limits were given. This altitude corresponded to a clearance of 5 m between the helicopter skid and the WT nacelle. Two different helicopter response types of the flight control system were used for the hover task. The helicopter with BA response type corresponds to a helicopter without any stabilization system and was used for a conservative estimate of the lateral safety clearance. In contrast, the helicopter with attitude-command attitude-hold (AC) response type is comparable to the response type of a commercial EC135 helicopter and reduced the workload.
Table 7. Performance limits of the pilot task for hovering (OS-2).
ParameterDesiredAdequate
Heading, ± 5 ± 10
Lateral limit, m ± 1.5 ± 2.5
Longitudinal limit, m ± 1.5 ± 2.5
Hover time, s<30<30
The pilots said the pilot task well represented reality and was suitable for pilot training, even though no externally slung load was used. As in operational practice, the pilots use the horizontal blade (L-position), the cage of the nacelle and textures on the surface (dirt, rust, etc.) as visual cues to stabilize the helicopter. Therefore, a realistic cueing environment is important, especially for this pilot task. The pilots did suggest slightly loosening the performance limits for the heading to enable a better view of the the WT, because it is not necessary to hold a perfect 90 angle to the WT nacelle, and visual cues were partly hidden by the helicopter cockpit.

5.4. Objective and Subjective Assessments

Objective and subjective assessment methods were used to evaluate the simulation results. The objective methods used the data from the simulations and focused on the helicopter’s motion transients and available safety clearance and control margins.
For the offline analysis of OS-1, the requirements for helicopter motion transients from ADS-33 were used (Table 8). The helicopter motion transients were recoverable to a safe steady flight condition without exceptional piloting skill [44]. Originally, the classification was developed to evaluate the motion transients due to a disturbance of the flight control system. The vortex encounter at t EN was considered as a comparable disturbance for “forward flight—near Earth” from Table 8. Therefore, both requirements of “hover and low speed” and “up-and-away” applied. For this study, the assessment of helicopter motion transients was simplified to the requirements of “hover and low speed”.
In contrast, the subjective methods were based on pilot rating scales. The pilots were instructed to repeat each test case 2–3 times to familiarize themselves with the new test conditions and to achieve reproducible simulation results. Overall, two experimental test pilots of helicopters and two professional helicopter pilots with different levels of experience participated at the simulation campaign (Table A1). The evaluation of OS-1 was performed by Pilots A, B and D; and the evaluation of OS-2 was performed by Pilots A, B and C. Note that Pilot A and Pilot C used to work as helicopter pilots for German offshore wind farms and are highly familiarized with the examined operational scenarios in reality.
The pilots were asked to evaluate the perceived turbulence at OS-1 and OS-2 with the Turbulent Air Scale (TS, Table A2). It is a subjective measure of the impact of the turbulence on the helicopter.
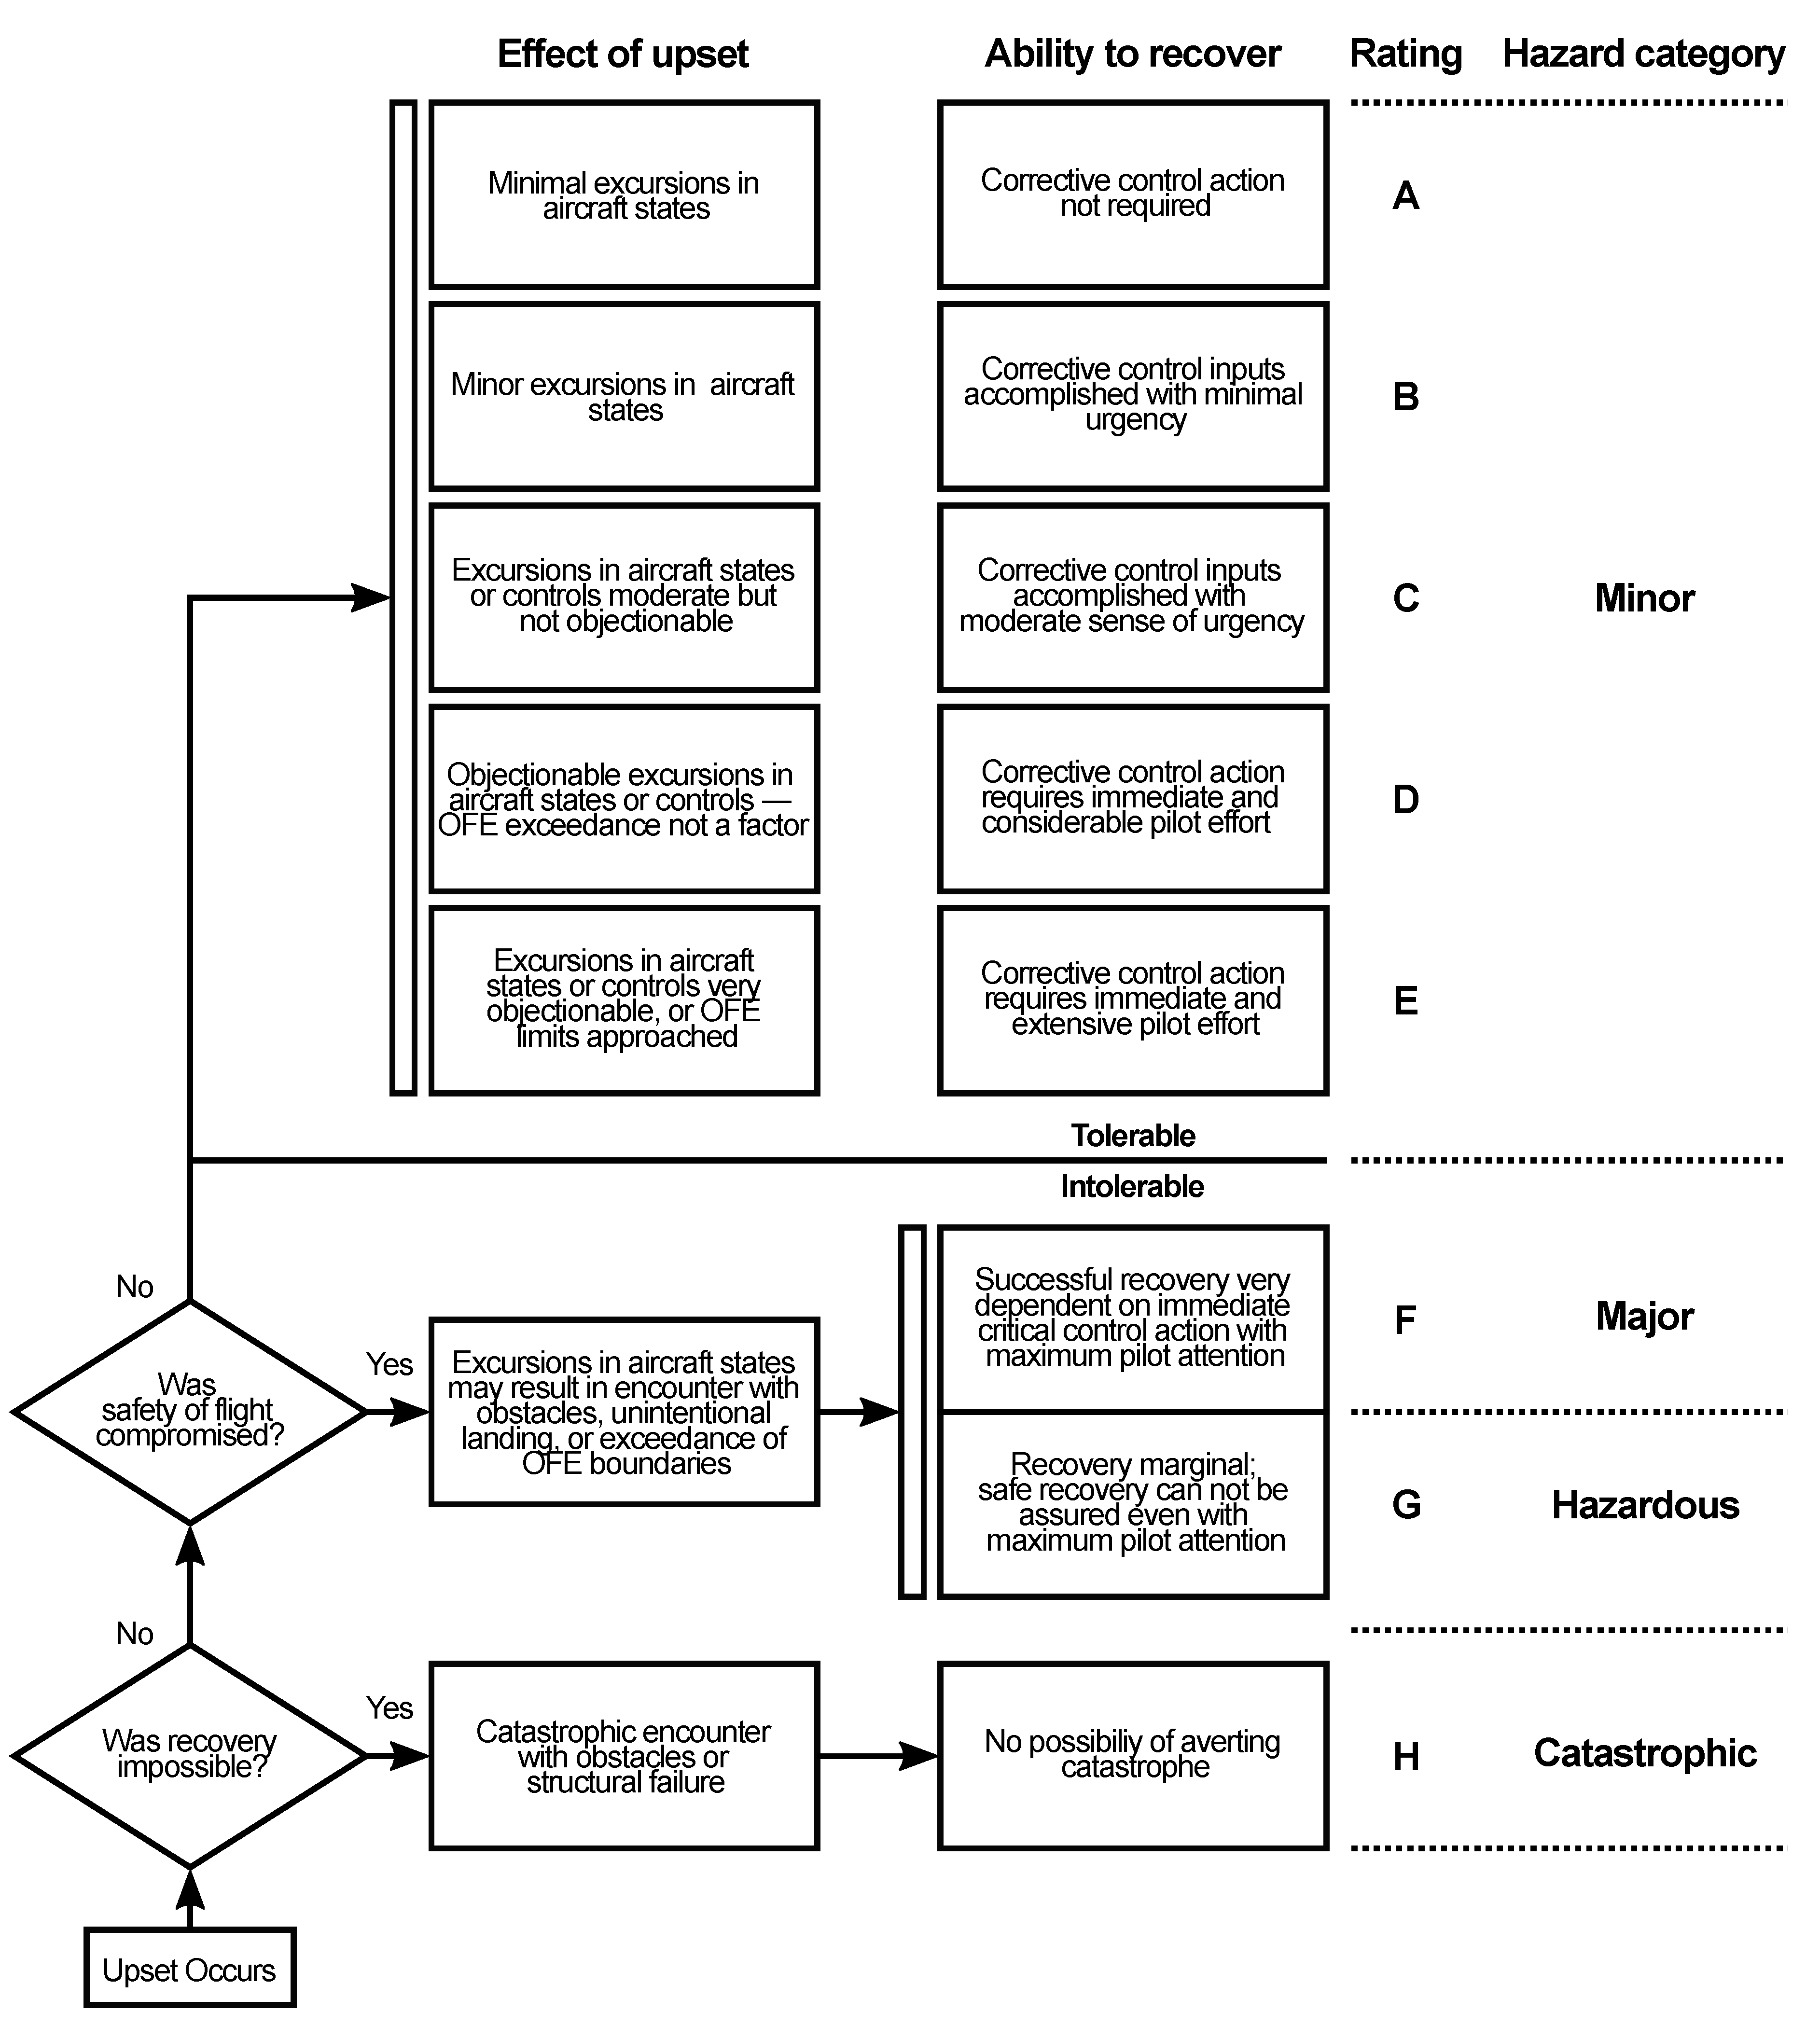
Furthermore, the Upset Severity Rating (USR, Figure A1) was used to evaluate the severity of the vortex encounter in OS-1. It consists of a decision tree, which originates from pilot rating scales for failure transients and is a subjective measure of the effect of the upset and the ability to recover the helicopter from a disturbance. The usage of the USR-rating was simplified in this study by evaluating solely the ability to recover.
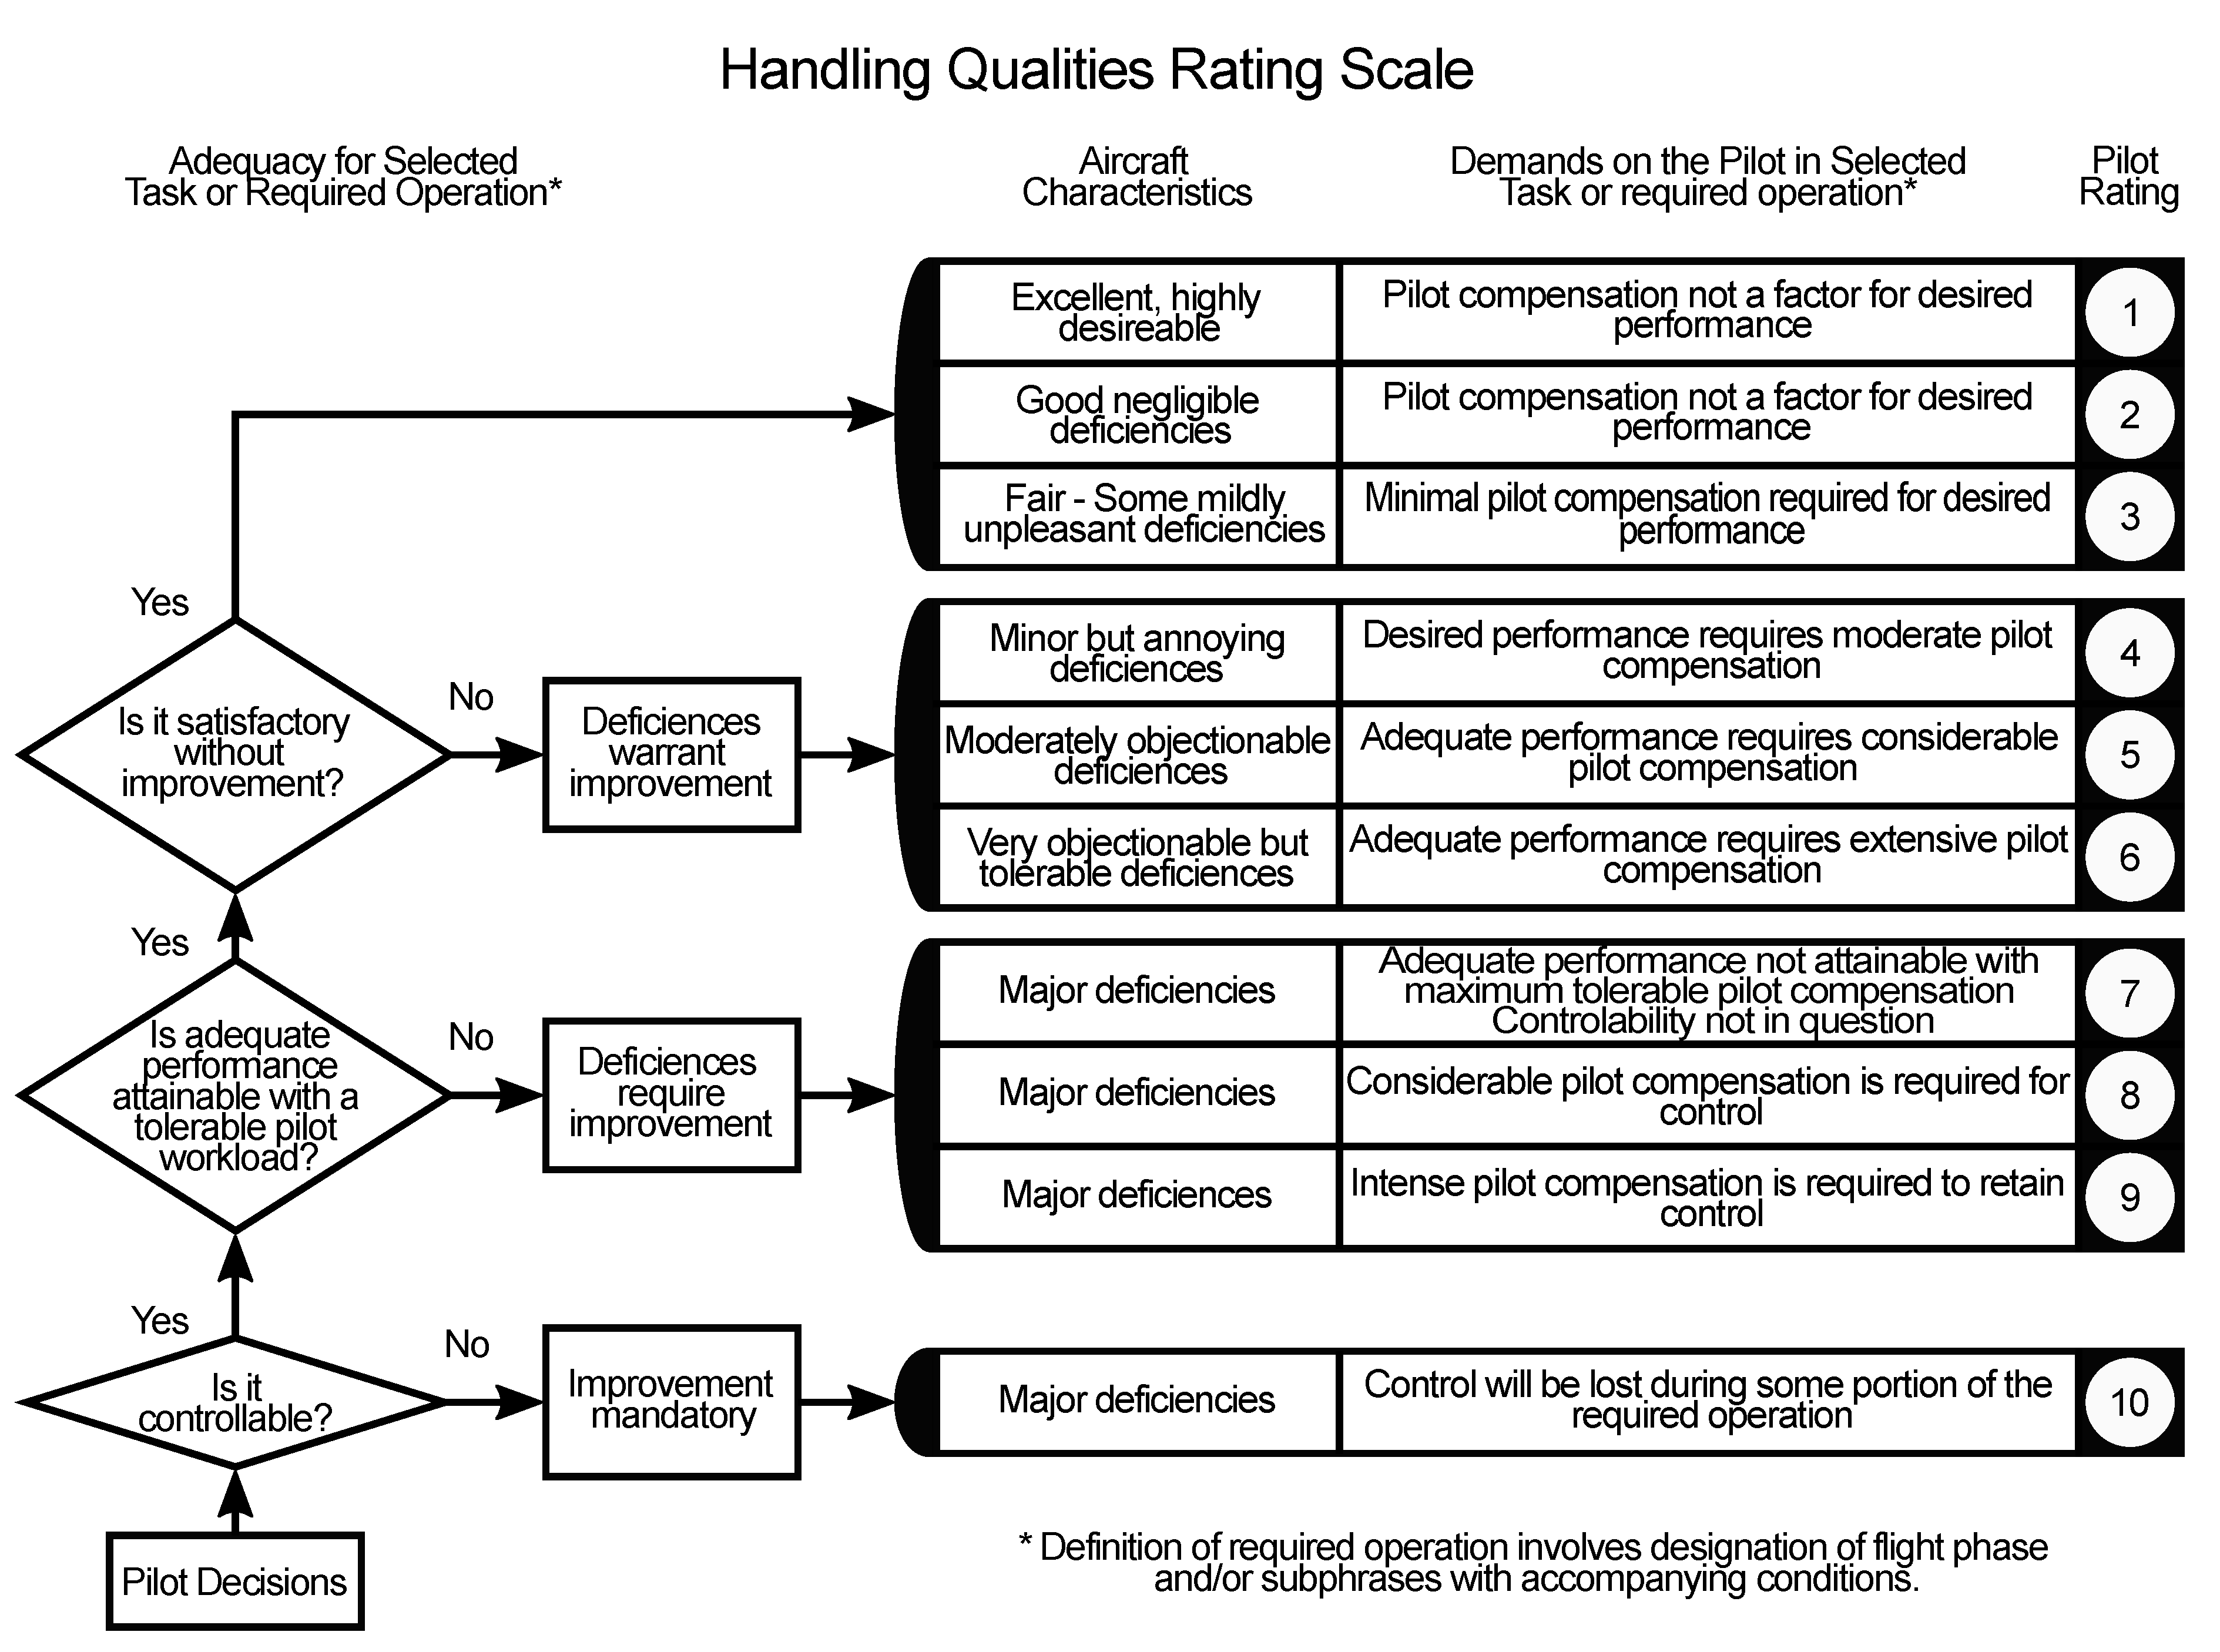
Lastly, the widely used Cooper–Harper Handling Qualities Rating Scale (HQR, Figure A2) was used to evaluate the hover task in OS-2. It consists of a decision tree and is a subjective measure of the additional pilot compensation required to fulfill a specific piloting task. The usage of the HQR ratings is an integral part of experimental test pilot training due to its complexity, and it was only used by Pilots A and B in this study.

6. Results

6.1. Offline Analysis of OS-1

In the following section, the results of the offline analysis of the longitudinal vortex rotor interactions (position 2, position 5, position 7) of OS-1 are shown. Therefore, the vortex encounters of the helicopter at the positions from Table 3 were simulated without any pilot input. The ability of the simulation setup to cause rotor-centered vortex encounters is shown, and the helicopter reactions of the non-piloted simulations were assessed using the ADS-33 offline criteria from Table 8. Furthermore, those results are compared with airwake data from the previously used SWM from [8].
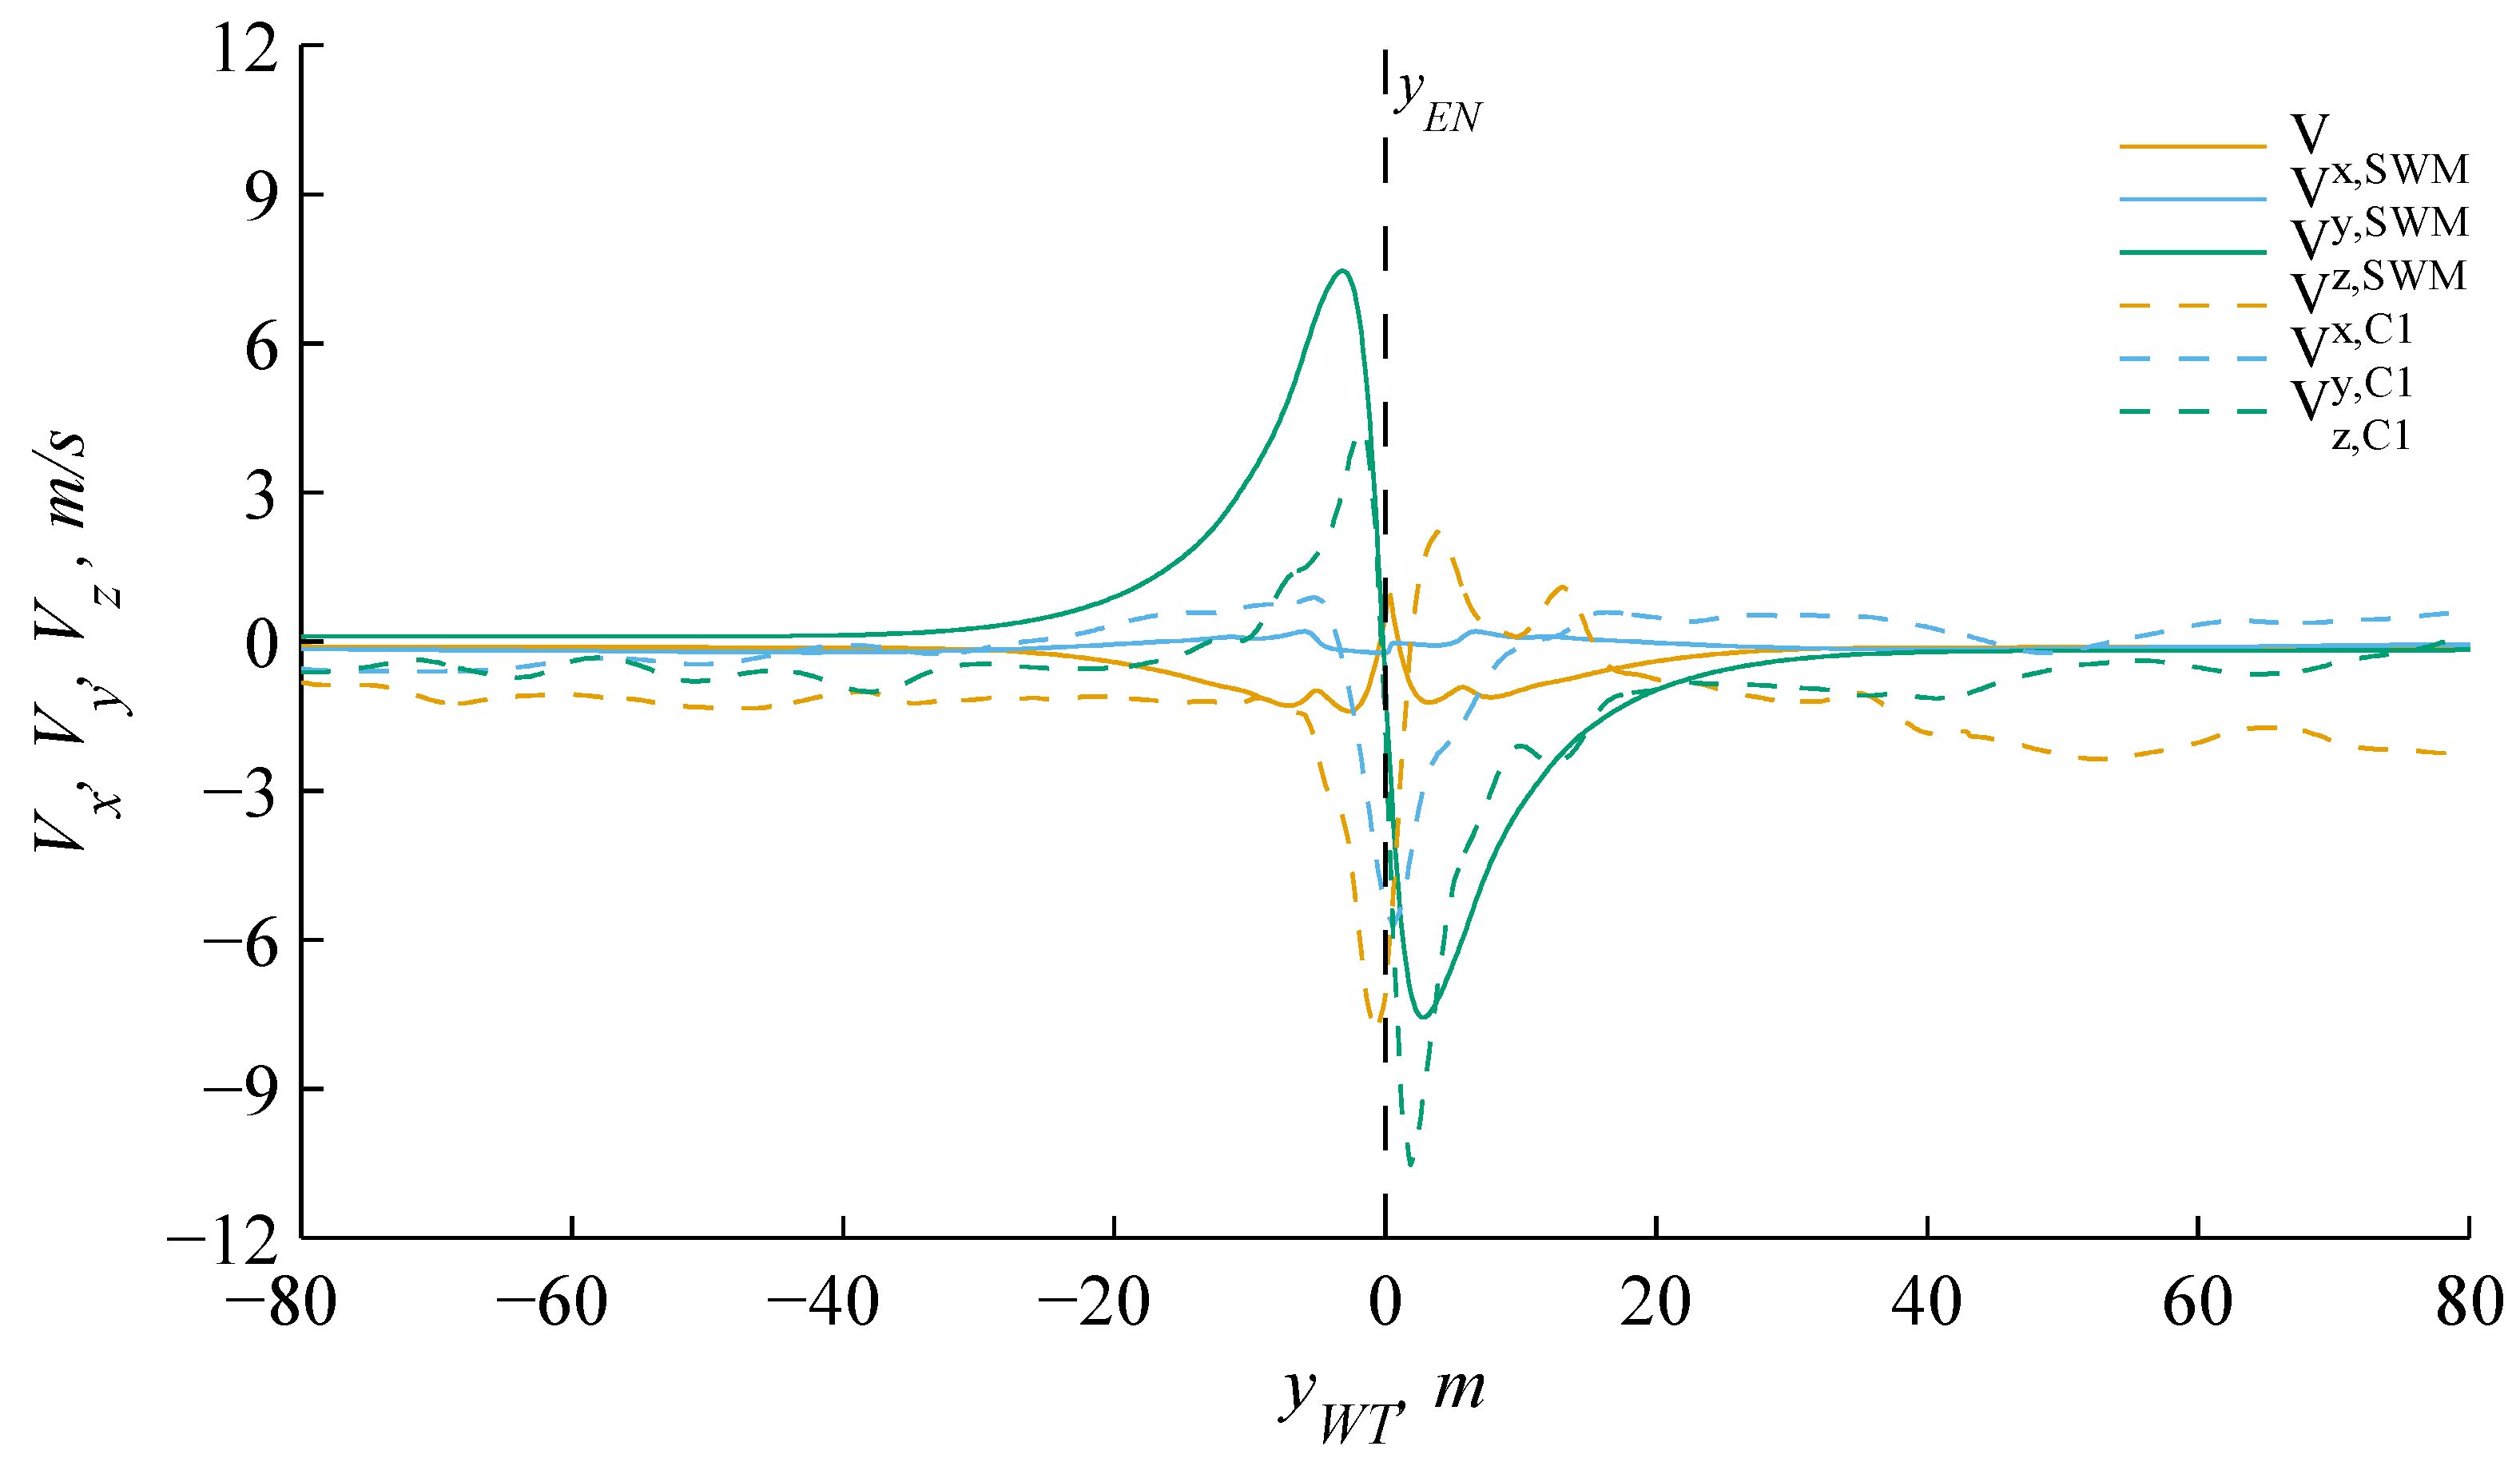
The airwake velocities ( V x , V y , V z ) of C1 and the SWM were extracted from an ideally straight line through the vortex core at position 2 and are depicted in Figure 15. This straight line corresponds approximately to the flight path trajectory at the beginning of the following helicopter simulations without any pilot. The vortex core center can be identified by the zero crossing of the velocity V z . Due to the simplifications of the SWM, a perfectly symmetrical velocity profile is shown. In contrast, the velocity profile of C1 shows deformations due to blade tip vortex deformation within the CFD simulation. In addition, C1 contains minor velocity disturbances all throughout due to ambient atmospheric turbulence, which disturbed the flight path even at the beginning of the helicopter simulations and caused deviations from the ideal flight path. Note that the extracted straight line and the helical WT blade tip vortex are inclined (Figure 2). Therefore, Figure 15 is not suitable for determining the vortex core radius.
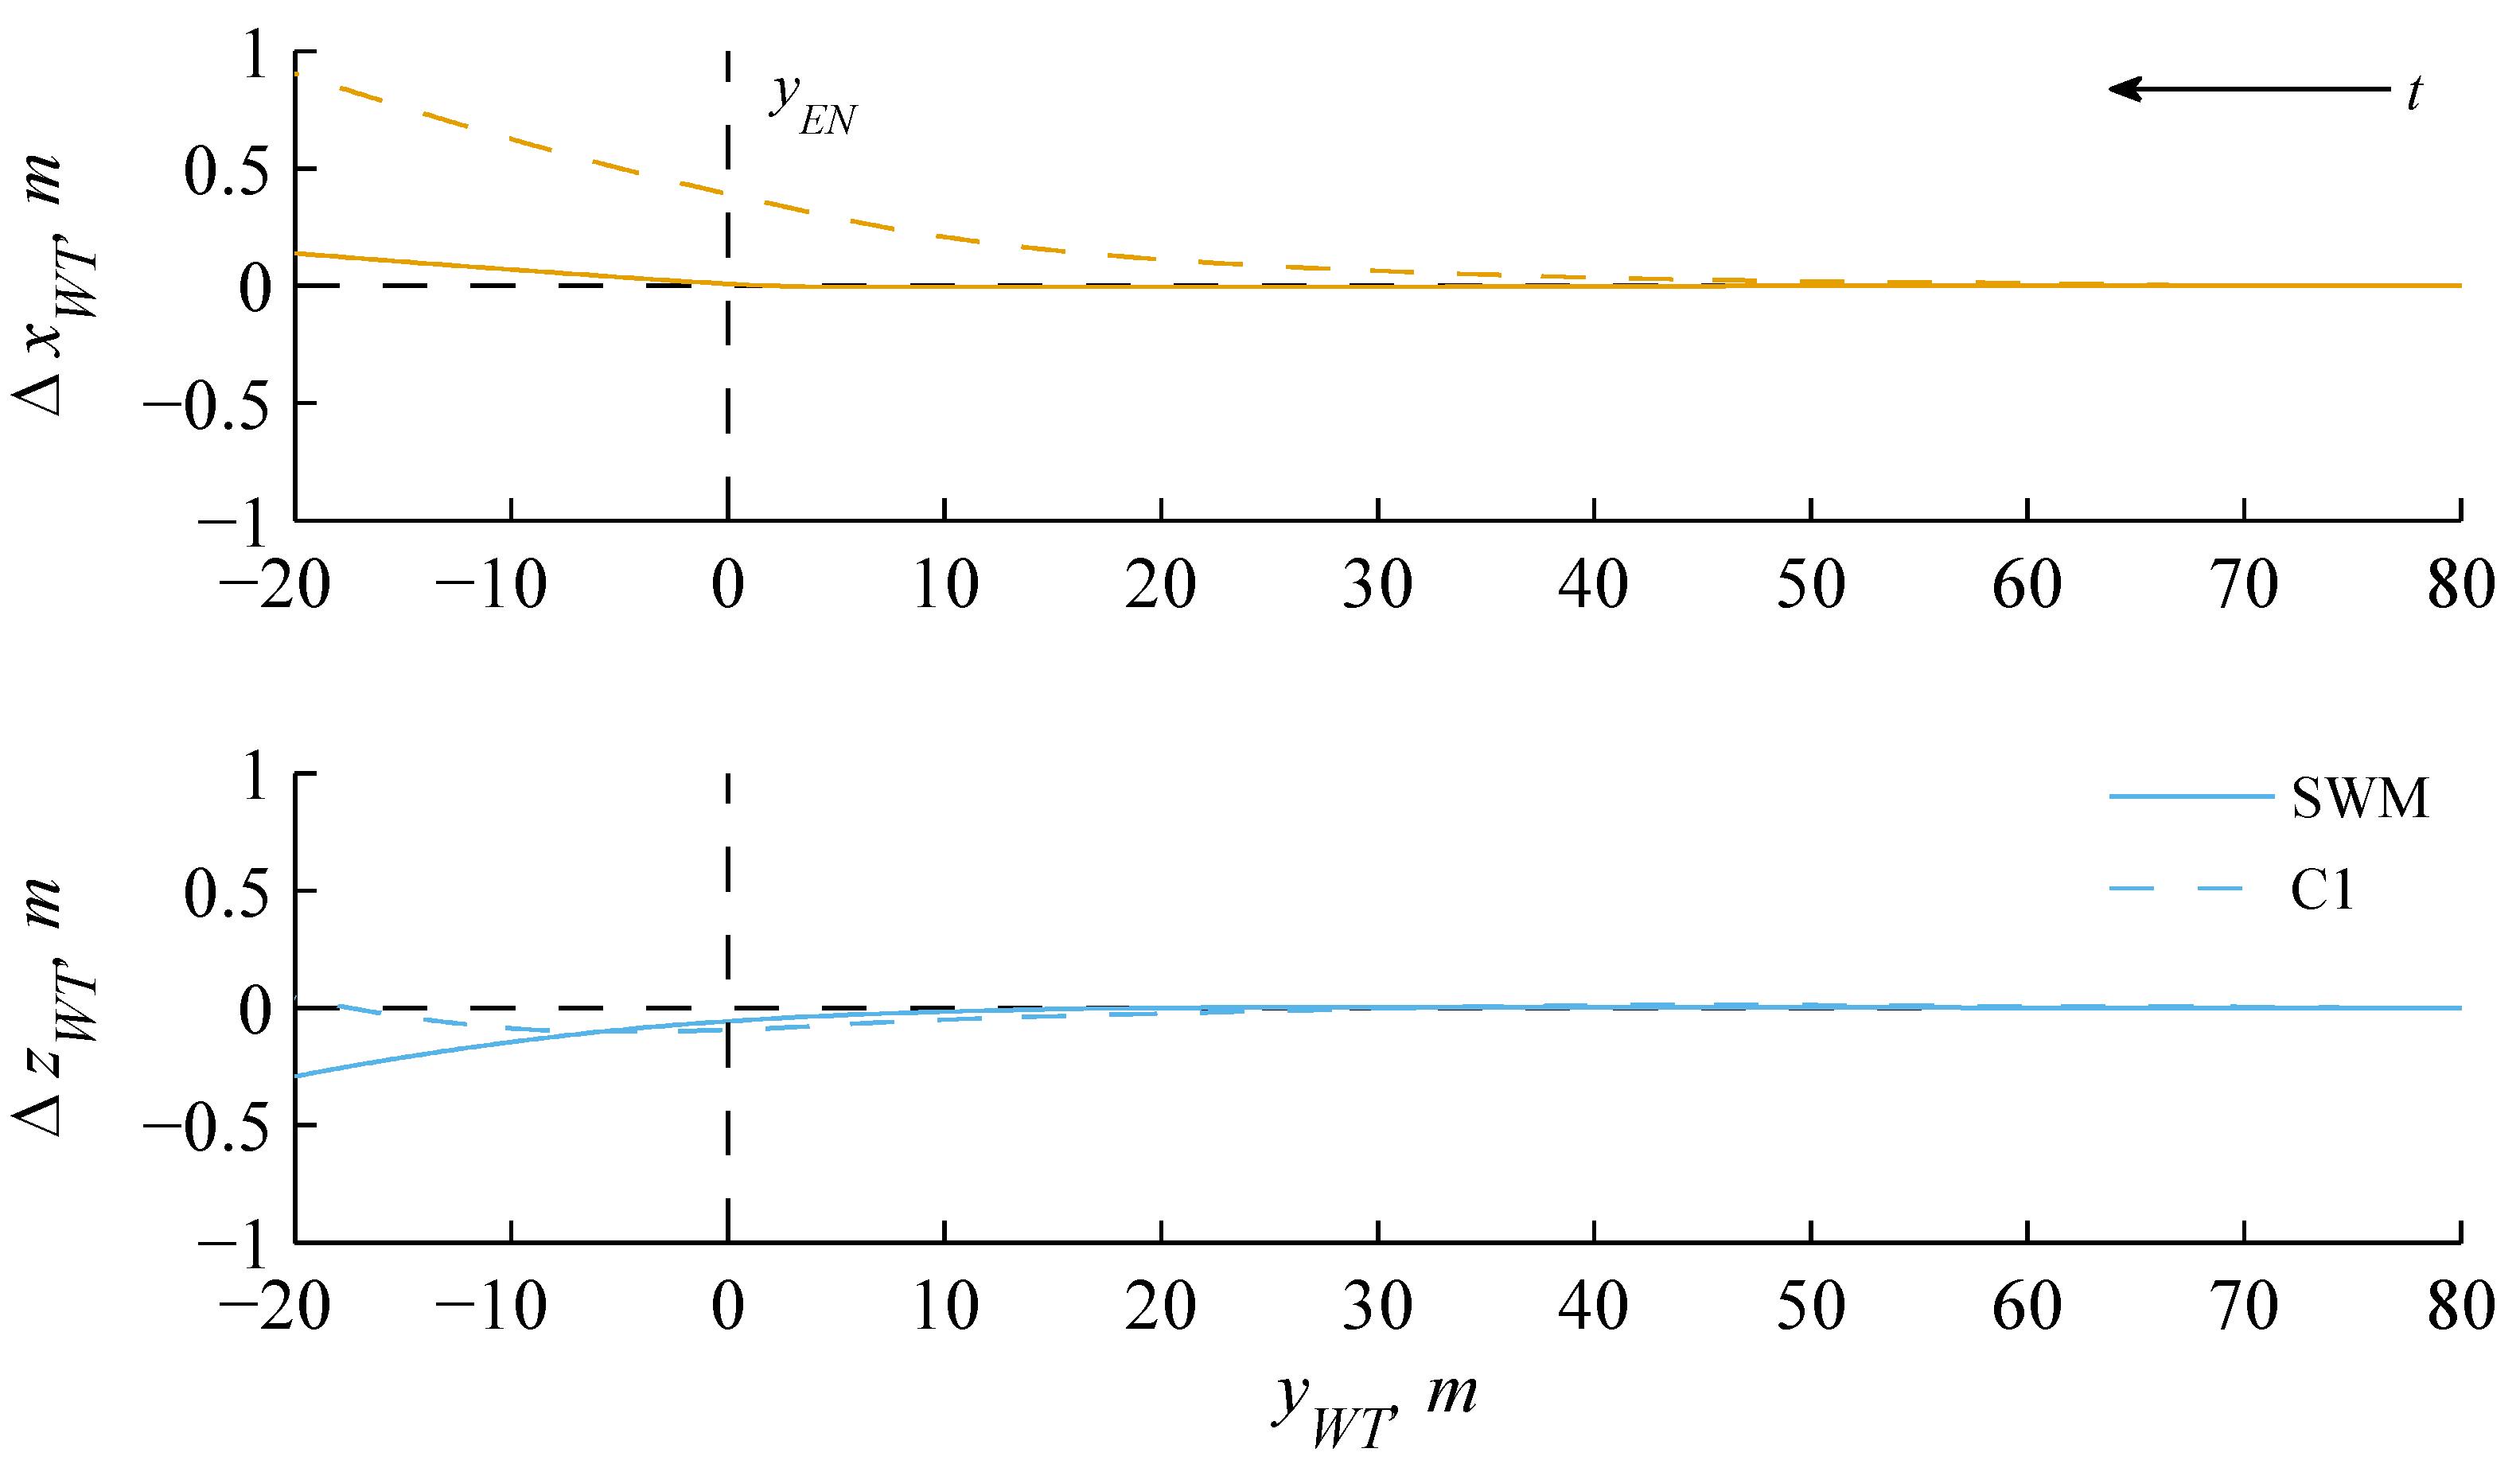
Figure 16 shows the lateral and vertical deviations ( Δ x non-piloted , Δ z non-piloted ) between the ideally straight line and the non-piloted helicopter simulations of C1 and SWM. The flight direction of the helicopter was west and is indicated by an arrow. Furthermore, the vortex core encounter is indicated at y EN = 0 m . Note that a simulation setup with a perfectly rotor-centered vortex encounter would correspond to zero deviations at y EN . The flight path deviations of the SWM were smaller compared to C1, which amounted to approximately 0.5 m . This was due to the additional ambient atmospheric turbulence in C1 (Figure 15). The vortex core radius at position 2 was estimated to be R c = 1.26 m (Table 3), which is larger than the flight path deviations. Therefore, the vortex core was encountered by the helicopter rotor hub, but the vortex core center was missed.
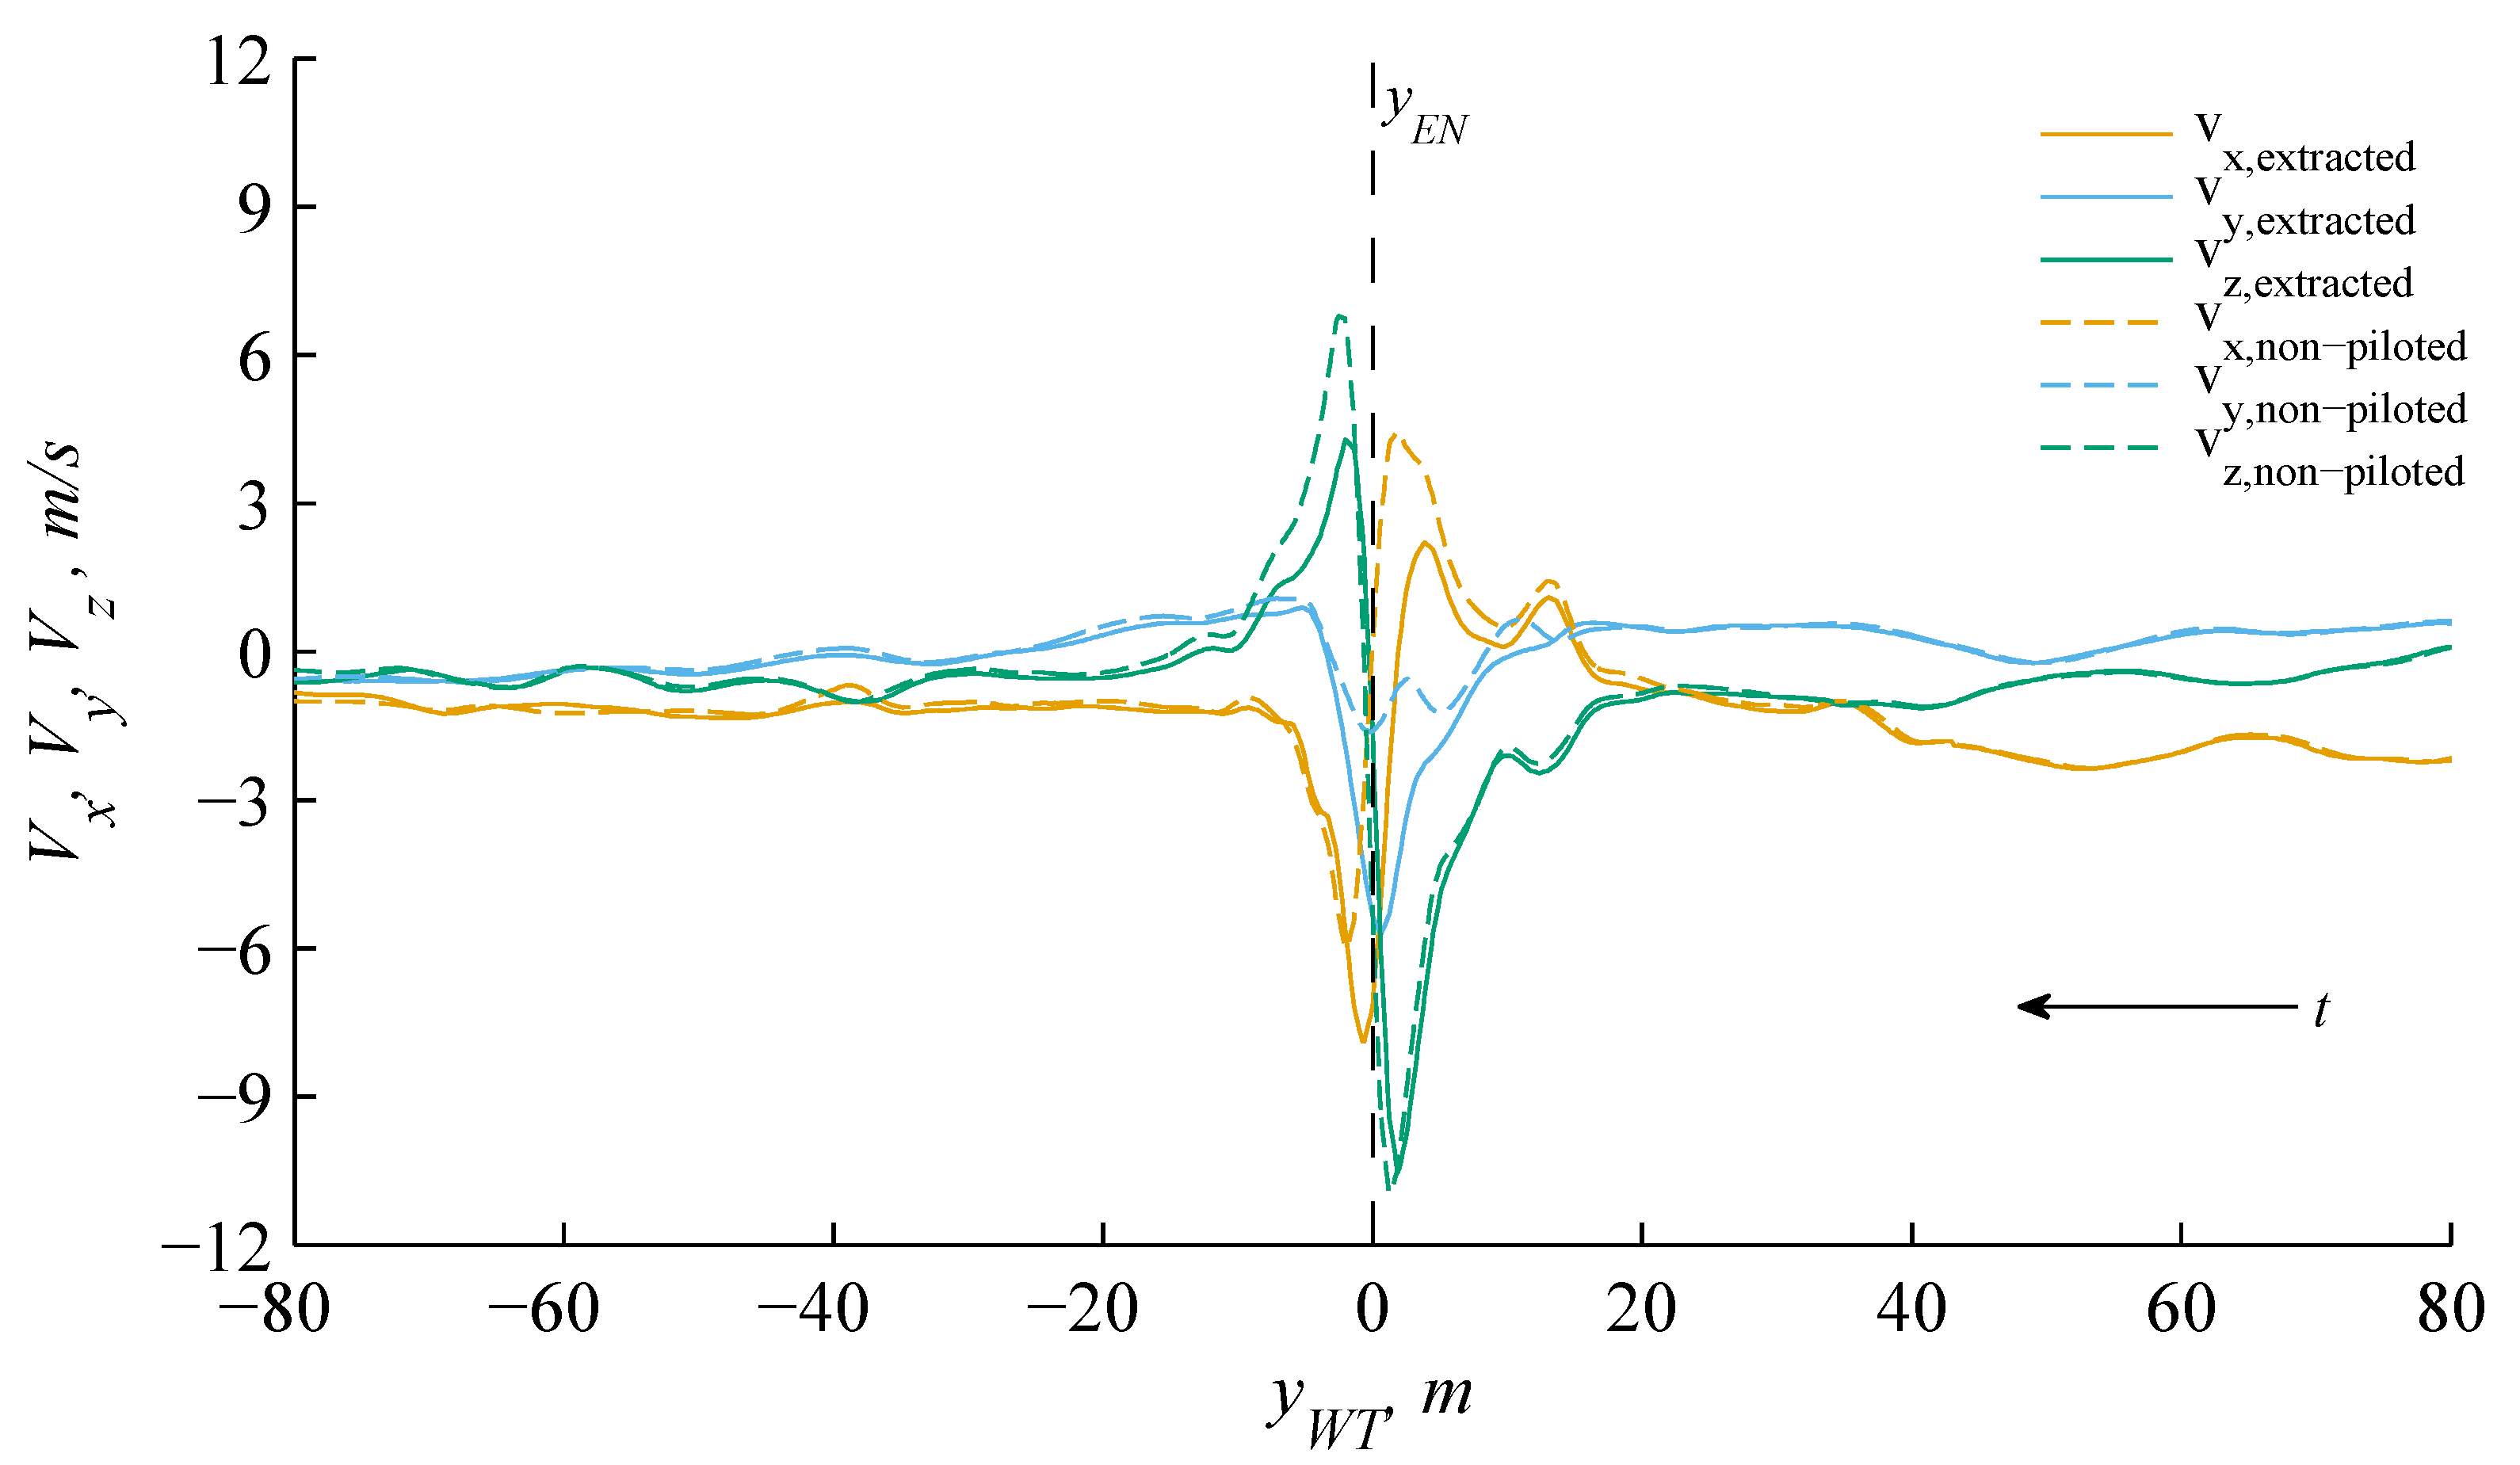
Figure 17 shows a comparison of the airwake velocities ( V x , V y , V z ) between the non-piloted simulation and an extracted ideally straight line for C1 at position 2. Note that a simulation setup with a perfectly rotor-centered vortex encounter would match the curves before the vortex encounter ( y > 0 m ), but deviations between both curves always appeared after the vortex encounter ( y < 0 m ) due to the helicopter’s reaction. It can be seen that the airwake velocities ( V x , V y , V z ) are in a good agreement before the vortex encounter, even though the vortex core center was missed and flight path deviations of approximately 0.5 m appear. This analysis was successfully repeated for position 2, position 5 and position 7 for both flight directions. Thus, the simulation setup is considered acceptable for the simulation of vortex encounters, even though the vortex core was not perfectly hit.
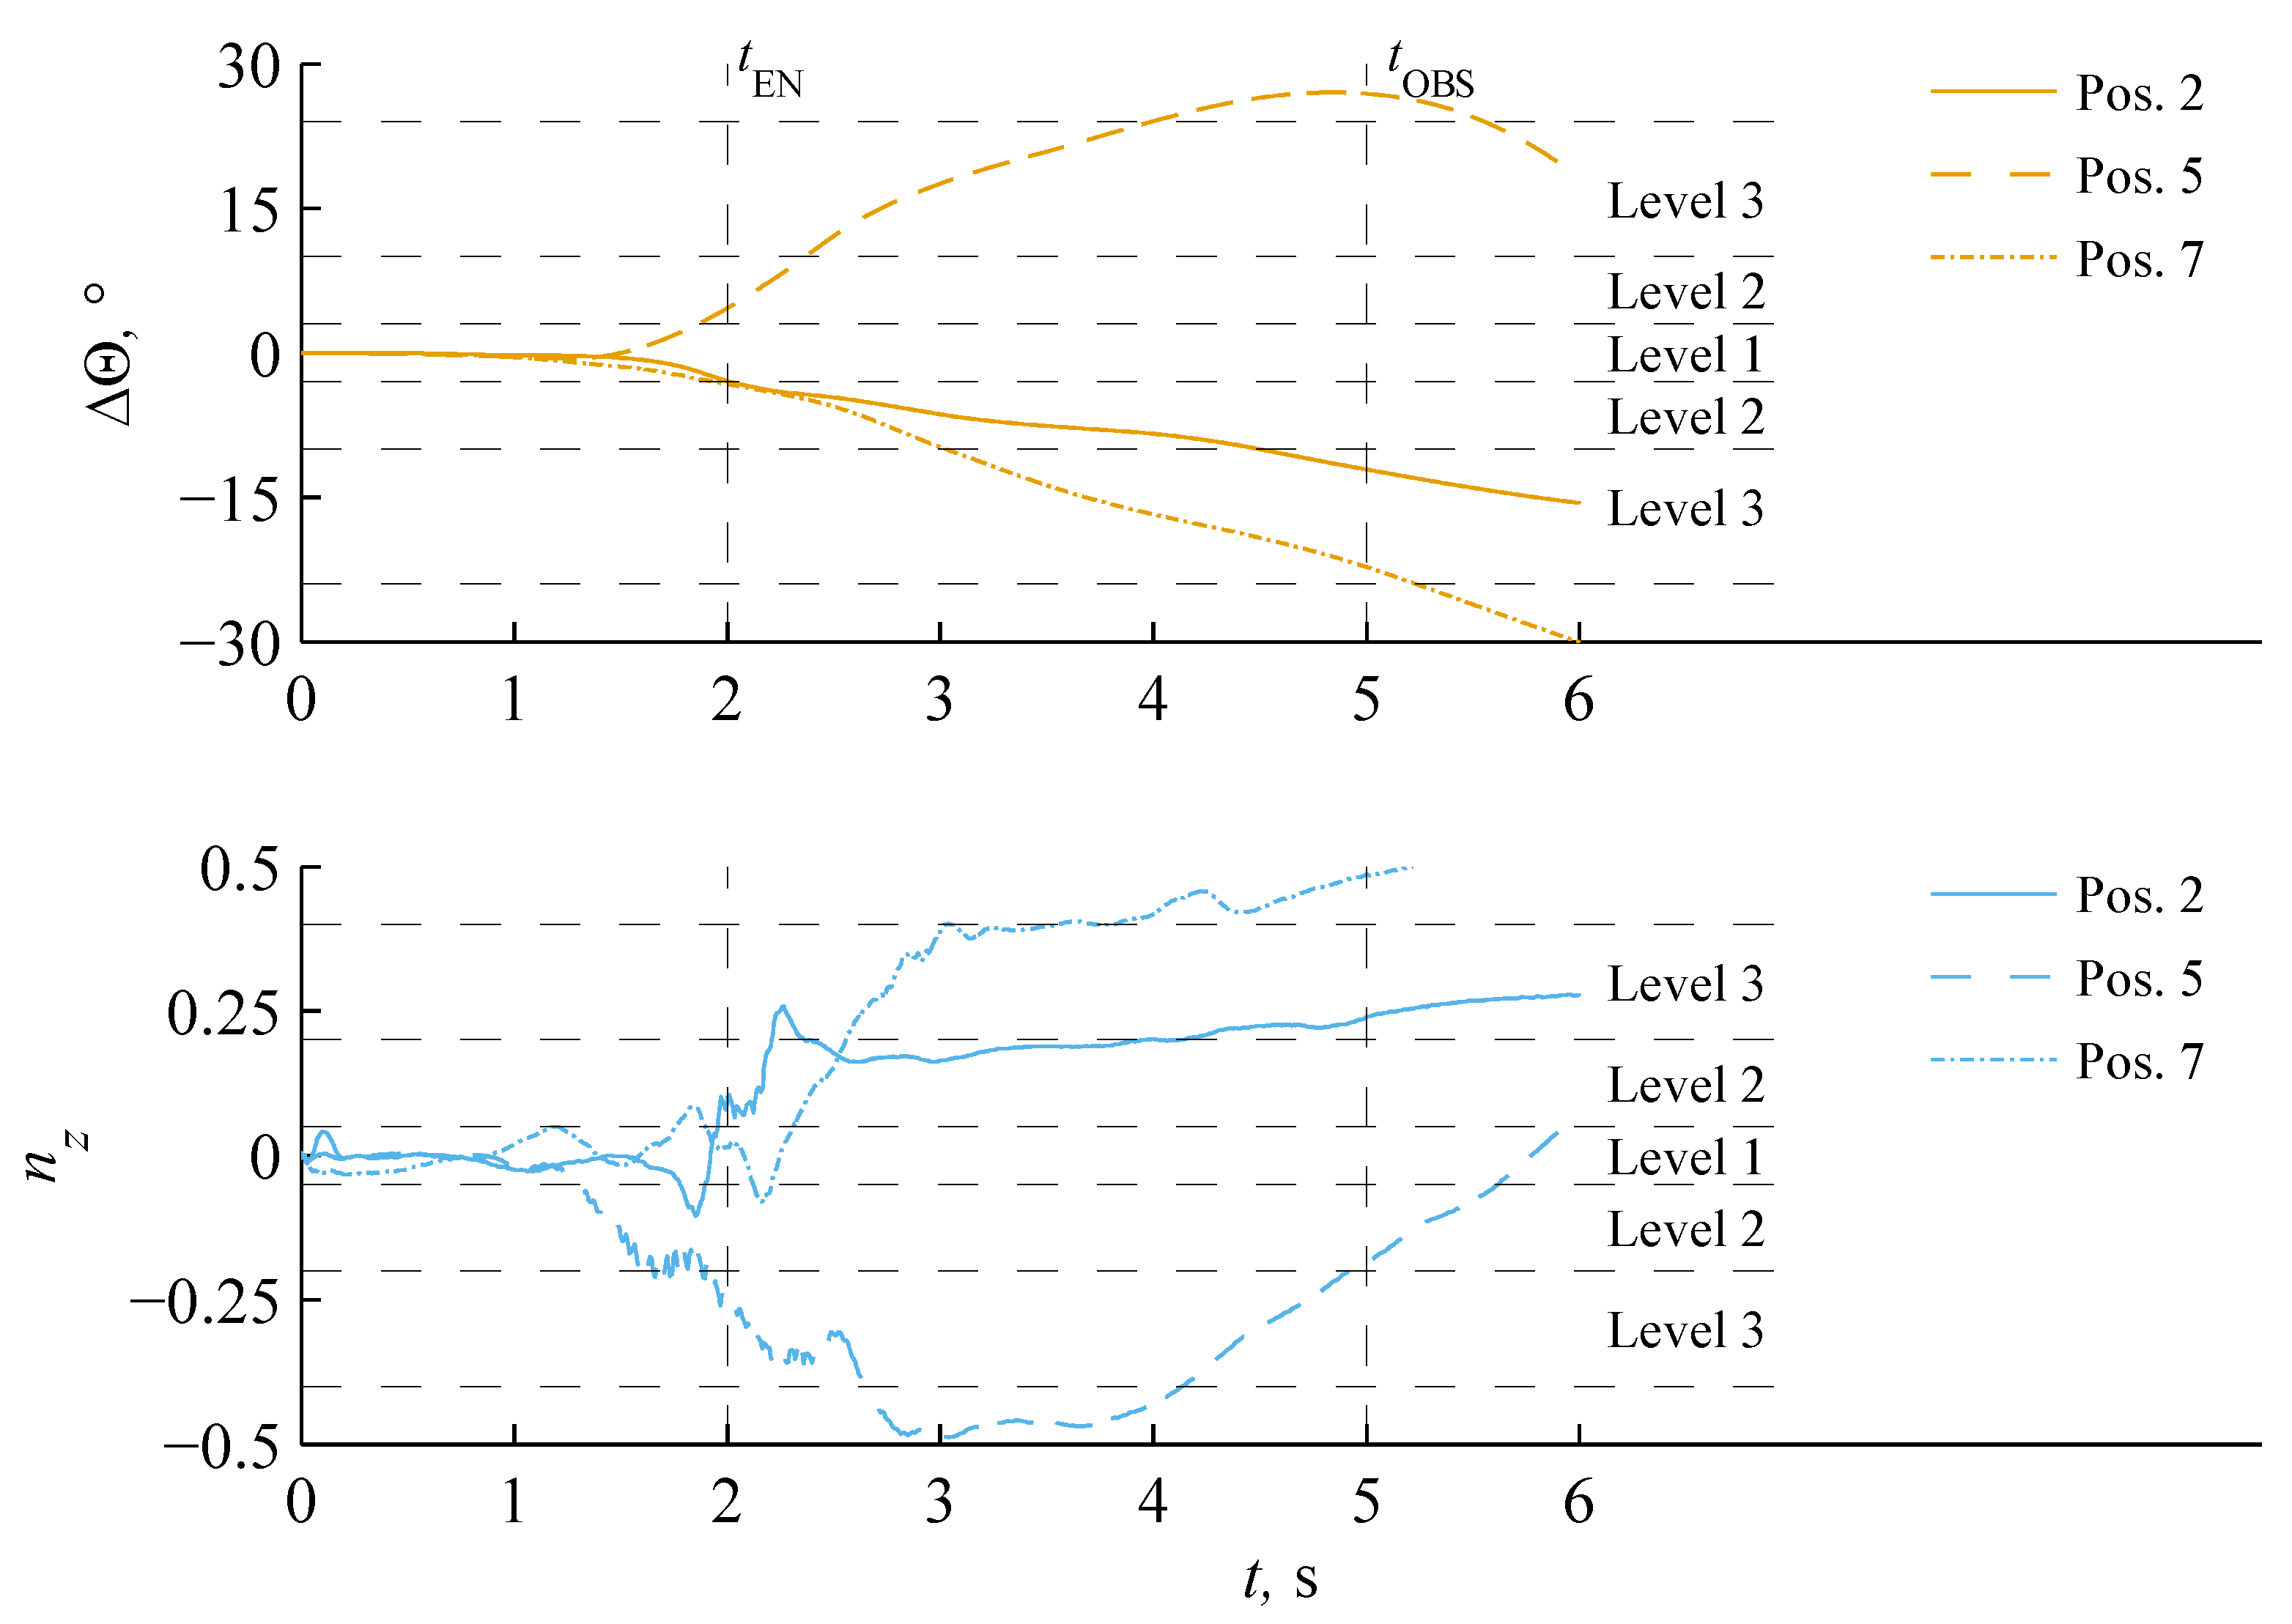
Figure 18 shows exemplary attitude changes ( Δ Φ , Δ Θ , Δ Ψ ) and load factors ( n x , n y , n z ) for the non-piloted simulation of C1 at position 2. The limits of the ADS-33 offline criteria from Table 8 are indicated by horizontally dashed lines. The evaluation time frame for the ADS-33 criteria started at the vortex encounter t EN , lasted for 3 s and ended at t OBS . At the beginning of the simulation, the helicopter was trimmed and a minor drift of the attitudes developed. At t 1.8 s , the first effects of the blade tip vortex on the helicopter are visible. After the vortex encounter t EN , the roll Δ Φ and pitch Δ Θ attitude diverged, and the yaw Δ Ψ attitude oscillated. The largest load factor was n z , which appeared directly after the vortex encounter t EN .
It can be seen that the maximum level of the ADS-33 offline criteria was determined by the load factor n z and the pitch attitude change Δ Θ . As described in detail in [16], this can be explained by the longitudinal vortex rotor interaction. Due to the aerodynamic excitation of the main rotor by the blade tip vortex, the rotor responded mainly with longitudinal flapping. As a result, large pitch moments of the helicopter occurred, which caused pitch down or up movements, depending on the flight direction through the blade tip vortex. Consequently, the following assessment of the non-piloted simulations could be reduced to the load factor n z and the pitch attitude change Δ Θ .
Figure 19 shows a comparison of the pitch attitude change Δ Θ and the load factor n z for the non-piloted simulation of C1 between position 2, position 5 and position 7. The limits of the ADS-33 offline criteria are indicated by horizontally dashed lines, and only non-piloted simulations with flight direction west are depicted. As indicated, the helicopter’s reactions strongly depended on the vortex encounter position. Due to the ambient atmospheric turbulence and vortex deformations, the helicopter’s reactions deviated from clear pitch-up or pitch-down behavior and even changed its direction. In contrast, the non-piloted simulations of the SWM showed expected, clear pitch-up or pitch-down behavior, depending on the flight direction, though they are not shown here.
A summary of the assessment with the ADS-33 offline criteria is depicted in Table 9. It shows the results of all vortex encounter positions with longitudinal vortex rotor interaction (position 2, position 5, position 7), both flight directions and both airwake data (C1 SWM). If possible, the determining factor ( Δ Θ or n z ) is indicated by a superscript. It can be seen that the impacts of the vortex encounters were at the border of levels 2–3 and above, independently of the flight direction. The levels of SWM do not show a noticeable dependency on the distance to the WT. In contrast, the levels of C1 increased at position 5 and position 7, which were further away from the WT. Therefore, an increase in the impacts of the vortex encounters can occur with increasing distance to the WT. This can be explained at position 5 with effects such as vortex merging (Figure 8) and vortex deformations, which may cause larger helicopter reactions.
According to the ADS-33 offline criteria in Table 8, vortex encounters larger than level 3 may occur at medium to far distances from the WT, which violates the specifications. These predictions are further examined with piloted simulations in the next section.

6.2. Piloted Simulation

6.2.1. Results of OS-1

For the piloted simulations of OS-1, all vortex encounter positions from Table 3 were examined with airwake data C1 and C2. Due to the limited time of the campaign, only transit flights with flight direction west were examined. Exemplary results are given for position 5, which had the largest predicted vortex impact in the offline analysis (Table 9).
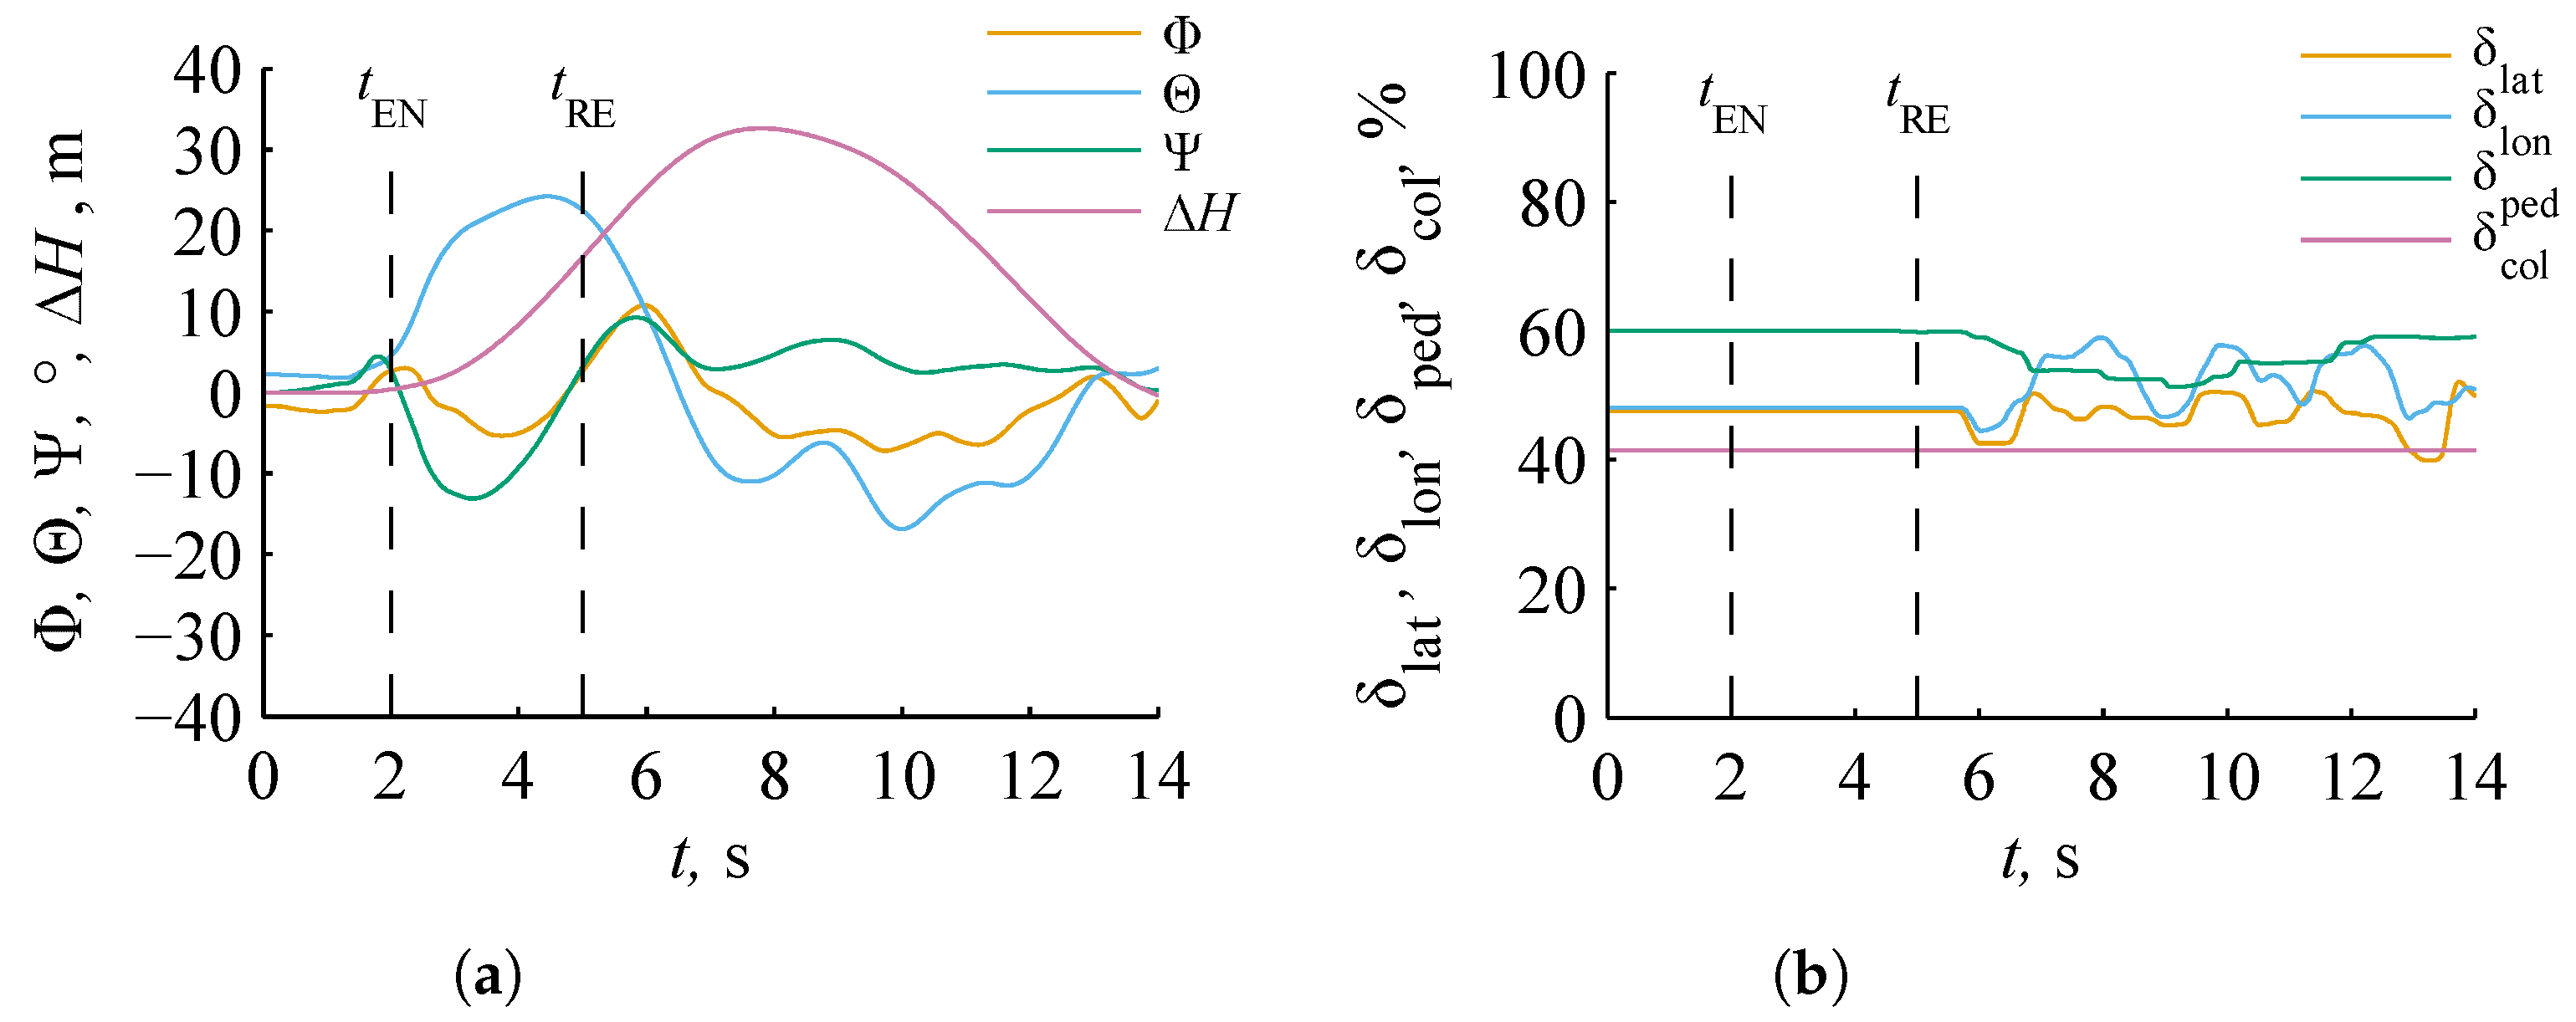
Figure 20a,b shows exemplary the pilot input ( δ lat , δ lon , δ ped , δ col ) and the helicopter reactions ( Φ , Θ , Ψ , Δ H ) for position 5 at the upper boundary (Figure 2). As already described, ambient atmospheric turbulence caused a small drift at the beginning of the simulation. At t 1.7 s , the first influence of the WT blade tip vortex can be seen by a pitch-up movement. This pitch-up movement increased and the helicopter started to gain altitude Δ H , even after the vortex core was encountered at t EN 2.0 s . An unstable oscillation occurs in roll Φ and yaw Ψ axes. The pilot was allowed to start the recovery maneuver at t RE = 5.0 s , but the actual recovery maneuver started slightly delayed at t = 5.6 s . This was due to delays between radio instructions by the simulation operator and the actual response time of the pilot. Mainly pitch δ lon and roll inputs δ lat were given by the pilot to recover the helicopter. Very low activity on pedal input δ ped is used to stabilize the yaw axis Ψ and no collective inputs δ col were used to correct the altitude. The helicopter was recovered and stabilized after t = 14.0 s .
Overall, relative attitude changes amounted to 20 for the pitch axis Θ and to ± 15 for roll Φ and yaw Ψ axes. Furthermore, an altitude gain Δ H of up to 30 m occurred. The largest pilot inputs were pitch δ lon and roll inputs δ lat with a range of ± 15 % relative to the trim with sufficient control margins.
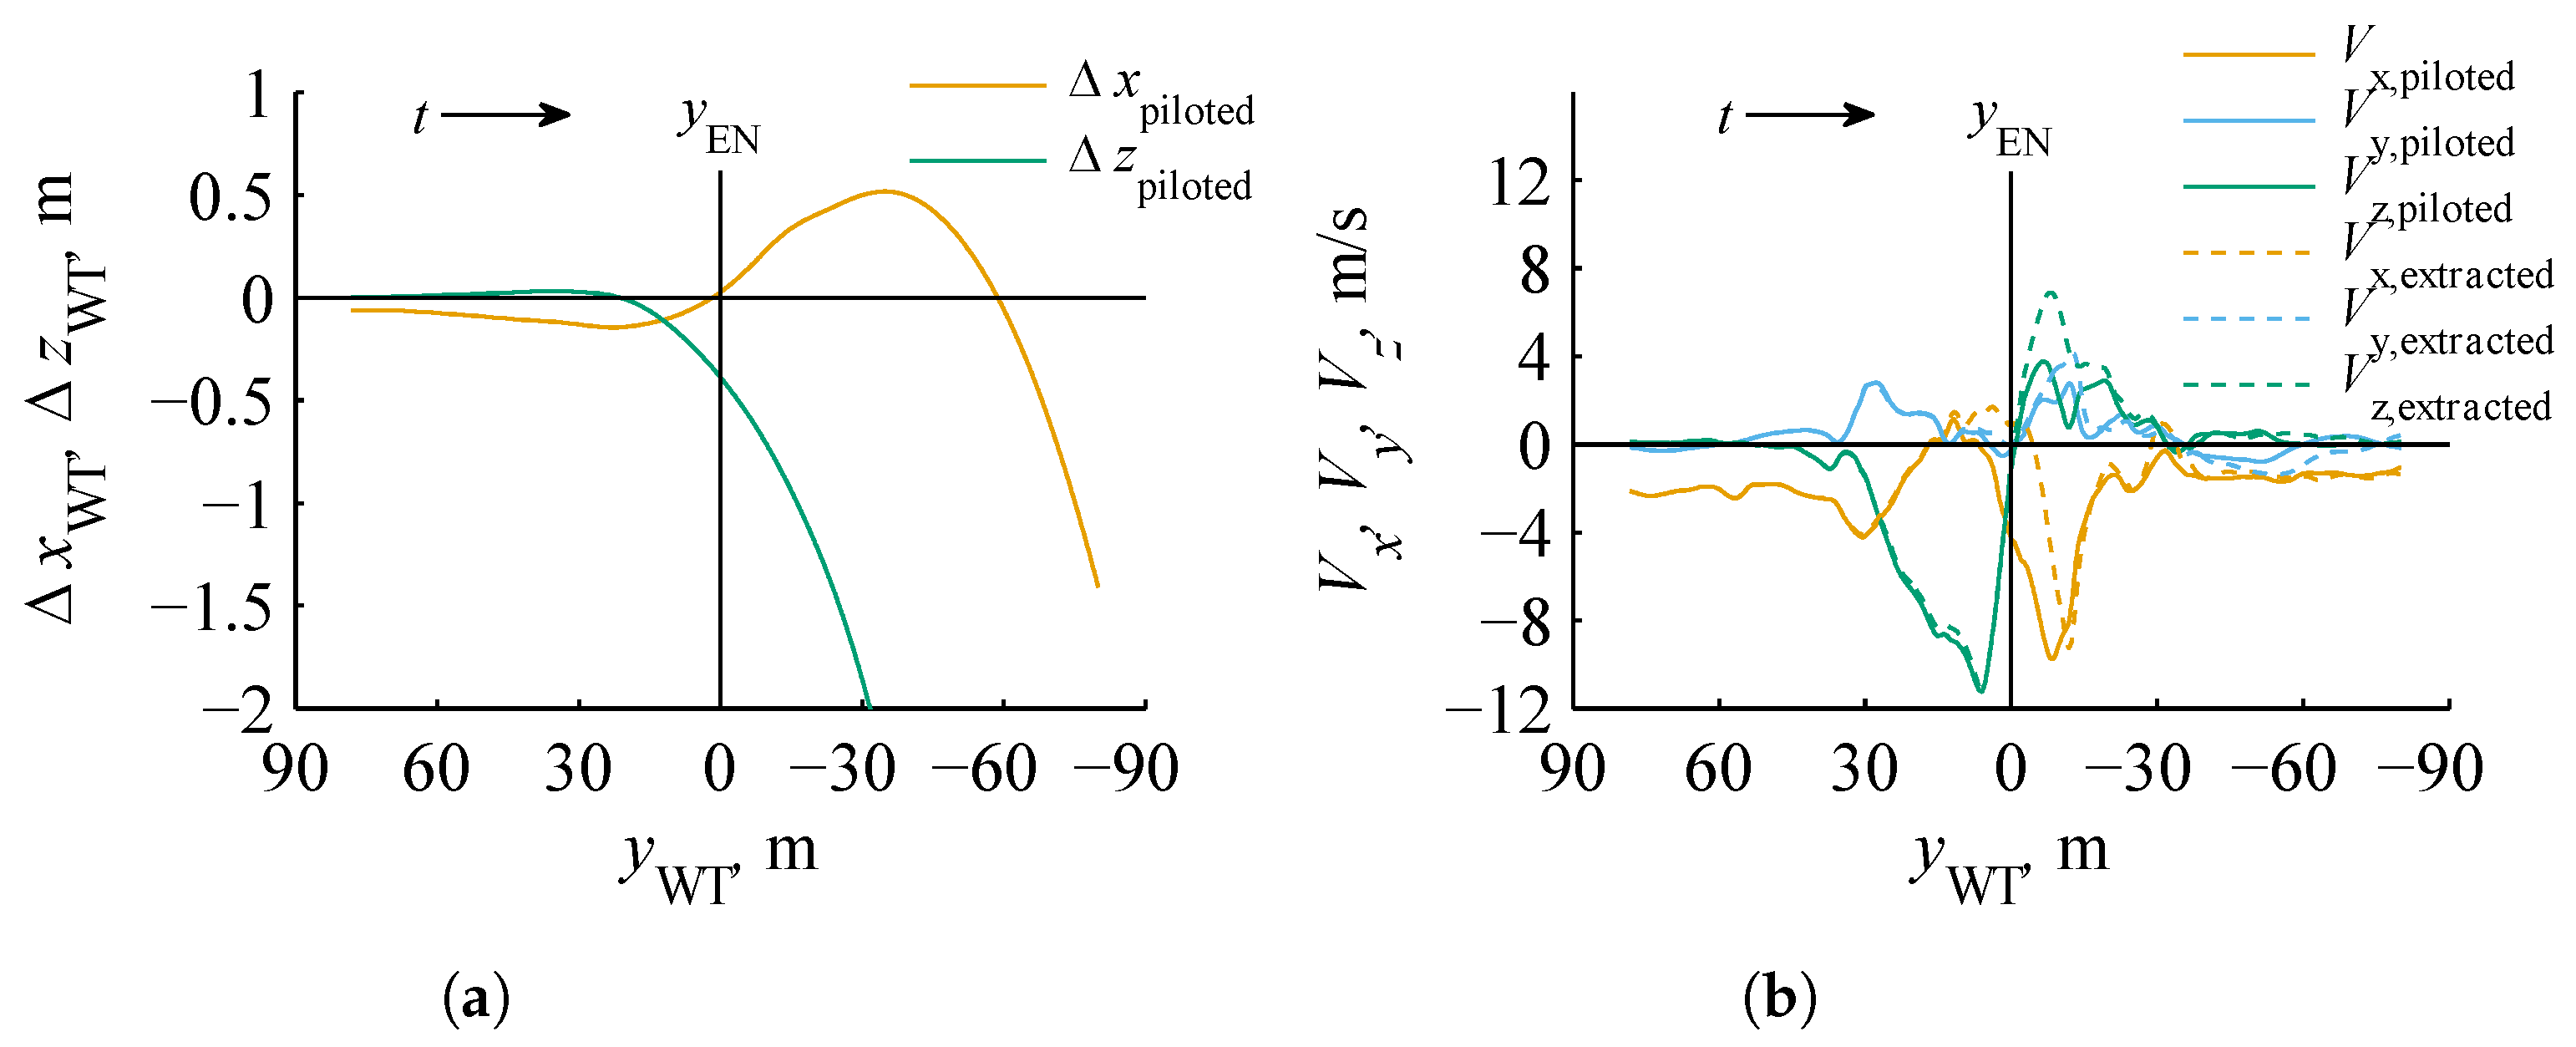
Figure 21 shows a comparison of the flight path deviations ( Δ x piloted , Δ z piloted ) and airwake velocities ( V x , V y , V z ) between the piloted simulation and an extracted ideal, straight-line flight path. The helicopter was trimmed with minor deviations from the ideal flight path, started to drift slightly at the beginning of the simulation and encountered the vortex core at y EN = 0.0 m with a deviation of approximately 0.5 m (Figure 21a). For the longitudinal vortex rotor interaction, the airwake velocity V z is most relevant. Figure 21b shows that the velocity profile and the peak value were sufficiently well captured till the vortex encounter at y EN = 0.0 m , and the subsequent deviations were based on helicopter reactions. Note that Figure 21b shows an oblique vortex encounter and is not suitable for determining the vortex core radius R c .
Figure 21b shows an unusually wide area ( 10 m < y < 30 m ) with high values of the airwake velocity V z . As shown in Figure 17, rather fine peak values of the airwake velocity V z were expected from C1. This can be explained by deformations of the blade tip vortex helix within the CFD simulation. Figure 22 shows the blade tip vortex helix at position 5 and the extracted ideal, straight-line flight path. The ideal flight path is nearly parallel to the vortex axis at the upper boundary. Therefore, the influence of the vortex encounter on the helicopter was prolonged for this flight path, as indicated, which caused larger helicopter deviations. Furthermore, additional aerodynamic effects such as vortex merging were found for position 5 (Figure 8).
Figure 23 shows the subjective pilot assessments of OS-1. The ratings of the three pilots are split into the airwake data C1 ( V W = 11.3 m / s ) and C2 ( V W = 25.0 m / s ) and different flight altitudes (Up—altitude upper boundary, Hub—altitude hub height). Each case is described by minimum, maximum and average rating. Note that the position order at hub height (position 7, position 5, position 2) and at the upper boundary (position 13, position 11, position 8) represent increasing distance to the WT from right to left.
The TS ratings in Figure 23a partly contain a high scatter and a range of up to TS-6 (moderate turbulence). For transit flights at hub height, a weak trend to larger perceived turbulence in proximity of the WT might be visible for both wind speeds V W , but must be considered with care due to the high scatter. In contrast, there is no clear trend for transit flights at the upper boundary, but position 5 at V W = 11.3 m / s and position 2 at V W = 25.0 m / s are of particular interest. As already described, the former caused larger perceived turbulence due to the aerodynamic effects. The latter suffered from unfavorable helicopter trim conditions, which caused large drifts at the beginning of the simulation.
The scatter of the USR-ratings in Figure 23b is lower compared to the TS ratings, and all USR-ratings are below D (minor hazard). A potential trend toward increased ratings in proximity of the WT is visible for transit flights at hub height for both wind speeds V W . However, there is still no trend visible for transit flights at the upper boundary. Once more, position 5 at V W = 11.3 m / s and position 2 at V W = 25.0 m / s are conspicuous.
Both subjective pilot assessments show similarities. However, the pilots were more confident evaluating the vortex encounter with the USR scale, which can be seen by the decreased scatter. Overall, the pilots perceived moderate turbulence and somewhat large helicopter reactions due to the artificial pilot response time, but the recovery of the helicopter was never considered a major hazard. Consequently, the impact of the same vortex encounter was considered less severe in the piloted simulations compared to the offline analysis. These results were achieved by very conservative assumptions (artificial pilot response time, helicopter with BA response type, rotor-centered vortex encounters) and with pilots with very different flight experience.

6.2.2. Results of OS-2

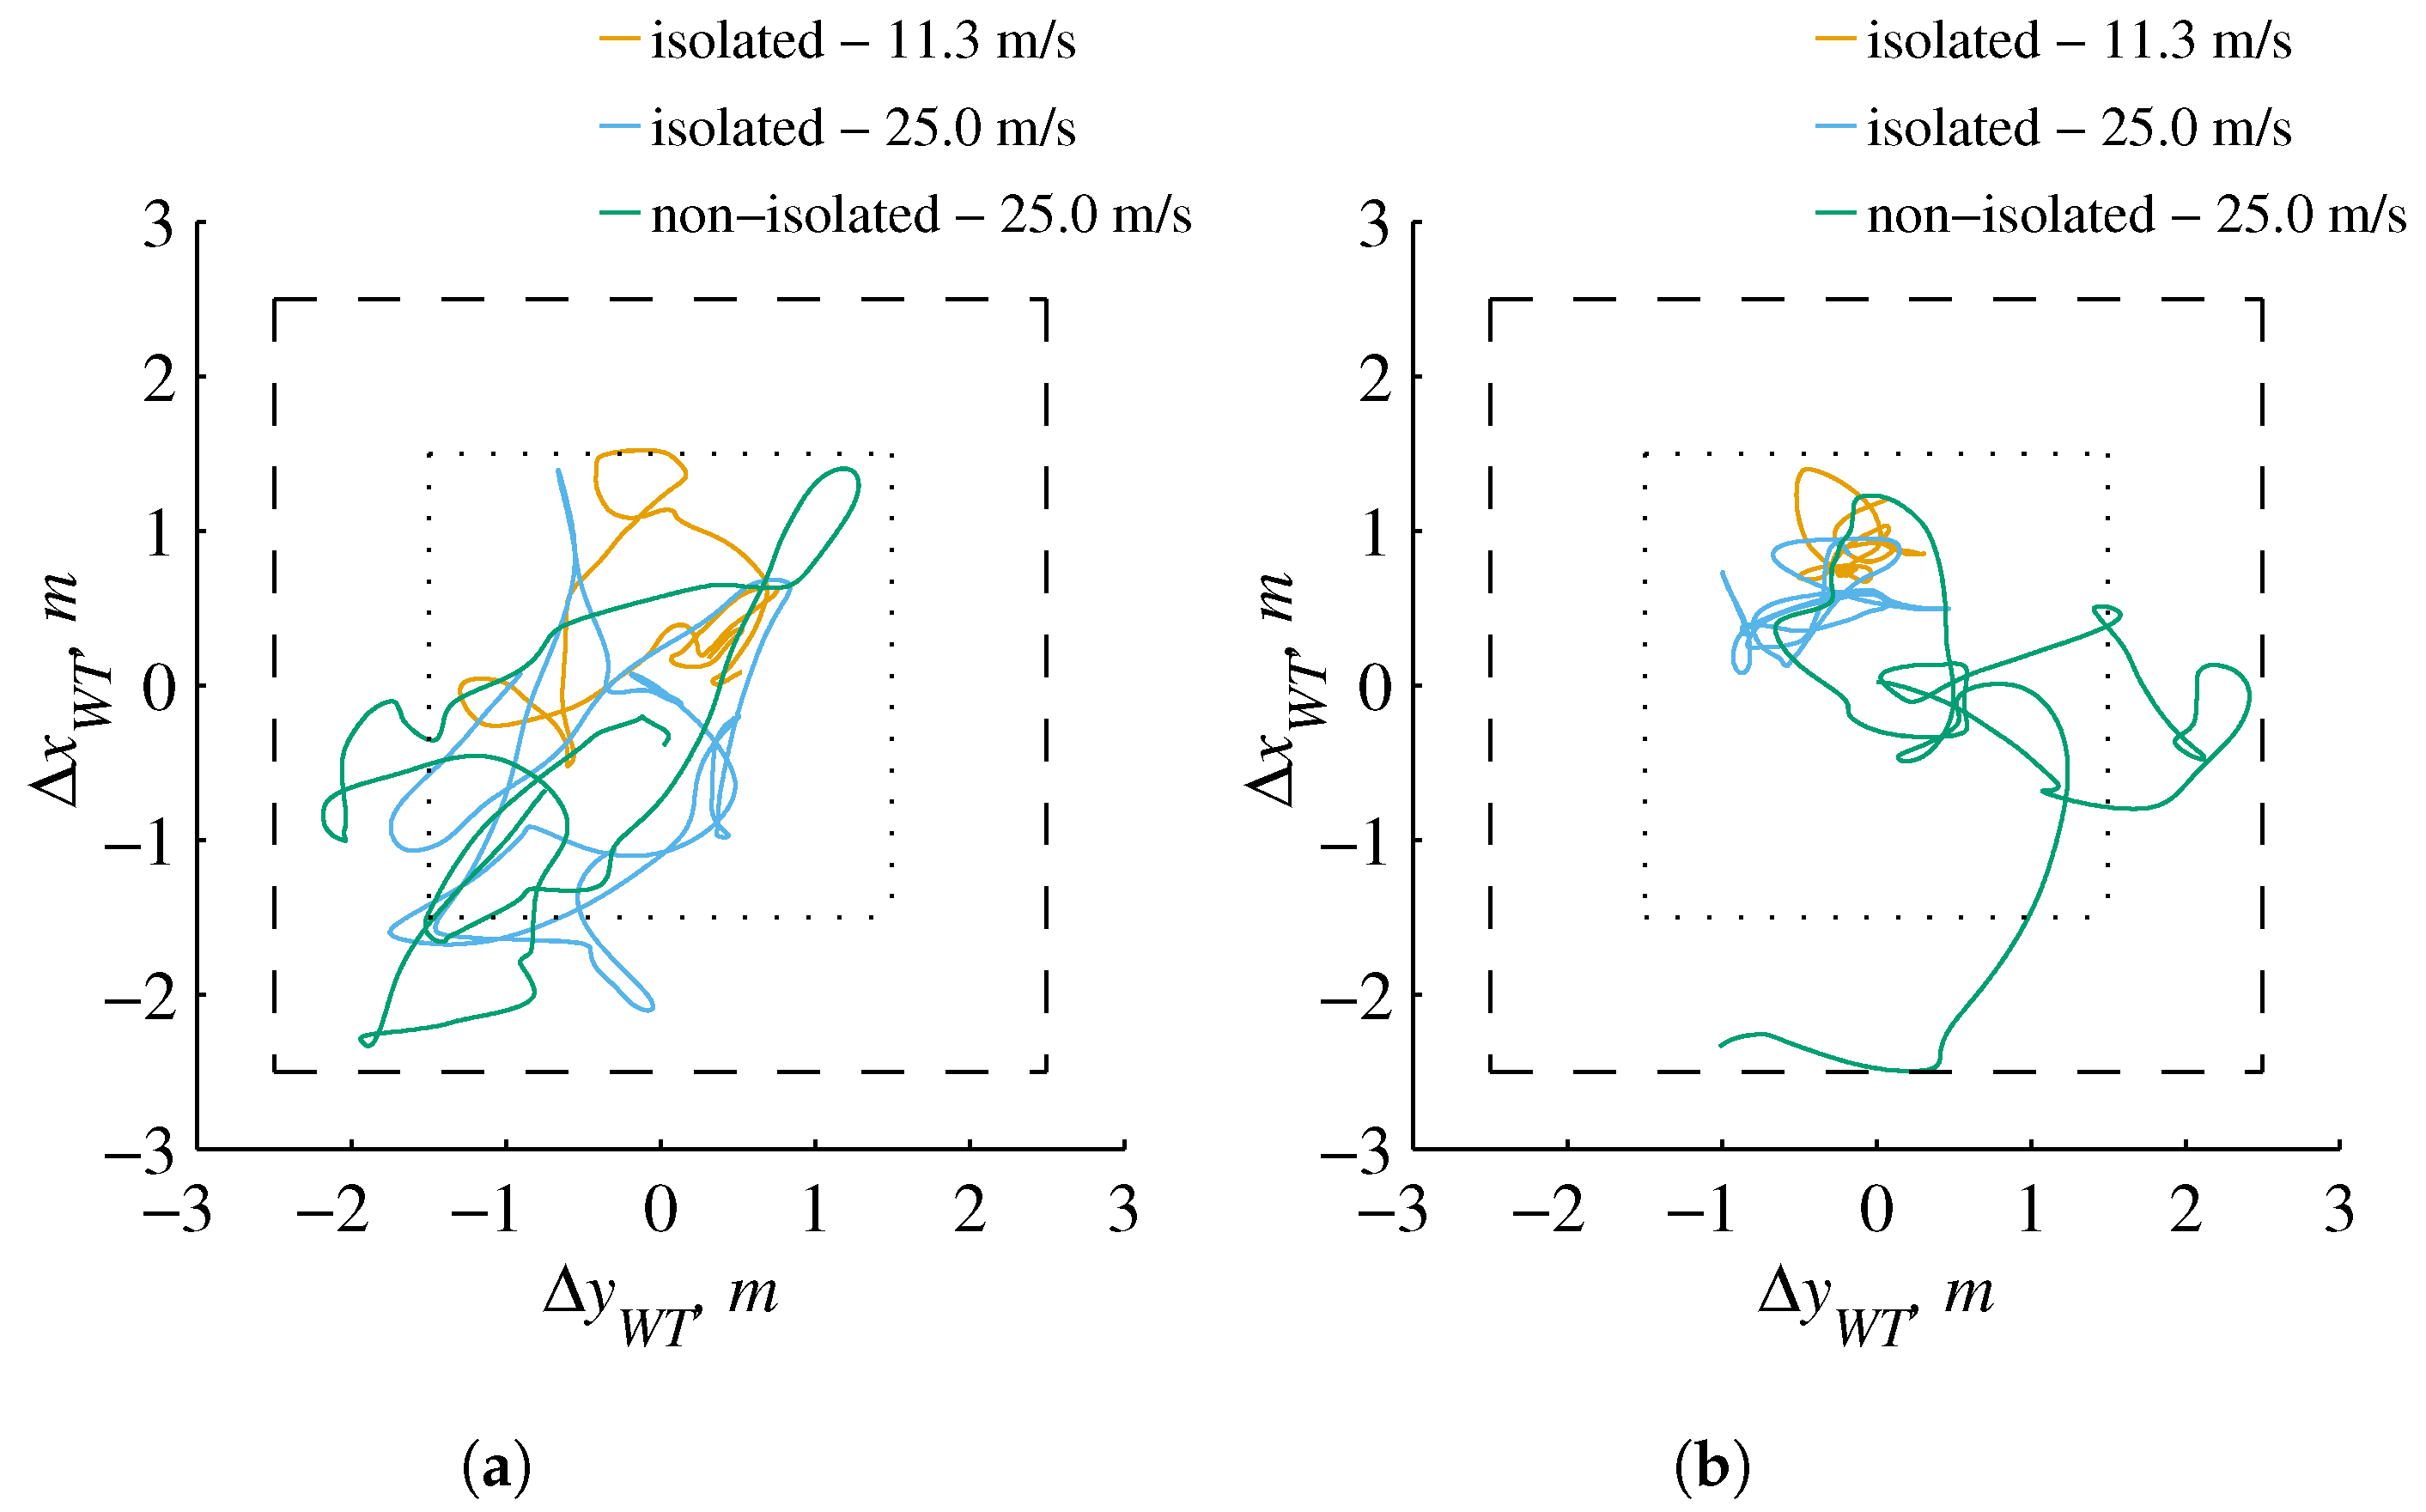
For the piloted simulations of OS-2, the hover task was performed with airwake data C4, C5 and C7 (Table 1). Figure 24 shows exemplary the longitudinal Δ x and lateral Δ y positions of the helicopter winch above the WT nacelle of Pilot A for different wind conditions and different helicopter response types (BA, AC). Furthermore, the longitudinal and lateral limits from Table 7 are depicted, and only the 30 s hover phase is shown.
For the helicopter with BA response type, desired task performance was only achieved at a medium wind speed of V W = 11.3 m / s (Figure 24a). The task performance decreased to adequate with a wind speed of V W = 25.0 m / s . The additional turbulence for the non-isolated WT caused a further decrease in task performance, but it still remained adequate. Figure 24b shows that in general the task performance improved for the helicopter with AC response type. The fluctuations decreased, and both cases with isolated WTs clearly allowed the desired task performance. For the non-isolated WT, no task performance improvements and lateral deviations of up to Δ y + 2.5 m are visible, which correspond to a drift towards the WT rotor disk. It must be noted that Pilot A showed a loss of concentration and exhaustion during the last simulations. It is considered that the strong decrease in pilot performance for the non-isolated WT was based on human factors rather than on turbulence.
Overall, the largest lateral deviations of Δ y max = ± 3.0 m were detected for the helicopter with BA response type by another pilot and are not displayed here. Therefore, this value is considered as a conservative estimate for potentially critical drifts towards the WT rotor disk and corresponds to a usage of 60 % of the lateral safety clearance. Note that for the EC135, a lateral safety clearance of ≈ 5 m was applied (Figure 1b).
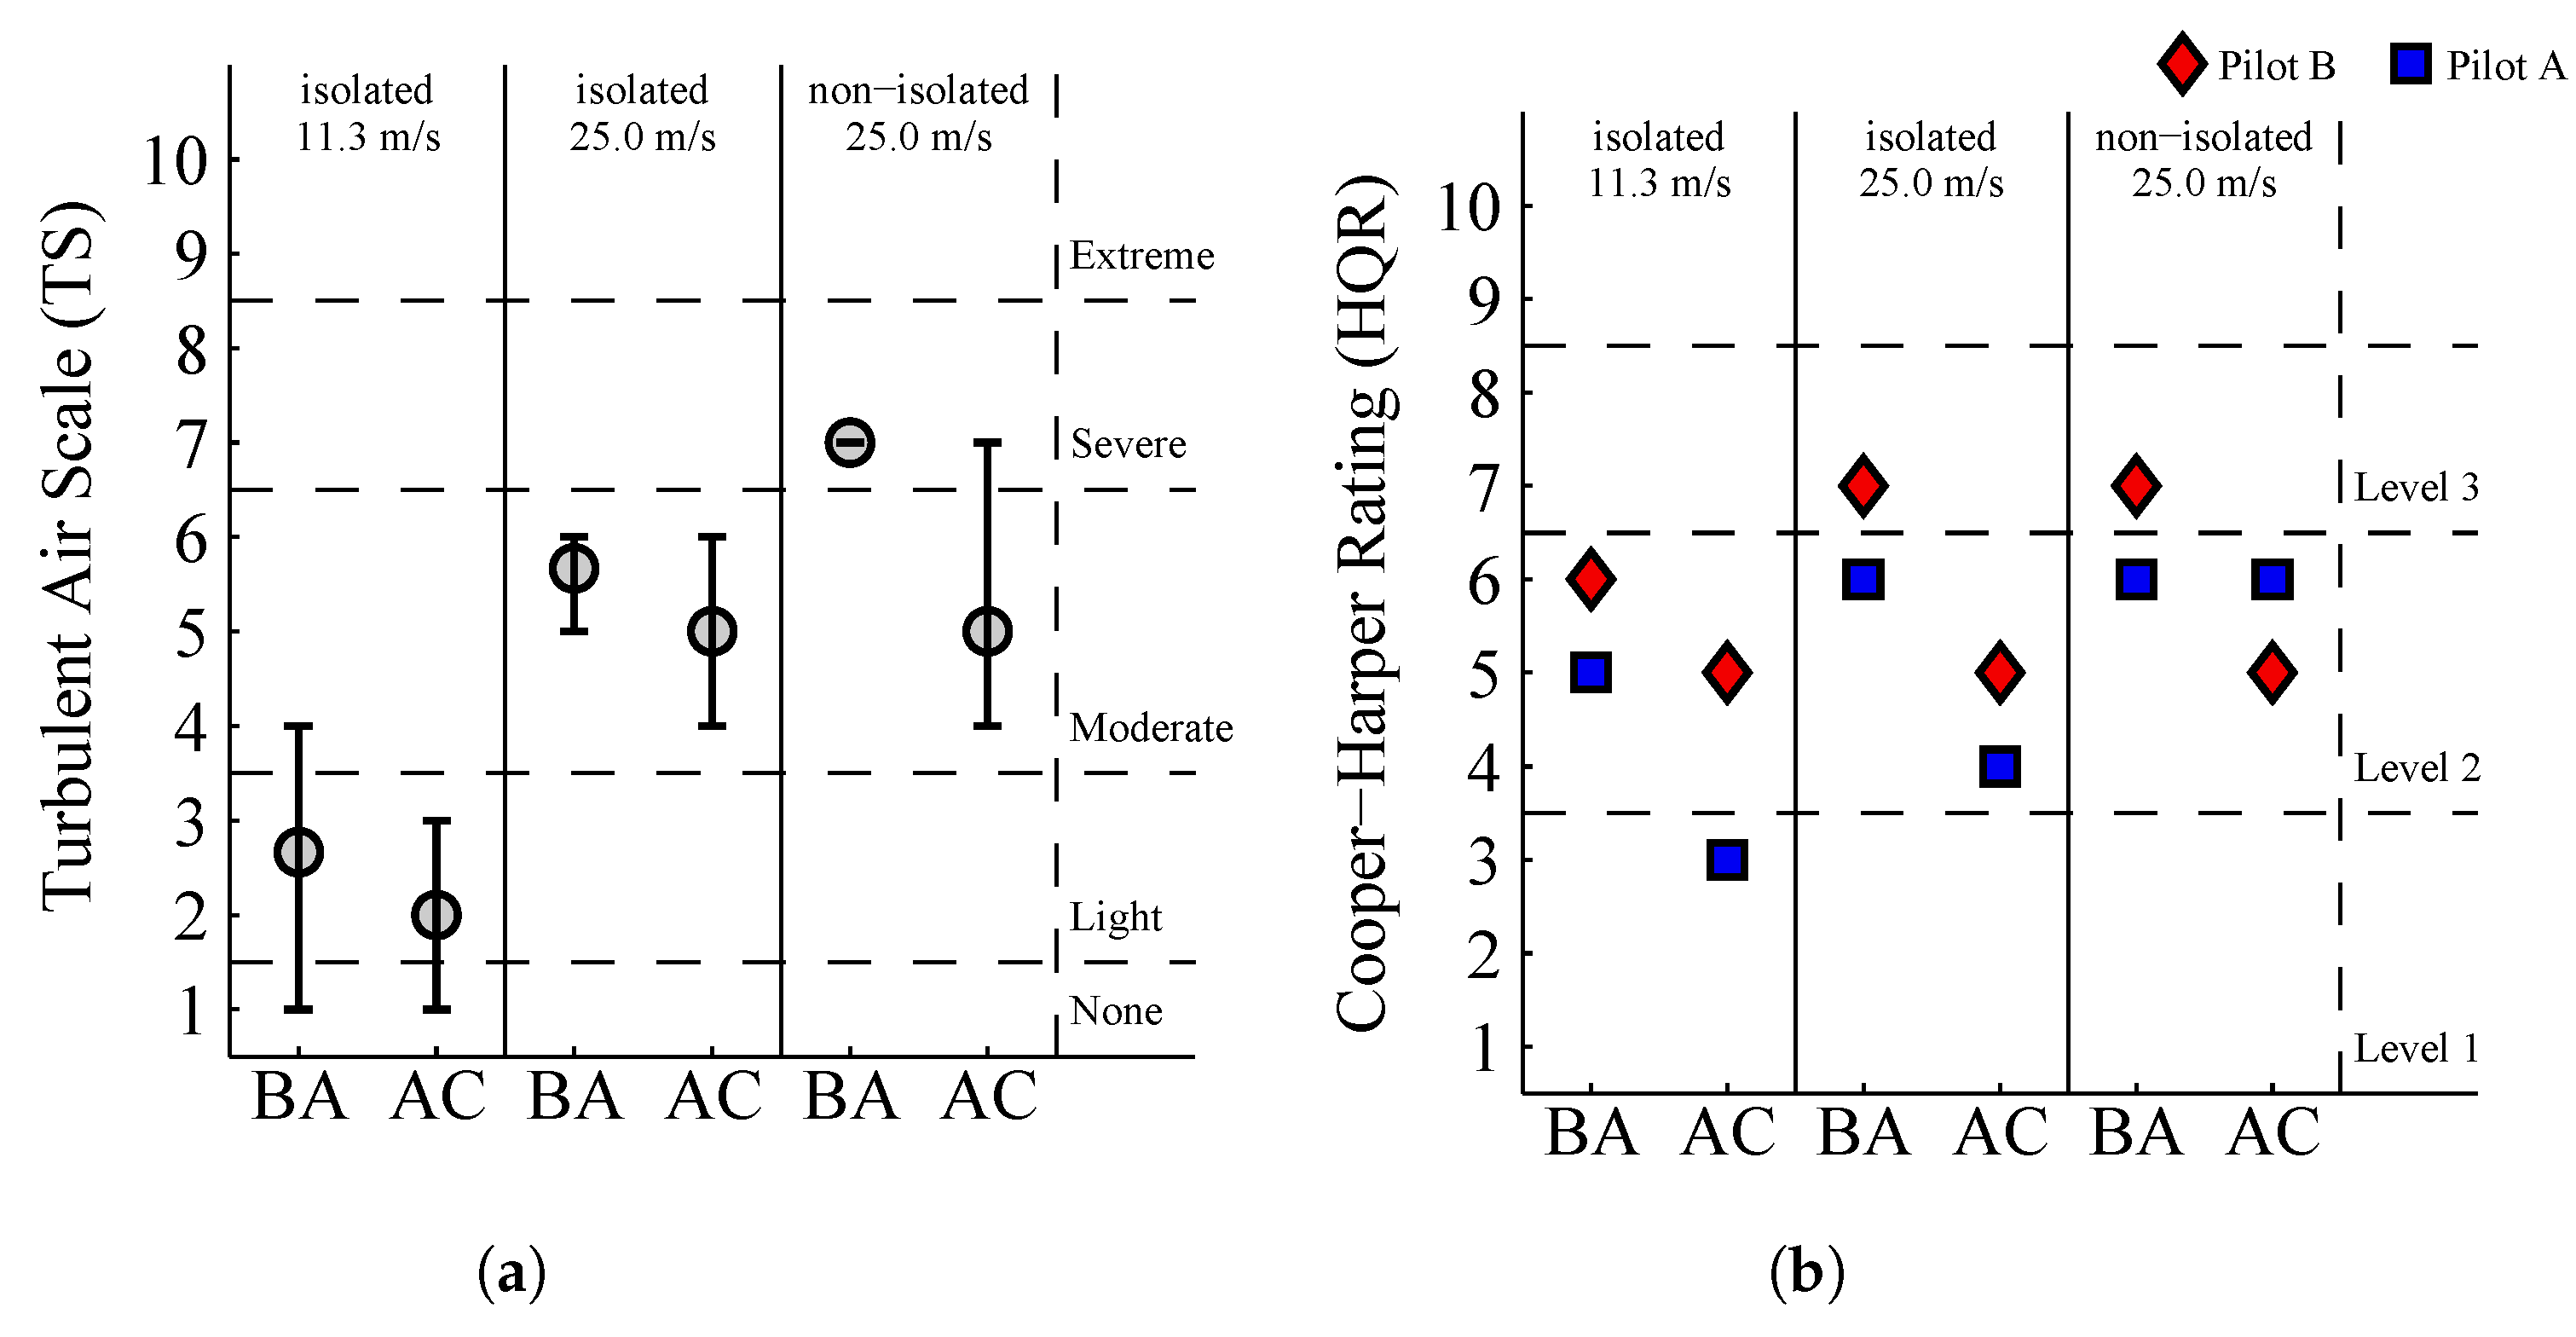
Figure 25 shows the subjective pilot assessment of the hover task. The ratings of the pilots are split into the different wind conditions and helicopter response types. The results of the TS rating are described by minimum, maximum and average rating (Figure 25a). In contrast, the HQR ratings have only been evaluated by the experimental test pilots and are depicted separately (Figure 25b).
Figure 25. Subjective pilot assessment of the hover task at different positions (BA—helicopter with bare-airframe response type, AC—helicopter with attitude-command attitude-hold response type). (a) Turbulent Air Scale (TS, Table A2). (b) Cooper–Harper Handling Qualities Rating Scale (HQR, Figure A2).
Energies 15 01790 g025
The TS ratings in Figure 25a have a high scatter and range up to TS-7 (severe turbulence). A comparison between the helicopter response types shows that the perceived turbulence decreased in any one wind condition for the helicopter with AC response type. Consequently, deficiencies of a poor helicopter response type were perceived wrongly as additional turbulence. Furthermore, a clear increase in the perceived turbulence is visible for an increase in the wind speed to V W = 25.0 m / s . For the case of the non-isolated WT, only a slight increase in the perceived turbulence is visible. This behavior fits the standard deviation of the vertical velocity component σ w in the helicopter rotor area of Table 4.
The most HQR ratings are mostly within level 2, which is considered acceptable for this pilot task (Figure 25b). Only two single ratings of the helicopter with BA response type are within level 3 and are not considered acceptable. The ratings of the helicopter with AC response type are lower or equal compared to the helicopter with BA response type. Furthermore, an increase in the wind speed to V W = 25.0 m / s increased the HQR ratings. However, the HQR ratings did not further increase for the non-isolated WT, even though slightly higher turbulence was perceived. In general, the HQR ratings of Pilot B were higher compared to Pilot A. It is assumed that this behavior was based on the practical experience of Pilot A in offshore wind farms (Table A1). The HQR ratings show that handling qualities of the helicopter with AC response type are still acceptable for this pilot task, but improvements are recommended.

7. Discussion

7.1. Discussion of OS-1

Offline analysis and piloted simulations in OS-1 were used to examine the size of the flight corridor within an offshore wind farm. The definition of a pilot task with high reproducibility was a challenge, because it is difficult to hit the relatively small vortex cores with the helicopter’s main rotor in a comparable way. Trade-offs were made between the depth of the simulation for the pilots (very short simulation time before vortex encounter t EN 2 s ), precision of vortex encounter (deviations Δ x piloted and Δ z piloted ) and degree of realism (artificial pilot response time of 3 s ). The resulting pilot task is considered suitable with sufficient precision of vortex encounters (deviations Δ x piloted and Δ z piloted of approximately ± 0.5 m ) compared to the vortex core radius ( 0.80 m < R c < 2.96 m ).
Simulation improvements might be made by an automatic flight path control system which holds a fixed trajectory through the vortex core. After the vortex encounter, the flight path control system should automatically be turned off and the helicopter recovered manually by the pilot. The usage of an artificial pilot response time is recommended to simulate divided attention of the pilot. The artificial pilot response time of 3 s was chosen for direct comparison with the ADS-33 offline criteria (Table 8) and to increase the partly weak effects of the vortex encounter for the analysis. For less conservative and more practical approaches, a reduced artificial pilot response time is recommended. Furthermore, the flight direction of the helicopter should be aligned with the local vortex axis at the vortex encounter to maximize its effect. Lastly, the influence of WT wakes of more than 5 MW only were approximated in previous studies [8]. In consideration of the trend toward more powerful offshore WTs, those examinations should be verified with flow fields from high-fidelity CFD computations.
The transit flight results were achieved by conservative assumptions (long artificial pilot response time, helicopter with BA response type, rotor-centered vortex encounters) and with pilots with very different flight experience. Furthermore, the simulations were partly performed very close to the WT (operational practice 330 m in GTI), which tends to increase the impact of the vortex encounter due to vortex aging effects [14]. The rather low airspeed of V = 80 kt was expected to increase the impact of the vortex encounter, because the helicopter would remain longer in the influential area of the blade tip vortex. This corresponds to an advance ratio of μ 0.2 , which fulfills the guidelines for rigid line vortex modeling approaches from [18]. Effects which decreased the impact of the vortex encounter were neglected (vortex deflection [17], stabilization through a flight control system, etc.).
Overall, the results are considered conservative estimates of the impacts of vortex encounters at current operational offshore wind farms. Nevertheless, additional validation by measurements of WT wake and flight tests with instrumented helicopters in offshore wind farms are recommended.

7.2. Discussion of OS-2

Piloted simulations of the hover task in OS-2 were used to examine the lateral safety clearance to the helicopter hoist area of offshore WTs. In reality, helicopter hoist operations are complex maneuvers, consisting of precision hovering, an additional slung load and communication between the pilot and the hoist operator in an adverse environment. In this study, it was approximated by a hovering task with simulated communication between the pilot and a hoist operator. The main focus of this study was to investigate the influence of turbulence on the helicopter in a realistic simulation. A common medium wind speed of V W = 11.3 m / s and a very high wind speed of V W = 25.0 m / s , which is slightly above usual operating procedures, was chosen. Furthermore, the impact of additional turbulence from a rotating WT upstream of the helicopter hoist area of the non-rotating WT at a wind speed of V W = 25.0 m / s was examined. The same case was considered for a wind speed of V W = 11.3 m / s , at which the upstream rotating WT operated with the expected strong blade tip vortices, but this was not examined due to limited time.
A possible improvement to the simulation would be the implementation of a slung load in the pilot task, which should be affected by the turbulence. Note that in reality the hoist operator would dampen the slung load’s movements by horizontally pushing and pulling the hoist cable, which cannot be directly simulated in a flight simulator. Further aspects such as bad weather and low visibility would have an influence on the task performance as well, and should be examined in future studies.
Nonetheless, the results of the hover flight were achieved by conservative assumptions (helicopter with BA response type without stabilization, unusually high wind speed, additional turbulence from an upstream WT) and with pilots with very different flight experience. In addition, piloted simulations for comparisons were performed with a helicopter with AC response type, whose characteristics are comparable to the response type of a commercial EC135 helicopter.
Overall, the results are considered conservative estimates of helicopter hoist operations at offshore WTs, and the simulation fidelity received favorable comments from the pilots. However, a validation of the simulation results by flight tests with instrumented helicopters in offshore wind farms is recommended.

8. Conclusions

A simulation campaign using a light utility helicopter at AVES was conducted to assess potential risks in offshore wind farms for helicopter operations. Two operational scenarios were derived through consultation with the German authorities LBA and BSH to examine transit flights within offshore wind farms and hover flights at single offshore WTs. Both were assessed in a dedicated maritime visual environment of the wind farm GTI with weather effects, dynamic waves, rotating WTs and turbulence interactions based on highly resolved CFD-based flow fields. Conservative assumptions were made to take into account simulation deficiencies and to estimate operational limits. Based on this effort, the following key conclusions were made:
  • Transit flight
    -
    The helicopter’s reactions with CFD flow fields can be larger than in the SWM due to blade tip vortex helix deformation, vortex merging and additional turbulence. Those aerodynamic effects can increase the impacts of vortex encounters at medium to far distances from the WT.
    -
    Non-piloted simulations of longitudinal vortex rotor interaction between a helicopter with BA response type and a WT blade tip vortex helix may cause vortex encounters higher than level 3 by ADS-33 offline criteria.
    -
    In contrast, piloted simulations with an artificial pilot response time of 3 s showed that those helicopter reactions can be recovered with little danger.
    -
    Overall, the simulations suggest that the sizes of current flight corridors in offshore wind farms are sufficiently large for the considered scenario. Transit flights at different altitudes, in close proximity to WTs and at various wind speeds, have always been recovered without much risk.
  • Hover flight
    -
    The perceived turbulence and the pilot compensation increased with increasing wind speed V W . Additional turbulence at a non-isolated WT was perceived, but for this specific case it did not necessarily cause additional pilot compensation.
    -
    The largest lateral deviations of Δ y max = ± 3.0 m were estimated with a helicopter with BA response type and at an unusually high wind speed of V W = 25.0 m / s . Consequently, the lateral safety clearance towards the WT was made 60 % .
    -
    Overall, the simulations suggest that the lateral safety clearance is sufficiently large for the considered scenario. Probably, hoist crew comfort and safety are more limiting than the lateral safety clearance.
Future work should focus on validation of the simulation results and the consideration of more powerful offshore WTs. For the CFD computations, additional flow field measurements in the wake of offshore WTs are desirable to evaluate the blade tip vortex aging behind large-scale WTs. In regard to the piloted simulations, further quantitative validation is needed for a profound transfer of the simulation results to reality. Therefore, flight tests with instrumented helicopters in offshore wind farms are desired. Afterwards, a validated simulation with potential improvements could be used to develop recommendation for dimensioning of safety clearances.

Author Contributions

Formal analysis, A.Š., D.H.G. and M.C.; investigation, F.H.; writing—original draft preparation, A.Š., D.H.G. and M.C.; writing—review and editing, A.Š. and T.L.; supervision, F.H., A.Š. and T.L. All authors have read and agreed to the published version of the manuscript.

Funding

This research was funded by the German Federal Ministry of Economic Affairs and Energy (BMWi), grant numbers 0324121A, 0324121B, 0324121C and 0324121D.
Energies 15 01790 i001

Institutional Review Board Statement

Not applicable.

Informed Consent Statement

Informed consent was obtained from all subjects involved in the study.

Data Availability Statement

Not applicable.

Acknowledgments

The authors would like to thank BSH, LBA, the Flight Service of the German Federal Police (BPOLFLS), Helicopter Travel Munich GmbH (HTM) and Windpark Heliflight Consulting GmbH (WHC) for their professional support and involvement, especially during the research work concerning regulations and operational procedures for helicopter operations in offshore wind farms. Furthermore, the authors would like to thank the helicopter pilots of LBA and BPOLFLS for the participation in the simulation campaign at AVES. Lastly, the authors gratefully acknowledge the High-Performance Computing Center Stuttgart (HLRS) for providing the computational resources necessary for the CFD simulations within the project WEALoads.

Conflicts of Interest

The authors declare no conflict of interest.

Nomenclature

The following nomenclature is used in this manuscript:
D H mRotor diameter of helicopter rotor
D WT mRotor diameter of WT
f H 1/minRotational frequency of helicopter rotor
f WT 1/minRotational frequency of WT
Δ H mAltitude change
I%Turbulence intensity
I w %Turbulence intensity, vertical direction
LmIntegral length scale
L WT mDistance between WTs in OS-2
M a s s kgMass of helicopter
N b -Number of blades of helicopter rotor
n x , n y , n z -Load factors
R c mBlade tip vortex core radius
R H mRotor radius of helicopter rotor
t EN sTime of vortex encounter
t OBS sTime of the end of offline evaluation
t RE sTime of the start of recovery maneuver
Δ t WT sTemporal discretization of airwake data
T WT sTemporal dimension of airwake data
u, v, wm/sCFD flow fields velocities
U H m/sBlade tip speed of helicopter rotor
V c m/sBlade tip vortex tangential speed
V W m/sWind speed
V W , Ω max m/sRated wind speed of WT
V W , max m/sCut-off wind speed of WT
V x , V y , V z m/sAirwake velocities
V ktAirspeed of helicopter
x CFD , y CFD , z CFD mCFD coordinate system
x WT , y WT , z WT mWT coordinate system
x EN , y EN , z EN mPosition of Vortex encounter
Δ x , Δ y , Δ z mHelicopter position deviations
Δ x CFD mLocal spatial discretization of CFD data
Δ x WT , Δ y WT , Δ z WT mSpatial discretization of airwake data
X WT , Y WT , Z WT mSpatial dimension of airwake data
y + -Dimensionless wall distance
z HUB mWT hub height
α m²/sWind profile power law with the exponent
Γ m²/sBlade tip vortex circulation
Γ 0 m²/sInitial blade tip vortex circulation
δ lat , δ lon , δ ped , δ col %lateral, longitudinal, pedal and collective pilot input
ϵ -Regularization kernel
μ -Helicopter advance ratio
σ w m/sStandard deviation, vertical direction
Φ , Θ , Ψ Roll, pitch and yaw attitude
ω y , ω z 1/sVorticity
Ω H rad/sRotor rotational speed of helicopter rotor

Appendix A

Table A1. Overview of pilot experience.
Pilot APilot BPilot CPilot D
Pilot license27 years41 years20 years6 years
Experimental test pilotYesYesNoNo
Aircraft experience: EC135400 h1250 h2045 h600 h
Aircraft experience: Bo105200 h3050 h--
Aircraft experience: Sea King2500 h---
Aircraft experience: Chinook500 h---
Aircraft experience: Bell 205-500--
Aircraft experience: Bell 412-500--
Aircraft experience: Bell UH-1--1105 h-
Aircraft experience: Alouette II-1400138 h-
Aircraft experience: Agusta A109--54 h-
Aircraft experience: Sikorsky S-76--620 h-
Aircraft experience: Others1000 h--150 h
Total flight hours4600 h6700 h3962 h750 h
Offshore flights per year100120830
Helicopter offshore experience (% of flight hours)50–75%0–25%75–100%25–50%
Maneuver: Landing OSSmore than 300more than 300
Maneuver: Hoisting with person at OSSmore than 300more than 300
Maneuver: Hoisting without person at OSSmore than 30000
Maneuver: Hoisting with person at ship00more than 300
Maneuver: Ship deck landing10–300more than 300–10
Table A2. Turbulent Air Scale (TS) with turbulence categories none (TS-1), light (TS-2–TS-3), moderate (TS-4–TS-6), severe (TS-7–TS-8) and extreme (TS-9–TS-10) [45].
ScaleDefinitionAir Condition
1-Flat calm
2LightFairly smooth, occasional gentle displacement
3Small movements requiring correction if in manual control
4ModerateContinuous small bumps
5Continuous medium bumps
6Medium bumps with occasional heavy ones
7SevereContinuous heavy bumps
8Occasional negative “g”
9ExtremeRotorcraft difficult to control
10Rotorcraft lifted bodily several hundreds of feet
Figure A1. Upset Severity Rating (USR) with hazard categories minor (AE), major (F), hazardous (G) and catastrophic (H) [13].
Energies 15 01790 g0a1
Figure A2. Cooper–Harper Handling Qualities Rating Scale (HQR) with level 1 HQ (HQR-1–HQR-3), level 2 HQ (HQR-4–HQR-6) and level 3 HQ (HQR-7–HQR-8) [46].
Energies 15 01790 g0a2
Table A3. Douglas sea state scale from World Meteorological Organization (WMO) [47].
Sea State CodeDescription of SeaSignificant Wave HeightWind Speed
mftkt
0Calm (Glassy)000–3
1Calm (Rippled)0 to 0.10 to 1 3 4–6
2Smooth (Wavelets)0.1 to 0.5 1 3 to 1 2 3 7–10
3Slight0.5 to 1.25 1 2 3 to 411–16
4Moderate1.25 to 2.54 to 817–21
5Rough2.5 to 48 to 1322–27
6Very Rough4 to 613 to 2028–47
7High6 to 820 to 3048–55
8Very High9 to 1430 to 4556–63
9PhenomenalOver 14Over 4564–118

References

  1. Mauz, M.; Rautenberg, A.; Platis, A.; Cormier, M.; Bange, J. First identification and quantification of detached-tip vortices behind a wind energy converter using fixed-wing unmanned aircraft system. Wind Energy Sci. 2019, 4, 451–463. [Google Scholar] [CrossRef] [Green Version]
  2. Bühler, M.; Weihing, P.; Klein, L.; Lutz, T.; Krämer, E. Actuator line method simulations for the analysis of wind turbine wakes acting on helicopters. J. Phys. Conf. Ser. 2018, 1037, 062004. [Google Scholar] [CrossRef] [Green Version]
  3. Cormier, M.; Bühler, M.; Mauz, M.; Lutz, T.; Bange, J.; Krämer, E. CFD Prediction of Tip Vortex Aging in the Wake of a Multi-MW Wind Turbine. J. Phys. Conf. Ser. 2020, 1618, 062029. [Google Scholar] [CrossRef]
  4. Cormier, M.; Lutz, T. Numerical Investigation of the Unsteady Flow Field Past an Offshore Wind Turbine in Maintenance Operations. In STAB/DGLR Symposium; Springer: Cham, Switzerland, 2020; pp. 592–603. [Google Scholar]
  5. Cormier, M.; Letzgus, P.; Lutz, T.; Krämer, E. CFD Study of an Offshore Wind Turbine in Maintenance Conditions. In High Performance Computing in Science and Engineering’20; Springer: Cham, Switzerland, 2021; pp. 435–449. [Google Scholar]
  6. Horvat, B.; Hajek, M.; Rauleder, J. Analysing rotorcraft vortex encounter methods with a lattice-boltzmann method based gpu framework. In Proceedings of the AIAA Science and Technology Forum and Exposition (SciTech), Orlando, FL, USA, 6–10 January 2020. [Google Scholar]
  7. Horvat, B.; Hajek, M.; Rauleder, J. Computational flight path analysis of a helicopter in an offshore wind farm using a lattice-boltzmann method. In Proceedings of the AIAA Science and Technology Forum and Exposition (SciTech), Virtual Conference, 19–21 January 2021. [Google Scholar]
  8. Štrbac, A.; Martini, T.; Greiwe, D.H.; Hoffmann, F.; Jones, M. Analysis of Rotorcraft Wind Turbine Wake Encounters using Piloted Simulation. CEAS Aeronaut. J. 2021, 12, 273–290. [Google Scholar] [CrossRef]
  9. Ramirez, L.; Fraile, D.; Brindley, G. Offshore Wind in Europe—Key Trends and Statistics 2020; Technical Report; WindEurope: Brussels, Belgium, 2021. [Google Scholar]
  10. Komusanac, I.; Brindley, G.; Fraile, D.; Ramirez, L. Wind Energy in Europe—2020 Statistics and the Outlook for 2021–2025; Technical Report; WindEurope: Brussels, Belgium, 2021. [Google Scholar]
  11. Dalgic, Y.; Lazakis, I.; Turan, O. Investigation of Optimum Crew Transfer Vessel Fleet for Offshore Wind Farm Maintenance Operations. Wind Eng. 2015, 39, 31–52. [Google Scholar] [CrossRef] [Green Version]
  12. Muller, M.; Greenwood, R.; Richards, M.; Bark, L. Survey and Analysis of Rotorcraft Flotation Systems; Technical Report DOT/FAA/AR-95/53; U.S. Department of Transportation (DOT), Federal Aviation Administration (FAA): Washington, DC, USA, 1996. [Google Scholar]
  13. Padfield, G.D.; Manimala, B.; Turner, G.P. A Severity Analysis for Rotorcraft Encounters with Vortex Wakes. J. Am. Helicopter Soc. 2004, 49, 445–456. [Google Scholar] [CrossRef]
  14. van der Wall, B.G.; Fischenberg, D.; Lehmann, P.H.; van der Wall, L.B. Impact of Wind Energy Rotor Wakes on Fixed-Wing Aircraft and Helicopters. In Proceedings of the 42nd European Rotorcraft Forum, Lille, France, 5–8 September 2016. [Google Scholar]
  15. van der Wall, B.G.; Lehmann, P.H. About the Impact of Wind Turbine Blade Tip Vortices on Helicopter Rotor. CEAS Aeronaut. J. 2018, 9, 67–84. [Google Scholar] [CrossRef]
  16. van der Wall, B.G. Rotor Thrust and Power Variations during In-Plane and Orthogonal Vortex Interaction. In Proceedings of the 7th Asian/Australian Rotorcraft Forum, Jeju Island, Korea, 30 October–1 November 2018. [Google Scholar]
  17. van der Wall, B.G. Impact of Vortex—Wake Interference on Rotor Trim; In Proceedings of the VFS Transformative Vertical Flight, San Jose, CA, USA, 21–23 January 2020.
  18. van der Wall, B.G. Comparison of Different Approaches for Modeling Vortex—Rotor Wake Interference on Rotor Trim. In Proceedings of the 76th Annual Forum and Technology Display, addedOnline, 6–8 October 2020. [Google Scholar]
  19. Bakker, R.; Visingardi, A.; van der Wall, B.G.; Voutsinas, S.; Basset, P.M.; Campagnolo, F.; Pavel, M.; Barakos, G.; White, M. Wind Turbine Wakes and Helicopter Operations—An Overview of the Garteur HC-AG23 Activities. In Proceedings of the 44th European Rotorcraft Forum, Delft, The Netherlands, 18–21 September 2018. [Google Scholar]
  20. Hoffmann, F. Rechtliche und flugbetriebliche Grundlagen für Hubschraubereinsätze in Offshore-Windparks; Technical Report DLR-IB-FT-BS-2017-134; Deutsches Zentrum für Luft-und Raumfahrt (DLR): Braunschweig, Germany, 2018. [Google Scholar]
  21. Anon. Bekanntmachung der Gemeinsamen Grundsätze des Bundes und der Länder über Windenbetriebsflächen auf Windenergieanlagen: GGBL-WBF, Bundesministerium für Verkehr, Bau und Stadtentwicklung (BMVBS). Available online: http://www.verwaltungsvorschriften-im-internet.de/bsvwvbund_18012012_LR116116524.htm (accessed on 27 November 2021).
  22. Jonkman, J.; Butterfield, S.; Musial, W.; Scott, G. Definition of a 5 MW Reference Wind Turbine for Offshore System Development; Technical Report NREL/TP-500-38060; National Renewable Energy Laboratory (NREL): Golden, CO, USA, 2009. [Google Scholar]
  23. Anon. North West Shelf Data Portal, Bundesamt für Seeschifffahrt und Hydrographie (BSH). Available online: http://nwsportal.bsh.de/ (accessed on 27 November 2018).
  24. Kroll, N.; Faßbender, J. MEGAFLOW—Numerical Flow Simulation for Aircraft Design. In MEGAFLOW Symposium; Springer: Berlin/Heidelberg, Germany, 2005. [Google Scholar]
  25. Jameson, A.; Schmidt, W.; Turkel, E. Numerical solution of the Euler equations by finite volume methods using Runge Kutta time stepping schemes. In Proceedings of the 14th Fluid and Plasma Dynamics Conference, Palo Alto, CA, USA, 23–25 June 1981. [Google Scholar]
  26. Kowarsch, U.; Keßler, M.; Krämer, E. High Order CFD-Simulation of the Rotor-Fuselage Interaction. Available online: https://dspace-erf.nlr.nl/xmlui/bitstream/handle/20.500.11881/605/erf2013_091.pdf?sequence=1 (accessed on 27 November 2021).
  27. Klein, L.; Gude, J.; Wenz, F.; Lutz, T.; Krämer, E. Advanced computational fluid dynamics (CFD)–multi-body simulation (MBS) coupling to assess low-frequency emissions from wind turbines. Wind Energy Sci. 2018, 3, 713–728. [Google Scholar] [CrossRef] [Green Version]
  28. Weihing, P.; Schulz, C.; Lutz, T.; Krämer, E. Comparison of the actuator line model with fully resolved simulations in complex environmental conditions. J. Phys. Conf. Ser. 2017, 854, 012049. [Google Scholar] [CrossRef]
  29. Troldborg, N.; Zahle, F.; Réthoré, P.E.; Sørensen, N. Comparison of wind turbine wake properties in non-sheared inflow predicted by different CFD rotor models. Wind Energy 2014, 18, 1239–1250. [Google Scholar] [CrossRef]
  30. Shives, M.; Crawford, C. Mesh and load distribution requirements for actuator line CFD simulations. Wind Energy 2013, 16, 1183–1196. [Google Scholar] [CrossRef]
  31. Troldborg, N. Actuator Line Modeling of Wind Turbine Wakes. Ph.D. Thesis, Technical University of Denmark, Lyngby, Denmark, June 2008. [Google Scholar]
  32. Türk, M. Ermittlung Designrelevanter Belastungsparameter für Offshore-Windkraftanlagen. Ph.D. Thesis, Universität zu Köln, Köln, Germany, 2008. [Google Scholar]
  33. Mann, J. The spatial structure of neutral atmospheric surface-layer turbulence. J. Fluid Mech. 1994, 273, 141–168. [Google Scholar] [CrossRef]
  34. Peña, A.; Gryning, S.E.; Mann, J. On the length-scale of the wind profile. Q. J. R. Meteorol. Soc. 2010, 136, 2119–2131. [Google Scholar] [CrossRef]
  35. Sherry, M.; Nemes, A.; Lo Jacono, D.; Blackburn, H.M.; Sheridan, J. The interaction of helical tip and root vortices in a wind turbine wake. Phys. Fluids 2013, 25, 117102. [Google Scholar] [CrossRef] [Green Version]
  36. Menter, F.R. Two-equation eddy-viscosity turbulence models for engineering applications. AIAA J. 1994, 32, 1598–1605. [Google Scholar] [CrossRef] [Green Version]
  37. Rowe, S.J.; Howson, D.; Turner, G. A turbulence criterion for safe helicopter operations to offshore installations. Aeronaut. J. 2006, 110, 749–758. [Google Scholar] [CrossRef] [Green Version]
  38. Duda, H.; Gerlach, T.; Advani, S.; Potter, M. Design of the DLR AVES Research Flight Simulator. In Proceedings of the AIAA Modeling and Simulation Technologies (MST) Conference, Boston, MA, USA, 21–23 May 2013. [Google Scholar]
  39. Kaletka, J.; Kurscheid, H.; Butter, U. FHS, the New Research Helicopter: Ready for Service. In Proceedings of the 29th European Rotorcraft Forum, Friedrichshafen, Germany, 16–18 September 2003. [Google Scholar]
  40. Maibach, M.J.; Jones, M.; Štrbac, A. Development of a Simulation Environment for Maritime Rotorcraft Research Applications. In Proceedings of the Deutscher Luft- und Raumfahrtkongress (DLRK), Online conference, 3 September 2020. [Google Scholar]
  41. Lehmann, P.H.; Jones, M.; Höfinger, M. Impact of Turbulence and Degraded Visual Environment on Pilot Workload. CEAS Aeronaut. J. 2017, 8, 413–428. [Google Scholar] [CrossRef]
  42. Hamers, M.; von Grünhagen, W. Nonlinear Helicopter Model Validation Applied to Realtime Simulations. In Proceedings of the 53rd American Helicopter Society Annual Forum, Virginia Beach, VA, USA, 29 April–1 May 1997. [Google Scholar]
  43. Pitt, D.M.; Peters, D.A. Theoretical Prediction of Dynamic-Inflow Derivatives. Vertica 1981, 5, 21–34. [Google Scholar]
  44. Anon. Aeronautical Design Standard 33E PRF; Technical Report ADS-33E-PRF; United States Army Aviation and Missile Command (AMCOM): Redstone, AL, USA, 2000. [Google Scholar]
  45. Anon. Defence Standard 00-970, Design and Airworthiness Requirements for Service Aircraft, Part 7—Rotorcraft; Technical Report DEF STAN 00-970 Part 7/2—Section 9; Ministry of Defence: Glasgow, UK, 2007. [Google Scholar]
  46. Cooper, G.E.; Harper, R.P. The Use of Pilot Rating in the Evaluation of Aircraft Handling Qualities; Technical Report TND 5153; National Aeronautics and Space Administration (NASA): Washington, DC, USA, 1969. [Google Scholar]
  47. Anon. Advisory Circular AC 29-2C—Certification of Transport Category Rotorcraft; Technical Report AC 29-2C; U.S. Department of Transportation (DOT), Federal Aviation Administration (FAA): Washington, DC, USA, 2014. [Google Scholar]
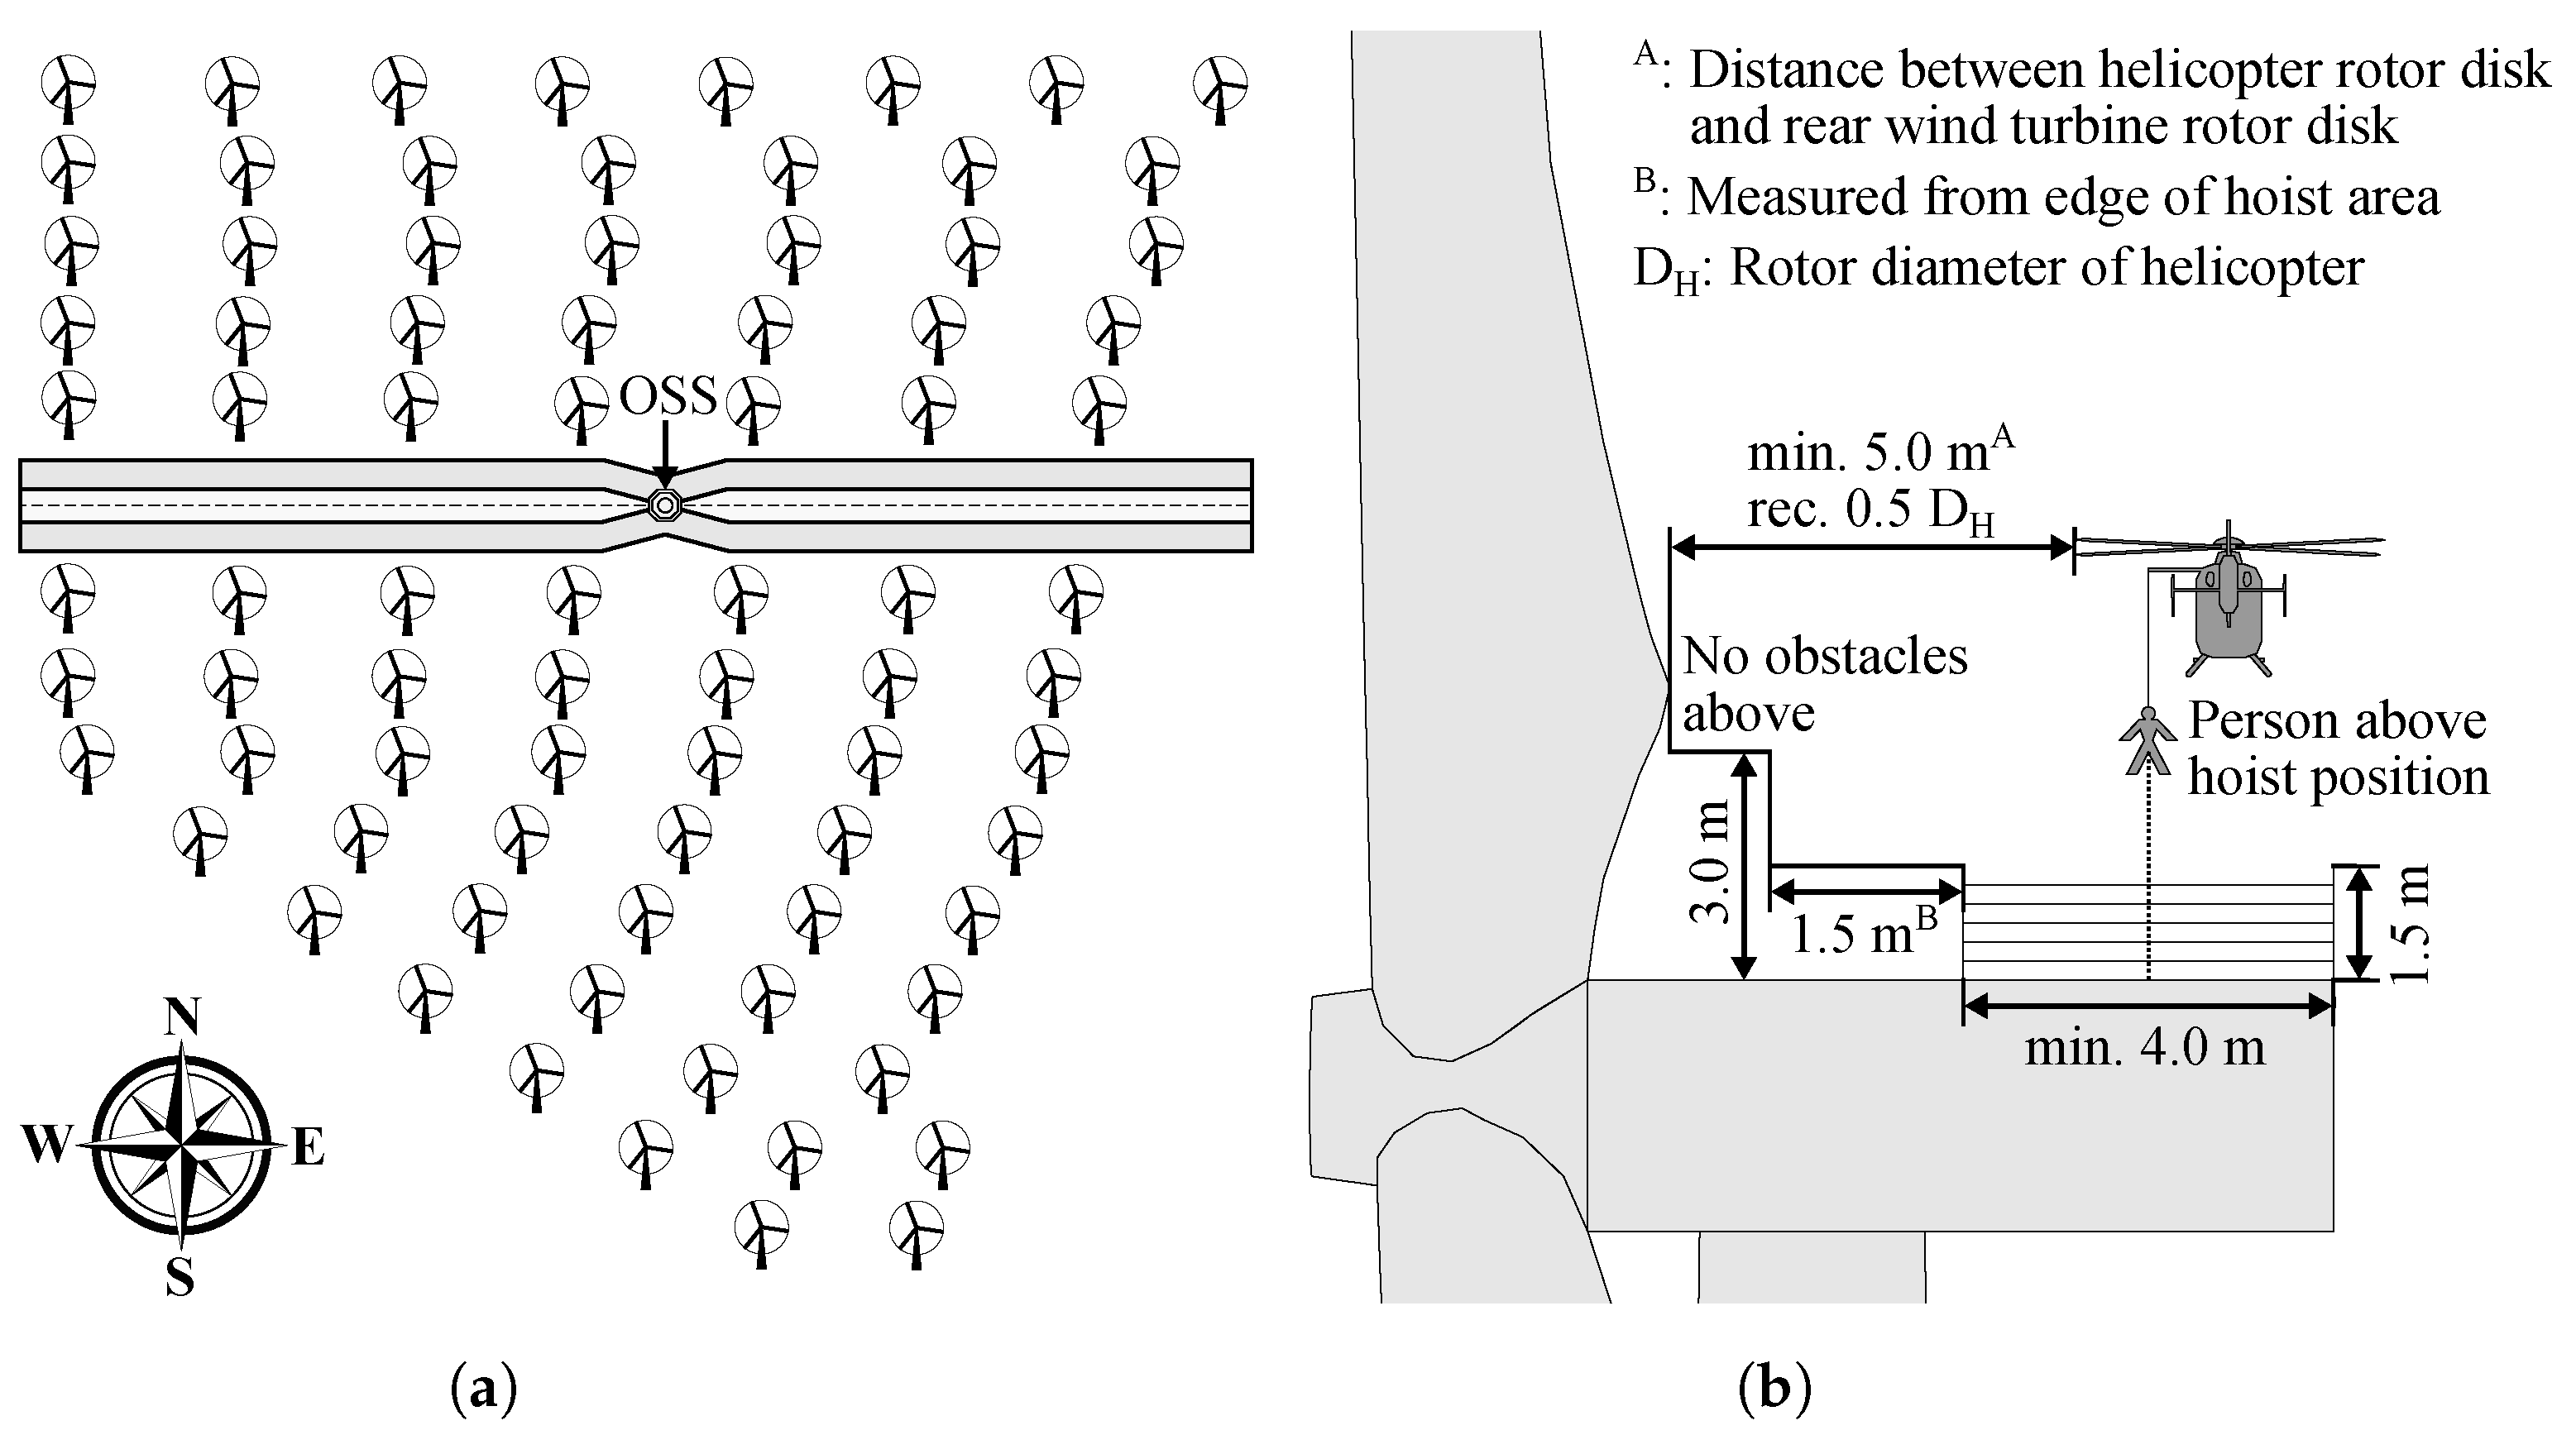
Figure 1. German regulations for maritime helicopter operations in offshore wind farms. (a) The inner and outer flight corridor at the offshore wind farm Global Tech I (GTI) [20]; (b) Lateral safety clearance for the helicopter hoist area at offshore wind turbines (WTs) [21].
Energies 15 01790 g001
Figure 2. Operational Scenario 1 (OS-1): Transit flight with direction west next to a rotating WT.
Energies 15 01790 g002
Figure 3. Operational Scenario 2 (OS-2): Hover flight at a non-rotating WT in “L-position”. (a) Subcase 1: Hover flight at an isolated WT. (b) Subcase 2: Hover flight at a non-isolated WT ( L WT = 680 m ).
Energies 15 01790 g003
Figure 4. Measured wind speed V W at a unmanned lightvessel named “Deutsche Bucht”, located approximately 35 km north from the island Langeoog (Database from [23]).
Energies 15 01790 g004
Figure 5. Grid refinement area around the blade tip vortex helix (OS-1).
Energies 15 01790 g005
Figure 6. Instantaneous streamwise velocity and λ 2 -isosurfaces in the WT wake flow field of C1 at V W = 11.3 m / s . Note that the WT geometry is plotted for more clarity, but was not resolved in the CFD simulation of C1. (OS-1).
Energies 15 01790 g006
Figure 7. Instantaneous streamwise velocity and λ 2 -isosurfaces in the WT wake flow field of C2 at V W = 25.0 m / s . Note that the WT geometry is plotted for more clarity, but was not resolved in the CFD simulation of C2. (OS-1).
Energies 15 01790 g007
Figure 8. Vortex merging in WT wake flow field C1, (OS-1). (a) Vorticity ω y in a vertical plane passing through the rotor plane at y CFD = 0 m . (b) Vorticity ω z in a horizontal plane at z HUB = 90 m .
Energies 15 01790 g008
Figure 9. CFD grids around the WT, with the WT surface in red; for more clarity, every 4th grid line is plotted (OS-2).
Energies 15 01790 g009
Figure 10. Instantaneous streamwise velocity of WT wake flow field (OS-2). (a) C4 − V W = 11.3 m / s ; (b) C5 − V W = 25.0 m / s ; (c) C7 − V W = 25.0 m / s .
Energies 15 01790 g010
Figure 11. Standard deviation of the vertical velocity component σ w in a plane located at z CFD = 101 m from [4]. The circles represent the integration area of Table 4 ( σ w 0 —solid, σ w + 1.5 —dashed, σ w + 2.5 —dashed dotted) (OS-2). (a) C4 − V W = 11.3 m / s ; (b) C5 − V W = 25.0 m / s ; (c) C7 − V W = 25.0 m / s .
Energies 15 01790 g011
Figure 12. AVES simulation facility at DLR. (a) AVES research simulator. (b) Maritime offshore scenario of Global Tech I (GTI).
Energies 15 01790 g012
Figure 13. Distribution of airload computation points (ACPs) in HeliWorX.
Energies 15 01790 g013
Figure 14. Hover task with performance limits at a non-rotating WT (OS-2). (a) Hover task at a non-rotating WT (top view); (b) Hover task at a non-rotating WT (side view).
Energies 15 01790 g014
Figure 15. Comparison between the airwake velocities ( V x , V y , V z ) of C1 and SWM at position 2.
Energies 15 01790 g015
Figure 16. Lateral and vertical flight path deviations ( Δ x non-piloted , Δ z non-piloted ) of the non-piloted simulation from the ideally straight line for C1 and SWM at position 2.
Energies 15 01790 g016
Figure 17. Comparison of the airwake velocities ( V x , V y , V z ) between the non-piloted simulation and an extracted ideally straight line for C1 at position 2.
Energies 15 01790 g017
Figure 18. Attitude changes ( Δ Φ , Δ Θ , Δ Ψ ) and load factors ( n x , n y , n z ) for the non-piloted simulation of C1 at position 2 with limits of ADS-33 offline criteria.
Energies 15 01790 g018
Figure 19. Comparison of pitch the attitude change Δ Θ and the load factor n z for the non-piloted simulation of C1 between position 2, position 5 and position 7 with limits of ADS-33 offline criteria (flight direction west).
Energies 15 01790 g019
Figure 20. Helicopter reactions and pilot input for the transit task (Pilot A, position 5, V W = 11.3 m / s ). (a) Attitude ( Φ , Θ , Ψ ) and altitude ( Δ H ). (b) Pilot input ( δ lat , δ lon , δ ped , δ col ).
Energies 15 01790 g020
Figure 21. Comparison of flight path and airwake velocities between piloted simulations and an extracted ideal, straight-line flight path (Pilot A, position 5, V W = 11.3 m / s ). (a) Flight path deviations ( Δ x piloted , Δ z piloted ). (b) Airwake velocities ( V x , V y , V z ).
Energies 15 01790 g021
Figure 22. Visualization of the blade tip vortex helix at V W = 11.3 m / s and ideal flight path (red dashed) at position 5 (CFD coordinate system).
Energies 15 01790 g022
Figure 23. Subjective pilot assessment of the transit task at different positions (Up—altitude upper boundary, Hub—altitude hub height). (a) Turbulent Air Scale (TS, Table A2); (b) Upset Severity Rating (USR, Figure A1).
Energies 15 01790 g023
Figure 24. Longitudinal Δ x and lateral Δ y position of the helicopter winch above the WT nacelle (Pilot A). (a) Helicopter with bare-airframe response type (BA). (b) Helicopter with attitude-command attitude-hold response type (AC).
Energies 15 01790 g024
Table 1. Overview of interpolated airwake data.
Airwake DataC1C2C4C5C6C7
Operational scenarioOS-1OS-1OS-2OS-2OS-2OS-2
WT statusrotatingrotatingnon-rotatingnon-rotatingnon-rotatingnon-rotating
WT surroundingisolatedisolatedisolatedisolatednon-isolatednon-isolated
V W , m/s11.325.011.325.011.325.0
Δ x WT , Δ y WT , Δ z WT , m0.1250.1250.2250.2250.2250.225
X WT , m44044085858585
Y WT , m232232170170170170
Z WT , m20620650505050
Δ t WT , s--0.040.040.040.04
T WT , s--12.4012.4012.4012.40
Table 2. Maritime inflow data.
Airwake DataMean Velocity ProfileMann-Box Parameters
V W , m/s α I, %L, m
C1, C411.30.145.0045
C2, C5, C725.00.146.8460
Table 3. Selected blade tip vortices for the piloted simulation of vortex encounters with properties identified from the WT wake flow field in C1.
ParameterPos. 7Pos. 5Pos. 2Pos. 13Pos. 11Pos. 8
Upper BoundaryHub Height
x EN , m300175100330150100
R c , m2.961.301.26-0.801.00
V c , m/s3.2010.499.35-8.5010.57
Γ , m²/s79133116-11098
Table 4. Averaged standard deviation of the vertical velocity component σ w over the helicopter rotor area from WT flow field data C4, C5 and C7.
CaseWind SpeedWT SurroundingVertical Standard Deviation
V W , m/s σ w 0 , m/s σ w + 1.5 , m/s σ w + 2.5 , m/s
C411.3isolated0.420.460.49
C525.0isolated0.930.991.03
C725.0non-isolated0.991.021.05
Table 5. Properties of the helicopter model used in the piloted simulation.
ParameterACT/FHS
R H , m5.1
f H , 1/min395
Ω H , rad/s41.4
U H , m/s211
N b 4
M a s s , kg2630
Table 6. Performance limits of pilot task for transit flights (OS-1).
ParameterDesiredAdequate
Heading, ± 5 ± 10
Airspeed, kt ± 5 ± 10
Altitude, ft ± 10 ± 30
Stabilize time, s<5<8
Response time, s33
Table 8. Requirements for helicopter motion transients following control system failures (ADS-33E-PRF [44]).
LevelFlight Condition
Hover and Low SpeedForward Flight
Near EarthUp-and-Away
1 3 roll, pitch, yaw
0.05 g nx, ny, nz
no recovery action for 3 s
both hover and low speed
and forward flight
up-and-away
requirements apply
stay within OFE
no recovery action for 10 s
2 10 roll, pitch, yaw
0.20 g nx, ny, nz
no recovery action for 3 s
both hover and low speed
and forward flight
up-and-away
requirements apply
stay within OFE
no recovery action for 5 s
3 24 roll, pitch, yaw
0.40 g nx, ny, nz
no recovery action for 3 s
both hover and low speed
and forward flight
up-and-away
requirements apply
stay within OFE
no recovery action for 3 s
Table 9. Summary of the assessment of the non-piloted simulations with the ADS-33 offline criteria.
Flight DirectionAirwake DataPos. 2Pos. 5Pos. 7
x = 100 m x = 175 m x = 300 m
WestC12–3>3>3 +
SWM2–32–32–3
EastC12–3 +>3+
SWM2–32–32–3
+: Loadfactor.
Publisher’s Note: MDPI stays neutral with regard to jurisdictional claims in published maps and institutional affiliations.